servaas vd berg
TRANSCRIPT

The primary school sector and the impact of the introduction
of Grade R on learning outcomes
Servaas van der Berg
Research on Socio-economic Policy (ReSEP), Department of Economics, University of Stellenbosch
Presentation to
Allan Gray Orbis Foundation Selection Summit, Bertha Centre, UCT Graduate School of Business
29 September 2015

South Africa has made great progress in getting children to school, and keeping them there longer
2
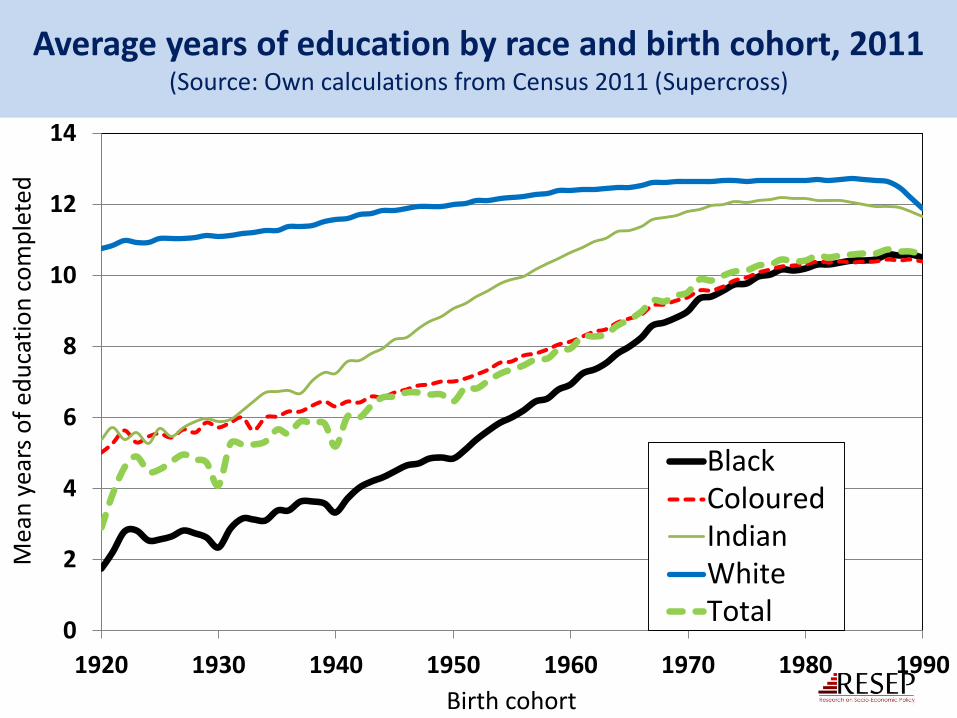
Average years of education by race and birth cohort, 2011 (Source: Own calculations from Census 2011 (Supercross)
0
2
4
6
8
10
12
14
1920 1930 1940 1950 1960 1970 1980 1990
Mea
n y
ears
of
edu
cati
on
co
mp
lete
d
Birth cohort
BlackColouredIndianWhiteTotal
But in Lant Pritchett’s words, “Schooling ain’t learning” – SA performance in international assessments is dismal
4

Literacy score in PIRLS 2006 565
500
405
302
0
100
200
300
400
500
600R
ussia
Ho
ng
Ko
ng
Ca
na
da:A
lberta
Sin
ga
po
re
Canada:British…
Lu
xem
bo
urg
Ca
na
da:O
nta
rio
Ita
ly
Hu
ng
ary
Sw
ed
en
Germ
an
y
Neth
erla
nd
s
Belg
ium
(F
lem
ish
)
Bu
lga
ria
Den
ma
rk
Ca
na
da:N
ov
a S
co
tia
La
tvia
Un
ited
Sta
tes
En
gla
nd
Au
str
ia
Lit
hu
an
ia
Ch
inese T
aip
ei
Ca
na
da:Q
ueb
ec
New
Zea
lan
d
Slo
va
k R
ep
ub
lic
Sco
tlan
d
Fra
nce
Slo
ven
ia
Po
lan
d
Sp
ain
Isra
el
Icela
nd
Mold
ov
a
Belg
ium
(F
ren
ch
)
No
rw
ay
Ro
man
ia
Geo
rg
ia
Maced
on
ia
Trin
ida
d &
To
ba
go
Ira
n
In
do
nesia
Qa
tar
Ku
wait
Moro
cco
Sou
th A
fric
a
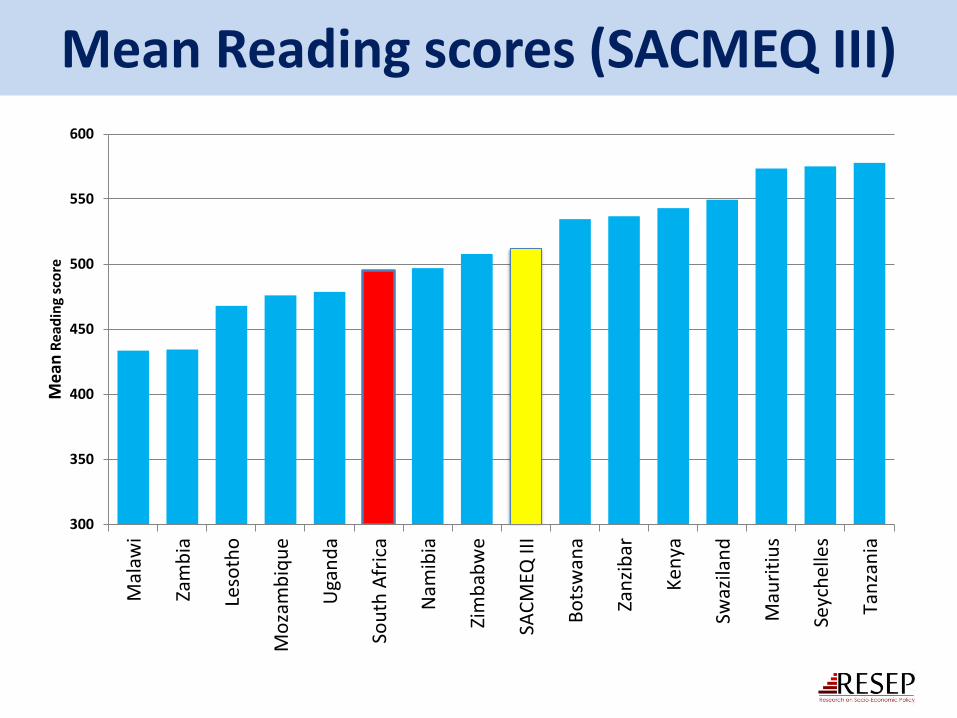
Mean Reading scores (SACMEQ III)
300
350
400
450
500
550
600M
alaw
i
Zam
bia
Leso
tho
Mo
zam
biq
ue
Uga
nd
a
Sou
th A
fric
a
Nam
ibia
Zim
bab
we
SAC
MEQ
III
Bo
tsw
ana
Zan
zib
ar
Ken
ya
Swaz
ilan
d
Mau
riti
us
Seyc
he
lles
Tan
zan
ia
Me
an R
ead
ing
sco
re
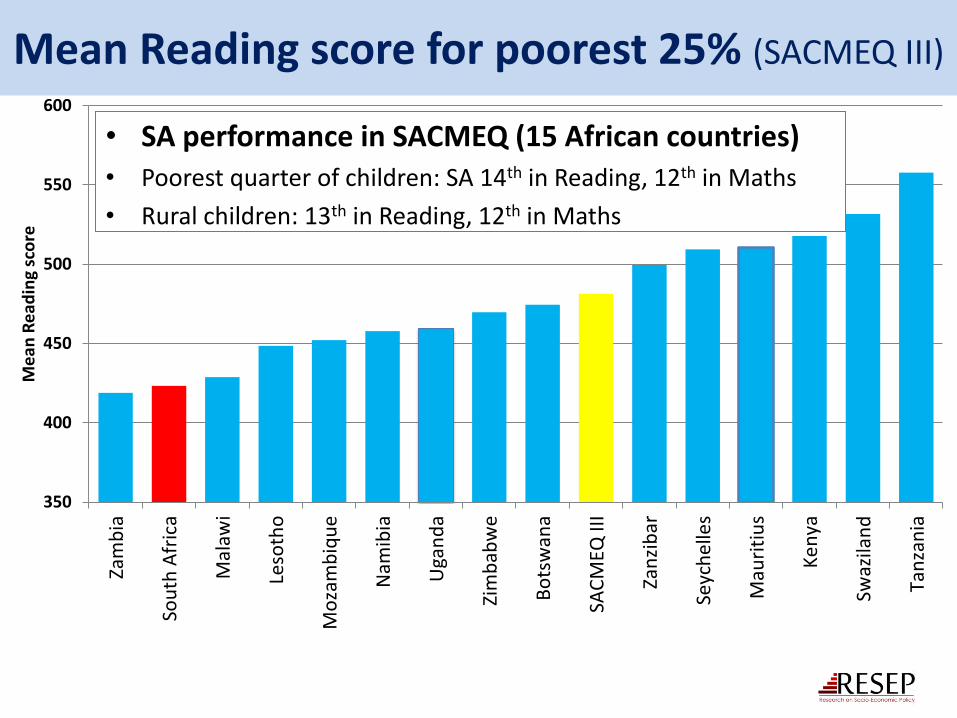
Mean Reading score for poorest 25% (SACMEQ III)
350
400
450
500
550
600Za
mb
ia
Sou
th A
fric
a
Mal
awi
Leso
tho
Mo
zam
biq
ue
Nam
ibia
Uga
nd
a
Zim
bab
we
Bo
tsw
ana
SAC
MEQ
III
Zan
zib
ar
Seyc
he
lles
Mau
riti
us
Ke
nya
Swaz
ilan
d
Tan
zan
ia
Me
an R
ead
ing
sco
re
• SA performance in SACMEQ (15 African countries) • Poorest quarter of children: SA 14th in Reading, 12th in Maths
• Rural children: 13th in Reading, 12th in Maths
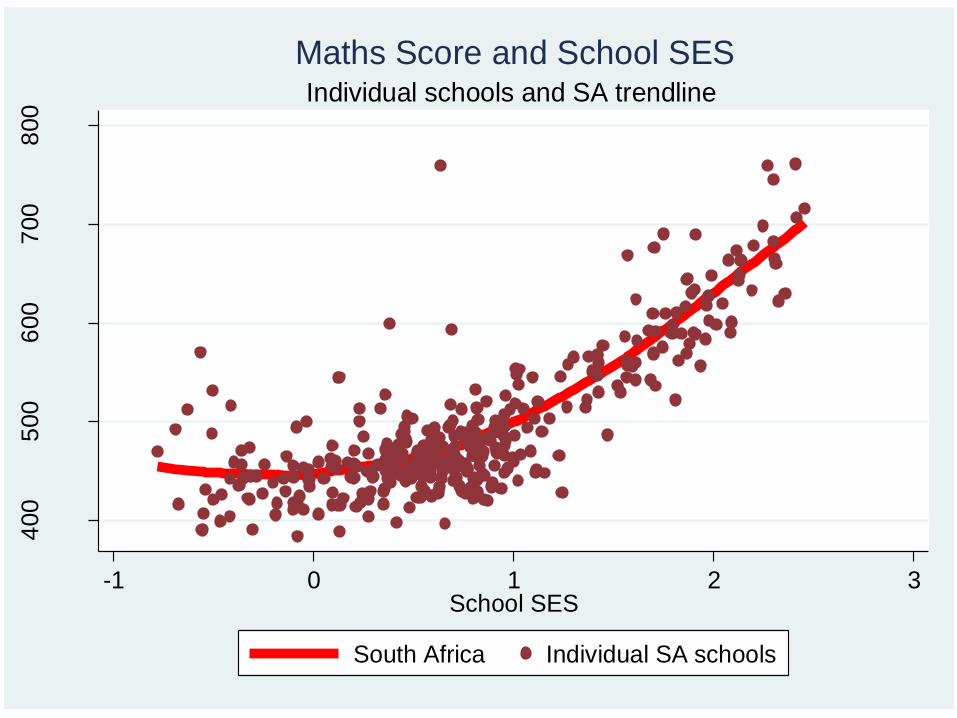
400
500
600
700
800
Ma
ths S
co
re
-1 0 1 2 3School SES
South Africa Individual SA schools
Individual schools and SA trendline
Maths Score and School SES

450
500
550
600
650
700
Ma
ths S
co
re
-1 0 1 2 3School SES
South Africa SAQMEQ
SA vs SACMEQ
Maths Score and School SES

Cumulative proportion of students from South Africa and England scoring below each score level shown in PIRLS 2006
0
10
20
30
40
50
60
70
80
90
100
0 100 200 300 400 500 600 700 800
Cu
mu
lati
ve %
of
stu
den
ts
Score in PIRLS 2006
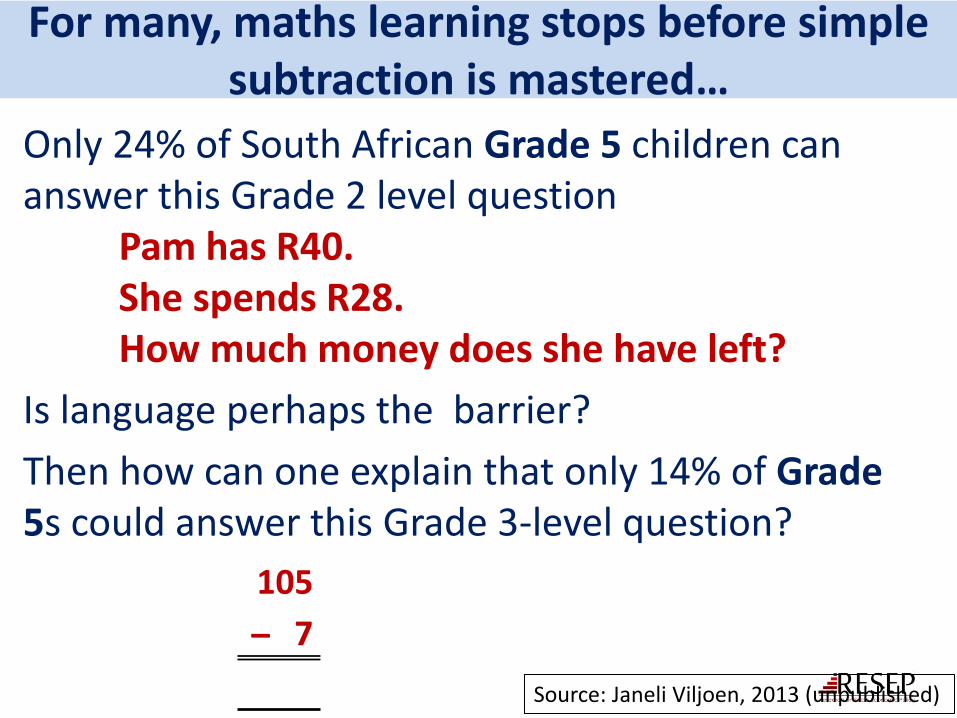
For many, maths learning stops before simple subtraction is mastered…
Only 24% of South African Grade 5 children can answer this Grade 2 level question Pam has R40. She spends R28. How much money does she have left?
Is language perhaps the barrier?
Then how can one explain that only 14% of Grade 5s could answer this Grade 3-level question?
Source: Janeli Viljoen, 2013 (unpublished)
105
7
At the core, it is a teacher problem…
12

Opportunity to learn
• In NW province, teachers teach only 40% of scheduled lessons (Carnoy, Chisholm et al. 2012)
• By Sept/Oct, one-third of SA grade 5 children had not written a single paragraph-length piece during that whole school year (NSES study)
• Number of literacy exercises found in the “best” learner’s book (Gr5):
– Former white schools 75
– Former black schools 33
13

School level continuous assessment and exam
marks, Maths HG 2005
Parents and children get little information about performance from the school system

Teacher views on % of class at appropriate level in Numeracy for grade at beginning and end of year
47%
79%
56%
85%
55%
84%
22%
0%
10%
20%
30%
40%
50%
60%
70%
80%
90%
100%
Grade 1 Grade 2 Grade 3 End of Grade 3
Grade 1 teacher
Grade 2 teacher
Grade 3 teacher
% achieving WCED standard in tests
BACKGROUND: NATURE OF THE PROBLEM
16
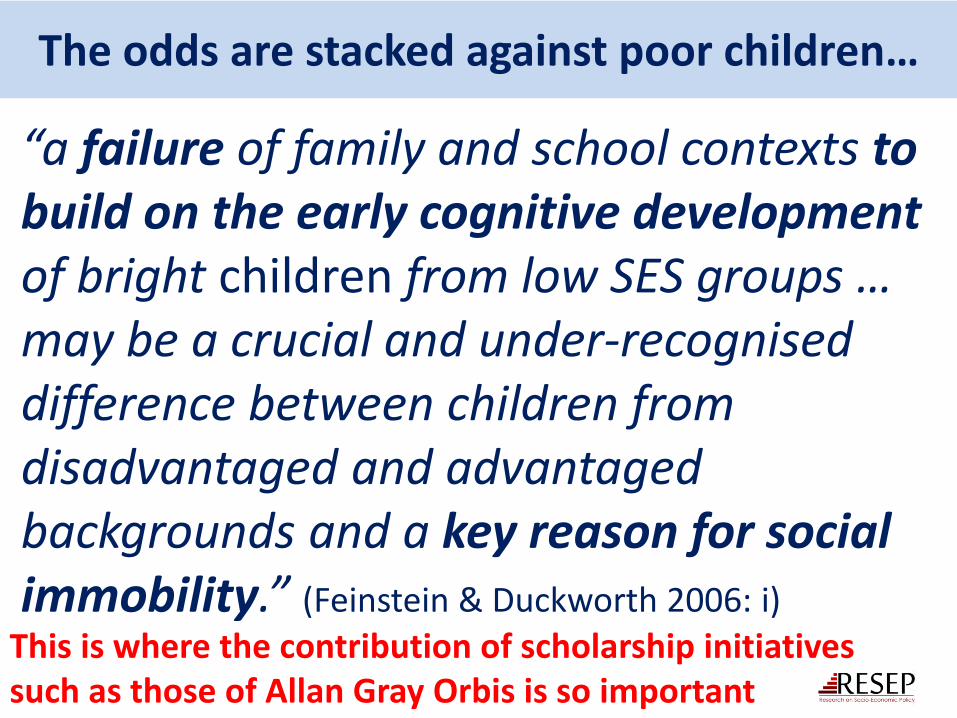
The odds are stacked against poor children…
“a failure of family and school contexts to build on the early cognitive development of bright children from low SES groups … may be a crucial and under-recognised difference between children from disadvantaged and advantaged backgrounds and a key reason for social immobility.” (Feinstein & Duckworth 2006: i)
This is where the contribution of scholarship initiatives such as those of Allan Gray Orbis is so important

Of ±1 million children in a cohort, 100%
55%
42%
±16% ±11%
±6%
-
100 000
200 000
300 000
400 000
500 000
600 000
700 000
800 000
900 000
1 000 000
Children incohort
Reachmatric
Pass matric AttainBachelor's
pass
Attenduniversity
Graduatewith
degree

Children ‘on track’ by grade and quintile in ANA Maths, 2012
0
100 000
200 000
300 000
400 000
500 000
600 000
700 000
Grade 1 Grade 2 Grade 3 Grade 4 Grade 5 Grade 6 Grade 9
Quintile 1
Quintile 2
Quintile 3
Quintile 4
Quintile 5
“On track” defined as not over-aged and within one std dev of “norm group”

% of entering cohort ‘on track’ in ANA 2012 and Bachelor’s passes in Gr.12, by school quintile & grade
0%
20%
40%
60%
80%
100%
Cohortentering
On trackGr1
On trackGr2
On trackGr4
On trackGr6
On trackGr9
Gr12Bachelor's
pass
Quintile 1 Quintile 2 Quintile 3 Quintile 4 Quintile 5

% of entering cohort on track in various grades in ANA 2012 & ANA 2013
0
0.1
0.2
0.3
0.4
0.5
0.6
0.7
0.8 % Bachelor's Pass2012% on Track 2012
% on Track 2013

Learning deficits
• By Grade 4, patterns of ‘on track’ performance across quintiles approximate matric exemption patterns: academic and labour market prospects are bleak for children who are no longer on track
• This requires greater emphasis on Foundation Phase or earlier
– whether deficits arise from weak early instruction, or because disadvantaged home environments require early remediation

THE ROLE OF GRADE R (AND ECD)
23
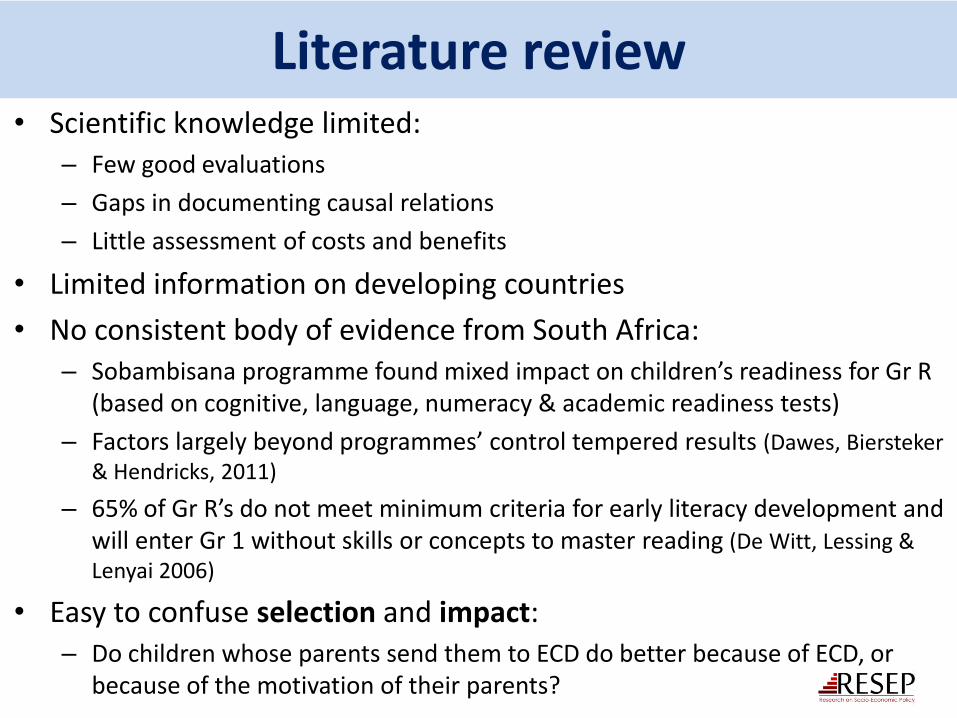
Literature review • Scientific knowledge limited:
– Few good evaluations
– Gaps in documenting causal relations
– Little assessment of costs and benefits
• Limited information on developing countries
• No consistent body of evidence from South Africa: – Sobambisana programme found mixed impact on children’s readiness for Gr R
(based on cognitive, language, numeracy & academic readiness tests)
– Factors largely beyond programmes’ control tempered results (Dawes, Biersteker & Hendricks, 2011)
– 65% of Gr R’s do not meet minimum criteria for early literacy development and will enter Gr 1 without skills or concepts to master reading (De Witt, Lessing & Lenyai 2006)
• Easy to confuse selection and impact: – Do children whose parents send them to ECD do better because of ECD, or
because of the motivation of their parents?

• Life trajectory established early; gaps persistent
• schooling simply reinforces emerging trends and usually widens gaps (Feinstein, 2003)
• SA study found stable language delays between Gr R & Gr 3 – education not powerful enough to overcome entrenched problem (Klop, 2005)
• Characteristics at age 7 explain much of variation in educ. attainment, earnings and employment (Almond & Currie 2010)
• High returns to early investments, because:
• Longer period to reap returns (Heckman, 2007)
• Later remediation costly and less effective
• ‘Skills beget skills’
• Early investment also best to reduce inequalities
Human capital development and ECD
25

Lon
g te
rm
Sho
rt t
erm
A quality pre-school’s supposed benefits
26
Increased achievement test scores
Decreased grade retention
Decreased special/remedial education
Increased high school graduation
Increased tertiary enrolment
Improved behaviour and attitudes
Decreased crime & delinquency
Decreased welfare dependence
Increase in earnings
Increase in tax receipts
Increased parental employment
Educational benefits

Paths through which Grade R makes competent Grade 1 children
27
• Emergent literacy (alphabetic knowledge, phonological awareness, letter sounds) highly related to later literacy
• Primary mechanism by which low income leads to underachievement
Language skills
• Such skills predict and cause outcomes
• Heckman: motivation, socioemotional regulation, time preference, personality factors, ability to work with others
• Sensitive, responsive teaching strengthens effortful control, ability to persevere, enthusiasm, sociability
Non-cognitive
skills
GRADE R IN SOUTH AFRICA
28

Nr of Gr R learners in public & independent schools
2001 2005 2010 2012
EC 18 873 105 231 164 803 158 363
FS 16 002 18 449 27 209 30 639
GT 23 920 41 073 76 460 95 374
KZN 73 993 79 276 175 541 189 169
LIM 84 243 98 273 113 432 117 950
MPU 5 803 14 171 51 758 59 202
NC 4 042 6 598 12 387 15 036
NW 3 176 9 737 42 010 44 489
WC 11 473 32 389 43 603 57 643
Total 241 525 405 197 707 203 767 865
29

Cost of a Grade R place
• Gr R spending per learner of R3 112 only 30% of Non-Grade R level of R10 500
– much less than the 70% recommended in Norms & Standards
• Gr R offered at lower cost, cross-subsidisation within schools difficult to control
• High coverage associated with lower spending: Western Cape & Gauteng have high spending and low coverage
• Further expenditure required to increase practitioners and thus covered learners
METHODOLOGY AND RESULTS
31
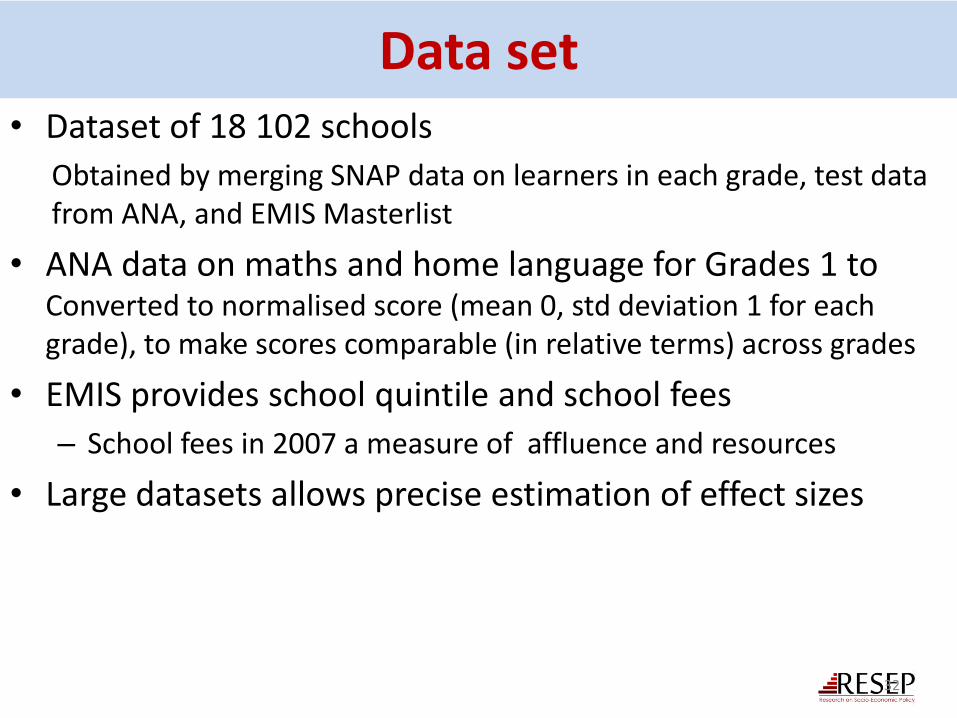
Data set • Dataset of 18 102 schools
Obtained by merging SNAP data on learners in each grade, test data from ANA, and EMIS Masterlist
• ANA data on maths and home language for Grades 1 to Converted to normalised score (mean 0, std deviation 1 for each grade), to make scores comparable (in relative terms) across grades
• EMIS provides school quintile and school fees
– School fees in 2007 a measure of affluence and resources
• Large datasets allows precise estimation of effect sizes
32
Measuring treatment
Treatment measure: % of learners in a given cohort that attended Gr R and also Gr 2 two years later
33

Determining causal impact
• Other factors may also influence outcomes – Some we can control for (e.g. SES) – 0bservables – Others we cannot – Unobservables
• Endogeneity is a confounding effect and limits our ability to draw causal inferences
• Example: Factors that could affect both treatment and learning: – Better managed schools may more easily introduce Gr R,
and would also usually have better learning outcomes – Departments may put more effort into introducing Gr R
in weaker schools
34
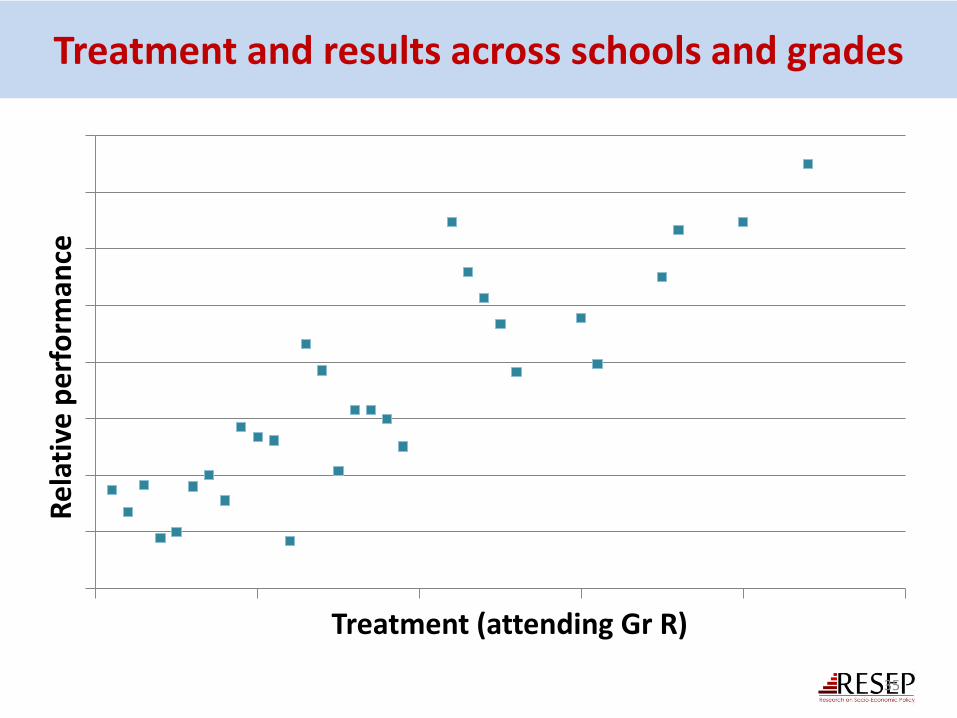
Treatment and results across schools and grades
35
Re
lati
ve p
erf
orm
ance
Treatment (attending Gr R)
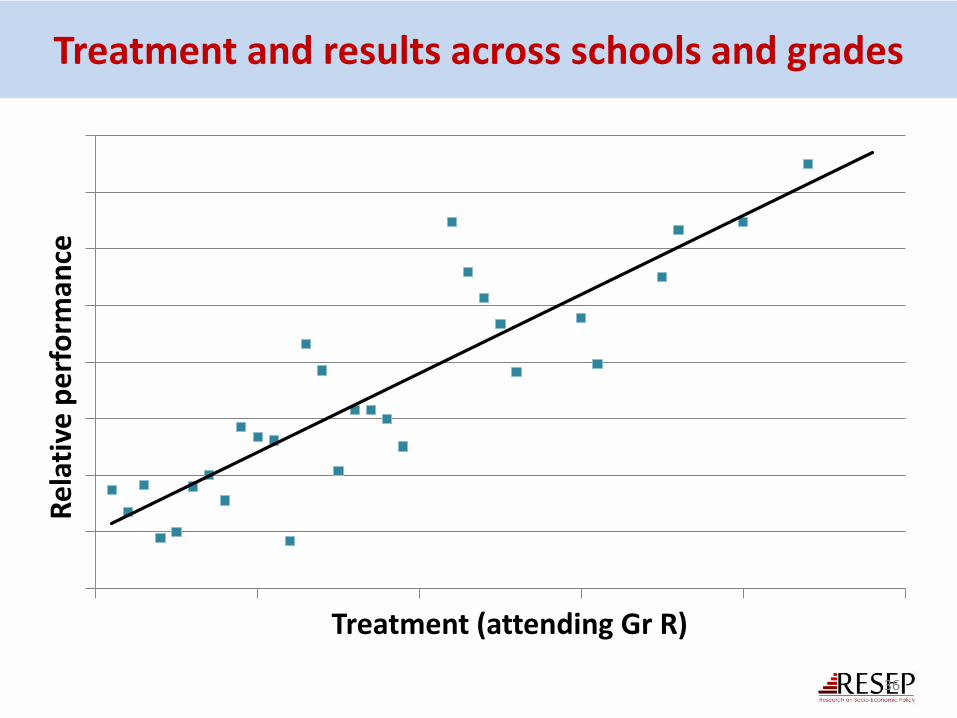
Treatment and results across schools and grades
36
Re
lati
ve p
erf
orm
ance
Treatment (attending Gr R)
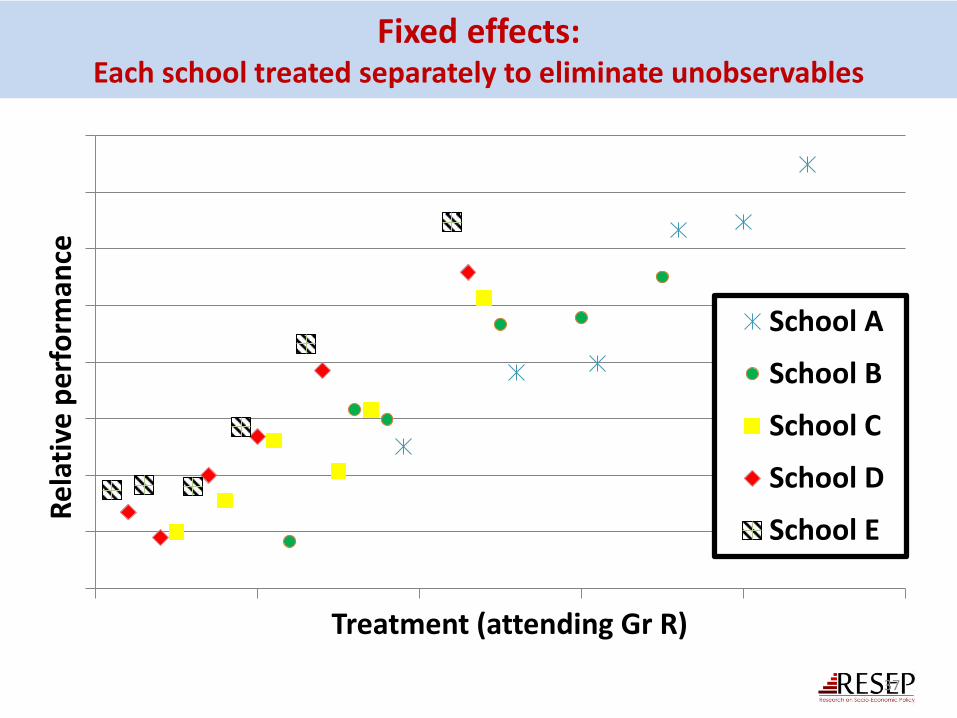
Fixed effects: Each school treated separately to eliminate unobservables
37
Re
lati
ve p
erf
orm
ance
Treatment (attending Gr R)
School A
School B
School C
School D
School E

Fixed effects: Each school treated separately to eliminate unobservable differences
38
Re
lati
ve p
erf
orm
ance
Treatment (attending Gr R)
School A
School B
School C
School D
School E
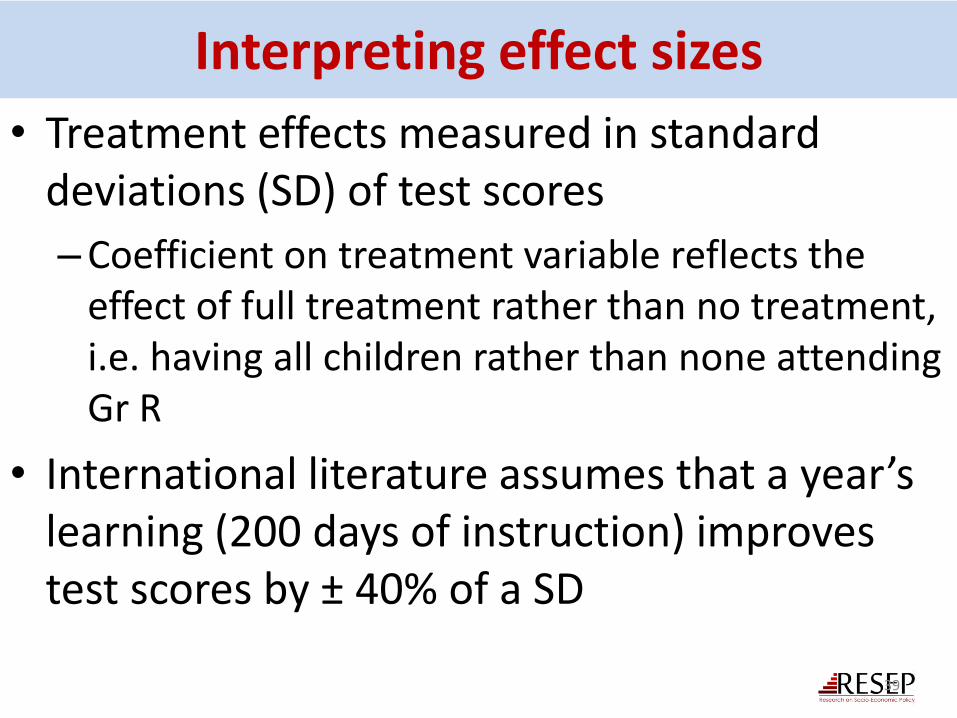
Interpreting effect sizes
• Treatment effects measured in standard deviations (SD) of test scores
–Coefficient on treatment variable reflects the effect of full treatment rather than no treatment, i.e. having all children rather than none attending Gr R
• International literature assumes that a year’s learning (200 days of instruction) improves test scores by ± 40% of a SD
39
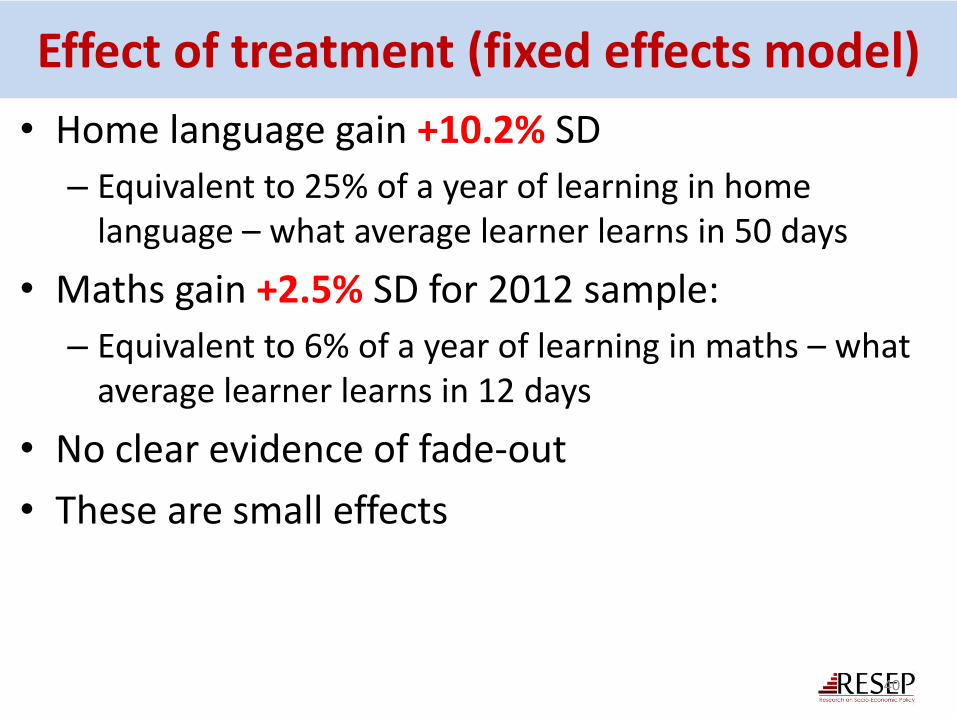
Effect of treatment (fixed effects model)
• Home language gain +10.2% SD
– Equivalent to 25% of a year of learning in home language – what average learner learns in 50 days
• Maths gain +2.5% SD for 2012 sample:
– Equivalent to 6% of a year of learning in maths – what average learner learns in 12 days
• No clear evidence of fade-out
• These are small effects
40
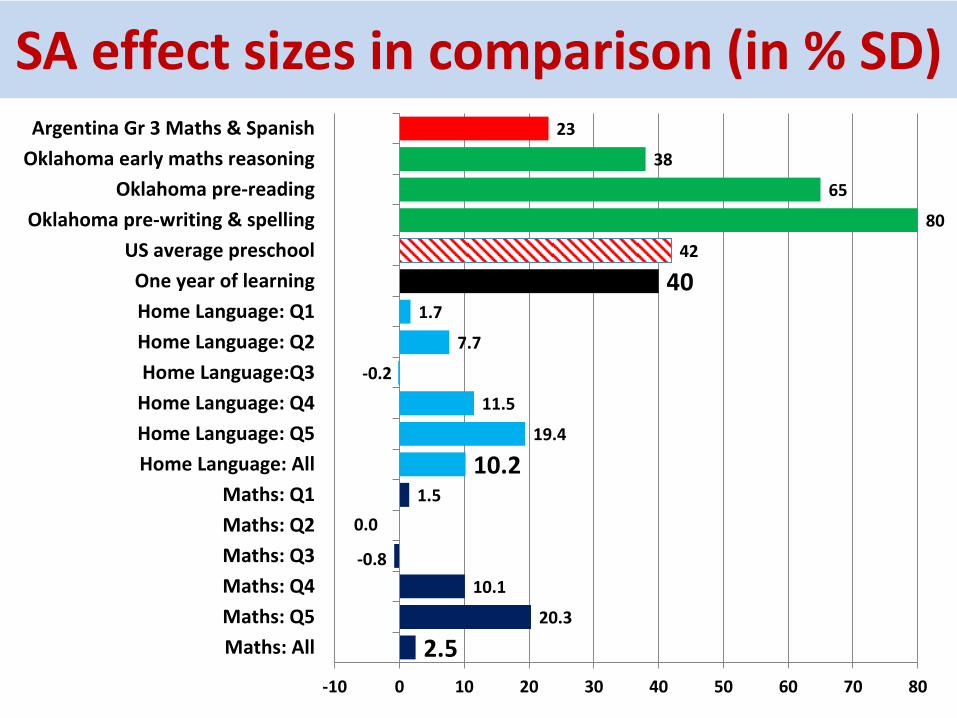
SA effect sizes in comparison (in % SD)
2.5
20.3
10.1
-0.8
0.0
1.5
10.2
19.4
11.5
-0.2
7.7
1.7
40
42
80
65
38
23
-10 0 10 20 30 40 50 60 70 80
Maths: All
Maths: Q5
Maths: Q4
Maths: Q3
Maths: Q2
Maths: Q1
Home Language: All
Home Language: Q5
Home Language: Q4
Home Language:Q3
Home Language: Q2
Home Language: Q1
One year of learning
US average preschool
Oklahoma pre-writing & spelling
Oklahoma pre-reading
Oklahoma early maths reasoning
Argentina Gr 3 Maths & Spanish
CONCLUSIONS AND RECOMMENDATIONS
42

Conclusions about Grade R impact
• Dataset enables accurate estimation of effects
• Fixed effects control for unobserved heterogeneity (endogeneity), thus causal effects estimated
• Grade R has clearly had a net positive impact on learning, albeit small
Effects may be lasting: little sign of fade-out (decay) in higher grades
Channels not clear, however (e.g. role of nutrition/ school feeding)
No discernible effects in bottom quintiles
43
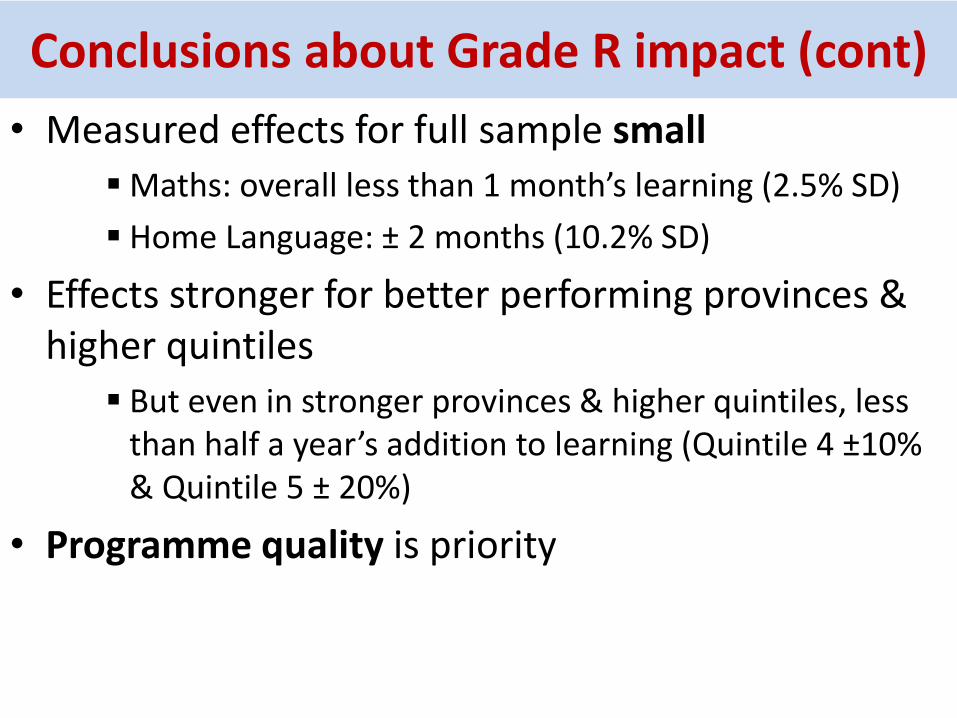
Conclusions about Grade R impact (cont)
• Measured effects for full sample small
Maths: overall less than 1 month’s learning (2.5% SD)
Home Language: ± 2 months (10.2% SD)
• Effects stronger for better performing provinces & higher quintiles
But even in stronger provinces & higher quintiles, less than half a year’s addition to learning (Quintile 4 ±10% & Quintile 5 ± 20%)
• Programme quality is priority

Recommendations
• Grade R completely underfunded according to DBE’s own criteria (30% rather than 70% of other learners), with large inter-provincial differences
• Quality requires threshold levels of funding of both personnel and LTSM – need to ensure this
• Provinces must ensure Grade R is not crowded out by other spending
45
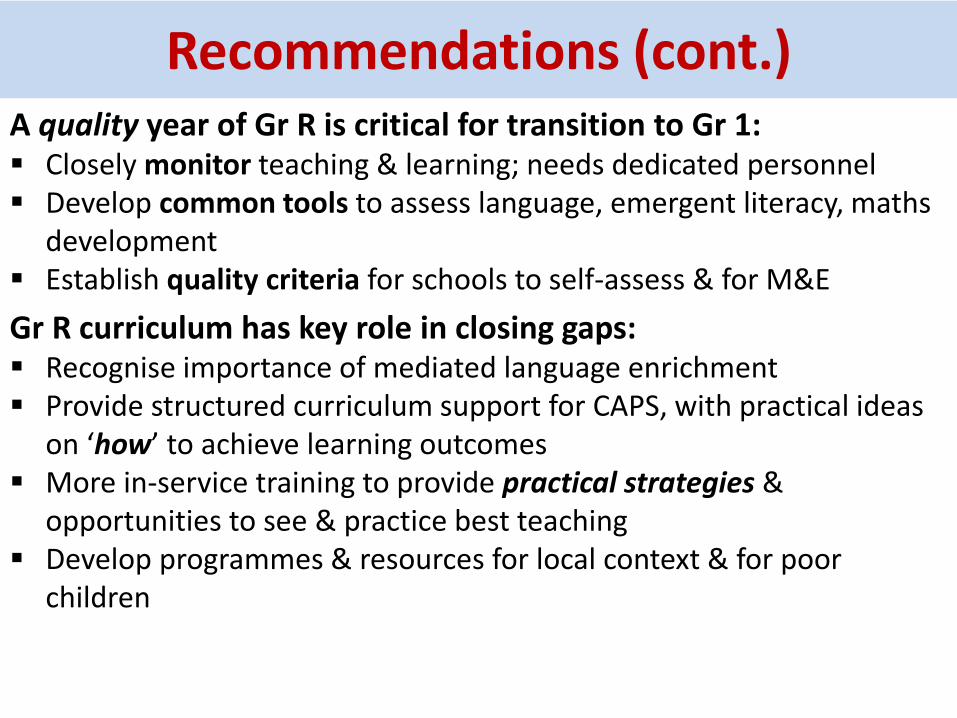
Recommendations (cont.) A quality year of Gr R is critical for transition to Gr 1: Closely monitor teaching & learning; needs dedicated personnel Develop common tools to assess language, emergent literacy, maths
development Establish quality criteria for schools to self-assess & for M&E
Gr R curriculum has key role in closing gaps: Recognise importance of mediated language enrichment Provide structured curriculum support for CAPS, with practical ideas
on ‘how’ to achieve learning outcomes More in-service training to provide practical strategies &
opportunities to see & practice best teaching Develop programmes & resources for local context & for poor
children