service-oriented environments for dynamically interacting with mesoscale weather
TRANSCRIPT

Each year across the US, mesoscale weatherevents—flash floods, tornadoes, hail,strong winds, lightning, and localizedwinter storms—cause hundreds of
deaths, routinely disrupt transportation and com-merce, and lead to economic losses averaging morethan US$13 billion.1 Although mitigating the im-pacts of such events would yield enormous eco-nomic and societal benefits, research leading to thatgoal is hindered by rigid IT frameworks that can’taccommodate the real-time, on-demand, dynami-cally adaptive needs of mesoscale weather research;its disparate, high-volume data sets and streams; orthe tremendous computational demands of its nu-merical models and data-assimilation systems.
In response to the increasingly urgent need for acomprehensive national cyberinfrastructure inmesoscale meteorology—particularly one that caninteroperate with those being developed in otherrelevant disciplines—the US National ScienceFoundation (NSF) funded a large information tech-nology research (ITR) grant in 2003, known asLinked Environments for Atmospheric Discovery(LEAD). A multidisciplinary effort involving nineinstitutions and more than 100 scientists, students,and technical staff in meteorology, computer sci-ence, social science, and education, LEAD ad-dresses the fundamental research challenges neededto create an integrated, scalable framework foradaptively analyzing and predicting the atmosphere.
LEAD’s foundation is dynamic workflow orches-tration and data management in a Web servicesframework. These capabilities provide for the use ofanalysis tools, forecast models, and data repositories,
12 COMPUTING IN SCIENCE & ENGINEERING
SERVICE-ORIENTED ENVIRONMENTSFOR DYNAMICALLY INTERACTINGWITH MESOSCALE WEATHER
G R I DC O M P U T I N G
Within a decade after John von Neumann and colleagues conducted the first experimentalweather forecast on the ENIAC computer in the late 1940s, numerical models of theatmosphere became the foundation of modern-day weather forecasting and one of the drivingapplication areas in computer science. This article describes research that is enabling a majorshift toward dynamically adaptive responses to rapidly changing environmental conditions.
KELVIN K. DROEGEMEIER, KEITH BREWSTER, MING XUE, AND DANIEL WEBER
University of OklahomaDENNIS GANNON AND BETH PLALE
Indiana UniversityDANIEL REED AND LAVANYA RAMAKRISHNAN
University of North CarolinaJAY ALAMEDA AND ROBERT WILHELMSON
US National Center for Supercomputing ApplicationsTOM BALTZER, BEN DOMENICO, DONALD MURRAY, MOHAN RAMAMURTHY, AND ANNE WILSON
University Corporation for Atmospheric ResearchRICHARD CLARK AND SEPIDEH YALDA
Millersville UniversitySARA GRAVES, RAHUL RAMACHANDRAN, AND JOHN RUSHING
University of Alabama in HuntsvilleEVERETTE JOSEPH AND VERNON MORRIS
Howard University
1521-9615/05/$20.00 © 2005 IEEE
Copublished by the IEEE CS and the AIP
NOVEMBER/DECEMBER 2005 13
not in fixed configurations or as static recipients ofdata but rather as dynamically adaptive, on-demandsystems that respond to weather as it evolves. Al-though mesoscale meteorology is the particularproblem to which we’ve applied the LEAD concept,the methodologies and infrastructures we’ve devel-oped are extensible to other domains such as medi-cine, ecology, oceanography, and biology.
In a companion article,2 we describe the organi-zation and cataloging of metadata as LEAD work-flows generate them. Here, we present a moreholistic view of LEAD and focus on the rationalebehind and structure of its architecture. Now be-ginning its third of five years, LEAD is deployingseveral of its key services to the research and edu-cation communities. During the next 18 months,the project will focus on how streaming observa-tions and analysis/simulation output can be used tomodify workflows in real time.
The Case for Dynamic AdaptationThose having experienced the devastation of a tor-nado or hurricane, the raging waters of a flash flood,or the paralyzing impacts of lake-effect snows un-derstand that mesoscale weather develops rapidly,often with considerable uncertainty with regard tolocation. Such weather is also locally intense andfrequently influenced by processes on both largerand smaller scales. Ironically, few of the technolo-gies people use to observe the atmosphere, predictits evolution, and compute, transmit, or store in-formation about it operate in a manner that accom-modates mesoscale weather’s dynamic behavior.Radars don’t adaptively scan specific regions ofthunderstorms; numerical models are run largely onfixed time schedules in fixed configurations; and cy-berinfrastructure doesn’t allow meteorological toolsto run on-demand, change configuration in re-sponse to the weather, or provide the fault toleranceneeded for rapid reconfiguration. As a result, today’sweather technology is highly constrained and farfrom optimal when applied to any particular situa-tion. To demonstrate, let’s review examples in whichdifferent modes of adaptation within numericalmodels yield notable forecast improvements. We’llalso look at the necessity of adaptive observationsand cyberinfrastructure in creating a suitable envi-ronment for studying mesoscale weather.
Adaptation in TimeOne of the most basic adaptive strategies in nu-merical weather prediction is rapid updating, inwhich the appearance of features in a given forecastsuggests running successive forecasts more fre-quently. For mesoscale weather, which can appear
suddenly and evolve rapidly, this capability is espe-cially relevant, though not easily achieved owing toon-demand requirements for computing and data
Glossary of AcronymsADaM Algorithm and Data MiningARPS Advanced Regional Prediction SystemBPEL Business Process Execution LanguageCASA Center for Collaborative Adaptive Sensing of the AtmosphereCDT Central daylight timeCST Central standard timedBZ Decibel Units of Radar ReflectivityGRAM Grid Resource Allocation and ManagementHAPI Health Application Programming InterfaceITR Information technology researchLDM Local data managerLEAD Linked Environments for Atmospheric DiscoverymyLEAD My Linked Environments for Atmospheric DiscoveryNEXRAD Next-generation radarNSF National Science FoundationSOA Service-oriented architectureTHREDDS Thematic real-time environmental distributed data services UTC Coordinated universal timeWOORDS Workflow orchestration for on-demand, real-time, dynami-
cally adaptive systemsWRF Weather research and forecasting model
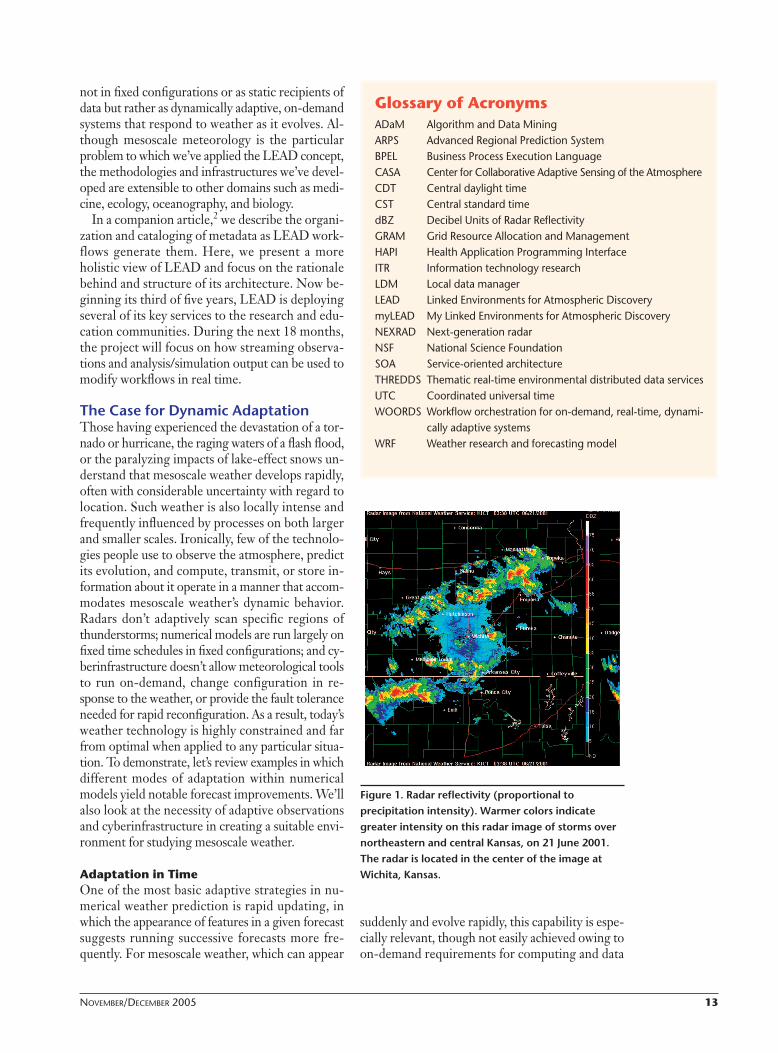
Figure 1. Radar reflectivity (proportional toprecipitation intensity). Warmer colors indicategreater intensity on this radar image of storms overnortheastern and central Kansas, on 21 June 2001.The radar is located in the center of the image atWichita, Kansas.

14 COMPUTING IN SCIENCE & ENGINEERING
resources. To illustrate, Figure 1 shows reflectivity(equivalent to precipitation intensity) from the Wi-chita, Kansas, WSR-88D radar, also known asnext-generation radar (NEXRAD), at 0336 coor-dinated universal time (UTC) or 10:36 p.m. cen-tral daylight time (CDT) on 21 June 2001. Clearlyevident is a broken line of intense thunderstorms(bright red colors) oriented northeast–southwestand extending from just southwest of Topeka,Kansas, to south of Great Bend, Kansas. A secondarea of storms is present in northern Oklahoma.
Just after noon that same day, an electric utilityin Kansas used a customized version of a fine-scalecomputer prediction model called the AdvancedRegional Prediction System (ARPS)3 to generatethe 11-hour forecast shown in Figure 2a. The util-ity initiated the forecast at 11 a.m. CDT and ex-tended it through 10 p.m. CDT, or approximately38 minutes prior to the radar image in Figure 1.The forecast depicts an area of thunderstorms hav-ing roughly the same alignment as what eventuallydeveloped, but before mobilizing repair crews todeal with possible power outages, the utility mod-ified the model’s execution schedule and ran arapid update cycle, producing forecasts every twohours (Figures 2b through 2d). Although the nine-hour forecast (Figure 2b) produced a noticeablydifferent solution from that initiated two hoursearlier (Figure 2a), subsequent forecasts began to“lock onto” a consistent solution as the time of in-terest (10 p.m. CDT) approached, giving the util-ity confidence in the forecast and sufficient leadtime to mobilize a response. By adapting themodel to the weather and to its needs, the power
utility took control of a potentially costly situationand mitigated loss.
Adaptation in SpaceIn addition to increasing forecast frequency as ameans for obtaining more accurate solutions, mod-els can adapt via the use of nested grids. This com-putational modality is quite common across a widerange of fluid dynamics applications, and researchershave automated it so that the grid mesh responds dy-namically to changes in the flow using both struc-tured4 and unstructured5 approaches. Such gridrefinement is motivated by the desire to capture in-creasingly fine-scale features—particularly individ-ual thunderstorms—along with the larger-scaleenvironments in which they are embedded.
Figure 3a shows a 12-hour radar reflectivity fore-cast from the ARPS, valid at 0000 UTC or 6:00p.m. central standard time (CST) on Friday, 29January 1999, using a horizontal grid spacing of 32km.6 In reality, the northeast–southwest-orientedregion of precipitation in Arkansas, which exhibitslittle fine-scale structure in the model due to thecoarse grid, contained multiple lines of tornadicthunderstorms (see Figure 4).
In an attempt to capture more detail, a nested gridusing 9-km horizontal spacing (the red box in Fig-ure 3a) was spawned over a region of intense weatherand yielded the six-hour forecast shown in Figure3b. Some explicit evidence of intense thunderstormsemerges (yellow colors), although the 9-km grid isunable to resolve the most energetic elements of theflow—that is, individual updrafts and downdrafts.Spawning yet another grid at 3-km spacing (Figure
Project Status
Given the LEAD service orchestration infrastructure’scomplexity and the number and diversity of services it
offers, we’re developing a series of LEAD prototypes that letus incrementally test and evaluate approaches and compo-nents within the controlled environment of the LEAD grid.All of this is a prelude to production deployment of LEAD’s“science gateway” on the US National Science Founda-tion’s TeraGrid, a networked collection of some of thelargest computing and storage resources available in the USfor open scientific research.
At this writing, the LEAD team has developed and inte-grated an operational portal with more than a dozen appli-cations deployed as Web services and used in workflows.We’ve conducted experiments with the prototype frame-work atop the LEAD grid, and we estimate that 85 percent
of the infrastructure is complete. With regard to the LEAD architecture, all the cross-cutting
services exist and have been deployed on one or more of thegrid testbeds. The LEAD portal is operational but is expectedto evolve as usage patterns and needs change. With the ex-ception of the scheduler, replica locator, and the generic in-gest service, all the resource-access services have beendeployed. The workflow monitors and engines are opera-tional, along with the virtual organization catalog and theTHREDDS service. Initial versions of the application and con-figuration services exist and operate. Major services yet to bedeveloped and deployed are the data stream services and ap-plication resource broker; both are critical componentsneeded to move from static to dynamic workflows. Ratherthan build a new broker, we’re evaluating the solutions beingdeveloped in several other TeraGrid and NSF ITR projects.

NOVEMBER/DECEMBER 2005 15
3c), indicated by the red box in Figure 3b, yields aforecast that captures the multiple line structure,overall orientation, and generally correct movementof the storms (compare with Figure 4). Upon closer
inspection, however, we see that the 3-km forecastdoes differ from observations in important ways (forexample, the lack of storms in the “boot heel” ofMissouri). Nevertheless, the ability to spatially adapt
(a)
(c)
(b)
(d)
Figure 2. Radar reflectivity forecasts. From the Advanced Regional Prediction System model on 20 June 2001, warmer colorsindicate greater precipitation intensity at (a) the 11-hour forecast, (b) the nine-hour forecast, (c) the five-hour forecast, and (d)the three-hour forecast.
(a) (b) (c)
Figure 3. Radar reflectivity forecasts. (a) This 12-hour forecast on 22 January 1999 uses 32-km horizontal grid spacing; (b) a six-hour nested grid forecast using 9-km horizontal grid spacing shows some evidence of thunderstorms, but is still unable tocapture individual cells. (c) A six-hour nested grid forecast using 3-km horizontal grid spacing over the domain showsremarkable agreement with observations in mode (broken lines of individual cells), orientation, and motion. The red boxes inpanels (a) and (b) show the nested domain locations in (b) and (c), respectively.

16 COMPUTING IN SCIENCE & ENGINEERING
the grid mesh (in this case, manually) clearly pro-vides a positive impact by capturing individual thun-derstorms that were absent at coarser grid spacings.Note, however, that such adaptation might not bewarranted or desirable in all cases, nor may the req-uisite computational resources be available. By min-ing the model solution or observations for specifiedcharacteristics, LEAD provides the framework forintelligently, and automatically, generating nesteddomains in a grid context and providing quality ofservice estimates across the architecture.
Ensemble ForecastingComparing Figures 1 and 2, it’s clear that anygiven forecast can contain considerable uncer-tainty, in large part because we never know theatmosphere’s true state (due to incomplete sam-pling, observation errors, and so on). Conse-quently, a particular forecast’s initial conditionrepresents only one of numerous possibilities—that is, a single member of a probability distribu-tion of physically plausible states. Becauseinsufficient computational power exists to predictthe full probability distribution’s evolution(known as stochastic–dynamic forecasting),7 me-teorologists sample several states and producenumerous forecasts instead of making just one.This ensemble methodology—the creation of mul-tiple concurrently valid forecasts from slightlydifferent initial conditions, different models, thesame model initialized at different times, or viathe use of different physics options within thesame or multiple models—has become the cor-nerstone of medium-range (six to 10 days) oper-ational global numerical weather prediction;8 infact, it’s even being extended to individualstorms.9 Of course, ensemble forecasting greatlyincreases the required computational resourcesand thus might be desirable only in certain situ-ations, as dictated by the weather or a provisionalforecast’s outcome—thus, the need for intelli-gent, automated adaptation.
To illustrate the power of ensemble forecasting,Figure 5 shows radar reflectivity at 6 p.m. CST on29 March 2000 over north central Texas; the figureis similar in content to Figure 1, except that it’sfrom multiple radar data objectively analyzed to aregular grid. Clearly evident is a north–south-ori-ented line of intense thunderstorms, which ulti-mately produced multiple tornadoes, one of whichpassed through the Fort Worth, Texas, metropoli-tan area (white arrow), causing three deaths andnearly US$500 million dollars in damage.10
Researchers studying this case post facto initial-ized a five-member ensemble of forecasts at 2300UTC on 29 March 2000. The control forecast infigure 6a captures the overall structure and motionof the storms in northern Texas, but it fails to pre-dict the extension of the system further south. Theother four ensemble members, initialized fromslightly different (though equally probable) statesand valid at the same time (see Figures 6b through6e), exhibit considerable variability, with members1 and 2 placing an extensive area of spurious stormsin the southeastern part of the domain. Member 3is different from all other forecasts, as well as real-ity (see Figure 5); if it were the only forecast avail-
Figure 4. Multiple tornadic storms. Image from 21January 1999 over Arkansas from multiple radars withtheir data objectively analyzed to a regular grid.6
Figure 5. Observed storms. For a thunderstormcomplex on 29 March 2000 over north central Texas,the white arrow shows the supercell that produced amajor tornado in the Fort Worth metropolitan area.

NOVEMBER/DECEMBER 2005 17
able, the guidance would obviously be quite poor.The practical value of ensemble forecasting lies
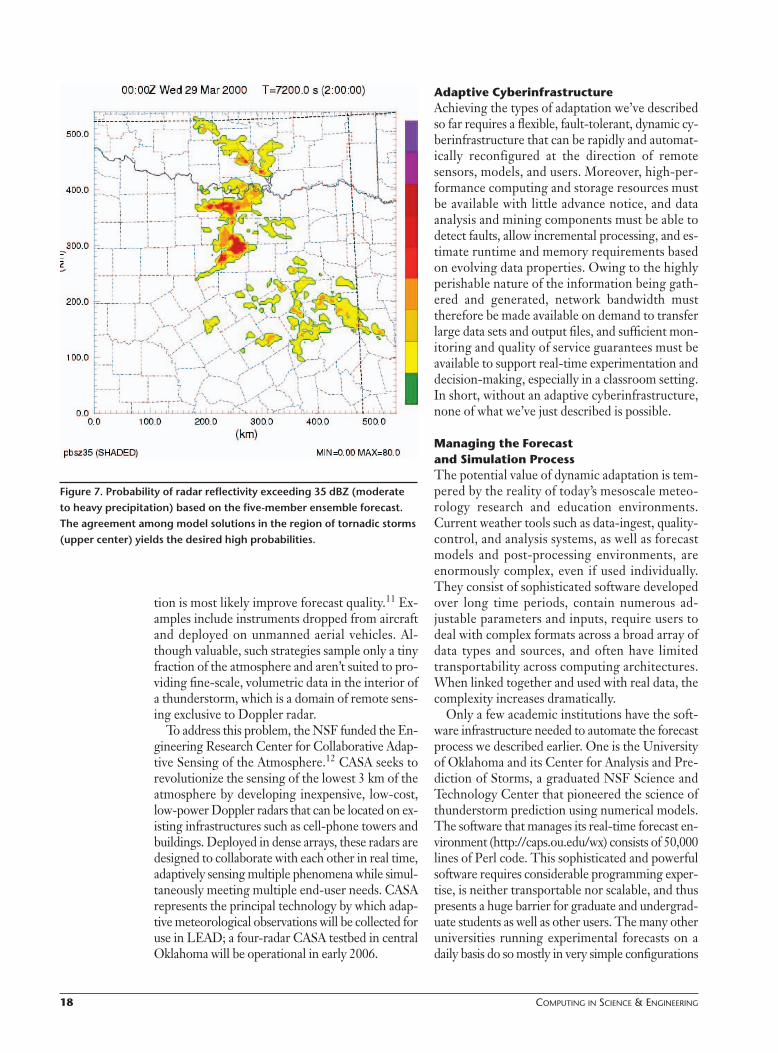
in the ability to quantify forecast uncertainty andemphasize intense local events through the use ofprobabilities. Figure 7 shows the probability ofradar reflectivity exceeding a value of 35 decibelunits of radar reflectivity (dBZ), or heavy precipi-tation. This calculation simply involves determin-ing—at each grid point—how many forecasts meetthis criterion and then dividing by the total num-ber of forecasts. Note how the ensemble de-em-phasizes the spurious storms in the southeasternpart of the domain and highlights the region inwhich all forecasts agreed—near Fort Worth—where all the tornadic storms actually occurred.
The ability to initiate an ensemble of forecasts au-tomatically and then determine the ensemble’s size,and thus the computational and networking load,dynamically based on a control run’s output repre-sents a significant adaptation to both observationsand model output and is one of LEAD’s key goals.
Adaptive Observing SystemsThe adaptive behavior illustrated in the previoussubsection is confined to the operation of a nu-merical model. However, models are fed by obser-vations, the instruments for which are typicallydeployed in spatially regular arrays that remainfixed in space, collect observations at prescribed in-tervals, and operate largely independently (and inthe same mode), regardless of the type of weatherpresent. A prime example is the NEXRADDoppler weather radar network across the US: dueto the radars’ long range, Earth’s curvature pre-vents them from sampling approximately 72 per-cent of the atmosphere below 1 km. Furthermore,the radars have only a few modes of operation andcan’t be tasked to focus on specific regions of theatmosphere at the expense of others.
In recent years, researchers have supplementedconventional observation strategies with adaptiveor targeted observations in which sensors are de-ployed to specific areas where additional informa-
(a)
(d) (e)
(b) (c)
Control forecast Ensemble member #1
Ensemble member #4Ensemble member #3
Ensemble member #2
Figure 6. Five-member ensemble forecasting. In (a) a control forecast on 29 March 2000, warmer colors indicate greaterprecipitation intensity during a two-hour run; each of (b) – (e) the four ensemble members is created from a slightly different butphysically plausible initial condition, yet the variation among predicted aerial coverage, intensity, and placement is significant.
18 COMPUTING IN SCIENCE & ENGINEERING
tion is most likely improve forecast quality.11 Ex-amples include instruments dropped from aircraftand deployed on unmanned aerial vehicles. Al-though valuable, such strategies sample only a tinyfraction of the atmosphere and aren’t suited to pro-viding fine-scale, volumetric data in the interior ofa thunderstorm, which is a domain of remote sens-ing exclusive to Doppler radar.
To address this problem, the NSF funded the En-gineering Research Center for Collaborative Adap-tive Sensing of the Atmosphere.12 CASA seeks torevolutionize the sensing of the lowest 3 km of theatmosphere by developing inexpensive, low-cost,low-power Doppler radars that can be located on ex-isting infrastructures such as cell-phone towers andbuildings. Deployed in dense arrays, these radars aredesigned to collaborate with each other in real time,adaptively sensing multiple phenomena while simul-taneously meeting multiple end-user needs. CASArepresents the principal technology by which adap-tive meteorological observations will be collected foruse in LEAD; a four-radar CASA testbed in centralOklahoma will be operational in early 2006.
Adaptive CyberinfrastructureAchieving the types of adaptation we’ve describedso far requires a flexible, fault-tolerant, dynamic cy-berinfrastructure that can be rapidly and automat-ically reconfigured at the direction of remotesensors, models, and users. Moreover, high-per-formance computing and storage resources mustbe available with little advance notice, and dataanalysis and mining components must be able todetect faults, allow incremental processing, and es-timate runtime and memory requirements basedon evolving data properties. Owing to the highlyperishable nature of the information being gath-ered and generated, network bandwidth musttherefore be made available on demand to transferlarge data sets and output files, and sufficient mon-itoring and quality of service guarantees must beavailable to support real-time experimentation anddecision-making, especially in a classroom setting.In short, without an adaptive cyberinfrastructure,none of what we’ve just described is possible.
Managing the Forecast and Simulation ProcessThe potential value of dynamic adaptation is tem-pered by the reality of today’s mesoscale meteo-rology research and education environments.Current weather tools such as data-ingest, quality-control, and analysis systems, as well as forecastmodels and post-processing environments, areenormously complex, even if used individually.They consist of sophisticated software developedover long time periods, contain numerous ad-justable parameters and inputs, require users todeal with complex formats across a broad array ofdata types and sources, and often have limitedtransportability across computing architectures.When linked together and used with real data, thecomplexity increases dramatically.
Only a few academic institutions have the soft-ware infrastructure needed to automate the forecastprocess we described earlier. One is the Universityof Oklahoma and its Center for Analysis and Pre-diction of Storms, a graduated NSF Science andTechnology Center that pioneered the science ofthunderstorm prediction using numerical models.The software that manages its real-time forecast en-vironment (http://caps.ou.edu/wx) consists of 50,000lines of Perl code. This sophisticated and powerfulsoftware requires considerable programming exper-tise, is neither transportable nor scalable, and thuspresents a huge barrier for graduate and undergrad-uate students as well as other users. The many otheruniversities running experimental forecasts on adaily basis do so mostly in very simple configurations
Figure 7. Probability of radar reflectivity exceeding 35 dBZ (moderateto heavy precipitation) based on the five-member ensemble forecast.The agreement among model solutions in the region of tornadic storms(upper center) yields the desired high probabilities.

NOVEMBER/DECEMBER 2005 19
using local computing facilities and pregeneratedanalyses to which no new data are added. Thus, animportant goal of LEAD is to lower the entry bar-rier for using complex weather technologies.
System CapabilitiesLEAD’s complex array of services, applications, in-terfaces, and local and remote computing, network-ing, and storage resources is assembled by users inworkflows to study mesoscale weather as it evolves.Figure 8 shows the hierarchy of software required tocreate and orchestrate this suite of capabilities.
From the high-level view (the top of Figure 8),LEAD lets users query for and acquire information(for example, observational data sets, model results,the status of a resource or job, and so on), simulateand predict weather by using numerical atmos-pheric models, assimilate data (that is, combine ob-servations under imposed dynamical constraints tocreate a 3D atmospheric state), and analyze, mine,and visualize data and model output. The outcomesof these operations (the bottom of Figure 8) in-clude data sets, model output, gridded analyses, an-imations, static images, and a wide variety ofrelationships and other information. The fabricthat links the user requirements with outcomes—namely, the extensive middleware, tool, and servicecapabilities—is LEAD’s research domain.
We’ve provided several foundational tools within
the LEAD environments (the second level in Fig-ure 8), including
• a Web portal, the primary (though not exclusive)user entry point;
• the ARPS Data Assimilation System,13 a sophis-ticated tool for data quality control and assimila-tion, including the preparation of initialconditions for simulations and forecasts;
• myLEAD,14 a flexible metadata catalog service; • the Weather Research and Forecast (WRF)
model,15 a next-generation atmospheric predic-tion and simulation model;
• ADaM (Algorithm Development and Mining),16
a powerful suite of tools for mining observationaldata, assimilated data sets, and model output; and
• Integrated Data Viewer,17 a widely used desktopapplication for visualizing a variety of multidi-mensional geophysical data.
As we’ll describe later, these foundational tools andthe resources that enable them are linked togetherin a service-oriented architecture (SOA).
System ConceptLEAD’s conceptual underpinning is WOORDS, theworkflow orchestration for on-demand, real-time, dy-namically adaptive systems. As used in LEAD, WO-ORDS components have the following meaning:
Fundamentalcapabilities
Simulate Assimilate PredictAnalyze/mine Visualize
Query
Execute
Store
Execute
Publish Authorize
Move
Edit
Configure
Monitor
Foundationaluser tools
ADAS WRF IDVADaM
Catalog
Outcomes Data sets Model output AnimationsGridded analyses Static images Relationships
Build
Compile
Authorize
TriggerSteer
ManageDefine
Query & acquire
Portal
Enablingfunctions
• Authorization• Authentication• Notification• Monitoring• Workflow• Security• ESML
• VO catalog• THREDDS Catalog• MyLEAD• Control• Query• Stream• Transcoder
• Ontology• Host environment• GPIR• Application host• Execution description• Application description
New Knowledge, Understanding, Ideas
MyLead
Define
Middlewareservices
Figure 8. LEAD system. Fundamental capabilities familiar to meteorologists are shown in the top level, below which are theassociated tools for enacting these capabilities and the middleware that links everything together. System-generatedproducts appear at the bottom.
20 COMPUTING IN SCIENCE & ENGINEERING
• Workflow orchestration is the automation of aprocess, in whole or part, during which tasks orinformation are exchanged among system com-ponents to perform a specific action according toa set of procedural rules.
• On demand is the ability to perform an actionimmediately with or without prior planning ornotification.
• Real time is the transmission or receipt of infor-mation about an event nearly simultaneouslywith its occurrence.
• Dynamically adaptive is the ability of a system, orany of its components, to respond automaticallyand in a coordinated manner to both internal andexternal influences.
• A system is a group of independent but interrelatedelements that operate in a unified, holistic manner.
Another important notion is streaming data, whichconnotes information transported in a nearly time-continuous manner, often directly as input to ser-vices without first being written to files.
Although mesoscale meteorology and numericalweather prediction represent archetypal applica-tions of WOORDS, the concept is far more gen-eral. The effective suppression of wild fires, forexample, could depend on numerical simulationsthat incorporate evolving weather conditions, fuelavailability, burn-line locations, and so on. Em-bedded sensors could measure roadway conditionsand highway traffic flow to help reroute traffic incase of accidents. These examples show how usingWOORDS as a general notion can benefit non-meteorology communities.
The LEAD SystemLEAD consists of the following principal compo-nents (see Figure 9):
• The user subsystem comprises the LEAD portal—the principal mechanism by which users can ac-cess LEAD technologies—as well as themyLEAD personal workspace and the geo-ref-erence graphical user interface.
• The data subsystem handles data and metadata,any numerical model output produced by oper-ational or experimental models, and user-gener-ated information.
• The tools subsystem consists of all meteorologicaland IT tools as well as interfaces for user-sup-plied tools.
• The orchestration subsystem provides the tech-nologies that let users manage data flows andmodel execution streams, and create and mineoutput. It also provides linkages to other soft-
ware and processes for continuous or on-demandapplications.
• Located at six of the nine participating institu-tions (the University of Oklahoma, the Univer-sity of Illinois at Urbana-Champaign, theUniversity of Alabama in Huntsville, the UCARUnidata Program, the University of North Car-olina at Chapel Hill, and Indiana University), thedistributed computing systems in the LEAD gridrepresent a distributed testbed for developing,integrating, and testing LEAD’s components.
The LEAD system is instantiated as an SOA,which organizes an enterprise or system’s key func-tions as a set of services. Workflows orchestrate thecollections of service invocations and responses re-quired to accomplish specific tasks. A Web serviceperforms a specific operation, or a set of operations,based on requests from clients—for example, book-ing airline flights or looking up a friend’s address.Web services conform to a family of standards,generally called “WS-*,” that specify most aspectsof the service’s behavior. For example,
• the Web Service Definition Language (WSDL;www.w3c.org) specifies both how a service ex-pects to receive requests and the type of re-sponses it generates;
• WS-Addressing defines the way a client accessesa service and to what location the service shouldsend responses; and
• WS-Security defines protocols for secure com-munication of messages from the client to theservice and back.
SOAs are widely deployed in the commercial en-terprise sector, and they form the foundation ofmany scientific “grid” technologies.
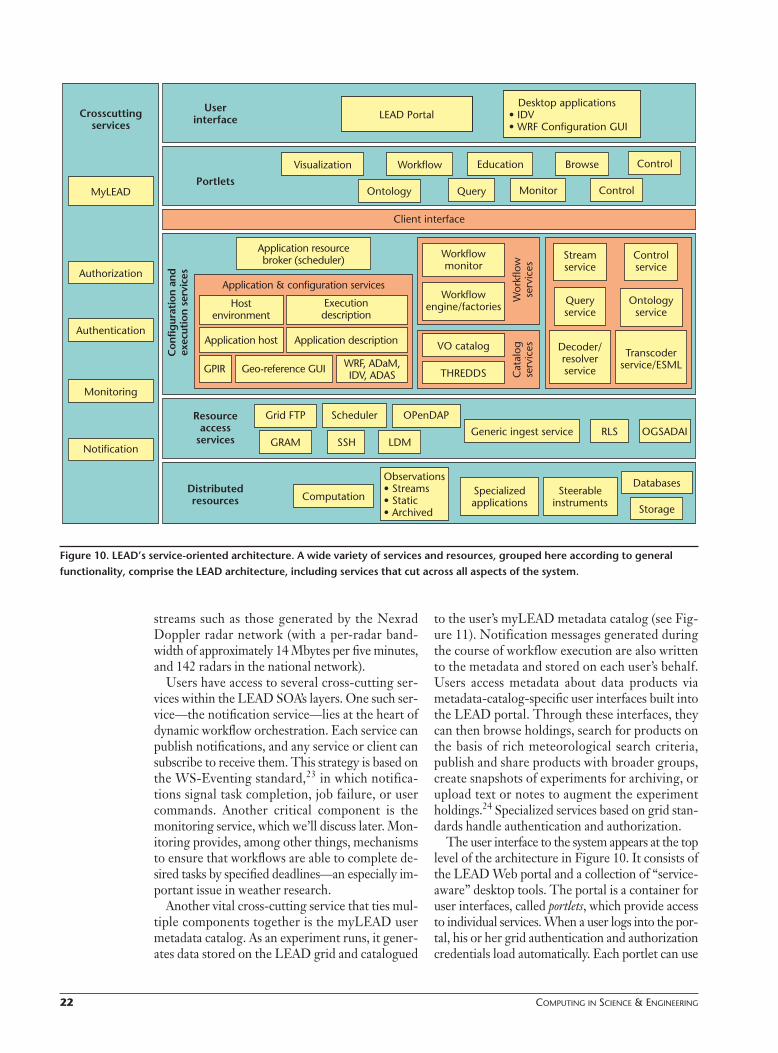
As Figure 10 shows, the LEAD SOA has five dis-tinct yet highly interconnected layers. The bottomlayer represents raw computation, application, anddata resources distributed throughout the LEADgrid and elsewhere. The next level up holds theWeb services that provide access to raw servicessuch as those found in the Globus toolkit, as wellas services for accessing weather data (Unidata’s lo-cal data manager [LDM]18 and the Open-SourceProject for a Network Data Access Protocol[www.opendap.org]) and data access services suchas the replica location service19 and the Open GridService Architecture Data Access and Integration(OGSA-DAI) service.20
The configuration and execution services in themiddle layer, consisting of five elements, representservices invoked by LEAD workflows. The first is

NOVEMBER/DECEMBER 2005 21
the application-oriented configuration service thatmanages the deployment and execution of real ap-plications such as the WRF simulation model, theARPS Data Assimilation System, and the ADaMtools. Related to it is the application resource bro-ker, which matches the appropriate host for execu-tion to each application task, based on theexecution’s time constraints. The workflow engineservice, which drives experimental workflow in-stances, invokes both the configuration service andapplication resource broker. The fourth element,known as catalog services, represents the mannerin which a user or application service discoverspublic-domain data products, or LEAD services,for use in computational experiments via a virtualorganization catalog. This catalog obtains infor-mation about public data products by periodicallycrawling THREDDS (Thematic Real-time Envi-ronmental Distributed Data Services) catalogs,21
which store pointers to a wide variety of data.Finally, users require a host of data services to
support rich query, access, and transformation op-erations on data products. An important goal be-hind LEAD is access transparency—facilitating user
queries across all available heterogeneous datasources without adverse affects from different for-mats and naming schemes. Achieving any level oftransparency requires at least minimal metadata fordescribing data products.
Metadata are essential for managing hugeamounts of data generated by observing systems,models, and other meteorological resources.LEAD’s XML schema—called the LEAD meta-data schema—adheres to the US Federal Geo-graphic Data Committee (FGDC)-definedstandard for geospatial data. Specifically, we cre-ated an FGDC profile for LEAD by modifying theFGDC schema, restructuring it to handle theLEAD notion of resource collection, and addingother elements while still maintaining namespacesfor separate LEAD catalogs. We released version1.0 of the schema in June 2005.
A key Web service that maps higher-level at-mospheric concepts to concrete terms used in dataservices is the LEAD ontology service. Decoderand interchange services, such as the Earth SystemMarkup Language,22 transform data from one formto another. Stream services manage live data
Portal
Geo-reference GUI
MyLEAD workspace
User subsystem
LEAD grid
Servers andlive feeds
Storage
Controllabledevices
ESML
Personal catalogs
THREDDS catalogs
Semanticstechnologies
Data subsystem
Task design
Allocation &scheduling
Monitoring
Estimation
Workflowengine
WorkflowGUI
Orchestration subsystem
ADAS
IDV
User- specified
ADaM
Workflow GUI
Detectionalgorithms
Tools subsystem
Grid resourcesand servicesLocal resources and services
Figure 9. LEAD system framework. LEAD is composed of several interacting subsystems, with the LEAD grid representing astable, secure environment for development and testing.
22 COMPUTING IN SCIENCE & ENGINEERING
streams such as those generated by the NexradDoppler radar network (with a per-radar band-width of approximately 14 Mbytes per five minutes,and 142 radars in the national network).
Users have access to several cross-cutting ser-vices within the LEAD SOA’s layers. One such ser-vice—the notification service—lies at the heart ofdynamic workflow orchestration. Each service canpublish notifications, and any service or client cansubscribe to receive them. This strategy is based onthe WS-Eventing standard,23 in which notifica-tions signal task completion, job failure, or usercommands. Another critical component is themonitoring service, which we’ll discuss later. Mon-itoring provides, among other things, mechanismsto ensure that workflows are able to complete de-sired tasks by specified deadlines—an especially im-portant issue in weather research.
Another vital cross-cutting service that ties mul-tiple components together is the myLEAD usermetadata catalog. As an experiment runs, it gener-ates data stored on the LEAD grid and catalogued
to the user’s myLEAD metadata catalog (see Fig-ure 11). Notification messages generated duringthe course of workflow execution are also writtento the metadata and stored on each user’s behalf.Users access metadata about data products viametadata-catalog-specific user interfaces built intothe LEAD portal. Through these interfaces, theycan then browse holdings, search for products onthe basis of rich meteorological search criteria,publish and share products with broader groups,create snapshots of experiments for archiving, orupload text or notes to augment the experimentholdings.24 Specialized services based on grid stan-dards handle authentication and authorization.
The user interface to the system appears at the toplevel of the architecture in Figure 10. It consists ofthe LEAD Web portal and a collection of “service-aware” desktop tools. The portal is a container foruser interfaces, called portlets, which provide accessto individual services. When a user logs into the por-tal, his or her grid authentication and authorizationcredentials load automatically. Each portlet can use
Distributedresources
Cat
alog
serv
ices
Wor
kflo
wse
rvic
es
Con
figur
atio
n an
dex
ecut
ion
serv
ices
Computation Specializedapplications
Steerableinstruments
Storage
Databases
Resourceaccess
services GRAM
Grid FTP
SSH
Scheduler
LDM
OPenDAP
Generic ingest service
Userinterface
Desktop applications• IDV• WRF Configuration GUI
LEAD Portal
Portlets
Visualization Workflow Education
Monitor
Control
Ontology Query
Browse
ControlMyLEAD
Crosscuttingservices
Authorization
Authentication
Monitoring
Workflowmonitor
Workflowengine/factories
VO catalog
THREDDS
Application resourcebroker (scheduler)
Hostenvironment
GPIR WRF, ADaM,IDV, ADAS
Executiondescription
Application description
Application & configuration services
Client interface
Observations• Streams• Static• Archived
RLS OGSADAI
Geo-reference GUI
Controlservice
Streamservice
Ontologyservice
Decoder/resolverservice
Transcoderservice/ESML
Application host
Queryservice
Notification
Figure 10. LEAD’s service-oriented architecture. A wide variety of services and resources, grouped here according to generalfunctionality, comprise the LEAD architecture, including services that cut across all aspects of the system.

NOVEMBER/DECEMBER 2005 23
these identity certificates to access individual serviceson the users’ behalf, thus allowing them to com-mand the portal as a proxy for composing and exe-cuting workflows on back-end resources.
The LEAD Grid and PortalWe’re currently deploying the LEAD SOA on theLEAD grid, which consists of a set of compute andstorage resources (located at several of the LEADinstitutions), ranging from single-CPU Linux sys-tems with a few terabytes of local storage to largecluster-based systems and mass storage facilities ca-pable of serving many petabytes of data. TheLEAD grid is built on two systems: the Globus gridinfrastructure framework25 and the LDM. TheLEAD SOA is layered on top of that.
The LEAD grid provides a distributed “cleanroom” environment within which to develop, inte-grate, and test the LEAD SOA. By having com-plete control over system and application softwareversion control, LEAD can enforce compatibilityrequirements and avoid the numerous problemsthat can plague research and development effortsconducted in more open, unstable environments.We’re currently developing strategies for migrat-ing beyond this “safe sandbox” to other grids, suchas the TeraGrid.
Most users access the LEAD grid via the LEADportal (Figure 11), which also provides a gatewayto the TeraGrid, a national infrastructure for com-putational science. The LEAD portal is based onthe NSF National Middleware Initiative OpenGrid Computing Environment Portal toolkit(www.ogce.org). This portal lets users load proxyidentity certificates (based on Globus’s GSI model)into the portal server, which in turn allows the por-tal server to interact with the LEAD grid on theuser’s behalf. The portal also provides the user withoptions for configuring experiments and launchingthem on the LEAD grid.
Workflows and Incremental DevelopmentThe LEAD system is a sequence of prototypes thatserve to test and refine research concepts, engageend users, stimulate new ideas, and provide a mech-anism for ensuring effective integration amongmultiple disciplines. The fundamental “buildingblocks” of these prototypes are a series of Web ser-vices (see Figure 12a) that also consist of servicesand can be used as standalone applications or aspart of the overall LEAD environment. Users cancombine the services, via an orchestration interface,in numerous ways to create a wide array of capa-bilities, adding other services as necessary or creat-
ing and saving workflows of services that can alsobe combined in new workflows to solve increas-ingly complex problems (see Figure 12b).
Figure 11. The LEAD portal. Upon logging in, theuser is presented with a view of the myLEADworkspace, which is a private metadata catalog ofresults from the user’s computational experiments.
(b)
Service A(ADAS)
Service B(WRF)
Service D(MyLEAD)
Service E(VO Catalog)
Service F(IDV)
Service C(NEXRADStream)
Service G(Monitoring)
Service H(Scheduling)
Service I(ESML)
Service J(Repository)
Service K(ADaM)
Service L(ESML)
Manyothers…(a)
Service A(ADAS)
Service B(WRF)
Service D(MyLEAD)
Service C(NEXRADStream)
Service K(ADaM)
Service J(Repository)
Service L(ESML)
Figure 12. Web services and workflow engine. (a)LEAD is built on a series of Web services rangingfrom complex meteorological models to datastreams and decoders. (b) By using the workflowengine to combine LEAD services, users can create awide array of capabilities for research and education.Additional services can be added as needed.
24 COMPUTING IN SCIENCE & ENGINEERING
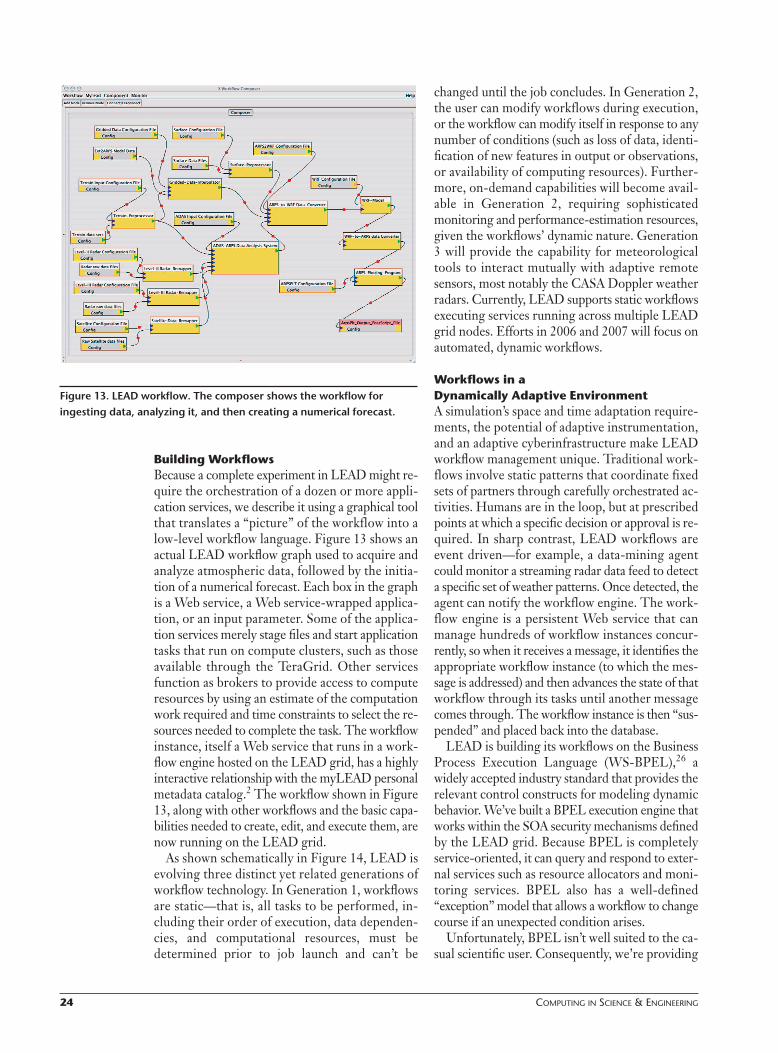
Building WorkflowsBecause a complete experiment in LEAD might re-quire the orchestration of a dozen or more appli-cation services, we describe it using a graphical toolthat translates a “picture” of the workflow into alow-level workflow language. Figure 13 shows anactual LEAD workflow graph used to acquire andanalyze atmospheric data, followed by the initia-tion of a numerical forecast. Each box in the graphis a Web service, a Web service-wrapped applica-tion, or an input parameter. Some of the applica-tion services merely stage files and start applicationtasks that run on compute clusters, such as thoseavailable through the TeraGrid. Other servicesfunction as brokers to provide access to computeresources by using an estimate of the computationwork required and time constraints to select the re-sources needed to complete the task. The workflowinstance, itself a Web service that runs in a work-flow engine hosted on the LEAD grid, has a highlyinteractive relationship with the myLEAD personalmetadata catalog.2 The workflow shown in Figure13, along with other workflows and the basic capa-bilities needed to create, edit, and execute them, arenow running on the LEAD grid.
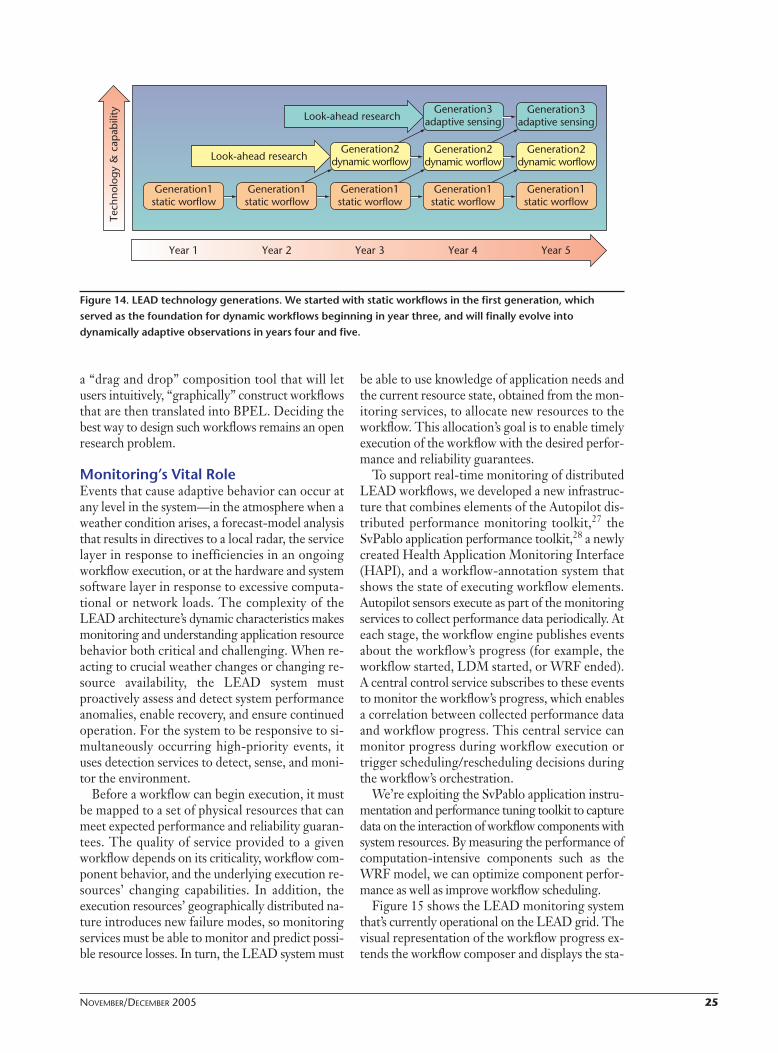
As shown schematically in Figure 14, LEAD isevolving three distinct yet related generations ofworkflow technology. In Generation 1, workflowsare static—that is, all tasks to be performed, in-cluding their order of execution, data dependen-cies, and computational resources, must bedetermined prior to job launch and can’t be
changed until the job concludes. In Generation 2,the user can modify workflows during execution,or the workflow can modify itself in response to anynumber of conditions (such as loss of data, identi-fication of new features in output or observations,or availability of computing resources). Further-more, on-demand capabilities will become avail-able in Generation 2, requiring sophisticatedmonitoring and performance-estimation resources,given the workflows’ dynamic nature. Generation3 will provide the capability for meteorologicaltools to interact mutually with adaptive remotesensors, most notably the CASA Doppler weatherradars. Currently, LEAD supports static workflowsexecuting services running across multiple LEADgrid nodes. Efforts in 2006 and 2007 will focus onautomated, dynamic workflows.
Workflows in a Dynamically Adaptive EnvironmentA simulation’s space and time adaptation require-ments, the potential of adaptive instrumentation,and an adaptive cyberinfrastructure make LEADworkflow management unique. Traditional work-flows involve static patterns that coordinate fixedsets of partners through carefully orchestrated ac-tivities. Humans are in the loop, but at prescribedpoints at which a specific decision or approval is re-quired. In sharp contrast, LEAD workflows areevent driven—for example, a data-mining agentcould monitor a streaming radar data feed to detecta specific set of weather patterns. Once detected, theagent can notify the workflow engine. The work-flow engine is a persistent Web service that canmanage hundreds of workflow instances concur-rently, so when it receives a message, it identifies theappropriate workflow instance (to which the mes-sage is addressed) and then advances the state of thatworkflow through its tasks until another messagecomes through. The workflow instance is then “sus-pended” and placed back into the database.
LEAD is building its workflows on the BusinessProcess Execution Language (WS-BPEL),26 awidely accepted industry standard that provides therelevant control constructs for modeling dynamicbehavior. We’ve built a BPEL execution engine thatworks within the SOA security mechanisms definedby the LEAD grid. Because BPEL is completelyservice-oriented, it can query and respond to exter-nal services such as resource allocators and moni-toring services. BPEL also has a well-defined“exception” model that allows a workflow to changecourse if an unexpected condition arises.
Unfortunately, BPEL isn’t well suited to the ca-sual scientific user. Consequently, we’re providing
Figure 13. LEAD workflow. The composer shows the workflow foringesting data, analyzing it, and then creating a numerical forecast.
NOVEMBER/DECEMBER 2005 25
a “drag and drop” composition tool that will letusers intuitively, “graphically” construct workflowsthat are then translated into BPEL. Deciding thebest way to design such workflows remains an openresearch problem.
Monitoring’s Vital RoleEvents that cause adaptive behavior can occur atany level in the system—in the atmosphere when aweather condition arises, a forecast-model analysisthat results in directives to a local radar, the servicelayer in response to inefficiencies in an ongoingworkflow execution, or at the hardware and systemsoftware layer in response to excessive computa-tional or network loads. The complexity of theLEAD architecture’s dynamic characteristics makesmonitoring and understanding application resourcebehavior both critical and challenging. When re-acting to crucial weather changes or changing re-source availability, the LEAD system mustproactively assess and detect system performanceanomalies, enable recovery, and ensure continuedoperation. For the system to be responsive to si-multaneously occurring high-priority events, ituses detection services to detect, sense, and moni-tor the environment.
Before a workflow can begin execution, it mustbe mapped to a set of physical resources that canmeet expected performance and reliability guaran-tees. The quality of service provided to a givenworkflow depends on its criticality, workflow com-ponent behavior, and the underlying execution re-sources’ changing capabilities. In addition, theexecution resources’ geographically distributed na-ture introduces new failure modes, so monitoringservices must be able to monitor and predict possi-ble resource losses. In turn, the LEAD system must
be able to use knowledge of application needs andthe current resource state, obtained from the mon-itoring services, to allocate new resources to theworkflow. This allocation’s goal is to enable timelyexecution of the workflow with the desired perfor-mance and reliability guarantees.
To support real-time monitoring of distributedLEAD workflows, we developed a new infrastruc-ture that combines elements of the Autopilot dis-tributed performance monitoring toolkit,27 theSvPablo application performance toolkit,28 a newlycreated Health Application Monitoring Interface(HAPI), and a workflow-annotation system thatshows the state of executing workflow elements.Autopilot sensors execute as part of the monitoringservices to collect performance data periodically. Ateach stage, the workflow engine publishes eventsabout the workflow’s progress (for example, theworkflow started, LDM started, or WRF ended).A central control service subscribes to these eventsto monitor the workflow’s progress, which enablesa correlation between collected performance dataand workflow progress. This central service canmonitor progress during workflow execution ortrigger scheduling/rescheduling decisions duringthe workflow’s orchestration.
We’re exploiting the SvPablo application instru-mentation and performance tuning toolkit to capturedata on the interaction of workflow components withsystem resources. By measuring the performance ofcomputation-intensive components such as theWRF model, we can optimize component perfor-mance as well as improve workflow scheduling.
Figure 15 shows the LEAD monitoring systemthat’s currently operational on the LEAD grid. Thevisual representation of the workflow progress ex-tends the workflow composer and displays the sta-
Tech
nolo
gy &
cap
abili
ty Look-ahead research
Year 1 Year 2 Year 3 Year 4 Year 5
Generation3adaptive sensing
Generation3adaptive sensing
Look-ahead researchGeneration2
dynamic worflowGeneration2
dynamic worflowGeneration2
dynamic worflow
Generation1static worflow
Generation1static worflow
Generation1static worflow
Generation1static worflow
Generation1static worflow
Figure 14. LEAD technology generations. We started with static workflows in the first generation, whichserved as the foundation for dynamic workflows beginning in year three, and will finally evolve intodynamically adaptive observations in years four and five.

26 COMPUTING IN SCIENCE & ENGINEERING
tus of the workflow’s tasks with a color-coded dis-play. Different colors represent status, and color in-tensities represent the collective resourceinformation’s CPU load values (for example, yel-low indicates the task hasn’t started, and green rep-resents the currently active branch of theworkflow). Trends in performance and reliabilityon relevant resources are displayed below theworkflow graph.
A reliability-monitoring toolkit complements theperformance-monitoring infrastructure. It helpsLEAD use reliability data to make scheduling de-cisions, anticipate likely failures, and take action be-fore workflows are disrupted. The failure indicatorinfrastructure in LEAD is based on HAPI, an in-terface for discovery and use of health-related di-agnostic information. By combining performanceand failure models, the infrastructure can guaran-tee continued operation of weather forecasting andrespond to additional resource requests based onweather phenomena.
Dynamically Adaptive LearningIn addition to creating a dynamically adaptive cy-berinfrastructure for mesoscale meteorology,LEAD is evolving a consistent education conceptknown as the Dynamically Adaptive Learning En-vironment (DALE). In contrast to more conven-tional learning in which a student proceeds through
a largely deterministic pathway toward under-standing a particular concept, DALE places thestudent in an inquiry-based environment in whichhe or she can explore new ideas by creating entirelynew pathways and tools—specifically, interactingwith weather to explore new questions as theyemerge in the student’s mind.
Tools and services that offer student-centered ca-pabilities are predicated on the existence of rich, dy-namic models of student understanding.29 Suchmodels depict key ideas that learners should under-stand, common learner conceptions and misconcep-tions, and how these ideas change over time asstudent understanding becomes increasingly sophis-ticated.30 DALE provides students with the ability toexplore their own ideas in virtual concept spaces andis scalable and extensible to other disciplines.
The construction of the LEAD systemand grid has been under way for twoyears, and we’ve learned many lessons.Some are common to most grid-ori-
ented projects—for example, security is alwaysmore difficult to implement in a multi-institutionalenvironment than expected. Moreover, it’s impos-sible to avoid software being installed in differentways on different hosts even in a clean-room test-bed built from dedicated resources, as is the casewith the LEAD grid. Consequently, the construc-tion of distributed applications with complete de-pendence on system-level coherence is virtuallyimpossible. This fact reveals the distinct advantageof an SOA: interacting with service interfaces hideslow-level system differences.
Finally, we’ve learned that maintaining largenumbers of continuously running or persistent ser-vices is very difficult and places a substantial bur-den on system administrators. A viable solution isto build a system in which a small number of ser-vices (in our case, the crosscutting services and por-tal) are persistent, with the remainder instantiatedon-demand by reliable core services. We anticipatelearning many more lessons upon moving into thedomain of dynamically adaptive workflows.
AcknowledgmentsLEAD is a large information technology research grantfunded by the US National Science Foundation under thefollowing cooperative agreements: ATM-0331594(University of Oklahoma), ATM-0331591 (ColoradoState University), ATM-0331574 (Millersville University),ATM-0331480 (Indiana University), ATM-0331579(University of Alabama in Huntsville), ATM03-31586(Howard University), ATM-0331587 (University
Figure 15. Workflow monitoring system. The LEAD monitoring systemprovides both graphical and textual information about the health andstatus of each workflow service and predicts hardware reliability bytracking CPU temperature and other variables.

NOVEMBER/DECEMBER 2005 27
Corporation for Atmospheric Research), and ATM-0331578 (University of Illinois at Urbana-Champaign,with a subcontract to the University of North Carolina).
References1. R.A. Pielke and R. Carbone, “Weather Impacts, Forecasts, and
Policy,” Bulletin Am. Meteorological Soc., vol. 83, 2002, pp.393–403.
2. B. Plale et al., “Cooperating Services for Managing Data DrivenComputational Experimentation,” Computing in Science & Eng.,vol. 7, no. 5, 2005, pp. 34–43.
3. M. Xue, K.K. Droegemeier, and V. Wong, “The Advanced Re-gional Prediction System (ARPS): A Multiscale Nonhydrostatic At-mospheric Simulation and Prediction Model, Part I: ModelDynamics and Verification,” Meteorological and AtmosphericPhysics, vol. 75, 2000, pp. 161–193.
4. W.C. Skamarock and J.B. Klemp, “Adaptive Grid Refinement forTwo-Dimensional and Three-Dimensional Nonhydrostatic Atmos-pheric Flow,” Monthly Weather Rev., vol. 121, 1993, pp. 788–804.
5. G. Dietachmayer and K. Droegemeier, “Application of Continu-ous Dynamic Grid Adaptation Techniques to MeteorologicalModeling, Part I: Basic Formulation and Accuracy,” MonthlyWeather Rev., vol. 120, 1992, pp. 1675–1706.
6. M. Xue et al., “The Advanced Regional Prediction System (ARPS):Storm-Scale Numerical Weather Prediction and Data Assimilation,”Meteorological and Atmospheric Physics, vol. 82, 2003, pp. 139–170.
7. R.J. Fleming, “On Stochastic Dynamic Prediction I: The Energet-ics of Uncertainty and the Question of Closure,” Monthly WeatherRev., vol. 99, 1971, pp. 851–872.
8. E. Kalnay, Atmospheric Modeling, Data Assimilation and Pre-dictability, Cambridge Press, 2003.
9. F. Kong, K.K. Droegemeier, and N.L. Levit, “Multiple ResolutionEnsemble Forecast of an Observed Tornadic Thunderstorm Sys-tem, Part I: Comparison of Coarse and Fine Grid Experiments,”to be published in Monthly Weather Rev., 2005.
10. Storm Data, Nat’l Climatic Data Center March 2000 Storm Data,vol. 42, no.3, 2000, p. 172.
11. R.E. Morss, K.A. Emanuel, and C. Snyder, “Idealized Adaptive Ob-servation Strategies for Improving Numerical Weather Predic-tion,” J. Atmospheric Science, vol. 58, 2001, pp. 210–232.
12. D.J. McLaughlin et al., “Distributed Collaborative Adaptive Sens-ing (DCAS) for Improved Detection, Understanding, and Pre-diction of Atmospheric Hazards,” Proc. 9th Symp. IntegratedObservational and Assimilation Systems for the Atmosphere,Oceans, and Land Surfaces, Am. Meteorological Soc., 2005.
13. K. Brewster, “Application of a Bratseth Analysis Scheme Includ-ing Doppler Radar Data,” Proc. 15th Conf. Weather Analysis andForecasting, Am. Meteorological Soc., 1996, pp. 92–95.
14. B. Plale et al., “User-Oriented Active Management of ScientificData with myLEAD,” IEEE Internet Computing, vol. 9, no. 1, 2005,pp. 27–34.
15. J. Michalakes et al., “Development of a Next-generation RegionalWeather Research and Forecast Model,” Proc. 9th ECMWF Work-shop on the Use of Parallel Processors in Meteorology, ArgonneNat’l Lab., 2000; preprint ANL/MCS-P868-0101.
16. J. Rushing et al., “ADaM: A Data Mining Toolkit for Scientists andEngineers,” to be published in Computers & Geosciences, 2005.
17. D. Murray et al., “The Integrated Data Viewer—A Web-EnabledApplication for Scientific Analysis and Visualization, Proc. 19thConf. Integrated Information and Processing, Am. MeteorologicalSoc., 2003.
18. R.K. Rew and G. Davis, “Distributed Data Capture and Process-ing in a Local Area Network,” Proc. 6th Int’l Conf. Interactive In-formation and Processing Systems for Meteorology, Oceanographyand Hydrology, Am. Meteorological Soc., 1990, pp. 69–72.
19. S. Vazhkudai, S. Tuecke, and I. Foster, “Replica Selection in theGlobus Data Grid,” IEEE/ACM Int’l Conf. Cluster Computing andthe Grid (CCGRID), IEEE CS Press, 2001, pp. 106–113.
20. M. Antonioletti et al., “Design and Implementation of Grid Data-base Services in OGSA-DAI,” Concurrency and Computation: Prac-tice and Experience, vol. 17, nos. 2–4, 2005, pp. 357–376.
21. E.R. Davis, and J. Caron, “THREDDS: A Geophysical Data/Meta-data Framework,” Proc. 18th Int’l Conf. Interactive Information Pro-cessing Systems (IIPS) for Meteorology, Oceanography, andHydrology, Am. Meteorological Soc., 2002, pp. 52–53.
22. R. Ramachandran et al., “Earth Science Markup Language (ESML):A Solution for Scientific Data-Application Interoperability Prob-lem,” Computers & Geosciences, vol. 30, 2004, pp. 117–124.
23. D.L. Box et al., “Web Services Eventing (WS-Eventing),” Aug.2004; http://ftpna2.bea.com/pub/downloads/WS-Eventing.pdf.
24. S. Lee et al., “Structure, Sharing, and Preservation of ScientificExperiment Data,” to be published in Proc. 3rd Int’l Workshop onChallenges of Large Applications in Distributed Environments(CLADE), 2005.
25. I. Foster and C. Kesselman, “Globus: A Metacomputing Infra-structure Toolkit,” Int’l J. Supercomputer Applications, vol. 11, no.2, 1997, pp. 115–128.
26. T. Andrews et al., Business Process Execution Language for Web Ser-vices, v1.1, IBM Developers Library, May 2003.
27. D.A. Reed and C Mendes, “Intelligent Monitoring for Adaptationin Grid Applications,” Proc. IEEE, vol. 93, no. 2, 2005, pp. 426–435.
28. L. DeRose, Y. Zhang, and D.A. Reed, “SvPablo: A Multi-LanguagePerformance Analysis System,” Proc. 10th Int’l Conf. ComputerPerformance Evaluation, Modeling Techniques and Tools, Springer-Verlag, 1998, pp. 352–355.
29. A.T. Corbett, K.R. Koedinger, and W.H. Hadley, “Cognitive Tu-tor: From the Research Classroom to All Classrooms,” Technol-ogy Enhanced Learning: Opportunities for Change, P.S. Goodman,ed., Lawrence Erlbaum Assoc., 2001, pp. 235–263.
30. Benchmarks for Science Literacy: New York, Project 2061, Am. As-soc. for the Advancement of Science, Oxford Univ. Press, 1993.
Kelvin K. Droegemeier is Regents’ Professor and Weath-ernews Chair of Meteorology, director of the Center forAnalysis and Prediction of Storms at the Sasaki Institute,and associate vice president for research at the Univer-sity of Oklahoma. His research interests are in numericalweather prediction, computational fluid dynamics, andhigh-performance computing. Droegemeier has a PhDin atmospheric science from the University of Illinois, Ur-bana-Champaign. Contact him at [email protected].
Dennis Gannon is a professor in the Computer Sci-ence Department at Indiana University. His research in-terests include distributed systems, Grid computing,and building programming environments for scientificapplications. Gannon has a PhD in computer sciencefrom the University of Illinois and a PhD in mathemat-ics from the University of California, Davis. Contact himat [email protected].
Daniel A. Reed is director of the Renaissance Com-puting Institute (RENCI), an interdisciplinary centerspanning the University of North Carolina at ChapelHill, Duke University, and North Carolina State Univer-sity. He is also the vice-chancellor for information tech-

28 COMPUTING IN SCIENCE & ENGINEERING
nology at the University of North Carolina at ChapelHill, where he holds the Chancellor’s Eminent Profes-sorship. Contact him at [email protected].
Beth Plale is an assistant professor in the computer sci-ence department at Indiana University. Her research in-terests include data management, grid computing,distributed systems, streaming data, and middleware.Plale has a PhD in computer science from the StateUniversity of New York Binghamton. Contact her [email protected].
Jay Alameda leads the Middleware Division of the In-tegrated CyberService Directorate, US National Centerfor Supercomputing Applications (NCSA) at the Uni-versity of Illinois Urbana-Champaign. He has an MS innuclear engineering from the University of Illinois, Ur-bana-Champaign, and a BS in chemical engineeringfrom the University of Notre Dame. Contact him [email protected].
Tom Baltzer is a software engineer for the Unidata Pro-gram at the University Corporation for AtmosphericResearch. He’s also active in the Project ManagementInstitute Mile High chapter, the Colorado SoftwareProcess Improvement Network, and the Boulder chap-ter of the ACM. Baltzer has a BS in computer sciencefrom the University of Colorado, Boulder. Contact himat [email protected].
Keith Brewster is a senior research scientist with theCenter for Analysis and Prediction of Storms at the Uni-versity of Oklahoma. His interests are in the use ofmodern observing systems in high-resolution numeri-cal weather prediction and hazards detection. Brew-ster has a PhD in meteorology from the University ofOklahoma. Contact him at [email protected].
Richard D. Clark is the chair of the Department ofEarth Sciences and professor of meteorology atMillersville University of Pennsylvania. His research in-terests include boundary layers and turbulence, airchemistry, and science education. Clark has a PhD inatmospheric science from the University of Wyoming.Contact him at [email protected].
Ben Domenico is deputy director of the Unidata Pro-gram Center at the University Corporation for Atmos-pheric Research. His research interests are incyberinfrastructure for geoscientific data access, analy-sis, and visualization. Domenico has a PhD in astro-physics from the University of Colorado at Boulder.Contact him at [email protected].
Sara J. Graves is a board of trustees university professor,
professor of computer science, and director of the Infor-mation Technology and Systems Center at the Univer-sity of Alabama in Huntsville. She is also the director ofthe Information Technology Research Center at the Na-tional Space Science and Technology Center. She has aPhD in computer science from the University of Alabamain Huntsville. Contact her at [email protected].
Everette Joseph is an associate professor in the De-partment of Physics and Astronomy at Howard Uni-versity, codirector of the NOAA/Howard UniversityCenter for Atmospheric Sciences, and principal in-vestigator on several research grants from NASA,NOAA, and NSF. He has a PhD in physics from theState University of New York at Albany. Contact himat [email protected].
Don Murray is a meteorologist/software engineer atthe Unidata Program Center in Boulder, Colorado. Hisinterests include geoscience visualization, remote dataaccess, glacial geology, and gardening. Murray has anMS in earth sciences from Montana State University.Contact him at [email protected].
Rahul Ramachandran is a research scientist at the Uni-versity of Alabama in Huntsville’s Information Technol-ogy and Systems Center. His research interests includethe design and development of scientific tools and al-gorithms, data mining, semantics, and ontology. Ra-machandran has a PhD in atmospheric from theUniversity of Alabama in Huntsville. Contact him at [email protected].
Mohan Ramamurthy is the director of the UniversityCorporation for Atmospheric Research’s Unidata Pro-gram and is a scientist at the US National Center for At-mospheric Research. His technical interests includeweather processes and prediction. Ramamurthy has aPhD in meteorology from the University of Oklahoma,Norman. Contact him at [email protected].
Lavanya Ramakrishnan is a research programmer at theRenaissance Computing Institute. Her research interestsinclude grid and high-performance computing with a fo-cus on monitoring and orchestration of application work-flows and portal environments. Ramakrishnan has an MSin computer science from Indiana University, Blooming-ton. Contact her at [email protected].
John A. Rushing is a senior research scientist at the Uni-versity of Alabama in Huntsville. His research interestsinclude pattern recognition, image processing, datamining, and artificial intelligence. Rushing has a PhD incomputer science from the University of Alabama inHuntsville. Contact him at [email protected].

NOVEMBER/DECEMBER 2005 29
Dan Weber is a senior research scientist with the Cen-ter for Analysis and Prediction of Storms at the Univer-sity of Oklahoma. His research interests include thedevelopment and use of numerical prediction modelsfor investigating atmospheric convection, severestorms, and urban weather. Weber has a PhD in mete-orology from the University of Oklahoma. Contact himat [email protected].
Robert Wilhelmson is a professor of atmospheric sci-ences in the Department of Atmospheric Sciences andchief science officer and senior associate director of theUS National Center for Supercomputing Applications,both at the University of Illinois at Urbana-Champaign.He has a PhD in computer science from the Universityof Illinois at Urbana-Champaign. Contact him [email protected].
Anne Wilson is a software engineer in the UniversityCorporation for Atmospheric Research’s Unidata Pro-
gram, where she designs and builds systems that pro-vide access to both near-real-time data and archivaldata. Wilson has a PhD in computer science from theUniversity of Maryland, College Park. Contact her [email protected].
Ming Xue is an associate professor in the School ofMeteorology and scientific director of the Center forAnalysis and Prediction of Storms at the University ofOklahoma. His interests include the development andapplication of advanced numerical weather predictionand data-assimilation systems. Xue has a PhD in mete-orology from the University of Reading, England. Con-tact him at [email protected].
Sepideh Yalda is an associate professor of meteorologyat Millersville University. Her research interests are in theareas of climate dynamics and regional climate change.Yalda has a PhD in meteorology from Saint Louis Uni-versity. Contact her at [email protected].
EXECUTIVE COMMITTEEPresident:GERALD L. ENGEL* Computer Science & EngineeringUniv. of Connecticut, Stamford1 University PlaceStamford, CT 06901-2315Phone: +1 203 251 8431Fax: +1 203 251 [email protected]: DEBORAH M. COOPER*Past President: CARL K. CHANG*VP, Educational Activities: MURALI VARANASI†VP, Electronic Products and Services: JAMES W. MOORE (2ND VP)*VP, Conferences and Tutorials: YERVANT ZORIAN†VP, Chapters Activities: CHRISTINA M. SCHOBER*VP, Publications: MICHAEL R. WILLIAMS (1ST VP)*VP, Standards Activities: SUSAN K. (KATHY) LAND*VP, Technical Activities: STEPHANIE M. WHITE†Secretary: STEPHEN B. SEIDMAN*Treasurer: RANGACHAR KASTURI†2004–2005 IEEE Division V Director: GENE F. HOFFNAGLE†2005–2006 IEEE Division VIII Director: STEPHEN L. DIAMOND†2005 IEEE Division V Director-Elect: OSCAR N. GARCIA*Computer Editor in Chief: DORIS L. CARVER†Executive Director: DAVID W. HENNAGE†* voting member of the Board of Governors† nonvoting member of the Board of Governors
E X E C U T I V E S T A F FExecutive Director: DAVID W. HENNAGEAssoc. Executive Director: ANNE MARIE KELLYPublisher: ANGELA BURGESSAssociate Publisher: DICK PRICEDirector, Administration: VIOLET S. DOANDirector, Information Technology & Services: ROBERT CAREDirector, Business & Product Development: PETER TURNER
PURPOSE The IEEE Computer Society is theworld’s largest association of computing pro-fessionals, and is the leading provider of tech-nical information in the field.
MEMBERSHIP Members receive the month-ly magazine Computer, discounts, and opportu-nities to serve (all activities are led by volunteer members). Membership is open to all IEEEmembers, affiliate society members, and othersinterested in the computer field.
COMPUTER SOCIETY WEB SITEThe IEEE Computer Society’s Web site, at www.computer.org, offers information andsamples from the society’s publications and con-ferences, as well as a broad range of informationabout technical committees, standards, studentactivities, and more.
BOARD OF GOVERNORSTerm Expiring 2005: Oscar N. Garcia, Mark A. Grant, Michel Israel, Rohit Kapur, Stephen B. Seidman, Kathleen M. Swigger, MakotoTakizawaTerm Expiring 2006: Mark Christensen, Alan Clements, Annie Combelles, Ann Q. Gates, James D. Isaak, Susan A. Mengel, Bill N. SchilitTerm Expiring 2007: Jean M. Bacon, George V.Cybenko, Richard A. Kemmerer, Susan K. (Kathy)Land, Itaru Mimura, Brian M. O’Connell, ChristinaM. SchoberNext Board Meeting: 4 Nov. 2005, Philadelphia
IEEE OFFICERSPresident and CEO : W. CLEON ANDERSONPresident-Elect: MICHAEL R. LIGHTNERPast President: ARTHUR W. WINSTONExecutive Director: TBDSecretary: MOHAMED EL-HAWARYTreasurer: JOSEPH V. LILLIEVP, Educational Activities: MOSHE KAMVP, Pub. Services & Products: LEAH H. JAMIESONVP, Regional Activities: MARC T. APTERVP, Standards Association: JAMES T. CARLOVP, Technical Activities: RALPH W. WYNDRUM JR.IEEE Division V Director: GENE F. HOFFNAGLEIEEE Division VIII Director: STEPHEN L. DIAMONDPresident, IEEE-USA: GERARD A. ALPHONSE
COMPUTER SOCIETY OFFICESHeadquarters Office
1730 Massachusetts Ave. NW
Washington, DC 20036-1992
Phone: +1 202 371 0101
Fax: +1 202 728 9614
E-mail: [email protected]
Publications Office10662 Los Vaqueros Cir., PO Box 3014Los Alamitos, CA 90720-1314Phone:+1 714 8218380E-mail: [email protected] and Publication Orders:Phone: +1 800 272 6657 Fax: +1 714 821 4641E-mail: [email protected]
Asia/Pacific OfficeWatanabe Building1-4-2 Minami-Aoyama,Minato-kuTokyo107-0062, JapanPhone: +81 3 3408 3118 Fax: +81 3 3408 3553E-mail: [email protected]