service quality and customer satisfaction of electricity
TRANSCRIPT
_____________________________________________________________________________________________________ *Corresponding author: E-mail: [email protected];
Asian Journal of Economics, Business and Accounting 8(4): 1-18, 2018; Article no.AJEBA.44493 ISSN: 2456-639X
Service Quality and Customer Satisfaction of Electricity Distribution Company: A Study of Olumo
Business Hub, Abeokuta, Ogun State
A. Shodiya Olayinka1*, O. Ojenike Joseph1, O. Jolaosho Surajudeen1 and T. Adebayo Adeyinka1
1Department of Business and Finance, Crescent University, Abeokuta, Ogun State, Nigeria.
Authors’ contributions
This work was carried out in collaboration between all authors. Author ASO designed the study, performed the statistical analysis, wrote the protocol and wrote the first draft of the manuscript. Authors OOJ and OJS managed the analyses of the study. Author TAA managed the literature
searches. All authors read and approved the final manuscript.
Article Information
DOI: 10.9734/AJEBA/2018/44493
Editor(s):
(1) Dr. Maria-Dolores Guillamon, Department of Financial Economics and Accounting, University of Murcia,
Spain.
Reviewers:
(1) Abdel Fattah, Mahmoud Al-Azzam Zarqa University, Jordan.
(2) Arup Kumar Baksi, Aliah University, India.
(3) Darmesh, Management and Science University, Malaysia.
Complete Peer review History: http://www.sciencedomain.org/review-history/27175
Received 19 August 2018
Accepted 31 October 2018
Published 12 November 2018
ABSTRACT This study examines the relationship between service quality and customer satisfaction in Ibadan Electricity Distribution Company. To achieve this, IBEDC customers residing in Ogun State were sampled to seek their opinion on their level of satisfaction with IBEDC's services. Survey research was employed which involved the distribution of questionnaires to customers. The questionnaire sought information based on the five SERVQUAL dimension of reliability, empathy, responsiveness, tangibles and assurance which were measured on a 7-point Likert scale. A total of 397 customers were surveyed with 19 SERVQUAL survey items and 3 customer satisfaction survey items. Data collected were analysed with the use of the arithmetic mean, standard deviation and Partial Least Squares Structural Equation Model (PLS-SEM) for testing the five hypotheses theorised in the study. From the study, it was established that the reliability of IBEDC does not have a significant
Original Research Article

Olayinka et al.; AJEBA, 8(4): 1-18, 2018; Article no.AJEBA.44493
2
effect on customer satisfaction in Olumo business hub, Abeokuta which implied that IBEDC’s ability to perform the promised service dependably and accurately or delivering on its promises is very poor. The study established that the empathy of IBEDC does not have a significant effect on customer satisfaction in Olumo business hub, Abeokuta which implied that IBEDC's caring and provision of individualised attention to customers by their staff are very poor. It established that the responsiveness of IBEDC does not have a significant effect on customer satisfaction in Olumo business hub, Abeokuta which implied that IBEDC’s willingness or readiness of staff to provide service is very poor. The study also established that the tangibles of IBEDC do not have a significant effect on customer satisfaction in Olumo business hub, Abeokuta which implied that IBEDC physical facilities (offices), staff appearance, materials associated to the service (transformers, wires etc. and equipment used to provide electricity are very old and obsolete. The finding from the study shows that the assurance of IBEDC does not have a significant effect on customer satisfaction in Olumo business hub, Abeokuta which implied that IBEDC’s staff knowledge and courtesy to convey trust and confidence is very poor.
Keywords: Service quality; customer satisfaction; Ibadan electricity distribution company; service
provider; electricity distribution companies.
1. INTRODUCTION Electricity Distribution Companies (DisCos) are saddled with the responsibility of supplying electricity to electricity consumers in Nigeria. They connect consumers with the electricity grid, transform and step-down electricity from the high voltage of 132 kV at the transmission level to the lower voltage levels of 33kV/11kV/0.415kV depending on the group of customers and distribute energy to the final consumer either as industrial or domestic users. DisCos are also responsible for the marketing and sale of electricity to customers which are an important function in the electricity value chain. All the revenue needed to sustain the electricity industry is earned through the distribution sector [1].
Ibadan Electricity Distribution Company (IBEDC), one of the eleven electricity distribution companies came into existence on 1
st November
2013 as part of the privatisation effort of the electricity sector. The Discos cover the largest franchise area in Nigeria, made up of Oyo, Ogun, Osun, Kwara and parts of Niger, Ekiti and Kogi states. To ensure efficient and effective management of such a large network, the company is divided into five regions, namely Oyo, Ibadan, Osun, Ogun and Kwara regions which are made up of Business Hubs (BH) that is manned by a Regional Commercial Manager and Regional Technical Manager in order to improve the quality of service delivered to their customers [2]. Service quality has widely been deliberated on since the 20th century and its idea is still relevant
to help today organisations in product differentiation and gaining competitive advantage in an era of globalisation [3,4]. According to Agyapong [5], the concept of quality, efficiency, productivity, growth and survival pose a great challenge for the survival and growth of all organisations. These growth and survival demands are further deepened by the need to attract new customers and retain existing ones, as they are the main focus of any successful business.
In quality management literature, service quality is often seen as a multi-dimensional construct. For example, the Nordic school of thought suggests that service quality should have two important dimensions, namely technical quality (that is, what customers' received from services provided by an organization) and functional quality (that is, how an organization delivers services to customers) [6,7]. Later, the service quality construct is modified and simplified by United States of America school of thought where it proposes that effective service quality should have five specific dimensions, namely tangible (physical facilities, equipment, and appearance of workers), reliability (ability to perform the promised service dependably and accurately), responsiveness (willingness to help customer and provide prompt service), assurance (knowledge and courtesy of workers and their abilities to inspire trust and confidence), and empathy (caring, individualized attention the organization provides its customers [8,9,10,11] .
However, the quality school of thoughts have different ideas which are developed based on

Olayinka et al.; AJEBA, 8(4): 1-18, 2018; Article no.AJEBA.44493
3
individual attitudes and perceptions [12]. This view believes that service quality is an important outcome of a comparison between customer expectations and their experience of the service [13]. If customers view that their expectations for service performance conform with their perceptions of the service, this situation may induce the notion of service quality [13,14]. Customer's assessment of service quality is critical information for service providers whose aim is to improve business performance, strengthen core competencies and position themselves more strategically in the marketplace [15,16]. Organisations that provide superior service quality do experience higher economic returns and also have a more satisfied customer base [17,18]. Therefore, it has become ubiquitous for service providers to seek out competitive advantages by providing superior service [19]. Zeithaml and Bitner [20] Opine that satisfaction is the customer’s evaluation of a product or service regarding whether it meets their needs and expectations. Customer satisfaction is derived largely from the quality and reliability of products and services [21] and represents the assessment of the performance of a product or service by customers, making it important for successful business performance measurement. Customers are always aiming to get maximum satisfaction from the products or services they buy, therefore, for any organisation to succeed in today's' marketplace; they must build customer relationship and not just building their products. Building customer relationships mean delivering superior value over competitors to the target customers [22]. Whether an organisation provides quality services or not depends on customers' feedback on the satisfaction they get from consuming the products, since higher levels of quality lead to higher levels of customer satisfaction [23].
Providing a good service quality is a major issue for all business especially for service providing companies like Electricity Distribution Companies in Nigeria (DisCos). Customer satisfaction may determine the success or failure of a business. To be competitive in the marketplace, service provider companies need to satisfy their customer. Best service quality provided would ensure a high market share and a substantial return.
A couple of years back after the conclusion of the privatisation process of the power sector in Nigeria, Discos customers are still not satisfied with the quality of service provided by the company. Customers still experience erratic power supply which has forced many electricity consumers to seek an alternative source of power in form investing in generator set, inverter, solar energy etc. Furthermore, electricity consumers are not satisfied with the billing system adopted by Disco. Some of them argued that they had been overcharged every month while some argued that they have not been given prepaid metres even after paying money to DisCos officials. In addition, electricity consumers have also complained of the nonchalant attitude of DisCos officials in handling the issue of replacing spoilt transformers. Some communities have been left out without electricity supply for years due to spoilt transformers and there is no hope as regards replacing these transformers. The irony of the matter is that DisCos still serve them their monthly bill and expect them to pay for the service they did not enjoy. However, several writers that have presented their argument on service quality and customer satisfaction such as [24,25,26] have focused their attention on the telecommunication and banking industry while little or no attention has been given to the electricity distribution companies in Nigeria. This means that there is a major gap in the relevant literature which need to be filled. Therefore, this research attempts to fill this gap by examining the impact of service quality on customer satisfaction in IBEDC, Olumo service hub to know whether customers are satisfied with the service provided by this company.
In this article we explore the relationship between service quality and customer satisfaction in Ibadan Electricity Distribution Company, Olumo Business Hub; evaluating the effect of service quality on customer satisfaction in Ibadan Electricity Distribution Company, Olumo business Hub. This study started with the introduction of the term service quality and customer satisfaction in Ibadan Electricity Distribution Company, Olumo business Hub which was then followed by the Literature

Olayinka et al.; AJEBA, 8(4): 1-18, 2018; Article no.AJEBA.44493
4
review, research method, analyses of data and consequently the conclusion and recommendation.
2. LITERATURE REVIEW 2.1 Service Quality Service quality is considered as a critical dimension of competitiveness (Lewis, 1989). Providing excellent service quality and high customer satisfaction is an important issue and challenge facing organisations [27]. Service quality is an important subject in both the public and private sectors, in the business and service industries [28]. It is the extent to which a service meets or exceeds customer needs and expectations [29,30,31,32,33,28]. During the past two decades, service quality has become a major area of attention to practitioners, managers and researchers because of its strong impact on business performance, lower costs, return on investment, customer satisfaction, customer loyalty and gaining higher profit [34,15,35,36,37,38,39,40,41,42].
The rapid development and competition of service quality, in both developed and developing countries, has made it important for companies to measure and evaluate the quality of service encounters [43]. Several conceptual models have been developed by different researchers for measuring service quality. It is envisaged that conceptual models in service quality enable management to identify quality problems and thus help in planning for the launch of a quality improvement program, thereby improving the efficiency, profitability and overall performance [42]. There are two main aspects that describe and affect both service quality; the actual service customers expected (expected service) and services perceived (perceived service). Fitzsimmons and Fitzsimmons [44] explain that the creation of customer satisfaction for a service can be identified through a comparison between service perceptions with service expectation, see Fig. 1.
Although the definitions of service quality vary, the definitions are all formulated from the customer perspective: That is, what customers perceive are important dimensions of quality [29]. [45] and [46] were the pioneers in the
Fig. 1. Perceived service quality model Source: Fitzsimmons and Fitzsimmons (2001)

Olayinka et al.; AJEBA, 8(4): 1-18, 2018; Article no.AJEBA.44493
5
conceptualisation of the service quality construct, these authors maintained that the overall perception of quality was a disconfirmation of a customer's expectation and his/her evaluation of a service. The dimensions of service quality have also been debated in the literature. For example, [45] proposed technical (the tangible aspects of service delivery) and functional (the expressive performance of the service) qualities as two critical dimensions of service quality. Alternatively, Parasuraman et al. 66 proposed five service quality dimensions, namely, tangibles, reliability, responsiveness, assurance and empathy. Rust and Oliver [47] developed a three-component dimensional model and concluded that the service product (i.e. technical quality), the service delivery (i.e. functional quality), and the service environment were critical dimensions of service quality. Dabholkar and Thorpe [48] tested a hierarchical conceptualisation of retail service quality that proposed three levels: (1) customers’ overall perceptions of service quality; (2) primary dimensions; and (3) sub-dimensions. Brady and Cronin [6] adopted the view that service quality perceptions were multi-dimensional and identified the primary dimensions of their model based on [47] findings. More recent work by Brady and Cronin [6] has provided a new and integrated conceptualisation of service quality. They argued convincingly that customers form service quality perceptions on the basis of their evaluations of three primary dimensions: Outcome quality, interaction quality, and environmental quality; these three primary dimensions are composed of multiple sub-dimensions. The aggregate evaluations of the sub-dimensions form their perceptions of an organisation's performance on each of the three primary dimensions, and those perceptions then lead to an overall service quality perception. The debate on service quality dimensions is still ambiguous, but it is generally accepted that perceptions of service quality are multidimensional and the dimensions are industry-specific.
2.2 Customer Satisfaction Recent interpretations in the consumer domain now couch satisfaction as a fulfilment response. Fulfilment implies that a consumption goal is known, as in basic motives of hunger, thirst, and safety. However, observers of human behaviour understand that these and other goals can be and frequently are modified and updated in
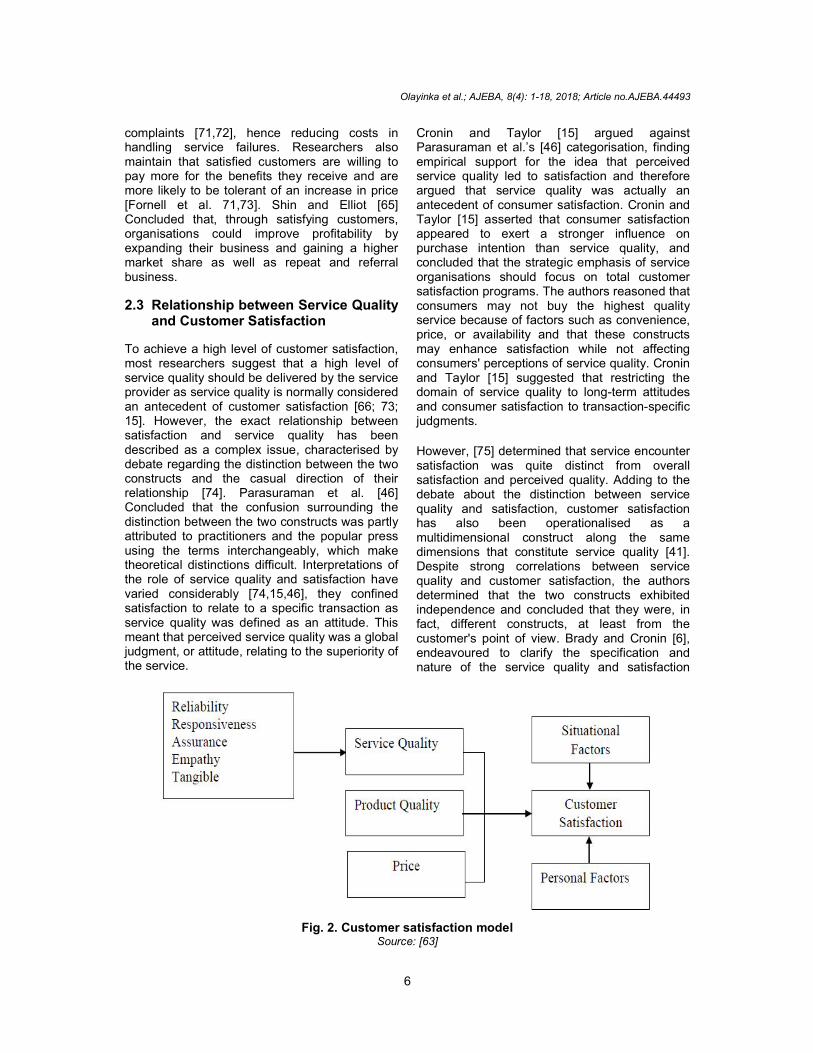
various ways. Thus, consumer researchers have moved away from the literal meaning of satisfaction and now pursue this concept as the consumer experiences and describe it. In [49], satisfaction is the consumer’s fulfilment response. It is a judgment that a product or service feature, or the product or service itself, provided (or is providing) a pleasurable level of consumption-related fulfilment, including levels of under or over-fulfilment. Hence, Satisfaction is an overall customer attitude towards a service provider while [50] concluded that [51] regard it an emotional reaction to the difference between what customers anticipate and what they receive. When customers are satisfied, they are more likely to return, while dissatisfied customers are more likely to go elsewhere [52,53,54]. Since, customer satisfaction is strongly influenced by the interaction between customers and employees [55], examining employee behaviour is critical. Employee behaviour, though, is strongly influenced by the operating organizational culture [56,57,58,59] "a system of shared values and beliefs that produces norms of behaviour and establishes an organizational way of life" [60]. Where the existing literature relates organisational culture and customer satisfaction, those links are either theoretical or indirect [61,62]. Quality of service is the focus of the assessment that reflects the customer's perception of the five specific dimensions of service. Conversely, satisfaction is more inclusive, that is, satisfaction is determined by the perception of service quality, product quality, price, situation factors, and personal factors [63], see Fig. 2. Customer satisfaction has become a key intermediary objective in service operations due to the benefits it brings to organisations [64]. The importance of customer satisfaction is derived from the generally accepted philosophy that for a business to be successful and profitable, it must satisfy customers [65]. Previous research has demonstrated that satisfaction is strongly associated with re-purchase intentions [66,67]. Customer satisfaction also serves as an exit barrier, helping a firm to retain its customers [67,68]. Several studies have concluded that it costs more to gain a new customer than it does to retain an existing one [69,70]. In addition, customer satisfaction also leads to favourable word-of-mouth publicity that provides valuable indirect advertising for an organisation [68; 67]. In many industries, having satisfied customers also means that the organisation receives fewer
Olayinka et al.; AJEBA, 8(4): 1-18, 2018; Article no.AJEBA.44493
6
complaints [71,72], hence reducing costs in handling service failures. Researchers also maintain that satisfied customers are willing to pay more for the benefits they receive and are more likely to be tolerant of an increase in price [Fornell et al. 71,73]. Shin and Elliot [65] Concluded that, through satisfying customers, organisations could improve profitability by expanding their business and gaining a higher market share as well as repeat and referral business.
2.3 Relationship between Service Quality and Customer Satisfaction
To achieve a high level of customer satisfaction, most researchers suggest that a high level of service quality should be delivered by the service provider as service quality is normally considered an antecedent of customer satisfaction [66; 73; 15]. However, the exact relationship between satisfaction and service quality has been described as a complex issue, characterised by debate regarding the distinction between the two constructs and the casual direction of their relationship [74]. Parasuraman et al. [46] Concluded that the confusion surrounding the distinction between the two constructs was partly attributed to practitioners and the popular press using the terms interchangeably, which make theoretical distinctions difficult. Interpretations of the role of service quality and satisfaction have varied considerably [74,15,46], they confined satisfaction to relate to a specific transaction as service quality was defined as an attitude. This meant that perceived service quality was a global judgment, or attitude, relating to the superiority of the service.
Cronin and Taylor [15] argued against Parasuraman et al.’s [46] categorisation, finding empirical support for the idea that perceived service quality led to satisfaction and therefore argued that service quality was actually an antecedent of consumer satisfaction. Cronin and Taylor [15] asserted that consumer satisfaction appeared to exert a stronger influence on purchase intention than service quality, and concluded that the strategic emphasis of service organisations should focus on total customer satisfaction programs. The authors reasoned that consumers may not buy the highest quality service because of factors such as convenience, price, or availability and that these constructs may enhance satisfaction while not affecting consumers' perceptions of service quality. Cronin and Taylor [15] suggested that restricting the domain of service quality to long-term attitudes and consumer satisfaction to transaction-specific judgments.
However, [75] determined that service encounter satisfaction was quite distinct from overall satisfaction and perceived quality. Adding to the debate about the distinction between service quality and satisfaction, customer satisfaction has also been operationalised as a multidimensional construct along the same dimensions that constitute service quality [41]. Despite strong correlations between service quality and customer satisfaction, the authors determined that the two constructs exhibited independence and concluded that they were, in fact, different constructs, at least from the customer's point of view. Brady and Cronin [6], endeavoured to clarify the specification and nature of the service quality and satisfaction
Fig. 2. Customer satisfaction model
Source: [63]
Olayinka et al.; AJEBA, 8(4): 1-18, 2018; Article no.AJEBA.44493
7
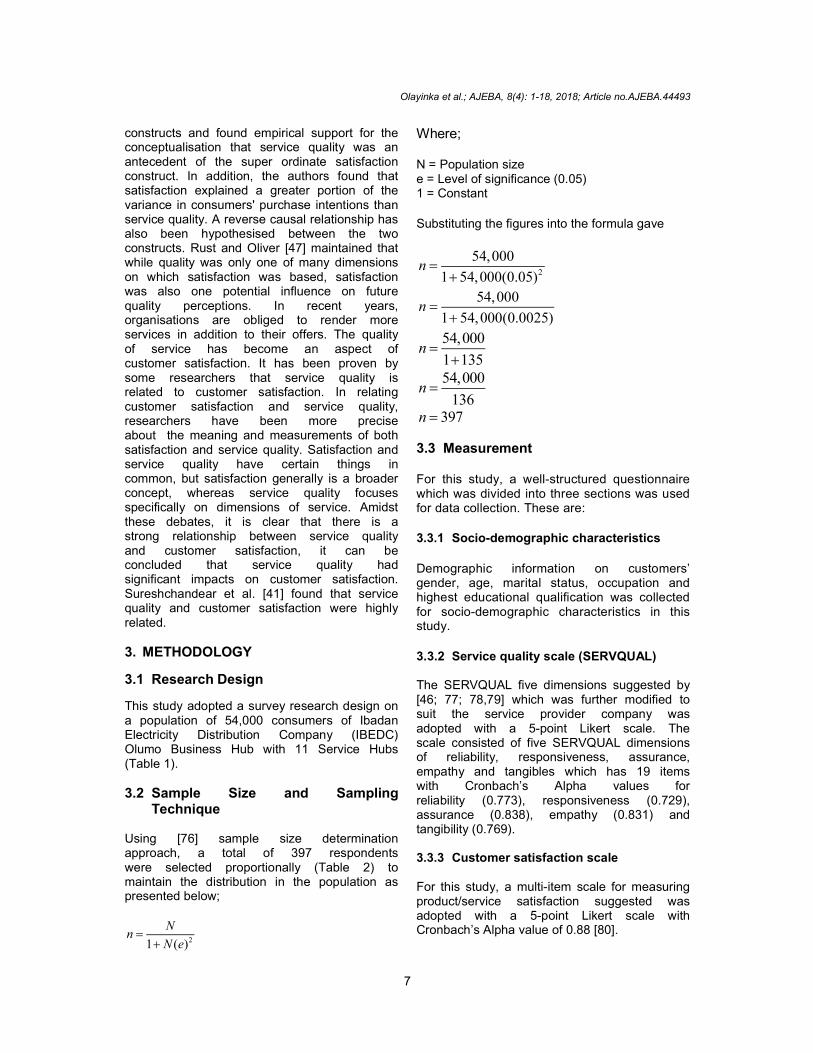
constructs and found empirical support for the conceptualisation that service quality was an antecedent of the super ordinate satisfaction construct. In addition, the authors found that satisfaction explained a greater portion of the variance in consumers' purchase intentions than service quality. A reverse causal relationship has also been hypothesised between the two constructs. Rust and Oliver [47] maintained that while quality was only one of many dimensions on which satisfaction was based, satisfaction was also one potential influence on future quality perceptions. In recent years, organisations are obliged to render more services in addition to their offers. The quality of service has become an aspect of customer satisfaction. It has been proven by some researchers that service quality is related to customer satisfaction. In relating customer satisfaction and service quality, researchers have been more precise about the meaning and measurements of both satisfaction and service quality. Satisfaction and service quality have certain things in common, but satisfaction generally is a broader concept, whereas service quality focuses specifically on dimensions of service. Amidst these debates, it is clear that there is a strong relationship between service quality and customer satisfaction, it can be concluded that service quality had significant impacts on customer satisfaction. Sureshchandear et al. [41] found that service quality and customer satisfaction were highly related. 3. METHODOLOGY
3.1 Research Design
This study adopted a survey research design on a population of 54,000 consumers of Ibadan Electricity Distribution Company (IBEDC) Olumo Business Hub with 11 Service Hubs (Table 1). 3.2 Sample Size and Sampling
Technique Using [76] sample size determination approach, a total of 397 respondents were selected proportionally (Table 2) to maintain the distribution in the population as presented below;
21 ( )
Nn
N e
Where; N = Population size e = Level of significance (0.05) 1 = Constant
Substituting the figures into the formula gave
2
54,000
1 54,000(0.05)n
54,000
1 54,000(0.0025)n
54,000
1 135n
54,000
136n
397n
3.3 Measurement For this study, a well-structured questionnaire which was divided into three sections was used for data collection. These are: 3.3.1 Socio-demographic characteristics
Demographic information on customers’ gender, age, marital status, occupation and highest educational qualification was collected for socio-demographic characteristics in this study.
3.3.2 Service quality scale (SERVQUAL) The SERVQUAL five dimensions suggested by [46; 77; 78,79] which was further modified to suit the service provider company was adopted with a 5-point Likert scale. The scale consisted of five SERVQUAL dimensions of reliability, responsiveness, assurance, empathy and tangibles which has 19 items with Cronbach’s Alpha values for reliability (0.773), responsiveness (0.729), assurance (0.838), empathy (0.831) and tangibility (0.769). 3.3.3 Customer satisfaction scale For this study, a multi-item scale for measuring product/service satisfaction suggested was adopted with a 5-point Likert scale with Cronbach’s Alpha value of 0.88 [80].

Olayinka et al.; AJEBA, 8(4): 1-18, 2018; Article no.AJEBA.44493
8
3.4 Reliability of the Instrument Reliability is the “extent to which a measurement is free of variable errors” [81]. The most popular measure of reliability is the Cronbach’s coefficient alpha. In this study, Cronbach’s alpha reliability test was used to assess the reliability of
measurement scales with multi-point items relating to the components of service quality and customer satisfaction. Based on this, the Cronbach’s alpha test with the value of 0.7 per cent was considered acceptable to ensure reliability [82].
Table 1. List of all service hubs under OLUMO business hub and their total number of
customers
S/N Service hub Location Population of consumers 1 Adigbe Adigbe 3,930 2 Ayetoro Ayetoro 8,614 3 Iberekodo Iberokodo 6,504 4 Ita-Oshin Ita-Oshin 5.391 5 Itori Itori 3,047 6 Itori 2 Itori 2,320 7 Kolobo Kolobo 5,090 8 Lafenwa Lafenwa 7,381 9 Obada Obada 3,335 10 Rounder Rounder 3,720 11 Sapon Sapon 4,668 TOTAL 54,000
Source: Ibadan Electricity Distribution Companies (IBEDC), 2018.
Table 2. Sample selected in each service hub using non-proportional sampling technique
S/N Service hub Population Sample size 1 Adigbe 3930 3.930 397
2954,000 1
2 Ayetoro 8614 8,614 39763
54,000 1
3 Iberekodo 6504 6,504 39748
54,000 1
4 Ita-Oshin 5391 5,391 39740
54,000 1
5 Itori 1 3047 3,047 39722
54,000 1
6 Itori 2 2320 2,320 39717
54,000 1
7 Kolobo 5090 5,090 39737
54,000 1
8 Lafenwa 7381 7,381 39754
54,000 1
9 Obada 3335 3,335 39725
54,000 1
10 Rounder 3720 3,720 39727
54,000 1
11 Sapon 4662 4,662 39735
54,000 1
54,000 397 Source: Researcher’s computation, 2018

Olayinka et al.; AJEBA, 8(4): 1-18, 2018; Article no.AJEBA.44493
9
Independent variables Dependent variable Service Quality Customer Satisfaction
Fig. 3. IBEDC Service Quality and Customer Satisfaction Model
Source: Researcher’s computation, 2018.
3.5 Data Analysis The data analysis was performed using structural equation modelling (SEM). In particular, the research model was analysed using partial least squares (PLS). PLS is an SEM technique that is used in predicting a set of dependent variables from a set of independent variables [83]. The data analysis was conducted in two phases: first, we established the psychometric validity of the scales used, through construct reliability and discriminant validity; and second, we investigated the hypothesised relationships among constructs using PLS.
4. RESULTS AND DISCUSSION 4.1 Pre-test
To validate the psychometric properties of the instruments used in the study, we pre-tested by carrying out a survey of 199 IBEDC customers.
The sample was chosen because it represented 50 per cent of the sample size considered for the study. The reliability of measurement items for each construct was assessed using Cronbach’s alpha, convergent and discriminant validity was assessed using principal components analysis. Both assessments yielded acceptable results in all circumstances.
4.2 Response Rate All the questionnaires administered were duly completed and used for the analysis after data cleaning as presented in Table 3.
4.3 Socio-Demographic Characteristics of Respondents
Demographic characteristics were considered to greatly influence some human decisions or decision-making process; hence, they were obtained from the sampled respondents and
Table 3. Response rate
S/N Population Sample size
Response Returned Completed Not completed Response rate (%)
1 Customers 397 397 397 0 100.0 Total 397 397 397 0 100.0
Source: Field Survey, 2018

Olayinka et al.; AJEBA, 8(4): 1-18, 2018; Article no.AJEBA.44493
10
depicted in Figures 4 to 7. From the study, 61.7 per cent were males while 38.3 per cent were female (Figure 4). Of the sampled respondents, the majority (82.8%) were married (Fig. 5). Also, the majority (34.3%) were between the age group of 25-34 years (Fig. 6) which indicates that respondents are still young and vibrant and are more likely to evaluate the service quality emanating from IBEDC. From the study, all the respondents have one form of education or
another and can, therefore, demonstrate an understanding of what attributes they want and how well these attributes have been satisfied (Fig. 7).
4.4 Instrument Validity The psychometric validity of the scales used was established through construct reliability and discriminant validity.
Fig. 4. Bar chart showing the distribution of customers according to gender
Table 4. Descriptive statistics and analysis of construct validity
Indicator Mean Std. deviation Loadings P-Value Customer Satisfaction (CUS)
CUS1 <- CUS 3.84 1.11 0.88 0.01 CUS2 <- CUS 3.00 1.12 0.83 0.01 CUS3 <- CUS 4.13 1.12 0.81 0.01
Reliability (REL) REL1 <- REL 3.63 1.19 0.89 0.01 REL2 <- REL 4.54 1.28 0.79 0.01 REL3 <- REL 4.46 1.17 0.90 0.01 REL4 <- REL 3.01 1.23 0.73 0.01
Empathy (EMP) EMP1 <- EMP 4.18 1.09 0.85 0.01 EMP2 <- EMP 3.38 1.12 0.88 0.01 EMP3 <- EMP 3.16 1.21 0.77 0.01 EMP4 <- EMP 4.05 1.37 0.91 0.01
Responsiveness (RESP) RESP1 <- RESP 3.39 1.11 0.89 0.01 RESP2 <- RESP 3.13 1.31 0.76 0.01 RESP3 <- RESP 3.26 1.22 0.86 0.01 RESP4 <- RESP 4.02 1.10 0.86 0.01
Tangibles (TAN) TAN1 <- TAN 4.67 1.01 0.84 0.01 TAN2 <- TAN 4.03 1.14 0.79 0.01 TAN3 <- TAN 3.18 1.21 0.81 0.01
Assurance (ASS) ASS1 <- ASS 3.22 1.27 0.97 0.01 ASS2 <- ASS 3.16 1.09 0.79 0.01 ASS3 <- ASS 4.18 1.17 0.76 0.01 ASS4 <- ASS 4.14 1.31 0.81 0.01

Olayinka et al.; AJEBA, 8(4): 1-18, 2018; Article no.AJEBA.44493
11
Fig. 5. Bar chart showing the distribution of customers according to marital status
Fig. 6. Bar chart showing the distribution of customers according to age
Fig. 7. Bar chart showing the distribution of customers according to educational qualification
Construct reliability was assessed using two measures of internal consistency: Cronbach’s alpha and composite reliability. Both of them must assume values of above 0.70 to indicate an acceptable reliability [84]. Table 4 showed the
descriptive statistics while Table 5 showed the construct reliability. The loadings of all items captured assumed a value above 0.70 (Table 4). Also, both

Olayinka et al.; AJEBA, 8(4): 1-18, 2018; Article no.AJEBA.44493
12
Cronbach’s alpha and composite reliability were very high, revealing a high degree of internal coherence and good psychometric properties (Table 5). To evaluate the discriminant validity, two tests were performed. First, the cross-loadings of measurement items on latent constructs were examined. In this test, discriminant validity is demonstrated when an item loads more highly on its intended construct than on any other construct. Following [85] this difference in loadings should be at least 0.10. In this test, all
items showed excellent discriminant validity (Table 6). Therefore, the model demonstrated high discriminant validity. A second test of discriminant validity is to compare the AVE score for each construct. In the AVE test of discriminant validity, the square root of a given construct’s AVE should be larger than any correlation of the given construct with any other construct in the model [84]. All of the results of this test were generally acceptable (Table 7).
Table 5. Reliability scores
Construct Composite reliability Cronbach’s α Customer satisfaction (CUS) 0.815 0.854 Reliability (REL) 0.726 0.775 Empathy (EMP) 0.851 0.831 Responsiveness (RESP) 0.882 0.729 Tangibles (TAN) 0.876 0.769 Assurance (ASS) 0.908 0.839
Table 6. Cross-loadings of measurement items to latent constructs
CUS REL EMP RESP TAN ASS CUS1 0.8801 0.6466 0.5395 0.2759 0.1201 0.1625 CUS2 0.8311 0.6028 0.6918 0.4516 0.1324 0.2158 CUS3 0.8102 0.6415 0.6975 0.4006 0.1471 0.5411 REL1 0.5071 0.8987 0.7272 0.3425 0.1521 0.3335 REL2 0.5199 0.7941 0.6211 0.3013 0.4101 0.1599 REL3 0.4058 0.9010 0.5247 0.3062 0.1657 0.2471 REL4 0.3090 0.7320 0.5059 0.2481 0.4714 0.4120 EMP1 0.4833 0.1533 0.8533 0.2312 0.4412 0.1368 EMP2 0.4789 0.2817 0.8817 0.1902 0.3942 0.1589 EMP3 0.5280 0.3714 0.7714 0.2339 0.2371 0.5142 EMP4 0.5807 0.2099 0.9099 0.4172 0.5147 0.3695 RESP1 0.623 0.4515 0.8183 0.8183 0.3925 0.3925 RESP2 0.5627 0.5042 0.8036 0.8036 0.2426 0.3312 RESP3 0.5234 0.5057 0.8082 0.8082 0.2187 0.2584 RESP4 0.6248 0.617 0.8015 0.8015 0.3333 0.1581 TAN1 0.2944 0.1521 0.2428 0.1661 0.8412 0.2661 TAN2 0.4093 0.1957 0.3951 0.3867 0.7918 0.4867 TAN3 0.4330 0.1474 0.3320 0.4867 0.8907 0.1867 ASS1 0.2111 0.1477 0.3511 0.1801 0.1811 0.9723 ASS2 0.2871 0.1899 0.1111 0.1871 0.2212 0.7908 ASS3 0.2689 0.2355 0.1455 0.2415 0.2330 0.7609 ASS4 0.3147 0.3957 0.2352 0.1456 0.2199 0.8121
Table 7. Correlation of the latent variable scores with the square root of AVE in the diagonal
Construct CUS REL EMP RESP TAN ASS CUS 0.8380 REL 0.4123 0.8307 EMP 0.5144 0.5514 0.8609 RESP 0.2314 0.3632 0.2211 0.8173 TAN 0.5578 0.2228 0.3396 0.5843 0.7444 ASS 0.6154 0.1478 0.4741 0.3594 0.4146 0.8316

Fig. 8. Path
Table 8. Structural model estimates
Original Sample REL -> CUS 0.210 EMP -> CUS 0.025 RESP -> CUS 0.418 TAN -> CUS 0.211 ASS -> CUS 0.438
4.5 Structural Model Results Table 8 revealed the results from the Structural Model that showed the contribution of independent latent variables on the dependent latent variable. In particular, the resultsthat the reliability of IBEDC had no significant effect on customer satisfaction as demoby the p-value (0.210, p > 0.9425). Therefore, the null hypothesis one was accepted. Empathy of IBEDC had no significant effect on customer satisfaction as demonstrated by the p(0.025, p > 0.3315). Therefore, the null
Olayinka et al.; AJEBA, 8(4): 1-18, 2018; Article no.
13
Fig. 8. Path diagram of PLS estimations
Table 8. Structural model estimates
Original Sample Standard Error T Statistics 0.0311 1.1421 0.0541 1.1512 0.0112 1.0021 0.0547 0.5412 0.0314 0.9514
from the Structural contribution of the
latent variables on the dependent the results showed
that the reliability of IBEDC had no significant effect on customer satisfaction as demonstrated
value (0.210, p > 0.9425). Therefore, the null hypothesis one was accepted. Empathy of IBEDC had no significant effect on customer satisfaction as demonstrated by the p-value (0.025, p > 0.3315). Therefore, the null
hypothesis two was accepted. Responsiveness of IBEDC had no significant effect on customer satisfaction as demonstrated by the p(0.418, p > 0.6847). Therefore, the null hypothesis three was accepted. Tangibles of IBEDC had no significant effect on customer satisfaction as demonstrated by the p(0.211, p > 0.5742). Therefore, the null hypothesis four were accepted. Lastly, assurance of IBEDC had no significant effect on customer satisfaction as demonstrated by the pvalue (0.438, p > 0.5879). Therefore, the null hypothesis two was accepted. Overall, the study
; Article no.AJEBA.44493
p-value 0.9425 0.3315 0.6847 0.5472 0.5879
epted. Responsiveness of IBEDC had no significant effect on customer satisfaction as demonstrated by the p-value (0.418, p > 0.6847). Therefore, the null hypothesis three was accepted. Tangibles of IBEDC had no significant effect on customer
s demonstrated by the p-value (0.211, p > 0.5742). Therefore, the null hypothesis four were accepted. Lastly, assurance of IBEDC had no significant effect on customer satisfaction as demonstrated by the p-value (0.438, p > 0.5879). Therefore, the null
thesis two was accepted. Overall, the study
Olayinka et al.; AJEBA, 8(4): 1-18, 2018; Article no.AJEBA.44493
14
revealed that service quality does not have any significant effect on customer satisfaction in IBEDC, Olumo hub, Ogun State.
5. CONCLUSION AND RECOMMENDA-TION
The broad objective of this study was to examine the effect of service quality on customer satisfaction at IBEDC since service quality has been an issue of major concern with its long-lasting impacts on customer satisfaction. The study has been successful in accomplishing its five research objectives and has been able to make contributions to the literature. Thus, based on the finding of the study the following conclusions were drawn: First, on the part of the descriptive statistics findings, the study was able to present the opinion of customers with regard to IBEDC quality of service wherein the customers expressed that IBEDC services were not reliable. They expressed that IBEDC’s provision of individualised attention to customers by its staff was very low. They also expressed that IBEDC’s willingness or readiness of its staff to provide service to customers was very low. In addition, they expressed that IBEDC's physical facilities, the appearance of personnel and materials associated with the services they provide were not appealing. They expressed that IBEDC’s staff’s knowledge, courtesy and their ability to convey trust and confidence to customers was very low. Lastly, customers express a low level of satisfaction with IBEDC services. Second, the study was able to analyse the variable (reliability, assurance, responsiveness, tangibles and empathy) influencing customer satisfaction. Thus, from the Partial Least Squares Structural Equation Modelling (SEM-PLS) analysis it was concluded that all the five dimensions of SERVQUAL had no significant effect on customer satisfaction. Based on the findings from the study we, therefore, concluded that service quality does not have a significant effect on customer satisfaction in IBEDC, Olumo business hub. It was recommended that IBEDC should work hard on improving electricity supply to customers in Ogun State. IBEDC should ensure that staff are knowledgeable of customers’ requests and problems. IBEDC staff should always listen to what the customer wants. IBEDC should encourage and welcome suggestions on
improving customer satisfaction. IBEDC should also fulfil promises made to customers by supplying them with transformers as well as prepaid meters to eliminate the distribution of estimated bills.
COMPETING INTERESTS
Authors have declared that no competing interests exist. The company name used for this research is commonly and predominantly selected in our area of research and country. There is absolutely no conflict of interest between the authors and the company because we do not intend to use this company as an avenue for any litigation but the advancement of knowledge. Also, the research was not funded by the company rather it was funded by the personal efforts of the authors.
REFERENCES
1. Omonfoman O. Electricity distribution companies: The challenges and way forward; 2016.
Available:http://www.opinion.premiumtimesng.com/2016/01/04/electricity-distribution-companies-the-challenges-and-way-forward-by-odion-omonfoman/
2. IBEDC. Company profile; 2018.
Available:http://www.ibedc.com/about.us/companyprofile
3. Ali F, Zhou Y, Hussain K, Kumat P, Neethiahnanthan N, Ragavan A. Quality assurance in education. Quality Assurance in Education. 2016;24(1):7-94.
4. Fotaki M. Why and how is compassion necessary to provide good quality healthcare? International Journal of Health Policy Management. 2015;4(44):199-201.
5. Agyapong GKQ. The effect of service quality on customer satisfaction in utility industry: A case of Vodafone. International Journal of Business and Management. 2011;6(5):203-210.
6. Brady MK, Cronin JJJ. Some new thoughts on conceptualizing perceived service quality: A hierarchical approach. Journal of Marketing. 2001;65:34-49.
7. Gronroos CA. Service quality model and its marketing implications. European Journal of Marketing. 1984;18(4):36-44.
8. Ismail A, Zaki HO, Rose IR. Interlinkages between service quality, customer

Olayinka et al.; AJEBA, 8(4): 1-18, 2018; Article no.AJEBA.44493
15
satisfaction and customer loyalty in Malaysia. A case study of Armed Forces Medical Organizations. Malaysian Journal of Society and Space. 2016;12(7):47-59.
9. Baldwin A, Sohal A. Service quality factors and outcomes in dental care. Managing Service Quality. 2003;13(3):207-216.
10. Parasuraman A, Berry LL, Zeithaml VA. SERVQUAL. Journal of Retailing. 1991;67(4):420-450.
11. Wan Edura WW, Jusoff HK. Service quality in health care setting. International Journal of Health Care Quality Assurance. 2009; 22(5):471-482.
12. Sriram S, Chintagunta PK, Machanda P. Service quality variability and termination behaviour. Management Science. 2015; 61(11):2739-2759.
13. Gronroos C. Service management: Customer management in service competi-tion. England: John Wiley & Sons Limited; 2007.
14. Kitapci O, Akdogan C, Dortyol T. The impact of service quality dimensions on patient satisfaction, repurchase intentions and word-of-mouth communication in the public healthcare industry. Procedia -Social and Behavioural Sciences. 2014; 148:161-169.
15. Cronin J, Taylor SA. Measuring service quality: A re-examination and extension. Journal of Marketing. 1992;56:55-68.
16. Jain SK, Gupta G. Measuring service quality: SERVQUAL vs. SERVPERF Scales. Vikalpa. 2004;29(2):25-37.
17. Aaker DA, Jacobson R. The financial information content of perceived quality. Journal of Marketing Research. 1994; 31(2):191-201.
18. Gilbert GR, Veloutsou C. A cross-industry comparison of customer satisfaction. The Journal of Services Marketing. 2006;20(5): 298-308.
19. Lee S, Kim Y, Hemminglon N, Yun D. Competitive service quality improvement (CSQI): A case study in the fast food industry. Food Service Technology. 2004; 4:75-84.
20. Zeithaml VA, Bitner MJ. Services marketing: Integrating customer focus across the firm (3
rd ed.). Boston, New York:
McGraw-Hill; 2003.
21. Curry J, Curry A. The consumer marketing method. New York: Free Press; 2000.
22. Kotler P, Armstrong G, Saunders J, Wong V. Principle of Marketing 3rd edition. Prentice Hall: Europe; 2002.
23. Kotler P, Keller KL. Marketing management (13
th ed.). New Jersey:
Pearson Education Inc., Upper Saddle River; 2009.
24. Ojo O. The relationship between service quality and customer satisfaction in the telecommunication industry: Evidence from Nigeria. BRAND. Broad Research in Accounting, Negotiation, and Distribution. 2010;1(1):88-100.
25. Ogunnaike O. Assessing the relationship between service quality and customer satisfaction: Evidence from Nigerian banking industry. Global Journal of Management and Business Research. 2010;10(3):2-5.
26. Alabar TT, Egena O, Gbande RI. Service quality and customer satisfaction in Nigerian mobile telephony. 3
rd International
Conference on Business, Management and Governance IPEDR. 2014;82:108-118.
27. Hung YH, Huang ML, Chen KS. Service quality evaluation by service quality per-formance matrix. Total quality Manage-ment & Business Excellence. 2003;14(1): 79-89.
28. Zahari W, Yusoff W, Ismail M. FM-SERVQUAL: A new approach of service quality measurement framework in local authorities. Journal of Corporate Real Estate. 2008;10(2):130-144.
29. Lewis BR. Quality in service sector – A review. International Journal of Brand Marketing. 1989;7(5):4-12.
30. Dotchin JA, Oakland JS. Total quality management in services. Part 1: understanding and classifying services. International Journal of Quality & Reliability Management. 1994;11(3):9-26.
31. Asubonteng P, McCleaty KJ, Swan JE. Servqual revisited: A critical review of service quality. Journal of Service Marketing. 1996;10(6):62-81.
32. Wisniewiski M, Donnelly M. Measuring service quality in the public sector: The potential for SERVQUAL. Total Quality Management. 1996;7(4):357-365.
33. Seilier VL. Examining service quality for homebuyers in the residential real estate brokerage industry. PhD thesis, Sydney: University of Western Sydney; 2004.
Olayinka et al.; AJEBA, 8(4): 1-18, 2018; Article no.AJEBA.44493
16
34. Leonard FS, Sasser WE. The incline of quality. Harvard Business Review. 1982; 60(5):163-171.
35. Gammie A. Stop at nothing in the search for quality. Human Resource, 5 (Spring). 1992;35-38.
36. Hallowell R. The relationships of customer satisfaction, customer loyalty and profitabi-lity: An empirical study. International Journal of Service Industry Management. 1996;7(4):27-42.
37. Chang TZ, Chen SJ. Market orientation, service quality and business profitability: A conceptual model and empirical evidence. Journal of Service Marketing. 1998;12(4): 246-264.
38. Gummesson E. Productivity, quality and relationship marketing in service operations. International Journal of Contemporary Hospitality Management. 1998;10(1):4-15.
39. Lasser WM, Manolis C, Winsor RD. Service quality perspectives and sati-sfaction in private banking. Journal of Service Marketing. 2000;14(3):244-271.
40. Newman K. Interrogating SERVQUAL: A critical assessment of service quality measurement in a high street retail bank. International Journal of Bank Marketing. 2001;19(3):126-139.
41. Sureshchandar GS, Rajendran C, Anantharaman RN. The relationship between service quality and customer satisfaction – a factor specific approach. Journal of Service Marketing. 2002;16(4): 363-379.
42. Seth N, Deshmukh SG. Service quality models: A review. International Journal of Quality & Reliability Management. 2005; 22(9):913-949.
43. Brown SW, Bitner MJ. Mandating a service revolution for marketing. In Lush RF, Vargo SL. (Eds). The service-dominant logic of marketing: Dialog, debate and directions. Armonk, NY: M.E. Sharp. 2007;393-405.
44. Fitzsimmons JA, Fitzsimmons MJ. Service Management: Operations, strategy, and information technology, 3rd edition. Irwin McGraw-Hill, New York, New York; 2001.
45. Gronroos C. strategic management and marketing in the service sector, Helsinki, Finland. Swedish School of Economics and Business Administration; 1982.
46. Parasuraman A, Zeithaml VA, Berry LL. SERVQUAL: A multiple-item scale for measuring consumer perceptions of service quality. Journal of Retailing. 1988;64:12-40.
47. Rust RT, Oliver RL. Service quality: Insights and managerial implications from the frontier. In Rust RT, Oliver RL. (Eds.), Service quality new directions in theory and practice. Sage Publications, London. 1994;1-20.
48. Dabholkar PA, Thorpe DI. Does customer satisfaction predict shopper intentions? Journal of Consumer Satisfaction, Dissatis-faction and Complaining Behaviour. 1994; 7:161-71.
49. Oliver RL. Satisfaction: A behavioural 45 perspective on the consumer. Singapore McGraw-Hill Companies Inc.; 1997.
50. Levesque T, McDougall GHG. Deter-minants of customer satisfaction in retail banking. International Journal of Bank Marketing. 1996;14(7):12-20.
51. Zineldin M. Total relationship management (TRM) and total quality management (TQM). Managerial Auditing Journal. 2000;15(1-2):20-28.
52. Heskett JL, Jones TO, Loveman GW, Sasser WE. Jr, Schlesinger LA. Putting the service profit chain to work. Harvard Business Review. 1994;105-111.
53. Strauss B, Chojnacki K, Decker A, Hoffman F. Retention effects of a customer club. International Journal of Service Industry Management. 2001;12(1): 7-19.
54. Zairi M. Managing customer satisfaction: a best practice perspective. The TQM Magazine. 2000;12(6):389-94.
55. Boshoff C, Tait M. Quality perceptions in the financial services sector: The potential impact of internal marketing. International Journal of Service Industry Management. 1996;7(5):5-31.
56. Chow CW, Harrison GL, McKinnon JL, Wu A. The organizational culture of public accounting firms: Evidence from Taiwanese local and US affiliated firms. Accounting, Organizations and Society. 2002;27(5):347-360.
57. Ferris GR, Arthur MM, Berkson HM, Kaplan DM, Harrell-Cook G, Frink DW. Towards a social context theory of the human resource management-organiza-

Olayinka et al.; AJEBA, 8(4): 1-18, 2018; Article no.AJEBA.44493
17
tional effectiveness relationship. Human Resource Management Review. 1998;8(3): 235-264.
58. Pratt J, Beaulieu P. Organizational culture in public accounting: Size, technology, rank and functional area. Accounting, Organizations and Society. 1992;17:667-89.
59. Schein E. Culture: The missing concept in organization studies. Administrative Science Quarterly. 1996;41(2):229-40.
60. Koberg CS, Chusmir LH. Organizational culture relationships with creativity and other job-related variables. Journal of Business Research. 1987;15(5):397-4409.
61. Gowing MK, Lindholm ML. Human resource management in the public sector. Human Resource Management. 2002; 41(3):283-295.
62. Gupta A, McDaniel JC, Herath SK. Quality management in service firms: Sustaining structures of total quality service. Managing Service Quality. 2005;15(4):389-402.
63. Zeithaml VA, Bitner MJ. Services marketing: Integrating customer focus across the firms. Boston: Tata-McGraw Hill; 2001.
64. Ranaweera C, Prabhu J. On the relative importance of customer satisfaction and trust as determinants of customer retention and positive word of mouth. Journal of Targeting, Measurement and Analysis for Marketing. 2003;12(1):82-98.
65. Shin D, Elliot KM. Measuring customers’ overall satisfaction: A multi-attributes assessment. Service Marketing Quarterly. 2001;22(1):3-19.
66. Cronin J, Brady MK, Hult GT. Assessing the effects of quality, value, and customer satisfaction on consumer behavioural intentions in service environments. Journal of Retailing. 2000;76(2):193-218.
67. Fornell C. A national customer satisfaction barometer: The Swedish experience. Journal of Marketing. 1992;56:6-21.
68. Halstead D, Page TJJR. The effects of satisfaction and complaining behaviour on consumers repurchase behaviour. Journal of Satisfaction, Dissatisfaction and Com-plaining Behaviour. 1992;5:1-11.
69. Blodgett JG, Wakefield KL, Barnes JH. The effects of customer service on
consumer complaining behaviour. Journal of Services Marketing. 1995;9(4):31-42.
70. Gummesson E. Relationship marketing: From 4Ps to 30Rs, Stockholm University, Stockholm; 1994.
71. Fornell C, Johnson MD, Anderson EW, Char J, Bryant BE. The American customer satisfaction index: Nature, pur-pose and findings. Journal of Marketing. 1996;60:7-18.
72. Spreng RA, Harrell GD, Mackoy RD. Service recovery: Impact on satisfaction and intentions. Journal of Service Marketing. 1995;9(1):15-23.
73. Anderson E, Fornell C, Lehmann DR. Customer satisfaction, market share, and profitability: Findings from Sweden. Journal of Marketing. 1994;58(1):53-66.
74. Brady MK, Cronin JJ, Brand RR. Performance-only measurement of service quality: A replication and extension. Journal of Business Research. 2002;55(1): 17-31.
75. Bitner MJ, Hubbert AR. Encounter satisfaction versus overall satisfaction versus quality. In Rust RT, Oliver RL. (Eds.), Service quality: New directions in theory and practice, Thousand Oaks: Sage Publications. 1994;72-94.
76. Yamane T. Statistics: An introductory analysis (2nd ed.). New York: Harper and Row; 1967.
77. Jabnoun N, Hassan Al-Tamimi HA. Measuring perceived service quality at UAE commercial banks. International Journal of Quality & Reliability Manage-ment. 2003;20(4):458–472.
78. Othman A, Owen L. The multi dimensionality of Carter Model to measure customer service quality (SQ) in Islamic banking industry: A study in Kuwait finance house. International Journal of Islamic Financial Services. 2001;3(4):1–12.
79. Othman A, Owen L. The multi-dimensionality of CARTER model to measure customer service quality in Islamic banking industry: A study in Kuwait Finance House. International Journal of Islamic Financial Services. 2002;3(1).
80. Wang MI, Shieh JC, Hsiao J. The relationship between service quality, customer satisfaction and customer loyalty: A study on the management consulting
Olayinka et al.; AJEBA, 8(4): 1-18, 2018; Article no.AJEBA.44493
18
industry. Journal of Information and Opti-mization Sciences. 2013;26(2):371-384.
81. Tull D, Hawkins D. Marketing research: Measurement and methods. New York; McGraw Hill; 1987.
82. Nunnally JC. Psychometric theory. New York: McGraw-Hill; 1967.
83. Abdi H. Partial least squares (PLS) regression. In Lewis Beck M, Bryman A, Futing T. (eds.) Encyclopaedia of social
sciences research methods. Thousand Oaks: CA, Sage; 2008.
84. Chin WW. Issues and opinion on structural equation modelling. MIS Quarterly. 1998;22(1):7-16.
85. Gafen D, Straub D. A practical guide to factorial validity using PLS-graph: Tutorial and annotated example. Communications of the Association for Information System. 2005;16(1):91-109.
_________________________________________________________________________________ © 2018 Olayinka et al.; This is an Open Access article distributed under the terms of the Creative Commons Attribution License (http://creativecommons.org/licenses/by/4.0), which permits unrestricted use, distribution, and reproduction in any medium, provided the original work is properly cited.
Peer-review history: The peer review history for this paper can be accessed here:
http://www.sciencedomain.org/review-history/27175