services and health for elderly in long term care and health for elderly in long term care 2010 3...
TRANSCRIPT

Services and Health for Elderly in Long TERm Care Baseline report SHELTER is funded by the European Commission, aiming to validate inter-RAI LTCF as the standard measure for different nursing home populations across European health systems. Baseline assessments in the UK took place between Dec ember2009 and February 2010 in nine BUPA homes.
2010
Dr. Yachien Huang and Professor Iain Carpenter Centre for Health Services Studies
University of Kent 6/7/2010

Services and Health for Elderly in Long TERm Care 2010
2

Services and Health for Elderly in Long TERm Care 2010
3
Table of Contents About the project ............................................................................................................................... 4
1. Demography ................................................................................................................................ 5
1.1 Gender .......................................................................................................................................... 5
1.2 Age ................................................................................................................................................ 5
1.3 Length of stay ............................................................................................................................... 6
1.4 Sources of admission .................................................................................................................... 7
2. Cognitive function (CPS) across homes .......................................................................................... 9
3. Activity of Daily Living Hierarchy (ADLH) scale across homes ...................................................... 11
4. Depression Scale (DRS) score across homes ................................................................................ 13
5. Pain scores across homes ............................................................................................................. 15
6. Clinical Assessment Protocols (CAPs) ........................................................................................... 16
6.1 Behavior Cap ........................................................................................................................... 16
6.2 Bladder Cap ............................................................................................................................ 16
6.3 Bowel Cap ............................................................................................................................... 16
6.4 Communication Cap .............................................................................................................. 17
6.5 Dehydration Cap .................................................................................................................... 17
6.6 Delirium Cap .......................................................................................................................... 17
6.7 Depression CAP ...................................................................................................................... 17
6.8 Drinking Cap .......................................................................................................................... 17
6.9 Fall Cap .................................................................................................................................. 18
6.10 Feeding tube Cap .................................................................................................................. 18
6.11 Nutrition Cap ........................................................................................................................ 18
6.12 Oral Health Cap .................................................................................................................... 18
6.13 Pain Cap ................................................................................................................................ 19
6.14 Pressure ulcer Cap ................................................................................................................ 19
6.15 Smoking Cap ......................................................................................................................... 19
6.16 Vision Cap ............................................................................................................................. 19
Services and Health for Elderly in Long TERm Care 2010
4
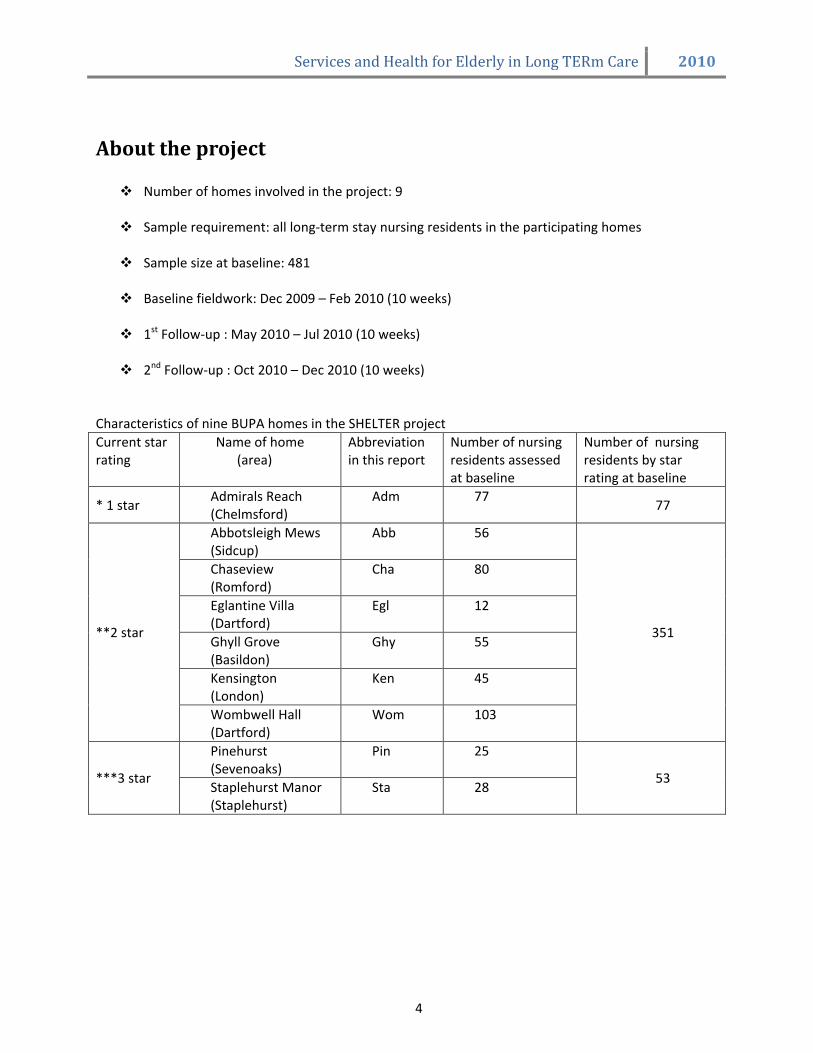
About the project Number of homes involved in the project: 9
Sample requirement: all long-term stay nursing residents in the participating homes
Sample size at baseline: 481
Baseline fieldwork: Dec 2009 – Feb 2010 (10 weeks)
1st Follow-up : May 2010 – Jul 2010 (10 weeks)
2nd Follow-up : Oct 2010 – Dec 2010 (10 weeks)
Characteristics of nine BUPA homes in the SHELTER project
Current star rating
Name of home (area)
Abbreviation in this report
Number of nursing residents assessed at baseline
Number of nursing residents by star rating at baseline
* 1 star Admirals Reach (Chelmsford)
Adm 77 77
**2 star
Abbotsleigh Mews (Sidcup)
Abb 56
351
Chaseview (Romford)
Cha 80
Eglantine Villa (Dartford)
Egl 12
Ghyll Grove (Basildon)
Ghy 55
Kensington (London)
Ken 45
Wombwell Hall (Dartford)
Wom 103
***3 star
Pinehurst (Sevenoaks)
Pin 25
53 Staplehurst Manor (Staplehurst)
Sta 28

Services and Health for Elderly in Long TERm Care 2010
5
1. Demography
1.1 Gender
At baseline, 72% of the residents in the project are female. Female population is 2.5 times of the male population.
Kensington in London has the highest proportion of male population (35.6%). Graph 1.1.1 Gender distribution overall (%)
Graph 1.1.2 Gender distribution across homes
1.2 Age The oldest resident in the project is/was
105 years old at baseline. The youngest is/was only 46 years old.
Average age of residents in the project at
baseline is 84.2 (yrs old); median age is 85.1 (yrs old).
‘80-90 years old’ is the largest age group
at baseline (43.2%). About 70% of the residents are above 80
years old. Only about 7% are younger than 70 years old.
Graph 1.2.1 Age distribution of all residents (%)
1.95
23.3
43.2
26.6
0
5
10
1520
25
3035
40
45
%
below
60
60 - 70 70 - 80 80 - 90 above
90
Age category
Age distribution of all residents

Services and Health for Elderly in Long TERm Care 2010
6
Mean age of residents are similar across
homes. Pinehurst and Staplehurst nursing homes,
the lifestyle homes in the project, have the highest mean age and also a higher proportion of ‘90 yrd plus’ residents .
Table 1.2.2 Mean age across homes
Min Max Mean Std. deviation
Abb 46 102 85.72 9.093
Cha 52 104 85.08 10.992
Egl 70 99 84.19 9.273
Ghy 60 96 82.91 7.863
Pin 66 105 89.28 8.414
Sta 56 100 87.04 10.402
Ken 65 105 84.76 9.477
Adm 59 101 85.44 8.205
Wom 50 97 81.19 9.863
1.3 Length of stay
Average length of stay of all residents at baseline was two years and five months (29.2 months). However this figure is likely to be distorted by residents who had stayed for a very long time. Therefore, it’s better to look at the median length of stay, which was 1.5 years (18.6 months).
More than 70% of the residents assessed
at baseline had not been in the home for more than three years.
37% of the residents assessed at baseline
were admitted in the last 12 months.
Graph 1.3.1 Length of stay in all residents (%)
Distribution of different length of stay
37 34.1
15.4 13.5
0
5
10
15
20
25
30
35
40
less than 12
mths
12 to 36
mths
36 to 60
mths
more than
60 mths
length of stay
%
Table 1.3.1 Mean length of stay across homes
% admitted in last 12 months
Max (mths)
Mean (mths)
Median (mths)
Abb 19.6 106 31.7 20.1
Cha 48.8 88.6 24.2 14.5
Egl 36.4 108 34.4 25.6
Ghy 45.5 142 27.7 14.1
Pin 40 146 24.1 12.1
Sta 25 118 29.7 22.0
Ken 44.4 175 32.0 18.5
Adm 29.9 160 34.2 18.1
Wom 37.5 134 28.4 19.5
Five nursing homes in this project have
residents whose length of stay exceeds 10 years.
Eglantine Villa has the longest mean
length of stay and median length of stay.
Chaseview and Ghyll Grove have the highest proportion of residents admitted in the last 12 months, at 48.8% and 45.5% respectively.

Services and Health for Elderly in Long TERm Care 2010
7
1.4 Sources of admission Graph 1.4.1 Admission sources of all residents (%)
Acute hospital, private homes,
residential homes, and other nursing homes are the four main sources for resident admission. All four sources combined made up 93% of the total admission.
About half of the residents (52.2%) were admitted from acute hospital, about a quarter (23.3%) came from private homes, another 9.6% came from residential homes, and another 7.7% from other nursing homes.
Table 1.4.1 Admission sources overall and by star rating (%)
%
ALL
* ** ***
Private home
23.3 23.4 19.7 47.2
Residential
home
9.6 13.0 10.3 0
Other nursing
home
7.7 7.8 7.4 9.4
Acute
hospital
52.2 32.5 58.4 39.6
Other
7.2 23.3 4.2 3.8
Total
100.0 100.0 100.0 100.0
Graph 1.4.2 Admission sources overall and by star rating (%)
Distribution of admission source
52.2
32.5
58.4
39.6
23.3
23.4
19.747.2
7.7
7.8
7.4
9.49.6
13
10.30
0%
20%
40%
60%
80%
100%
All 1 star 2 star 3 star
Others
Residential home
Other nursing
home
Private home
Acute hospital

Services and Health for Elderly in Long TERm Care 2010
8
Ghyll Grove and Wombwell have the
largest proportion of admissions from acute hospitals (at 76.4% and 74.8% respectively), and the lowest admissions from private homes. About three quarters of residents in Ghyll Grove and Wombwell were admitted from the acute hospital.
Pinehurst, Staplehurst and Kensington
have a much higher percentages of residents coming from private homes compared to other homes.
Table 1.4.2 Type of admission source across homes (%)
% Private homes
Acute hospital
Other sources
Abb 17.9 44.6 37.5
Cha 16.3 53.8 29.9
Egl 25.0 25.0 50.0
Ghy 12.7 76.4 10.9
Pin 52.2 40.0 7.8
Sta 42.9 39.3 17.8
Ken 51.1 33.3 15.6
Adm 23.4 32.5 44.1
Wom 12.6 74.8 12.6

Services and Health for Elderly in Long TERm Care 2010
9
2. Cognitive function across homes
Table 2.1 Residents distribution in different CPS categories (%)
Graph 2.1 Distribution of CPS in homes by star rating (%)
The Cognitive Performance Scale (CPS) combines information on memory impairment, level of consciousness, and executive function, with scores ranging from 0 (intact) to 6 (very severe impairment).
Score of 2 and more suggests dementia or dementia in development.
In the SHELTER project, the population
in three star-homes appeared less cognitively dependent than homes of lower star rating. Almost half of the residents (50.9%) in three-star homes are cognitively intact or borderline intact, compared to just above one third (36.5%) in two-star homes and fewer than one-fifth (18.2%) in the one-star home.
Residents in two-star homes are almost evenly distributed in each cognitive ability categories.
One-star home has a very cognitive dependent population, with more than one third of residents (36.4 %) assessed to be severe or very severely impaired.
Staplehurst, Pinehurst and Kensington have less cognitive dependent population compared to others.
CPS score All n=481
* n=77
** n=351
*** n=53
0-1 Intact and borderline intact
%
35.1 18.2 36.5 50.9
2-4 Mild to moderate severe impairment %
35.3 45.5 33.0 35.8
5-6 Severe to very severe impairment %
29.5 36.4 30.5 13.2
Total
100.0 100.0 100.0 100.0
All n=481
* n=77
** n=351
*** n=53
Mean CPS
2.7 3.5 2.7 1.7
Median CPS 3.0 4.0 2.0
1.0

Services and Health for Elderly in Long TERm Care 2010
10
Table 2.2 Distribution of residents’ CPS across homes (%)
CPS score Abb (n=77)
Cha (n=80)
Egl (n=12)
Ghy (n=55)
Pin (n=25)
Sta (n=28)
Ken (n=45)
Adm (n=77)
Wom (n=103)
0-1 (No dementia) %
21.4 30.0 18.2 45.5 48.0 53.6 44.4 18.2 43.3
2 and above (dementia present) %
78.6 70.0 81.8 54.5 52.0 46.4 55.6 81.8 56.7
Total 100.0 100.0 100.0 100.0 100.0 100.0 100.0 100.0 100.0
Abb (n=77)
Cha (n=80)
Egl (n=12)
Ghy (n=55)
Pin (n=25)
Sta (n=28)
Ken (n=45)
Adm (n=77)
Wom (n=103)
Mean CPS
3.3 3.0 4.1 2.2 1.8 1.6 1.9 3.5 2.6
Median CPS 3.0 3.0 5.0 2.0 2.0 1.0 2.0 4.0 2.0 Interquartile range
3.0 4.0 4.0 5.0 3.0 2.0 2.0 3.0 5.0
Graph 2.2 shows that the population in Admirals Reach is significantly more cognitively
dependent than the population in Kensington, Staplehurst, Pinehurst, Ghyll Grove and Wombwell.
Graph 2.2 Mean CPS across homes error bars chart

Services and Health for Elderly in Long TERm Care 2010
11
3. Activity of Daily Living Hierarchy (ADLH) across homes Table 3.1 Distribution of ADLH overall and by star rating (%)
ADLH score
All n=481
* n=77
** n=351
*** n=53
0 6.9 2.6 6.3 17.0
1 2.5 1.3 2.8 1.9
2 5.0 9.1 4.6 1.9
3 11.3 24.7 8.9 7.5
4 9.6 3.9 10.0 15.1
5 42.3 35.1 43.9 41.5
6 22.3 23.4 23.4 15.1
Total 99.8 100.0 99.7 100.0
The ADLH Scale scores are as follows: 0 Independent, no impairment 1 Supervision 2 Limited 3 Extensive 1 4 Extensive 2 5 Dependent 6 Total dependence
Dependency appears high across homes. In
total, 64.6% residents scored 5 (dependent) and 6 (total dependent).
Mean ADLH score for all residents is 4.3, between ‘extensive 2’ and ‘dependent’. The median ADLH is 5.0 (dependent).
Median ADLH scores are 5 across homes of
different star rating, although three-star homes as a whole has a higher proportion of ADLH independent residents compared to other homes. 17% of its residents scored 0. This is 2.6 times of the two-star homes and 6.5 times of the one-star homes.
Abbotsleigh Mews, Eglantine Villa have the most physically dependent residents.
Kensington has a significantly less physically
dependent population than other two-star and one-star homes in the project.
Graph 3.1 Distribution of ADLH overall and by star rating (%)
Table 3.2 ADLH score comparison by star rating
All n=481
* n=77
** n=351
*** n=53
Mean ADLH score
4.3 4.2 4.4 3.8
Median ADLH score
5.0 5.0 5.0 5.0
Interquartile range
2 2 1 2

Services and Health for Elderly in Long TERm Care 2010
12
Graph 3.3 Distribution of ADLH score across homes (%)
Table 3.3 Mean ADLH across homes
Abb
(n=77) Cha
(n=80) Egl
(n=12) Ghy
(n=55) Pin
(n=25) Sta
(n=28) Ken
(n=45) Adm
(n=77) Wom
(n=103)
Mean ADLH 4.7 4.2 4.9 4.6 3.9 3.7 3.1 4.2 4.6
Median ADLH
5.0 5.0 5.0 5.0 5.0 5.0 3.0 5.0 5.0
Interquartile range
0 2 2 2 2 3 4 2 2
Graph 3.4 Mean ADLH across homes error bar chart

Services and Health for Elderly in Long TERm Care 2010
13
4. Depression across homes Depression Scale (DRS) ranges from 0
to 14. Scores of 3 and more indicate that the resident may be depressed.
39.2% of all residents scored 0 in DRS,
meaning they have not displayed any signs of depression in the last 30 days.
At baseline, about half of the residents
(51.1%) are not depressed and about one third of the residents (32.6%) may have depression according to DRS definition.
Depression scores are similar across
nine homes.
Mean DRS score for all residents is 2.1, and median DRS score is 1.0.
Table 4.1 Distribution of DRS in all residents
Graph 4.1 Distribution of DRS score in all residents (%)
Graph 4.2 Distribution of DRS score in all residents (%)
DRS score ALL (n=481)
0 Not depressed
39.2%
1 Not depressed
11.9%
2 Borderline
16.3%
3+
May have depression 32.6%
Total
99.8%
DRS score ALL (n=481)
Mean score
2.1
Median score
1.0
Interquartile range
3.0

Services and Health for Elderly in Long TERm Care 2010
14
Table 4.2 DRS score across homes
DRS Abb
(n=77) Cha
(n=80) Egl
(n=12) Ghy
(n=55) Pin
(n=25) Sta
(n=28) Ken
(n=45) Adm
(n=77) Wom
(n=103) Mean DRS
2.5 2.2 1.8 1.9 2.4 2.0 1.7 1.9 2.2
Median DRS
2.0 1.5 0 1.0 2.0 1.0 2.0 1.0 1.0
Interquartile Range
4.0 4.0 4.0 9.0 4.0 3.0 3.0 3.0 4.0
Mean DRS seems to bear a stronger correlation with resident’s ADLH score than their CPS score.
Residents who scored 4 and more on the ADLH appeared significantly more depressed than those ones who scored 0 and 1.
Graph 4.3 Distribution of mean DRS across CPS scale
Graph 4.4 Distribution of mean DRS across ADLH scale

Services and Health for Elderly in Long TERm Care 2010
15
5. Pain scores across homes Pain scale indicates pain frequency and
intensity. Score 2 or more suggests the need for pain relief or intervention.
At baseline, as high as 86.5% residents
feel no pain or less than daily pain. Mean pain score is 0.5 and median pain score is 0.
Wombwell and Admirals Reach have
the highest proportion of residents having reported no pain (score 0).
Mean pain score in most homes are
below 1.
Table 5.1 Distribution of pain scale score overall and by star rating (%)
ALL * ** *** 0 No pain 63.2 75.3 63.5 43.4
1 Less than daily pain
23.3 13.0 23.4 37.7
2 Mild or moderate pain
10.8 7.8 11.4 11.3
3-4 Severe pain
2.5 3.9 1.7 7.5
Total 100.0 100.0 100.0 100.0
ALL * ** *** Mean 0.5 0.4 0.5 0.8 Median 0 0 0 1
Table 5.2 Percentages of pain score 2 and more across homes (%)
Abb
(n=77) Cha
(n=80) Egl
(n=12) Ghy
(n=55) Pin
(n=25) Sta
(n=28) Ken
(n=45) Adm
(n=77) Wom
(n=103) Relief or intervention suggested
12.5 16.3 45.5 25.4 16.0 21.4 4.4 11.7 4.8
Table 5.3 Pain scores across homes Pain score
Abb (n=77)
Cha (n=80)
Egl (n=12)
Ghy (n=55)
Pin (n=25)
Sta (n=28)
Ken (n=45)
Adm (n=77)
Wom (n=103)
Mean 0.4 0.6 1.5 0.8 0.6 0.9 0.4 0.4 0.2
Median 0 0 1 0 1 1 0 0 0
Pain score appears higher among cognitively intact residents. This could be that feelings of pain and
ability to report pain are related to resident’s cognitive condition.
Graph 5.1 Distribution of pain scale score across CPS scale

Services and Health for Elderly in Long TERm Care 2010
16
6. Clinical Assessment Protocols (CAPs) Subsets of items in LTCF are selected to form ‘CAP triggers’ to identify persons who may benefit from care and support in each of the problem areas referenced by the CAPs. The CAP triggers seeks to identify two types of persons:
1) those who have a higher than expected likelihood of declining 2) those who have an increased likelihood of improving, including those declining due to a recent
acute problem and whose symptoms will have alleviated when the problem is addressed.
For those triggered, each CAP contains care guidelines (not included in this report) to help think through the relevant underlying issues and move towards a plan of care. Residents usually will trigger more than one CAP. Persons in North American nursing homes averaged 4 triggered CAPs and persons screened for admission to North American nursing homes average 7 triggered CAPs.
6.1 Behavior Cap
This cap identifies two types of residents for further review. The first type includes those who exhibit behavioral symptoms of wandering, being verbally abusive, being physically aggressive and/or exhibiting socially inappropriate behavioral symptoms. The second type includes those whose behavioral symptoms appear to have improved but this may be due to current treatment or intervention masking their symptoms.
6.2 Bladder Cap Studies in the UK show about 43% of residents in nursing homes are incontinent. Incontinence is curable in many older people but not all. A care plan is suggested if one of more of the following are present:
Incontinent twice or more a week
Use of external or indwelling catheter
Use of intermittent catheter
Use if pads/briefs
6.3 Bowel Cap This cap addresses three most common bowel conditions seen in older adults: constipation, diarrhea and fecal incontinence.
All (n=481)
Prevent decline
15.3%
Facilitate improvement
32.0%
All (n=481)
Triggered
21.3%
All (n=481)
Prevent decline 8.9%
Facilitate improvement
8.7%

Services and Health for Elderly in Long TERm Care 2010
17
6.4 Communication Cap Potential for improvement communication suggested if one or more of the following present:
Hearing problem
Problem making self understood
Problem understanding others
6.5 Dehydration Cap Dehydration cap is triggered by water or fluid loss (output) far exceeds fluid intake.
6.6 Delirium Cap
Delirium cap is triggered when a person’s behaviour in the following areas appears different from usual functioning either new onset or worsening or different from recent times: easily distracted, episodes of disorganized speech, mental function varies over the course of the day, acute change in mental status from person’s usual functioning.
6.7 Depression CAP Studies in the UK have shown that about 45% of residents in nursing and residential homes are classified as depressed.
6.8 Drinking Cap The CAP seeks to identify strategies for helping persons cut back on excessive drinking. Persons to whom
one or more of the following apply: Needs to cut back on drinking or has been told by others to cut down
on drinking Needs a drink first thing in the morning Has had five or more drinks at a single setting in the last 14 days
All (n=481)
Prevent decline 23.9%
Facilitate improvement
12.5%
All (n=481)
Triggered
9.9%
All (n=481)
Triggered
15.1%
All Opportunity for improvement
28.3%
High opportunity for improvement
32.2%
All (n=481)
Triggered
5.4%

Services and Health for Elderly in Long TERm Care 2010
18
6.9 Fall Cap
Potential for additional falls or risk of initial fall might be triggered by one or more of following:
Fell in last month/past 1-6 month
Wandering
Dizziness/vertigo
Use of trunk restraint
Use of anxiolytic drugs and/or antidepressant drugs
6.10 Feeding tube Cap
This CAP triggers persons with a feeding tube, addressing issues relative to the use of a feeding tube and its potential removal. All persons with a feeding tube will be triggered for review.
6.11 Nutrition Cap This cap is based on the person’s Body Mass Index (BMI) and relies on the correct information of weight and height. Medium risk includes people who have both baseline BMI score of 19-21 and have no clear indication that death is near. High risk includes person with both BMI score lower than 19 and who do not have a clear indication that death is clear.
6.12 Oral Health Cap Triggers of this cap include:
Mouth debris, less than daily cleaning of teeth/dentures
Mouth pain
Teeth loss and no dentures
Broken, loose or carious teeth
Inflamed gums and ulcers
All (n=481)
Medium risk
13.3%
High risk
1.2%
All (n=481)
Medium risk
1.8%
High risk
1.0%
All (n=481)
Medium risk
17.9%
High risk
29.4%
All (n=481)
Triggered
16.1%
Triggered, symptoms
27.2%

Services and Health for Elderly in Long TERm Care 2010
19
6.13 Pain Cap
6.14 Pressure ulcer Cap
Pressure sore present or there is a risk of occurrence if one or more of the following present:
Pressure sore present
Bed mobility problem
Bedfast
Bowel incontinence
Peripheral vascular disease
Previous pressure sore
Skin desensitized to pain or pressure
Daily trunk restraint
6.15 Smoking Cap
The CAP seeks to identify strategies for helping persons cease smoking. Persons who smoke daily would trigger this cap.
6.16 Vision Cap An acute, reversible visual function problem or the potential for visual improvement suggested if one or more of following present:
Side vision problem
Cataracts
Glaucoma
Vision impaired
All (n=481)
Medium improvement potential
16.1%
High improvement potential
3.8%
All (n=481)
Prevent decline 39.0%
Facilitate improvement 7.0%
All (n=481)
Triggered
3.2%
All (n=481)
Medium improvement potential
15.6%
High improvement potential
15.0%