environmentclearance.nic.inenvironmentclearance.nic.in/writereaddata/online/tor/23...2018-04-23consultancy...
TRANSCRIPT
Consultancy Services for preparation of DPR for development of Economic Corridors, Inter Corridors, Feeder Routes and National corridors (GQ and NS-EW Corridors) to improve the efficiency of freight movement in India under Bharatmala Pariyojana (Chennai-Salem Highway)
Feasibility Report Volume – I (Main Report)
Feedback Infra Pvt. Ltd. i National Highways Authority of India
TABLE OF CONTENTS
1. INTRODUCTION .................................................................................................................. 1-1
1.1 PROJECT BACKGROUND ............................................................................................................................ 1-1
1.2 SCOPE OF CONSULTANCY SERVICES ............................................................................................................. 1-2
1.3 SCHEDULE OF DELIVERABLES: ..................................................................................................................... 1-3
1.4 STRUCTURE OF THE REPORT (DRAFT FEASIBILITY REPORT): ............................................................................... 1-4
2. SITE OF THE PROJECT.......................................................................................................... 2-1
2.1. GENERAL ............................................................................................................................................... 2-1
2.2. DISTRICTS LINKED BY THE PROJECT ............................................................................................................... 2-2
2.3. VILLAGES FALLING ALONG THE EXPRESSWAY ALIGNMENT ................................................................................ 2-2
2.3.1 VILLAGES FALLING ALONG THE GREEN FIELD HIGHWAY ALIGNMENT .................................................................. 2-2
3. SOCIO-ECONOMIC PROFILE................................................................................................. 3-1
3.1 INTRODUCTION .................................................................................................................................. 3-1
3.2 BACKGROUND .................................................................................................................................... 3-1
Socio and Demographic Indicators .............................................................................................................. 3-1
Economic Indicators .................................................................................................................................... 3-2
3.3 PROJECT BACKGROUND ...................................................................................................................... 3-2
3.4 PROJECT LOCATION ............................................................................................................................ 3-3
3.5 SOCIAL AND DEMOGRAPHIC PROFILE OF TAMILNADU ....................................................................... 3-5
3.6 ECONOMIC PROFILE............................................................................................................................ 3-6
3.7 THE PROJECT DISTRICTS .................................................................................................................... 3-10
4. TRAFFIC STUDIES & FORECASTS .......................................................................................... 4-1
4.1 TRAFFIC SURVEYS AND ANALYSIS ................................................................................................................. 4-1
4.1.1 INTRODUCTION ....................................................................................................................................... 4-1
4.1.2 PROJECT DETAILS ..................................................................................................................................... 4-1
4.1.3 COMPETING ALTERNATE ROUTES ................................................................................................................. 4-2
4.1.4 SURVEY METHODOLOGY ........................................................................................................................... 4-4
4.1.4.1 Primary surveys and considerations .......................................................................................... 4-4
4.1.4.2 Classified traffic volume count ................................................................................................... 4-6
4.1.4.3 Origin-Destination survey .......................................................................................................... 4-7
4.1.4.4 Axle load survey ......................................................................................................................... 4-7
4.1.4.5 Speed and delay survey .............................................................................................................. 4-8
4.1.5 DATA ANALYSIS ....................................................................................................................................... 4-8
4.1.5.1 Traffic volume count .................................................................................................................. 4-8
4.1.5.2 Average daily traffic (ADT) ......................................................................................................... 4-9 4.1.5.2.1 Annual average daily traffic (AADT) .................................................................................................... 4-12
4.1.5.2.2 Composition of traffic .......................................................................................................................... 4-15
4.1.5.2.3 Hourly variation of traffic .................................................................................................................... 4-19
4.1.5.2.4 Daily variation of traffic volume .......................................................................................................... 4-20
4.1.5.2.5 Directional distribution of traffic ......................................................................................................... 4-21
Consultancy Services for preparation of DPR for development of Economic Corridors, Inter Corridors, Feeder Routes and National corridors (GQ and NS-EW Corridors) to improve the efficiency of freight movement in India under Bharatmala Pariyojana (Chennai-Salem Highway)
Feasibility Report Volume – I (Main Report)
Feedback Infra Pvt. Ltd. ii National Highways Authority of India
4.1.5.3 Origin – Destination Survey...................................................................................................... 4-22 4.1.5.3.1 Zoning system ...................................................................................................................................... 4-22
4.1.5.3.2 Expansion factors and development of O – D matrices ....................................................................... 4-24
4.1.5.3.3 Lead Distribution ................................................................................................................................. 4-24
4.1.5.3.4 Trip purpose ......................................................................................................................................... 4-27
4.1.5.3.5 Commodity groups and analysis .......................................................................................................... 4-27
4.1.5.4 Axle load survey ....................................................................................................................... 4-30 4.1.5.4.1 Calculation of VDF ............................................................................................................................... 4-30
4.1.5.4.2 Computation of Design Traffic ............................................................................................................. 4-31
4.1.5.5 Speed and delay survey ............................................................................................................ 4-32
4.2 TRAFFIC FORECASTS AND DEMAND ESTIMATES ............................................................................................. 4-33
4.2.1 TRAFFIC FORECASTING ............................................................................................................................ 4-33
4.2.1.1 PAST VEHICLE REGISTRATION DETAILS .................................................................................................... 4-33
4.2.1.2 PAST GROWTH OF THE ECONOMY ......................................................................................................... 4-34
4.2.1.3 TRANSPORT DEMAND ELASTICITY .......................................................................................................... 4-35
4.2.1.4 PERSPECTIVE GROWTH: STATE AND NATIONAL ECONOMIES ........................................................................ 4-37
4.2.1.5 PROJECTED TRAFFIC RATES .................................................................................................................. 4-38
4.2.1.5.1 Traffic forecast for non–motorised traffic ........................................................................... 4-39
4.2.2 TRAVEL DEMAND ESTIMATES ................................................................................................................... 4-39
4.2.2.1 TRAFFIC DEMAND ESTIMATION FOR PROPOSED PROJECT ROAD .................................................................... 4-39
4.2.2.2 SECTIONS ALONG PROJECT CORRIDOR .................................................................................................... 4-40
4.2.2.3 DIVERTED TRAFFIC ............................................................................................................................. 4-40
4.2.2.3.1 PROCEDURE FOR DIVERSION ANALYSIS ............................................................................................... 4-40
4.2.2.3.2 GENERALIZED COST ....................................................................................................................... 4-41
4.2.2.3.3 DIVERSION ANALYSIS ..................................................................................................................... 4-44
4.2.2.4 DEVELOPMENT TRAFFIC ...................................................................................................................... 4-44
4.2.2.5 GENERATED/ INDUCED TRAFFIC ........................................................................................................... 4-45
4.2.2.6 ESTIMATED TRAFFIC ON PROPOSED HIGHWAY ......................................................................................... 4-46
4.2.3 TOLL PLAZA .......................................................................................................................................... 4-50
4.2.3.1 LOCATION OF TOLL PLAZA .................................................................................................................... 4-50
4.2.4 CAPACITY ANALYSIS ............................................................................................................................... 4-50
4.2.3.2 Capacity augmentation proposals (lane requirement) ............................................................ 4-50
4.2.3.2.1 Projected traffic levels ......................................................................................................... 4-50
5. FINALIZATION OF ALIGNMENT OF THE PROPOSED HIGHWAY .............................................. 5-1
5.3 EXISTING TRAFFIC .................................................................................................................................... 5-1
5.4 PROJECT LOCATION .................................................................................................................................. 5-2
5.5 METHODOLOGY OF FINALIZATION OF ALIGNMENT .......................................................................................... 5-2
5.6 PACKAGING OF THE ALIGNMENT SELECTED .................................................................................................... 5-2
6. DESIGN STANDARD AND SPECIFICATION ............................................................................. 6-1
6.1 GENERAL ............................................................................................................................................... 6-1
6.2 DESIGN SPEED ........................................................................................................................................ 6-1
6.3 RIGHT OF WAY........................................................................................................................................ 6-1
Consultancy Services for preparation of DPR for development of Economic Corridors, Inter Corridors, Feeder Routes and National corridors (GQ and NS-EW Corridors) to improve the efficiency of freight movement in India under Bharatmala Pariyojana (Chennai-Salem Highway)
Feasibility Report Volume – I (Main Report)
Feedback Infra Pvt. Ltd. iii National Highways Authority of India
6.4 LANE WIDTH OF CARRIAGEWAY ................................................................................................................. 6-1
6.5 MEDIAN ................................................................................................................................................ 6-1
6.6 SHOULDERS ............................................................................................................................................ 6-2
6.7 CROSSFALL ............................................................................................................................................. 6-2
6.8 ACCELERATION/DECELERATION LANE .......................................................................................................... 6-2
6.9 DESIGN OF HORIZONTAL/VERTICAL ALIGNMENT ............................................................................................ 6-3
6.9.1 HORIZONTAL ALIGNMENT ......................................................................................................................... 6-3
6.9.2 VERTICAL ALIGNMENT .............................................................................................................................. 6-4
6.9.3 COORDINATION OF HORIZONTAL AND VERTICAL ALIGNMENT ............................................................................ 6-5
6.9.4 LATERAL AND VERTICAL CLEARANCE AT UNDERPASSES .................................................................................... 6-5
6.9.5 LATERAL AND VERTICAL CLEARANCE AT OVERPASSES ...................................................................................... 6-6
6.9.6 ACCESS CONTROL .................................................................................................................................... 6-6
6.9.7 INTERCHANGE ......................................................................................................................................... 6-6
6.9.8 CONNECTING ROADS ................................................................................................................................ 6-7
6.10 GEOMETRIC DESIGN ................................................................................................................................. 6-7
6.11 GRADE SEPARATED STRUCTURES ................................................................................................................ 6-7
6.11.1 VEHICULAR UNDERPASS/OVERPASS ........................................................................................................ 6-7
6.11.2 VEHICULAR UNDER PASS (GRADE-II) ....................................................................................................... 6-7
6.11.3 ROBS/RUBS ..................................................................................................................................... 6-8
6.11.4 TUNNELS ........................................................................................................................................... 6-8
6.12 MEDIAN OPENINGS ................................................................................................................................. 6-8
6.13 FENCING AND BOUNDARY STONES .............................................................................................................. 6-8
6.14 TYPICAL CROSS SECTIONS .......................................................................................................................... 6-8
6.15 CAPACITY OF EXPRESSWAY ........................................................................................................................ 6-8
6.16 SERVICE ROAD ........................................................................................................................................ 6-8
6.17 EMBANKMENT AND CUT SECTIONS ............................................................................................................. 6-8
6.18 PAVEMENT DESIGN .................................................................................................................................. 6-8
6.18.1 TYPE OF PAVEMENT ............................................................................................................................. 6-8
6.18.2 DESIGN OF FLEXIBLE PAVEMENT ............................................................................................................. 6-9
6.18.3 DESIGN OF PLAIN JOINTED RIGID PAVEMENT ............................................................................................ 6-9
6.18.4 DESIGN OF CONTINUOUSLY REINFORCED CONCRETE PAVEMENT .................................................................. 6-9
6.18.5 DESIGN OF COMPOSITE PAVEMENTS ....................................................................................................... 6-9
6.19 MATERIALS ............................................................................................................................................ 6-9
6.20 DRAINAGE DESIGN ................................................................................................................................... 6-9
6.21 TRAFFIC CONTROL DEVICES, ROAD SAFETY DEVICES AND ROAD SIDE FURNITURE ............................................... 6-10
6.22 TRAFFIC MANAGEMENT SYSTEMS ............................................................................................................. 6-10
6.23 TOLL PLAZAS ........................................................................................................................................ 6-10
6.24 PROJECT FACILITIES ................................................................................................................................ 6-11
6.25 DESIGN CRITERIA FOR STRUCTURES ........................................................................................................... 6-11
6.25.1 DEFINITION OF STRUCTURES ................................................................................................................ 6-11
6.25.2 DESIGN STANDARDS-STRUCTURES ........................................................................................................ 6-11
6.25.3 SPECIAL DESIGN REQUIREMENTS .......................................................................................................... 6-12
6.25.4 DESIGN BASIS ................................................................................................................................... 6-13
6.25.5 DESIGN LOAD AND STRESSES ............................................................................................................... 6-17
6.25.6 CULVERTS ........................................................................................................................................ 6-22

Consultancy Services for preparation of DPR for development of Economic Corridors, Inter Corridors, Feeder Routes and National corridors (GQ and NS-EW Corridors) to improve the efficiency of freight movement in India under Bharatmala Pariyojana (Chennai-Salem Highway)
Feasibility Report Volume – I (Main Report)
Feedback Infra Pvt. Ltd. iv National Highways Authority of India
6.26 HYDROLOGY AND FLOOD CONTROL ........................................................................................................... 6-22
7. PRELIMINARY DESIGNS ...................................................................................................... 7-1
7.1 TYPICAL CROSS SECTIONS ................................................................................................................... 7-1
7.2 SCHEME OF WIDENING ..................................................................................................................... 7-12
7.3 CURVE DETAILS ..................................................................................................................................... 7-18
7.4 INTERSECTION PROPOSALS .............................................................................................................. 7-19
7.4.1 Grade Separated Intersections ..................................................................................................... 7-19
7.4.2 At Grade Intersections .................................................................................................................. 7-21
7.5 MATERIAL INVESTIGATION ....................................................................................................................... 7-22
7.5.1 Characterization of Sub-grade ..................................................................................................... 7-22
7.5.2 SUBGRADE INVESTIGATIONS ........................................................................................................ 7-23 7.5.2.1 Methodology (Test Pits) ...................................................................................................................... 7-23
7.5.2.2 Large Pits (1.0 m X 1.0 m) .................................................................................................................... 7-23
7.5.3 Material for Embankment and Subgrade ..................................................................................... 7-23
7.5.4 Stone Aggregates ......................................................................................................................... 7-24
7.6 PAVEMENT DESIGN ................................................................................................................................ 7-26
7.6.1 GENERAL ........................................................................................................................................... 7-26
7.7 DESIGN CONSIDERATION FOR FLEXIBLE PAVEMENT ........................................................................ 7-26
7.7.1 Design Life .................................................................................................................................... 7-26
7.7.2 VDF ............................................................................................................................................... 7-26
7.7.3 Traffic Growth Rates .................................................................................................................... 7-27
7.7.4 Design Loading ............................................................................................................................. 7-27
7.7.5 Homogeneous Sections for Pavement Design .............................................................................. 7-28
7.7.6 Flexible Pavement Design ............................................................................................................. 7-28
Crust Designs ............................................................................................................................................. 7-29
7.7.7 Overlay Design for existing pavement .......................................................................................... 7-33
7.7.8 Rigid Pavement Design ................................................................................................................. 7-34
7.10 PROPOSALS FOR STRUCTURES .......................................................................................................... 7-47
7.10.1 MAJOR BRIDGES ....................................................................................................................... 7-50
7.10.2 Major bridge Cum Flyover - New construction ........................................................................ 7-53
7.10.3 Major bridge Cum ROB - New construction ............................................................................. 7-53
7.10.4 ROB Cum MJB Cum Flyover Cum Interchange - New construction .......................................... 7-54
7.10.5 Major bridge – Existing Retained+New construction ............................................................... 7-55
7.10.6 Minor Bridges ........................................................................................................................... 7-56
7.10.7 ROB – New Construction .......................................................................................................... 7-76
7.10.8 Tunnels– New Construction ..................................................................................................... 7-77
Note: .......................................................................................................................................................... 7-77
7.10.9 Culverts .................................................................................................................................... 7-78
7.10.10 Grade Separator ....................................................................................................................... 7-79
8. PROJECT FACILITIES ............................................................................................................ 8-1
8.1 GENERAL ............................................................................................................................................... 8-1
8.2 SERVICE AREA ......................................................................................................................................... 8-1
8.3 LAYBYES ................................................................................................................................................. 8-2
Consultancy Services for preparation of DPR for development of Economic Corridors, Inter Corridors, Feeder Routes and National corridors (GQ and NS-EW Corridors) to improve the efficiency of freight movement in India under Bharatmala Pariyojana (Chennai-Salem Highway)
Feasibility Report Volume – I (Main Report)
Feedback Infra Pvt. Ltd. v National Highways Authority of India
8.4 TOLL PLAZAS .......................................................................................................................................... 8-2
8.5 ROAD MARKINGS .................................................................................................................................... 8-3
8.6 ROAD SIGNS ........................................................................................................................................... 8-3
8.7 KILOMETRE STONES ................................................................................................................................. 8-3
8.8 200 M STONES AND BOUNDARY STONES ..................................................................................................... 8-3
8.9 DELINEATORS AND OBJECT MARKERS .......................................................................................................... 8-3
8.10 GUARD POST .......................................................................................................................................... 8-3
8.11 CRASH BARRIER ....................................................................................................................................... 8-4
9. COST ESTIMATE ................................................................................................................. 9-1
9.1 INTRODUCTION AND ASSUMPTIONS .................................................................................................. 9-1
9.2 ADOPTION OF UNIT RATES .................................................................................................................. 9-1
9.3 BILL OF QUANTITIES FOR CIVIL WORKS ............................................................................................... 9-1
9.4 COSTING FOR SAFETY DEVICES ........................................................................................................... 9-1
9.5 LAND ACQUISITION COST ................................................................................................................... 9-1
9.6 COST OF R & R ..................................................................................................................................... 9-1
9.7 COST OF ENVIRONMENTAL MITIGATION PLAN .................................................................................. 9-2
9.8 ANY OTHER ASSOCIATED COST ........................................................................................................... 9-2
9.9 TOTAL COST ESTIMATES ..................................................................................................................... 9-2
9.10 COMPARISON OF COST WITH SIMILAR PROJECTS IN THE REGION ...................................................... 9-4
10. ENVIRONMENTAL SCREENING AND PRELIMINARY ENVIRONMENTAL ASSESSMENT ............10-1
10.1 INTRODUCTION ..................................................................................................................................... 10-1
10.2 STUDY AREA ......................................................................................................................................... 10-1
10.3 SCOPE OF PRELIMINARY ENVIRONMENTAL ASSESSMENT................................................................................ 10-1
10.4 METHODOLOGY .................................................................................................................................... 10-1
10.5 ONSITE STUDY ...................................................................................................................................... 10-2
10.6 LEGISLATIVE FRAMEWORK ....................................................................................................................... 10-2
10.7 BASELINE ENVIRONMENT SCENARIO .......................................................................................................... 10-6
10.7.1 Project Districts ........................................................................................................................ 10-6
10.7.2 Climate and Meteorology ........................................................................................................ 10-6
10.7.3 Terrain and Land use ................................................................................................................ 10-9
10.7.4 Seismicity ................................................................................................................................. 10-9
10.7.5 Geology and Soil ...................................................................................................................... 10-9
10.7.6 Ambient Air Quality................................................................................................................ 10-10
10.7.7 Noise ...................................................................................................................................... 10-10
10.7.8 Water Environment ................................................................................................................ 10-10 10.7.8.1 Hydrogeology .................................................................................................................................... 10-10
10.7.9 Surface water / Ground Water Scenario ................................................................................ 10-10 10.7.9.1 Surface Water .................................................................................................................................... 10-10
10.7.9.2 Ground Water.................................................................................................................................... 10-10
10.7.10 Biological Environment .......................................................................................................... 10-10 10.7.10.1 Protected Areas ............................................................................................................................ 10-10
10.7.10.2 Forest ............................................................................................................................................ 10-11

Consultancy Services for preparation of DPR for development of Economic Corridors, Inter Corridors, Feeder Routes and National corridors (GQ and NS-EW Corridors) to improve the efficiency of freight movement in India under Bharatmala Pariyojana (Chennai-Salem Highway)
Feasibility Report Volume – I (Main Report)
Feedback Infra Pvt. Ltd. vi National Highways Authority of India
10.7.10.3 Flora & Fauna................................................................................................................................ 10-11
10.8 STAKEHOLDER CONSULTATION ............................................................................................................... 10-13
10.9 POTENTIAL ENVIRONMENTAL IMPACTS .................................................................................................... 10-13
10.10 ENVIRONMENTAL BUDGET ................................................................................................................ 10-16
11. INITIAL SOCIAL IMPACT ASSESSMENT ................................................................................11-1
11.1 PROJECT BACKGROUND .................................................................................................................... 11-1
11.2 PROJECT LOCATION .......................................................................................................................... 11-2
11.3 THE STATE OF TAMILNADU ............................................................................................................... 11-4
11.3.1 The District ............................................................................................................................... 11-5
11.4 SCOPE OF THE PROJECT ......................................................................................................................... 11-11
11.5 PROJECT APPRECIATION ................................................................................................................. 11-13
11.5.1 Road Alignment ..................................................................................................................... 11-13
11.6 SITE APPRECIATION AND RECONNAISSANCE DETAILS .................................................................... 11-15
11.7 GENDER AND DEVELOPMENT ......................................................................................................... 11-17
11.8 METHODOLOGY .............................................................................................................................. 11-17
11.8.1 Collection of Data from Secondary Sources .......................................................................... 11-18
11.8.2 Reconnaissance Survey of the Project Impact Zone .............................................................. 11-18
11.8.3 Analysis of Data and Screening Exercise ................................................................................ 11-19
11.8.4 Preliminary Social Assessment & Baseline Scenario .............................................................. 11-19
11.8.5 Impact of Land Acquisition .................................................................................................... 11-19
11.8.6 Increase in Employment Opportunities ................................................................................. 11-21
11.9 PUBLIC CONSULTATION .................................................................................................................. 11-21
11.9.1 Introduction ........................................................................................................................... 11-21
11.9.2 Need ....................................................................................................................................... 11-21
11.9.3 Objectives .............................................................................................................................. 11-21
11.9.4 Process of Consultation ......................................................................................................... 11-22
11.9.5 Identification of issues ........................................................................................................... 11-22
11.10 MITIGATION AND ENHANCEMENT MEASURES .......................................................................... 11-23
11.10.1 Suggested Mitigation Measures ............................................................................................ 11-23
11.11 POLICY, LEGAL AND ADMINISTRATIVE FRAMEWORK ................................................................. 11-23
11.11.1 Broad Principles ..................................................................................................................... 11-23
11.11.2 Land Acquisition Act, 1894 .................................................................................................... 11-26
11.11.3 Project Specific Resettlement framework ............................................................................. 11-26
11.11.4 Land Acquisition- Mitigation Measures ................................................................................. 11-26
11.11.5 RESETTLEMENT FRAMEWORK PRINCIPLES AND ENTITLEMENT MATRIX .............................. 11-27
11.12 SAFETY ........................................................................................................................................ 11-35
11.12.1 Enhancement Opportunities.................................................................................................. 11-35
11.13 PROPOSED ACTION PLAN ........................................................................................................... 11-36
11.14 TENTATIVE BUDGET FOR RESETTLEMENT AND REHABILITATION ACTIVITIES R&R PROGRAM ... 11-36
11.15 CONCLUSIONS ............................................................................................................................ 11-37
12. CONCLUSION AND RECOMMENDATION .............................................................................12-1
12.1 CONCLUSION AND RECOMMENDATION........................................................................................... 12-1
Consultancy Services for preparation of DPR for development of Economic Corridors, Inter Corridors, Feeder Routes and National corridors (GQ and NS-EW Corridors) to improve the efficiency of freight movement in India under Bharatmala Pariyojana (Chennai-Salem Highway)
Feasibility Report Volume – I (Main Report)
Feedback Infra Pvt. Ltd. vii National Highways Authority of India
INDEX OF TABLES
TABLE 2-1 ............................................................................................................................................................... 2-2
TABLE 2-2 ............................................................................................................................................................... 2-2
TABLE 2-3 ............................................................................................................................................................... 2-2
TABLE 2-4: .............................................................................................................................................................. 2-6
TABLE 3-1: DISTRICT WISE DETAILS ALONG THE EXISTING ROUTES ...................................................................................... 3-3
TABLE 3-2: PACKAGEWISE DETAILS WITH PROPOSED RIGHT OF WAY .................................................................................... 3-4
TABLE 3-3: TALUK WISE DETAILS ALONG DIFFERENT DISTRICTS OF PROPOSED ALIGNMENT ........................................................ 3-4
TABLE 3-4: SOCIO-ECONOMIC CHARACTERISTICS ............................................................................................................ 3-8
TABLE 3-5: DISTRICTS OF TAMIL NADU ......................................................................................................................... 3-9
TABLE 4-1: ALTERNATIVE CORRIDORS ........................................................................................................................... 4-2
TABLE 4-2: VEHICLE CLASSIFICATION SYSTEM.................................................................................................................. 4-6
TABLE 4-3: SCHEDULE OF TRAFFIC VOLUME COUNT SURVEY ............................................................................................... 4-6
TABLE 4-4: SCHEDULE OF ORIGIN – DESTINATION SURVEY ................................................................................................. 4-7
TABLE 4-5: SCHEDULE OF AXLE LOAD SURVEY ................................................................................................................. 4-8
TABLE 4-6: PASSENGER CAR EQUIVALENCY FACTORS ........................................................................................................ 4-8
TABLE 4-7: AVERAGE DAILY TRAFFIC AT COUNT LOCATIONS ............................................................................................ 4-10
TABLE 4-8: SEASONAL FACTORS BASED ON FUEL SALES DATA ........................................................................................... 4-12
TABLE 4-9: SEASONAL FACTORS BASED ON TOLL PLAZA DATA .......................................................................................... 4-12
TABLE 4-10: ANNUAL AVERAGE DAILY TRAFFIC AT COUNT LOCATIONS .............................................................................. 4-13
TABLE 4-11: SUMMARY OF ADT AND AADT AT COUNT LOCATIONS ................................................................................. 4-15
TABLE 4-12: AVERAGE TOTAL TRAFFIC COMPOSITION AT COUNT LOCATIONS....................................................................... 4-16
TABLE 4-13: DAY FACTORS AND MAXIMUM VARIATIONS ................................................................................................ 4-20
TABLE 4-14: DAILY VARIATION OF TRAFFIC VOLUME (PCUS) .......................................................................................... 4-20
TABLE 4-15: DIRECTIONAL SPLIT ................................................................................................................................ 4-21
TABLE 4-16: SAMPLE SIZE FOR O – D SURVEY .............................................................................................................. 4-22
TABLE 4-17: ADOPTED ZONING SYSTEM FOR THE STUDY ................................................................................................. 4-23
TABLE 4-18: LEAD DISTRIBUTION OF VEHICLES .............................................................................................................. 4-24
TABLE 4-19: TRIP PURPOSE OF PASSENGER VEHICLES ..................................................................................................... 4-27
TABLE 4-20: CLASSIFICATION OF COMMODITIES ............................................................................................................ 4-27
TABLE 4-21: DISTRIBUTION OF GOODS CARRIED BY COMMERCIAL VEHICLES ........................................................................ 4-28
TABLE 4-22: OBSERVED VDF .................................................................................................................................... 4-31
TABLE 4-23: OBSERVED RUNNING TIME AND SPEED ALONG THE SALEM-ULUNDURPET-CHENNAI ROAD ................................... 4-32
TABLE 4-24: OBSERVED RUNNING TIME AND SPEED ALONG THE SALEM-KRISHNAGIRI-CHENNAI ROAD .................................... 4-32
TABLE 4-25: PAST VEHICLE REGISTRATION DATA ........................................................................................................... 4-34
TABLE 4-26: ECONOMIC INDICES OF INFLUENCE STATE AND INDIA AT CONSTANT PRICES (2004 - 05)...................................... 4-34
TABLE 4-27: OBSERVED TRANSPORT DEMAND ELASTICITY VALUES AND TRAFFIC GROWTH ..................................................... 4-36
TABLE 4-28: PROJECTED TRANSPORT DEMAND ELASTICITY VALUES ................................................................................... 4-37
TABLE 4-29: PROJECTED GROWTH RATES OF INDICATORS IN PERCENTAGE .......................................................................... 4-37
TABLE 4-30: ESTIMATED AND RECOMMENDED TRAFFIC GROWTH RATES ............................................................................ 4-39
TABLE 4-31: HOMOGENOUS SECTIONS BASED ON NODES AND INTERCHANGES .................................................................... 4-40
TABLE 4-32: GENERALISED COST FOR ALTERNATE ROUTES AND PROJECT ROAD ................................................................... 4-43
TABLE 4-33: ESTIMATED DIVERTED TRAFFIC (2017-18), SECTION WISE ............................................................................ 4-44
TABLE 4-34: INDUCED RATIO FOR INDUCED TRAFFIC ...................................................................................................... 4-46

Consultancy Services for preparation of DPR for development of Economic Corridors, Inter Corridors, Feeder Routes and National corridors (GQ and NS-EW Corridors) to improve the efficiency of freight movement in India under Bharatmala Pariyojana (Chennai-Salem Highway)
Feasibility Report Volume – I (Main Report)
Feedback Infra Pvt. Ltd. viii
National Highways Authority of India
TABLE 4-35: SECTION WISE ESTIMATED TRAFFIC DEMAND ON PROJECT HIGHWAY ................................................................ 4-47
TABLE 4-36: DESIGN SERVICE VOLUME STANDARDS FOR LOS B & LOS C ........................................................................... 4-50
TABLE 4-37: PROJECTED SECTIONAL TRAFFIC (AADT) IN PCUS ....................................................................................... 4-50
TABLE 4-38: YEAR UPTO WHICH LOS B AND LOS C WILL SERVE ....................................................................................... 4-52
TABLE 5-1: PACKAGE-WISE DETAILS WITH PROPOSED RIGHT OF WAY ................................................................................... 5-2
TABLE 5-2: TALUK WISE DETAILS ALONG DIFFERENT DISTRICTS OF PROPOSED ALIGNMENT ........................................................ 5-3
TABLE 7-1: DETAILS OF PROPOSED CROSS SECTION ......................................................................................................... 7-1
TABLE 7-2: WIDENING SCHEME FOR CHENNAI – SALEM MAIN ALIGNMENT ....................................................................... 7-12
TABLE 7-3: WIDENING SCHEME FOR KANCHIPURAM SPUR ............................................................................................. 7-17
TABLE 7-4: WIDENING SCHEME FOR CHETPET SPUR ...................................................................................................... 7-17
TABLE 7-5: WIDENING SCHEME FOR TIRUVANAMALAI SPUR ........................................................................................... 7-18
TABLE 7-6: CURVE DETAILS ...................................................................................................................................... 7-18
TABLE 7-7: LIST OF GRADE SEPARATED INTERSECTIONS ON NH-209 ................................................................................ 7-19
TABLE 7-8: LIST OF AT GRADE INTERSECTIONS ............................................................................................................. 7-21
TABLE 7-9: METHOD OF TESTING .............................................................................................................................. 7-23
TABLE 7-10: DETAILS OF SOIL/ MOORUM BORROW AREAS ............................................................................................ 7-24
TABLE 7-11: STONE AGGREGATE QUARRIES ................................................................................................................ 7-24
TABLE 7-12: DETAILS OF SAND QUARRIES ................................................................................................................... 7-25
TABLE 7-13: VDF CALCULATED ................................................................................................................................. 7-27
TABLE 7-14: TRAFFIC GROWTH RATES ......................................................................................................................... 7-27
TABLE 7-15: HOMOGENOUS SECTIONS ....................................................................................................................... 7-28
TABLE 7-16: PROPOSED PAVEMENT DESIGN ................................................................................................................ 7-31
TABLE7-17: PROPOSED PAVEMENT DESIGN FOR SERVICE ROADS ..................................................................................... 7-32
TABLE 7-18: SUMMARY OF CHARACTERISTIC DEFLECTIONS & OVERLAY PROPOSAL ............................................................... 7-33
TABLE 7-19: AXLE LOAD SPECTRUM AT LOCATION 1 METTUPATTI EX.KM.21.750 (OLD NH-68) (CHENNAI -SALEM) ................ 7-35
TABLE 7-20: RESULT OF AXLE LOAD SPECTRUM LOCATION 1 METTUPATTI EX.KM.21.750 (OLD NH-68) (CHENNAI -SALEM) ..... 7-35
TABLE 7-21: AXLE LOAD SPECTRUM AT LOCATION 1 METTUPATTI EX.KM.21.750 (OLD NH-68) (SALEM - CHENNAI) ............... 7-36
TABLE 7-22: RESULT OF AXLE LOAD SPECTRUM AT LOCATION 1 METTUPATTI EX.KM.21.750 (OLD NH-68) (SALEM - CHENNAI) .. 7-
36
TABLE 7-23: AXLE LOAD SPECTRUM AT LOCATION 2 PALLIKONDA EX.KM.KM 98.520 (OLD NH-4) (CHENNAI -SALEM) .............. 7-37
TABLE 7-24: RESULT OF AXLE LOAD SPECTRUM AT LOCATION 2 PALLIKONDA EX.KM.KM 98.520 (OLD NH-4)(CHENNAI -SALEM) 7-37
TABLE 7-25: AXLE LOAD SPECTRUM AT LOCATION 2 PALLIKONDA EX.KM.KM 98.520 (OLD NH-4) (SALEM - CHENNAI) ............. 7-38
TABLE 7-26: RESULT OF AXLE LOAD SPECTRUM AT LOCATION 2 PALLIKONDA EX.KM.KM 98.520 (OLD NH-4) (SALEM - CHENNAI) .....
7-38
TABLE 7-27: AXLE LOAD SPECTRUM AT LOCATION 3 NEAR PAPPIREDDIPATTI JN. EX.KM KM 31.000 (SH-18) (CHENNAI -SALEM) .......
7-39
TABLE 7-28: RESULT OF AXLE LOAD SPECTRUM AT LOCATION 3 NEAR PAPPIREDDIPATTI JN. EX.KM KM 31.000 (SH-18) (CHENNAI -
SALEM) ........................................................................................................................................................ 7-39
TABLE 7-29: AXLE LOAD SPECTRUM AT LOCATION 3 NEAR PAPPIREDDIPATTI JN. EX.KM KM 31.000 (SH-18) (SALEM - CHENNAI) ......
7-40
TABLE 7-30: RESULT OF AXLE LOAD SPECTRUM AT LOCATION 3 NEAR PAPPIREDDIPATTI JN. EX.KM KM 31.000 (SH-18) (SALEM -
CHENNAI) ..................................................................................................................................................... 7-40
TABLE 7-31: MODULUS OF SUB-GRADE REACTION ........................................................................................................ 7-41
Consultancy Services for preparation of DPR for development of Economic Corridors, Inter Corridors, Feeder Routes and National corridors (GQ and NS-EW Corridors) to improve the efficiency of freight movement in India under Bharatmala Pariyojana (Chennai-Salem Highway)
Feasibility Report Volume – I (Main Report)
Feedback Infra Pvt. Ltd. ix National Highways Authority of India
TABLE 7-32: PROPOSED RIGID PAVEMENT DESIGN ....................................................................................................... 7-43
TABLE 7-33: SUMMARY OF LIFE CYCLE COST ANALYSIS .................................................................................................. 7-44
TABLE 7-34: SUMMARY OF LIFE CYCLE COST ANALYSIS .................................................................................................. 7-45
TABLE 7-35: SUMMARY OF LIFE CYCLE COST ANALYSIS .................................................................................................. 7-45
TABLE 7-36: PROPOSED TOLL PLAZA LOCATIONS ........................................................................................................... 7-46
TABLE 7-37 SUMMARY OF STRUCTURES ...................................................................................................................... 7-47
TABLE 7-38 DETAILS OF MAJOR BRIDGE PROPOSED FOR NEW CONSTRUCTION ................................................................... 7-50
TABLE 7-39: DETAILS OF MAJOR BRIDGE CUM FLYOVER PROPOSED FOR NEW CONSTRUCTION .............................................. 7-53
TABLE 7-40: DETAILS OF MAJOR BRIDGE CUM ROB PROPOSED FOR NEW CONSTRUCTION ................................................... 7-53
TABLE 7-41: DETAILS OF ROB CUM FLYOVER CUM INTERCHANGE CUM MJB PROPOSED FOR NEW CONSTRUCTION ................. 7-54
TABLE 7-42: DETAILS OF MAJOR BRIDGE PROPOSED FOR EXISTING RETAINED + NEW CONSTRUCTION ..................................... 7-55
TABLE 7-43: DETAILS OF MINOR BRIDGES PROPOSED FOR NEW CONSTRUCTION ................................................................ 7-56
TABLE 7-44: DETAILS OF MINOR BRIDGES PROPOSED FOR RECONSTRUCTION ..................................................................... 7-66
TABLE 7-45: DETAILS OF MINOR BRIDGES PROPOSED FOR SR-NEW CONSTRUCTION + MCW-NEW CONSTRUCTION ................. 7-67
TABLE 7-46: DETAILS OF MINOR BRIDGES PROPOSED FOR SR-NEW CONSTRUCTION +MCW-RECONSTRUCTION + NEW
CONSTRUCTION ............................................................................................................................................. 7-71
TABLE 7-47: DETAILS OF MINOR BRIDGES PROPOSED FOR NEW CONSTRUCTION ................................................................ 7-72
TABLE 7-48: DETAILS OF MINOR BRIDGE PROPOSED FOR RECONSTRUCTION + NEW CONSTRUCTION ....................................... 7-73
TABLE 7-49: DETAILS OF MINOR BRIDGE PROPOSED FOR WIDENING WITH MINOR REPAIRS ................................................... 7-75
TABLE 7-50: DETAILS OF ROB’S PROPOSED FOR NEW CONSTRUCTION ............................................................................. 7-76
TABLE 7-51: DETAILS OF TUNNELS PROPOSED FOR NEW CONSTRUCTION .......................................................................... 7-77
TABLE 7-52: SUMMARY OF CULVERTS ......................................................................................................................... 7-78
TABLE 7-53: DETAILS OF GRADE SEPARATORS PROPOSED FOR NEW CONSTRUCTION ........................................................... 7-79
TABLE 10-1: IMPORTANT ENVIRONMENT COMPONENTS ................................................................................................ 10-2
TABLE 10-2: ENVIRONMENT LAWS AND THEIR APPLICABILITY .......................................................................................... 10-2
TABLE 10-3: IMD OBSERVATORIES IN VICINITY OF THE PROPOSED HIGHWAY ALIGNMENT ..................................................... 10-7
TABLE 10-4: LONG-TERM (1981-2000) CLIMATOLOGICAL CONDITIONS AT IMD OBSERVATORIES ........................................ 10-7
TABLE 10-5: LAND USE MAP OF PROJECT REGION ......................................................................................................... 10-9
TABLE 10-6: ECO-SENSITIVE AREAS WITHIN 15KM FROM PROJECT ROAD ........................................................................ 10-11
TABLE 10-7: FOREST AREA ALONGSIDE THE PROPOSED PROJECT ROAD ........................................................................... 10-11
TABLE 10-8: LIST OF FLORA IN STUDY REGION ........................................................................................................... 10-11
TABLE 10-9: LIST OF FAUNA IN STUDY REGION ........................................................................................................... 10-12
TABLE 10-10: IMPACT & MITIGATION ...................................................................................................................... 10-13
TABLE 11-1: DISTRICT WISE DETAILS ALONG THE EXISTING ROUTES .................................................................................. 11-2
TABLE 11-2: PACKAGE WISE DETAILS WITH PROPOSED RIGHT OF WAY ............................................................................... 11-2
TABLE 11-3: TALUK WISE DETAILS ALONG DIFFERENT DISTRICTS OF PROPOSED ALIGNMENT .................................................... 11-3
TABLE 11-4: SOCIO-ECONOMIC CHARACTERISTICS ...................................................................................................... 11-15
TABLE 11-5 DISTRICTS OF TAMIL NADU .................................................................................................................... 11-16
TABLE 11-6: TYPE OF INFORMATION AND SOURCES..................................................................................................... 11-18
TABLE 11-7: TOTAL STRUCTURE BELONGS TO THE PROJECT ROAD ................................................................................... 11-19
TABLE 11-8: LAND ACQUISITION REQUIRED ............................................................................................................... 11-20
TABLE 11-9: LAND ACQUISITION REQUIRED ............................................................................................................... 11-20
TABLE 11-10: ENTITLEMENT MATRIX ....................................................................................................................... 11-30
TABLE 11-11: ESTIMATED TENTATIVE BUDGET FOR R&R ACTIVITIES .............................................................................. 11-36
Consultancy Services for preparation of DPR for development of Economic Corridors, Inter Corridors, Feeder Routes and National corridors (GQ and NS-EW Corridors) to improve the efficiency of freight movement in India under Bharatmala Pariyojana (Chennai-Salem Highway)
Feasibility Report Volume – I (Main Report)
Feedback Infra Pvt. Ltd. x National Highways Authority of India
INDEX OF FIGURES
FIGURE 3-1: LOCATION MAP OF PROJECT ROAD ............................................................................................................. 3-5
FIGURE 4-1: ALTERNATE ROUTES FROM CHENNAI TO SALEM ............................................................................................. 4-3
FIGURE 4-2: TRAFFIC SURVEYS LOCATION MAP ............................................................................................................... 4-5
FIGURE 4-3: VEHICLE COMPOSITION .......................................................................................................................... 4-19
FIGURE 4-4: HOURLY TRAFFIC VARIATION AT COUNT LOCATIONS ...................................................................................... 4-19
FIGURE 4-5: DAILY VARIATION OF TRAFFIC AT COUNT LOCATIONS ..................................................................................... 4-20
FIGURE 4-6: DAILY VARIATION OF TRAFFIC AT COUNT LOCATIONS ACROSS WEEK .................................................................. 4-21
FIGURE 4-7: TRIP PURPOSE (%) ................................................................................................................................. 4-27
FIGURE 4-8: PERCENTAGE DISTRIBUTION OF COMMODITIES ............................................................................................ 4-30
FIGURE 5-1: LOCATION MAP OF PROJECT ROAD ............................................................................................................. 5-4
FIGURE 11-1: LOCATION MAP OF PROJECT ROAD ......................................................................................................... 11-4
Consultancy Services for preparation of DPR for development of Economic Corridors, Inter Corridors, Feeder Routes and National corridors (GQ and NS-EW Corridors) to improve the efficiency of freight movement in India under Bharatmala Pariyojana (Chennai-Salem Highway)
Feasibility Report Volume – I (Main Report)
Introduction
Feedback Infra Pvt. Ltd. 1-1 National Highways Authority of India
1. INTRODUCTION
1.1 Project Background
The Government of India has taken up development of Economic Corridors, Inter Corridors,
Feeder Corridors and National Corridors (GQ and NS-EW Corridors) to improve the efficiency
of Freight Movements in India under Bharatmala Pariyojana. The National Highways Authority
of India (NHAI) has appointed M/s. Feedback Infra Pvt. Ltd. for providing the required
Consultancy services for preparation of Detailed Project Report for 5 such corridors under LOT
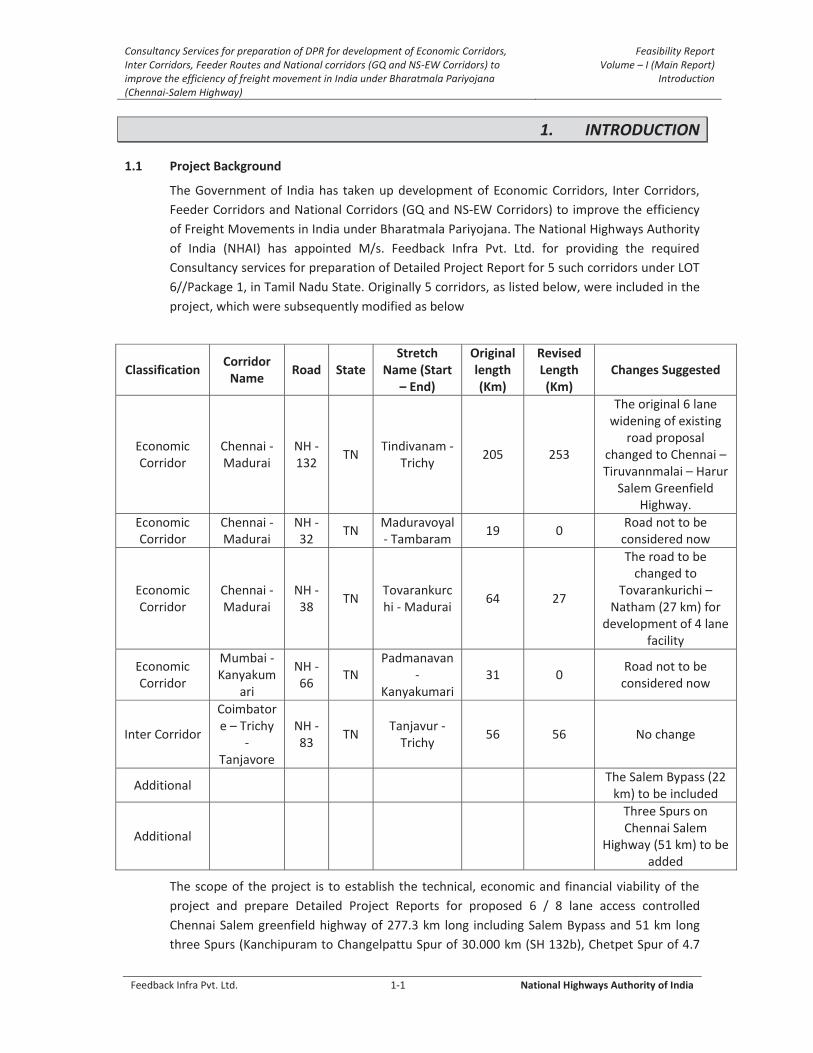
6//Package 1, in Tamil Nadu State. Originally 5 corridors, as listed below, were included in the
project, which were subsequently modified as below
Classification Corridor Name Road State
Stretch Name (Start
– End)
Original length (Km)
Revised Length (Km)
Changes Suggested
Economic Corridor
Chennai - Madurai
NH - 132
TN Tindivanam -
Trichy 205 253
The original 6 lane widening of existing
road proposal changed to Chennai – Tiruvannmalai – Harur
Salem Greenfield Highway.
Economic Corridor
Chennai - Madurai
NH -32
TN Maduravoyal - Tambaram
19 0 Road not to be
considered now
Economic Corridor
Chennai - Madurai
NH - 38
TN Tovarankurchi - Madurai
64 27
The road to be changed to
Tovarankurichi – Natham (27 km) for
development of 4 lane facility
Economic Corridor
Mumbai - Kanyakum
ari
NH - 66
TN Padmanavan
- Kanyakumari
31 0 Road not to be
considered now
Inter Corridor
Coimbatore – Trichy
- Tanjavore
NH - 83
TN Tanjavur -
Trichy 56 56 No change
Additional The Salem Bypass (22
km) to be included
Additional
Three Spurs on Chennai Salem
Highway (51 km) to be added
The scope of the project is to establish the technical, economic and financial viability of the
project and prepare Detailed Project Reports for proposed 6 / 8 lane access controlled
Chennai Salem greenfield highway of 277.3 km long including Salem Bypass and 51 km long
three Spurs (Kanchipuram to Changelpattu Spur of 30.000 km (SH 132b), Chetpet Spur of 4.7

Consultancy Services for preparation of DPR for development of Economic Corridors, Inter Corridors, Feeder Routes and National corridors (GQ and NS-EW Corridors) to improve the efficiency of freight movement in India under Bharatmala Pariyojana (Chennai-Salem Highway)
Feasibility Report Volume – I (Main Report)
Introduction
Feedback Infra Pvt. Ltd. 1-2 National Highways Authority of India
(SH 4) km and Tiruvannmalai Spur of 16 km (NH 38)), development of Tovarankurichi to
Natham road to 4 lane facility and Tanjavur to Trichy road (56 km) to 6 lane facility in a sound
technical and most economical manner, taking into consideration the environment and social
aspects of the area, quality audit and safety audit requirement in design and to carry out
through financial analysis for implementation. The Consultants have already submitted the
Inception Report and Alignment Report as part of the assignment. This report pertains to
Feasibility Study of the Green Field Chennai-Salem highway (From Chennai Outer Ring Road
to end of Salem Bypass) along with 3 Spurs as mentioned above.
1.2 Scope of Consultancy Services
The main objective of the consultancy services is to establish the technical, economic and financial viability of the project and prepare Detailed Project Report for Greenfield Green field highway including rehabilitation and upgrading of the existing road, if any.
The Scope of work shall thus cover the following major tasks. i. Review of all available reports and published information about the project road and
the project influence area.
ii. Environmental and social impact assessment, including social related to cultural
related properties, natural habitats, involuntary resettlement etc.
ii Public consultation, including consultation with communities located along the road,
NGOs working in the area, other stake holders and relevant Government
Departments at all the different stages of assignment (such as inception stage,
feasibility stage, preliminary design stage and once final designs are concretized).
iii. Detailed Reconnaissance.
iv. Identification of possible alternative alignments for Green field highway along with
improvements in the existing alignment, if any bypassing congested locations with
alternatives, evaluation of different alternatives comparison on techno-economic
and other considerations and recommendations regarding most appropriate option.
v. Traffic studies including traffic surveys and Axle load survey and demand
forecasting for next thirty years.
vi. Inventory and condition surveys for the spurs (existing road), existing road portions
other than the proposed green field highway.
vii. Inventory and condition surveys for bridges, cross-drainage structures, other
Structures, river Bank training/Protection works and drainage provisions.
viii. Detailed topographic surveys using LIDAR equipped with minimum engineering grade
system or any other better technology having output accuracy not less than
(a) Specified in IRC SP 19
(b) Total Station
(c) GPS/ DGPS
The use of conventional high precision instruments i.e. Total Station or equivalent
can be used at locations such as major bypasses, water bodies etc. where it may not
be possible to survey using LIDAR.
ix. Pavement investigations.
Consultancy Services for preparation of DPR for development of Economic Corridors, Inter Corridors, Feeder Routes and National corridors (GQ and NS-EW Corridors) to improve the efficiency of freight movement in India under Bharatmala Pariyojana (Chennai-Salem Highway)
Feasibility Report Volume – I (Main Report)
Introduction
Feedback Infra Pvt. Ltd. 1-3 National Highways Authority of India
x. Sub-grade characteristics and strength: investigation of required sub-grade and sub-
soil characteristics and strength for road and embankment design and sub soil
investigation.
xi. Identification of sources of construction materials.
xii. Detailed design of road, its x-sections, horizontal and vertical alignment and design
of embankment of height more than 6m and also in poor soil conditions and where
density consideration require, even lesser height embankment. Detailed design of
structures preparation of GAD and construction drawings and cross-drainage
structures and underpasses etc.
xiii. Identification of the type and the design of intersections.
xiv. Identification and design of grade separated interchanges
xv. Design of complete drainage system and disposal point for storm water.
xvi. Value analysis / value engineering and project costing.
xvii. Economic and financial analysis.
xviii. Contract packaging and implementation schedule.
xix. Strip plan indicating the scheme for schedule for LA: reports documents and
drawings arrangement of estimates for cutting/ transplanting of trees and
shifting of utilities from the concerned department.
xx. To find out financial viability of project for implementation and suggest the preferred
mode on which the project is to be taken up.
xxi. Preparation of detailed project report, cost estimate, approved for construction
Drawings, rate analysis, detailed bill of quantities, bid documents for execution of
civil works through budgeting resources.
xxii. Design of toll plaza and identification of their numbers and location and office cum
residential complex including working drawings.
xxiii. Design of weighing stations, parking areas and road side amenities.
xxiv. Any other user oriented facility en-route toll facility.
xxv. Tie-in of on-going/sanctioned works of MORT&H/ NHAI/ other agencies.
xxvi. Preparation of social plans for the project affected people as per policy of the lending
agencies / Govt. of India R&R Policy.
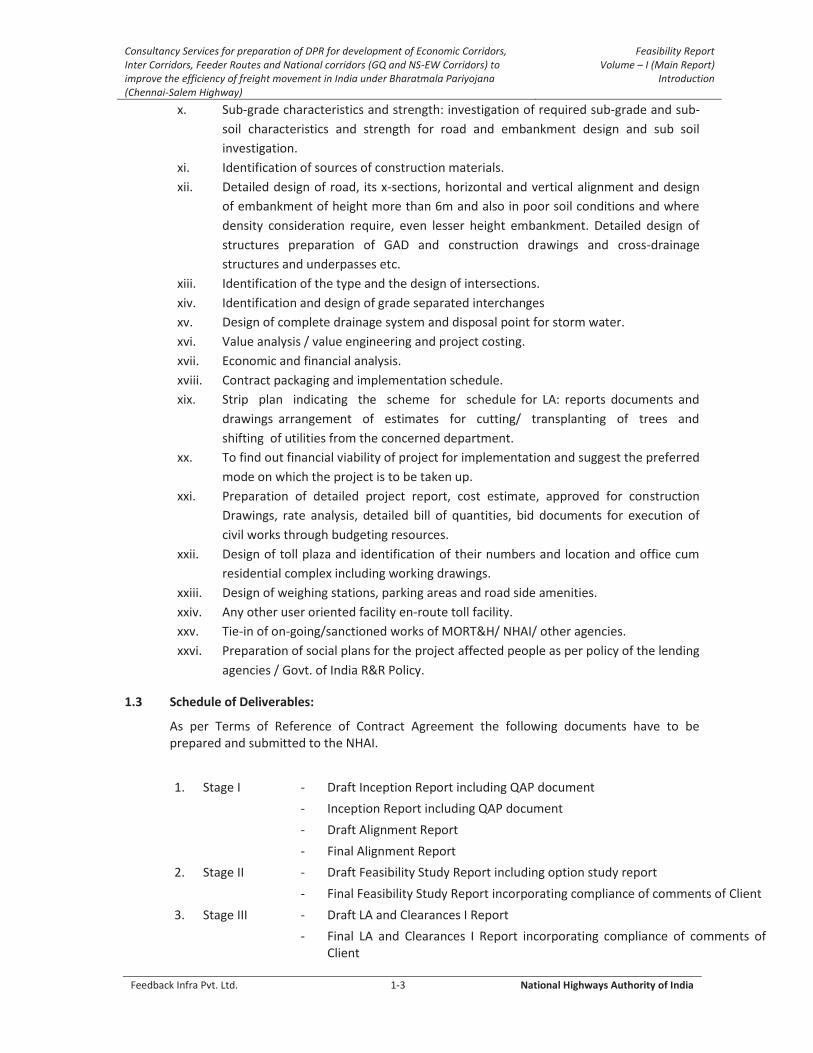
1.3 Schedule of Deliverables:
As per Terms of Reference of Contract Agreement the following documents have to be prepared and submitted to the NHAI.
1. Stage I - Draft Inception Report including QAP document
- Inception Report including QAP document
- Draft Alignment Report
- Final Alignment Report
2. Stage II - Draft Feasibility Study Report including option study report
- Final Feasibility Study Report incorporating compliance of comments of Client
3. Stage III - Draft LA and Clearances I Report
- Final LA and Clearances I Report incorporating compliance of comments of Client

Consultancy Services for preparation of DPR for development of Economic Corridors, Inter Corridors, Feeder Routes and National corridors (GQ and NS-EW Corridors) to improve the efficiency of freight movement in India under Bharatmala Pariyojana (Chennai-Salem Highway)
Feasibility Report Volume – I (Main Report)
Introduction
Feedback Infra Pvt. Ltd. 1-4 National Highways Authority of India
4. Stage IV - Draft DPR
- Final DPR incorporating compliance of comments of Client
5. Stage V - Draft Technical Schedules
- Final technical schedule
6. Stage VI - LA and Clearances II Report
1.4 Structure of the report (Draft Feasibility Report):
This report (Draft Feasibility Report) has been chaptalized as below.
Chapter 1 : Introduction
Chapter 2 : Site of the project
Chapter 3 : Socio-Economic Profile of the area
Chapter 4 : Traffic studies and Forecast
Chapter 5 : Finalization of Alignment for the Expressway
Chapter 6 : Specifications and Standards
Chapter 7 : Preliminary Design of the Project
Chapter 8 : Project Facilities
Chapter 9 : Preliminary Project Cost
Chapter 10 : Environmental Screening and Preliminary Environmental Assessment
Chapter 11 : Initial Social Assessment
Chapter 12 : Conclusions

Consultancy Services for preparation of DPR for development of Economic Corridors, Inter Corridors, Feeder Routes and National corridors (GQ and NS-EW Corridors) to improve the efficiency of freight movement in India under Bharatmala Pariyojana (Chennai-Salem Highway)
Feasibility Report Volume – I (Main Report)
Site of the Project
Feedback Infra Pvt. Ltd. 2-1 National Highways Authority of India
2. SITE OF THE PROJECT
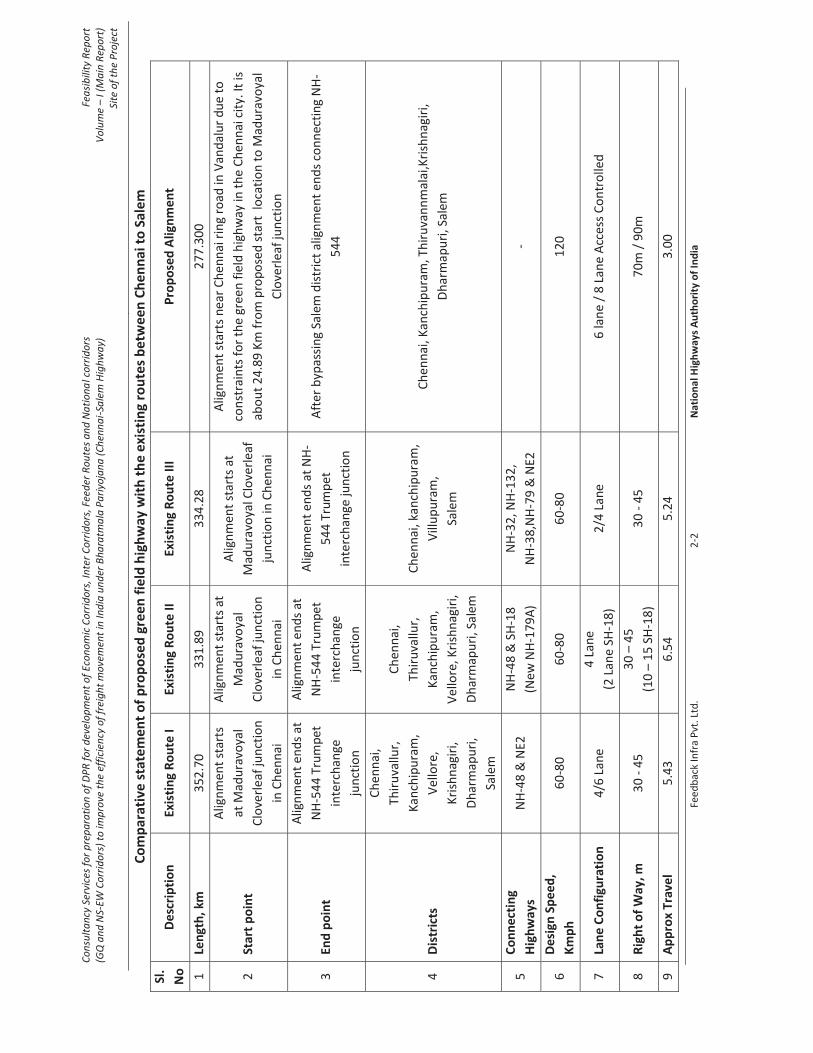
2.1. General
The present connection between Chennai to Salem is provided by three routes; Route I :
National Highways NH-48 and NE2 passing through Chennai, Kanchipuram, Vellore,
Krishnagiri, Dharmapuri and Salem districts of Tamil Nadu state with the length of 352.70 Km
consisting 4/6 lane configuration, Route II : National Highway NH-48 and State Highway SH-
18 (New NH-179A) travelling along same districts as route I has a length of 331.89 Km
consisting 2/4 lane configuration and Route III : National Highway NH-32, NH-132, NH-38,
NH-79 and NE2 traversing along Chennai, Villupuram and Salem districts of Tamil Nadu state
with the length of 334.28 Km with 2/4 lane configuration. Since these routes are not access-
controlled, speed of the travel is affected by considerable cross movement of traffic through
the side roads and access of vehicles from the abutting settlements leading to slower than
design speed of the through traffic. Besides, the sections through mountainous terrain along
existing route II on SH-18 (New NH-179A) section have lower radius curves at some places
which restrict smooth movement of traffic at design speed.
The idea of constructing a high- speed facility like a fully access-controlled green field
highway has originated from the primary necessity to eliminate the bottlenecks and
limitations that exist in the present corridors to reduce the travel time between Chennai –
Salem. It has been felt that substantial reduction of travel time between these two districts
would not only fetch direct benefits to the users due to less vehicle operating cost,
passenger time saving and other intangible benefits as well. The connectivity provided
through interchanges with residential, commercial and industrial hub would also fetch direct
and indirect benefits. The project is expected to generate development around the abutting
towns connected through proposed spurs from the green field highway. Number of
openings and employment opportunities to the local people and for the local and National
contractors as well, which would satisfy the Federal Govt agenda of employment
opportunities. There would be short and long term tangible and intangible benefits by this
project.
All the above factors warrant the construction of an access controlled green field highway
ensuring safety and high speed movement of men and materials from production units to
consumers in shortest possible time.
The present project alignment has been sub divided into parts of two recently declared
National Highways (NH 179A and 179B). The first part of the project alignment, (179A) starts
from Salem bypass end (Project chainage 0+000), and ends at the off-take point of NH 179A
to Baniyambadi (Project Chainage 57+300 km). The second part of the project alignment,
(179B) starts from the Chennai bypass at Vandalur (Project chainage 0+000), and ends at the
off-take point of NH 179A to Baniyambadi (Project Chainage 220+000 km).
Cons
ulta
ncy
Serv
ices f
or p
repa
ratio
n of
DPR
for d
evel
opm
ent o
f Eco
nom
ic Co
rrid
ors,
Inte
r Cor
ridor
s, Fe
eder
Rou
tes a
nd N
atio
nal c
orrid
ors
(GQ
and
NS-
EW C
orrid
ors)
to im
prov
e th
e ef
ficie
ncy
of fr
eigh
t mov
emen
t in
Indi
a un
der B
hara
tmal
a Pa
riyoj
ana
(Che
nnai
-Sal
em H
ighw
ay)
Feas
ibili
ty R
epor
t Vo
lum
e –
I (M
ain
Repo
rt)
Site
of t
he P
roje
ct
Fee
db
ack
Infr
a P
vt. L
td.
2-2
Nat
iona
l Hig
hway
s Aut
horit
y of
Indi
a
Com
para
tive
stat
emen
t of p
ropo
sed
gree
n fie
ld h
ighw
ay w
ith th
e ex
istin
g ro
utes
bet
wee
n Ch
enna
i to
Sale
m
Sl.
No
Desc
riptio
n Ex
istin
g Ro
ute
I Ex
istin
g Ro
ute
II Ex
istin
g Ro
ute
III
Prop
osed
Alig
nmen
t
1 Le
ngth
, km
3
52
.70
3
31
.89
3
34
.28
2
77
.30
0
2 St
art p
oint
Alig
nm
ent
star
ts
at M
adu
ravo
yal
Clo
verl
eaf
jun
ctio
n
in C
hen
nai
Alig
nm
ent
star
ts a
t
Mad
ura
voya
l
Clo
verl
eaf
jun
ctio
n
in C
hen
nai
Alig
nm
ent
star
ts a
t
Mad
ura
voya
l Clo
verl
eaf
jun
ctio
n in
Ch
enn
ai
Alig
nm
ent
star
ts n
ear
Ch
enn
ai r
ing
road
in V
and
alu
r d
ue
to
con
stra
ints
fo
r th
e gr
een
fie
ld h
igh
way
in t
he
Ch
enn
ai c
ity.
It is
abo
ut
24
.89
Km
fro
m p
rop
ose
d s
tart
lo
cati
on
to
Mad
ura
voya
l
Clo
verl
eaf
jun
ctio
n
3 En
d po
int
Alig
nm
ent
end
s at
NH
-54
4 T
rum
pet
inte
rch
ange
jun
ctio
n
Alig
nm
ent
end
s at
NH
-54
4 T
rum
pet
inte
rch
ange
jun
ctio
n
Alig
nm
ent
end
s at
NH
-
54
4 T
rum
pet
inte
rch
ange
jun
ctio
n
Aft
er b
ypas
sin
g Sa
lem
dis
tric
t al
ign
men
t en
ds
con
nec
tin
g N
H-
54
4
4 D
istr
icts
Ch
enn
ai,
Thir
uva
llur,
Kan
chip
ura
m,
Vel
lore
,
Kri
shn
agir
i,
Dh
arm
apu
ri,
Sale
m
Ch
enn
ai,
Thir
uva
llur,
Kan
chip
ura
m,
Vel
lore
, Kri
shn
agir
i,
Dh
arm
apu
ri, S
alem
Ch
enn
ai, k
anch
ipu
ram
,
Vill
up
ura
m,
Sale
m
Ch
enn
ai, K
anch
ipu
ram
, Th
iru
van
nm
alai
,Kri
shn
agir
i,
Dh
arm
apu
ri, S
alem
5 Co
nnec
ting
H
ighw
ays
NH
-48
& N
E2
NH
-48
& S
H-1
8
(New
NH
-17
9A
)
NH
-32
, NH
-13
2,
NH
-38
,NH
-79
& N
E2
-
6 De
sign
Spe
ed,
Kmph
6
0-8
0 6
0-8
0 6
0-8
0 1
20
7 La
ne C
onfig
urat
ion
4/6
Lan
e
4 L
ane
(2 L
ane
SH-1
8)
2/4
Lan
e 6
lan
e /
8 L
ane
Acc
ess
Co
ntr
olle
d
8 Ri
ght o
f Way
, m
30
- 4
5
30
– 4
5
(10
– 1
5 S
H-1
8)
30
- 4
5
70
m /
90
m
9 Ap
prox
Tra
vel
5.4
3
6.5
4
5.2
4
3.0
0

Cons
ulta
ncy
Serv
ices f
or p
repa
ratio
n of
DPR
for d
evel
opm
ent o
f Eco
nom
ic Co
rrid
ors,
Inte
r Cor
ridor
s, Fe
eder
Rou
tes a
nd N
atio
nal c
orrid
ors
(GQ
and
NS-
EW C
orrid
ors)
to im
prov
e th
e ef
ficie
ncy
of fr
eigh
t mov
emen
t in
Indi
a un
der B
hara
tmal
a Pa
riyoj
ana
(Che
nnai
-Sal
em H
ighw
ay)
Feas
ibili
ty R
epor
t Vo
lum
e –
I (M
ain
Repo
rt)
Site
of t
he P
roje
ct
Fee
db
ack
Infr
a P
vt. L
td.
2-3
Nat
iona
l Hig
hway
s Aut
horit
y of
Indi
a
Sl.
No
Desc
riptio
n Ex
istin
g Ro
ute
I Ex
istin
g Ro
ute
II Ex
istin
g Ro
ute
III
Prop
osed
Alig
nmen
t
Tim
e, H
ours
m
inut
es
10
No
of N
H cr
ossi
ngs
6
5
6
5
11
No
of S
H cr
ossi
ngs
21
21
20
10
12
Acce
ss C
ontr
ol
No
acc
ess
/Par
tial
acc
ess
con
tro
l
No
acc
ess
/Par
tial
acc
ess
Co
ntr
ol
No
acc
ess
/Par
tial
acc
ess
Co
ntr
ol
Co
mp
lete
acc
ess
con
tro
l wit
h
on
ly 9
po
ssib
le lo
cati
on
fo
r
Entr
y an
d e
xit.
13
Mer
its
1. S
ince
ro
ads
are
alre
ady
pre
sen
t, t
her
e is
no
str
uct
ure
aff
ecti
ng
and
lan
d a
cqu
isit
ion
, un
like
the
pro
po
sed
gre
enfi
eld
hig
hw
ay.
2. A
ll th
e ex
isti
ng
rou
tes
are
eith
er n
o a
cces
s/p
arti
al a
cces
s co
ntr
olle
d,
the
con
nec
tivi
ty is
mu
ch h
igh
er t
o t
he
villa
ges/
tow
n a
lon
g it
s p
ath
.
3. A
lth
ou
gh t
he
aver
age
trav
el t
ime
for
thes
e ro
ute
s fr
om
Ch
enn
ai t
o
Sale
m is
5 h
ou
rs 4
5 m
inu
tes,
wit
h t
he
imp
rove
men
ts t
o t
he
exis
tin
g it
can
be
red
uce
d.
4. T
her
e is
no
fo
rest
lan
d a
cqu
isit
ion
, wh
ich
is a
ver
y d
iffi
cult
&
linge
rin
g p
roce
ss r
equ
ired
fo
r p
rop
ose
d g
reen
fiel
d h
igh
way
.
5. P
rop
ose
d h
igh
way
wit
h c
lose
d t
oll
po
licy
syst
em is
dif
ficu
lt t
o a
cces
s
for
a co
mm
on
man
.
1. B
ette
r co
nn
ecti
vity
to
maj
or
tow
ns
thro
ugh
sp
urs
at
Kan
chip
ura
m-C
han
galp
attu
, Ch
epet
& T
iru
van
nam
alai
utl
isin
g
exis
tin
g SH
-58
, SH
-4 &
NH
-23
4 r
esp
ecti
vely
.
2. S
ho
rter
tra
vel t
ime
and
dis
tan
ce c
om
par
ed t
o e
xist
ing
rou
tes.
3. C
om
ple
tely
acc
ess
con
tro
lled
fo
r h
igh
a s
pee
d c
orr
ido
r.
4. G
reen
fie
ld h
igh
way
inte
nd
s to
co
nn
ect
ind
ust
rial
are
a an
d
spec
ial e
con
om
ic z
on
es p
rese
nt
alo
ng
Ch
enn
ai a
nd
Sal
em
dis
tric
ts.
5. T
he
new
acc
ess
con
tro
lled
gre
en f
ield
hig
hw
ay w
ill p
ave
the
way
fo
r ec
on
om
ic d
evel
op
men
t o
f th
e re
gio
n.
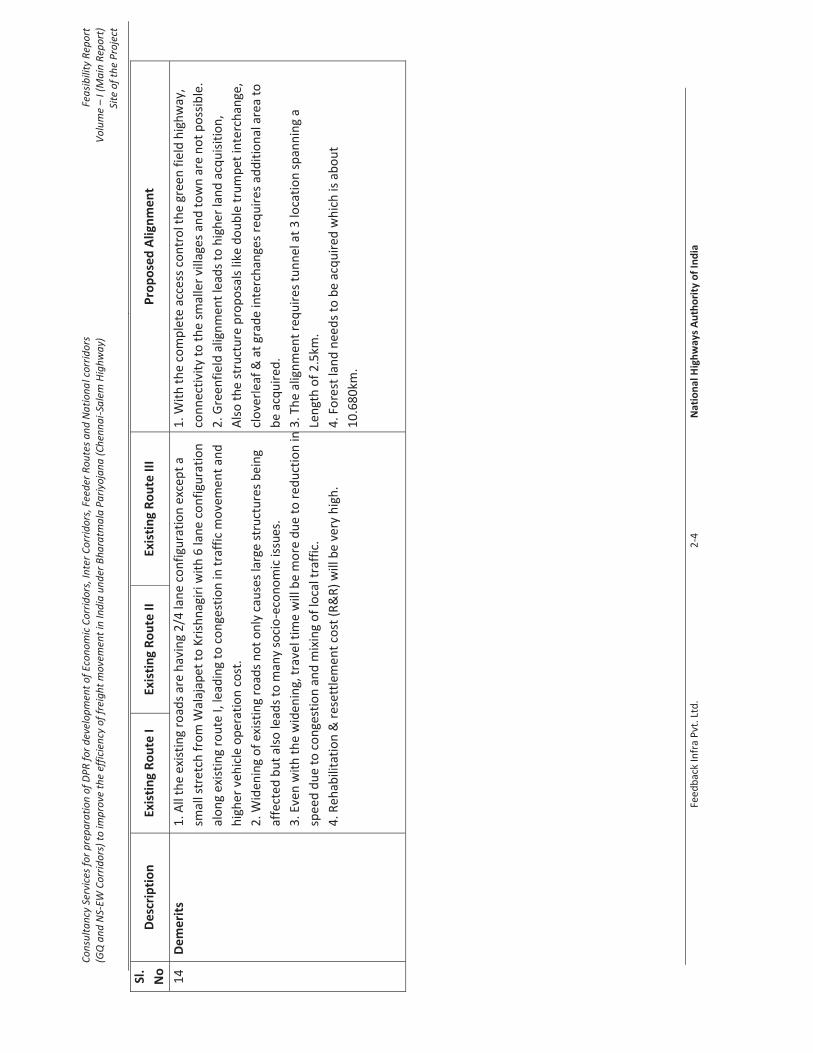
Cons
ulta
ncy
Serv
ices f
or p
repa
ratio
n of
DPR
for d
evel
opm
ent o
f Eco
nom
ic Co
rrid
ors,
Inte
r Cor
ridor
s, Fe
eder
Rou
tes a
nd N
atio
nal c
orrid
ors
(GQ
and
NS-
EW C
orrid
ors)
to im
prov
e th
e ef
ficie
ncy
of fr
eigh
t mov
emen
t in
Indi
a un
der B
hara
tmal
a Pa
riyoj
ana
(Che
nnai
-Sal
em H
ighw
ay)
Feas
ibili
ty R
epor
t Vo
lum
e –
I (M
ain
Repo
rt)
Site
of t
he P
roje
ct
Fee
db
ack
Infr
a P
vt. L
td.
2-4
Nat
iona
l Hig
hway
s Aut
horit
y of
Indi
a
Sl.
No
Desc
riptio
n Ex
istin
g Ro
ute
I Ex
istin
g Ro
ute
II Ex
istin
g Ro
ute
III
Prop
osed
Alig
nmen
t
14
Dem
erits
1
. All
the
exis
tin
g ro
ads
are
hav
ing
2/4
lan
e co
nfi
gura
tio
n e
xcep
t a
smal
l str
etch
fro
m W
alaj
apet
to
Kri
shn
agir
i wit
h 6
lan
e co
nfi
gura
tio
n
alo
ng
exis
tin
g ro
ute
I, le
adin
g to
co
nge
stio
n in
tra
ffic
mo
vem
ent
and
hig
her
veh
icle
op
erat
ion
co
st.
2. W
iden
ing
of
exis
tin
g ro
ads
no
t o
nly
cau
ses
larg
e st
ruct
ure
s b
ein
g
affe
cted
bu
t al
so le
ads
to m
any
soci
o-e
con
om
ic is
sues
.
3. E
ven
wit
h t
he
wid
enin
g, t
rave
l tim
e w
ill b
e m
ore
du
e to
red
uct
ion
in
spee
d d
ue
to c
on
gest
ion
an
d m
ixin
g o
f lo
cal t
raff
ic.
4. R
ehab
ilita
tio
n &
res
ettl
emen
t co
st (
R&
R)
will
be
very
hig
h.
1. W
ith
th
e co
mp
lete
acc
ess
con
tro
l th
e gr
een
fie
ld h
igh
way
,
con
nec
tivi
ty t
o t
he
smal
ler
villa
ges
and
to
wn
are
no
t p
oss
ible
.
2. G
reen
fiel
d a
lign
men
t le
ads
to h
igh
er la
nd
acq
uis
itio
n,
Als
o t
he
stru
ctu
re p
rop
osa
ls li
ke d
ou
ble
tru
mp
et in
terc
han
ge,
clo
verl
eaf
& a
t gr
ade
inte
rch
ange
s re
qu
ires
ad
dit
ion
al a
rea
to
be
acq
uir
ed.
3. T
he
alig
nm
ent
req
uir
es t
un
nel
at
3 lo
cati
on
sp
ann
ing
a
Len
gth
of
2.5
km.
4. F
ore
st la
nd
nee
ds
to b
e ac
qu
ired
wh
ich
is a
bo
ut
10
.68
0km
.

Consultancy Services for preparation of DPR for development of Economic Corridors, Inter Corridors, Feeder Routes and National corridors (GQ and NS-EW Corridors) to improve the efficiency of freight movement in India under Bharatmala Pariyojana (Chennai-Salem Highway)
Feasibility Report Volume – I (Main Report)
Site of the Project
Feedback Infra Pvt. Ltd. 2-5 National Highways Authority of India
2.2. Districts linked by the project
The expressway route will link following districts as shown in Table 2-1:
Table 2-1
S. No. District Population (2011 Census)
1 Kanchipuram 40.0 Lakhs
2 Thiruvannmalai 24.8 Lakhs
3 Krishnagiri 18.8 Lakhs
4 Dharampuri 15.1 Lakhs
5 Salem 34.8 Lakhs
2.3. Villages Falling Along the Expressway Alignment
On preliminary assessment, it is found that a total of 854 villages fall along the Expressway
alignment. The tentative numbers of villages according to the districts falling within are
given below as Table 2-2
Table 2-2
S. No. Name of the Districts No. of Villages 1 Kanchipuram 42
2 Thiruvannmalai 74
3 Krishnagiri 1
4 Dharampuri 24
5 Salem 18
Total 159 2.3.1 Villages Falling Along the Green Field Highway Alignment
The green field highway alignment from Vandalur pass through 159 villagesthe lands of 193
villages. The details of district, Taluks and villages are shown below as Table 2-3.
Table 2-3: Villages Falling Along the Green Field Highway Alignment
S.NO. DISTRICT TALUK VILLAGES 1 KANCHIPURAM SRIPERUMBUDUR VARADHARAJAPURAM 2 VALAYAKARANAI
3 ADHANUR
4 KARASANGAL
5 THUNDALKALANI
6 KORUKANTHANGAL
7 ORATHUR
8 SENTHAMANGALAM
9 KAVANUR

Consultancy Services for preparation of DPR for development of Economic Corridors, Inter Corridors, Feeder Routes and National corridors (GQ and NS-EW Corridors) to improve the efficiency of freight movement in India under Bharatmala Pariyojana (Chennai-Salem Highway)
Feasibility Report Volume – I (Main Report)
Site of the Project
Feedback Infra Pvt. Ltd. 2-6 National Highways Authority of India
S.NO. DISTRICT TALUK VILLAGES 10 NATTARASANPATTU
11 ARAMBAKKAM
12 ERIVAKKAM
13 KANCHIVAKKAM
14 UMAYALPARAMANCHERI
15 VADAKKUPATTU
16 KOLATHANCHERI
17 ECHOOR
18 KOLATHANCHERI
19 POONDI
20 CHENGALPATTU MANNIVAKKAM
21 AMMANUMBAKKAM
22 APPUR
23 GURUVANMEDU
24 REDDIKUPPAM
25 UTHIRAMERUR SEETTANCHERRY
26 ARUMBULIYUR COLONY
27 KARUMBAKKAM
28 ARUMBULIYUR
29 SEETHAPURAM
30 SEETHANANJERI
31 PINAYUR
32 ANAMBAKKAM
33 CHITALAPAKKAM
34 PUTHALI
35 ADAVAPAKKAM
36 OZHUGARAI
37 AZHISOOR
38 SILAMBAKKAM
39 VENGARAM
40 KARUVEPPAMPOON
41 HANUMANTHANDALAM
42 ELANAGAR 43 THIRUVANNMALAI CHEYYAR SIRUNALLUR 44 KILNEERKUNDRAM
45 ATHI
46 VADA ALAPIRANDAN
47 ANAPATHUR
48 ERUMAIVETTI
49 THENTHANDALAM
50 PERUMBALAI
51 VILARIPPATTU
52 CHITTAMOOR
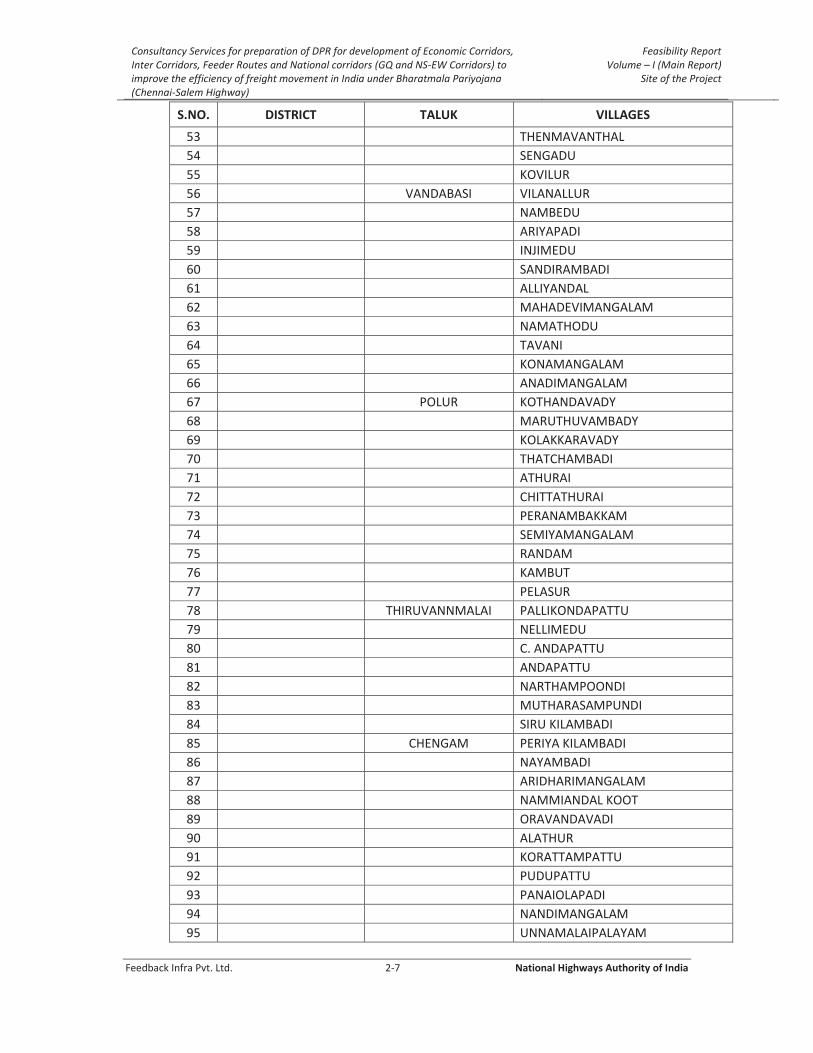
Consultancy Services for preparation of DPR for development of Economic Corridors, Inter Corridors, Feeder Routes and National corridors (GQ and NS-EW Corridors) to improve the efficiency of freight movement in India under Bharatmala Pariyojana (Chennai-Salem Highway)
Feasibility Report Volume – I (Main Report)
Site of the Project
Feedback Infra Pvt. Ltd. 2-7 National Highways Authority of India
S.NO. DISTRICT TALUK VILLAGES 53 THENMAVANTHAL
54 SENGADU
55 KOVILUR
56 VANDABASI VILANALLUR
57 NAMBEDU
58 ARIYAPADI
59 INJIMEDU
60 SANDIRAMBADI
61 ALLIYANDAL
62 MAHADEVIMANGALAM
63 NAMATHODU
64 TAVANI
65 KONAMANGALAM
66 ANADIMANGALAM
67 POLUR KOTHANDAVADY
68 MARUTHUVAMBADY
69 KOLAKKARAVADY
70 THATCHAMBADI
71 ATHURAI
72 CHITTATHURAI
73 PERANAMBAKKAM
74 SEMIYAMANGALAM
75 RANDAM
76 KAMBUT
77 PELASUR
78 THIRUVANNMALAI PALLIKONDAPATTU
79 NELLIMEDU
80 C. ANDAPATTU
81 ANDAPATTU
82 NARTHAMPOONDI
83 MUTHARASAMPUNDI
84 SIRU KILAMBADI
85 CHENGAM PERIYA KILAMBADI
86 NAYAMBADI
87 ARIDHARIMANGALAM
88 NAMMIANDAL KOOT
89 ORAVANDAVADI
90 ALATHUR
91 KORATTAMPATTU
92 PUDUPATTU
93 PANAIOLAPADI
94 NANDIMANGALAM
95 UNNAMALAIPALAYAM

Consultancy Services for preparation of DPR for development of Economic Corridors, Inter Corridors, Feeder Routes and National corridors (GQ and NS-EW Corridors) to improve the efficiency of freight movement in India under Bharatmala Pariyojana (Chennai-Salem Highway)
Feasibility Report Volume – I (Main Report)
Site of the Project
Feedback Infra Pvt. Ltd. 2-8 National Highways Authority of India
S.NO. DISTRICT TALUK VILLAGES 96 PERIYERI
97 PUDURCHENGAM
98 MUNNURMANGALAM
99 ANWARABATH
100 SE.NACHIPATTU
101 MANMALAI
102 CHENGAM
103 PERUMBATTAM
104 PERUMBAKKAM
105 PAKKIRIPALAYAM
106 MELPULIDIYUR
107 ANDANUR
108 VEDANKUPPAM
109 MELVANAKKAMBADI
110 PERUMANADU
111 MELPALLIPATTU
112 ANANDAVADI R.F
113 KARIMALAPADI
114 MELRAVANDAVADI
115 NARADAPATTU
116 KATTAMADUVU 117 KRISHNAGIRI UTHANGARAI ATHIPADI 118 DHARMAPURI HARUR ETTIPATTI 119 TAMBAL
120 VEDAKADAMADUVU
121 ALAMBADI
122 ANDIYUR
123 THEERTHAMALAI
124 MAMBADI
125 VEPPAMPATTY
126 PALAYAM
127 GUDALUR
128 ITTAIAMPATTY
129 THEDAMPATTI
130 KAMMALAMPATTY
131 HARUR
132 PAPPIREDDIPATTI NAMBIPPATTI
133 CHINNANKUPPAM
134 PARAYAPATTI
135 ERUMIYAMPATTI
136 PUDUPATTI
137 ERULAPATTI
138 KAVANDAMPATTY
139 THADAMPATTI

Consultancy Services for preparation of DPR for development of Economic Corridors, Inter Corridors, Feeder Routes and National corridors (GQ and NS-EW Corridors) to improve the efficiency of freight movement in India under Bharatmala Pariyojana (Chennai-Salem Highway)
Feasibility Report Volume – I (Main Report)
Site of the Project
Feedback Infra Pvt. Ltd. 2-9 National Highways Authority of India
S.NO. DISTRICT TALUK VILLAGES 140 PALLIPATTI
141 PAPPIREDDIPATTI 142 SALEM YERACAUD KUTTUR R.F. 143 MANJAVADI R.F.
144 VAZHAPADI KULLAMPATTY
145 MINNAMPALLI
146 SALEM VELAMPATTI R.F.
147 ACHANKUTTAPATTI
148 MOOKANUR
149 KUPPANUR
150 VELLAIYANPATTI
151 SUKKAMPATTI
152 VALASAIYUR
153 PARAPATTI
154 NILAVARAPATTI
155 NALIKALPATTI
156 SITTANERI
157 VEERAPANDI
158 AKKARAPALAYAM
159 GAJJALNAICKENPATTI 2.4 Requirement of Crossing Structures 2.4.1 Along the Expressway
The expressway will be crossing the existing NH, SH, MDR, ODR, canals, rivers, railway tracks
etc, where major structures such as bridges, interchanges, grade separators, ROB’s underpasses etc. will be required. An assessment of the requirement of major structures is
provided in the following Table 2-4:
Table 2-4: Crossing Structures
S.No Structure Type Location Nearest Place District
1 Trumpet Interchange Varadharajapuram Kanchipuram
2 MJB Neelamangalam Kanchipuram
3 VUP G-II Neelamangalam Kanchipuram
4 VUP Orathur Kanchipuram
5 VUP Vadamelpakkam Kanchipuram
6 VUP Kanchivakkam Kanchipuram
7 MJB Kanchivakkam Kanchipuram
8 Flyover Umayalparamancheri Kanchipuram
9 MJB Umayalparamancheri Kanchipuram
10 VUP Guruvanmedu Kanchipuram
11 VUP G-II Guruvanmedu Kanchipuram

Consultancy Services for preparation of DPR for development of Economic Corridors, Inter Corridors, Feeder Routes and National corridors (GQ and NS-EW Corridors) to improve the efficiency of freight movement in India under Bharatmala Pariyojana (Chennai-Salem Highway)
Feasibility Report Volume – I (Main Report)
Site of the Project
Feedback Infra Pvt. Ltd. 2-10 National Highways Authority of India
S.No Structure Type Location Nearest Place District
12 ROB Cum MJB Cum Flyover
Cum Interchange Palur Kanchipuram
13 VUP Seetancherry Kanchipuram
14 VUP Sethapuram Kanchipuram
15 VUP Anambakkam Kanchipuram
16 VUP Sirumailur Kanchipuram
17 MJB Sirumailur Kanchipuram
18 VUP G-II Vayalakkavoor Kanchipuram
19 MJB Irumaram Kanchipuram
20 Flyover Adavapakkam Kanchipuram
21 VUP G-II Vengaram Kanchipuram
22 VUP G-II Elanagar Kanchipuram
23 VUP Manampathi Kanchipuram
24 MJB Cum Flyover Nedungal Tiruvannamalai
25 VUP G-II Vada Alapirandan Tiruvannamalai
26 VUP G-II Erumaivetti Tiruvannamalai
27 Interchange Thenthanadalam Tiruvannamalai
28 MJB Perumbalai Tiruvannamalai
29 MJB Chittamoor Tiruvannamalai
30 VUP G-II Thenmavanthal Tiruvannamalai
31 VUP Vilanallur Tiruvannamalai
32 MJB Kottagaram Tiruvannamalai
33 VUP G-II Kottagaram Tiruvannamalai
34 VUP Nambedu Tiruvannamalai
35 MJB Pudur Tiruvannamalai
36 VUP Ariyapadi Tiruvannamalai
37 MNB Cum VUP Alliyandal Tiruvannamalai
38 VUP G-II Tavani Tiruvannamalai
39 VOP @ 90+940 Visamangalam Tiruvannamalai
40 Double Trumpet Intechange Ulagampattu Tiruvannamalai
41 VUP G-II Appedu Tiruvannamalai
42 VUP G-II Kollakaravady Tiruvannamalai
43 VOP @ 103+480 Thatchambadi Tiruvannamalai
44 VUP Athurai Tiruvannamalai
45 VUP G-II Peranambakkam Tiruvannamalai
46 VUP Analiya kambattu Tiruvannamalai
47 MJB Pathiyavadi Tiruvannamalai
48 Flyover Palliput Tiruvannamalai
49 Trumpet Interchange Palliput Tiruvannamalai
50 VUP Andapattu Tiruvannamalai
51 VUP Periya Kilambadi Tiruvannamalai
52 VUP Namminadal Koot Tiruvannamalai
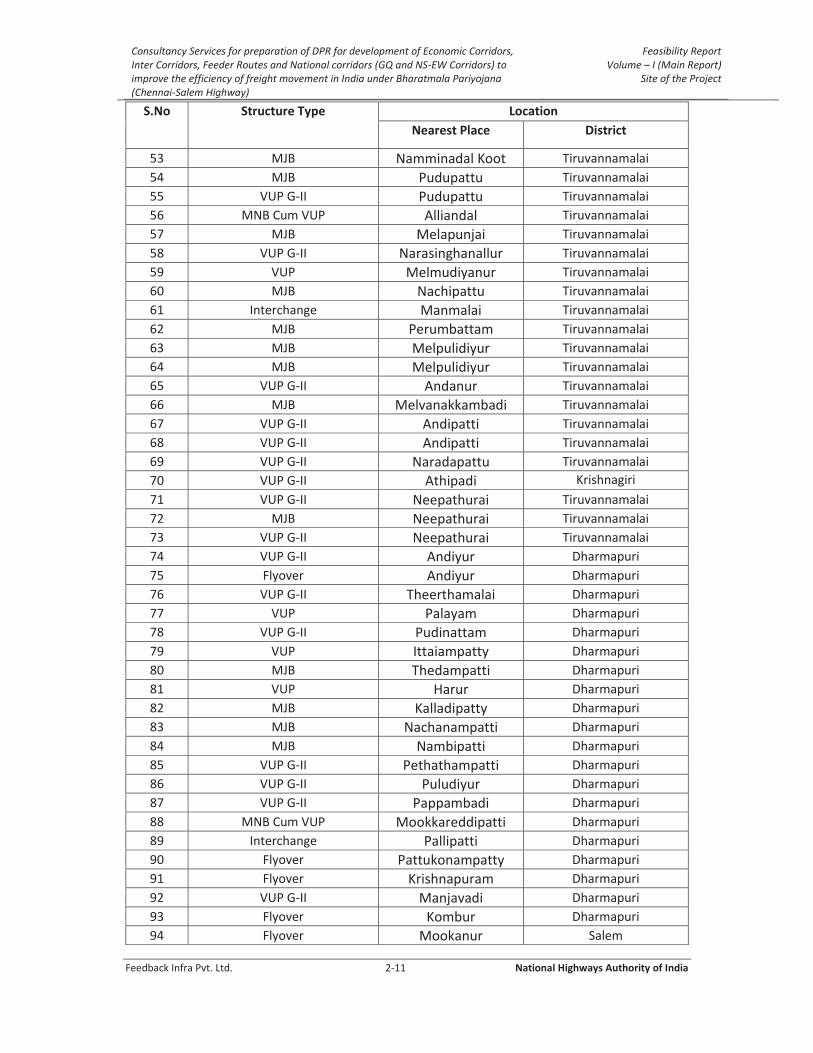
Consultancy Services for preparation of DPR for development of Economic Corridors, Inter Corridors, Feeder Routes and National corridors (GQ and NS-EW Corridors) to improve the efficiency of freight movement in India under Bharatmala Pariyojana (Chennai-Salem Highway)
Feasibility Report Volume – I (Main Report)
Site of the Project
Feedback Infra Pvt. Ltd. 2-11 National Highways Authority of India
S.No Structure Type Location Nearest Place District
53 MJB Namminadal Koot Tiruvannamalai
54 MJB Pudupattu Tiruvannamalai
55 VUP G-II Pudupattu Tiruvannamalai
56 MNB Cum VUP Alliandal Tiruvannamalai
57 MJB Melapunjai Tiruvannamalai
58 VUP G-II Narasinghanallur Tiruvannamalai
59 VUP Melmudiyanur Tiruvannamalai
60 MJB Nachipattu Tiruvannamalai
61 Interchange Manmalai Tiruvannamalai
62 MJB Perumbattam Tiruvannamalai
63 MJB Melpulidiyur Tiruvannamalai
64 MJB Melpulidiyur Tiruvannamalai
65 VUP G-II Andanur Tiruvannamalai
66 MJB Melvanakkambadi Tiruvannamalai
67 VUP G-II Andipatti Tiruvannamalai
68 VUP G-II Andipatti Tiruvannamalai
69 VUP G-II Naradapattu Tiruvannamalai
70 VUP G-II Athipadi Krishnagiri
71 VUP G-II Neepathurai Tiruvannamalai
72 MJB Neepathurai Tiruvannamalai
73 VUP G-II Neepathurai Tiruvannamalai
74 VUP G-II Andiyur Dharmapuri
75 Flyover Andiyur Dharmapuri
76 VUP G-II Theerthamalai Dharmapuri
77 VUP Palayam Dharmapuri
78 VUP G-II Pudinattam Dharmapuri
79 VUP Ittaiampatty Dharmapuri
80 MJB Thedampatti Dharmapuri
81 VUP Harur Dharmapuri
82 MJB Kalladipatty Dharmapuri
83 MJB Nachanampatti Dharmapuri
84 MJB Nambipatti Dharmapuri
85 VUP G-II Pethathampatti Dharmapuri
86 VUP G-II Puludiyur Dharmapuri
87 VUP G-II Pappambadi Dharmapuri
88 MNB Cum VUP Mookkareddipatti Dharmapuri
89 Interchange Pallipatti Dharmapuri
90 Flyover Pattukonampatty Dharmapuri
91 Flyover Krishnapuram Dharmapuri
92 VUP G-II Manjavadi Dharmapuri
93 Flyover Kombur Dharmapuri
94 Flyover Mookanur Salem

Consultancy Services for preparation of DPR for development of Economic Corridors, Inter Corridors, Feeder Routes and National corridors (GQ and NS-EW Corridors) to improve the efficiency of freight movement in India under Bharatmala Pariyojana (Chennai-Salem Highway)
Feasibility Report Volume – I (Main Report)
Site of the Project
Feedback Infra Pvt. Ltd. 2-12 National Highways Authority of India
S.No Structure Type Location Nearest Place District
95 VUP G-II Vellaiyanpatti Salem
96 Flyover Kullampatty Salem
97 VUP Minnampalli Salem
98 Cloverleaf Interchange Ramalingapuram Salem
99 VUP G-II Masiyanakampatti Salem
100 VUP G-II Masiyanakampatti Salem
101 VUP G-II Masiyanakampatti Salem
102 VUP G-II Masiyanakampatti Salem
103 Double Trumpet Intechange Gajallanickenpatti Salem
104 MJB Nalikalpatti Salem
105 Trumpet Interchange Ariyanur Salem
Consultancy services for Preparation of Detailed Project Report of Economic Corridors, Inter Corridors, Feeder routes and National Corridors under Bharatmala Pariyojana (Lot-6/Package -1)
Feasibility Report Volume – I (Main Report)
Social Economic Profile
Feedback Infra Pvt. Ltd. 3-1 National Highways Authority of India
3. SOCIO-ECONOMIC PROFILE
3.1 INTRODUCTION To understand completely how the growth of traffic and demand for transport infrastructure is dependent on the region’s available resources, human and natural, the social and economic distribution, the gross output, the growth potential, a study of socioeconomic profile is essential. For a region a close inter-relation exists between the socio economic activity and transport infrastructure. The region’s development is completely governed by these two components and how they complement each other.
This chapter endeavours to provide socio-economic profile at two levels i) Region or State level and ii) Project Influence Area. Socio-economic and demographic data of the project area – population & density, employment, poverty levels, industry, agriculture, literacy, health, transport, tourism potential and related aspects. Socio- economic profile has been prepared to provide a quantitative framework against which qualitative socio and economic impacts of any of the development initiative can be assessed and evaluated.
3.2 BACKGROUND
The socio economic profile helps in making project implementation decisions. A survey of historical economic and demographic activity can help to explain current social status distribution among the society, the living standards, the quality of life, the general awareness, maturity levels, in turn the reflection on the growth of traffic etc.
An understanding of the past and current industrialization, for example, could help to explain the presence and contemporary value of the dams that obstruct fish passage, the types of contaminants that are likely to be present behind those dams, and the economic and political pressures that may promote or inhibit their removal or modification, which decide the investing potential in the region.
The socio-economic profile is discussed in terms of a few selected indicators, which are broadly categorized in to the following and hence together are termed as Socio Economic Indicators.
Socio and Demographic Indicators Social indicators are set of indicators that measure progress towards the policy objectives designed for promoting employment, combating poverty, improving living and working conditions, combating exclusion, developing human resources, etc. Demographic Indicators are a scientific measure of human population dynamics. It encompasses the study of the size, structure and distribution of populations, and how populations change over time due to births, deaths, migration and ageing.
A list of socio and demographic indicators considered for this report is as under:
Population
Male/Female Ratio
Health
Household
Literacy
Poverty
Employment

Consultancy services for Preparation of Detailed Project Report of Economic Corridors, Inter Corridors, Feeder routes and National Corridors under Bharatmala Pariyojana (Lot-6/Package -1)
Feasibility Report Volume – I (Main Report)
Social Economic Profile
Feedback Infra Pvt. Ltd. 3-2 National Highways Authority of India
Economic Indicators An economic indicator is simply any economic statistic, which indicates how well the economy is doing and how well the economy is going to do in the future. To understand economic indicators, we must understand the ways in which economic indicators differ. Alternatively statistics, which indicates current economic growth rates and trends such as retail sales and employment. Economic indicators allow analysis of economic performance and predictions of future performance.
Gross Domestic Product (GDP)
Net State Domestic Product (NSDP)
Per Capita Income
Agriculture & Irrigation
Industry
Transportation 3.3 PROJECT BACKGROUND
The Government of India has decided to develop Economic Corridors, Inter Corridors, Feeder Corridors and National Corridors (GQ and NS-EW Corridors) to improve the efficiency of Freight Movements in India under Bharatmala Pariyojana. The National Highways Authority of India (NHAI) has appointed M/s. Feedback Infra Pvt. Ltd. for providing the required Consultancy services for preparation of Detailed Project Report for 5 such corridors under LOT 6//Package 1, in Tamilnadu State. Originally 5 corridors, as listed below, were included in the project, which were subsequently modified as below
Classification Corridor
Name Road State
Stretch Name
(Start – End)
Original length (Km)
Revised Length (Km)
Changes Suggested
Economic Corridor
Chennai - Madurai
NH - 132
TN Tindivanam -
Trichy 205 253
The original 6 lane widening of existing
road proposal changed to Chennai – Tiruvannmalai – Harur
Salem Greenfield Highway.
Economic Corridor
Chennai - Madurai
NH -32
TN Maduravoyal - Tambaram
19 0 Road not to be
considered now
Economic Corridor
Chennai - Madurai
NH - 38
TN Tovarankurchi - Madurai
64 27
The road to be changed to
Tovarankurichi – Natham (27 km) for
development of 4 lane facility
Economic Corridor
Mumbai - Kanyakum
ari
NH - 66
TN Padmanavan
- Kanyakumari
31 0 Road not to be
considered now
Inter Corridor
Coimbatore – Trichy
- Tanjavore
NH - 83
TN Tanjavur -
Trichy 56 56 No change
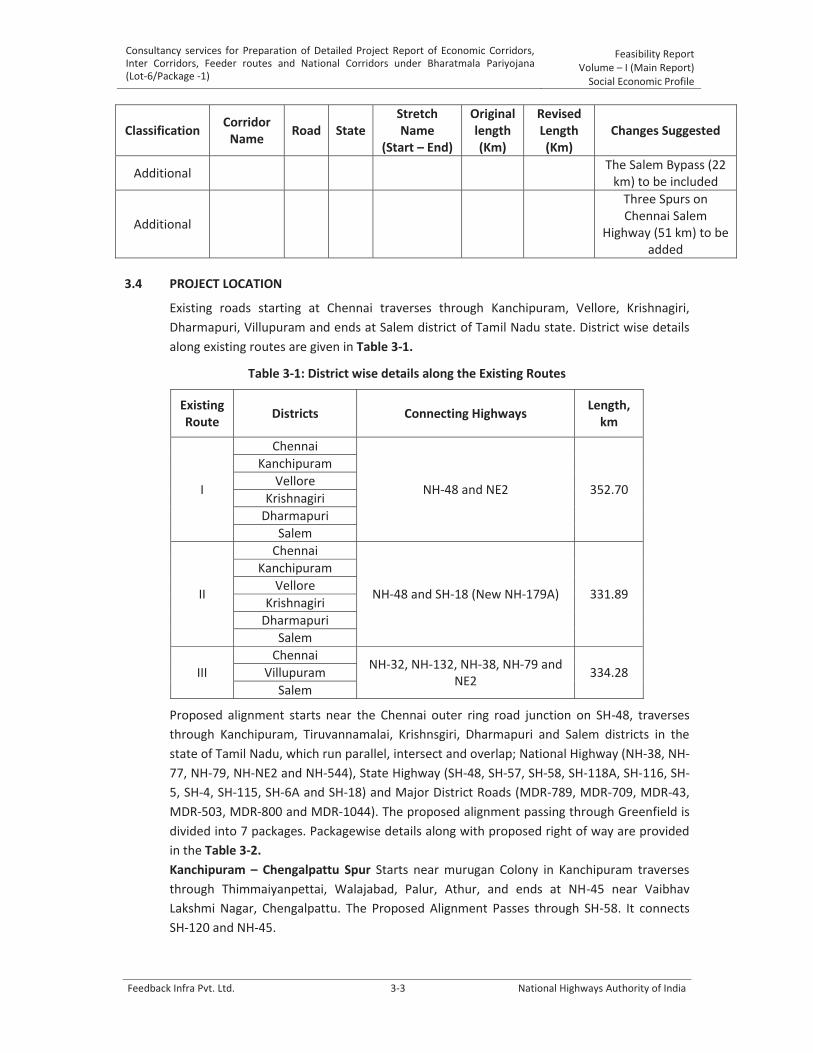
Consultancy services for Preparation of Detailed Project Report of Economic Corridors, Inter Corridors, Feeder routes and National Corridors under Bharatmala Pariyojana (Lot-6/Package -1)
Feasibility Report Volume – I (Main Report)
Social Economic Profile
Feedback Infra Pvt. Ltd. 3-3 National Highways Authority of India
Classification Corridor
Name Road State
Stretch Name
(Start – End)
Original length (Km)
Revised Length (Km)
Changes Suggested
Additional The Salem Bypass (22
km) to be included
Additional
Three Spurs on Chennai Salem
Highway (51 km) to be added
3.4 PROJECT LOCATION
Existing roads starting at Chennai traverses through Kanchipuram, Vellore, Krishnagiri,
Dharmapuri, Villupuram and ends at Salem district of Tamil Nadu state. District wise details
along existing routes are given in Table 3-1.
Table 3-1: District wise details along the Existing Routes
Existing Route
Districts Connecting Highways Length,
km
I
Chennai
NH-48 and NE2 352.70
Kanchipuram
Vellore
Krishnagiri
Dharmapuri
Salem
II
Chennai
NH-48 and SH-18 (New NH-179A) 331.89
Kanchipuram
Vellore
Krishnagiri
Dharmapuri
Salem
III
Chennai NH-32, NH-132, NH-38, NH-79 and
NE2 334.28 Villupuram
Salem
Proposed alignment starts near the Chennai outer ring road junction on SH-48, traverses
through Kanchipuram, Tiruvannamalai, Krishnsgiri, Dharmapuri and Salem districts in the
state of Tamil Nadu, which run parallel, intersect and overlap; National Highway (NH-38, NH-
77, NH-79, NH-NE2 and NH-544), State Highway (SH-48, SH-57, SH-58, SH-118A, SH-116, SH-
5, SH-4, SH-115, SH-6A and SH-18) and Major District Roads (MDR-789, MDR-709, MDR-43,
MDR-503, MDR-800 and MDR-1044). The proposed alignment passing through Greenfield is
divided into 7 packages. Packagewise details along with proposed right of way are provided
in the Table 3-2.
Kanchipuram – Chengalpattu Spur Starts near murugan Colony in Kanchipuram traverses
through Thimmaiyanpettai, Walajabad, Palur, Athur, and ends at NH-45 near Vaibhav
Lakshmi Nagar, Chengalpattu. The Proposed Alignment Passes through SH-58. It connects
SH-120 and NH-45.
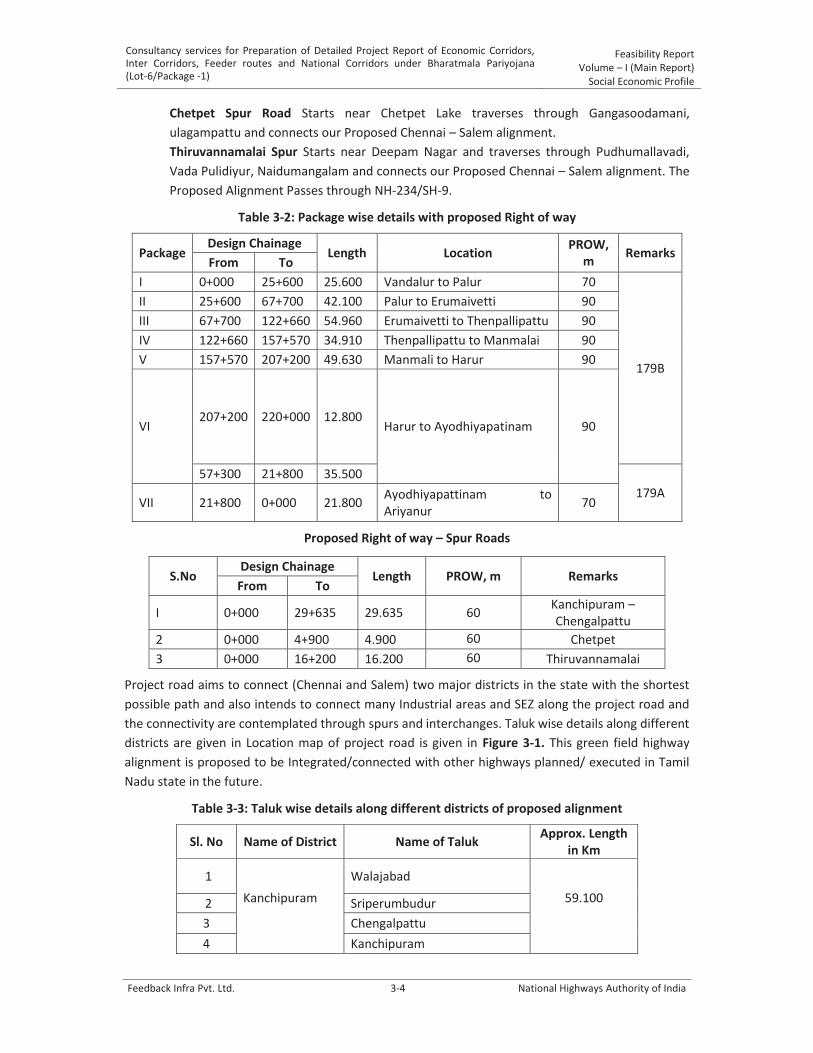
Consultancy services for Preparation of Detailed Project Report of Economic Corridors, Inter Corridors, Feeder routes and National Corridors under Bharatmala Pariyojana (Lot-6/Package -1)
Feasibility Report Volume – I (Main Report)
Social Economic Profile
Feedback Infra Pvt. Ltd. 3-4 National Highways Authority of India
Chetpet Spur Road Starts near Chetpet Lake traverses through Gangasoodamani,
ulagampattu and connects our Proposed Chennai – Salem alignment.
Thiruvannamalai Spur Starts near Deepam Nagar and traverses through Pudhumallavadi,
Vada Pulidiyur, Naidumangalam and connects our Proposed Chennai – Salem alignment. The
Proposed Alignment Passes through NH-234/SH-9.
Table 3-2: Package wise details with proposed Right of way
Package Design Chainage
Length Location PROW,
m Remarks
From To
I 0+000 25+600 25.600 Vandalur to Palur 70
179B
II 25+600 67+700 42.100 Palur to Erumaivetti 90
III 67+700 122+660 54.960 Erumaivetti to Thenpallipattu 90
IV 122+660 157+570 34.910 Thenpallipattu to Manmalai 90
V 157+570 207+200 49.630 Manmali to Harur 90
VI 207+200 220+000 12.800
Harur to Ayodhiyapatinam 90
57+300 21+800 35.500
179A VII 21+800 0+000 21.800
Ayodhiyapattinam to Ariyanur
70
Proposed Right of way – Spur Roads
S.No Design Chainage
Length PROW, m Remarks From To
I 0+000 29+635 29.635 60 Kanchipuram – Chengalpattu
2 0+000 4+900 4.900 60 Chetpet
3 0+000 16+200 16.200 60 Thiruvannamalai
Project road aims to connect (Chennai and Salem) two major districts in the state with the shortest
possible path and also intends to connect many Industrial areas and SEZ along the project road and
the connectivity are contemplated through spurs and interchanges. Taluk wise details along different
districts are given in Location map of project road is given in Figure 3-1. This green field highway
alignment is proposed to be Integrated/connected with other highways planned/ executed in Tamil
Nadu state in the future.
Table 3-3: Taluk wise details along different districts of proposed alignment
Sl. No Name of District Name of Taluk Approx. Length
in Km
1
Kanchipuram
Walajabad
59.100
2 Sriperumbudur
3 Chengalpattu
4 Kanchipuram

Consultancy services for Preparation of Detailed Project Report of Economic Corridors, Inter Corridors, Feeder routes and National Corridors under Bharatmala Pariyojana (Lot-6/Package -1)
Feasibility Report Volume – I (Main Report)
Social Economic Profile
Feedback Infra Pvt. Ltd. 3-5 National Highways Authority of India
Sl. No Name of District Name of Taluk Approx. Length
in Km
5 Uthiramerur
6
Tiruvannamalai
Tiruvannamalai
Cheyyaru
123.900
7 Vandavasi
8 Polur
9 Arani
10 Tiruvannamalai
11
12 Chetpet
13 Kalasapakkam
14 Chengam
15 Krishnagiri Uttangarai 2.000
16 Dharmapuri
Harur 56.000
17 Papireddipatty
18
Salem
Yercadu
36.300 19 Valappadi
20 Salem south
21 Salem
Total Length, Km 277.300
Figure 3-1: Location Map of Project Road

Consultancy services for Preparation of Detailed Project Report of Economic Corridors, Inter Corridors, Feeder routes and National Corridors under Bharatmala Pariyojana (Lot-6/Package -1)
Feasibility Report Volume – I (Main Report)
Social Economic Profile
Feedback Infra Pvt. Ltd. 3-6 National Highways Authority of India
Methodology The socio economic characteristics of the PIA as indicated above have been examined through a preliminary socio economic survey. The base data required was collected from numerous agencies and referring the various literature available from the Directorate of Economics and Statistics and official government websites. All statistics used to study the past economic performance of the PIA are based on secondary official sources of information. As the social surveys are being conducted the profile is limited to state level and of immediate PIA is submitted with the Final Feasibility Report.
3.5 SOCIAL AND DEMOGRAPHIC PROFILE OF TAMILNADU General History
Tamil Nadu (literally The Land of Tamils or Tamil Country) is one of the 29 states of India. Chennai (formerly known as Madras), capital city of the state is the largest city. Tamil Nadu is a land most known for its monumental ancient Hindu temples and classical form of dance Bharata Natyam. Tamil Nadu lies in the southernmost part of the Indian Peninsula and is bordered by the union territory of Puducherry and the states of Kerala, Karnataka, and Andhra Pradesh. It is bounded by the Eastern Ghats on the north by the Nilgiri, the Anamalai Hills and Kerala on the west, by the Bay of Bengal in the east, by the Gulf of Mannar and the Palk Strait on the southeast, and by the Indian Ocean on the south.
Tamil Nadu is the eleventh largest state in India by area and the seventh most populous state in India. It is the second largest state economy in India as of 2012. The state ranked 6th among states in India according to the Human Development Index as of 2011. The state has the highest number (10.56 per cent) of business enterprises and stands second in total employment (9.97 per cent) in India, compared to the population share of about 6 per cent. In the 2013 Raghuram Rajan panel report, Tamil Nadu was ranked as the third most developed state in India based on a "Multidimensional Development Index".
The region has been the home of the Tamil people since at least 1500 BC. Its official language is Tamil, which holds a status of being a classical language. Tamil has been in use in inscriptions and literature for over 2500 years. Mythical traditions dictate that Lord Shiva himself taught sage Agastya this language. Sage Agastya is considered to be the father of Tamil literature and compiled the first Tamil grammar called Agathiyam, but the scripts of Agathiyam no longer exist. It is believed that he lived in the 6th or 7th century BC and specialized in language, alchemy, medicine and spirituality (yogam and gnanam). There are 96 books in the name of Agathiyar. Tamil Nadu is home to many natural resources, classical arts, classical music, classical literature, Hindu temples of Dravidian architecture, hill stations, beach resorts, multi-religious pilgrimage sites, and eight UNESCO World Heritage Sites.
Tamil Nadu has performed reasonably well in terms of literacy growth during previous decades. The state's literacy rate increased from 62.66% in 1991 to 73.47% in 2001 which is above the national average.
India has a human development index calculated as 0.619, while the corresponding figure for Tamil Nadu is 0.736, placing it among the top states in the country. The life expectancy at birth for males is 65.2 years and for females it is 67.6 years.
Consultancy services for Preparation of Detailed Project Report of Economic Corridors, Inter Corridors, Feeder routes and National Corridors under Bharatmala Pariyojana (Lot-6/Package -1)
Feasibility Report Volume – I (Main Report)
Social Economic Profile
Feedback Infra Pvt. Ltd. 3-7 National Highways Authority of India
3.6 ECONOMIC PROFILE Net State Domestic Product (NSDP)
Tamil Nadu’s gross state domestic product for 2007 is estimated at 275,000 in current prices. The state experienced a GSDP growth rate of 12.1% for this period. Possessing the third largest economy (2007-2008) among states in India, Tamil Nadu is also the most industrialised state in India. The per capita income for the period 2007 - 2008 for the state was Rs. 43,000 ranking second among the South Indian states. It ranks third in foreign direct investment approvals (cumulative 1991-2002) of Rs.225,826 million ($5,000 million), next only to Maharashtra (Rs.366,024 million ($8,100 million)) and Delhi (Rs.303,038 million ($6,700 million)) and the State's FDI investment constitutes 9.12% of the total FDI in the country.
According to the 2001 Census, Tamil Nadu has the highest level of urbanisation (43.86%) in India, accounting for 6% of India’s total population and 9.6% of the urban population and is the most urbanized state in India. Service sector contributes 45% of the economic activity in the state, followed by manufacturing at 34% and agriculture at 21%. Government is the major investor in the state with 51% of total investments, followed by private Indian investors at 29.9% and foreign private investors at 14.9%.
Annual Plan outlays have increased by a record 75% from Rs.52,000 million ($1,100 million) in 2001-2 to Rs.91,000 million ($2,000 million) in 2005-6. Based on URP - Consumption for the period 2004 - 2005, percentage of the state's population Below Poverty Line was 27.5%.
Tamil Nadu lies in the southernmost part of the Indian Peninsula and is bordered by the union territory of Puducherry and the South Indian states of Kerala, Karnataka, and Andhra Pradesh. It is bounded by the Eastern Ghats on the north, by the Nilgiri, the Anamalai Hills, and Kerala on the west, by the Bay of Bengal in the east, by the Gulf of Mannar and the Palk Strait on the southeast, and by the Indian Ocean on the south. It also shares a maritime border with the nation of Sri Lanka.
Tamil Nadu covers an area of 130,058 sq.km and is the eleventh largest state in India. The bordering states are Kerala to the west, Karnataka to the north west and Andhra Pradesh to the north. To the east is the Bay of Bengal and the state encircles the union territory of Puducherry. The southernmost tip of the Indian Peninsula is Kanyakumari which is the meeting point of the Arabian Sea, the Bay of Bengal, and the Indian Ocean.
The western, southern and the north western parts are hilly and rich in vegetation. The Western Ghats and the Eastern Ghats meet at the Nilgiri hills. The Western Ghats traverse the entire western border with Kerala, effectively blocking much of the rain bearing clouds of the south west monsoon from entering the state. The eastern parts are fertile coastal plains and the northern parts are a mix of hills and plains. The central and the south central regions are arid plains and receive less rainfall than the other regions. Tamil Nadu has a coastline of about 1,076 km which is the country's second longest coastline.
Tamil Nadu is the seventh most populous state in India. 48.4 per cent of the state's population live in urban areas, the highest among large states in India. At the 2011 India census, Tamil Nadu had a population of 72,147,030.
Tamil Nadu is mostly dependent on monsoon rains, and thereby is prone to droughts when the monsoons fail. The climate of the state ranges from dry sub-humid to semi-arid. The state has two distinct periods of rainfall: south west monsoon from June to September, with strong southwest winds; North east monsoon from October to December, with dominant north east winds;
The annual rainfall of the state is about 945 mm of which 48 per cent is through the north east
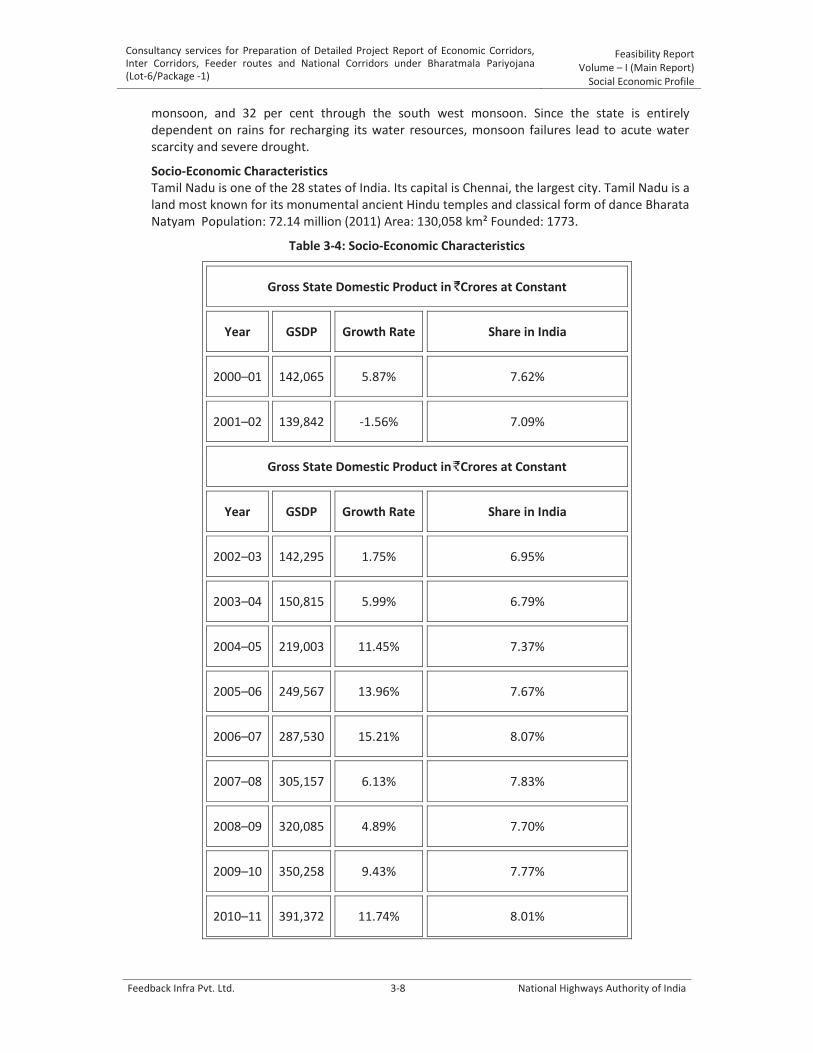
Consultancy services for Preparation of Detailed Project Report of Economic Corridors, Inter Corridors, Feeder routes and National Corridors under Bharatmala Pariyojana (Lot-6/Package -1)
Feasibility Report Volume – I (Main Report)
Social Economic Profile
Feedback Infra Pvt. Ltd. 3-8 National Highways Authority of India
monsoon, and 32 per cent through the south west monsoon. Since the state is entirely dependent on rains for recharging its water resources, monsoon failures lead to acute water scarcity and severe drought.
Socio-Economic Characteristics Tamil Nadu is one of the 28 states of India. Its capital is Chennai, the largest city. Tamil Nadu is a land most known for its monumental ancient Hindu temples and classical form of dance Bharata Natyam Population: 72.14 million (2011) Area: 130,058 km² Founded: 1773.
Table 3-4: Socio-Economic Characteristics
Gross State Domestic Product in Crores at Constant
Year GSDP Growth Rate Share in India
2000–01 142,065 5.87% 7.62%
2001–02 139,842 -1.56% 7.09%
Gross State Domestic Product in Crores at Constant
Year GSDP Growth Rate Share in India
2002–03 142,295 1.75% 6.95%
2003–04 150,815 5.99% 6.79%
2004–05 219,003 11.45% 7.37%
2005–06 249,567 13.96% 7.67%
2006–07 287,530 15.21% 8.07%
2007–08 305,157 6.13% 7.83%
2008–09 320,085 4.89% 7.70%
2009–10 350,258 9.43% 7.77%
2010–11 391,372 11.74% 8.01%

Consultancy services for Preparation of Detailed Project Report of Economic Corridors, Inter Corridors, Feeder routes and National Corridors under Bharatmala Pariyojana (Lot-6/Package -1)
Feasibility Report Volume – I (Main Report)
Social Economic Profile
Feedback Infra Pvt. Ltd. 3-9 National Highways Authority of India
According to the 2011 Census, Tamil Nadu is the most urbanised state in India (49 per cent), accounting for 9.6 per cent of the urban population while only comprising 6 per cent of India’s total population and is the most urbanised state in India.CITEREFThe_Hindu18_May_2008 Services contributes to 45 per cent of the economic activity in the state, followed by manufacturing at 34 per cent and agriculture at 21 per cent. Government is the major investor in the state with 51 per cent of total investments, followed by private Indian investors at 29.9 per cent and foreign private investors at 14.9 per cent. Tamil Nadu has a network of about 113 industrial parks and estates offering developed plots with supporting infrastructure.
According to the publications of the Tamil Nadu government the Gross State Domestic Product at Constant Prices (Base year 2004–2005) for the year 2011–2012 is 428,109 crores, an increase of 9.39 per cent over the previous year. The per capita income at current price is 72,993.
Table 3-5: Districts of Tamil Nadu
District Headquarters Area
Population (2011)
Population density
1 Ariyalur Ariyalur 1,944 km³ 752,481 387 /km²
2 Chennai Chennai 174 km² 4,681,087 26,903 /km²
3 Coimbatore Coimbatore 4,642 km² 3,172,578 648 /km²
4 Cuddalore Cuddalore 3,705 km² 2,600,880 702 /km²
5 Dharmapuri Dharmapuri 4,527 km² 1,502,900 332 /km²
6 Dindigul Dindigul 6,054 km² 2,161,367 357 /km²
7 Erode Erode 5,692 km² 2,259,608 397 /km²
8 Kanchipuram Kanchipuram 4,305 km² 2,690,897 666 /km²
9 Kanyakumari Nagercoil 1,685 km² 1,863,174 1,106 /km²
10 Karur Karur 2,902 km² 1,076,588 371 /km²
11 Krishnagiri Krishnagiri 5,091 km² 1,883,731 370 /km²
12 Madurai Madurai 3,695 km² 2,441,038 663 /km²
13 Nagapattinam Nagapattinam 2,416 km² 1,614,069 668 /km²
14 Namakkal Namakkal 3,402 km² 1,721,179 506 /km²
15 Nilgiris Udagamandalam 2,552 km² 735,071 288 /km²
16 Perambalur Perambalur 1,748 km² 564,511 323 /km²
17 Pudukkottai Pudukkottai 4,652 km² 1,618,725 348 /km²
18 Ramanathapuram Ramanathapuram 4,180 km² 1,337,560 320 /km²
19 Salem Salem 5,249 km² 3,480,008 663 /km²
20 Sivaganga Sivaganga 4,140 km² 1,341,250 324 /km²
21 Thanjavur Thanjavur 3,477 km² 2,302,781 661 /km²
22 Theni Theni 2,872 km² 1,143,684 397 /km²
23 Thoothukudi Thoothukudi 4,599 km² 1,738,376 378 /km²
24 Tiruchirappalli Tiruchirappalli 4,508 km² 2,713,858 602 /km²
2011–12 428,109 9.39% 8.20%
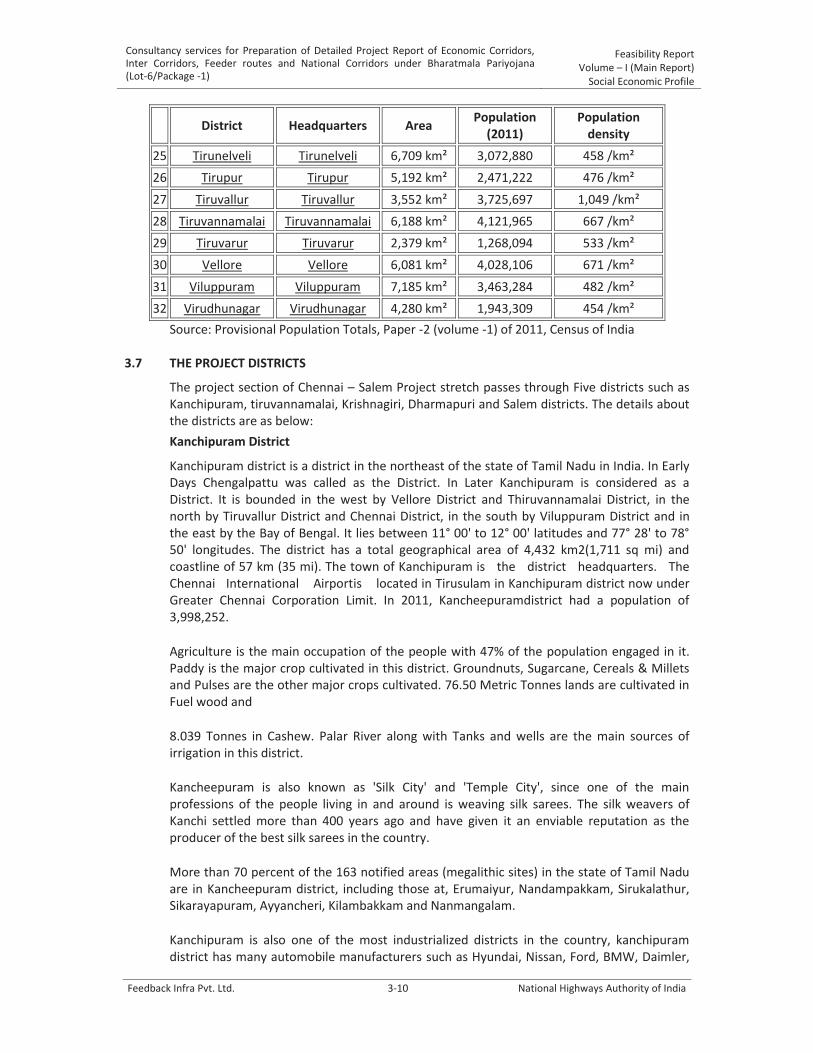
Consultancy services for Preparation of Detailed Project Report of Economic Corridors, Inter Corridors, Feeder routes and National Corridors under Bharatmala Pariyojana (Lot-6/Package -1)
Feasibility Report Volume – I (Main Report)
Social Economic Profile
Feedback Infra Pvt. Ltd. 3-10 National Highways Authority of India
District Headquarters Area
Population (2011)
Population density
25 Tirunelveli Tirunelveli 6,709 km² 3,072,880 458 /km²
26 Tirupur Tirupur 5,192 km² 2,471,222 476 /km²
27 Tiruvallur Tiruvallur 3,552 km² 3,725,697 1,049 /km²
28 Tiruvannamalai Tiruvannamalai 6,188 km² 4,121,965 667 /km²
29 Tiruvarur Tiruvarur 2,379 km² 1,268,094 533 /km²
30 Vellore Vellore 6,081 km² 4,028,106 671 /km²
31 Viluppuram Viluppuram 7,185 km² 3,463,284 482 /km²
32 Virudhunagar Virudhunagar 4,280 km² 1,943,309 454 /km²
Source: Provisional Population Totals, Paper -2 (volume -1) of 2011, Census of India 3.7 THE PROJECT DISTRICTS
The project section of Chennai – Salem Project stretch passes through Five districts such as Kanchipuram, tiruvannamalai, Krishnagiri, Dharmapuri and Salem districts. The details about the districts are as below:
Kanchipuram District
Kanchipuram district is a district in the northeast of the state of Tamil Nadu in India. In Early Days Chengalpattu was called as the District. In Later Kanchipuram is considered as a District. It is bounded in the west by Vellore District and Thiruvannamalai District, in the north by Tiruvallur District and Chennai District, in the south by Viluppuram District and in the east by the Bay of Bengal. It lies between 11° 00' to 12° 00' latitudes and 77° 28' to 78° 50' longitudes. The district has a total geographical area of 4,432 km2(1,711 sq mi) and coastline of 57 km (35 mi). The town of Kanchipuram is the district headquarters. The Chennai International Airportis located in Tirusulam in Kanchipuram district now under Greater Chennai Corporation Limit. In 2011, Kancheepuramdistrict had a population of 3,998,252.
Agriculture is the main occupation of the people with 47% of the population engaged in it. Paddy is the major crop cultivated in this district. Groundnuts, Sugarcane, Cereals & Millets and Pulses are the other major crops cultivated. 76.50 Metric Tonnes lands are cultivated in Fuel wood and
8.039 Tonnes in Cashew. Palar River along with Tanks and wells are the main sources of irrigation in this district.
Kancheepuram is also known as 'Silk City' and 'Temple City', since one of the main professions of the people living in and around is weaving silk sarees. The silk weavers of Kanchi settled more than 400 years ago and have given it an enviable reputation as the producer of the best silk sarees in the country.
More than 70 percent of the 163 notified areas (megalithic sites) in the state of Tamil Nadu are in Kancheepuram district, including those at, Erumaiyur, Nandampakkam, Sirukalathur, Sikarayapuram, Ayyancheri, Kilambakkam and Nanmangalam.
Kanchipuram is also one of the most industrialized districts in the country, kanchipuram district has many automobile manufacturers such as Hyundai, Nissan, Ford, BMW, Daimler,
Consultancy services for Preparation of Detailed Project Report of Economic Corridors, Inter Corridors, Feeder routes and National Corridors under Bharatmala Pariyojana (Lot-6/Package -1)
Feasibility Report Volume – I (Main Report)
Social Economic Profile
Feedback Infra Pvt. Ltd. 3-11 National Highways Authority of India
Yamaha etc. thanks to its proximity to the state capital Chennai. Areas surrounding Sriperumbudur have turned out to become one of the largest manufacturing hubs of India. The district is home to the manufacturing units of Hyundai, Ford, Mitsubishi, Nokia, Samsung, Dell, Saint Gobain, etc. The district is also at the center of the Information Technology boom in India. Many multinational IT companies like Tata Consultancy Services (TCS), Infosys, Wipro Technologies, Cognizant Technology Solutions, etc. have set up their offices in Kanchipuram district. TCS and Infosys have built huge offices with capacities of 22,000 and 25,000 employees, respectively.
Tiruvannamalai district
Tiruvannamalai District (also known as Thiruvannaamalai) is one of the districts in the state of Tamil Nadu, in South India. It was formed in the year 1989 from non-existing North Arcot District as Tiruvannamalai Sambuvarayar and Vellore Ambedkar. Tiruvannamalai town is the district headquarters. The district is divided into 12 Taluks - Aarani, Chengam, Tiruvannamalai, Polur, Thandarampattu,Vandavasi, kalasapakkam, chetpet , Cheyyar and vembakk am . Arani is famous for silk sarees. As of 2011, the district had a population of 4,164,875 with a sex-ratio of 994 females for every 1,000 males.
According to 2011 census, Tiruvannamalai District had a population of 2,464,875 with a sex-ratio of 994 females for every 1,000 males, much above the national average of 929. A total of 272,569 were under the age of six, constituting 141,205 males and 131,364 females. Scheduled Castes and Scheduled Tribes accounted for 22.94% and 3.69% of the population respectively. The average literacy of the district was 66%, compared to the national average of 72.99%. The district had a total of 588,836 households. There were a total of 1,238,177 workers, comprising 265,183 cultivators, 351,310 main agricultural labourers, 37,020 in house hold industries, 316,559 other workers, 268,105 marginal workers, 27,458 marginal cultivators, 173,753 marginal agricultural labourers, 9,700 marginal workers in household industries and 57,194 other marginal workers.
Tiruvannamalai District has an area of 6,191 km2. It is bounded on the north by Vellore District, on the east by Kanchipuram District, on the south by Villupuram District, and on the west by Dharmapuri and Krishnagiri districts.
In the District Arani and Thiruvannamalai regions are highest revenue generations regions respectievely.In 2006 the Ministry of Panchayati Raj named Tiruvannamalai one of the country's 250 most backward districts (out of a total of 640). It is one of the six districts in Tamil Nadu currently receiving funds from the Backward Regions Grant Fund Programme (BRGF).
Tiruvannamalai District is known for its two major businesses, agriculture and silk saree weaving. Rice cultivation and processing is one of the biggest businesses in this district. 112013 hectares of paddy cultivation is irrigated by 1965 lakes and 18 reservoirs and small dams. It has 18 regulated markets through which the farmers sell their agri products directly to the government. Through these regulated markets, 271411 metric tonnes of paddy harvested in 2007. There are lots of rice mills to process paddy found throughout the district. The modern rice mill near Cheyyar is the biggest government owned mill and Arani has around 278 rice mills. Kalambur is also has around 20 Rice mills and known for variety of rice called Kalambur Ponni rice.

Consultancy services for Preparation of Detailed Project Report of Economic Corridors, Inter Corridors, Feeder routes and National Corridors under Bharatmala Pariyojana (Lot-6/Package -1)
Feasibility Report Volume – I (Main Report)
Social Economic Profile
Feedback Infra Pvt. Ltd. 3-12 National Highways Authority of India
The district has a large populace of weavers who are specialize in making Silk sarees. Hand looms are often engaged for weaving, although recently some have turned to mechanized methods of using Power looms. Arani taluk contributes high percent of Silk weaving. Arani is the most important revenue earning town in the district. Though the town is not popular off the state, a bulk of India's Silk apparels is produced by the people of Arani.
The district started to industrialize following the establishment of the industrial complex near Cheyyar by the State Industries Promotion Corporation of Tamil Nadu (SIPCOT). This is evidenced by the recent announcements of a 250-acre (1.0 km2) hi-tech Special Economic Zone for automative components, a 300-acre (1.2 km2) electronics hardware park and the commitment from the Taiwanese Shoe Company to set up its unit. In November 2009 the Tamil Nadu cabinet approved the Mahindara & Mahindra's Rs 1800 core automobile project in 450 acres. This unit will produce tractors, SUVs and commercial vehicles and auto parts. Aluminum die cast unit by Ashley Alteams, a joint venture by Ashok Leyland and Finland-based Alteams Oy started its production in January 2010. This High pressure die cast will manufacture automobile and telecommunication components with initial capacity of 7000 ton per year. One of the largest sugar mills in the country - Cheyyar co-operative sugars - is situated near Cheyyar.
Since Tiruvannamalai District has its capital at Tiruvannamalai City, there are many factories around Tiruvannamalai. Scent factories are large in number due to the high production of flowers around Tiruvannamalai. They are listed as follows: 1. Hindusthan house hold factories, 2. Sarala birla factory of aroma oil, 3. Parthiban cottages aroma oil factory. The Tamil Nadu government is planning for a SIPCOT at naidumangalam and kilpennathur both near Tiruvannamalai. Arani has the factories related to Rice and Silk with in the town and in the Taluk area. As well, there are few other mills near Arani, such as Lakshmi Saraswathi Cotton mills Arni Pvt Ltd and some Engineering Industries.
Krishnagiri District
Krishnagiri district is a district in the western part of the state of Tamil Nadu, in India. This district is carved out from Dharmapuri District by 2004. The municipal town of Krishnagiri is the district headquarters. In Tamil NaduKrishnagiri district was formed as the 30th district of Tamil Nadu on February 9, 2004. Krishnagiri District was formed by carving out five taluks and ten blocks of the erstwhile Dharmapuri district. The first collector of Krishnagiri was Mangat Ram Sharma
A district collector heads the district administration. Krishnagiri district is divided into two divisions and five taluks for the purpose of revenue administration. Revenue Divisional Officer heads the divisions and Tahsildar is the head of taluk level administration. Development administration in this district is coordinated by the panchayats (also called as blocks) for the rural areas. There are about ten panchayat unions, seven town panchayats, 352 village Panchayats and 874 revenue villages in this district. Krishnagiri district comprises two revenue divisions Krishnagiri and Hosur. There are seven taluks: Krishnagiri, Hosur, Pochampalli, Uthangarai, Shoolagiri, Bargur and Denkanikottai. There are 12 panchayat unions: Kelamangalam, Thalli, Anchetti, Krishnagiri, Shoolagiri, Vepanapalli, Hosur, Kaveripattinam, Pochampalli, Mathur and Uthangarai.
According to the 2011 census, Krishnagiri district had a population of 1,879,809 with a sex-ratio of 963 females for every 1,000 males, much above the national average of 929. A total of 217,323 were under the age of six, constituting 112,832 males and 104,491 females. Scheduled Castes and Scheduled Tribes accounted for 14.22% and 1.19% of the population

Consultancy services for Preparation of Detailed Project Report of Economic Corridors, Inter Corridors, Feeder routes and National Corridors under Bharatmala Pariyojana (Lot-6/Package -1)
Feasibility Report Volume – I (Main Report)
Social Economic Profile
Feedback Infra Pvt. Ltd. 3-13 National Highways Authority of India
respectively. The average literacy of the district was 63.2%, compared to the national average of 72.99%.The district had a total of 448,053 households. There were a total of 877,779 workers, comprising 218,600 cultivators, 197,369 main agricultural labourers, 15,237 in house hold industries, 310,795 other workers, 135,778 marginal workers, 17,438 marginal cultivators, 65,959 marginal agricultural labourers, 6,681 marginal workers in household industries and 45,700 other marginal workers.
The State industrial Promotion Corporation of Tamil Nadu, (SIPCOT) has developed one of the largest industrial complexes in the country in Hosur in over an area of 1370 acres and to develop Large/Medium/Small industries with SIDCO offering comprehensive services for more than 500 industries.
The industries in Hosur are the source of raising the standard of living of people in Krishnagiri district. It is producing goods varying from Pin to Aeroplance. The credit goes to the good climate, incentives and inspiration provided by the State government and Central government. It is at an altitude of 10000m from mean sea level. It is very near to Bangalore, the capital of Karnataka. Industries of various kinds such as electrical, electronic, automobile, chemical, iron & steel are flourishing because of the favorable conditions and infrastructure availability. Information technology has a great scup for investment because of the proximity of Bangalore.
Several industrialist of repute have started their units in Hosur. Hosur has been able to attract some of the most prestigious industrial houses in the country including the Tatas, The Birlas, the Hindujas, TVS group companies, Murugappa group of companies, Lakshmi group and also a number of MNC’s. Hosur Industrial area is consists of about 700 industries comprising of Large, Medium, Small and tiny industries. The location of these industries are SIPCOT phase I & II, SIDCO industrial estates, SIDCO electronic industrial estate and the outside industries are scattered in private lands within 20 Kms radius of Hosur towards Krishnagiri, Royakottai & Thalli Roads and few major industries in Harita, Bagalur, Belagondapalli, Thorapalli and other areas.
The units located at Hosur manufacture sophisticated products ranging from Trucks, Automobiles and Automobiles parts, Motor Cycles, Mopeds, Diesel Engines, Power shift Transmission, Castings, Forgings, Cigarettes, Watches & Jewellery, Abrasives, Hosiery knilling needles. Machineries, Aircrafts and Pharmaceuticals, Biotech textiles, Chemicals, Electronic, electrical and general engineering.
Dharmapuri district
Dharmapuri is a district in Western part of Tamil Nadu in South India. It is the first district created in Tamil Nadu after the independence of India by splitting from then Salem district on 10 October, 1965.
The other major towns in the district are Harur, Palacode, Karimangalam, Pennagaram and Pappireddipatti. Dharmapuri District is one of the major producers of mango in the state, fine quality of Granite is found in the district. It is also one of the main Sericulture belts in the state. Around 30 percent of the district area is under forest cover. Cauvery river enters into tamilnadu through this district.
The district is located between latitudes N 11 47’ and 12 33’ and longitudes E 77 02’ and 78 40’. Occupies an area of 4497.77 km² (i.e. 3.46% of Tamil Nadu) and has a population of

Consultancy services for Preparation of Detailed Project Report of Economic Corridors, Inter Corridors, Feeder routes and National Corridors under Bharatmala Pariyojana (Lot-6/Package -1)
Feasibility Report Volume – I (Main Report)
Social Economic Profile
Feedback Infra Pvt. Ltd. 3-14 National Highways Authority of India
2,856,300 (as of 2001). It is bounded on the north by Krishnagiri District, on the east by Tiruvannamalai District and Viluppuram District districts, on the south by Salem District, and on the west by Karnataka's Chamarajanagar District. The Whole district is surrounded by hills and forests. The terrain of dharmapuri is of rolling plains type. Dharmapuri is located on the geographically important area in south India.
The whole district is predominantly covered with forests. Spider valley located near Hogenakkal is home to many wild animals. The district falls in the migratory path of elephants. Man and elephant conflicts are most common in these parts. Many tribal communities depend on these forests. Vathalmalai, a mountain hamlet on top of Shervarayan hill chain has suitable conditions to cultivate coffee and jack fruit. Wild boars and spotted deers are commonly seen in Morappur and Harur forest region. Gaurs sometimes stroll near villages near Bommidi region. Thoppur ghat section has one of the scenic highways surrounded by mountains and forests. This district lies in a geography where both Western and Eastern ghats make their presence.
Dharmapuri and Krishnagiri districts account for more than 60 -70% total mango production in Tamil Nadu. It is a major producer of Ragi and saamai crops in the state. Exotic crops like dates are also being cultivated by some farmers in the areas around Ariyakulam.
Dharmapuri district shows vigorous increasing performance in literacy and education. Where by the year 2011 it secured last position in Tamil Nadu by scoring 62%, whereas by the year 2016 it showed 92% literacy by securing 12th rank in Tamil Nadu out of 32. It also shows vigorous increase in educational hubs by having colleges and school in various fields of education.
Salem district
Salem District is a district of Tamil Nadu state in southern India.Salem was the biggest district before separating Dharmapuri in Tamilnadu. The district was now separated into Dharmapuri, Krishnagiri and Namakkal as individual district .Salem district is the best location to live in India.Salem is the district headquarters and other major towns in the district include Attur,Mettur Sankagiri and Edappadi. Salem two thousand years ago is evident from the discovery of silver coins of the Greek Emperor Tiberices Claudices Nero (37-68 A.D.) in Koneripatti of Salem in 1987. It was ruled by Mazhavar kings Adhiyamaan and Valvil Ori of sangam age. It comes under Mazhanadu a vast region dated 2nd century BC. Salem was the largest district of Tamilnadu, it was bifurcated into Salem – Dharmapuri districts in 1965 and Namakkal district in 1997.
According to 2011 census, Salem district had a population of 3,482,056 with a sex-ratio of 954 females for every 1,000 males, much above the national average of 929. A total of 344,960 were under the age of six, constituting 180,002 males and 164,958 females. Scheduled Castes and Scheduled Tribes accounted for 16.67% and 3.43% of the population respectively. The average literacy of the district was 65.64%, compared to the national average of 72.99%. The district had a total of 915,967 households. There were a total of 1,694,160 workers, comprising 247,011 cultivators, 396,158 main agricultural labourers, 132,700 in house hold industries, 785,161 other workers, 133,130 marginal workers, 9,993 marginal cultivators, 58,052 marginal agricultural labourers, 8,803 marginal workers in household industries and 56,282 other marginal workers.

Consultancy services for Preparation of Detailed Project Report of Economic Corridors, Inter Corridors, Feeder routes and National Corridors under Bharatmala Pariyojana (Lot-6/Package -1)
Feasibility Report Volume – I (Main Report)
Social Economic Profile
Feedback Infra Pvt. Ltd. 3-15 National Highways Authority of India
The Salem handloom industry is one of the most ancient cottage industries and producing quality sari, dothi and angavasthram out of silk yarn and cotton yarn. In the recent past, home furnishing items are also woven, mainly for export purposes. More than 75,000 handlooms are working and the total value of cloth produced per annum is estimated at Rs. 5,000 crores. With more than 125 spinning mills, with modern weaving units and garment units Salem established itself as one of the major textile center in Tamil Nadu .The history of handloom and spinning mills dates back to pre- independence period in Salem. But till 1960s there were fewer than 5 spinning mills. Private handloom weaving started thriving in the region along with the large scale cooperative sector handloom weaving and marketing units. Small scale hand dying units were started around the region to support the industry. Around 1980s the textile industry grew significantly. Many major spinning mills and waste spinning units came up into existence. Many Handloom societies and dying houses were established. New and increased numbers of Power Loom units were mushroomed in the places like Gugai, Ammapet, Attayampatti, Vennandur, Magudanchavadi, Rasipuram, Komarapalayam Pallipalayam, Jalakandapuram and Ellampillai.
The Salem region also houses the Tamil Nadu largest number of Sago industries which are engaged in the production Sago Foods and Starch.In Salem District alone, 34000 hectares of land is under tapioca cultivation which is the raw material for the sago industries and there are 650 units engaged in tapioca processing. In and around Salem the yield of tapioca is about 25-30 T/ha, highest in the World. National average is 19 T/ha and World average production stands at 10 T/ha. Hence it is called land of sago. In 1981, Salem Starch and Sago Manufacturers Service Industrial Co-operative Society Ltd (popularly called as SAGOSERVE) were established to promote the growth of sago industries. Nearly 80% of the national demand for Sago and Starch is being met by the Sagoserv.
Salem Steel Plant, a special steel unit of Steel Authority of India Ltd have their plant located in Salem which produces Cold rolled stainless steel and Hot rolled stainless steel/carbon steel. The plant can produce austenitic, ferritic, martensitic and low-nickel stainless steel in the form of coils and sheets with an installed capacity of 70,000 tonnes/year in Cold Rolling Mill and 1,86,000 tonnes/year in Hot Rolling Mill. In addition, the plant has country's first top-of-the-line stainless steel blanking facility with a capacity of 3,600 tonnes/year of coin blanks and utility blanks/circles. Expansion and modernisation of Salem Steel Plant is ongoing. The plan envisages installation of Steel Melting and Continuous Casting facilities to produce 1,80,000 tonnes of slabs along with expansion of Cold Rolling Mill complex, enhancing the capacity of Cold Rolled Stainless Steel Products from 65,000 TPA to 1,46,000 TPA and an additional Roll Grinding Machine for Hot Rolling Mill for increasing production to 3,64,000 TPA. The total project area is 1130 acres and cost of the project is 1780 crores.
Southern Iron & Steel Company Ltd (joint venture with JSW Steel) the first integrated steel plant of India at a cost of 2,235 Crores, located near Salem for the production of TMT corrosion resistant bars/alloy steels. The Salem plant is the largest special steel plant in India aims to develop the Kanjamalai, Kavuthimalai and Vediappanmalai iron ore mines in Tamil Nadu on receipt of requisite approvals to improve raw material security. This will facilitate expansion of production capacity to 2 MTPA. It will also allow the unit to diversify into the production of value- added products such as annealed, drawn and peeled steel. The plant is continuously working to develop special grades for critical automotive applications.
The Madras Aluminium Company Ltd (MALCO) is part of Vedanta Resources Plc, a London Stock Exchange listed FTSE 100 diversified metals and mining major. MALCO has a state-of-the-art, coal- based Captive Power Plant at the same location which was commissioned in

Consultancy services for Preparation of Detailed Project Report of Economic Corridors, Inter Corridors, Feeder routes and National Corridors under Bharatmala Pariyojana (Lot-6/Package -1)
Feasibility Report Volume – I (Main Report)
Social Economic Profile
Feedback Infra Pvt. Ltd. 3-16 National Highways Authority of India
the year 1999. In the year 2004 MALCO augmented its smelter capacity from earlier 25,000TPA to 40,000TPA. It generates 100 MW power from 4 units of 25MW each through power plant located at Mettur, Tamil Nadu. Around 90% of the entire power generated is exported; the rest is used internally. Efficient plant operations enabled MALCO to achieve a higher plant load factor since existence.
The region around Salem is rich in mineral ores. Salem has one of the largest magnesite, and bauxite and also irons ore deposits in India. It has many magnesite factories operated by private and public sectors such as Burn Standard & Co, Dalmia Magnesites and Tata Refractories, SAIL refractories. The Leigh Bazaar market in Salem is the biggest regional market for agro products. Narasus coffee one of the famous coffee in Tamil Nadu, Nandhi Dall Mills the oldest flour mill company, BSP refineries (Usha Refined Sunflower Oil) are other few companies have their presence in Salem.
Being one of the fastest growing tier II cities, the Tamil Nadu government and ELCOT are planning to establish an IT park in Salem covering about 160 acres (0.65 km2). SAIL is planning a Steel SEZ inside the Salem Steel plant covering about 250 acres (1.0 km2) there is an exclusive Electrical and Electronics Industrial Estate in the Suramangalam area of Salem city. Coimbatore-Erode-Salem stretch was well known for Industries and Textile processings and it is announced as Coimbatore- Salem Industrial Corridor and further development works are carried by SIPCOT Linking.

Consultancy Services for preparation of DPR for development of Economic Corridors, Inter Corridors, Feeder Routes and National corridors (GQ and NS-EW Corridors) to improve the efficiency of freight movement in India under Bharatmala Pariyojana (Chennai-Salem Highway)
Feasibility Report Volume – I (Main Report)
Traffic Studies & Forecasts
Feedback Infra Pvt. Ltd. 4-1 National Highways Authority of India
4. TRAFFIC STUDIES & FORECASTS
4.1 Traffic surveys and analysis 4.1.1 Introduction
This section presents the traffic studies and analyses carried out for addressing various objectives and issues pertaining to upgrading for 8 laning of Chennai-Salem highway (green field alignment) in the state of Tamil Nadu. The results of this analysis will form inputs for forecasting future traffic, planning and designing the pavement, developing capacity augmentation proposals, designing the toll plaza and design of intersections along the project road.
Since it is a green field highway a thorough knowledge of the travel characteristics of the traffic on the existing alternate routes is essential for future diverted traffic estimation on the project road. Hence, detailed traffic surveys have been carried out to assess the baseline traffic characteristics on various alternative routes from Chennai to Salem.
4.1.2 Project details
The Project corridor (Chennai - Salem highway) starts at Vandalur from Chennai outer ring road in Tamilnadu state, traverses through Walajabad, Chetpet, Tiruvanaamalai, Harur and connects Salem town on NH 79 at Ayodhyapatnam, then by passes Salem town through green field and culminates at NH 544. This part of the alignment is a completely green field alignment and passes through towns like Oragadam, Walajabad, Chetpet, Tiruvannmalai and Harur. On the way it crosses SH 48, SH 58, SH 118A, SH 116, SH 5, SH 4, SH 115, NH 38, NH 77, SH 6A, SH 18 and end on NH 79 at Ayodhyapatnam. The Samen bypass starts from Ayodhyapatnam and crosses NH 44 bypassing Salem town on the south and culminates at Aryanur on NH 544 (Salem Coimbatore NH). The project road is divided into seven packages and the details are given below.
Package Section
Length, km Locations
From km To km
I 0+000 25+600 25.600 Vandalur to Palur
II 25+600 67+700 42.100 Palur to Erumaivetti
III 67+700 122+660 54.960 Erumaivetti to Thenpallipattu
IV 122+660 157+570 34.910 Thenpallipattu to Manmalai
V 157+570 207+200 49.630 Manmali to Harur
VI
207+200 220+000 12.800
Harur to Ayodhiyapatinam
57+300 21+800 35.500
VII 21+800 0+000 21.800 Ayodhiyapatinam to Ariyanur
Project road aims to connect Airports of all two major cities and also intends to connect many Industrial areas and SEZ along the project road and the connectivity are contemplated through spurs and interchanges.
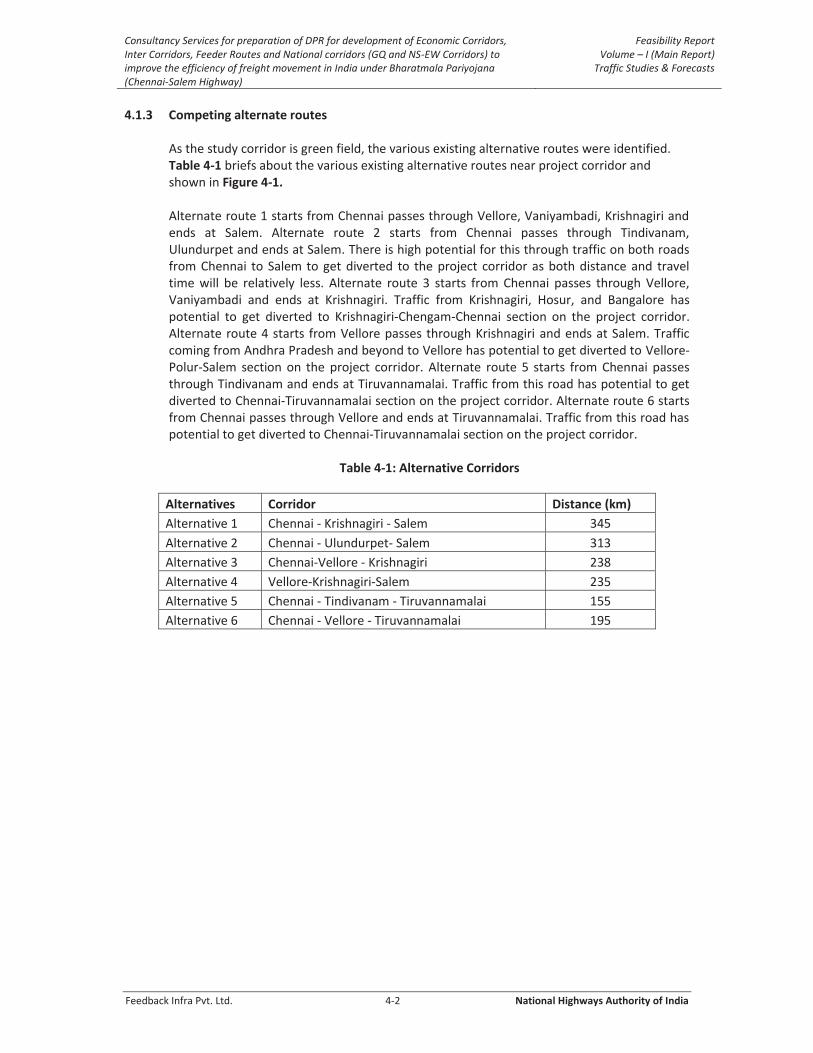
Consultancy Services for preparation of DPR for development of Economic Corridors, Inter Corridors, Feeder Routes and National corridors (GQ and NS-EW Corridors) to improve the efficiency of freight movement in India under Bharatmala Pariyojana (Chennai-Salem Highway)
Feasibility Report Volume – I (Main Report)
Traffic Studies & Forecasts
Feedback Infra Pvt. Ltd. 4-2 National Highways Authority of India
4.1.3 Competing alternate routes
As the study corridor is green field, the various existing alternative routes were identified. Table 4-1 briefs about the various existing alternative routes near project corridor and shown in Figure 4-1. Alternate route 1 starts from Chennai passes through Vellore, Vaniyambadi, Krishnagiri and ends at Salem. Alternate route 2 starts from Chennai passes through Tindivanam, Ulundurpet and ends at Salem. There is high potential for this through traffic on both roads from Chennai to Salem to get diverted to the project corridor as both distance and travel time will be relatively less. Alternate route 3 starts from Chennai passes through Vellore, Vaniyambadi and ends at Krishnagiri. Traffic from Krishnagiri, Hosur, and Bangalore has potential to get diverted to Krishnagiri-Chengam-Chennai section on the project corridor. Alternate route 4 starts from Vellore passes through Krishnagiri and ends at Salem. Traffic coming from Andhra Pradesh and beyond to Vellore has potential to get diverted to Vellore-Polur-Salem section on the project corridor. Alternate route 5 starts from Chennai passes through Tindivanam and ends at Tiruvannamalai. Traffic from this road has potential to get diverted to Chennai-Tiruvannamalai section on the project corridor. Alternate route 6 starts from Chennai passes through Vellore and ends at Tiruvannamalai. Traffic from this road has potential to get diverted to Chennai-Tiruvannamalai section on the project corridor.
Table 4-1: Alternative Corridors
Alternatives Corridor Distance (km)
Alternative 1 Chennai - Krishnagiri - Salem 345
Alternative 2 Chennai - Ulundurpet- Salem 313
Alternative 3 Chennai-Vellore - Krishnagiri 238
Alternative 4 Vellore-Krishnagiri-Salem 235
Alternative 5 Chennai - Tindivanam - Tiruvannamalai 155
Alternative 6 Chennai - Vellore - Tiruvannamalai 195

Co
nsu
lta
ncy
Ser
vice
s fo
r p
rep
ara
tio
n o
f D
PR
fo
r d
evel
op
men
t o
f Ec
on
om
ic C
orr
ido
rs, I
nte
r C
orr
ido
rs, F
eed
er R
ou
tes
an
d N
ati
on
al
corr
ido
rs (
GQ
an
d N
S -EW
Co
rrid
ors
) to
imp
rove
th
e ef
fici
ency
of
frei
gh
t m
ove
men
t in
Ind
ia u
nd
er B
ha
ratm
ala
Pa
riyo
jan
a (
Ch
enn
ai-
Sale
m H
igh
wa
y)
Fea
sib
ility
Rep
ort
V
olu
me –
I (M
ain
Rep
ort
) Tr
aff
ic S
tud
ies
& F
ore
cast
s
Fee
db
ack
Infr
a P
vt. L
td.
4-3
N
atio
na
l Hig
hw
ays
Au
tho
rity
of
Ind
ia
Fi
gure
4-1
: Alt
ern
ate
ro
ute
s fr
om
Ch
enn
ai t
o S
alem

Consultancy Services for preparation of DPR for development of Economic Corridors, Inter Corridors, Feeder Routes and National corridors (GQ and NS-EW Corridors) to improve the efficiency of freight movement in India under Bharatmala Pariyojana (Chennai-Salem Highway)
Feasibility Report Volume – I (Main Report)
Traffic Studies & Forecasts
Feedback Infra Pvt. Ltd. 4-4 National Highways Authority of India
4.1.4 Survey Methodology 4.1.4.1 Primary surveys and considerations
To capture traffic flow characteristics, travel pattern, speed characteristics, users’ preference regarding toll imposition on traffic passing through the existing routes from Chennai to Salem and other characteristics related to miscellaneous requirements on the project road, following primary traffic surveys were conducted.
Classified traffic volume count (CTVC) using ATCC method
Origin – destination survey (OD)
Axle load survey
Speed and delay study
Traffic survey stations for carrying out CTVC, OD and axle load surveys were selected after a site reconnaissance considering the following parameters.
The station should represent homogeneous traffic section
The station should be free from urban and local traffic influence
The station should be located in a reasonably level terrain with good visibility
The summary of primary surveys conducted on the project corridor is illustrated in Figure 4-2 below.
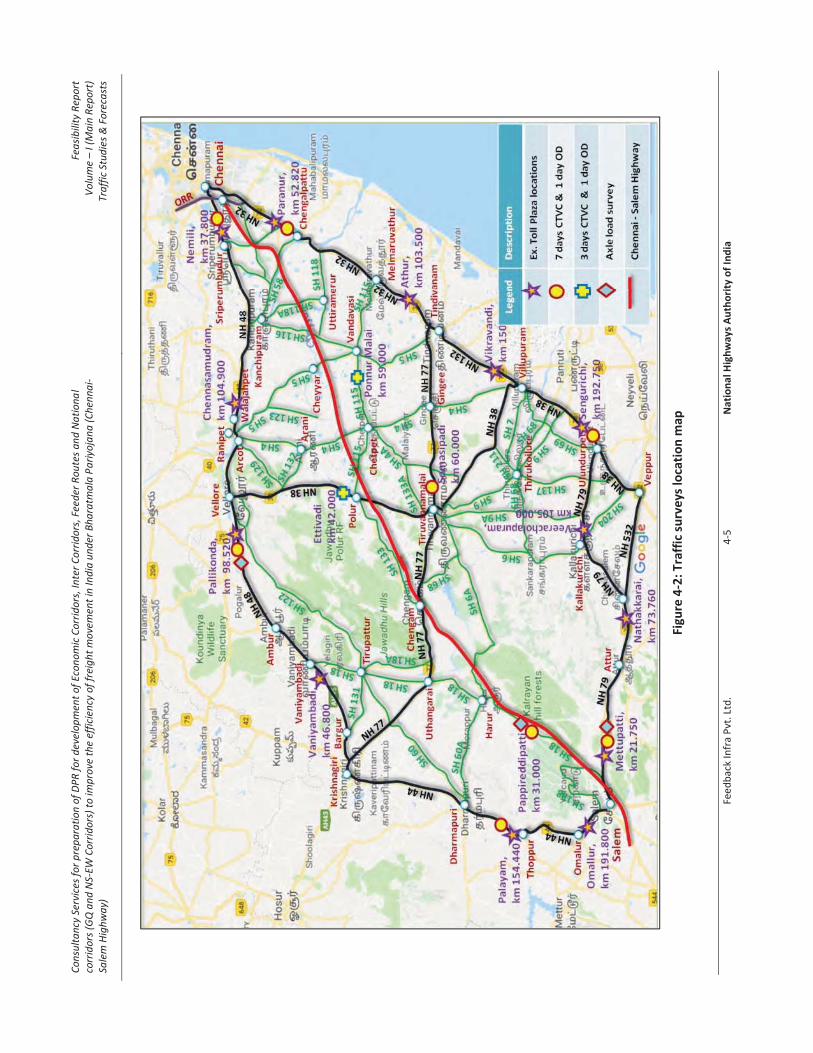
Co
nsu
lta
ncy
Ser
vice
s fo
r p
rep
ara
tio
n o
f D
PR
fo
r d
evel
op
men
t o
f Ec
on
om
ic C
orr
ido
rs, I
nte
r C
orr
ido
rs, F
eed
er R
ou
tes
an
d N
ati
on
al
corr
ido
rs (
GQ
an
d N
S-EW
Co
rrid
ors
) to
imp
rove
th
e ef
fici
ency
of
frei
gh
t m
ove
men
t in
Ind
ia u
nd
er B
ha
ratm
ala
Pa
riyo
jan
a (
Ch
enn
ai-
Sale
m H
igh
wa
y)
Fea
sib
ility
Rep
ort
V
olu
me –
I (M
ain
Rep
ort
)Tr
aff
ic S
tud
ies
& F
ore
cast
s
Fee
db
ack
Infr
a P
vt. L
td.
4-5
N
atio
na
l Hig
hw
ays
Au
tho
rity
of
Ind
ia
Figu
re 4
-2: T
raff
ic s
urv
eys
loca
tio
n m
ap

Consultancy Services for preparation of DPR for development of Economic Corridors, Inter Corridors, Feeder Routes and National corridors (GQ and NS-EW Corridors) to improve the efficiency of freight movement in India under Bharatmala Pariyojana (Chennai-Salem Highway)
Feasibility Report Volume – I (Main Report)
Traffic Studies & Forecasts
Feedback Infra Pvt. Ltd. 4-6 National Highways Authority of India
4.1.4.2 Classified traffic volume count
The CTVC surveys were conducted at ten locations on existing roads from Chennai to Salem. For seven locations CTVC were conducted continuously for 7 consecutive days and for 24 hours, through Automatic Traffic Counter and Classifier (ATCC) method. For the remaining three locations CTVC were conducted continuously for 3 consecutive days and for 24 hours. The counts location is representing mid block count station for each homogeneous section of existing roads. The surveys were as per guidelines illustrated in IRC: SP: 19 – 2001, ‘Manual for Survey, Investigation and Preparation of Road Projects’. For carrying out the counts, the vehicles were grouped under the following categories (Table 4-2).
Automatic Traffic Counter and Classifier (ATCC) is capable of counting vehicles according to their class with help of different non intrusive technologies such as infrared sensors, Pneumatic tubes etc. Pneumatic Tube Technology used for the present traffic study of Automatic Traffic Counter and Classifier.
Table 4-2: Vehicle classification system
Motorised traffic
2 wheelers: Scooters, bikes, motor cycles and mopeds etc
3 wheelers including auto rickshaw
Passenger Car Car, jeep, taxi & van
Bus Mini bus
Govt. bus
Private bus
Truck Light commercial vehicles (LCV)
2 Axle truck
3 Axle truck
4 to 6 Axle Truck
Truck with more than 6 Axle
Other Vehicles Agriculture Tractor, Tractor & Trailer
Slow moving vehicles
Bicycle
Cycle rickshaw
Animal drawn
Hand cart
The count data was recorded for 60 minute intervals for each vehicle group for each direction of travel separately. This traffic data is used for working out traffic characteristics analysis and forecast, capacity augmentation and toll analysis. The schedule of survey is given in Table 4-3.
Table 4-3: Schedule of traffic volume count survey
Location Survey Locations Existing km Date
CTVC 1 Paranur (near Chengalpet) km 52.820 (old NH-45) 28-02-2018 to 06-03-2018
CTVC 2 Sengurichi (near Ulundurpet) km 192.750 (old NH-45) 27-02-2018 to 05-03-2018
CTVC 3 Mettupatti (near Valappadi) km 21.750 (old NH-68) 01-03-2018 to 07-03-2018
CTVC 5 Pallikonda (near Vellore) km 98.520 (old NH-4) 03-03-2018 to 09-03-2018
CTVC 6 Palayam (near Dharmapuri) km 154.440 (old NH-7) 01-03-2018 to 07-03-2018
CTVC 7 Somasipadi (near Tiruvannamalai) km 95.600 (old NH-66) 26-02-2018 to 04-03-2018
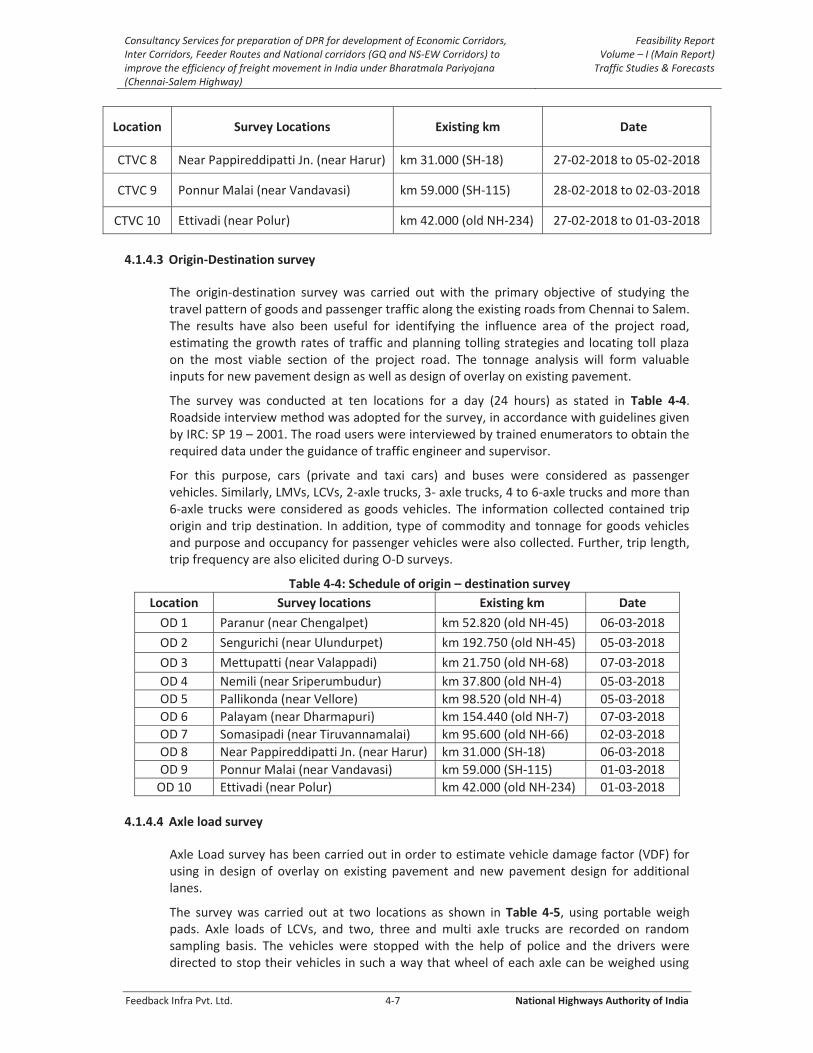
Consultancy Services for preparation of DPR for development of Economic Corridors, Inter Corridors, Feeder Routes and National corridors (GQ and NS-EW Corridors) to improve the efficiency of freight movement in India under Bharatmala Pariyojana (Chennai-Salem Highway)
Feasibility Report Volume – I (Main Report)
Traffic Studies & Forecasts
Feedback Infra Pvt. Ltd. 4-7 National Highways Authority of India
Location Survey Locations Existing km Date
CTVC 8 Near Pappireddipatti Jn. (near Harur) km 31.000 (SH-18) 27-02-2018 to 05-02-2018
CTVC 9 Ponnur Malai (near Vandavasi) km 59.000 (SH-115) 28-02-2018 to 02-03-2018
CTVC 10 Ettivadi (near Polur) km 42.000 (old NH-234) 27-02-2018 to 01-03-2018
4.1.4.3 Origin-Destination survey
The origin-destination survey was carried out with the primary objective of studying the travel pattern of goods and passenger traffic along the existing roads from Chennai to Salem. The results have also been useful for identifying the influence area of the project road, estimating the growth rates of traffic and planning tolling strategies and locating toll plaza on the most viable section of the project road. The tonnage analysis will form valuable inputs for new pavement design as well as design of overlay on existing pavement.
The survey was conducted at ten locations for a day (24 hours) as stated in Table 4-4. Roadside interview method was adopted for the survey, in accordance with guidelines given by IRC: SP 19 – 2001. The road users were interviewed by trained enumerators to obtain the required data under the guidance of traffic engineer and supervisor.
For this purpose, cars (private and taxi cars) and buses were considered as passenger vehicles. Similarly, LMVs, LCVs, 2-axle trucks, 3- axle trucks, 4 to 6-axle trucks and more than 6-axle trucks were considered as goods vehicles. The information collected contained trip origin and trip destination. In addition, type of commodity and tonnage for goods vehicles and purpose and occupancy for passenger vehicles were also collected. Further, trip length, trip frequency are also elicited during O-D surveys.
Table 4-4: Schedule of origin – destination survey
Location Survey locations Existing km Date
OD 1 Paranur (near Chengalpet) km 52.820 (old NH-45) 06-03-2018
OD 2 Sengurichi (near Ulundurpet) km 192.750 (old NH-45) 05-03-2018
OD 3 Mettupatti (near Valappadi) km 21.750 (old NH-68) 07-03-2018
OD 4 Nemili (near Sriperumbudur) km 37.800 (old NH-4) 05-03-2018
OD 5 Pallikonda (near Vellore) km 98.520 (old NH-4) 05-03-2018
OD 6 Palayam (near Dharmapuri) km 154.440 (old NH-7) 07-03-2018
OD 7 Somasipadi (near Tiruvannamalai) km 95.600 (old NH-66) 02-03-2018
OD 8 Near Pappireddipatti Jn. (near Harur) km 31.000 (SH-18) 06-03-2018
OD 9 Ponnur Malai (near Vandavasi) km 59.000 (SH-115) 01-03-2018
OD 10 Ettivadi (near Polur) km 42.000 (old NH-234) 01-03-2018
4.1.4.4 Axle load survey
Axle Load survey has been carried out in order to estimate vehicle damage factor (VDF) for using in design of overlay on existing pavement and new pavement design for additional lanes.
The survey was carried out at two locations as shown in Table 4-5, using portable weigh pads. Axle loads of LCVs, and two, three and multi axle trucks are recorded on random sampling basis. The vehicles were stopped with the help of police and the drivers were directed to stop their vehicles in such a way that wheel of each axle can be weighed using

Consultancy Services for preparation of DPR for development of Economic Corridors, Inter Corridors, Feeder Routes and National corridors (GQ and NS-EW Corridors) to improve the efficiency of freight movement in India under Bharatmala Pariyojana (Chennai-Salem Highway)
Feasibility Report Volume – I (Main Report)
Traffic Studies & Forecasts
Feedback Infra Pvt. Ltd. 4-8 National Highways Authority of India
the weighing pad. The readings were recorded by trained enumerators for each axle separately. In addition, information about origin, destination and type of goods transported by commercial vehicles are recorded.
Table 4-5: Schedule of axle load survey
Location Survey location/ section Existing km Date
AL 1 Mettupatti (near Valappadi) km 21.750 (old NH-68) 07-03-2018
AL 2 Pallikonda (near Vellore) km 98.520 (old NH-4) 05-03-2018
AL 3 Near Pappireddipatti Jn. (near Harur) km 31.000 (SH-18) 06-03-2018
4.1.4.5 Speed and delay survey
The speed and delay survey was conducted using moving car observer method. It was conducted for all the existing roads from Chennai to Salem. The existing roads were divided into suitable sections based on the traffic characteristics of the corridor. The test vehicle was run at the perceptible average speed of the traffic stream along the road. The observers inside the test vehicles recorded travel time and stopping delay timings along with the causes of delays. The test vehicle was made to travel on both directions of travel covering different peak and off peak traffic flow conditions.
4.1.5 Data Analysis
4.1.5.1 Traffic volume count
The classified traffic volume count survey data for four locations was analysed in order to obtain the following traffic characteristics:
Average hourly variation of traffic volume
Daily variation of traffic volume
Average Composition of traffic
Directional distribution of traffic
Average Daily Traffic (ADT) volume
Daily and hourly variation of classified traffic flow is recorded by conducting traffic count at strategically selected traffic count stations. Recorded traffic data has been converted into Passenger Car Unit using PCU factors as shown in Table 4-6. These equivalency factors are extracted from IRC: 64 – 1990, ‘Guidelines for Capacity of Roads in Rural Areas’.
Table 4-6: Passenger car equivalency factors
Sl. No Vehicle Type PCU Factors
1. Two Wheeler 0.50
2. Auto–rickshaw 1.00
3. Car / Jeep / Van 1.00
4. Mini Bus 1.50
5. Standard Bus 3.00
6. Light Commercial Vehicle (LCV), Agricultural Tractor 1.50
7. Two Axle Truck 3.00
8. Three Axle Truck 3.00
9. Truck Trailer 4.50

Consultancy Services for preparation of DPR for development of Economic Corridors, Inter Corridors, Feeder Routes and National corridors (GQ and NS-EW Corridors) to improve the efficiency of freight movement in India under Bharatmala Pariyojana (Chennai-Salem Highway)
Feasibility Report Volume – I (Main Report)
Traffic Studies & Forecasts
Feedback Infra Pvt. Ltd. 4-9 National Highways Authority of India
Sl. No Vehicle Type PCU Factors
10. Agriculture Tractor-trailer 4.50
11. Animal Drawn 8.00
12. Cycle 0.50
13. Hand Cart 3.00
14. Cycle Rickshaw 2.00
4.1.5.2 Average daily traffic (ADT)
Traffic volume count data for 7 days at seven count locations, 3 days at three locations was averaged to determine Average Daily Traffic (ADT). Traffic volume count summary sheets for count locations along with ADT tables are presented in Annexure 4.1 to this report. The count location ADT by vehicle type is presented in Table 4-7.

Co
nsu
lta
ncy
Ser
vice
s fo
r p
rep
ara
tio
n o
f D
PR
fo
r d
evel
op
men
t o
f Ec
on
om
ic C
orr
ido
rs, I
nte
r C
orr
ido
rs, F
eed
er R
ou
tes
an
d N
ati
on
al
corr
ido
rs (
GQ
an
d N
S -EW
Co
rrid
ors
) to
imp
rove
th
e ef
fici
ency
of
frei
gh
t m
ove
men
t in
Ind
ia u
nd
er B
ha
ratm
ala
Pa
riyo
jan
a (
Ch
enn
ai-
Sale
m H
igh
wa
y)
Fea
sib
ility
Rep
ort
V
olu
me –
I (M
ain
Rep
ort
) Tr
aff
ic S
tud
ies
& F
ore
cast
s
Fee
db
ack
Infr
a P
vt. L
td.
4-1
0
Nat
ion
al H
igh
way
s A
uth
ori
ty o
f In
dia
Tab
le 4
-7: A
vera
ge D
aily
Tra
ffic
at
cou
nt
loca
tio
ns
Mo
de
of
Ve
hic
le
Par
anu
r TP
(o
ld
NH
-45
)
Sen
guri
chi T
P (
old
N
H-4
5)
Me
ttu
pat
ti
TP (
old
NH
-6
8)
Nem
ili
TP (
old
N
H-4
)
Pal
liko
nd
a TP
(o
ld N
H-
4)
Pal
ayam
TP
(o
ld
NH
-7)
Som
asip
adi (
old
N
H-6
6)
Pap
pir
edd
ipat
ti J
n (
SH-1
8)
Po
nn
urm
alai
(SH
-11
5)
Etti
vad
i (o
ld N
H-
23
4)
Car
/ J
eep
/ V
an
22
68
7
10
72
1
72
99
1
46
91
1
01
95
1
02
65
2
97
5
13
30
7
30
2
43
6
Loca
l/Sh
ared
Car
8
5
4
10
1
2
5
5
3
2
2
0
Min
i Bu
s 2
08
6
36
9
17
6
12
45
1
97
1
75
1
05
6
6
44
8
1
Sch
oo
l Bu
s 1
12
2
9
75
8
5
68
3
0
23
0
55
3
0
92
Go
vt. b
us
36
55
1
44
0
88
1
16
79
1
19
9
80
8
57
4
23
3
16
0
48
7
Pvt
. bu
s 2
03
6
16
28
7
71
1
44
8
59
8
89
3
19
6
12
7
39
2
06
LMV
2
36
3
11
66
1
37
3
22
04
1
10
6
19
99
5
08
3
70
2
26
6
22
LCV
(4
Wh
eels
) 1
96
7
4
73
3
49
1
30
1
78
1
6
23
6
3
0
LCV
(6
Wh
eels
) 2
36
7
15
53
1
06
1
30
08
2
02
0
28
64
1
19
1
80
5
3
27
0
2 A
xle
14
73
9
46
9
72
1
78
4
80
3
13
08
1
78
4
56
6
4
28
4
3 A
xle
23
87
1
09
2
61
1
18
82
8
69
1
61
4
16
0
70
2
10
7
53
7
MA
V (
4 -
6 A
xles
) 1
99
9
14
70
6
81
2
05
6
16
40
4
34
6
71
8
20
7
3
62
3
MA
V (
7++
Axl
es)
0
0
0
0
1
0
0
0
0
0
2 W
hee
ler
23
87
8
52
13
8
80
7
14
50
5
11
81
9
54
50
9
97
4
18
35
2
29
9
53
38
3 w
he
ele
r/A
uto
8
51
1
06
2
13
3
97
1
09
5
50
7
36
6
7
42
1
06
Trac
tor
2
8
8
2
5
4
7
12
1
4
Trac
tor
wit
h t
raile
r 7
1
7
13
4
1
5
19
2
1
13
1
2
0
Cyc
le
13
6
1
9
12
1
18
1
16
1
05
3
3
38
4
2
Cyc
le r
icks
haw
3
0
3
2
2
1
1
0
0
0
An
imal
dra
wn
0
0
0
0
0
1
0
0
0
2
Toll
exem
pte
d
Veh
icle
s 4
7
22
1
8
34
2
8
28
6
2
0
2
Tolla
ble
Veh
icle
s 4
14
46
2
04
92
1
39
83
3
04
43
1
88
31
2
44
85
5
13
5
43
64
1
53
4
56
68
Tolla
ble
PC
U
70
09
4
36
90
6
23
64
2
53
69
7
32
82
2
50
61
1
81
80
1
05
15
2
64
1
11
25
2
No
n-t
olla
ble
veh
icle
s 2
48
01
5
37
2
90
81
1
49
56
1
30
82
6
12
6
10
48
0
19
02
2
38
1
55
14
No
n-t
olla
ble
PC
U
12
90
3
28
35
4
72
8
77
28
7
18
1
34
27
5
52
2
10
21
1
21
7
29
08
Mo
tori
sed
Veh
icle
s 6
62
31
2
58
58
2
30
42
4
53
85
3
17
93
3
04
93
1
55
09
6
23
3
38
77
1
11
38

Co
nsu
lta
ncy
Ser
vice
s fo
r p
rep
ara
tio
n o
f D
PR
fo
r d
evel
op
men
t o
f Ec
on
om
ic C
orr
ido
rs, I
nte
r C
orr
ido
rs, F
eed
er R
ou
tes
an
d N
ati
on
al
corr
ido
rs (
GQ
an
d N
S -EW
Co
rrid
ors
) to
imp
rove
th
e ef
fici
ency
of
frei
gh
t m
ove
men
t in
Ind
ia u
nd
er B
ha
ratm
ala
Pa
riyo
jan
a (
Ch
enn
ai-
Sale
m H
igh
wa
y)
Fea
sib
ility
Rep
ort
V
olu
me –
I (M
ain
Rep
ort
) Tr
aff
ic S
tud
ies
& F
ore
cast
s
Fee
db
ack
Infr
a P
vt. L
td.
4-1
1
Nat
ion
al H
igh
way
s A
uth
ori
ty o
f In
dia
Mo
de
of
Ve
hic
le
Par
anu
r TP
(o
ld
NH
-45
)
Sen
guri
chi T
P (
old
N
H-4
5)
Me
ttu
pat
ti
TP (
old
NH
-6
8)
Nem
ili
TP (
old
N
H-4
)
Pal
liko
nd
a TP
(o
ld N
H-
4)
Pal
ayam
TP
(o
ld
NH
-7)
Som
asip
adi (
old
N
H-6
6)
Pap
pir
edd
ipat
ti J
n (
SH-1
8)
Po
nn
urm
alai
(SH
-11
5)
Etti
vad
i (o
ld N
H-
23
4)
No
n-M
oto
rise
d
Veh
icle
s 1
6
6
22
1
4
12
0
11
8
10
6
33
3
8
44
Tota
l Ve
hic
les
66
24
7
25
86
4
23
06
4
45
39
9
31
91
3
30
61
1
15
61
5
62
66
3
91
5
11
18
2
Tota
l PC
U
82
99
5
39
73
9
28
36
9
61
42
4
40
00
3
54
03
8
13
70
1
11
53
5
38
58
1
41
58
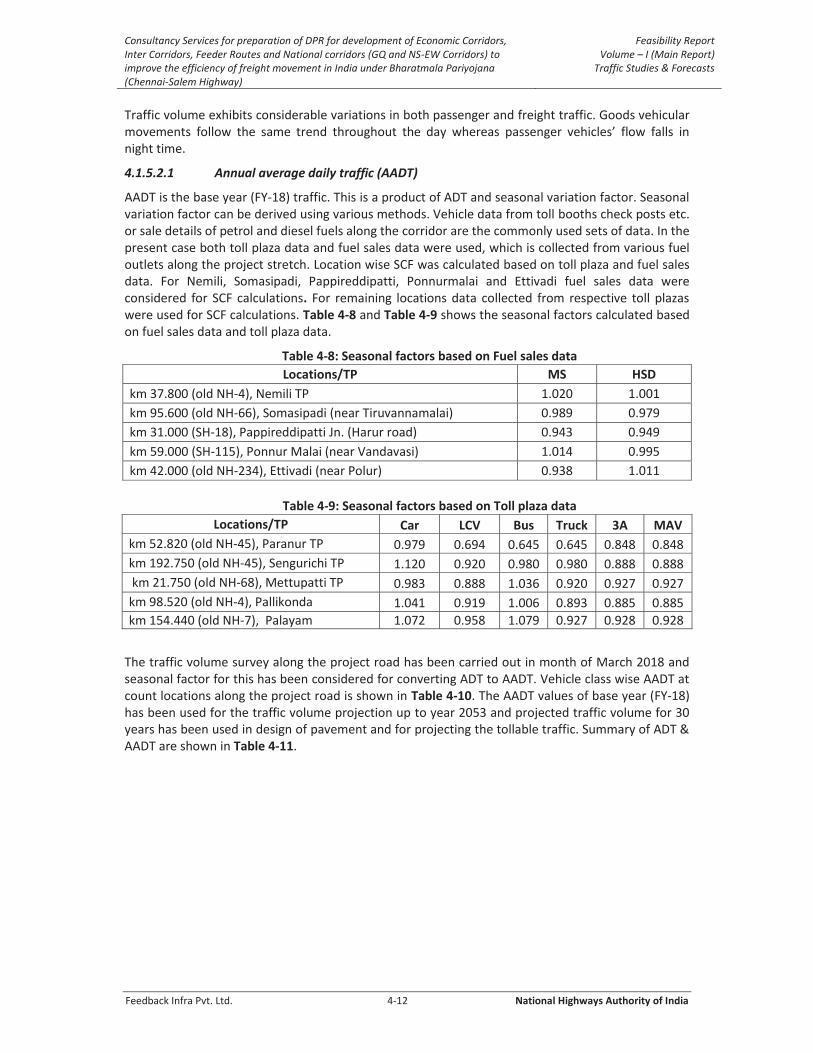
Consultancy Services for preparation of DPR for development of Economic Corridors, Inter Corridors, Feeder Routes and National corridors (GQ and NS-EW Corridors) to improve the efficiency of freight movement in India under Bharatmala Pariyojana (Chennai-Salem Highway)
Feasibility Report Volume – I (Main Report)
Traffic Studies & Forecasts
Feedback Infra Pvt. Ltd. 4-12 National Highways Authority of India
Traffic volume exhibits considerable variations in both passenger and freight traffic. Goods vehicular movements follow the same trend throughout the day whereas passenger vehicles’ flow falls in night time.
4.1.5.2.1 Annual average daily traffic (AADT)
AADT is the base year (FY-18) traffic. This is a product of ADT and seasonal variation factor. Seasonal variation factor can be derived using various methods. Vehicle data from toll booths check posts etc. or sale details of petrol and diesel fuels along the corridor are the commonly used sets of data. In the present case both toll plaza data and fuel sales data were used, which is collected from various fuel outlets along the project stretch. Location wise SCF was calculated based on toll plaza and fuel sales data. For Nemili, Somasipadi, Pappireddipatti, Ponnurmalai and Ettivadi fuel sales data were considered for SCF calculations. For remaining locations data collected from respective toll plazas were used for SCF calculations. Table 4-8 and Table 4-9 shows the seasonal factors calculated based on fuel sales data and toll plaza data.
Table 4-8: Seasonal factors based on Fuel sales data
Locations/TP MS HSD
km 37.800 (old NH-4), Nemili TP 1.020 1.001
km 95.600 (old NH-66), Somasipadi (near Tiruvannamalai) 0.989 0.979
km 31.000 (SH-18), Pappireddipatti Jn. (Harur road) 0.943 0.949
km 59.000 (SH-115), Ponnur Malai (near Vandavasi) 1.014 0.995
km 42.000 (old NH-234), Ettivadi (near Polur) 0.938 1.011
Table 4-9: Seasonal factors based on Toll plaza data
Locations/TP Car LCV Bus Truck 3A MAV
km 52.820 (old NH-45), Paranur TP 0.979 0.694 0.645 0.645 0.848 0.848
km 192.750 (old NH-45), Sengurichi TP 1.120 0.920 0.980 0.980 0.888 0.888
km 21.750 (old NH-68), Mettupatti TP 0.983 0.888 1.036 0.920 0.927 0.927
km 98.520 (old NH-4), Pallikonda 1.041 0.919 1.006 0.893 0.885 0.885
km 154.440 (old NH-7), Palayam 1.072 0.958 1.079 0.927 0.928 0.928
The traffic volume survey along the project road has been carried out in month of March 2018 and seasonal factor for this has been considered for converting ADT to AADT. Vehicle class wise AADT at count locations along the project road is shown in Table 4-10. The AADT values of base year (FY-18) has been used for the traffic volume projection up to year 2053 and projected traffic volume for 30 years has been used in design of pavement and for projecting the tollable traffic. Summary of ADT & AADT are shown in Table 4-11.
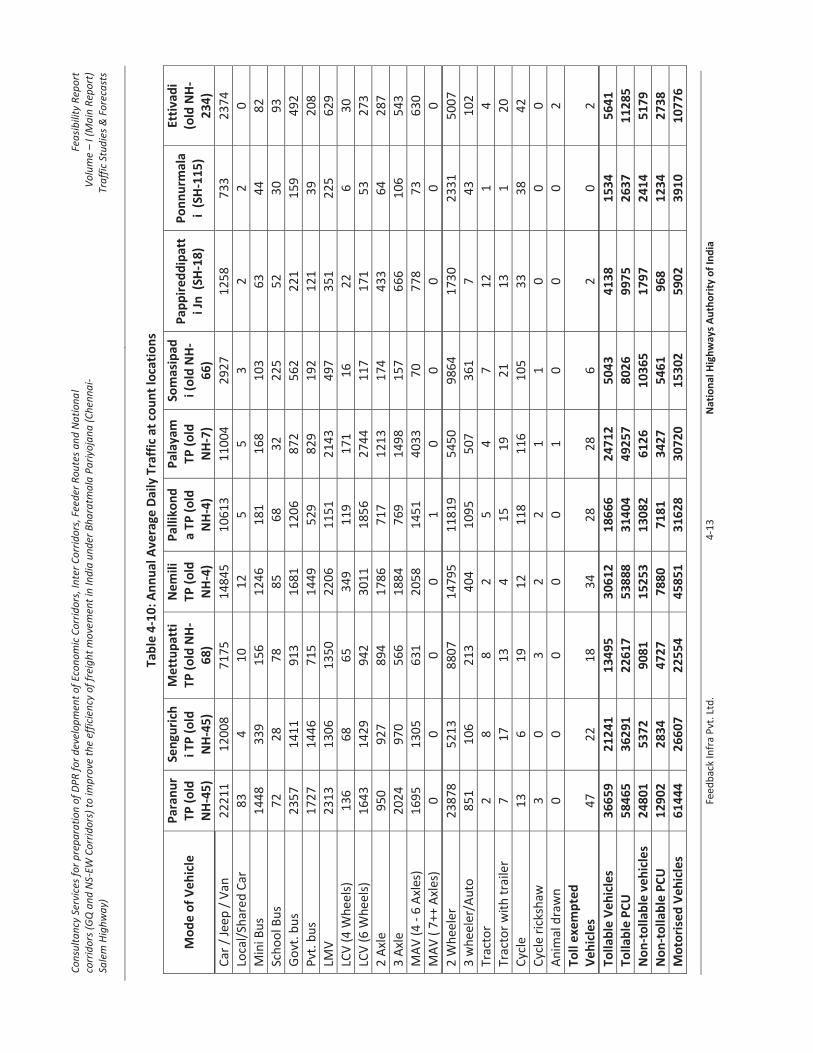
Co
nsu
lta
ncy
Ser
vice
s fo
r p
rep
ara
tio
n o
f D
PR
fo
r d
evel
op
men
t o
f Ec
on
om
ic C
orr
ido
rs, I
nte
r C
orr
ido
rs, F
eed
er R
ou
tes
an
d N
ati
on
al
corr
ido
rs (
GQ
an
d N
S -EW
Co
rrid
ors
) to
imp
rove
th
e ef
fici
ency
of
frei
gh
t m
ove
men
t in
Ind
ia u
nd
er B
ha
ratm
ala
Pa
riyo
jan
a (
Ch
enn
ai-
Sale
m H
igh
wa
y)
Fea
sib
ility
Rep
ort
V
olu
me –
I (M
ain
Rep
ort
) Tr
aff
ic S
tud
ies
& F
ore
cast
s
Fee
db
ack
Infr
a P
vt. L
td.
4-1
3
Nat
ion
al H
igh
way
s A
uth
ori
ty o
f In
dia
Tab
le 4
-10
: An
nu
al A
vera
ge D
aily
Tra
ffic
at
cou
nt
loca
tio
ns
Mo
de
of
Ve
hic
le
Par
anu
r TP
(o
ld
NH
-45
)
Sen
guri
chi T
P (
old
N
H-4
5)
Me
ttu
pat
ti
TP (
old
NH
-6
8)
Nem
ili
TP (
old
N
H-4
)
Pal
liko
nd
a T
P (
old
N
H-4
)
Pal
ayam
TP
(o
ld
NH
-7)
Som
asip
adi (
old
NH
-6
6)
Pap
pir
edd
ipat
ti J
n (
SH-1
8)
Po
nn
urm
ala
i (S
H-1
15
)
Etti
vad
i (o
ld N
H-
23
4)
Car
/ J
eep
/ V
an
22
21
1
12
00
8
71
75
1
48
45
1
06
13
1
10
04
2
92
7
12
58
7
33
2
37
4
Loca
l/Sh
ared
Car
8
3
4
10
1
2
5
5
3
2
2
0
Min
i Bu
s 1
44
8
33
9
15
6
12
46
1
81
1
68
1
03
6
3
44
8
2
Sch
oo
l Bu
s 7
2
28
7
8
85
6
8
32
2
25
5
2
30
9
3
Go
vt. b
us
23
57
1
41
1
91
3
16
81
1
20
6
87
2
56
2
22
1
15
9
49
2
Pvt
. bu
s 1
72
7
14
46
7
15
1
44
9
52
9
82
9
19
2
12
1
39
2
08
LMV
2
31
3
13
06
1
35
0
22
06
1
15
1
21
43
4
97
3
51
2
25
6
29
LCV
(4
Wh
eels
) 1
36
6
8
65
3
49
1
19
1
71
1
6
22
6
3
0
LCV
(6
Wh
eels
) 1
64
3
14
29
9
42
3
01
1
18
56
2
74
4
11
7
17
1
53
2
73
2 A
xle
95
0
92
7
89
4
17
86
7
17
1
21
3
17
4
43
3
64
2
87
3 A
xle
20
24
9
70
5
66
1
88
4
76
9
14
98
1
57
6
66
1
06
5
43
MA
V (
4 -
6 A
xles
) 1
69
5
13
05
6
31
2
05
8
14
51
4
03
3
70
7
78
7
3
63
0
MA
V (
7++
Axl
es)
0
0
0
0
1
0
0
0
0
0
2 W
hee
ler
23
87
8
52
13
8
80
7
14
79
5
11
81
9
54
50
9
86
4
17
30
2
33
1
50
07
3 w
hee
ler/
Au
to
85
1
10
6
21
3
40
4
10
95
5
07
3
61
7
4
3
10
2
Trac
tor
2
8
8
2
5
4
7
12
1
4
Trac
tor
wit
h t
raile
r 7
1
7
13
4
1
5
19
2
1
13
1
2
0
Cyc
le
13
6
1
9
12
1
18
1
16
1
05
3
3
38
4
2
Cyc
le r
icks
haw
3
0
3
2
2
1
1
0
0
0
An
imal
dra
wn
0
0
0
0
0
1
0
0
0
2
Toll
exe
mp
ted
V
ehic
les
47
2
2
18
3
4
28
2
8
6
2
0
2
Tolla
ble
Veh
icle
s 3
66
59
2
12
41
1
34
95
3
06
12
1
86
66
2
47
12
5
04
3
41
38
1
53
4
56
41
Tolla
ble
PC
U
58
46
5
36
29
1
22
61
7
53
88
8
31
40
4
49
25
7
80
26
9
97
5
26
37
1
12
85
No
n-t
oll
able
veh
icle
s 2
48
01
5
37
2
90
81
1
52
53
1
30
82
6
12
6
10
36
5
17
97
2
41
4
51
79
No
n-t
olla
ble
PC
U
12
90
2
28
34
4
72
7
78
80
7
18
1
34
27
5
46
1
96
8
12
34
2
73
8
Mo
tori
sed
Veh
icle
s 6
14
44
2
66
07
2
25
54
4
58
51
3
16
28
3
07
20
1
53
02
5
90
2
39
10
1
07
76

Co
nsu
lta
ncy
Ser
vice
s fo
r p
rep
ara
tio
n o
f D
PR
fo
r d
evel
op
men
t o
f Ec
on
om
ic C
orr
ido
rs, I
nte
r C
orr
ido
rs, F
eed
er R
ou
tes
an
d N
ati
on
al
corr
ido
rs (
GQ
an
d N
S -EW
Co
rrid
ors
) to
imp
rove
th
e ef
fici
ency
of
frei
gh
t m
ove
men
t in
Ind
ia u
nd
er B
ha
ratm
ala
Pa
riyo
jan
a (
Ch
enn
ai-
Sale
m H
igh
wa
y)
Fea
sib
ility
Rep
ort
V
olu
me –
I (M
ain
Rep
ort
) Tr
aff
ic S
tud
ies
& F
ore
cast
s
Fee
db
ack
Infr
a P
vt. L
td.
4-1
4
Nat
ion
al H
igh
way
s A
uth
ori
ty o
f In
dia
Mo
de
of
Ve
hic
le
Par
anu
r TP
(o
ld
NH
-45
)
Sen
guri
chi T
P (
old
N
H-4
5)
Me
ttu
pat
ti
TP (
old
NH
-6
8)
Nem
ili
TP (
old
N
H-4
)
Pal
liko
nd
a T
P (
old
N
H-4
)
Pal
ayam
TP
(o
ld
NH
-7)
Som
asip
adi (
old
NH
-6
6)
Pap
pir
edd
ipat
ti J
n (
SH-1
8)
Po
nn
urm
ala
i (S
H-1
15
)
Etti
vad
i (o
ld N
H-
23
4)
No
n-M
oto
rise
d
Veh
icle
s 1
6
6
22
1
4
12
0
11
8
10
6
33
3
8
44
Tota
l Veh
icle
s 6
14
60
2
66
13
2
25
76
4
58
65
3
17
48
3
08
38
1
54
08
5
93
5
39
48
1
08
20
Tota
l PC
U
71
36
7
39
12
5
27
34
4
61
76
8
38
58
5
52
68
4
13
48
7
10
94
3
38
71
1
40
22

Consultancy Services for preparation of DPR for development of Economic Corridors, Inter Corridors, Feeder Routes and National corridors (GQ and NS-EW Corridors) to improve the efficiency of freight movement in India under Bharatmala Pariyojana (Chennai-Salem Highway)
Feasibility Report Volume – I (Main Report)
Traffic Studies & Forecasts
Feedback Infra Pvt. Ltd. 4-15 National Highways Authority of India
Table 4-11: Summary of ADT and AADT at count locations
Sl. No. Location ADT AADT
Nos. PCUs Nos. PCUs
1 Paranur TP (old NH-45) 66247 82995 61460 71367
2 Sengurichi TP (old NH-45) 25864 39739 26613 39125
3 Mettupatti TP (old NH-68) 23064 28369 22576 27344
4 Nemili TP (old NH-4) 45399 61424 45865 61768
5 Pallikonda TP (old NH-4) 31913 40003 31748 38585
6 Palayam TP (old NH-7) 30611 54038 30838 52684
7 Somasipadi (near Tiruvanamalai) (old NH-66) 15615 13701 15408 13487
8 Pappireddipatti Jn. (Harur road) (SH-18) 6266 11535 5935 10943
9 Ponnur Malai (near Vandavasi) (SH-115) 3915 3858 3948 3871
10 Ettivadi (near Polur) (NH-234) 11182 14158 10820 14022
4.1.5.2.2 Composition of traffic
The average composition of tollable traffic at count locations is presented in Figure 4-3 and Table 4-12 shows the average composition of total traffic at CTVC count locations. It is observed that two wheelers are having highest share of composition i.e., from 17.8% to 63.9% and next by cars i.e., from 18.6% to 41.5%. In terms of freight traffic LMVs & LCVs share are more in all location. MAVs share is more in toll plaza locations followed by 3-Axle trucks and 2-Axle trucks.
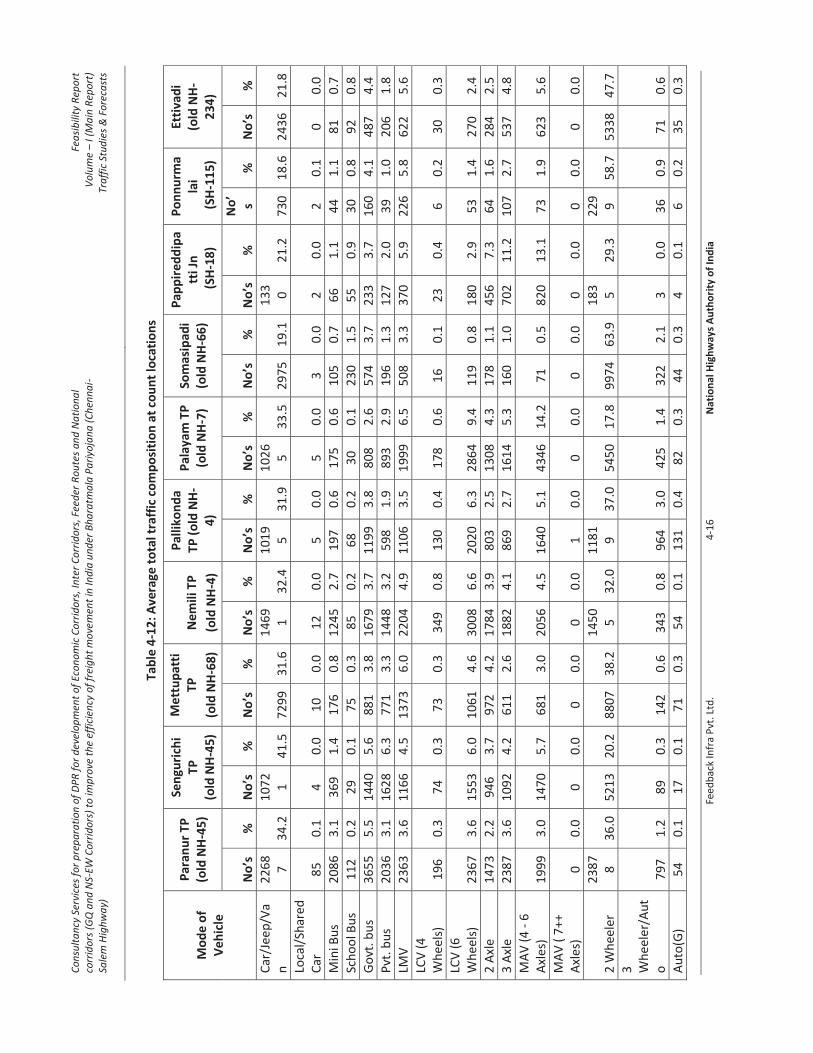
Co
nsu
lta
ncy
Ser
vice
s fo
r p
rep
ara
tio
n o
f D
PR
fo
r d
evel
op
men
t o
f Ec
on
om
ic C
orr
ido
rs, I
nte
r C
orr
ido
rs, F
eed
er R
ou
tes
an
d N
ati
on
al
corr
ido
rs (
GQ
an
d N
S -EW
Co
rrid
ors
) to
imp
rove
th
e ef
fici
ency
of
frei
gh
t m
ove
men
t in
Ind
ia u
nd
er B
ha
ratm
ala
Pa
riyo
jan
a (
Ch
enn
ai-
Sale
m H
igh
wa
y)
Fea
sib
ility
Rep
ort
V
olu
me –
I (M
ain
Rep
ort
) Tr
aff
ic S
tud
ies
& F
ore
cast
s
Fee
db
ack
Infr
a P
vt. L
td.
4-1
6
Nat
ion
al H
igh
way
s A
uth
ori
ty o
f In
dia
Tab
le 4
-12
: Ave
rage
to
tal t
raff
ic c
om
po
siti
on
at
cou
nt
loca
tio
ns
Mo
de
of
Veh
icle
Par
anu
r T
P
(old
NH
-45
)
Sen
guri
chi
TP
(old
NH
-45
)
Me
ttu
pat
ti
TP
(old
NH
-68
)
Nem
ili T
P
(old
NH
-4)
Pal
liko
nd
a TP
(o
ld N
H-
4)
Pal
ayam
TP
(o
ld N
H-7
) So
mas
ipad
i (o
ld N
H-6
6)
Pap
pir
edd
ipa
tti J
n
(SH
-18
)
Po
nn
urm
ala
i (
SH- 1
15
)
Etti
vad
i (o
ld N
H-
23
4)
No’
s %
N
o’s
%
N
o’s
%
No’
s %
N
o’s
%
No’
s %
N
o’s
%
No’
s %
N
o’ s %
N
o’s
%
Car
/Jee
p/V
an
2
26
87
3
4.2
1
07
21
4
1.5
7
29
9
31
.6
14
69
1
32
.4
10
19
5
31
.9
10
26
5
33
.5
29
75
1
9.1
1
33 0
21
.2
73
0
18
.6
24
36
2
1.8
Loca
l/Sh
ared
C
ar
85
0
.1
4
0.0
1
0
0.0
1
2
0.0
5
0
.0
5
0.0
3
0
.0
2
0.0
2
0
.1
0
0.0
Min
i Bu
s 2
08
6
3.1
3
69
1
.4
17
6
0.8
1
24
5
2.7
1
97
0
.6
17
5
0.6
1
05
0
.7
66
1
.1
44
1
.1
81
0
.7
Sch
oo
l Bu
s 1
12
0
.2
29
0
.1
75
0
.3
85
0
.2
68
0
.2
30
0
.1
23
0
1.5
5
5
0.9
3
0
0.8
9
2
0.8
Go
vt. b
us
36
55
5
.5
14
40
5
.6
88
1
3.8
1
67
9
3.7
1
19
9
3.8
8
08
2
.6
57
4
3.7
2
33
3
.7
16
0
4.1
4
87
4
.4
Pvt
. bu
s 2
03
6
3.1
1
62
8
6.3
7
71
3
.3
14
48
3
.2
59
8
1.9
8
93
2
.9
19
6
1.3
1
27
2
.0
39
1
.0
20
6
1.8
LMV
2
36
3
3.6
1
16
6
4.5
1
37
3
6.0
2
20
4
4.9
1
10
6
3.5
1
99
9
6.5
5
08
3
.3
37
0
5.9
2
26
5
.8
62
2
5.6
LCV
(4
W
hee
ls)
19
6
0.3
7
4
0.3
7
3
0.3
3
49
0
.8
13
0
0.4
1
78
0
.6
16
0
.1
23
0
.4
6
0.2
3
0
0.3
LCV
(6
W
hee
ls)
23
67
3
.6
15
53
6
.0
10
61
4
.6
30
08
6
.6
20
20
6
.3
28
64
9
.4
11
9
0.8
1
80
2
.9
53
1
.4
27
0
2.4
2 A
xle
14
73
2
.2
94
6
3.7
9
72
4
.2
17
84
3
.9
80
3
2.5
1
30
8
4.3
1
78
1
.1
45
6
7.3
6
4
1.6
2
84
2
.5
3 A
xle
23
87
3
.6
10
92
4
.2
61
1
2.6
1
88
2
4.1
8
69
2
.7
16
14
5
.3
16
0
1.0
7
02
1
1.2
1
07
2
.7
53
7
4.8
MA
V (
4 -
6
Axl
es)
19
99
3
.0
14
70
5
.7
68
1
3.0
2
05
6
4.5
1
64
0
5.1
4
34
6
14
.2
71
0
.5
82
0
13
.1
73
1
.9
62
3
5.6
MA
V (
7++
A
xles
) 0
0
.0
0
0.0
0
0
.0
0
0.0
1
0
.0
0
0.0
0
0
.0
0
0.0
0
0
.0
0
0.0
2 W
hee
ler
23
87
8
36
.0
52
13
2
0.2
8
80
7
38
.2
14
50
5
32
.0
11
81
9
37
.0
54
50
1
7.8
9
97
4
63
.9
18
3 5
29
.3
22
99
5
8.7
5
33
8
47
.7
3
Wh
eele
r/A
ut
o
79
7
1.2
8
9
0.3
1
42
0
.6
34
3
0.8
9
64
3
.0
42
5
1.4
3
22
2
.1
3
0.0
3
6
0.9
7
1
0.6
Au
to(G
) 5
4
0.1
1
7
0.1
7
1
0.3
5
4
0.1
1
31
0
.4
82
0
.3
44
0
.3
4
0.1
6
0
.2
35
0
.3
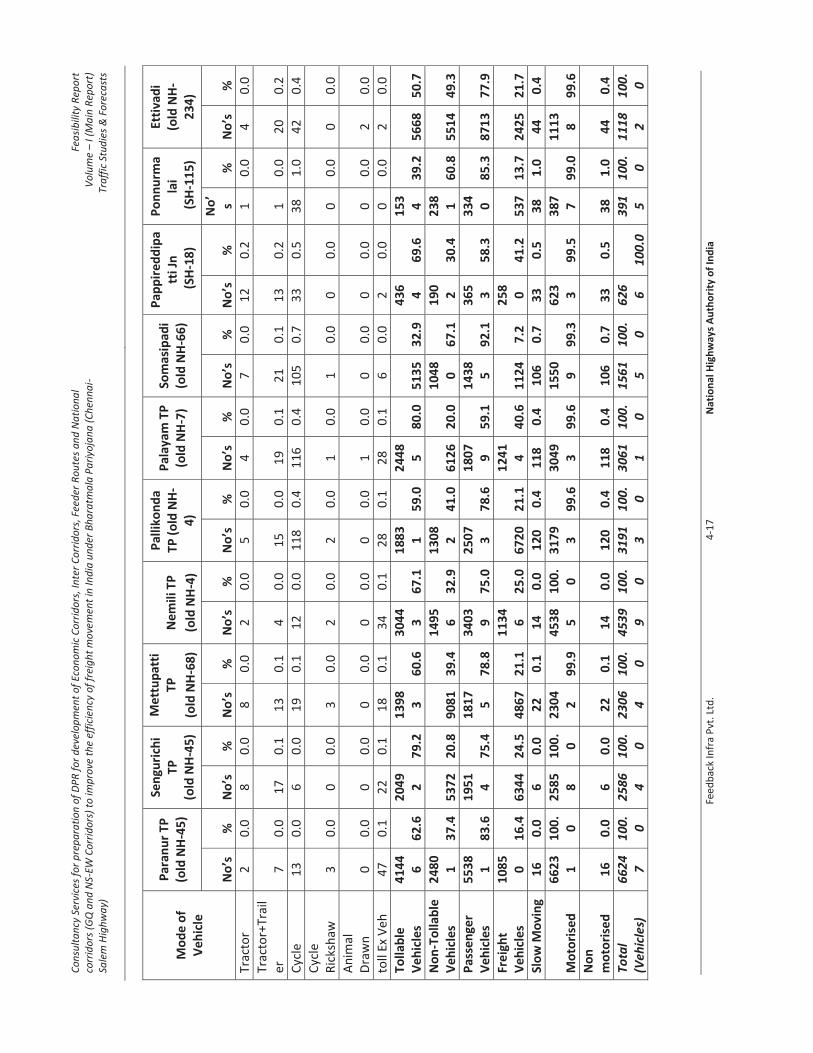
Co
nsu
lta
ncy
Ser
vice
s fo
r p
rep
ara
tio
n o
f D
PR
fo
r d
evel
op
men
t o
f Ec
on
om
ic C
orr
ido
rs, I
nte
r C
orr
ido
rs, F
eed
er R
ou
tes
an
d N
ati
on
al
corr
ido
rs (
GQ
an
d N
S -EW
Co
rrid
ors
) to
imp
rove
th
e ef
fici
ency
of
frei
gh
t m
ove
men
t in
Ind
ia u
nd
er B
ha
ratm
ala
Pa
riyo
jan
a (
Ch
enn
ai-
Sale
m H
igh
wa
y)
Fea
sib
ility
Rep
ort
V
olu
me –
I (M
ain
Rep
ort
) Tr
aff
ic S
tud
ies
& F
ore
cast
s
Fee
db
ack
Infr
a P
vt. L
td.
4-1
7
Nat
ion
al H
igh
way
s A
uth
ori
ty o
f In
dia
Mo
de
of
Veh
icle
Par
anu
r T
P
(old
NH
-45
)
Sen
guri
chi
TP
(old
NH
-45
)
Me
ttu
pat
ti
TP
(old
NH
-68
)
Nem
ili T
P
(old
NH
-4)
Pal
liko
nd
a TP
(o
ld N
H-
4)
Pal
ayam
TP
(o
ld N
H-7
) So
mas
ipad
i (o
ld N
H-6
6)
Pap
pir
edd
ipa
tti J
n
(SH
-18
)
Po
nn
urm
ala
i (
SH- 1
15
)
Etti
vad
i (o
ld N
H-
23
4)
No’
s %
N
o’s
%
N
o’s
%
No’
s %
N
o’s
%
No’
s %
N
o’s
%
No’
s %
N
o’ s %
N
o’s
%
Trac
tor
2
0.0
8
0
.0
8
0.0
2
0
.0
5
0.0
4
0
.0
7
0.0
1
2
0.2
1
0
.0
4
0.0
Trac
tor+
Trai
ler
7
0
.0
17
0
.1
13
0
.1
4
0.0
1
5
0.0
1
9
0.1
2
1
0.1
1
3
0.2
1
0
.0
20
0
.2
Cyc
le
13
0
.0
6
0.0
1
9
0.1
1
2
0.0
1
18
0
.4
11
6
0.4
1
05
0
.7
33
0
.5
38
1
.0
42
0
.4
Cyc
le
Ric
ksh
aw
3
0.0
0
0
.0
3
0.0
2
0
.0
2
0.0
1
0
.0
1
0.0
0
0
.0
0
0.0
0
0
.0
An
imal
D
raw
n
0
0.0
0
0
.0
0
0.0
0
0
.0
0
0.0
1
0
.0
0
0.0
0
0
.0
0
0.0
2
0
.0
toll
Ex V
eh
47
0
.1
22
0
.1
18
0
.1
34
0
.1
28
0
.1
28
0
.1
6
0.0
2
0
.0
0
0.0
2
0
.0
Tolla
ble
V
ehic
les
41
44
6
62
.6
20
49
2
79
.2
13
98
3
60
.6
30
44
3
67
.1
18
83
1
59
.0
24
48
5
80
.0
51
35
3
2.9
4
36 4
69
.6
15
34
3
9.2
5
66
8
50
.7
No
n-T
olla
ble
V
ehic
les
24
80
1
37
.4
53
72
2
0.8
9
08
1
39
.4
14
95
6
32
.9
13
08
2
41
.0
61
26
2
0.0
1
04
80
6
7.1
1
90 2
30
.4
23
81
6
0.8
5
51
4
49
.3
Pas
sen
ger
Veh
icle
s 5
53
81
8
3.6
1
95
14
7
5.4
1
81
75
7
8.8
3
40
39
7
5.0
2
50
73
7
8.6
1
80
79
5
9.1
1
43
85
9
2.1
3
65 3
58
.3
33
40
8
5.3
8
71
3
77
.9
Fre
igh
t V
ehic
les
10
85
0
16
.4
63
44
2
4.5
4
86
7
21
.1
11
34
6
25
.0
67
20
2
1.1
1
24
14
4
0.6
1
12
4
7.2
2
58 0
41
.2
53
7
13
.7
24
25
2
1.7
Slo
w M
ovi
ng
16
0
.0
6
0.0
2
2
0.1
1
4
0.0
1
20
0
.4
11
8
0.4
1
06
0
.7
33
0
.5
38
1
.0
44
0
.4
Mo
tori
sed
6
62
31
1
00
.0
2
58
58
1
00
.0
2
30
42
9
9.9
4
53
85
1
00
.0
3
17
93
9
9.6
3
04
93
9
9.6
1
55
09
9
9.3
6
23 3
99
.5
38
77
9
9.0
1
11
38
9
9.6
No
n
mo
tori
sed
1
6
0.0
6
0
.0
22
0
.1
14
0
.0
12
0
0.4
1
18
0
.4
10
6
0.7
3
3
0.5
3
8
1.0
4
4
0.4
Tota
l (V
ehic
les)
6
62
47
1
00
.0
2
58
64
1
00
.0
2
30
64
1
00
.0
4
53
99
1
00
.0
3
19
13
1
00
.0
3
06
11
1
00
.0
1
56
15
1
00
.0
6
26 6
10
0.0
3
91
5
10
0.
0
11
18
2
10
0.
0

Consultancy Services for preparation of DPR for development of Economic Corridors, Inter Corridors, Feeder Routes and National corridors (GQ and NS-EW Corridors) to improve the efficiency of freight movement in India under Bharatmala Pariyojana (Chennai-Salem Highway)
Feasibility Report Volume – I (Main Report)
Traffic Studies & Forecasts
Feedback Infra Pvt. Ltd. 4-18 National Highways Authority of India
Car 34%
Mini Bus 3% Bus
9% LMV 4%
LCV 4%
2 Axle 2%
3 Axle 4%
MAV 3%
2 wheeler 36%
Auto 1%
Tractor 0%
NMT 0% Toll
exempted 0%
Vehicle Composition at Paranur TP (old NH-45)
Car 42%
Mini Bus 1% Bus
12%
LMV 5%
LCV 6%
2 Axle 4%
3 Axle 4%
MAV 6%
2 wheeler 20%
Auto 0%
Tractor 0%
NMT 0%
Toll exempted
0%
Vehicle Composition at Sengurichi TP (old NH-45)
Car 32%
Mini Bus 1% Bus
7% LMV 6%
LCV 5%
2 Axle 4%
3 Axle 3%
MAV 3%
2 wheeler 38%
Auto 1%
Tractor 0% NMT
0%
Toll exempted
0%
Vehicle Composition at Mettupatti TP (old NH-68)
Car32%
Mini Bus3%Bus
7%LMV5%
LCV7%
2 Axle4%
3 Axle4%
MAV5%
2 wheeler32%
Auto1%
Tractor0%
NMT0%
Tollexempted
0%
Vehicle Composition at Nemili TP (old NH-4)
Car 32%
Mini Bus 1% Bus
6% LMV 3%
LCV 7%
2 Axle 3%
3 Axle 3%
MAV 5%
2 wheeler 37%
Auto 3%
Tractor 0%
NMT 0%
Toll exempted
0%
Vehicle Composition at Pallikonda TP (old NH-4)
Car34%
Mini Bus1%Bus
6%LMV6%LCV
10%
2 Axle4%
3 Axle5%
MAV14%
2 wheeler18%
Auto2%
Tractor0%
NMT0%
Tollexempted
0%
Vehicle Composition at Palayam TP ( old NH-7)
Car 19%
Mini Bus 1%
Bus 6%
LMV 3%
LCV 1%
2 Axle 1%
3 Axle 1%
MAV 1%
2 wheeler 64%
Auto 2%
Tractor 0%
NMT 1%
Toll exempted
0%
Vehicle Composition at Somasipadi (old NH-66)
Car 21% Mini Bus
1%
Bus 7%
LMV 6%
LCV 3% 2 Axle
7% 3 Axle 11%
MAV 13%
2 wheeler 29%
Auto 0%
Tractor 1%
NMT 1%
Toll exempted
0%
Vehicle Composition at Pappireddipatti Jn (SH-18)
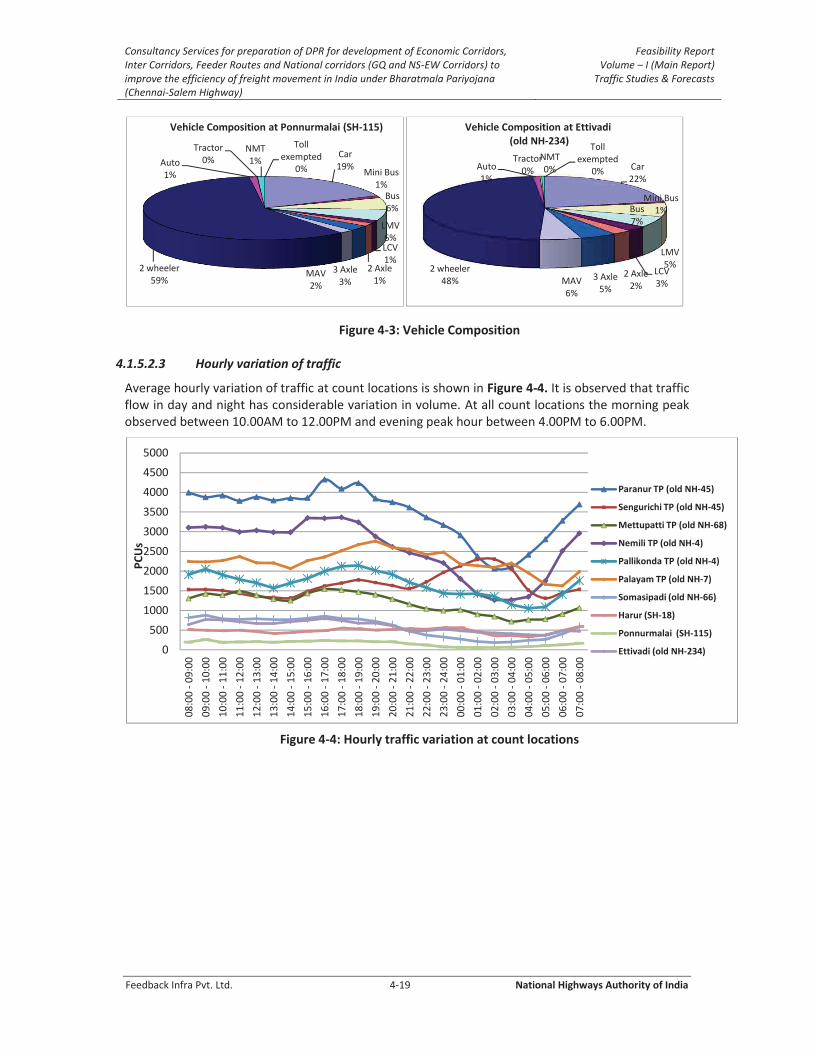
Consultancy Services for preparation of DPR for development of Economic Corridors, Inter Corridors, Feeder Routes and National corridors (GQ and NS-EW Corridors) to improve the efficiency of freight movement in India under Bharatmala Pariyojana (Chennai-Salem Highway)
Feasibility Report Volume – I (Main Report)
Traffic Studies & Forecasts
Feedback Infra Pvt. Ltd. 4-19 National Highways Authority of India
Figure 4-3: Vehicle Composition
4.1.5.2.3 Hourly variation of traffic
Average hourly variation of traffic at count locations is shown in Figure 4-4. It is observed that traffic flow in day and night has considerable variation in volume. At all count locations the morning peak observed between 10.00AM to 12.00PM and evening peak hour between 4.00PM to 6.00PM.
Figure 4-4: Hourly traffic variation at count locations
Car 19%
Mini Bus 1%
Bus 6%
LMV 6% LCV 1%
2 Axle 1%
3 Axle 3%
MAV 2%
2 wheeler 59%
Auto 1%
Tractor 0%
NMT 1%
Toll exempted
0%
Vehicle Composition at Ponnurmalai (SH-115)
Car 22%
Mini Bus1% Bus
7%
LMV 5%
LCV 3%
2 Axle 2%
3 Axle 5%
MAV 6%
2 wheeler 48%
Auto 1%
Tractor 0%
NMT 0%
Toll exempted
0%
Vehicle Composition at Ettivadi (old NH-234)
0
500
1000
1500
2000
2500
3000
3500
4000
4500
5000
08
:00
- 0
9:0
0
09
:00
- 1
0:0
0
10
:00
- 1
1:0
0
11
:00
- 1
2:0
0
12
:00
- 1
3:0
0
13
:00
- 1
4:0
0
14
:00
- 1
5:0
0
15
:00
- 1
6:0
0
16
:00
- 1
7:0
0
17
:00
- 1
8:0
0
18
:00
- 1
9:0
0
19
:00
- 2
0:0
0
20
:00
- 2
1:0
0
21
:00
- 2
2:0
0
22
:00
- 2
3:0
0
23
:00
- 2
4:0
0
00
:00
- 0
1:0
0
01
:00
- 0
2:0
0
02
:00
- 0
3:0
0
03
:00
- 0
4:0
0
04
:00
- 0
5:0
0
05
:00
- 0
6:0
0
06
:00
- 0
7:0
0
07
:00
- 0
8:0
0
PC
Us
Paranur TP (old NH-45)
Sengurichi TP (old NH-45)
Mettupatti TP (old NH-68)
Nemili TP (old NH-4)
Pallikonda TP (old NH-4)
Palayam TP (old NH-7)
Somasipadi (old NH-66)
Harur (SH-18)
Ponnurmalai (SH-115)
Ettivadi (old NH-234)

Consultancy Services for preparation of DPR for development of Economic Corridors, Inter Corridors, Feeder Routes and National corridors (GQ and NS-EW Corridors) to improve the efficiency of freight movement in India under Bharatmala Pariyojana (Chennai-Salem Highway)
Feasibility Report Volume – I (Main Report)
Traffic Studies & Forecasts
Feedback Infra Pvt. Ltd. 4-20 National Highways Authority of India
4.1.5.2.4 Daily variation of traffic volume
Figure 4-5: Daily variation of traffic at count locations
Daily variation of traffic for count locations is shown in Figure 4-5. Daily variation of traffic in terms of day factors at count locations is presented in Table 4-5.
Table 4-13: Day factors and maximum variations
Location Monday Tuesday Wednesday Thursday Friday Saturday Sunday
Paranur TP (old NH-45) 2.9 -2.6 2.8 -1.4 -1.4 1.9 -2.2
Sengurichi TP (old NH-45) -13.1 -2.6 -3.4 0.7 7.5 8.7 2.3
Mettupatti TP (old NH-68) -7.7 0.0 2.9 -6.0 5.1 5.9 0.1
Nemili TP (old NH-4) 7.3 -0.4 -0.4 6.4 1.8 -0.2 -14.4
Pallikonda TP (old NH-4) -4.1 -9.8 -5.4 3.2 1.5 4.6 10.1
Palayam TP (old NH-7) -6.4 -5.1 -3.3 7.9 3.4 2.0 1.6
Somasipadi (old NH-66) 0.7 -20.1 -4.5 20.9 5.7 6.8 -9.5
Pappireddipatti Jn. (SH-18) -8.9 0.0 8.6 -1.1 -2.3 4.1 -0.5
Ponnur Malai (SH-115) 5.1 6.1 -11.3
Ettivadi (NH-234) -7.0 -7.3 14.4
Daily traffic for 7 days at count locations in histogram form is presented in Figure 4-6 and the variation of daily total PCU is presented in Table 4-14 along with maximum and minimum variations from average volume in percentages.
Table 4-14: Daily Variation of Traffic Volume (PCUs)
Location Mon Tue Wed Thu Fri Sat Sun ADT
Maximum variation
+ Ve (%) - Ve (%)
Paranur TP (old NH-45) 85390 80812 85356 81804 81835 84566 81172 82995 2.9 -2.6
Sengurichi TP (old NH-45) 34547 38723 38383 40017 42720 43207 40650 39739 8.7 -13.1
Mettupatti TP (old NH-68) 26173 28367 29183 26664 29820 30034 28387 28369 5.9 -7.7
0
10000
20000
30000
40000
50000
60000
70000
80000
90000
Monday Tuesday Wednesday Thursday Friday Saturday Sunday
PC
Us
km 52.820 (old NH-45)
km 192.750 (old NH-45)
km 21.750 (old NH-68)
km 37.800 (old NH-4)
km 98.520 (old NH-4)
km 154.440 (old NH-7)
km 95.600 (old NH-66)
km 31.000 (SH-18)
km 59.000 (SH-115)
km 42.000 (old NH-234)
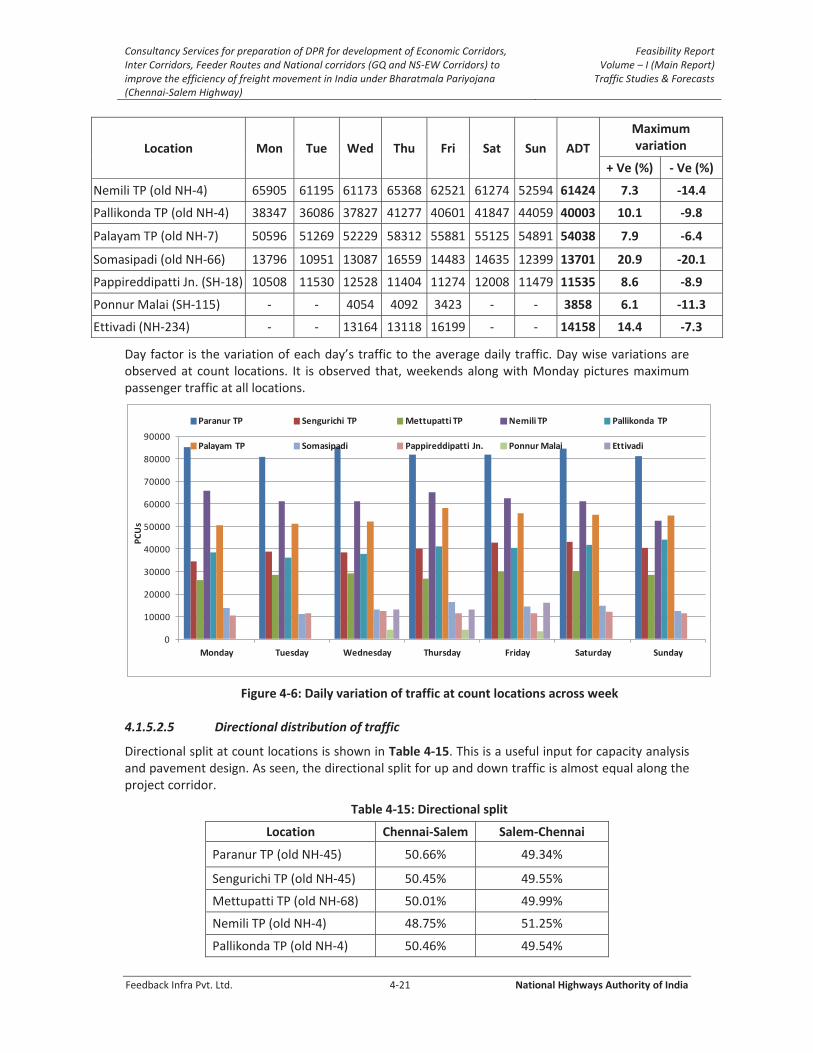
Consultancy Services for preparation of DPR for development of Economic Corridors, Inter Corridors, Feeder Routes and National corridors (GQ and NS-EW Corridors) to improve the efficiency of freight movement in India under Bharatmala Pariyojana (Chennai-Salem Highway)
Feasibility Report Volume – I (Main Report)
Traffic Studies & Forecasts
Feedback Infra Pvt. Ltd. 4-21 National Highways Authority of India
Location Mon Tue Wed Thu Fri Sat Sun ADT
Maximum variation
+ Ve (%) - Ve (%)
Nemili TP (old NH-4) 65905 61195 61173 65368 62521 61274 52594 61424 7.3 -14.4
Pallikonda TP (old NH-4) 38347 36086 37827 41277 40601 41847 44059 40003 10.1 -9.8
Palayam TP (old NH-7) 50596 51269 52229 58312 55881 55125 54891 54038 7.9 -6.4
Somasipadi (old NH-66) 13796 10951 13087 16559 14483 14635 12399 13701 20.9 -20.1
Pappireddipatti Jn. (SH-18) 10508 11530 12528 11404 11274 12008 11479 11535 8.6 -8.9
Ponnur Malai (SH-115) - - 4054 4092 3423 - - 3858 6.1 -11.3
Ettivadi (NH-234) - - 13164 13118 16199 - - 14158 14.4 -7.3
Day factor is the variation of each day’s traffic to the average daily traffic. Day wise variations are observed at count locations. It is observed that, weekends along with Monday pictures maximum passenger traffic at all locations.
Figure 4-6: Daily variation of traffic at count locations across week
4.1.5.2.5 Directional distribution of traffic
Directional split at count locations is shown in Table 4-15. This is a useful input for capacity analysis and pavement design. As seen, the directional split for up and down traffic is almost equal along the project corridor.
Table 4-15: Directional split
Location Chennai-Salem Salem-Chennai
Paranur TP (old NH-45) 50.66% 49.34%
Sengurichi TP (old NH-45) 50.45% 49.55%
Mettupatti TP (old NH-68) 50.01% 49.99%
Nemili TP (old NH-4) 48.75% 51.25%
Pallikonda TP (old NH-4) 50.46% 49.54%
0
10000
20000
30000
40000
50000
60000
70000
80000
90000
Monday Tuesday Wednesday Thursday Friday Saturday Sunday
PC
Us
Paranur TP Sengurichi TP Mettupatti TP Nemili TP Pallikonda TP
Palayam TP Somasipadi Pappireddipatti Jn. Ponnur Malai Ettivadi

Consultancy Services for preparation of DPR for development of Economic Corridors, Inter Corridors, Feeder Routes and National corridors (GQ and NS-EW Corridors) to improve the efficiency of freight movement in India under Bharatmala Pariyojana (Chennai-Salem Highway)
Feasibility Report Volume – I (Main Report)
Traffic Studies & Forecasts
Feedback Infra Pvt. Ltd. 4-22 National Highways Authority of India
Location Chennai-Salem Salem-Chennai
Palayam TP (old NH-7) 50.67% 49.33%
Somasipadi (old NH-66) 49.38% 50.62%
Pappireddipatti Jn. (SH-18) 52.51% 47.49%
Ponnur Malai (SH-115) 53.26% 46.74%
Ettivadi (NH-234) 52.40% 47.60%
4.1.5.3 Origin – Destination Survey
The O–D survey has been carried out on random sample basis and sample size in terms of percentage of daily traffic obtained for each class of vehicle is shown in Table 4-16 below.
Table 4-16: Sample Size for O – D Survey
S. No Vehicle type Paranur TP (old NH-45)
Sengurichi TP (old NH-45)
Mettupatti TP
(old NH-68) Nemili TP
(old NH-4)
Pallikonda TP (old NH-4)
1 Car / Jeep / Van 28.20% 31.86% 36.39% 22.58% 28.89%
2 Bus 17.22% 28.24% 39.52% 16.20% 19.28%
3 LMV 19.65% 20.97% 42.86% 17.03% 17.20%
4 LCV 20.55% 24.53% 23.62% 17.14% 24.24%
5 2 Axle Truck 44.00% 51.95% 69.77% 47.59% 54.91%
6 3 Axle Truck 23.96% 45.53% 46.57% 27.08% 43.26%
7 Multi Axle Truck 23.80% 82.96% 64.42% 23.97% 44.22%
S. No Vehicle type Palayam TP (old NH-7)
Somasipadi (old NH-66)
Pappireddipatti Jn (SH-18)
Ponnurmalai (SH-115)
Ettivadi (old NH-234)
1 Car / Jeep / Van 30.92% 27.70% 41.22% 35.60% 19.95%
2 Bus 26.46% 19.71% 54.47% 34.01% 16.98%
3 LMV 22.92% 28.06% 14.59% 23.70% 14.66%
4 LCV 27.46% 34.90% 30.05% 67.39% 28.66%
5 2 Axle Truck 51.71% 24.46% 39.69% 45.16% 42.96%
6 3 Axle Truck 28.52% 29.10% 44.59% 16.10% 38.98%
7 Multi Axle Truck 38.41% 25.69% 25.24% 28.26% 38.94%
The collected data were entered into the computer and checked manually. Incorrect entries were corrected by cross-checking it with original field data sheets. The data was also checked for inconsistencies. The checking included:
Trips from zones to zones which cannot possibly ply through the survey location
Vehicle type with their corresponding lead / load / occupancy for any inconsistencies
The checked and corrected data were used for final analysis.
4.1.5.3.1 Zoning system
For analysis of data collected from the field, it is required to code them for developing origin and destination matrices of trips. The project road passes through in the state of Tamil Nadu. The project stretch comes under Kanchipuram, Tiruvanamalai, Dharmapuri and Salem districts of Tamil nadu
These zones were considered as immediate influence area (IIA) and rest of the zones are considered

Consultancy Services for preparation of DPR for development of Economic Corridors, Inter Corridors, Feeder Routes and National corridors (GQ and NS-EW Corridors) to improve the efficiency of freight movement in India under Bharatmala Pariyojana (Chennai-Salem Highway)
Feasibility Report Volume – I (Main Report)
Traffic Studies & Forecasts
Feedback Infra Pvt. Ltd. 4-23 National Highways Authority of India
as external zones. Neighbouring districts considered as IIA region and remaining districts of Tamil Nadu, Karnataka, Kerala, Andhra Pradesh and Telangana and rest of India were grouped to form external influencing zones. These considerations helped in arriving at 45 zones for the project. The zones are listed in Table 4-17.
Table 4-17: Adopted zoning system for the study
Zone No Description State/District
1 Tiruvallur district Tiruvallur
2 Chennai North (Ennore, Red hills, Aladu, Madhavaram, Vichoor, Ediyanchavadi)
Tiruvallur/Chennai
3 Chennai South (Chennai, Port, Poonamalle, Avadi, Tambaram, Adyar, Velacherry)
Chennai/Kanchipuram
4 Chengalpattu, Maraimalai nagar, Mahabalipuram, Kalpakkam Kanchipuram
5 Sriperambudur, Kanchipuram, Sunguvarchattram, Walajabad Kanchipuram
6 Arakkonnam, Tiruttani, Pallipattu Tiruvallur, Vellore
7 Walajapet, Arcot, Ranipet, Pudupadi, Sholinghur, Ponnai, Ammoor
Vellore
8 Vellore, Katpadi, Brahmapuram, Kannamangalam, Pennathur Vellore
9 Gudiyattam, Pudupettai, Melpatti, Ambur, Agaram, Vinayambadi
Vellore
10 Tirupattur, Jolarpet, Uthangarai, Motupatti, Mathur Vellore/Krishnagiri
11 Hosur, Krishnagiri, Bargur, Denkanalkota Krishnagiri
12 Tirvettipuram, Cheyyar, Kalavai, Kilpudipakkam, Brahmadesam
Tiruvannamalai/Vellore
13 Vandavasi, Uttiramerur, Maduranattakam, Padalam, Melmaruvattur
Tiruvannamalai/Kanchipuram
14 Arani, Velpadi, Gengapuram, Semmambadi Tiruvannamalai
15 Chetpet, Sattambadi, Avalurpettai Tiruvannamalai/Villupuram
16 Polur, Ettivadi, Tirusur, Kunnathur, Kalasapakkam, Pettai, Palankovil
Tiruvannamalai
17 Tiruvannamalai Tiruvannamalai
18 Chengam, Valayampattu, Kottakulam, Kariyamangalam Tiruvannamalai
19 Gingee, Tindivanam, Vairapuram, Marakkanam Villupuram
20 Villupuram, Tirukovillur, Kallakurichi, Rest of Villupuram Villupuram
21 Harur, Morappur Dharmapuri
22 Dharmapuri Dharmapuri
23 Markarampatti, Pallippatti, Samiyapuram, Lakshmipuram, Valvandi
Dharmapuri
24 Yercaud, Kulampatti, Vazhappadi, Ayodhyapattnam, Belur Salem
25 Salem Salem
26 Attur, Gangavalli, Malliyakarai, Sondarapalli Salem
27 Omalur, Mettur, Kadiyampatti Salem

Consultancy Services for preparation of DPR for development of Economic Corridors, Inter Corridors, Feeder Routes and National corridors (GQ and NS-EW Corridors) to improve the efficiency of freight movement in India under Bharatmala Pariyojana (Chennai-Salem Highway)
Feasibility Report Volume – I (Main Report)
Traffic Studies & Forecasts
Feedback Infra Pvt. Ltd. 4-24 National Highways Authority of India
Zone No Description State/District
28 Cuddalore, Nagapattanam, Perambalur, Thiruvarur, Thanjavur
Tamil Nadu
29 Tiruchchurapalli Tamil Nadu
30 Nammakal, Karur districts Tamil Nadu
31 Erode, Coimbatore, Nilgiris Tamil Nadu
32 Pudukottai, Sivaganga, Ramanathapuram districts Tamil Nadu
33 Dindigul, Madurai, Theni districts Tamil Nadu
34 Virudunagar, Tuticorin, Tirunelveli, Kanniyakumari districts Tamil Nadu
35 Pondicherry Pondicherry
36 Mysore, Chamaraj nagar districts Karnataka
37 Rest of Karnataka Karnataka
38 Kasaragod, Kannur, Wayanad, Kozhikode districts Kerala
39 Rest of Kerala Kerala
40 Ananthapur, Kadapa, Kurnool districts Andhra Pradesh
41 Nellore, Chittor, Prakasam, Guntur, Krishna (Vijayawada), Vishakhapatnam, Rest of AP
Andhra Pradesh
42 Telangana, Maharashtra states Rest of India
43 Odisha, West Bengal, Chhattisgarh, Bihar, Jharkhand, North East States
Rest of India
44 Gujarat, Rajasthan, Madhya Pradesh, Haryana, Delhi, Himachal Pradesh
Rest of India
45 Rest of India Rest of India
4.1.5.3.2 Expansion factors and development of O – D matrices
The origin – destination details were collected from the trip makers during the survey on sample basis. Sampling varied with the changes in traffic flow across the day. Care has been taken to eliminate any element of bias in sampling. Since data was collected on sample basis, expansion factors are required to replicate the pattern as reflected in the sample to the total number of vehicular trips made during the day. These expansion factors are calculated separately for each class of vehicle. For example, if xc is number of cars interviewed and Xc is the total number of cars counted during the day, then Xc/xc would be the expansion factor for cars.
O – D matrices are developed to assess the traffic movement pattern. These matrices actually speak about distribution of trips for each zone as intra zonal and inter zonal movements. The vehicle wise O – D matrices are developed by multiplying the sample O – D matrix obtained from survey data with expansion factors. Accordingly 8 matrices, for different modes were developed for each survey location. O – D matrices for different vehicle type all ten locations are presented in Annexure 4.2a to 4.2j to this report.
4.1.5.3.3 Lead Distribution
The lead distribution of vehicles as revealed from O – D survey is given in Table 4-18. LMV is included in this, as its trips also impart important characteristics about distances.
Table 4-18: Lead distribution of vehicles
Vehicle type
Trip Length Range (km)
< 20 21 -50 51-100 101-200 201-350 351-500 501-750 751-1000 >1000 Total
Paranur TP (old NH-45)
Car 0.00 2.23 8.75 41.42 27.18 19.43 0.33 0.57 0.09 100.00

Consultancy Services for preparation of DPR for development of Economic Corridors, Inter Corridors, Feeder Routes and National corridors (GQ and NS-EW Corridors) to improve the efficiency of freight movement in India under Bharatmala Pariyojana (Chennai-Salem Highway)
Feasibility Report Volume – I (Main Report)
Traffic Studies & Forecasts
Feedback Infra Pvt. Ltd. 4-25 National Highways Authority of India
Bus 0.00 1.58 16.29 35.75 28.05 17.19 0.68 0.00 0.45 100.00
LMV 0.00 3.14 33.63 43.50 12.56 5.38 1.79 0.00 0.00 100.00
LCV 0.00 2.27 45.31 26.21 11.97 11.33 2.59 0.32 0.00 100.00
2-Axle 0.00 2.00 28.67 54.67 7.73 4.53 1.60 0.67 0.13 100.00
3-Axle 0.00 1.03 22.79 32.06 35.00 6.76 1.18 1.03 0.15 100.00
MAV 0.00 1.34 17.78 54.30 13.96 7.65 2.68 1.72 0.57 100.00
Sengurichi TP (old NH-45)
Car 0.00 2.99 2.06 26.54 52.76 12.45 2.56 0.28 0.36 100.00
Bus 0.00 1.47 0.49 20.47 60.91 13.85 2.45 0.12 0.25 100.00
LMV 0.00 6.98 2.91 26.16 46.51 12.79 3.49 0.00 1.16 100.00
LCV 0.00 4.10 2.24 19.78 55.22 10.45 5.22 0.75 2.24 100.00
2-Axle 0.00 3.71 2.29 16.00 46.86 20.86 8.29 0.29 1.71 100.00
3-Axle 0.00 2.70 1.80 17.72 49.25 17.42 8.71 1.80 0.60 100.00
MAV 0.00 2.46 0.65 17.36 47.93 19.30 9.46 1.68 1.17 100.00
Mettupatti TP (old NH-68)
Car 1.30 0.75 21.64 26.75 29.06 9.52 7.13 3.77 0.08 100.00
Bus 2.34 0.29 13.62 31.92 38.36 5.71 5.71 2.05 0.00 100.00
LMV 1.15 1.64 23.61 32.46 27.05 7.21 4.10 1.48 1.31 100.00
LCV 0.60 1.79 17.91 23.28 28.96 19.40 5.97 2.09 0.00 100.00
2-Axle 1.09 1.09 18.39 22.62 31.34 12.67 8.45 3.00 1.36 100.00
3-Axle 0.62 0.93 15.17 26.63 28.79 12.07 9.29 5.26 1.24 100.00
MAV 0.23 0.92 8.05 14.25 29.20 17.93 14.25 11.72 3.45 100.00
Nemili TP (old NH-4)
Car 0.03 27.20 3.48 40.60 16.33 1.93 2.07 8.14 0.23 100.00
Bus 0.00 29.04 3.31 48.53 13.24 1.47 0.37 4.04 0.00 100.00
LMV 0.00 41.41 3.13 33.59 12.50 4.69 2.34 2.34 0.00 100.00
LCV 0.00 30.37 4.44 32.96 15.19 4.07 1.11 11.48 0.37 100.00
2-Axle 0.00 29.13 2.80 36.01 10.81 3.82 2.54 13.49 1.40 100.00
3-Axle 0.00 22.50 2.46 30.58 17.40 3.34 4.04 18.28 1.41 100.00
MAV 0.00 23.84 0.69 34.03 12.73 6.02 3.01 16.44 3.24 100.00
Pallikonda TP (old NH-4)
Car 0.00 0.14 9.41 21.15 15.86 4.11 25.41 23.60 0.32 100.00
Bus 0.00 0.26 10.16 10.68 12.76 1.30 37.50 27.08 0.26 100.00
LMV 0.00 0.00 25.12 16.26 14.29 4.93 23.65 12.81 2.96 100.00
LCV 0.00 0.00 8.10 16.84 21.96 5.12 23.67 22.39 1.92 100.00
2-Axle 0.00 0.00 3.36 14.35 14.80 3.59 37.44 24.66 1.79 100.00
3-Axle 0.00 0.66 3.62 13.16 17.43 3.29 37.17 22.70 1.97 100.00
MAV 0.00 0.00 4.57 11.34 15.12 5.20 32.60 29.61 1.57 100.00
Palayam TP (old NH-7)
Car 0.00 5.23 17.87 20.13 15.21 6.22 25.16 8.12 2.06 100.00
Bus 0.00 6.70 28.71 16.99 7.18 1.67 30.86 7.66 0.24 100.00
LMV 0.00 8.65 21.31 21.10 15.82 5.49 12.24 5.06 10.34 100.00
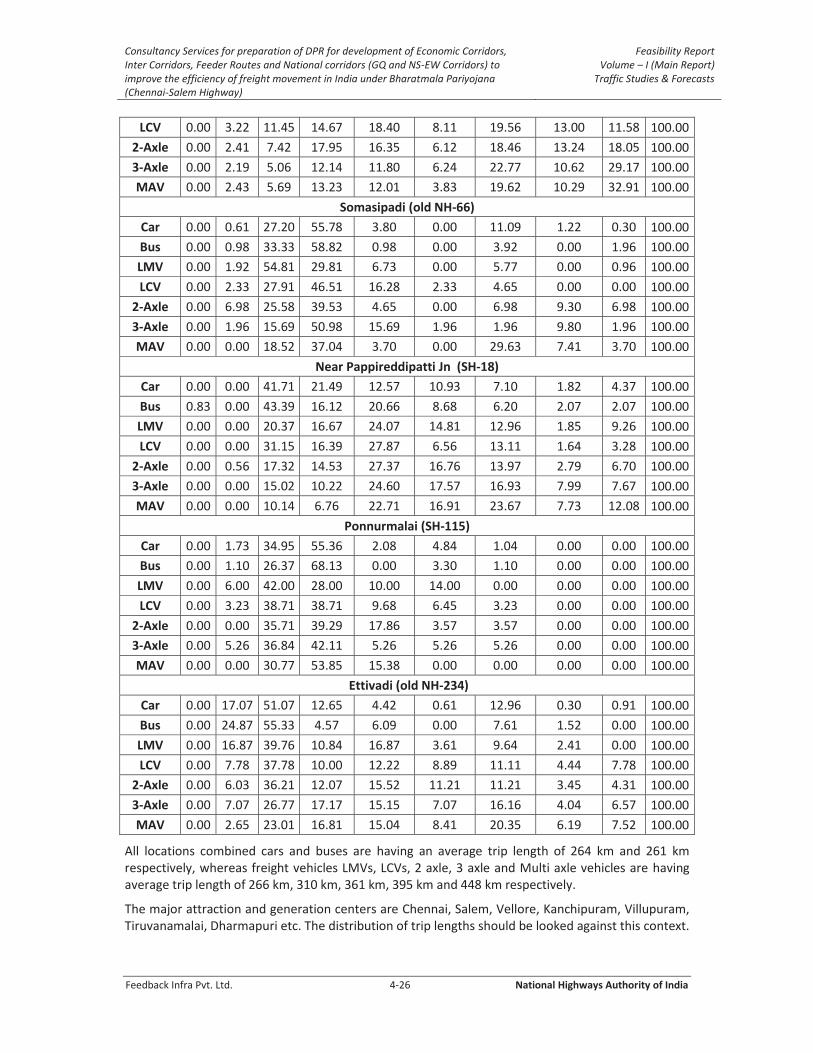
Consultancy Services for preparation of DPR for development of Economic Corridors, Inter Corridors, Feeder Routes and National corridors (GQ and NS-EW Corridors) to improve the efficiency of freight movement in India under Bharatmala Pariyojana (Chennai-Salem Highway)
Feasibility Report Volume – I (Main Report)
Traffic Studies & Forecasts
Feedback Infra Pvt. Ltd. 4-26 National Highways Authority of India
LCV 0.00 3.22 11.45 14.67 18.40 8.11 19.56 13.00 11.58 100.00
2-Axle 0.00 2.41 7.42 17.95 16.35 6.12 18.46 13.24 18.05 100.00
3-Axle 0.00 2.19 5.06 12.14 11.80 6.24 22.77 10.62 29.17 100.00
MAV 0.00 2.43 5.69 13.23 12.01 3.83 19.62 10.29 32.91 100.00
Somasipadi (old NH-66)
Car 0.00 0.61 27.20 55.78 3.80 0.00 11.09 1.22 0.30 100.00
Bus 0.00 0.98 33.33 58.82 0.98 0.00 3.92 0.00 1.96 100.00
LMV 0.00 1.92 54.81 29.81 6.73 0.00 5.77 0.00 0.96 100.00
LCV 0.00 2.33 27.91 46.51 16.28 2.33 4.65 0.00 0.00 100.00
2-Axle 0.00 6.98 25.58 39.53 4.65 0.00 6.98 9.30 6.98 100.00
3-Axle 0.00 1.96 15.69 50.98 15.69 1.96 1.96 9.80 1.96 100.00
MAV 0.00 0.00 18.52 37.04 3.70 0.00 29.63 7.41 3.70 100.00
Near Pappireddipatti Jn (SH-18)
Car 0.00 0.00 41.71 21.49 12.57 10.93 7.10 1.82 4.37 100.00
Bus 0.83 0.00 43.39 16.12 20.66 8.68 6.20 2.07 2.07 100.00
LMV 0.00 0.00 20.37 16.67 24.07 14.81 12.96 1.85 9.26 100.00
LCV 0.00 0.00 31.15 16.39 27.87 6.56 13.11 1.64 3.28 100.00
2-Axle 0.00 0.56 17.32 14.53 27.37 16.76 13.97 2.79 6.70 100.00
3-Axle 0.00 0.00 15.02 10.22 24.60 17.57 16.93 7.99 7.67 100.00
MAV 0.00 0.00 10.14 6.76 22.71 16.91 23.67 7.73 12.08 100.00
Ponnurmalai (SH-115)
Car 0.00 1.73 34.95 55.36 2.08 4.84 1.04 0.00 0.00 100.00
Bus 0.00 1.10 26.37 68.13 0.00 3.30 1.10 0.00 0.00 100.00
LMV 0.00 6.00 42.00 28.00 10.00 14.00 0.00 0.00 0.00 100.00
LCV 0.00 3.23 38.71 38.71 9.68 6.45 3.23 0.00 0.00 100.00
2-Axle 0.00 0.00 35.71 39.29 17.86 3.57 3.57 0.00 0.00 100.00
3-Axle 0.00 5.26 36.84 42.11 5.26 5.26 5.26 0.00 0.00 100.00
MAV 0.00 0.00 30.77 53.85 15.38 0.00 0.00 0.00 0.00 100.00
Ettivadi (old NH-234)
Car 0.00 17.07 51.07 12.65 4.42 0.61 12.96 0.30 0.91 100.00
Bus 0.00 24.87 55.33 4.57 6.09 0.00 7.61 1.52 0.00 100.00
LMV 0.00 16.87 39.76 10.84 16.87 3.61 9.64 2.41 0.00 100.00
LCV 0.00 7.78 37.78 10.00 12.22 8.89 11.11 4.44 7.78 100.00
2-Axle 0.00 6.03 36.21 12.07 15.52 11.21 11.21 3.45 4.31 100.00
3-Axle 0.00 7.07 26.77 17.17 15.15 7.07 16.16 4.04 6.57 100.00
MAV 0.00 2.65 23.01 16.81 15.04 8.41 20.35 6.19 7.52 100.00
All locations combined cars and buses are having an average trip length of 264 km and 261 km respectively, whereas freight vehicles LMVs, LCVs, 2 axle, 3 axle and Multi axle vehicles are having average trip length of 266 km, 310 km, 361 km, 395 km and 448 km respectively.
The major attraction and generation centers are Chennai, Salem, Vellore, Kanchipuram, Villupuram, Tiruvanamalai, Dharmapuri etc. The distribution of trip lengths should be looked against this context.
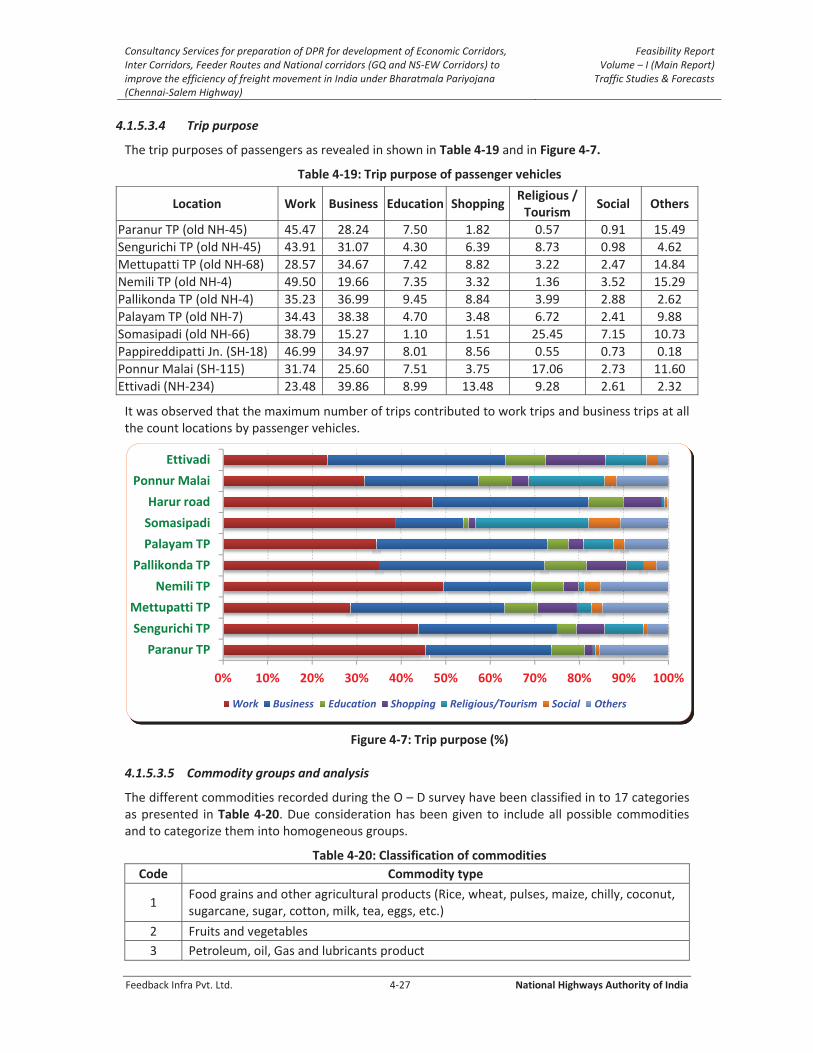
Consultancy Services for preparation of DPR for development of Economic Corridors, Inter Corridors, Feeder Routes and National corridors (GQ and NS-EW Corridors) to improve the efficiency of freight movement in India under Bharatmala Pariyojana (Chennai-Salem Highway)
Feasibility Report Volume – I (Main Report)
Traffic Studies & Forecasts
Feedback Infra Pvt. Ltd. 4-27 National Highways Authority of India
4.1.5.3.4 Trip purpose
The trip purposes of passengers as revealed in shown in Table 4-19 and in Figure 4-7.
Table 4-19: Trip purpose of passenger vehicles
Location Work Business Education Shopping Religious /
Tourism Social Others
Paranur TP (old NH-45) 45.47 28.24 7.50 1.82 0.57 0.91 15.49
Sengurichi TP (old NH-45) 43.91 31.07 4.30 6.39 8.73 0.98 4.62
Mettupatti TP (old NH-68) 28.57 34.67 7.42 8.82 3.22 2.47 14.84
Nemili TP (old NH-4) 49.50 19.66 7.35 3.32 1.36 3.52 15.29
Pallikonda TP (old NH-4) 35.23 36.99 9.45 8.84 3.99 2.88 2.62
Palayam TP (old NH-7) 34.43 38.38 4.70 3.48 6.72 2.41 9.88
Somasipadi (old NH-66) 38.79 15.27 1.10 1.51 25.45 7.15 10.73
Pappireddipatti Jn. (SH-18) 46.99 34.97 8.01 8.56 0.55 0.73 0.18
Ponnur Malai (SH-115) 31.74 25.60 7.51 3.75 17.06 2.73 11.60
Ettivadi (NH-234) 23.48 39.86 8.99 13.48 9.28 2.61 2.32
It was observed that the maximum number of trips contributed to work trips and business trips at all the count locations by passenger vehicles.
Figure 4-7: Trip purpose (%)
4.1.5.3.5 Commodity groups and analysis
The different commodities recorded during the O – D survey have been classified in to 17 categories as presented in Table 4-20. Due consideration has been given to include all possible commodities and to categorize them into homogeneous groups.
Table 4-20: Classification of commodities
Code Commodity type
1 Food grains and other agricultural products (Rice, wheat, pulses, maize, chilly, coconut, sugarcane, sugar, cotton, milk, tea, eggs, etc.)
2 Fruits and vegetables
3 Petroleum, oil, Gas and lubricants product
0% 10% 20% 30% 40% 50% 60% 70% 80% 90% 100%
Paranur TP
Sengurichi TP
Mettupatti TP
Nemili TP
Pallikonda TP
Palayam TP
Somasipadi
Harur road
Ponnur Malai
Ettivadi
Work Business Education Shopping Religious/Tourism Social Others

Consultancy Services for preparation of DPR for development of Economic Corridors, Inter Corridors, Feeder Routes and National corridors (GQ and NS-EW Corridors) to improve the efficiency of freight movement in India under Bharatmala Pariyojana (Chennai-Salem Highway)
Feasibility Report Volume – I (Main Report)
Traffic Studies & Forecasts
Feedback Infra Pvt. Ltd. 4-28 National Highways Authority of India
Code Commodity type
4 Minerals, chemicals, fertilizer, Charcoal, Coal, acid
5 Iron
6 Steel
7 Finished and manufactured products (Product of machinery, rubber, tyres, electric & electronics, glass, plastic, pipes, paint etc.)
8 Automobiles and machinery parts
9 Parcel service, Box and Containers
10 Sand
11 Cement
12 Building materials (Bricks, Stones, Soil, Tiles, Marbles, Granites, Wood, etc )
13 Miscellaneous goods (Livestock, Animal feed/food, Fish, Water, Salt, Waste, Book, Paper, etc)
14 Empty vehicles
The commodity movement pattern along the corridor is analysed and presented in Table 4-21. The percentage of each commodity is shown mode wise for all survey locations. Figure 4-8 shows the bar chart of each commodity.
Table 4-21: Distribution of goods carried by commercial vehicles
Vehicle type
Commodities in % Total 1 2 3 4 5 6 7 8 9 10 11 12 13 14
Paranur TP
LMV 5.83
9.87
5.38
0.90
1.35
0.45
3.59
1.35
15.25
4.93
1.79
13.45
11.21
24.66
100
LCV 6.11
4.50
6.75
1.29
2.25
1.93
3.22
0.96
12.54
5.79
5.47
12.86
7.72
28.62
100
2A Truck 7.32
3.33
9.59
0.27
3.20
1.60
2.13
1.86
17.98
9.59
6.52
17.31
4.66
14.65
100
3A Truck 7.34
3.08
8.08
0.73
3.82
2.06
1.91
1.17
12.48
11.89
6.31
20.56
6.02
14.54
100
MAV 7.24
1.33
16.00
0.76
3.05
2.86
3.62
3.81
14.10
8.76
7.24
15.24
4.38
11.62
100
Sengurichi TP
LMV 9.68
6.91
4.61
0.46
0.46
1.38
4.61
0.92
14.29
0.46
2.76
2.76
5.53
45.16
100
LCV 10.56
5.63
8.45
0.35
0.00
0.70
4.23
1.06
13.73
0.70
4.23
3.87
25.70
20.77
100
2A Truck 13.44
6.98
9.56
2.07
0.26
2.58
6.98
1.55
17.05
0.26
5.43
5.43
9.04
19.38
100
3A Truck 14.16
3.18
11.85
1.45
0.58
2.31
4.62
1.45
18.79
0.29
8.67
6.07
5.49
21.10
100
MAV 9.10
3.20
15.38
0.49
1.35
2.34
4.18
2.46
7.87
2.46
7.50
3.20
5.41
35.06
100
Mettupatti TP
LMV 9.66
7.89
2.58
2.74
0.81
1.77
7.25
0.32
13.53
0.64
3.22
5.96
8.37
35.27
100
LCV 12.72
4.44
1.78
2.37
1.18
3.55
10.36
0.59
17.46
1.48
3.85
4.73
8.58
26.92
100

Consultancy Services for preparation of DPR for development of Economic Corridors, Inter Corridors, Feeder Routes and National corridors (GQ and NS-EW Corridors) to improve the efficiency of freight movement in India under Bharatmala Pariyojana (Chennai-Salem Highway)
Feasibility Report Volume – I (Main Report)
Traffic Studies & Forecasts
Feedback Infra Pvt. Ltd. 4-29 National Highways Authority of India
Vehicle type
Commodities in % Total 1 2 3 4 5 6 7 8 9 10 11 12 13 14
2A Truck 11.31
3.10
3.90
2.42
0.81
1.88
4.04
0.81
12.11
2.15
8.34
6.46
9.02
33.65
100
3A Truck 18.40
2.15
7.06
4.60
2.15
1.53
4.91
1.84
7.67
2.45
5.52
5.21
8.90
27.61
100
MAV 8.82
1.36
7.92
4.30
1.58
3.85
6.79
5.20
10.18
1.13
12.90
4.30
8.82
22.85
100
Nemili TP
LMV 6.06
6.06
8.33
1.52
3.79
0.76
7.58
0.76
11.36
0.76
1.52
12.12
11.36
28.03
100
LCV 8.99
7.55
10.79
0.72
7.91
0.36
5.76
5.04
6.12
2.88
0.36
13.67
7.19
22.66
100
2A Truck 7.59
7.59
7.21
0.13
1.64
0.63
7.84
5.44
13.40
3.41
0.38
11.38
6.32
27.05
100
3A Truck 8.32
3.64
10.92
0.00
3.12
1.39
7.63
4.16
11.44
11.61
0.17
11.96
4.16
21.49
100
MAV 4.11
6.39
9.59
0.00
3.42
0.91
7.99
5.94
13.70
8.68
0.23
12.33
5.25
21.46
100
Pallikonda TP
LMV 12.25
11.76
2.94
1.96
0.00
0.49
8.33
4.41
10.29
2.45
1.96
2.94
8.33
31.86
100
LCV 9.34
9.13
7.01
2.97
0.64
1.27
8.28
7.64
10.40
0.42
3.61
4.67
9.77
24.84
100
2A Truck 12.08
5.37
13.42
0.67
0.45
1.79
10.29
7.38
7.16
0.00
4.70
2.68
10.29
23.71
100
3A Truck 12.79
5.57
9.51
1.97
1.31
1.31
9.18
10.16
4.92
0.66
4.26
6.23
8.20
23.93
100
MAV 7.87
6.14
7.56
1.73
0.79
0.79
8.50
17.32
14.65
0.31
4.09
5.83
10.08
14.33
100
Palayam TP
LMV 10.06
11.53
2.52
1.47
1.89
0.63
5.87
0.84
15.72
0.42
0.63
3.14
5.24
40.04
100
LCV 9.14
19.82
5.02
1.80
0.51
2.06
6.44
2.19
12.23
0.26
1.93
3.22
8.62
26.77
100
2A Truck 12.12
14.53
5.71
2.40
1.70
2.51
7.11
2.20
12.22
0.20
1.50
4.91
10.52
22.34
100
3A Truck 12.79
7.58
4.71
2.86
1.01
2.02
8.59
2.86
18.18
0.51
2.86
4.71
10.77
20.54
100
MAV 12.78
8.37
6.13
3.13
1.85
2.30
8.37
3.71
11.57
0.26
5.37
4.15
11.57
20.45
100
Somasipadi
LMV 10.30
6.67
2.42
0.61
0.00
0.00
3.64
0.61
11.52
3.64
1.82
10.91
11.52
36.36
100
LCV 17.31
11.54
1.92
0.00
0.00
0.00
0.00
0.00
13.46
3.85
0.00
23.08
5.77
23.08
100
2A Truck 8.77
7.02
3.51
0.00
1.75
0.00
0.00
7.02
14.04
5.26
0.00
17.54
10.53
24.56
100
3A Truck 12.73
0.00
16.36
0.00
0.00
0.00
0.00
1.82
23.64
1.82
0.00
12.73
7.27
23.64
100
MAV 14.29
0.00
17.86
3.57
0.00
0.00
0.00
0.00
32.14
3.57
3.57
7.14
0.00
17.86
100
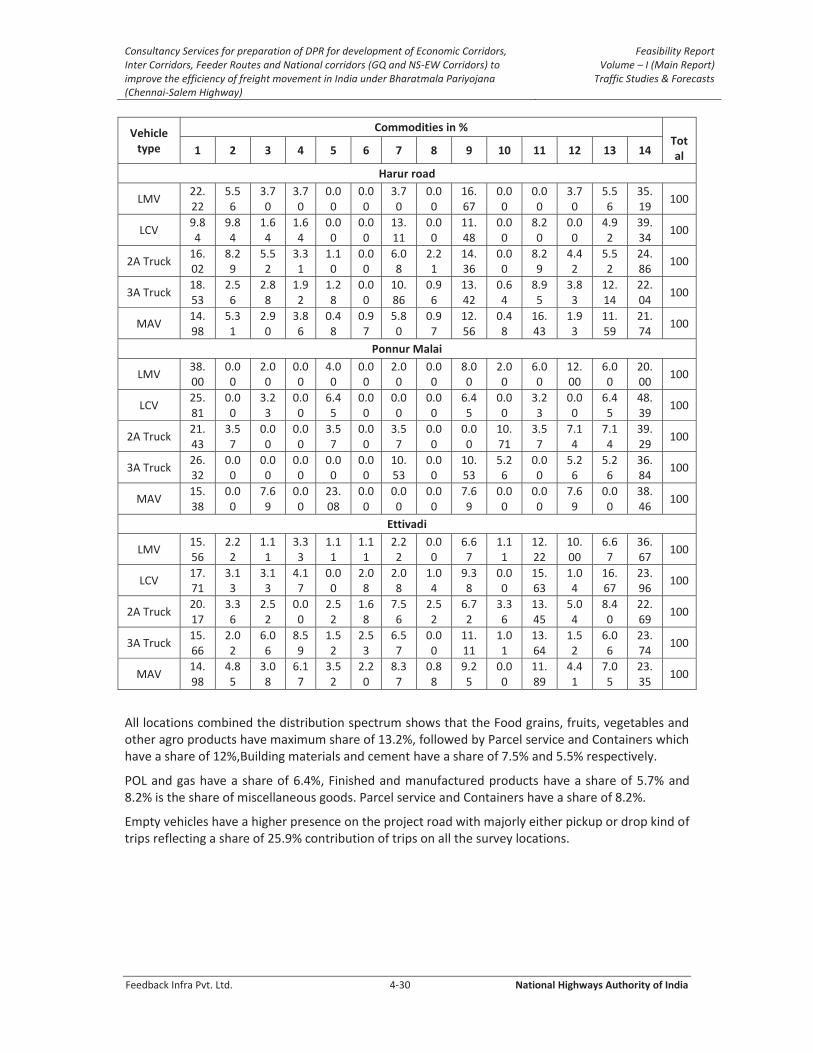
Consultancy Services for preparation of DPR for development of Economic Corridors, Inter Corridors, Feeder Routes and National corridors (GQ and NS-EW Corridors) to improve the efficiency of freight movement in India under Bharatmala Pariyojana (Chennai-Salem Highway)
Feasibility Report Volume – I (Main Report)
Traffic Studies & Forecasts
Feedback Infra Pvt. Ltd. 4-30 National Highways Authority of India
Vehicle type
Commodities in % Total 1 2 3 4 5 6 7 8 9 10 11 12 13 14
Harur road
LMV 22.22
5.56
3.70
3.70
0.00
0.00
3.70
0.00
16.67
0.00
0.00
3.70
5.56
35.19
100
LCV 9.84
9.84
1.64
1.64
0.00
0.00
13.11
0.00
11.48
0.00
8.20
0.00
4.92
39.34
100
2A Truck 16.02
8.29
5.52
3.31
1.10
0.00
6.08
2.21
14.36
0.00
8.29
4.42
5.52
24.86
100
3A Truck 18.53
2.56
2.88
1.92
1.28
0.00
10.86
0.96
13.42
0.64
8.95
3.83
12.14
22.04
100
MAV 14.98
5.31
2.90
3.86
0.48
0.97
5.80
0.97
12.56
0.48
16.43
1.93
11.59
21.74
100
Ponnur Malai
LMV 38.00
0.00
2.00
0.00
4.00
0.00
2.00
0.00
8.00
2.00
6.00
12.00
6.00
20.00
100
LCV 25.81
0.00
3.23
0.00
6.45
0.00
0.00
0.00
6.45
0.00
3.23
0.00
6.45
48.39
100
2A Truck 21.43
3.57
0.00
0.00
3.57
0.00
3.57
0.00
0.00
10.71
3.57
7.14
7.14
39.29
100
3A Truck 26.32
0.00
0.00
0.00
0.00
0.00
10.53
0.00
10.53
5.26
0.00
5.26
5.26
36.84
100
MAV 15.38
0.00
7.69
0.00
23.08
0.00
0.00
0.00
7.69
0.00
0.00
7.69
0.00
38.46
100
Ettivadi
LMV 15.56
2.22
1.11
3.33
1.11
1.11
2.22
0.00
6.67
1.11
12.22
10.00
6.67
36.67
100
LCV 17.71
3.13
3.13
4.17
0.00
2.08
2.08
1.04
9.38
0.00
15.63
1.04
16.67
23.96
100
2A Truck 20.17
3.36
2.52
0.00
2.52
1.68
7.56
2.52
6.72
3.36
13.45
5.04
8.40
22.69
100
3A Truck 15.66
2.02
6.06
8.59
1.52
2.53
6.57
0.00
11.11
1.01
13.64
1.52
6.06
23.74
100
MAV 14.98
4.85
3.08
6.17
3.52
2.20
8.37
0.88
9.25
0.00
11.89
4.41
7.05
23.35
100
All locations combined the distribution spectrum shows that the Food grains, fruits, vegetables and other agro products have maximum share of 13.2%, followed by Parcel service and Containers which have a share of 12%,Building materials and cement have a share of 7.5% and 5.5% respectively.
POL and gas have a share of 6.4%, Finished and manufactured products have a share of 5.7% and 8.2% is the share of miscellaneous goods. Parcel service and Containers have a share of 8.2%.
Empty vehicles have a higher presence on the project road with majorly either pickup or drop kind of trips reflecting a share of 25.9% contribution of trips on all the survey locations.

Consultancy Services for preparation of DPR for development of Economic Corridors, Inter Corridors, Feeder Routes and National corridors (GQ and NS-EW Corridors) to improve the efficiency of freight movement in India under Bharatmala Pariyojana (Chennai-Salem Highway)
Feasibility Report Volume – I (Main Report)
Traffic Studies & Forecasts
Feedback Infra Pvt. Ltd. 4-31 National Highways Authority of India
Figure 4-8: Percentage distribution of commodities 4.1.5.4 Axle load survey
Axle load survey has been carried out in order to estimate vehicle damage factor (VDF) for its use in design of overlay on existing pavement and new pavement for additional lanes.
4.1.5.4.1 Calculation of VDF
The vehicle damage factor is a multiplier for converting the number of commercial vehicles of different axle loads to the number of standard axle load repetitions. Design of new pavement for additional lane or strengthening of existing pavement is based upon the cumulative number of 8.17 tonne equivalent standard axles (ESA) that will pass over the pavement during its design period. The classes of traffic which lead to significant axle loads (or damage) to the pavement and accordingly considered for design are: LCVs, Buses, two axle, three axle and multi axle trucks. Cumulative standard axle (CSA) is calculated in accordance with the guidelines provided in IRC: 37 – 2012 and IRC: SP 73 - 2007. The overloaded vehicles have serious adverse impact on the performance of pavement. It has been ascertained that the damaging effect of axles on flexible pavement is approximately proportional to the fourth power of the ratio of axle load to standard axle load.
Equivalency factors as recommended by IRC have been used to convert the axle load spectrum into an equivalent number of standard axles. Equivalency factors as recommended by IRC have been used to convert the axle load spectrum into an equivalent number of standard axles. The equivalency factors are derived for each axle load category from the fourth power rule. The product of frequency of axles for each axle load category and corresponding equivalency factors gives the ESA for corresponding axle load category. The VDF is calculated by dividing the sum of ESA for all class of vehicles by the total number of vehicles weighed. The calculated VDF of LCVs, Buses, 2 axles, 3 axles and multi axle trucks are shown in Table 4-22 below.
0.00
5.00
10.00
15.00
20.00
25.00
30.00
35.00
40.00
45.00
1 2 3 4 5 6 7 8 9 10 11 12 13 14
Paranur TP Sengurichi TP Mettupatti TP Nemili TP Pallikonda TP
Palayam TP Somasipadi Harur road Ponnur Malai Ettivadi

Consultancy Services for preparation of DPR for development of Economic Corridors, Inter Corridors, Feeder Routes and National corridors (GQ and NS-EW Corridors) to improve the efficiency of freight movement in India under Bharatmala Pariyojana (Chennai-Salem Highway)
Feasibility Report Volume – I (Main Report)
Traffic Studies & Forecasts
Feedback Infra Pvt. Ltd. 4-32 National Highways Authority of India
Table 4-22: Observed VDF
Mode Chennai-Salem Salem-Chennai
Mettupatti TP (old NH-68)
LCV 0.72 0.79
2-axle 2.62 1.47
3-axle 5.75 4.38
MAV 8.76 7.95
Bus 0.72 1.16
Pallikonda TP (old NH-4)
LCV 0.75 0.80
2-axle 1.64 1.87
3-axle 3.93 4.42
MAV 5.50 6.26
Bus 0.83 1.15
Papireddipatti Jn. (Hosur road) on SH-18
LCV 0.65 0.59
2-axle 3.78 2.58
3-axle 6.81 5.19
MAV 9.42 9.50
Bus 0.75 1.10
4.1.5.4.2 Computation of Design Traffic
The design traffic is considered in terms of the Cumulative Standard Axles (CSA) to be carried during the design life of 15 years on the road. The computation involves initial volume of commercial vehicles per day, lateral distribution of traffic, growth rate, design life in years and vehicle damage factor (number of standard axle per commercial vehicle) to convert commercial vehicles to standard axles.
The following equation has been used to calculate the cumulative number of standard axles in accordance with IRC: 81 – 1997 and IRC: 37 – 2012.
s
Where
Ns = The cumulative number of standard axles to be catered for in the design life.
A = Initial traffic, in the year of completion of construction, in terms of the number of commercial vehicles per day duly modified to account for lane distribution.
r = Annual growth rate of commercial vehicles, %
x = Design life in years
F = Vehicle Damage Factor (number of standard axles per commercial vehicle)
The Million Standard Axles (MSA) from base year to horizon year for commercial traffic has been estimated using VDF values derived from axle load survey for bus, LCV, 2 axle, 3 axle and multi axle trucks. The VDF values for both directions are used for calculations, in project stretch.
The summary of VDF calculation and cumulative MSA for the base and horizon years according to projected traffic for all homogeneous sections are discussed in Pavement Design Chapter.
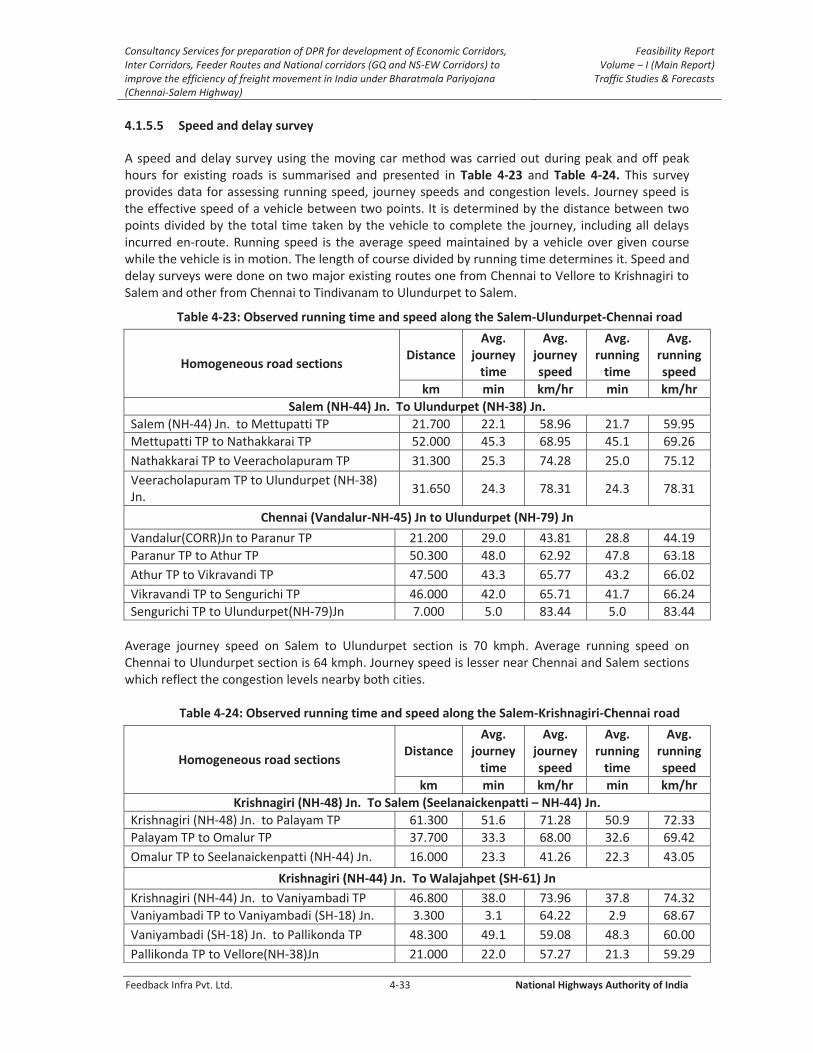
Consultancy Services for preparation of DPR for development of Economic Corridors, Inter Corridors, Feeder Routes and National corridors (GQ and NS-EW Corridors) to improve the efficiency of freight movement in India under Bharatmala Pariyojana (Chennai-Salem Highway)
Feasibility Report Volume – I (Main Report)
Traffic Studies & Forecasts
Feedback Infra Pvt. Ltd. 4-33 National Highways Authority of India
4.1.5.5 Speed and delay survey
A speed and delay survey using the moving car method was carried out during peak and off peak hours for existing roads is summarised and presented in Table 4-23 and Table 4-24. This survey provides data for assessing running speed, journey speeds and congestion levels. Journey speed is the effective speed of a vehicle between two points. It is determined by the distance between two points divided by the total time taken by the vehicle to complete the journey, including all delays incurred en-route. Running speed is the average speed maintained by a vehicle over given course while the vehicle is in motion. The length of course divided by running time determines it. Speed and delay surveys were done on two major existing routes one from Chennai to Vellore to Krishnagiri to Salem and other from Chennai to Tindivanam to Ulundurpet to Salem.
Table 4-23: Observed running time and speed along the Salem-Ulundurpet-Chennai road
Homogeneous road sections Distance
Avg. journey
time
Avg. journey speed
Avg. running
time
Avg. running speed
km min km/hr min km/hr
Salem (NH-44) Jn. To Ulundurpet (NH-38) Jn.
Salem (NH-44) Jn. to Mettupatti TP 21.700 22.1 58.96 21.7 59.95
Mettupatti TP to Nathakkarai TP 52.000 45.3 68.95 45.1 69.26
Nathakkarai TP to Veeracholapuram TP 31.300 25.3 74.28 25.0 75.12
Veeracholapuram TP to Ulundurpet (NH-38) Jn.
31.650 24.3 78.31 24.3 78.31
Chennai (Vandalur-NH-45) Jn to Ulundurpet (NH-79) Jn
Vandalur(CORR)Jn to Paranur TP 21.200 29.0 43.81 28.8 44.19
Paranur TP to Athur TP 50.300 48.0 62.92 47.8 63.18
Athur TP to Vikravandi TP 47.500 43.3 65.77 43.2 66.02
Vikravandi TP to Sengurichi TP 46.000 42.0 65.71 41.7 66.24
Sengurichi TP to Ulundurpet(NH-79)Jn 7.000 5.0 83.44 5.0 83.44
Average journey speed on Salem to Ulundurpet section is 70 kmph. Average running speed on Chennai to Ulundurpet section is 64 kmph. Journey speed is lesser near Chennai and Salem sections which reflect the congestion levels nearby both cities.
Table 4-24: Observed running time and speed along the Salem-Krishnagiri-Chennai road
Homogeneous road sections Distance
Avg. journey
time
Avg. journey speed
Avg. running
time
Avg. running speed
km min km/hr min km/hr
Krishnagiri (NH-48) Jn. To Salem (Seelanaickenpatti – NH-44) Jn.
Krishnagiri (NH-48) Jn. to Palayam TP 61.300 51.6 71.28 50.9 72.33
Palayam TP to Omalur TP 37.700 33.3 68.00 32.6 69.42
Omalur TP to Seelanaickenpatti (NH-44) Jn. 16.000 23.3 41.26 22.3 43.05
Krishnagiri (NH-44) Jn. To Walajahpet (SH-61) Jn
Krishnagiri (NH-44) Jn. to Vaniyambadi TP 46.800 38.0 73.96 37.8 74.32
Vaniyambadi TP to Vaniyambadi (SH-18) Jn. 3.300 3.1 64.22 2.9 68.67
Vaniyambadi (SH-18) Jn. to Pallikonda TP 48.300 49.1 59.08 48.3 60.00
Pallikonda TP to Vellore(NH-38)Jn 21.000 22.0 57.27 21.3 59.29

Consultancy Services for preparation of DPR for development of Economic Corridors, Inter Corridors, Feeder Routes and National corridors (GQ and NS-EW Corridors) to improve the efficiency of freight movement in India under Bharatmala Pariyojana (Chennai-Salem Highway)
Feasibility Report Volume – I (Main Report)
Traffic Studies & Forecasts
Feedback Infra Pvt. Ltd. 4-34 National Highways Authority of India
Homogeneous road sections Distance
Avg. journey
time
Avg. journey speed
Avg. running
time
Avg. running speed
km min km/hr min km/hr
Krishnagiri (NH-48) Jn. To Salem (Seelanaickenpatti – NH-44) Jn.
Vellore(NH-38)Jn to Arcot(SH-4)Jn 23.000 21.0 65.71 20.1 68.71
Arcot(SH-4)Jn to Walajahpet(SH-61)Jn 6.200 10.0 37.20 9.4 39.50
Homogeneous road sections Distance
Avg. journey
time
Avg. journey speed
Avg. running
time
Avg. running speed
km min km/hr min km/hr
Walajahpet (SH-61) Jn to Poonamallee (CORR) Jn
Walajahpet(SH-61)Jn to Chennasamudram TP 7.100 12.0 35.50 11.8 36.05
Chennasamudram TP to Nemili TP 72.600 77.1 56.53 76.9 56.68
Nemili TP to Poonamallee(CORR) Jn 18.000 25.0 43.20 24.3 44.54
Average journey speed on Salem to Krishnagiri section is 60 kmph. Average journey speed on Krishnagiri to Walajahpet section is 60 kmph. This is because of congestion near Arcot and Salem sections. Average journey speed drops significantly to 45 kmph in Walajahpet to Poonamallee section. The low journey speeds can be attributed due to built-up settlements along the road and congestion levels on the road.
4.2 Traffic forecasts and Demand estimates
4.2.1 Traffic Forecasting
Investment priorities are governed by the traffic demand, assessed benefits and cost of the project. Demand plays the important role, governing which type of facility / infrastructure needs to be created. This in turn determines likely benefits and costs to develop the same. A highway project of this nature calls for significant investment. Prediction of traffic demand becomes an important task and has to be carried out very accurately. Accurate estimation of traffic has direct bearing on the viability of the project. Recognizing this, efforts are made to carefully assess all the parameters that help in predicting the traffic demand in future, which necessitates realistic estimation of traffic growth rates. Traffic growth on a road facility is generally estimated on the basis of historical trends. In the present case, traffic growth rates have been estimated using elasticity method as per IRC: 108 – 2015. Demand changes are usually because of shifts in the pattern of economic activities in the surrounding regions. Hence, future traffic estimation necessitates a preview, however imprecise the probable pattern of future growth of the economy.
4.2.1.1 Past vehicle registration details
It is revealed from OD survey that the project stretch is influenced by traffic from the state of Tamil Nadu alone. For establishing growth rates, data of Tamil Nadu state and rest of India is considered.
The vehicle registration data for the state of Tamil Nadu and commercial vehicles in India are collected and presented in Table 4-25 below.
Table 4-25: Past vehicle registration data
Year Two wheeler Car / Jeep Bus Commercial vehicles
Tamil Nadu
2004-05 6106057 730414 32539 263068

Consultancy Services for preparation of DPR for development of Economic Corridors, Inter Corridors, Feeder Routes and National corridors (GQ and NS-EW Corridors) to improve the efficiency of freight movement in India under Bharatmala Pariyojana (Chennai-Salem Highway)
Feasibility Report Volume – I (Main Report)
Traffic Studies & Forecasts
Feedback Infra Pvt. Ltd. 4-35 National Highways Authority of India
Year Two wheeler Car / Jeep Bus Commercial vehicles
2005-06 6750328 802793 34473 323275
2006-07 7503426 884370 34813 337792
2007-08 8260019 990439 37490 402800
2008-09 9036783 1099368 40019 456316
2009-10 9969598 1230045 42365 475964
2010-11 11207338 1399799 43435 506480
2011-12 12659928 1574944 44529 547990
2012-13 14150373 1744738 48370 568566
2013-14 15595140 1923607 49077 620168
2014-15 16991527 2084864 49665 648404
2015-16 18400635 2252888 49765 664322
2016-17 19987302 2439734 49800 670530
CAGR 10.39 10.57 3.61 8.11
India
Year CVs (‘000) Source :
Road Transport Year Book by MORTH Publication, Govt. of India
State Transport department, Govt. of Tamil Nadu
2004-05 3877622
2005-06 4274984
2006-07 5118880
2007-08 5600938
2008-09 6040924
2009-10 6431926
2010-11 7064495
2011-12 7658391
2012-13 8306834
2013-14 8697541
2014-15 9344464
CAGR 9.19
4.2.1.2 Past growth of the economy
Growth of traffic on the project road is influenced by existing development and future growth prospects of the influencing regions. The time series data of state income NSDP at constant (2004-05) prices, state population, per-capita income of PIA state and GDP as published by Central Statistical Organization have been collected and studied to assess the past performance of the influencing state economies. Table 4-26 depicts these economic indicators.
Table 4-26: Economic indices of influence state and India at constant prices (2004 - 05)
Year NSDP (millions) % growth PCI (Rs.) % growth
Tamil Nadu
2004-05 1936450 - 30062 -
2005-06 2215879 14.4% 34126 13.5%
2006-07 2562858 15.7% 39166 14.8%
2007-08 2723398 6.3% 41314 5.5%
2008-09 2867436 5.3% 43193 4.5%
2009-10 3167599 10.5% 47394 9.7%
2010-11 3599605 13.6% 53507 12.9%
2011-12 3865081 7.4% 57093 6.7%
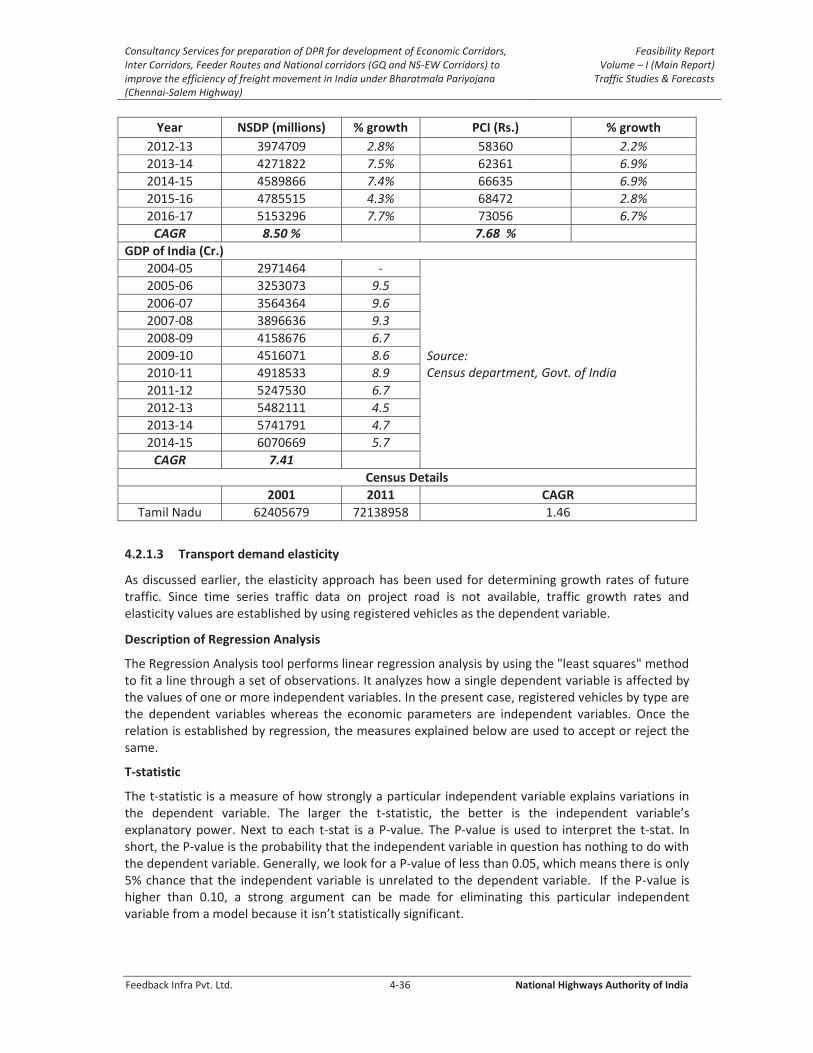
Consultancy Services for preparation of DPR for development of Economic Corridors, Inter Corridors, Feeder Routes and National corridors (GQ and NS-EW Corridors) to improve the efficiency of freight movement in India under Bharatmala Pariyojana (Chennai-Salem Highway)
Feasibility Report Volume – I (Main Report)
Traffic Studies & Forecasts
Feedback Infra Pvt. Ltd. 4-36 National Highways Authority of India
Year NSDP (millions) % growth PCI (Rs.) % growth
2012-13 3974709 2.8% 58360 2.2%
2013-14 4271822 7.5% 62361 6.9%
2014-15 4589866 7.4% 66635 6.9%
2015-16 4785515 4.3% 68472 2.8%
2016-17 5153296 7.7% 73056 6.7%
CAGR 8.50 % 7.68 %
GDP of India (Cr.)
2004-05 2971464 -
Source: Census department, Govt. of India
2005-06 3253073 9.5
2006-07 3564364 9.6
2007-08 3896636 9.3
2008-09 4158676 6.7
2009-10 4516071 8.6
2010-11 4918533 8.9
2011-12 5247530 6.7
2012-13 5482111 4.5
2013-14 5741791 4.7
2014-15 6070669 5.7
CAGR 7.41
Census Details
2001 2011 CAGR
Tamil Nadu 62405679 72138958 1.46
4.2.1.3 Transport demand elasticity
As discussed earlier, the elasticity approach has been used for determining growth rates of future traffic. Since time series traffic data on project road is not available, traffic growth rates and elasticity values are established by using registered vehicles as the dependent variable.
Description of Regression Analysis
The Regression Analysis tool performs linear regression analysis by using the "least squares" method to fit a line through a set of observations. It analyzes how a single dependent variable is affected by the values of one or more independent variables. In the present case, registered vehicles by type are the dependent variables whereas the economic parameters are independent variables. Once the relation is established by regression, the measures explained below are used to accept or reject the same.
T-statistic
The t-statistic is a measure of how strongly a particular independent variable explains variations in the dependent variable. The larger the t-statistic, the better is the independent variable’s explanatory power. Next to each t-stat is a P-value. The P-value is used to interpret the t-stat. In short, the P-value is the probability that the independent variable in question has nothing to do with the dependent variable. Generally, we look for a P-value of less than 0.05, which means there is only 5% chance that the independent variable is unrelated to the dependent variable. If the P-value is higher than 0.10, a strong argument can be made for eliminating this particular independent variable from a model because it isn’t statistically significant.

Consultancy Services for preparation of DPR for development of Economic Corridors, Inter Corridors, Feeder Routes and National corridors (GQ and NS-EW Corridors) to improve the efficiency of freight movement in India under Bharatmala Pariyojana (Chennai-Salem Highway)
Feasibility Report Volume – I (Main Report)
Traffic Studies & Forecasts
Feedback Infra Pvt. Ltd. 4-37 National Highways Authority of India
R Square
R Square is another measure of the explanatory power of the model. In theory, R square compares the amount of error explained by the model as compared to the amount of error explained by averages. The higher the R-Square, the better it is.
Regression analysis was carried out on the database to arrive at the transport demand elasticity and growth rates using each category of vehicle with various combinations of economic parameters and population of the respective states. The resultant elasticity values, growth rates, R2 values and t-
statistic are presented in Table 4-27. The highlighted parameters are selected for traffic forecast in each case, based on best fit. For commercial vehicles, growth trend of Tamil Nadu state and India are analyzed.
Table 4-27: Observed transport demand elasticity values and traffic growth
Vehicle Type Indicator Elasticity GR (%) R-square t-stat
Two Wheeler PCI 1.393 10.281 0.980 23.063
NSDP 1.272 10.360 0.983 25.420
Car PCI 1.438 10.613 0.983 25.200
NSDP 1.312 10.692 0.986 27.737
Bus PCI 0.541 3.994 0.960 16.170
NSDP 0.493 4.016 0.959 15.959
Trucks NSDP 0.877 7.149 0.965 17.490
LCV/LMV NSDP 1.153 9.393 0.960 16.200
India
CVs GDP 1.199 8.683 0,9938 37.882
Trucks GDP 0.688 4.980 0.9843 23.791
LCVs/LMVs GDP 1.779 12.875 0.9766 19.365
Projected transport demand elasticity
In order to arrive at realistic future elasticity for the project road, various factors relating to vehicle technology changes, in addition to character of traffic and travel pattern on the project road, have been considered.
High elasticity of cars being witnessed now is because of large demand facilitated by financing schemes and loans. Factors like growth of household incomes (particularly in urban areas), reduction in the prices of entry-level cars, growth of the used car market, changes in life-style, growing personal incomes, desire to own a vehicle, facilitated by availability of loans/financing schemes on easy terms etc., have all contributed to the rapid growth in ownership of cars. However, such trend would slow down and elasticity can be expected to decline.
Over the years, there has been a change in passenger movement with more and more people shifting towards personalized modes. Moreover, buses are usually plying on fixed pre-decided routes and thus elasticity values for buses have been considered accordingly.
With the changing freight vehicle mix in favor of LCVs for short distance traffic and 3-axle/MAVs for long-distance traffic, higher elasticity values for these have been considered as compared to 2-axle trucks. Considering the ongoing technical advancements in automobile industry, some of the standard two axle trucks would gradually be replaced by three axle truck and MAVs, leading to reduction in number of trucks. This shift has already been observed in various parts of the country.
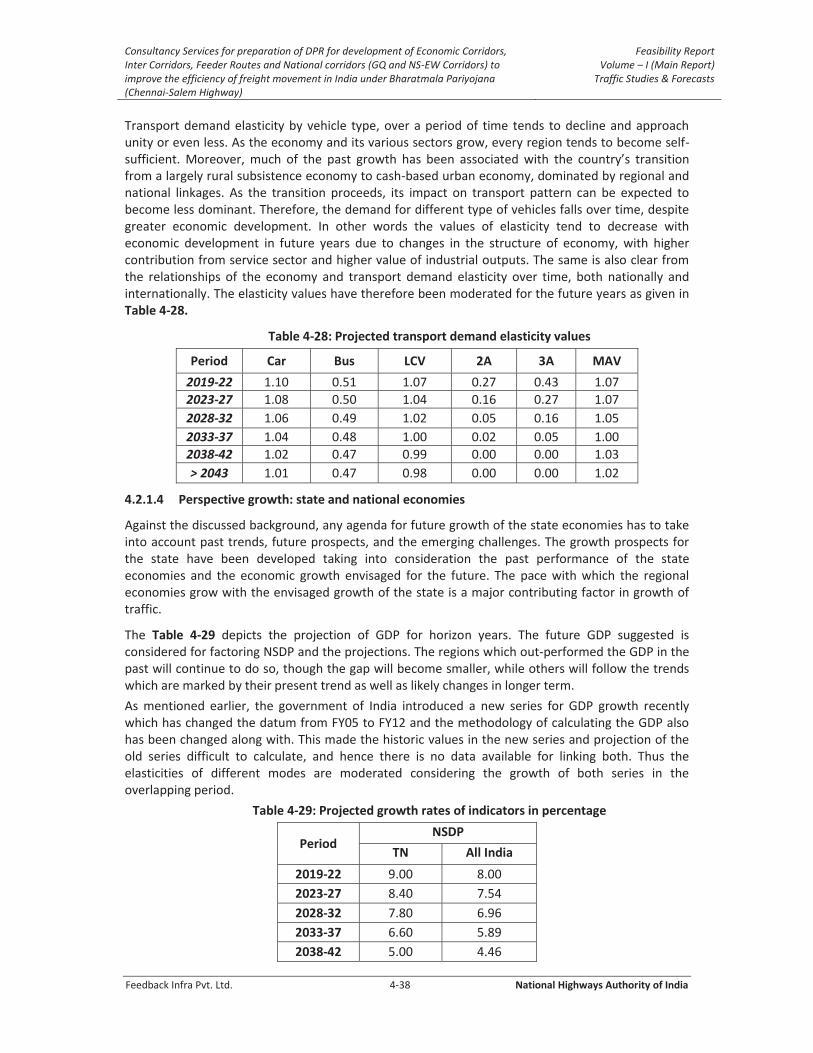
Consultancy Services for preparation of DPR for development of Economic Corridors, Inter Corridors, Feeder Routes and National corridors (GQ and NS-EW Corridors) to improve the efficiency of freight movement in India under Bharatmala Pariyojana (Chennai-Salem Highway)
Feasibility Report Volume – I (Main Report)
Traffic Studies & Forecasts
Feedback Infra Pvt. Ltd. 4-38 National Highways Authority of India
Transport demand elasticity by vehicle type, over a period of time tends to decline and approach unity or even less. As the economy and its various sectors grow, every region tends to become self-sufficient. Moreover, much of the past growth has been associated with the country’s transition from a largely rural subsistence economy to cash-based urban economy, dominated by regional and national linkages. As the transition proceeds, its impact on transport pattern can be expected to become less dominant. Therefore, the demand for different type of vehicles falls over time, despite greater economic development. In other words the values of elasticity tend to decrease with economic development in future years due to changes in the structure of economy, with higher contribution from service sector and higher value of industrial outputs. The same is also clear from the relationships of the economy and transport demand elasticity over time, both nationally and internationally. The elasticity values have therefore been moderated for the future years as given in Table 4-28.
Table 4-28: Projected transport demand elasticity values
Period Car Bus LCV 2A 3A MAV
2019-22 1.10 0.51 1.07 0.27 0.43 1.07
2023-27 1.08 0.50 1.04 0.16 0.27 1.07
2028-32 1.06 0.49 1.02 0.05 0.16 1.05
2033-37 1.04 0.48 1.00 0.02 0.05 1.00
2038-42 1.02 0.47 0.99 0.00 0.00 1.03
> 2043 1.01 0.47 0.98 0.00 0.00 1.02
4.2.1.4 Perspective growth: state and national economies
Against the discussed background, any agenda for future growth of the state economies has to take into account past trends, future prospects, and the emerging challenges. The growth prospects for the state have been developed taking into consideration the past performance of the state economies and the economic growth envisaged for the future. The pace with which the regional economies grow with the envisaged growth of the state is a major contributing factor in growth of traffic.
The Table 4-29 depicts the projection of GDP for horizon years. The future GDP suggested is considered for factoring NSDP and the projections. The regions which out-performed the GDP in the past will continue to do so, though the gap will become smaller, while others will follow the trends which are marked by their present trend as well as likely changes in longer term.
As mentioned earlier, the government of India introduced a new series for GDP growth recently which has changed the datum from FY05 to FY12 and the methodology of calculating the GDP also has been changed along with. This made the historic values in the new series and projection of the old series difficult to calculate, and hence there is no data available for linking both. Thus the elasticities of different modes are moderated considering the growth of both series in the overlapping period.
Table 4-29: Projected growth rates of indicators in percentage
Period NSDP
TN All India
2019-22 9.00 8.00
2023-27 8.40 7.54
2028-32 7.80 6.96
2033-37 6.60 5.89
2038-42 5.00 4.46

Consultancy Services for preparation of DPR for development of Economic Corridors, Inter Corridors, Feeder Routes and National corridors (GQ and NS-EW Corridors) to improve the efficiency of freight movement in India under Bharatmala Pariyojana (Chennai-Salem Highway)
Feasibility Report Volume – I (Main Report)
Traffic Studies & Forecasts
Feedback Infra Pvt. Ltd. 4-39 National Highways Authority of India
Period NSDP
TN All India
> 2043 5.00 4.46
4.2.1.5 Projected traffic rates
The production and sales data of commercial vehicles has been collected for 10 years from Society of Indian Automobile Manufactures (SIAM) and analysed.
Source: From various volumes published by SIAM
It is found that production / sale of multi axle trucks have increased whereas the same has decreased for 2-axle trucks in the recent past. The exhibit shows the ratio of sale of multi-axle trucks / 2-axle trucks. Based on the present composition of goods vehicles, overall growth of goods vehicles and average load carried by each vehicle type, tonnage has been calculated for 5 year blocks for present and future composition of traffic. The difference in the present and future tonnage gives the additional traffic due to change in modal share which has been converted into vehicles. On this basis growth rate of 2-axle trucks and multi-axle trucks have been moderated keeping the overall growth rates of trucks constant.
Normally, the growth potential of passenger traffic in a region depends on its population and economic growth rates. Therefore, both these parameters have been incorporated in forecasting of passenger traffic. Further, taking into account the fact that the different modes of passenger traffic grow at different rate, the elasticity (as discussed earlier) with respect to population and income growth rates is graded differently by different modes.
Growth potential of goods traffic is different from passenger traffic. This is more directly related to zone’s economic activity and production levels than its population and income growth, although the latter may strongly correlate with the former, especially the income growth.
In view of the above discussions, it is felt that the future growth rates should neither be under nor over targeted. The complexities involved and sensitive dimensions of economy are many, so it is important that its larger issues are to be addressed by constructing different scenarios. Thus an effort has been made to develop three different scenarios of varying growth rates of economic indicators as under:
Optimistic Scenario Most likely Scenario Pessimistic Scenario
Considering all the above discussed points, the growth rates were conceived using methods
0%
5%
10%
15%
20%
25%
30%
35%
40%
45%
50%
2003-04 2004-05 2005-06 2006-07 2007-08 2008-09 2009-10 2010-11 2011-12 2012-13 2013-14
LCV 2A
3A MAV

Consultancy Services for preparation of DPR for development of Economic Corridors, Inter Corridors, Feeder Routes and National corridors (GQ and NS-EW Corridors) to improve the efficiency of freight movement in India under Bharatmala Pariyojana (Chennai-Salem Highway)
Feasibility Report Volume – I (Main Report)
Traffic Studies & Forecasts
Feedback Infra Pvt. Ltd. 4-40 National Highways Authority of India
discussed earlier and have been modified accordingly. The basic growth factors are considered to be realistic rates. In the calculation, the growth rate of economic indicators was treated with ±0.5 sensitivity to arrive pessimistic and optimistic values. The final recommended growth rates are given in Table 4-30.
Table 4-30: Estimated and recommended traffic growth rates
Mode 2019-22 2023-27 2028-32 2033-37 2038-42 2043-47
Most likely
Car 9.8 8.9 8.1 6.7 5.1 5.0
Bus 4.5 4.1 3.8 3.1 2.3 2.3
LCV 9.5 8.6 7.8 6.5 4.9 4.8
2 Axle Truck 2.4 1.3 0.3 0.1 0.0 0.0
3 Axle Truck 3.8 2.2 1.2 0.3 0.0 0.0
MAVs 9.4 8.9 8.1 6.5 5.1 5.0
Two wheeler 12.0 11.0 10.0 8.3 6.2 6.2
Optimistic
Car 10.0 9.5 9.1 8.7 8.2 7.7
Bus 4.6 4.4 4.2 4.0 3.8 3.6
LCV 10.1 9.2 8.3 7.0 5.4 5.3
2 Axle Truck 2.8 1.7 0.7 0.5 0.0 0.0
3 Axle Truck 4.3 2.6 1.6 0.7 0.4 0.0
MAVs 9.9 9.3 8.5 6.9 5.4 5.4
Two wheeler 12.3 11.8 11.2 10.7 10.1 9.5
Pessimistic
Car 9.5 9.1 8.7 8.3 7.8 7.4
Bus 4.4 4.2 4.0 3.9 3.6 3.4
LCV 9.0 8.1 7.3 6.0 4.4 4.3
2 Axle Truck 2.0 0.9 -0.1 -0.3 0.0 0.0
3 Axle Truck 3.4 1.8 0.8 -0.1 -0.4 0.0
MAVs 9.0 8.5 7.7 6.1 4.7 4.6
Two wheeler 11.8 11.2 10.7 10.3 9.7 9.1
4.2.1.5.1 Traffic forecast for non–motorised traffic
The slow moving vehicles essentially cater to short haul traffic, meeting localised demand for transportation of individual passenger and goods to market centres and urban centres. Non–motorised traffic, especially pedal cycles, cycle rickshaws and animal drawn vehicles will be gradually replaced by motorised vehicles. Therefore, it is assumed that volume of animal drawn vehicles and pedal cycles are expected to decline by a negative growth of 2% per annum because of economic improvement. The growth rates of tractors have been however considered as 2% per annum.
4.2.2 Travel Demand Estimates
4.2.2.1 Traffic demand estimation for proposed project road
This section presents the assessment of traffic on the proposed Chennai – Salem Greenfield
alignment. The results of this analysis will form inputs for forecasting toll traffic and revenue,
deciding tolling strategy, planning and designing the pavement, developing capacity augmentation
proposals and designing the toll plaza.
The corridor traffic would consist of three components:

Consultancy Services for preparation of DPR for development of Economic Corridors, Inter Corridors, Feeder Routes and National corridors (GQ and NS-EW Corridors) to improve the efficiency of freight movement in India under Bharatmala Pariyojana (Chennai-Salem Highway)
Feasibility Report Volume – I (Main Report)
Traffic Studies & Forecasts
Feedback Infra Pvt. Ltd. 4-41 National Highways Authority of India
Diverted Traffic: This is traffic based on trips that are already being made between various
origin and destination pairs and likely to be diverted to the proposed project corridor.
Development Traffic: This is the traffic based on new trips that would be generated due to
the development of new nodes along the project highway.
Generated / Induced Traffic: This is traffic that is based on trips that were not taken earlier
due to lack of desired infrastructure.
Thus the total traffic on project corridor is sum of Diverted traffic, Developmental traffic and
Generated traffic
4.2.2.2 Sections along project corridor
The assessment of traffic along the corridor is based on the nodes and interchanges proposed for
developing along the road, as they are going to act as traffic generation and attraction centroids. The
nodes and interchanges are at same location. The locations of nodes and interchanges are defining
the homogenous sections in the present case. The Table 4-31 below lists the homogenous sections
for the project corridor.
Table 4-31: Homogenous sections based on nodes and interchanges
Section Chainage (km) Section Length,
km From To From To
1 0.000 24.580 Start Point(Chennai) SH 58 interchange (Kanchipuram) 24.580
2 24.580 67.395 SH 58 interchange (Kanchipuram) SH 5 interchange (Vandavasi) 42.815
3 67.395 94.505 SH 5 interchange (Vandavasi) SH 4 interchange (Chetpet) 27.110
4 94.505 121.760 SH 4 interchange (Chetpet) NH234interchange (Tiruvannamalai)
27.255
5 121.760 157.880 NH234 interchange
(Tiruvannamalai) NH 66 interchange (Chengam) 36.120
6 157.880 220.625 NH 66 interchange (Chengam) SH18 interchange (Harur) 62.745
7 220.625 243.920 SH18 interchange (Harur) NH 68 interchange (Salem) 23.295
8 243.920 270.360 NH 68 interchange (Salem) NH 44 interchange (Namakkal road) 26.440
9 270.360 277.320 NH 44 interchange (Namakkal road)
NH 544 inerchange (Coimbatore road)
6.960
*Chainages are tentative
4.2.2.3 Diverted traffic
The diversion traffic analysis is performed to assess the percentage of traffic that would be diverting
to the project corridor from potential competing corridors. All the potential competing corridors
were identified through reconnaissance surveys and assessment on various influencing factors has
been done to identify the traffic likely to be diverted to project corridor at the time of operations.
4.2.2.3.1 Procedure for diversion analysis
Cost ratio diversion curves have been used for estimating the diverted traffic to the green field
alignment. In this approach, traffic likely to be diverted to project road from alternate route is
estimated using diversion curves suggested by IRC: 108 – 2015, Guidelines for Traffic Forecast on
Highways, which computes the ratio of perceived costs on the competitive/alternative facilities.
The estimation of percentage diversion for all the alternatives has been done through following
steps:

Consultancy Services for preparation of DPR for development of Economic Corridors, Inter Corridors, Feeder Routes and National corridors (GQ and NS-EW Corridors) to improve the efficiency of freight movement in India under Bharatmala Pariyojana (Chennai-Salem Highway)
Feasibility Report Volume – I (Main Report)
Traffic Studies & Forecasts
Feedback Infra Pvt. Ltd. 4-42 National Highways Authority of India
i. Firstly to estimate the divertible traffic various data has been collected through primary
and secondary surveys. In primary surveys, Origin–Destination survey and speed and
delay survey was organized to analyze the percentage all through traffic for desired OD
pairs and average speed on competing corridors. In secondary data collection, range of
data collected on vehicle operating cost, value of time, toll rates, average toll rates per
km for NH and SH, etc.
ii. Secondly, generalized cost has been estimated based on values of time, vehicle
operating cost, toll rates, roughness of road, travel time, corridor length.
iii. Thirdly, In order to assess the potential amount of percentage traffic diversion to the
project corridor, a generalized cost analysis comparing the competing routes was
conducted, through which the equations with respect to mode has been calculated. This
analysis is based on the guidance provided by the Road User Cost Study 2000 for India,
and the diversion curve equations derived under the Technical Assistance Programme
funded by ADB for Ministry of Transport and the same are provided in IRC: 108-105.
These equations are as given below:
Vehicle Cost Ratio (CR) Interval Equations
Car <= 0.634 %Div = 98.750 - (CR/0.634) * 8.125
0.634 <= CR <= 1.465 %Div = 90.625 - ((CR-0.634)/0.831) * 84.375
1.465 <= CR <= 2.0 %Div = 6.25 - ((CR-1.465)/0.535) * 5.25
Truck & Bus <= 0.750 %Div = 100 - ((CR/0.75) * 5)
0.750 <= CR <= 1.250 %Div = 95 - ((CR-0.75)/0.5) * 90
1.250 <= CR <= 2.0 %Div = ((2-CR)/0.75) * 5
Where,
CR = (Total Cost of Alternate Route) / (Total Cost of Project Route)
Total Cost (Rs.) = Vehicle Operating Cost (Rs.)+Toll Charges (Rs.)+Value of time (Rs.)
iv. The percentage diversion is estimated based on the diversion of total traffic on to the
alternate route and the remaining percentage is diverted on to the project road.
4.2.2.3.2 Generalized cost
The generalized cost (GC) function used for diversion analysis relates the various time and cost
element into one value. For detail calculation of generalized costs for various alternative routes the
following elements are considered.
a. Length of routes: For all the potential alternative routes the length of route is
considered as the total distance between two points, along the alternate route and
along the route involving the project corridor. The details of the routes are given
below.
Stretch Route Type of Road No. of lanes Condition Toll Plaza Length
Alternate Route 1: Chennai - Krishnagiri - Salem

Consultancy Services for preparation of DPR for development of Economic Corridors, Inter Corridors, Feeder Routes and National corridors (GQ and NS-EW Corridors) to improve the efficiency of freight movement in India under Bharatmala Pariyojana (Chennai-Salem Highway)
Feasibility Report Volume – I (Main Report)
Traffic Studies & Forecasts
Feedback Infra Pvt. Ltd. 4-43 National Highways Authority of India
Alternate
Route
Chennai - Krishnagiri NH48 4/6 lane Good 4 230.0
Krishnagiri - Salem NH44 4/6 lane Good 2 115.0
Total 345.0
Project
road Chennai - Salem highway Project road 4/6 lane Good 1* 277.0
Alternate Route 2: Chennai - Ulundurpet- Salem
Alternate
Route
Chennai - Ulundurpet NH32/132/38 4 lane Good 4 176.0
Ulundurpet - Salem NH79(68) 4 lane Good 3 137.0
Total 313.0
Project
road Chennai - Salem highway Project road 4/6 lane Good 1* 277.0
Alternate Route 3: Chennai - Vellore - Krishnagiri
Project
Road
Krishnagiri - Chengam NH77 2 lane Fair 80.0
Chennai - Chengam Project road 4/6 lane Good 1* 158.0
Total 238.0
Alternate
Road Chennai - Krishnagiri NH48 4/6 lane Good 4 230.0
Alternate Route 4: Vellore - Krishnagiri - Salem
Project
road
Vellore - Polur (Project
highway) NH234 2 lane Fair
62.0
Polur (Project highway) -
Salem Project road 4/6 lane Good 1* 155.0
Total 217.0
Alternate
Road
Vellore - Krishnagiri -
Salem NH48/NH44 4/6 lane Good 4 235.0
Alternate Route 5: Chennai - Tindivanam - Tiruvannamalai
Alternate
Route
Chennai - Tindivanam NH32 4/6 lane Good 2 88.0
Tindivanam -
Tiruvannamalai NH77 2 lane Fair
67.0
Total 155.0
Project
road Chennai-Salem highway Project road 4/6 lane Good 1* 137.0
Alternate Route 6: Chennai - Vellore – Tiruvannamalai
Alternate
Road
Chennai - Vellore NH48 4/6 lane Good 2 114.0
Vellore - Tiruvannamalai NH234 2 lane Fair - 81.0
Total 195.0
Project
road Chennai - Salem highway Project road 4/6 lane Good 1* 137.0
*Toll amount for corresponding length
b. Vehicle operating cost: The VOC for various vehicle types are suggested in IRC: SP: 30
– 2009. Vehicle operating cost comprises of fixed and variable costs, like, fuel, tyres,

Consultancy Services for preparation of DPR for development of Economic Corridors, Inter Corridors, Feeder Routes and National corridors (GQ and NS-EW Corridors) to improve the efficiency of freight movement in India under Bharatmala Pariyojana (Chennai-Salem Highway)
Feasibility Report Volume – I (Main Report)
Traffic Studies & Forecasts
Feedback Infra Pvt. Ltd. 4-44 National Highways Authority of India
maintenance, lubricants etc. which vary with the distance travelled forming the
variable cost component and insurance, taxes and depreciation forming the fixed
component. The IRC: SP: 30 – 2009 suggests VOCs based on lane configuration, rise
and fall and roughness. The revised VOCs for present year has considered for
alternate routes mentioned above based on the lane configuration and pavement
conditions.
c. Value of time: The values of time costs for different modes is adopted from IRC: SP:
30 – 2009. It has been revised for present year and adopted values given below.
Nature of Journey by Passenger
Value of Time (Rs per hour) (2009) Value of Time (Rs per hour) (2018)
Primary Route Secondary Route Primary Route Secondary Route
Cars 62.5 52.5 89.4 75.1
Ordinary Bus Passenger 39.5 14.5 56.5 20.7
Deluxe Bus Passenger 43.5 - 62.2 -
Types of Route Commodity Holding Cost (Rs/day)
Commodity Holding Cost (Rs/hr) (2009)
Commodity Holding Cost (Rs/hr) (2018)
Primary Route
58.1 2.4 3.5
178 7.4 10.6
333 13.9 19.9
Secondary Route 53.8 2.2 3.2
148.4 6.2 8.8
d. Travel Time: Travel time is derived from the length of alternative route and average
speed. The average speed is adopted from the speed and delay survey results.
e. Toll: Toll estimation for each route is done using the prevailing toll policies and actual
toll on various routes, wherever necessary. The toll on project highway is considered
as suggested by NHAI toll notification.
The Generalized Cost for cost ratio calculation for vehicles has the following form;
GC = VOC*TL +VOT * TT +TR
Where,
VOC = Vehicle Operating Cost
VOT = Value of Travel Time
TT = Travel Time
TR = Toll Rates
TL = Trip Length
Table 4-32 gives the generalised cost for all the potential alternative routes along with proposed corridor
Table 4-32: Generalised cost for Alternate routes and Project road
Vehicle type Alternate route 1
Alternate route 2
Alternate route 3
Alternate route 4
Alternate route 5
Alternate route 6
Proposed Corridor*
Car 2913.92 2623.07 1920.10 2021.19 1281.80 1579.26 2237.36
Bus 6840.50 6190.97 4469.77 4777.81 2994.60 3650.05 5363.13
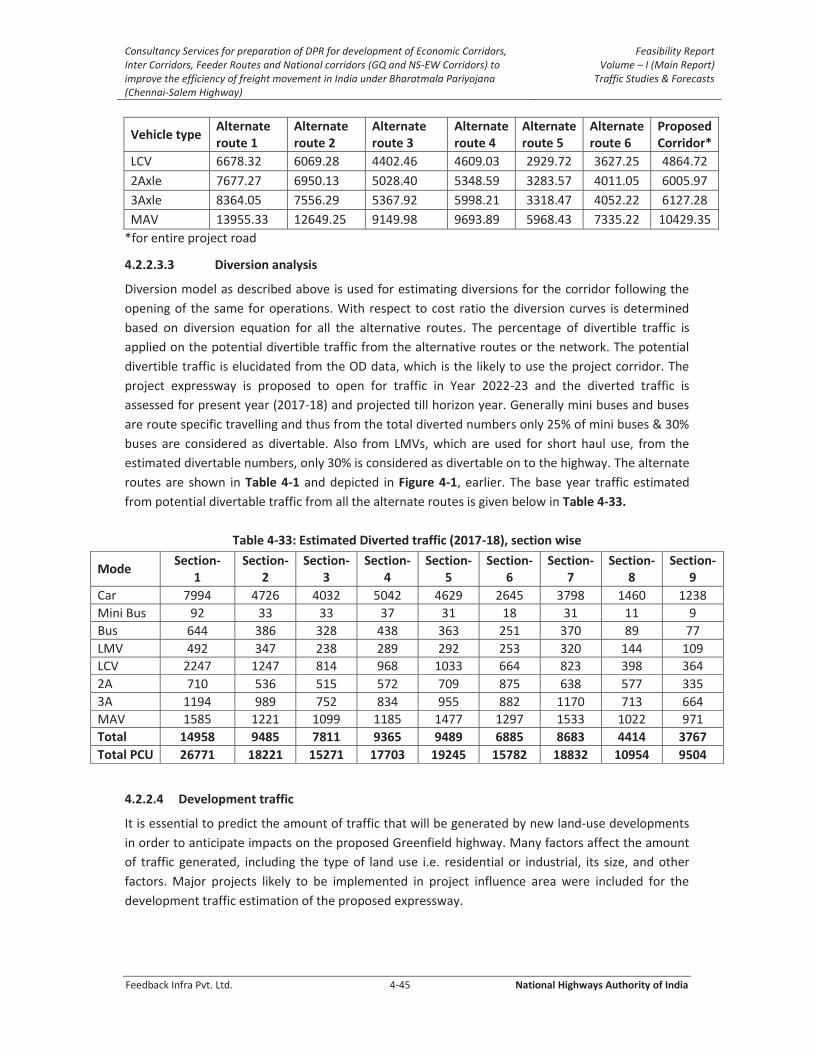
Consultancy Services for preparation of DPR for development of Economic Corridors, Inter Corridors, Feeder Routes and National corridors (GQ and NS-EW Corridors) to improve the efficiency of freight movement in India under Bharatmala Pariyojana (Chennai-Salem Highway)
Feasibility Report Volume – I (Main Report)
Traffic Studies & Forecasts
Feedback Infra Pvt. Ltd. 4-45 National Highways Authority of India
Vehicle type Alternate route 1
Alternate route 2
Alternate route 3
Alternate route 4
Alternate route 5
Alternate route 6
Proposed Corridor*
LCV 6678.32 6069.28 4402.46 4609.03 2929.72 3627.25 4864.72
2Axle 7677.27 6950.13 5028.40 5348.59 3283.57 4011.05 6005.97
3Axle 8364.05 7556.29 5367.92 5998.21 3318.47 4052.22 6127.28
MAV 13955.33 12649.25 9149.98 9693.89 5968.43 7335.22 10429.35
*for entire project road
4.2.2.3.3 Diversion analysis
Diversion model as described above is used for estimating diversions for the corridor following the
opening of the same for operations. With respect to cost ratio the diversion curves is determined
based on diversion equation for all the alternative routes. The percentage of divertible traffic is
applied on the potential divertible traffic from the alternative routes or the network. The potential
divertible traffic is elucidated from the OD data, which is the likely to use the project corridor. The
project expressway is proposed to open for traffic in Year 2022-23 and the diverted traffic is
assessed for present year (2017-18) and projected till horizon year. Generally mini buses and buses
are route specific travelling and thus from the total diverted numbers only 25% of mini buses & 30%
buses are considered as divertable. Also from LMVs, which are used for short haul use, from the
estimated divertable numbers, only 30% is considered as divertable on to the highway. The alternate
routes are shown in Table 4-1 and depicted in Figure 4-1, earlier. The base year traffic estimated
from potential divertable traffic from all the alternate routes is given below in Table 4-33.
Table 4-33: Estimated Diverted traffic (2017-18), section wise
Mode Section-
1 Section-
2 Section-
3 Section-
4 Section-
5 Section-
6 Section-
7 Section-
8 Section-
9
Car 7994 4726 4032 5042 4629 2645 3798 1460 1238
Mini Bus 92 33 33 37 31 18 31 11 9
Bus 644 386 328 438 363 251 370 89 77
LMV 492 347 238 289 292 253 320 144 109
LCV 2247 1247 814 968 1033 664 823 398 364
2A 710 536 515 572 709 875 638 577 335
3A 1194 989 752 834 955 882 1170 713 664
MAV 1585 1221 1099 1185 1477 1297 1533 1022 971
Total 14958 9485 7811 9365 9489 6885 8683 4414 3767
Total PCU 26771 18221 15271 17703 19245 15782 18832 10954 9504
4.2.2.4 Development traffic
It is essential to predict the amount of traffic that will be generated by new land-use developments
in order to anticipate impacts on the proposed Greenfield highway. Many factors affect the amount
of traffic generated, including the type of land use i.e. residential or industrial, its size, and other
factors. Major projects likely to be implemented in project influence area were included for the
development traffic estimation of the proposed expressway.
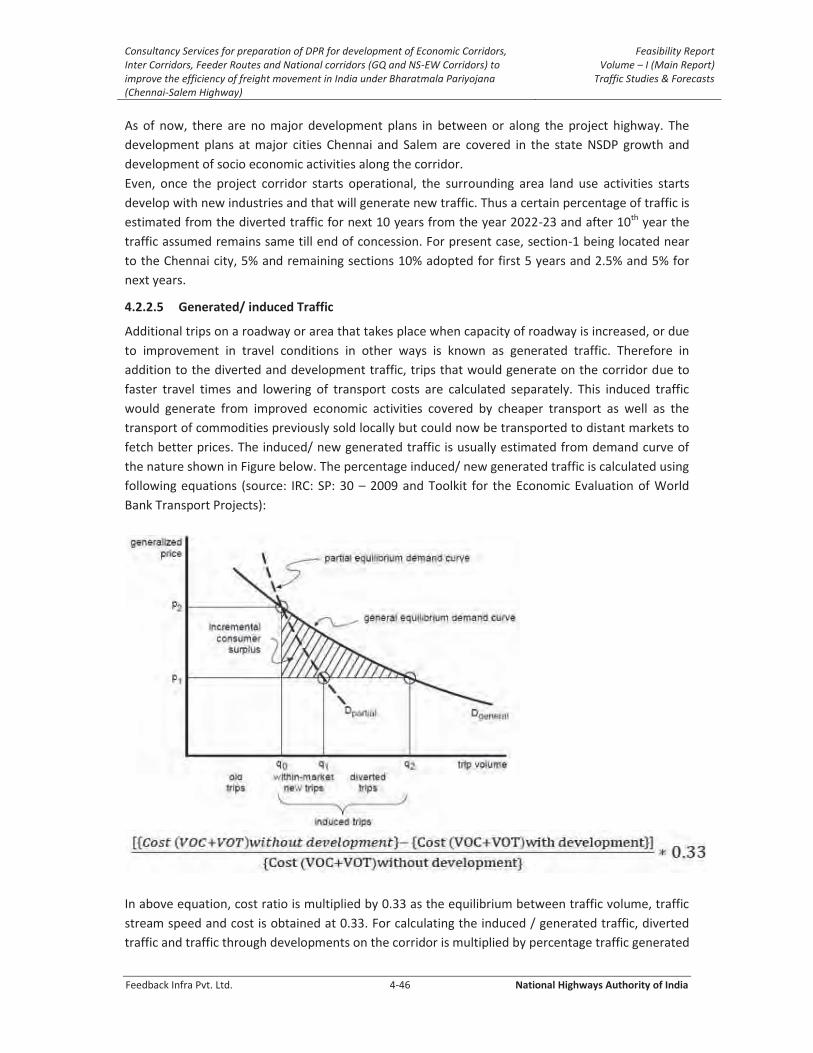
Consultancy Services for preparation of DPR for development of Economic Corridors, Inter Corridors, Feeder Routes and National corridors (GQ and NS-EW Corridors) to improve the efficiency of freight movement in India under Bharatmala Pariyojana (Chennai-Salem Highway)
Feasibility Report Volume – I (Main Report)
Traffic Studies & Forecasts
Feedback Infra Pvt. Ltd. 4-46 National Highways Authority of India
As of now, there are no major development plans in between or along the project highway. The
development plans at major cities Chennai and Salem are covered in the state NSDP growth and
development of socio economic activities along the corridor.
Even, once the project corridor starts operational, the surrounding area land use activities starts
develop with new industries and that will generate new traffic. Thus a certain percentage of traffic is
estimated from the diverted traffic for next 10 years from the year 2022-23 and after 10th year the
traffic assumed remains same till end of concession. For present case, section-1 being located near
to the Chennai city, 5% and remaining sections 10% adopted for first 5 years and 2.5% and 5% for
next years.
4.2.2.5 Generated/ induced Traffic
Additional trips on a roadway or area that takes place when capacity of roadway is increased, or due
to improvement in travel conditions in other ways is known as generated traffic. Therefore in
addition to the diverted and development traffic, trips that would generate on the corridor due to
faster travel times and lowering of transport costs are calculated separately. This induced traffic
would generate from improved economic activities covered by cheaper transport as well as the
transport of commodities previously sold locally but could now be transported to distant markets to
fetch better prices. The induced/ new generated traffic is usually estimated from demand curve of
the nature shown in Figure below. The percentage induced/ new generated traffic is calculated using
following equations (source: IRC: SP: 30 – 2009 and Toolkit for the Economic Evaluation of World
Bank Transport Projects):
In above equation, cost ratio is multiplied by 0.33 as the equilibrium between traffic volume, traffic
stream speed and cost is obtained at 0.33. For calculating the induced / generated traffic, diverted
traffic and traffic through developments on the corridor is multiplied by percentage traffic generated

Consultancy Services for preparation of DPR for development of Economic Corridors, Inter Corridors, Feeder Routes and National corridors (GQ and NS-EW Corridors) to improve the efficiency of freight movement in India under Bharatmala Pariyojana (Chennai-Salem Highway)
Feasibility Report Volume – I (Main Report)
Traffic Studies & Forecasts
Feedback Infra Pvt. Ltd. 4-47 National Highways Authority of India
obtained by above equation. Table 4-34 below shows the VOC and VOT for the existing and project
road along with the induced ratio.
Table 4-34: Induced ratio for induced traffic
Vehicle Type Existing corridor Proposed corridor Induced
ratio VOC VOT VOC VOT
Car 1644.49 353.86 1533.51 309.63 2.6%
Bus 4010.55 313.46 3741.47 287.33 2.3%
LCV 4778.21 17.77 4211.88 15.99 3.9%
2Axle 4946.84 49.01 4618.20 53.44 2.1%
3Axle 4946.84 54.46 4618.20 53.44 2.2%
MAV 9296.78 61.26 7771.98 109.98 5.2%
The average of sectional traffic volume arrived from diverted and development traffic from section 2
to 7 is taken and induced ratio applied on traffic volume to estimate induced traffic. This traffic is
assigned to all 9 sections.
4.2.2.6 Estimated Traffic on Proposed highway
The final traffic estimated on the proposed Greenfield highway is consists of diverted traffic,
development traffic and induced traffic. The section wise total numbers and total pcu in the
operational year of highway i.e, 2022-23 is given below in Table 4-35 and the detailed mode wise
estimated volume is presented in Annexure 4.3 to this report.
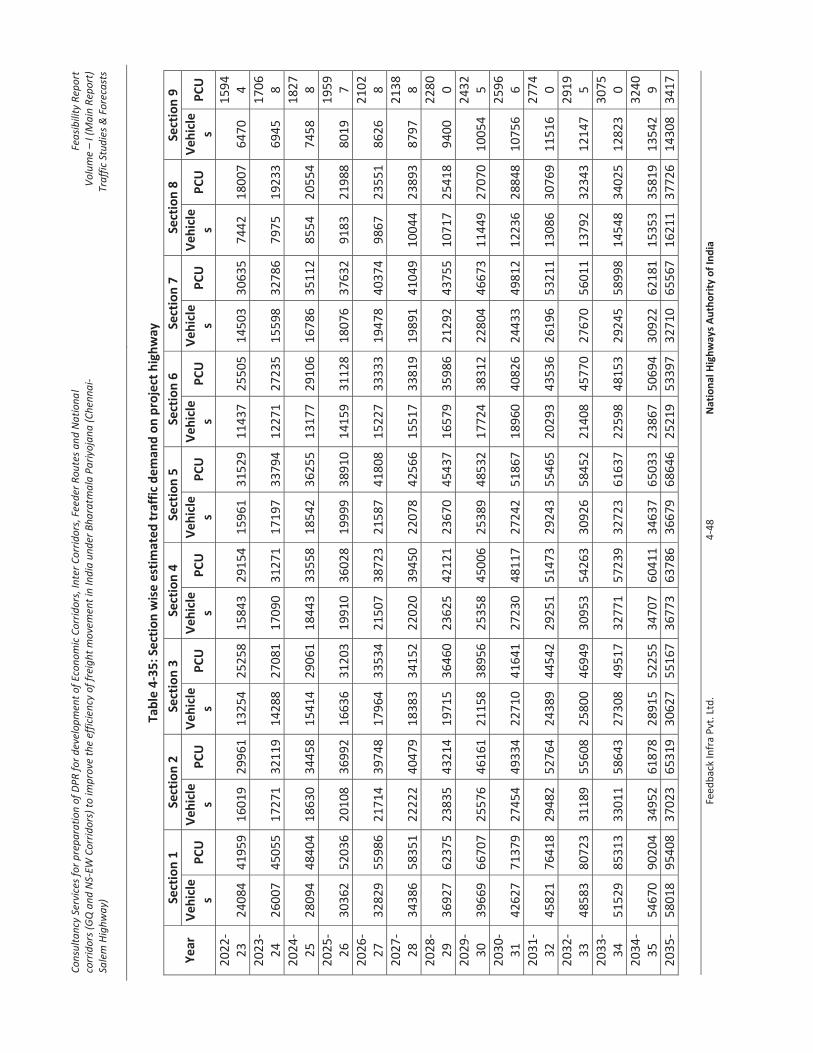
Co
nsu
lta
ncy
Ser
vice
s fo
r p
rep
ara
tio
n o
f D
PR
fo
r d
evel
op
men
t o
f Ec
on
om
ic C
orr
ido
rs, I
nte
r C
orr
ido
rs, F
eed
er R
ou
tes
an
d N
ati
on
al
corr
ido
r s (
GQ
an
d N
S-EW
Co
rrid
ors
) to
imp
rove
th
e ef
fici
ency
of
frei
gh
t m
ove
men
t in
Ind
ia u
nd
er B
ha
ratm
ala
Pa
riyo
jan
a (
Ch
enn
ai-
Sale
m H
igh
wa
y)
Fea
sib
ility
Rep
ort
V
olu
me –
I (M
ain
Rep
ort
) Tr
aff
ic S
tud
ies
& F
ore
cast
s
Fee
db
ack
Infr
a P
vt. L
td.
4-4
8
Nat
ion
al H
igh
way
s A
uth
ori
ty o
f In
dia
Tab
le 4
-35
: Se
ctio
n w
ise
est
imat
ed
tra
ffic
dem
and
on
pro
ject
hig
hw
ay
Ye
ar
Sect
ion
1
Sect
ion
2
Sect
ion
3
Sect
ion
4
Sect
ion
5
Sect
ion
6
Sect
ion
7
Sect
ion
8
Sect
ion
9
Veh
icle
s P
CU
V
ehic
les
PC
U
Veh
icle
s P
CU
V
ehic
les
PC
U
Veh
icle
s P
CU
V
ehic
les
PC
U
Veh
icle
s P
CU
V
ehic
les
PC
U
Veh
icle
s P
CU
20
22
-2
3
24
08
4
41
95
9
16
01
9
29
96
1
13
25
4
25
25
8
15
84
3
29
15
4
15
96
1
31
52
9
11
43
7
25
50
5
14
50
3
30
63
5
74
42
1
80
07
6
47
0
15
94
4
20
23
-2
4
26
00
7
45
05
5
17
27
1
32
11
9
14
28
8
27
08
1
17
09
0
31
27
1
17
19
7
33
79
4
12
27
1
27
23
5
15
59
8
32
78
6
79
75
1
92
33
6
94
5
17
06
8
20
24
-2
5
28
09
4
48
40
4
18
63
0
34
45
8
15
41
4
29
06
1
18
44
3
33
55
8
18
54
2
36
25
5
13
17
7
29
10
6
16
78
6
35
11
2
85
54
2
05
54
7
45
8
18
27
8
20
25
-2
6
30
36
2
52
03
6
20
10
8
36
99
2
16
63
6
31
20
3
19
91
0
36
02
8
19
99
9
38
91
0
14
15
9
31
12
8
18
07
6
37
63
2
91
83
2
19
88
8
01
9
19
59
7
20
26
-2
7
32
82
9
55
98
6
21
71
4
39
74
8
17
96
4
33
53
4
21
50
7
38
72
3
21
58
7
41
80
8
15
22
7
33
33
3
19
47
8
40
37
4
98
67
2
35
51
8
62
6
21
02
8
20
27
-2
8
34
38
6
58
35
1
22
22
2
40
47
9
18
38
3
34
15
2
22
02
0
39
45
0
22
07
8
42
56
6
15
51
7
33
81
9
19
89
1
41
04
9
10
04
4
23
89
3
87
97
2
13
88
20
28
-2
9
36
92
7
62
37
5
23
83
5
43
21
4
19
71
5
36
46
0
23
62
5
42
12
1
23
67
0
45
43
7
16
57
9
35
98
6
21
29
2
43
75
5
10
71
7
25
41
8
94
00
2
28
00
20
29
-3
0
39
66
9
66
70
7
25
57
6
46
16
1
21
15
8
38
95
6
25
35
8
45
00
6
25
38
9
48
53
2
17
72
4
38
31
2
22
80
4
46
67
3
11
44
9
27
07
0
10
05
4
24
32
5
20
30
-3
1
42
62
7
71
37
9
27
45
4
49
33
4
22
71
0
41
64
1
27
23
0
48
11
7
27
24
2
51
86
7
18
96
0
40
82
6
24
43
3
49
81
2
12
23
6
28
84
8
10
75
6
25
96
6
20
31
-3
2
45
82
1
76
41
8
29
48
2
52
76
4
24
38
9
44
54
2
29
25
1
51
47
3
29
24
3
55
46
5
20
29
3
43
53
6
26
19
6
53
21
1
13
08
6
30
76
9
11
51
6
27
74
0
20
32
-3
3
48
58
3
80
72
3
31
18
9
55
60
8
25
80
0
46
94
9
30
95
3
54
26
3
30
92
6
58
45
2
21
40
8
45
77
0
27
67
0
56
01
1
13
79
2
32
34
3
12
14
7
29
19
5
20
33
-3
4
51
52
9
85
31
3
33
01
1
58
64
3
27
30
8
49
51
7
32
77
1
57
23
9
32
72
3
61
63
7
22
59
8
48
15
3
29
24
5
58
99
8
14
54
8
34
02
5
12
82
3
30
75
0
20
34
-3
5
54
67
0
90
20
4
34
95
2
61
87
8
28
91
5
52
25
5
34
70
7
60
41
1
34
63
7
65
03
3
23
86
7
50
69
4
30
92
2
62
18
1
15
35
3
35
81
9
13
54
2
32
40
9
20
35
-5
80
18
9
54
08
3
70
23
6
53
19
3
06
27
5
51
67
3
67
73
6
37
86
3
66
79
6
86
46
2
52
19
5
33
97
3
27
10
6
55
67
1
62
11
3
77
26
1
43
08
3
41
7

Co
nsu
lta
ncy
Ser
vice
s fo
r p
rep
ara
tio
n o
f D
PR
fo
r d
evel
op
men
t o
f Ec
on
om
ic C
orr
ido
rs, I
nte
r C
orr
ido
rs, F
eed
er R
ou
tes
an
d N
ati
on
al
corr
ido
r s (
GQ
an
d N
S-EW
Co
rrid
ors
) to
imp
rove
th
e ef
fici
ency
of
frei
gh
t m
ove
men
t in
Ind
ia u
nd
er B
ha
ratm
ala
Pa
riyo
jan
a (
Ch
enn
ai-
Sale
m H
igh
wa
y)
Fea
sib
ility
Rep
ort
V
olu
me –
I (M
ain
Rep
ort
) Tr
aff
ic S
tud
ies
& F
ore
cast
s
Fee
db
ack
Infr
a P
vt. L
td.
4-4
9
Nat
ion
al H
igh
way
s A
uth
ori
ty o
f In
dia
Ye
ar
Sect
ion
1
Sect
ion
2
Sect
ion
3
Sect
ion
4
Sect
ion
5
Sect
ion
6
Sect
ion
7
Sect
ion
8
Sect
ion
9
Veh
icle
s P
CU
V
ehic
les
PC
U
Veh
icle
s P
CU
V
ehic
les
PC
U
Veh
icle
s P
CU
V
ehic
les
PC
U
Veh
icle
s P
CU
V
ehic
les
PC
U
Veh
icle
s P
CU
36
2
20
36
-3
7
61
58
5
10
09
48
3
92
27
6
89
80
3
24
51
5
82
64
3
89
72
6
73
75
3
88
53
7
24
89
2
66
58
5
62
70
3
46
14
6
91
68
1
71
23
3
97
53
1
51
24
3
60
46
20
37
-3
8
64
44
9
10
54
23
4
10
00
7
19
45
3
39
19
6
07
77
4
07
40
7
02
84
4
06
02
7
56
08
2
78
18
5
86
08
3
61
46
7
20
93
1
78
62
4
14
09
1
57
84
3
75
79
20
38
-3
9
67
45
3
11
01
12
4
28
58
7
50
50
3
54
57
6
34
07
4
25
94
7
33
29
4
24
36
7
88
74
2
90
33
6
10
55
3
77
53
7
51
56
1
86
34
4
31
40
1
64
75
3
91
81
20
39
-4
0
70
60
4
11
50
29
4
48
06
7
83
04
3
70
70
6
61
63
4
45
38
7
65
19
4
43
59
8
22
97
3
03
07
6
36
18
3
94
37
7
83
65
1
94
43
4
49
51
1
71
98
4
08
58
20
40
-4
1
73
91
5
12
01
98
4
68
55
8
17
29
3
87
66
6
90
66
4
65
82
7
98
78
4
63
82
8
59
01
3
16
47
6
63
18
4
12
08
8
17
44
2
02
95
4
68
64
1
79
60
4
26
28
20
41
-4
2
77
39
0
12
56
22
4
90
04
8
53
21
4
05
47
7
21
10
4
87
27
8
34
00
4
85
04
8
96
82
3
30
54
6
91
50
4
30
67
8
52
88
2
11
89
4
88
69
1
87
60
4
44
84
20
42
-4
3
81
00
4
13
12
64
5
12
41
8
90
59
4
23
99
7
52
79
5
09
58
8
70
66
5
07
13
9
36
17
3
45
17
7
20
99
4
50
01
8
89
78
2
21
20
5
09
58
1
95
92
4
64
18
20
43
-4
4
84
79
4
13
71
79
5
35
85
9
29
77
4
43
40
7
85
99
5
32
98
9
09
08
5
30
28
9
77
42
3
60
51
7
51
90
4
70
28
9
28
46
2
30
95
5
31
46
2
04
64
4
84
43
20
44
-4
5
88
77
3
14
33
90
5
60
47
9
70
93
4
63
79
8
20
88
5
57
54
9
49
44
5
54
59
1
02
07
6
37
66
2
78
43
9
49
15
8
96
91
0
24
12
0
55
44
9
21
38
0
50
57
4
20
45
-4
6
92
94
8
14
99
06
5
86
30
1
01
41
1
48
51
9
85
74
8
58
33
3
99
17
8
58
01
1
10
66
23
3
93
53
8
18
46
5
13
92
1
01
17
3
25
19
6
57
86
3
22
34
2
52
80
9
20
46
-4
7
97
33
1
15
67
45
6
13
43
1
05
94
4
50
76
5
89
59
1
61
04
0
10
36
24
6
06
90
1
11
39
7
41
12
8
85
42
5
53
73
8
10
56
49
2
63
26
6
04
01
2
33
53
5
51
58
20
47
-4
8
10
19
29
1
63
91
6
64
18
8
11
06
97
5
31
22
9
36
19
6
38
79
1
08
28
4
63
50
0
11
64
04
4
29
90
8
91
78
5
61
99
1
10
34
3
27
51
0
63
06
0
24
41
2
57
62
0
20
48
-4
9
10
67
54
1
71
44
3
67
17
4
11
56
87
5
55
96
9
78
49
6
68
59
1
13
17
7
66
45
1
12
16
60
4
49
45
9
31
18
5
87
83
1
15
27
1
28
75
4
65
85
3
25
52
4
60
20
6
20
49
-1
11
81
8
17
93
47
03
08
1
20
92
58
19
2
10
22
96
99
87
1
18
31
69
54
7
12
71
84
69
97
9
72
57
6
14
94
1
20
44
30
06
0
68
79
0
26
69
2
62
92

Co
nsu
lta
ncy
Ser
vice
s fo
r p
rep
ara
tio
n o
f D
PR
fo
r d
evel
op
men
t o
f Ec
on
om
ic C
orr
ido
rs, I
nte
r C
orr
ido
rs, F
eed
er R
ou
tes
an
d N
ati
on
al
corr
ido
r s (
GQ
an
d N
S-EW
Co
rrid
ors
) to
imp
rove
th
e ef
fici
ency
of
frei
gh
t m
ove
men
t in
Ind
ia u
nd
er B
ha
ratm
ala
Pa
riyo
jan
a (
Ch
enn
ai-
Sale
m H
igh
wa
y)
Fea
sib
ility
Rep
ort
V
olu
me –
I (M
ain
Rep
ort
) Tr
aff
ic S
tud
ies
& F
ore
cast
s
Fee
db
ack
Infr
a P
vt. L
td.
4-5
0
Nat
ion
al H
igh
way
s A
uth
ori
ty o
f In
dia
Ye
ar
Sect
ion
1
Sect
ion
2
Sect
ion
3
Sect
ion
4
Sect
ion
5
Sect
ion
6
Sect
ion
7
Sect
ion
8
Sect
ion
9
Veh
icle
s P
CU
V
ehic
les
PC
U
Veh
icle
s P
CU
V
ehic
les
PC
U
Veh
icle
s P
CU
V
ehic
les
PC
U
Veh
icle
s P
CU
V
ehic
les
PC
U
Veh
icle
s P
CU
50
5
7
2
5
0
7
5
20
50
-5
1
11
71
31
1
87
62
8
73
59
6
12
64
18
6
09
15
1
06
94
7
73
26
8
12
36
99
7
27
95
1
32
96
5
49
14
8
10
15
93
6
43
38
1
25
87
1
31
42
9
71
86
4
27
91
6
65
77
1
20
51
-5
2
12
27
09
1
96
32
7
77
04
9
13
21
86
6
37
76
1
11
83
9
76
71
4
12
93
55
7
62
06
1
39
04
4
51
40
9
10
61
51
6
73
25
1
31
57
1
32
86
8
75
09
8
29
20
4
68
76
5
20
52
-5
3
12
85
62
2
05
45
4
80
67
1
13
82
39
6
67
78
1
16
97
2
80
33
0
13
52
90
7
97
86
1
45
42
2
53
78
1
11
09
34
7
04
59
1
37
55
1
34
37
8
78
49
2
30
55
4
71
90
8
20
53
-5
4
13
47
04
2
15
03
0
84
47
3
14
45
90
6
99
28
1
22
35
7
84
12
5
14
15
18
8
35
43
1
52
11
6
56
27
0
11
59
54
7
37
48
1
43
82
8
35
96
3
82
05
4
31
97
2
75
20
6
20
54
-5
5
14
11
50
2
25
08
0
88
46
3
15
12
58
7
32
35
1
28
01
2
88
10
9
14
80
55
8
74
86
1
59
14
4
58
88
3
12
12
24
7
72
01
1
50
41
7
37
62
7
85
79
5
33
46
0
78
67
0
20
55
-5
6
14
79
14
2
35
62
4
92
65
0
15
82
51
7
67
04
1
33
94
4
92
28
8
15
49
13
9
16
24
1
66
51
6
61
62
4
12
67
53
8
08
23
1
57
33
0
39
37
2
89
72
0
35
02
1
82
30
4
20
56
-5
7
15
50
13
2
46
68
9
97
04
4
16
55
92
8
03
46
1
40
16
9
96
67
5
16
21
11
9
59
67
1
74
25
5
64
50
2
13
25
57
8
46
26
1
64
58
6
41
20
5
93
84
1
36
66
0
86
12
0
20
57
-5
8
16
24
62
2
58
29
7
10
16
56
1
73
29
2
84
16
7
14
67
00
1
01
27
9
16
96
61
1
00
52
5
18
23
74
6
75
21
1
38
64
6
88
61
6
17
21
99
4
31
28
9
81
63
3
83
80
9
01
22
20
58
-5
9
17
02
82
2
70
48
6
10
64
97
1
81
38
2
88
18
1
15
35
63
1
06
11
3
17
75
93
1
05
31
2
19
09
04
7
06
93
1
45
04
5
92
80
7
18
01
98
4
51
49
1
02
71
0
40
18
7
94
33
2
20
59
-6
0
17
84
88
2
83
27
1
11
15
77
1
89
86
5
92
39
1
16
07
59
1
11
18
5
18
59
12
1
10
33
3
19
98
51
7
40
20
1
51
75
6
97
20
3
18
85
86
4
72
68
1
07
47
6
42
08
3
98
74
6

Consultancy Services for preparation of DPR for development of Economic Corridors, Inter Corridors, Feeder Routes and National corridors (GQ and NS-EW Corridors) to improve the efficiency of freight movement in India under Bharatmala Pariyojana (Chennai-Salem Highway)
Feasibility Report Volume – I (Main Report)
Traffic Studies & Forecasts
Feedback Infra Pvt. Ltd. 4-51 National Highways Authority of India
4.2.3 Toll Plaza
4.2.3.1 Location of toll plaza
Since it is an access controlled highway, toll plazas will be kept at all entry and exit points along the highway. Exact locations will be decided during FFR stage.
4.2.4 Capacity Analysis
4.2.3.2 Capacity augmentation proposals (lane requirement)
Capacity analysis for project road has been carried out in order to define the Level of Service (LoS) offered by road sections under the prevailing roadway and traffic conditions.
Capacity and level of service guidelines
Capacity and design service volumes for various lane configurations are specified in IRC: 64 – 1990, ‘Capacity of Roads in Rural Areas’, IRC-SP: 84-2014 ‘Manual of Specifications and Standards for Four-laning of Highways through Public Private Partnership’ and IRC-SP:87-2013 ‘Manual of specifications and Standards for Six-laning of Highways through Public Private Partnership’.. The project stretch passes through plain terrain predominantly. The design service volume standards for LoS B and LoS C considered as per guidelines are given in Table 4-36 below.
Table 4-36: Design service volume standards for LoS B & LoS C
Road Plain Terrain
LOS B LOS C
2 lane 10000* 14000
4 lane 40000 60000
6 lane# 80000 120000
*As per MORTH notification (F.N. RW/NH-33044/37/2015/S&R(R); # The capacity of 6 lane as given in “Assumptions for Financial feasibility Analysis of BOT (Toll) projects” (Circular ref: NHAI/11033/CGM(fin)/2011 dated: 29.04.2011).
4.2.3.2.1 Projected traffic levels
The capacity analysis was done for entire project road with respective homogeneous sections. The projected traffic volumes for the projected road are given in Table 4-37.
Table 4-37: Projected sectional traffic (AADT) in PCUs
Section Section
1 Section
2 Section
3 Section
4 Section
5 Section 6 Section 7 Section 8 Section 9
2023 41959 29961 25258 29154 31529 25505 30635 18007 15944
2025 48404 34458 29061 33558 36255 29106 35112 20554 18278
2030 66707 46161 38956 45006 48532 38312 46673 27070 24325
2035 90204 61878 52255 60411 65033 50694 62181 35819 32409
2040 115029 78304 66163 76519 82297 63618 78365 44951 40858
2045 143390 97093 82088 94944 102076 78439 96910 55449 50574
2050 179345 120927 102292 118315 127180 97257 120447 68790 62925
2055 225080 151258 128012 148055 159144 121224 150417 85795 78670
2060 283271 189865 160759 185912 199851 151756 188586 107476 98746
Consultancy Services for preparation of DPR for development of Economic Corridors, Inter Corridors, Feeder Routes and National corridors (GQ and NS-EW Corridors) to improve the efficiency of freight movement in India under Bharatmala Pariyojana (Chennai-Salem Highway)
Feasibility Report Volume – I (Main Report)
Traffic Studies & Forecasts
Feedback Infra Pvt. Ltd. 4-52 National Highways Authority of India
Projected sectional AADT was compared with design service volume. The design service volume for project road is considered at the end of LOS B and LOS C and capacity augmentation is suggested for road section, which carry traffic volume more than design service volume.
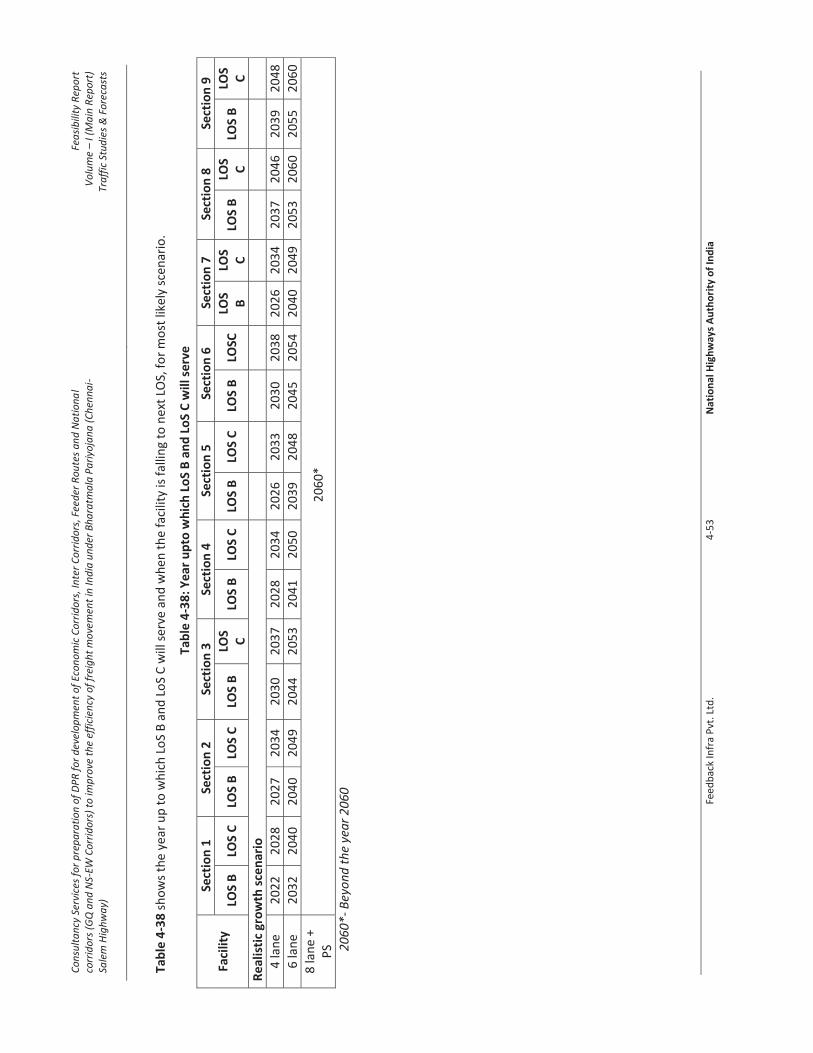
Co
nsu
lta
ncy
Ser
vice
s fo
r p
rep
ara
tio
n o
f D
PR
fo
r d
evel
op
men
t o
f Ec
on
om
ic C
orr
ido
rs, I
nte
r C
orr
ido
rs, F
eed
er R
ou
tes
an
d N
ati
on
al
corr
ido
rs (
GQ
an
d N
S -EW
Co
rrid
ors
) to
imp
rove
th
e ef
fici
ency
of
frei
gh
t m
ove
men
t in
Ind
ia u
nd
er B
ha
ratm
ala
Pa
riyo
jan
a (
Ch
enn
ai-
Sale
m H
igh
wa
y)
Fea
sib
ility
Rep
ort
V
olu
me –
I (M
ain
Rep
ort
) Tr
aff
ic S
tud
ies
& F
ore
cast
s
Fee
db
ack
Infr
a P
vt. L
td.
4-5
3
Nat
ion
al H
igh
way
s A
uth
ori
ty o
f In
dia
Tab
le 4
-38
sh
ow
s th
e ye
ar u
p t
o w
hic
h L
oS
B a
nd
Lo
S C
will
ser
ve a
nd
wh
en t
he
faci
lity
is f
allin
g to
nex
t LO
S, f
or
mo
st li
kely
sce
nar
io.
Tab
le 4
-38
: Yea
r u
pto
wh
ich
Lo
S B
an
d L
oS
C w
ill s
erve
Faci
lity
Sect
ion
1
Sect
ion
2
Sect
ion
3
Sect
ion
4
Sect
ion
5
Sect
ion
6
Sect
ion
7
Sect
ion
8
Sect
ion
9
LOS
B
LOS
C
LOS
B
LOS
C
LOS
B
LOS
C
LOS
B
LOS
C
LOS
B
LOS
C
LOS
B
LOSC
LO
S B
LO
SC
LO
S B
LO
SC
LO
S B
LO
SC
Re
alis
tic
gro
wth
sce
nar
io
4 la
ne
20
22
2
02
8
20
27
2
03
4
20
30
2
03
7
20
28
2
03
4
20
26
2
03
3
20
30
2
03
8
20
26
2
03
4
20
37
2
04
6
20
39
2
04
8
6 la
ne
20
32
2
04
0
20
40
2
04
9
20
44
2
05
3
20
41
2
05
0
20
39
2
04
8
20
45
2
05
4
20
40
2
04
9
20
53
2
06
0
20
55
2
06
0
8 la
ne
+ P
S 2
06
0*
20
60
*-
Bey
on
d t
he
yea
r 2
06
0

Consultancy Services for preparation of DPR for development of Economic Corridors, Inter Corridors, Feeder Routes and National corridors (GQ and NS-EW Corridors) to improve the efficiency of freight movement in India under Bharatmala Pariyojana (Chennai-Salem Highway)
Feasibility Report Volume – I (Main Report)
Traffic Studies & Forecasts
Feedback Infra Pvt. Ltd. 4-54 National Highways Authority of India
Section 1
To serve in LOS B the 6 lane facility should be ready by 2022 and to serve in LOS C 6 lane facility should be ready by 2028. To serve in LOS B the 8 lane facility should be ready by 2032 and to serve in LOS C 8 lane facility should be ready by 2040.
Section 2
To serve in LOS B the 6 lane facility should be ready by 2027 and to serve in LOS C 6 lane facility should be ready by 2034. To serve in LOS B the 8 lane facility should be ready by 2040 and to serve in LOS C 8 lane facility should be ready by 2049.
Section 3
To serve in LOS B the 6 lane facility should be ready by 2030 and to serve in LOS C 6 lane facility should be ready by 2037. To serve in LOS B the 8 lane facility should be ready by 2044 and to serve in LOS C 8 lane facility should be ready by 2053.
Section 4
To serve in LOS B the 6 lane facility should be ready by 2028 and to serve in LOS C 6 lane facility should be ready by 2034. To serve in LOS B the 8 lane facility should be ready by 2041 and to serve in LOS C 8 lane facility should be ready by 2050.
Section 5
To serve in LOS B the 6 lane facility should be ready by 2026 and to serve in LOS C 6 lane facility should be ready by 2033. To serve in LOS B the 8 lane facility should be ready by 2039 and to serve in LOS C 8 lane facility should be ready by 2048.
Section 6
To serve in LOS B the 6 lane facility should be ready by 2030 and to serve in LOS C 6 lane facility should be ready by 2038. To serve in LOS B the 8 lane facility should be ready by 2045 and to serve in LOS C 8 lane facility should be ready by 2054.
Section 7
To serve in LOS B the 6 lane facility should be ready by 2026 and to serve in LOS C 6 lane facility should be ready by 2034. To serve in LOS B the 8 lane facility should be ready by 2040 and to serve in LOS C 8 lane facility should be ready by 2049.
Section 8
To serve in LOS B the 6 lane facility should be ready by 2037 and to serve in LOS C 6 lane facility should be ready by 2046. To serve in LOS B the 8 lane facility should be ready by 2053 and to serve in LOS C 8 lane facility should be ready by 2060.
Section 9
To serve in LOS B the 6 lane facility should be ready by 2039 and to serve in LOS C 6 lane facility should be ready by 2048. To serve in LOS B the 8 lane facility should be ready by 2055 and to serve in LOS C 8 lane facility should be ready by 2060.
CONCLUSION
Section between Chennai and Kanchipuram/Chengalpet (Section 1) is having highest traffic volume and it requires 6 lane facility and it will serve upto 2032 in LOS B and upto 2040 in LOS C. 8-lane facility is required from 2032. In remaining sections (from section 2 to section 9), the six lane facility is required at the earliest in 2026 and 8-lane facility at the earliest by 2039 to serve in LOS B.
As per Indo-HCM (Indian Highway Capacity Manual), a suggested threshold limit for four lane to six
Consultancy Services for preparation of DPR for development of Economic Corridors, Inter Corridors, Feeder Routes and National corridors (GQ and NS-EW Corridors) to improve the efficiency of freight movement in India under Bharatmala Pariyojana (Chennai-Salem Highway)
Feasibility Report Volume – I (Main Report)
Traffic Studies & Forecasts
Feedback Infra Pvt. Ltd. 4-55 National Highways Authority of India
lane divided road to ensure enhanced safety in traffic operations is 22,500 PCUs and for six lane to eight lane is 34000 PCUs. Thus the average PCUs of all sections 25749 PCUs (sections 2 to 9) is reaching threshold limit by 2023 and demanding six lane requirement and eight lane by 2028 with an average PCUs of 34600.
Consultancy Services for preparation of DPR for development of Economic Corridors, Inter Corridors, Feeder Routes and National corridors (GQ and NS-EW Corridors) to improve the efficiency of freight movement in India under Bharatmala Pariyojana (Chennai-Salem Highway)
Feasibility Report Volume – I (Main Report)
Finalization of alignment of the Proposed Highway
Feedback Infra Pvt. Ltd. 5-1 National Highways Authority of India
5. FINALIZATION OF ALIGNMENT OF THE PROPOSED HIGHWAY
5.1 Background The Government of India has taken up the Bharatmala project on top priority. The LOT six projects earlier conceived have been modified to Chennai Selam Green Field highway along with spurs and two more existing roads improvement, as stated in Chapter 1 and 2. This chapter contains description of Chennai Selam Green Field Highway alignment finalization only along with spurs.
5.2 Need for the Green field highway The present connection between Chennai to Salem is provided by three routes; Route I : National Highways NH-48 and NE2 passing through Chennai, Kanchipuram, Vellore, Krishnagiri, Dharmapuri and Salem districts of Tamil Nadu state with the length of 352.70 Km consisting 4/6 lane configuration, Route II : National Highway NH-48 and State Highway SH-18 (New NH-179A) travelling along same districts as route I has a length of 331.89 Km consisting 2/4 lane configuration and Route III : National Highway NH-32, NH-132, NH-38, NH-79 and NE2 traversing along Chennai, Villupuram and Salem districts of Tamil Nadu state with the length of 334.28 Km with 2/4 lane configuration. Since these routes are not access-controlled, speed of the travel is affected by considerable cross movement of traffic through the side roads and access of vehicles from the abutting settlements leading to slower than design speed of the through traffic. Besides, the sections through mountainous terrain along existing route II on SH-18 (New NH-179A) section have lower radius curves at some places which restrict smooth movement of traffic at design speed. The idea of constructing a high- speed facility like a fully access-controlled green field highway has originated from the primary necessity to eliminate the bottlenecks and limitations that exist in the present corridors to reduce the travel time between Chennai – Salem. It has been felt that substantial reduction of travel time between these two districts would not only fetch direct benefits to the users due to less vehicle operating cost, passenger time saving and other intangible benefits as well. The connectivity provided through interchanges with residential, commercial and industrial hub would also fetch direct and indirect benefits. The project is expected to generate development around the abutting towns connected through proposed spurs from the green field highway. Number of openings and employment opportunities to the local people and for the local and National contractors as well, which would satisfy the Federal Govt agenda of employment opportunities. There would be short and long term tangible and intangible benefits by this project. All the above factors warrant the construction of an access controlled green field highway ensuring safety and high speed movement of men and materials from production units to consumers in shortest possible time.
5.3 Existing Traffic Traffic along the existing routes from Chennai Salem, via krishnagiri, via Vaniyambadi or via Ulundrupet is substantially driven by commercial and industrial traffic. In addition to this, some religious and archaeological attractions are there along and around the project

Consultancy Services for preparation of DPR for development of Economic Corridors, Inter Corridors, Feeder Routes and National corridors (GQ and NS-EW Corridors) to improve the efficiency of freight movement in India under Bharatmala Pariyojana (Chennai-Salem Highway)
Feasibility Report Volume – I (Main Report)
Finalization of alignment of the Proposed Highway
Feedback Infra Pvt. Ltd. 5-2 National Highways Authority of India
corridor and expected to increase passenger traffic considerably. A preliminary estimate shows, the traffic from Salem – Ulundrupet – Chennai route is around 8000 to 10000 PCU, Salem – Harur – Vellore route is 4000 to 5000 PCU and Salem – Krishnagiri – Chennai route is around 4000 PCU.
5.4 Project Location Existing roads starting at Chennai traverses through Kanchipuram, Vellore, Krishnagiri, Dharmapuri, Villupuram and ends at Salem district of Tamil Nadu state. Proposed alignment starts near the Chennai outer ring road junction on SH-48, traverses through Kanchipuram, Tiruvannamalai, Krishnsgiri, Dharmapuri and Salem districts in the state of Tamil Nadu, which run parallel, intersect and overlap; National Highway (NH-38, NH-77, NH-79, NH-NE2 and NH-544), State Highway (SH-48, SH-57, SH-58, SH-118A, SH-116, SH-5, SH-4, SH-115, SH-6A and SH-18) and Major District Roads (MDR-789, MDR-709, MDR-43, MDR-503, MDR-800 and MDR-1044).
5.5 Methodology of finalization of alignment
The following steps were taken in finalizing the alignment of the Expressway Step I: List out the Districts, Tehsils and Villages to be passed by the Expressway alignment. Step II: Collection of Topographic Maps and Village Maps Step III: Preliminary finalization of the alignment of the Green Field Highway from the Google earth and check it on SOI Topographic Maps Step IV: Consider connectivity requirement after discussion with NHAI officials Step V: Consider most direct route with least number of structures Step VI: Avoid / modify alignment to bypass forest land / pond / archeological important areas Step VII: Select type of interchanges Step VIII: Verify selected alignment at site Step IX: Prepare preliminary alignment plan
5.6 Packaging of the alignment selected
The proposed alignment passing through green-field is divided into 7 packages. Package-wise details along with proposed right of way are provided in the Table 5-1.
Table 5-1: Package-wise details with proposed right of way
Package Design Chainage
Length Location PROW,
m From To
I 0+000 25+600 25.600 Vandalur to Palur 70
II 25+600 67+700 42.100 Palur to Erumaivetti 90
III 67+700 122+660 54.960 Erumaivetti to Thenpallipattu 90
IV 122+660 157+570 34.910 Thenpallipattu to Manmalai 90
V 157+570 207+200 49.630 Manmali to Harur 90
VI 207+200 220+000 12.800
Harur to Ayodhiyapatinam 90 57+300 21+800 35.500

Consultancy Services for preparation of DPR for development of Economic Corridors, Inter Corridors, Feeder Routes and National corridors (GQ and NS-EW Corridors) to improve the efficiency of freight movement in India under Bharatmala Pariyojana (Chennai-Salem Highway)
Feasibility Report Volume – I (Main Report)
Finalization of alignment of the Proposed Highway
Feedback Infra Pvt. Ltd. 5-3 National Highways Authority of India
Package Design Chainage
Length Location PROW,
m From To
VII 21+800 0+000 21.800 Ayodhiyapattinam to
Ariyanur 70
Project road aims to connect (Chennai and Salem) two major districts in the state with the shortest possible path and also intends to connect many Industrial areas and SEZ along the project road and the connectivity are contemplated through spurs and interchanges. Taluk wise details along different districts are given in Location map of project road is given in
Figure 5-1. This green field highway alignment is proposed to be Integrated / connected with other highways planned/ executed in Tamil Nadu state in the future.
Table 5-2: Taluk wise details along different districts of proposed alignment
Sl. No Name of District Name of Taluk Approx. Length
in Km
1
Kanchipuram
Tambaram
59.11 2 Sriperumbudur
3 Chengalpattu
4 Uthiramerur
5
Tiruvannamalai
Cheyyaru
119.58
6 Vandavasi
7 Polur
8 Arani
9 Tiruvannamalai
10 Chengam
11 Krishnagiri Uttangarai 3.67
12 Dharmapuri
Harur 59.27
13 Papireddipatty
14
Salem
Yercadu
35.67 15 Valappadi
16 Salem
Total Length, Km 277.300
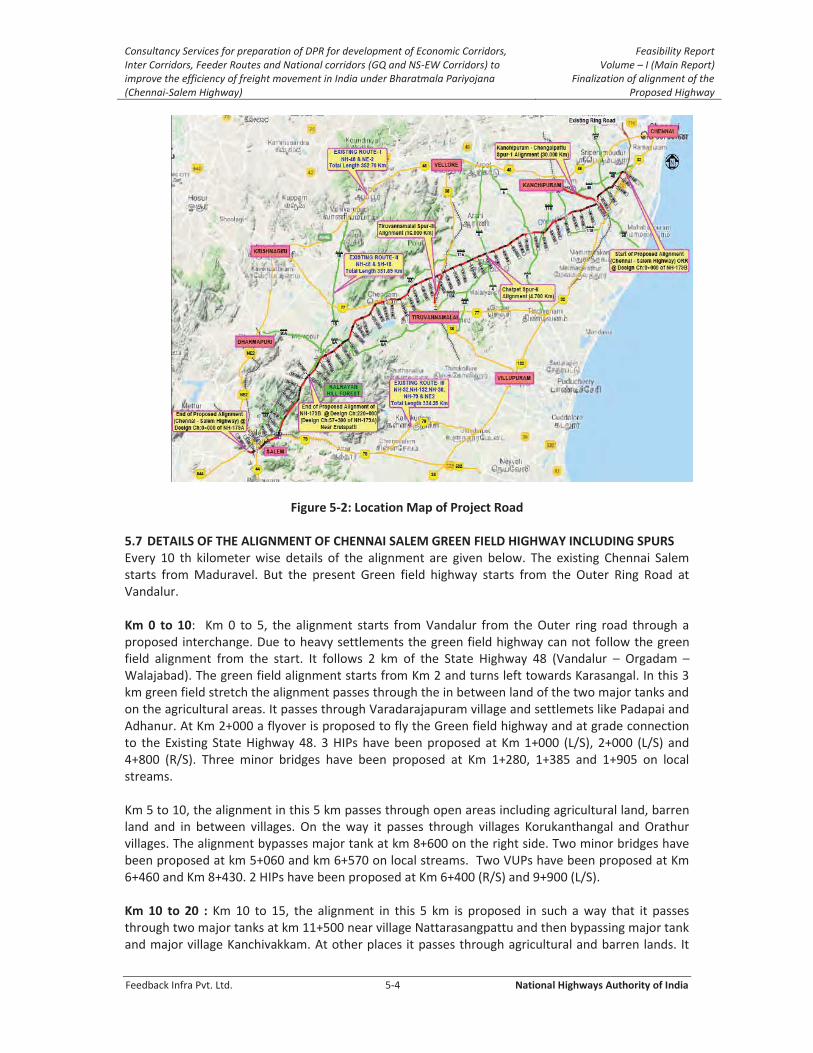
Consultancy Services for preparation of DPR for development of Economic Corridors, Inter Corridors, Feeder Routes and National corridors (GQ and NS-EW Corridors) to improve the efficiency of freight movement in India under Bharatmala Pariyojana (Chennai-Salem Highway)
Feasibility Report Volume – I (Main Report)
Finalization of alignment of the Proposed Highway
Feedback Infra Pvt. Ltd. 5-4 National Highways Authority of India
Figure 5-2: Location Map of Project Road
5.7 DETAILS OF THE ALIGNMENT OF CHENNAI SALEM GREEN FIELD HIGHWAY INCLUDING SPURS Every 10 th kilometer wise details of the alignment are given below. The existing Chennai Salem starts from Maduravel. But the present Green field highway starts from the Outer Ring Road at Vandalur. Km 0 to 10: Km 0 to 5, the alignment starts from Vandalur from the Outer ring road through a proposed interchange. Due to heavy settlements the green field highway can not follow the green field alignment from the start. It follows 2 km of the State Highway 48 (Vandalur – Orgadam – Walajabad). The green field alignment starts from Km 2 and turns left towards Karasangal. In this 3 km green field stretch the alignment passes through the in between land of the two major tanks and on the agricultural areas. It passes through Varadarajapuram village and settlemets like Padapai and Adhanur. At Km 2+000 a flyover is proposed to fly the Green field highway and at grade connection to the Existing State Highway 48. 3 HIPs have been proposed at Km 1+000 (L/S), 2+000 (L/S) and 4+800 (R/S). Three minor bridges have been proposed at Km 1+280, 1+385 and 1+905 on local streams. Km 5 to 10, the alignment in this 5 km passes through open areas including agricultural land, barren land and in between villages. On the way it passes through villages Korukanthangal and Orathur villages. The alignment bypasses major tank at km 8+600 on the right side. Two minor bridges have been proposed at km 5+060 and km 6+570 on local streams. Two VUPs have been proposed at Km 6+460 and Km 8+430. 2 HIPs have been proposed at Km 6+400 (R/S) and 9+900 (L/S). Km 10 to 20 : Km 10 to 15, the alignment in this 5 km is proposed in such a way that it passes through two major tanks at km 11+500 near village Nattarasangpattu and then bypassing major tank and major village Kanchivakkam. At other places it passes through agricultural and barren lands. It

Consultancy Services for preparation of DPR for development of Economic Corridors, Inter Corridors, Feeder Routes and National corridors (GQ and NS-EW Corridors) to improve the efficiency of freight movement in India under Bharatmala Pariyojana (Chennai-Salem Highway)
Feasibility Report Volume – I (Main Report)
Finalization of alignment of the Proposed Highway
Feedback Infra Pvt. Ltd. 5-5 National Highways Authority of India
passes through villages Vadamelpakkam, Kanchivakkam and Appur villages. Three minor bridges have been proposed at km 11+510, Km 12+600 and 13+620 on local streams. A major bridge of 100m length has been proposed on the tank at Km 14+230. Two VUPs have been proposed at Km 11+340 and Km 13+470. 2 HIPs have been proposed at Km 11+600 (R/S) and 13+800 (L/S). The alignment passes through forest land at Km 13+100 to 13+600. Km 15 to 20, the alignment in this 5 km is proposed as a straight one without any horizontal intersection points bypassing two tanks at Umayalparamancheri, then two big tanks at Eaichur village and passing through agricultural lands. The abutting villages are Umayaparamancheri, valayakaranai, Eaichur and Guruvanmedu. The poposed alignment crosses existing 4 Lane SH 57 (Sriperumbudur – Orgadam – Appur Road) where a Flyover / Overpass is proposed. A VUP on local road is proposed at Km 19+190. A major bridge of 525 m length has been proposed on the tank at Km 15+980 over Tank at Umayalparamancheri. Km 20 to 30: Km 20 to 25 the alignment in this 5 km passes through plain agricultural land and low lying land. It crosses major river Palar. Two minor bridges have been proposed, one over Nala and another over pond at Km 20+250 and 20+740. One VUP has been proposed at Km 20+940. A major structure (Interchange+ROB+Flyover) has been proposed at Km 24+580 to cross Palar river, railway line and providing both side spurs on SH 58 to kanchipuram and Chengalpattu. Two HIPs have been proposed at Km 21+185 (L/S) and 23+449 (R/S). The villages pass by in this streach are Guruvanmedu, Kolathancheri, Reddypalayam and Palar. Km 25 to 30, the alignment in this 5 km passes through plain agricultural land and low lying land. Five minor bridges have been proposed, three over Nala and two over ponds at Km 26+040, 26+170, 26+650, 26+960 and 28+615. Two VUPs have been proposed at Km 26+270 and 28+090. The alignment generally bypasses tanks at Pinayur. Two HIPs have been proposed at Km 25+916 (R/S) and at 28+910 (L/S). The villages pass by in this streach are Seethancherry, Arumbuliyan, Pazaverri and Seethapuram. Km 30 to 40: Km 30 to 40 the alignment in this 10 km passes through plain agricultural land and low lying land bypassing ponds and settlements. There are series of ponds at km 32 to 34 which have been avoided. Seven minor bridges have been proposed, six over Nala and one over pond at Km 30+080, 31+870, 32+875, 33+000, 35+665, 38+430, 38+620. Three VUPs have been proposed at Km 30+810, 34+515 and 38+195. Three HIPs have been proposed at Km 31+391 (L/S), 34+158 (R/S) and 39+982 (L/S). The villages pass by in this streach are Anambakkam, Pullampakkam, Sirumaliur, Neyadupakkam, Vayalakkavoor and Elayamarvelur. Km 40 to 50: This portion of the alignment in this 10 km passes through plain agricultural land and low lying land bypassing ponds and settlements. The alignment bypasses some ponds and seven minor bridges, six over Nala and one over pond at Km 40+870, 42+090, 42+930, 43+580, 45+600, 46+020, 48+630. One major bridge has been proposed at 42+440 over pond. Two VUPs have been proposed at Km 43+710 (SH 118A) and at 47+950. Three HIPs have been proposed at Km 44+902 (R/S), 47+302 (R/S) and 49+510 (R/S). The villages pass by in this streach are Puthali, Adavapakkam, Karuveppampoondi, Ozhugarai and Azhisoor. Km 50 to 60: This portion of the alignment in this 10 km passes through plain agricultural land and low lying land bypassing ponds and settlements. An important archeological monument (Pegalithic cists and cairns) are found at Perunagar village, kanchipuram. The alignment has been diverted by providing 3000m radius curve to avoid the monument by a distance of over 500m and taken near manampathi village in between km 51 to 63. The alignment bypasses some ponds and six minor

Consultancy Services for preparation of DPR for development of Economic Corridors, Inter Corridors, Feeder Routes and National corridors (GQ and NS-EW Corridors) to improve the efficiency of freight movement in India under Bharatmala Pariyojana (Chennai-Salem Highway)
Feasibility Report Volume – I (Main Report)
Finalization of alignment of the Proposed Highway
Feedback Infra Pvt. Ltd. 5-6 National Highways Authority of India
bridges, four over Nala, one over pond and another over pond inlet at Km 50+120, 51+990, 53+240, 56+430, 58+500 and 59+340. One VUP has been been proposed at Km 57+005. Two HIPs have been proposed at Km 51+645 (L/S) and 59+131 (R/S). The villages pass by in this streach are Anumanthandalam, Elanagar, Perunagar and Manampathi. Km 60 to 70: This portion of the alignment in this 10 km passes through plain agricultural land, low lying land, barren lands bypassing ponds, settlements and factories. The alignment bypasses some ponds. Six minor bridges have been proposed, five over Nala and one over pond inlet at Km 63+130, 63+760, 64+610, 65+060, 66+165 and 67+070. One Major Bridge and Flyover combined has been proposed at 60+110 over SH 116. One VUP has been been proposed at Km 67+395 (SH 5). One major bridge has been proposed at 68+720 over pond. Two HIPs have been proposed at Km 64+100 (L/S) and 67+242 (R/S). The villages pass by in this streach are Athi, Nedungal, Anapathur, Erumiavetti, Vinayagapuram, Perumbalai, Thenthandalam and Chittamoor. Km 70 to 80: This portion of the alignment in this 10 km passes through plain agricultural land, low lying land, barren lands bypassing ponds and settlements. The alignment bypasses some ponds. Seven minor bridges have been proposed, four over Nala, two over ponds and one over pond inlet at Km 71+040, 72+260, 72+510, 73+475, 74+680, 78+270 and 78+880. Two Major Bridges have been proposed at 70+720 and 77+250. Three VUPs have been been proposed at Km 72+050, 75+290 and 79+400. Two HIPs have been proposed at Km 71+693 (L/S) and 78+332 (L/S). The villages pass by in this streach are Sengadu, Kovilur, Villanalur, Chinna Sengadu, Kottagaram and Nambedu. Km 80 to 90: This portion of the alignment in this 10 km passes through plain agricultural land, low lying land, barren lands bypassing series of big and small ponds and settlements. Five minor bridges have been proposed, two over Nala, two over ponds and one over pond inlet at Km 82+890, 86+240, 87+650, 88+420 and 89+495. One Major Bridge has been proposed at 82+070 on pond. One VUP has been been proposed at Km 83+420. Three HIPs have been proposed at Km 82+006 (R/S), 84+773 (L/S) and 87+299 (R/S). The villages pass by in this streach are Aryapadi, Peranamallur, Pulur, Septangulam, Injimedu, Sandirambadi, Alliyandal, Mahadevimangalam, Taveni and Namathodu. The alignment passes through forest land in km 80+100 to 80+400. Km 90 to 100: This portion of the alignment in this 10 km passes through plain agricultural land, low lying land, barren lands bypassing series of big and small ponds and settlements. Nine minor bridges have been proposed, eight over Nala and one over pond inlet at Km 90+510, 91+780, 95+050, 97+720, 98+320, 98+580, 98+995, 99+250 and 99+380. Two VUPs have been been proposed at Km 90+940 and 98+830. One cloverleaf interchange on crossing with SH alongwith Chetpet spur has been proposed at Km 94+505. Four HIPs have been proposed at Km 91+458 (R/S), 94+479 (L/S), 97+321 (R/S) and 99+727 (L/S). The villages pass by in this streach are Anadimangalam, Imapuram, Ulagampattu, Semmambadi, Appedu, Maruthuvambadi and Kolakkaravadi. Km 100 to 110: This portion of the alignment in this 10 km passes through plain agricultural land and in some parts barren lands. Six minor bridges have been proposed, four over Nala and two at pond edge at Km 101+840, 106+240, 106+450, 106+740, 107+870 and 108+660. One Overpass over SH 115 (Chetpet to Ranipet Road) has been proposed at 103+480 so that the SH overpasses the green field highway. One VUP has been proposed at Km 105+610. The portion is a fairly straight alignment with only one HIP proposed at Km 109+166 (R/S). The villages pass by in this streach are Devikapuram, Thatchambodi, Chithathurai, Peranambakkam. The alignment passes through forest land in km 106+400 to 107+700.
Consultancy Services for preparation of DPR for development of Economic Corridors, Inter Corridors, Feeder Routes and National corridors (GQ and NS-EW Corridors) to improve the efficiency of freight movement in India under Bharatmala Pariyojana (Chennai-Salem Highway)
Feasibility Report Volume – I (Main Report)
Finalization of alignment of the Proposed Highway
Feedback Infra Pvt. Ltd. 5-7 National Highways Authority of India
Km 110 to 120: This portion of the alignment in this 10 km passes through plain agricultural land, in some parts barren lands, bypassing tanks, lakes and waterbodies. Five minor bridges have been proposed, Two over Nala and three on pond and at pond edges at Km 113+285, 116+230, 117+000, 118+200 and 118+370. Two VUPs have been proposed at Km 110+455 and 115+750. The portion is a fairly straight alignment with only one HIP proposed at Km 112+636 (L/S). The villages pass by in this streach are Semiyamangalam, Randam, Pelasur, Analiya, Kambattu and Pathiyavadi. Km 120 to 130: This portion of the alignment in this 10 km passes through plain agricultural land, in some parts barren lands, bypassing series of ponds on both sides and waterbodies. Four minor bridges have been proposed, Two over Nala and two on pond and at pond inlet and edges at Km 122+250, 122+740, 123+580 and 126+720. A major bridge and ROB has been proposed at Km 120+545 to cross Vellore – Tiruvannmalai Railway line and a tank besides the railway line trough a combined structure. One Double Trumpet interchange has been proposed at Km 121+760 to provide access to Polur and Thiruvannmalai through ramps and loops on NH 38. One VUP has been proposed at Km 125+500. The portion is a fairly straight alignment with only one HIP proposed at Km 125+743 (R/S). The villages pass by in this streach are Salayanoor, Thenpallypattu, Mettupalayam, Nellimedu, C. Andapattu, Narthampoondi, Mutharasampoondi, Siru Kilambadi and Thenagaram. Km 130 to 140: This portion of the alignment in this 10 km passes through plain agricultural land, in some parts barren lands, bypassing series of ponds on both sides and waterbodies. Six minor bridges have been proposed, all over Nala at Km 132+720, 133+680, 138+940, 139+200, 139+560 and 139+940. A major bridge has been proposed at Km 138+690 on local stream. Two VUPs has been proposed at Km 131+450 and 136+180. The portion is a fairly straight alignment with only one HIP proposed at Km 130+599 (L/S). The villages pass by in this streach are Kodi Kuppam, Nayambadi, N. Mottur, C. Namiyandal, Namyandal Koot, Alathur, Karattampattu and Kanji. Km 140 to 150: This portion of the alignment in this 10 km passes through plain agricultural land, rolling terrain, in some parts barren lands, bypassing some ponds on both sides and waterbodies. Five minor bridges have been proposed, four over Nala and one over pond at Km 142+680, 143+380, 146+700, 147+110, and 147+340. Two major bridges have been proposed at Km 140+930 and 145+990 on local stream. The portion is a curvy one with s curves with large radius to avoid forest land on both sides of the green field highway. Two HIPs have been proposed at Km 141+126 (L/S) and 145+229 (R/S). The villages pass by in this streach are Kodi Kuppam, Nayambadi, N. Mottur, C. Namiyandal, Namyandal Koot, Alathur, Karattampattu and Kanji. Km 150 to 160: This portion of the alignment in this 10 km passes through plain agricultural land, rolling terrain, in some parts barren lands, bypassing some villages and habitations on both sides. Four minor bridges have been proposed, three over Nala and one over pond at Km 152+020, 154+180, 158+850 and 158+960. Two major bridges have been proposed at Km 157+260 and 159+395 on local stream and ponds. One VUP has been proposed at 150+760 on local roads. Cloverleaf Interchange is proposed on the crossing with NH 77 to give connection to Chengam bound traffic. The portion is a curvy one with s curves with large radius to avoid forest land on both sides of the green field highway. Two HIPs have been proposed at Km 150+564 (R/S) and 155+100 (L/S). The villages pass by in this streach are Melmudiyanur, Ammapalayan, Muthanur, Kottakulam, Manmalai and Perumbatam. Km 160 to 170: This portion of the alignment in this 10 km passes through rolling terrain within hills. The alignment has been curved to avoid forest land. One HIP has been proposed at Km 164+930 (L/S). Four minor bridges have been proposed, three over Nala and one over pond at Km 160+425, 162+050, 169+000 and 169+330. Three major bridges have been proposed at Km 162+520, 163+750

Consultancy Services for preparation of DPR for development of Economic Corridors, Inter Corridors, Feeder Routes and National corridors (GQ and NS-EW Corridors) to improve the efficiency of freight movement in India under Bharatmala Pariyojana (Chennai-Salem Highway)
Feasibility Report Volume – I (Main Report)
Finalization of alignment of the Proposed Highway
Feedback Infra Pvt. Ltd. 5-8 National Highways Authority of India
and 167+670 on local stream and ponds. One VUP has been proposed at 165+060 on a local road. The villages pass by in this streach are Chengam, Pakkirapalayam, Melpulidiyur, Andanur, Melpallipattu and melvanakkambadi. Km 170 to 180: This portion of the alignment in this 10 km passes through hilly terrain bypassing the eserve forest on both sides. Two HIPs have been proposed at Km 170+989 (R/S) and 179+432 (L/S). Six minor bridges have been proposed all on nalla at Km 170+750, 171+780, 172+485, 174+030, 175+760 and 179+120. Two VUPs have been proposed at 170+360 and 175+550 on local roads. The villages pass by in this streach are Naradapattu, Karimalapadi and Athipadi. Km 180 to 190: This portion of the alignment in this 10 km passes through hilly terrain, a part of which (180+860 to 182+700) falls on the reserve forest. The alignment has been curved to avoid forest land (Anandamalai Reserve Forest). Two HIPs have been proposed at Km 184+142 (L/S) and 189+583 (R/S). Eight minor bridges have been proposed, five on local streams and three on ponds at Km 180+940, 181+260, 184+190, 184+460, 186+140, 187+360, 188+640 and 188+970. One Major bridge has been proposed on local stream at 183+560. Two VUPs have been proposed at 183+180 and 183+930 on local roads. The village pass by in this streach is Neepathurai. Km 190 to 200: This portion of the alignment in this 10 km passes through plain agricultural and some barren lands in between hilly areas (Vadakadamaduvu and Mondukuli). Only one HIP has been proposed at Km 192+269 (L/S). An overpass has been proposed at km 192+200 on State Highway from Thiruvannmalai to Harur (SH 6A). Eight minor bridges have been proposed all on nallas at Km 192+900, 193+750, 194+040, 196+160, 196+480, 197+600 and 197+920. Two VUPs have been proposed at 190+680 and 196+260. The villages pass by in this streach are Andiyur, Teerthamalai, Poyapatty, Virappanyakkampatty. Km 200 to 210: This portion of the alignment in this 10 km passes through agricultural lands in between scattered houses throughout. Three HIPs have been proposed at Km 200+790 (R/S), 203+500 (L/S) and 208+075 (L/S). Three major bridges on local streams at Km 202+140, 206+840 and 207+760. Four minor bridges have been proposed all on nallas at Km 203+780, 204+700, 207+080 and at 209+760. Only one VUP has been proposed at Km 201+380 on lpocal roads. The villages / major settlements pass by in this streach are Ittiyampatty, Koochanoor, Vengiampatti and Harur. Km 210 to 220: This portion of the alignment in this 10 km passes through agricultural lands in between scattered houses throughout. Only one HIP has been proposed at Km 215+255 (R/S). One major bridge has been proposed on local streams at Km 210+100. Seven minor bridges have been proposed all on nallas at Km 211+850, 214+400, 216+360, 217+120, 217+520, 218+620 and 219+230. Three VUPs have been proposed at Km 201+550, 213+060 and 219+530 all on local roads. The villages / major settlements pass by in this streach are Erumiyamapatty, Pudupatty and Mukkareddypatty. Km 57+300 to 47+300: This portion of the alignment in this 10 km passes through agricultural lands in between scattered houses, savoiding some tank and wet lands. Four HIPs have been proposed at Km 55+527 (L/S), 53+050 (R/S), 52+660(L/S) and 48+968 (L/S). One single trumpet interchange has been proposed to connect the green field highway (Newly formed NH 179B) with Ayadhyapatnam to Baniyambhatti road (SH 18, renamed to NH 179A) at Km 55+750. Nine minor bridges have been proposed all on nallas at Km 57+260, 56+920, 56+190, 53+520, 53+000, 52+440, 50+730, 50+450 and 47+970. Only one VUP has been proposed at Km 48+900 on a local road. The villages / major settlements pass by in this streach are Pappireddypatty, Pattukonampatty and Varadha Kavundanoor.

Consultancy Services for preparation of DPR for development of Economic Corridors, Inter Corridors, Feeder Routes and National corridors (GQ and NS-EW Corridors) to improve the efficiency of freight movement in India under Bharatmala Pariyojana (Chennai-Salem Highway)
Feasibility Report Volume – I (Main Report)
Finalization of alignment of the Proposed Highway
Feedback Infra Pvt. Ltd. 5-9 National Highways Authority of India
Km 47+300 to 37+300: This portion of the alignment in this 10 km passes through in between land of Manjavari reserve forest (Km 41+600 to 38+100). Three HIPs have been proposed at Km 43+600 (R/S), 39+141 (L/S) and 38+208 (R/S). Five minor bridges have been proposed all on nallas at Km 46+160, 43+930, 43+780, 41+300 and 38+740. Only one VUP has been proposed at Km 43+280 on a local road. The villages / major settlements pass by in this streach are Kallattupatti, Manjavadi, Chinnamanjanavadi and Komvur. Km 37+300 to 27+300: This portion of the alignment in this 10 km passes through in between forest land, agricultural land and open areas and in between scattered houses. Four HIPs have been proposed at Km 36+177 (L/S), 35+200 (R/S), 32+902 (L/S) and 28+665 (L/S). Six minor bridges have been proposed all on nallas at Km 37+140, 36+960, 36+400, 31+400, 30+220 and 29+300. One flyover at Km 31+800 has been proposed at the connection point with SH 18 (Newly formed NH 179A). The villages / major settlements pass by in this streach are Kuppanoor, Paruthikadu, Vellaiyanpatty, and Sukkampatty. Km 27+300 to 17+300: This portion of the alignment in this 10 km passes through semi urban areas with agricultural land and scattered houses throughout. The alignment passes through forest land in km 17+500 to 16+100, 15+800 to 15+000, 14+100 to 13+100 and 12+900 to 12+600. Two HIPs have been proposed, one at 20+709 at the crossing point of the green field highway with the NH 79 and at 17+530 (R/S). An interchange has been proposed at the crossing points at Km 21+590. At 22+140 a ROB has been proposed. Two minor bridges have been proposed all on nallas at Km 26+500 and 25+220. The villages / major settlements pass by in this streach are Ayodhyapatnam, Ramalingapuram and Chinnakavundapuram. Km 17+300 to 7+300: This portion of the alignment in this 10 km bypasses Salem city through semi urban areas, hilly area, agricultural land and scattered houses. The alignment bypasses forest land (Jerugumalai Reserve Forest) and passes through hills where tunnel will be needed at three locations (14+100 to 13+300, 12+900 to 12+200 and 11+000 to 10+400). Six HIPs have been proposed at 14+329 (R/S), 13+800 (L/S), 13+400 (R/S), 13+000 (L/S), 11+300 (R/S) and 7+555 (L/S). Three minor bridges have been proposed all on nallas at Km 17+200, 14+960 and 9+940. The villages / major settlements pass by in this streach are Saravana Nagar and Rajaram Colony. Km 7+300 to 0+000: This portion of the alignment in this 7.3 km bypasses Salem city through semi urban areas and scattered houses. Two interchanges have been proposed at Km 6+940 (with NH 44 where a double trumpet interchange will be proposed) and at end of the preject road at 0+000 (At the meeting point with NH 544, where a cloverleaf interchange will be proposed). Three HIPs have been proposed at 5+900 (L/S), 3+800 (R/S) and 0+800 (R/S). At 4+630 a ROB has been proposed. At 5+620 a major bridge has been proposed on pond. Two minor bridges have been proposed at Km 3+960 and 0+660 on nalla crossings. The alignment plan superimposed on toposheet and google earth images are provided along with this report.

Consultancy Services for preparation of DPR for development of Economic Corridors, Inter Corridors, Feeder Routes and National corridors (GQ and NS-EW Corridors) to improve the efficiency of freight movement in India under Bharatmala Pariyojana (Chennai-Salem Highway)
Feasibility Report Volume – I (Main Report)
Design Standard and specification
Feedback Infra Pvt. Ltd. 6-1 National Highways Authority of India
6. DESIGN STANDARD AND SPECIFICATION
6.1 General
The geometric design of the Project Expressway shall conform to the standards set out in the Manual for expressway (IRC: SP: 99-2013).
6.2 Design Speed
The design speeds given in below table shall be adopted for various terrain classifications.
Design Speed
Nature of Terrain Cross Slope of Ground Design Speed
Plain Less than 10% 120
Rolling Between 10 and 25 % 100
Where an intervening stretch is classified as hilly/mountainous stretch and it may not be expedient from economic and environmental consideration to adopt even standards applicable to rolling terrain, a lower design speed of 80 kmph consistent with the topography and driver expectancy may be adopted and in such stretches speed limit signs shall be posted.
6.3 Right of Way
The Right–of–Way (ROW) for the project expressway shall be as per site condition and requirements. The recommended minimum Right of Way in Plain/Rolling terrain for expressways is given below
Right of Way in Plain/Rolling Terrain
Section Right of Way Width (ROW)
Rural Section 90m – 120m
Rural sections passing through semi urban areas 120m
No service roads shall be provided within the ROW of the Expressway.
6.4 Lane Width of Carriageway
The standard lane width of the Project Expressway shall be 3.75 m. expressways shall have a minimum of two lanes for each direction of travel.
6.5 Median
The median shall bedepressed or flush. The recommended width of median is given below
Width of Median
Type of Median Recommended median width
Minimum (m) Desirable (m)
Depressed 12.0 15.0
Flushed 4.5 4.5
Flush (To accommodate structure\pier on median) 8.0 8.0

Consultancy Services for preparation of DPR for development of Economic Corridors, Inter Corridors, Feeder Routes and National corridors (GQ and NS-EW Corridors) to improve the efficiency of freight movement in India under Bharatmala Pariyojana (Chennai-Salem Highway)
Feasibility Report Volume – I (Main Report)
Design Standard and specification
Feedback Infra Pvt. Ltd. 6-2 National Highways Authority of India
The depressed median shall have suitably designed drainage system so that water does not stagnate in the median.
An edge strip of 0.75m width of depressed median adjacent to carriageway in either direction shall be paved with same specifications as of the adjacent carriageway.
As for as possible, the median shall be of uniform width in a particular section of the Project Expressway. However, where changes are unavoidable, a transition of 1 in 50 shall be provided.
Median barriers shall be provided as specified in Section-10 of IRC SP: 99-2013 Manual. In case of flush type medians, suitable antiglare measures such as metal/plastic screens shall be provided to reduce headlight glare from opposite traffic. The total height of screen including the height of barrier shall be of 1.5 m.
6.6 Shoulders
The shoulders on the outerside (left side of carriageway shall be 3 m) wide paved plus 2 m wide earthen. The shoulder composition shall be as below:
The composition and specification of the paved shoulder shall be as that of the main carriageway.
The earthen shoulder shall be provided with 200 mm thick layer of non-erodible/granular material for protection against erosion.
6.7 Crossfall
The crossfall on straightsections of expressway carriageway shall be as given in below table. Each carriageway shall have unidirectional crossfall.
Crossfall on Different Surfaces
Cross-sectional Element Annual Rainfall
1000 mm or more Less than 1000 mm
Carriageway, Paved Shoulders, Edge Strip, Flush median 2.5 Percent 2.0 Percent
The crossfall for earthen/granular shoulders on straight portions shall be atleast 1.0 percent steeper than the values given in above table. On super elevated sections, the earthen portion of the shoulder on the outer side of the curve would be provided with reverse crossfall so that the earth does not drain on the carriageway and the storm water drain out with minimum travel path.
6.8 Acceleration/Deceleration Lane
Acceleration/Deceleration lane shall be provided as per CI. 3.3.8, Section 3, IRC SP: 99-2013.
Each entry and exit ramp shall have acceleration/decelerartion lane for the Project Expressway. The length of the acceleration/decelerartion lanes shall be decided on the basis of speed differentials of the Project Expressway traffic and the speed permitted on the ramps.
Minimum Acceleration Lengths for Entry (Grades of 2 Percent or Less)
Expressway Design
Sped V (Km/h)
Acceleration Length L (m)
V’ Speed on Entry Curve at A (Km/h) 40 50 60 70 80 or more
80 145 115 65 - -
100 285 255 205 110 40
120 490 460 410 325 245
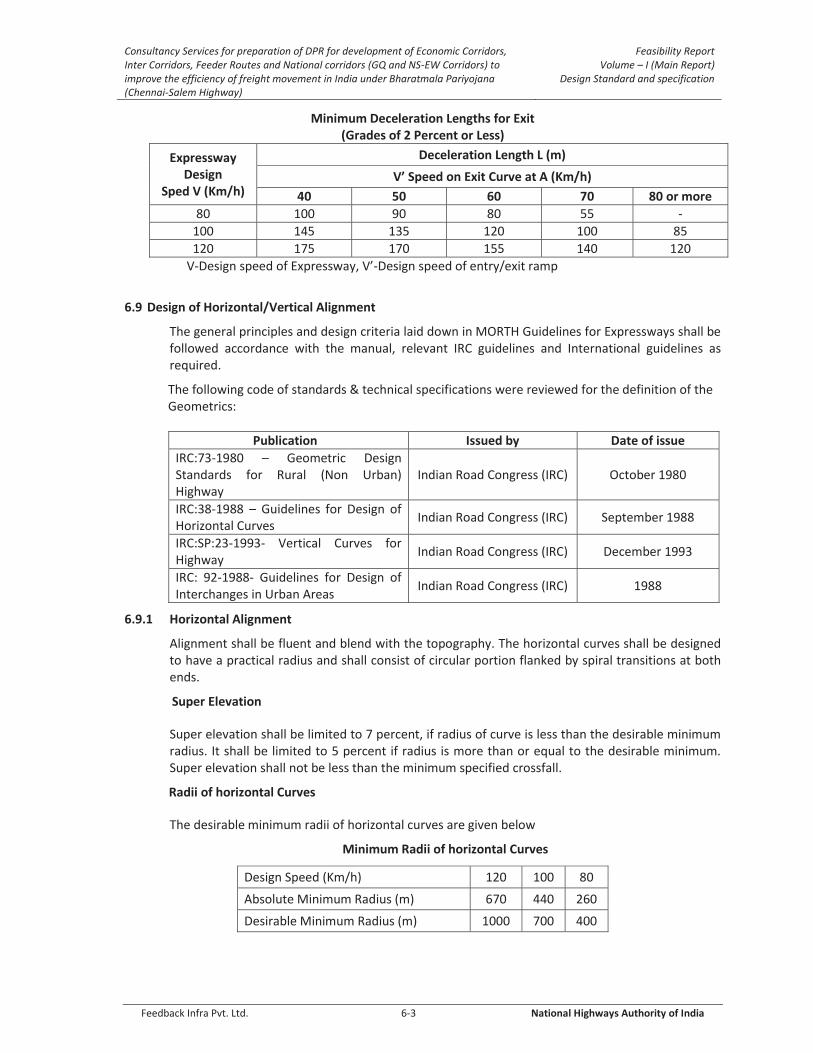
Consultancy Services for preparation of DPR for development of Economic Corridors, Inter Corridors, Feeder Routes and National corridors (GQ and NS-EW Corridors) to improve the efficiency of freight movement in India under Bharatmala Pariyojana (Chennai-Salem Highway)
Feasibility Report Volume – I (Main Report)
Design Standard and specification
Feedback Infra Pvt. Ltd. 6-3 National Highways Authority of India
Minimum Deceleration Lengths for Exit (Grades of 2 Percent or Less)
Expressway Design
Sped V (Km/h)
Deceleration Length L (m)
V’ Speed on Exit Curve at A (Km/h) 40 50 60 70 80 or more
80 100 90 80 55 -
100 145 135 120 100 85
120 175 170 155 140 120
V-Design speed of Expressway, V’-Design speed of entry/exit ramp
6.9 Design of Horizontal/Vertical Alignment
The general principles and design criteria laid down in MORTH Guidelines for Expressways shall be followed accordance with the manual, relevant IRC guidelines and International guidelines as required.
The following code of standards & technical specifications were reviewed for the definition of the Geometrics:
Publication Issued by Date of issue IRC:73-1980 – Geometric Design Standards for Rural (Non Urban) Highway
Indian Road Congress (IRC) October 1980
IRC:38-1988 – Guidelines for Design of Horizontal Curves
Indian Road Congress (IRC) September 1988
IRC:SP:23-1993- Vertical Curves for Highway
Indian Road Congress (IRC) December 1993
IRC: 92-1988- Guidelines for Design of Interchanges in Urban Areas
Indian Road Congress (IRC) 1988
6.9.1 Horizontal Alignment
Alignment shall be fluent and blend with the topography. The horizontal curves shall be designed to have a practical radius and shall consist of circular portion flanked by spiral transitions at both ends.
Super Elevation
Super elevation shall be limited to 7 percent, if radius of curve is less than the desirable minimum radius. It shall be limited to 5 percent if radius is more than or equal to the desirable minimum. Super elevation shall not be less than the minimum specified crossfall.
Radii of horizontal Curves
The desirable minimum radii of horizontal curves are given below
Minimum Radii of horizontal Curves
Design Speed (Km/h) 120 100 80
Absolute Minimum Radius (m) 670 440 260
Desirable Minimum Radius (m) 1000 700 400
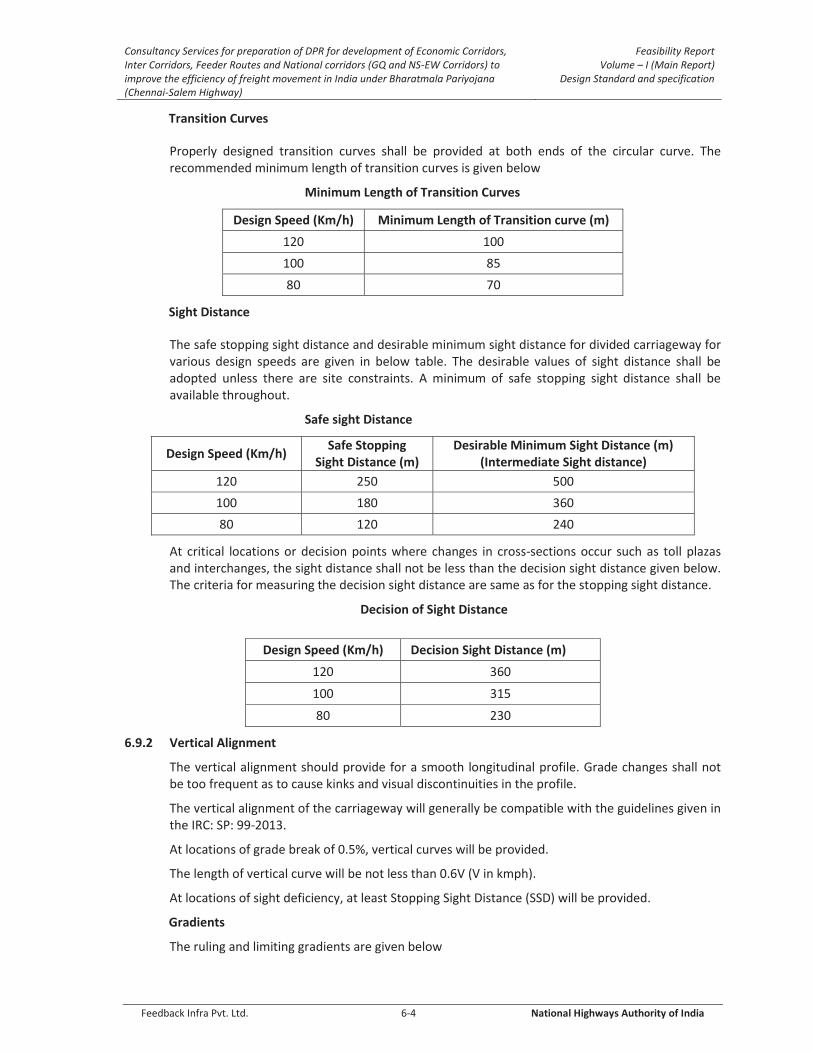
Consultancy Services for preparation of DPR for development of Economic Corridors, Inter Corridors, Feeder Routes and National corridors (GQ and NS-EW Corridors) to improve the efficiency of freight movement in India under Bharatmala Pariyojana (Chennai-Salem Highway)
Feasibility Report Volume – I (Main Report)
Design Standard and specification
Feedback Infra Pvt. Ltd. 6-4 National Highways Authority of India
Transition Curves
Properly designed transition curves shall be provided at both ends of the circular curve. The recommended minimum length of transition curves is given below
Minimum Length of Transition Curves
Design Speed (Km/h) Minimum Length of Transition curve (m)
120 100
100 85
80 70
Sight Distance
The safe stopping sight distance and desirable minimum sight distance for divided carriageway for various design speeds are given in below table. The desirable values of sight distance shall be adopted unless there are site constraints. A minimum of safe stopping sight distance shall be available throughout.
Safe sight Distance
Design Speed (Km/h) Safe Stopping
Sight Distance (m) Desirable Minimum Sight Distance (m)
(Intermediate Sight distance)
120 250 500
100 180 360
80 120 240
At critical locations or decision points where changes in cross-sections occur such as toll plazas and interchanges, the sight distance shall not be less than the decision sight distance given below. The criteria for measuring the decision sight distance are same as for the stopping sight distance.
Decision of Sight Distance
Design Speed (Km/h) Decision Sight Distance (m)
120 360
100 315
80 230
6.9.2 Vertical Alignment
The vertical alignment should provide for a smooth longitudinal profile. Grade changes shall not be too frequent as to cause kinks and visual discontinuities in the profile.
The vertical alignment of the carriageway will generally be compatible with the guidelines given in the IRC: SP: 99-2013.
At locations of grade break of 0.5%, vertical curves will be provided.
The length of vertical curve will be not less than 0.6V (V in kmph).
At locations of sight deficiency, at least Stopping Sight Distance (SSD) will be provided.
Gradients
The ruling and limiting gradients are given below
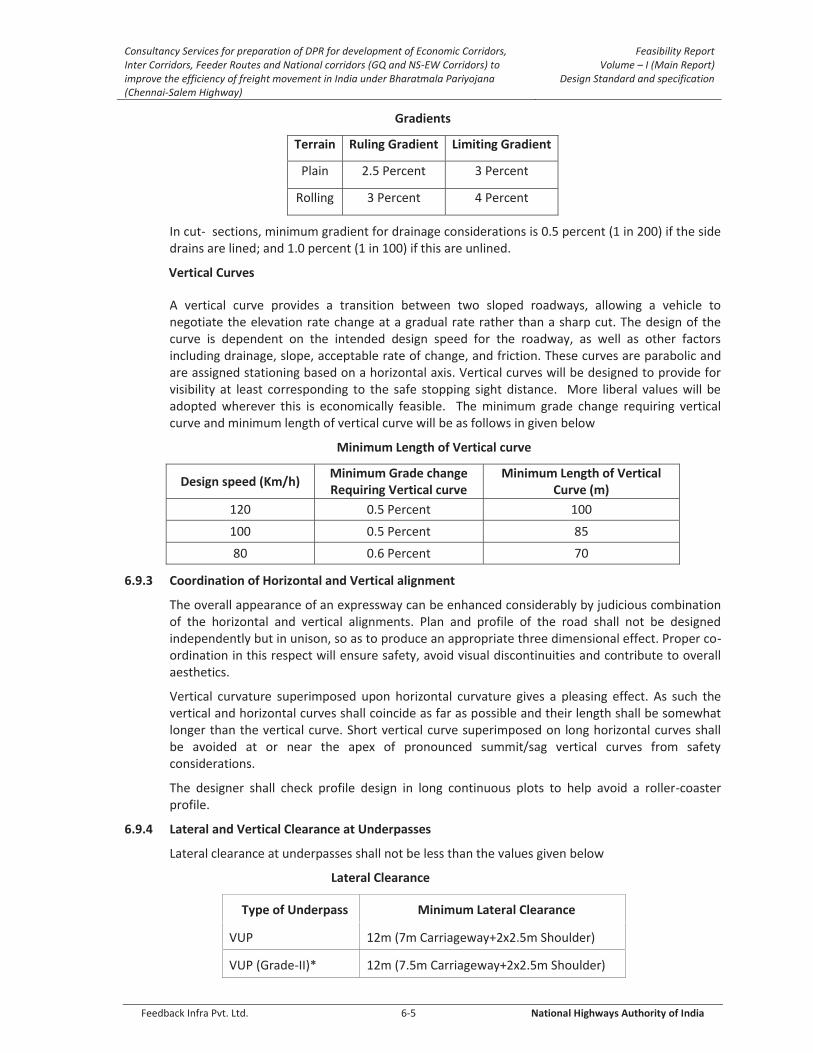
Consultancy Services for preparation of DPR for development of Economic Corridors, Inter Corridors, Feeder Routes and National corridors (GQ and NS-EW Corridors) to improve the efficiency of freight movement in India under Bharatmala Pariyojana (Chennai-Salem Highway)
Feasibility Report Volume – I (Main Report)
Design Standard and specification
Feedback Infra Pvt. Ltd. 6-5 National Highways Authority of India
Gradients
Terrain Ruling Gradient Limiting Gradient
Plain 2.5 Percent 3 Percent
Rolling 3 Percent 4 Percent
In cut- sections, minimum gradient for drainage considerations is 0.5 percent (1 in 200) if the side drains are lined; and 1.0 percent (1 in 100) if this are unlined.
Vertical Curves
A vertical curve provides a transition between two sloped roadways, allowing a vehicle to negotiate the elevation rate change at a gradual rate rather than a sharp cut. The design of the curve is dependent on the intended design speed for the roadway, as well as other factors including drainage, slope, acceptable rate of change, and friction. These curves are parabolic and are assigned stationing based on a horizontal axis. Vertical curves will be designed to provide for visibility at least corresponding to the safe stopping sight distance. More liberal values will be adopted wherever this is economically feasible. The minimum grade change requiring vertical curve and minimum length of vertical curve will be as follows in given below
Minimum Length of Vertical curve
Design speed (Km/h) Minimum Grade change Requiring Vertical curve
Minimum Length of Vertical Curve (m)
120 0.5 Percent 100
100 0.5 Percent 85
80 0.6 Percent 70
6.9.3 Coordination of Horizontal and Vertical alignment
The overall appearance of an expressway can be enhanced considerably by judicious combination of the horizontal and vertical alignments. Plan and profile of the road shall not be designed independently but in unison, so as to produce an appropriate three dimensional effect. Proper co-ordination in this respect will ensure safety, avoid visual discontinuities and contribute to overall aesthetics.
Vertical curvature superimposed upon horizontal curvature gives a pleasing effect. As such the vertical and horizontal curves shall coincide as far as possible and their length shall be somewhat longer than the vertical curve. Short vertical curve superimposed on long horizontal curves shall be avoided at or near the apex of pronounced summit/sag vertical curves from safety considerations.
The designer shall check profile design in long continuous plots to help avoid a roller-coaster profile.
6.9.4 Lateral and Vertical Clearance at Underpasses
Lateral clearance at underpasses shall not be less than the values given below
Lateral Clearance
Type of Underpass Minimum Lateral Clearance
VUP 12m (7m Carriageway+2x2.5m Shoulder)
VUP (Grade-II)* 12m (7.5m Carriageway+2x2.5m Shoulder)
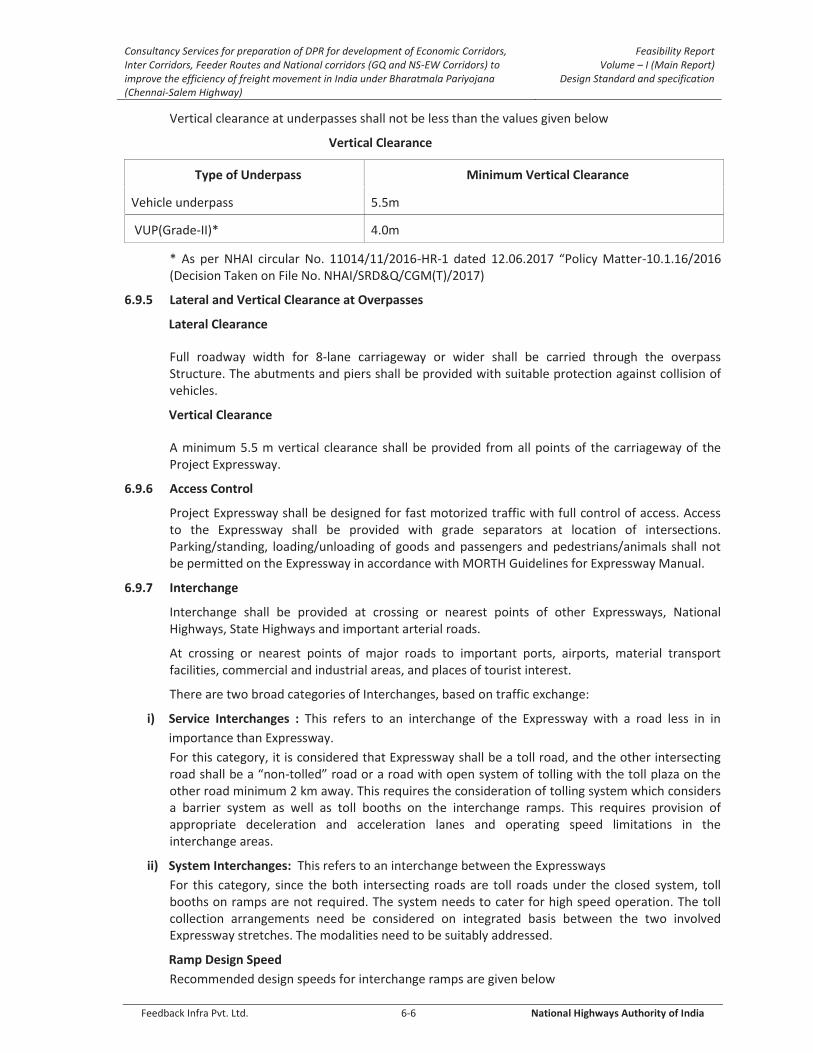
Consultancy Services for preparation of DPR for development of Economic Corridors, Inter Corridors, Feeder Routes and National corridors (GQ and NS-EW Corridors) to improve the efficiency of freight movement in India under Bharatmala Pariyojana (Chennai-Salem Highway)
Feasibility Report Volume – I (Main Report)
Design Standard and specification
Feedback Infra Pvt. Ltd. 6-6 National Highways Authority of India
Vertical clearance at underpasses shall not be less than the values given below
Vertical Clearance
Type of Underpass Minimum Vertical Clearance
Vehicle underpass 5.5m
VUP(Grade-II)* 4.0m
* As per NHAI circular No. 11014/11/2016-HR-1 dated 12.06.2017 “Policy Matter-10.1.16/2016 (Decision Taken on File No. NHAI/SRD&Q/CGM(T)/2017)
6.9.5 Lateral and Vertical Clearance at Overpasses
Lateral Clearance
Full roadway width for 8-lane carriageway or wider shall be carried through the overpass Structure. The abutments and piers shall be provided with suitable protection against collision of vehicles.
Vertical Clearance
A minimum 5.5 m vertical clearance shall be provided from all points of the carriageway of the Project Expressway.
6.9.6 Access Control
Project Expressway shall be designed for fast motorized traffic with full control of access. Access to the Expressway shall be provided with grade separators at location of intersections. Parking/standing, loading/unloading of goods and passengers and pedestrians/animals shall not be permitted on the Expressway in accordance with MORTH Guidelines for Expressway Manual.
6.9.7 Interchange
Interchange shall be provided at crossing or nearest points of other Expressways, National Highways, State Highways and important arterial roads.
At crossing or nearest points of major roads to important ports, airports, material transport facilities, commercial and industrial areas, and places of tourist interest.
There are two broad categories of Interchanges, based on traffic exchange:
i) Service Interchanges : This refers to an interchange of the Expressway with a road less in in
importance than Expressway.
For this category, it is considered that Expressway shall be a toll road, and the other intersecting road shall be a “non-tolled” road or a road with open system of tolling with the toll plaza on the other road minimum 2 km away. This requires the consideration of tolling system which considers a barrier system as well as toll booths on the interchange ramps. This requires provision of appropriate deceleration and acceleration lanes and operating speed limitations in the interchange areas.
ii) System Interchanges: This refers to an interchange between the Expressways
For this category, since the both intersecting roads are toll roads under the closed system, toll booths on ramps are not required. The system needs to cater for high speed operation. The toll collection arrangements need be considered on integrated basis between the two involved Expressway stretches. The modalities need to be suitably addressed.
Ramp Design Speed
Recommended design speeds for interchange ramps are given below
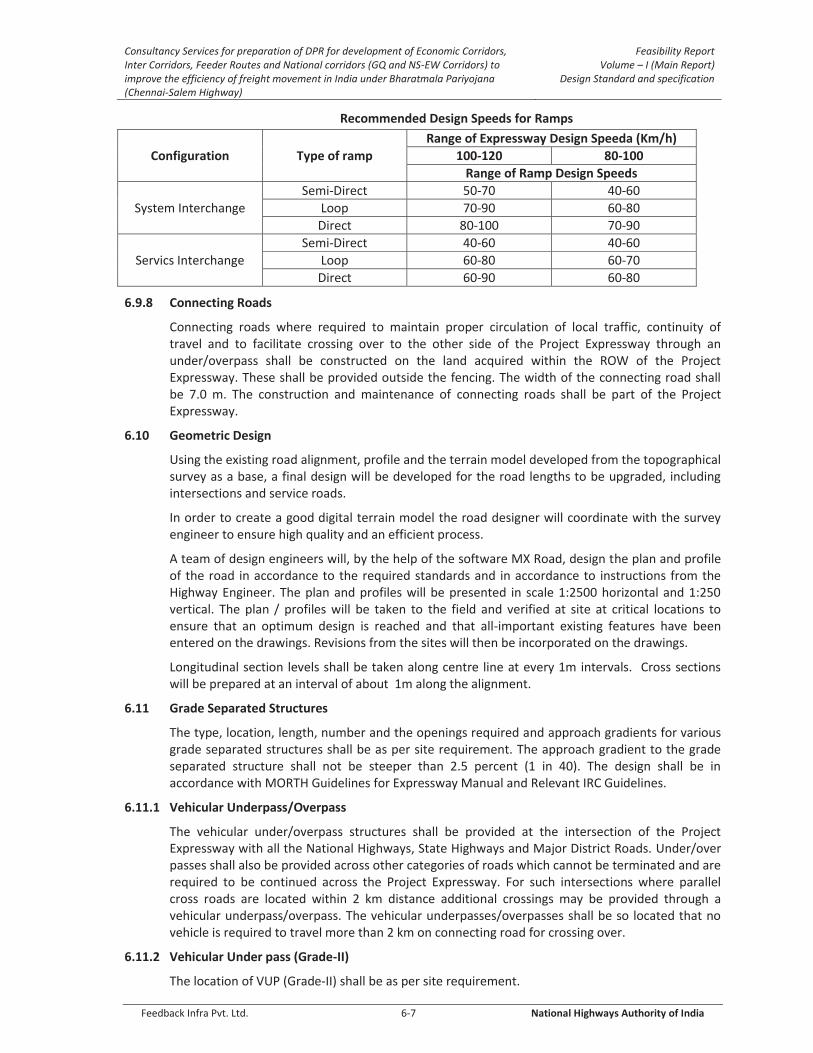
Consultancy Services for preparation of DPR for development of Economic Corridors, Inter Corridors, Feeder Routes and National corridors (GQ and NS-EW Corridors) to improve the efficiency of freight movement in India under Bharatmala Pariyojana (Chennai-Salem Highway)
Feasibility Report Volume – I (Main Report)
Design Standard and specification
Feedback Infra Pvt. Ltd. 6-7 National Highways Authority of India
Recommended Design Speeds for Ramps
Configuration Type of ramp
Range of Expressway Design Speeda (Km/h)
100-120 80-100
Range of Ramp Design Speeds
System Interchange
Semi-Direct 50-70 40-60
Loop 70-90 60-80
Direct 80-100 70-90
Servics Interchange
Semi-Direct 40-60 40-60
Loop 60-80 60-70
Direct 60-90 60-80
6.9.8 Connecting Roads
Connecting roads where required to maintain proper circulation of local traffic, continuity of travel and to facilitate crossing over to the other side of the Project Expressway through an under/overpass shall be constructed on the land acquired within the ROW of the Project Expressway. These shall be provided outside the fencing. The width of the connecting road shall be 7.0 m. The construction and maintenance of connecting roads shall be part of the Project Expressway.
6.10 Geometric Design
Using the existing road alignment, profile and the terrain model developed from the topographical survey as a base, a final design will be developed for the road lengths to be upgraded, including intersections and service roads.
In order to create a good digital terrain model the road designer will coordinate with the survey engineer to ensure high quality and an efficient process.
A team of design engineers will, by the help of the software MX Road, design the plan and profile of the road in accordance to the required standards and in accordance to instructions from the Highway Engineer. The plan and profiles will be presented in scale 1:2500 horizontal and 1:250 vertical. The plan / profiles will be taken to the field and verified at site at critical locations to ensure that an optimum design is reached and that all-important existing features have been entered on the drawings. Revisions from the sites will then be incorporated on the drawings.
Longitudinal section levels shall be taken along centre line at every 1m intervals. Cross sections will be prepared at an interval of about 1m along the alignment.
6.11 Grade Separated Structures
The type, location, length, number and the openings required and approach gradients for various grade separated structures shall be as per site requirement. The approach gradient to the grade separated structure shall not be steeper than 2.5 percent (1 in 40). The design shall be in accordance with MORTH Guidelines for Expressway Manual and Relevant IRC Guidelines.
6.11.1 Vehicular Underpass/Overpass
The vehicular under/overpass structures shall be provided at the intersection of the Project Expressway with all the National Highways, State Highways and Major District Roads. Under/over passes shall also be provided across other categories of roads which cannot be terminated and are required to be continued across the Project Expressway. For such intersections where parallel cross roads are located within 2 km distance additional crossings may be provided through a vehicular underpass/overpass. The vehicular underpasses/overpasses shall be so located that no vehicle is required to travel more than 2 km on connecting road for crossing over.
6.11.2 Vehicular Under pass (Grade-II)
The location of VUP (Grade-II) shall be as per site requirement.

Consultancy Services for preparation of DPR for development of Economic Corridors, Inter Corridors, Feeder Routes and National corridors (GQ and NS-EW Corridors) to improve the efficiency of freight movement in India under Bharatmala Pariyojana (Chennai-Salem Highway)
Feasibility Report Volume – I (Main Report)
Design Standard and specification
Feedback Infra Pvt. Ltd. 6-8 National Highways Authority of India
6.11.3 ROBs/RUBs
ROB/RUB shall be provided as per MORTH Guidelines for Expressways manual and relevant IRC guidelines for Bridges and IRC:32
6.11.4 Tunnels
Provision of Tunnels shall be as per Section-7 of the Manual (IRC: SP: 99:2013 -Standards for Tunnels).
6.12 Median Openings
Median openings with detachable barrier shall be provided for traffic management for maintenance works and vehicles involved in accidents. Such barriers shall be located at ends of interchanges and rest areas. It is desirable to provide median openings with detachable barriers at about 5 km spacing. Maintenance and emergency crossovers generally should not be located on super elevated curves and closer than 450 m to the end of a speed change taper of a ramp or to any structure.
6.13 Fencing and Boundary Stones
Fencing shall be provided all along the Project Expressway at the ROW boundary. The fencing shall be of type and design given in Section-10 of MORTH guidelines for Expressway Manual. The ROW shall be demarcated by installing Road Boundary Stones at the edges.
6.14 Typical Cross Sections
Typical cross section will be adopted as per MORTH Guidelines for Expressways manual. The proposed TCS are attached as Appendix I.
6.15 Capacity of Expressway
Rural expressways shall be designed for Level of Service-B. For the purpose of design and future augmentation of the Project Expressway, the design service volume for level of service- B for plain/rolling terrain shall be 1300 PCU/hr/lane, as per MORTH Guidelines for Expressways.
6.16 Service Road
Service road shall be designed in accordance with Manual of Specifications and Standards for Four Laning of Highways through Public Private Partnership (IRC SP 84) or Manual of Specifications and Standards for Six Laning of Highways through Public Private Partnership (IRC SP 87) based on site requirements and design Proposal.
6.17 Embankment and Cut Sections
The design and construction of the road in embankment and in cutting shall be carried out in accordance with Section 300 of MORTH Specifications and the requirements, and standards and specifications given in Section 4 of MORTH Guidelines for Expressway Manual.
6.18 Pavement Design
The design of pavement shall take into account all relevant factors for assuring reliable performance, surface characteristics and shall satisfy the specified minimum performance requirements. The guidelines to be followed for the Pavement design are IRC 37, IRC 58, IRC SP 76, AASHP Pavement Design 1993and MORTH guidelines for Expressways manual.
6.18.1 Type of Pavement
The type and crust thickness of Pavement for Main Carriageway and paved shoulders/edge strips will be finalized considering the existing site condition, locally available materials and project viability.

Consultancy Services for preparation of DPR for development of Economic Corridors, Inter Corridors, Feeder Routes and National corridors (GQ and NS-EW Corridors) to improve the efficiency of freight movement in India under Bharatmala Pariyojana (Chennai-Salem Highway)
Feasibility Report Volume – I (Main Report)
Design Standard and specification
Feedback Infra Pvt. Ltd. 6-9 National Highways Authority of India
6.18.2 Design of Flexible Pavement
The pavement shall be designed to ensure the specified performance for the projected traffic needs, climate and type of soils in the given area. A design procedure that is appropriate to produce a cost-effective structure meeting the performance requirements and long term durability shall be taken into account. Use of IRC 37 "Tentative Guidelines for the Design of Flexible Pavements" or any internationally accepted design procedure that is based on past performance and research will be used as basis for design. Design life of Flexible Pavement for expressways shall be minimum of 20 years.
6.18.3 Design of Plain Jointed Rigid Pavement
Plain Jointed rigid pavement shall be designed in accordance with the method prescribed in IRC -58 - 2011 "Guidelines for the Design of Plain Jointed Rigid Pavements for Highways". Design life of Rigid Pavement for expressways shall be minimum of 30 years.
6.18.4 Design of Continuously Reinforced Concrete Pavement
Continuously Reinforced Concrete Pavements (CRCP) shall be designed in accordance with IRC 101 as well as any recognized international guidelines.
6.18.5 Design of Composite Pavements
Composite Pavements are the pavements comprising of flexible layer and rigid layer or cement treated sub-base and/or base. The Composite pavement shall be designed considering inputs like soil property, traffic, etc. and individual layer properties of the pavement. IRC guidelines for flexible pavement (IRC 37), rigid pavements (IRC 58 and IRC SP 76) and other relevant Indian and international standards shall be referred.
6.19 Materials
All materials to be used in works shall be in conformity with the requirements laid down for relevant item in MORTH Specifications. If any material, which is not covered in MORTH Specifications, is used, shall conform to IRC or relevant Indian or International Standards, provisions.
6.20 Drainage Design
The IRC SP 42 will generally be followed for design of highway drainage. The planning of highway and drainage is intricately linked with the terrain, alignment of the highway and the proposed cross drainage works. Improper planning and design of any of the above factors may lead to unsatisfactory performance of the system. Hence planning and designing of adequate drainage system is a primary requirement for maintaining a structural soundness and functional efficiency of a road. Pavement structure including sub-grade must be protected from any ingress of water; otherwise over a period of time it may weaken the sub-grade by saturating it and cause distress in the pavement structure. Hence disposal of water from the pavement and sub-grade is a basic consideration in road design. Over and above quick drainage takes away the water from pavement surface and reduces chances of skidding of vehicles. In order to guard the pavement from the poorly drained conditions, planning, designing, construction and maintenance of longitudinal drains on either side of the roads is very much essential. The surface water from the pavement and shoulders will be made to flow in to the drains by providing suitable cross slopes / Camber. In addition, the proposed drains may have to cater for the runoff from the adjoining lands.
Design procedure:
After the finalisation of the road alignment including vertical and horizontal alignment, the centreline of the longitudinal drain is fixed keeping a safe distance from the foot of embankment.
The corridor along the Highway will be divided into suitable zones / sections depending on
Consultancy Services for preparation of DPR for development of Economic Corridors, Inter Corridors, Feeder Routes and National corridors (GQ and NS-EW Corridors) to improve the efficiency of freight movement in India under Bharatmala Pariyojana (Chennai-Salem Highway)
Feasibility Report Volume – I (Main Report)
Design Standard and specification
Feedback Infra Pvt. Ltd. 6-10 National Highways Authority of India
the terrain / topography in such a way that between the two ridges / crown points there will be natural valley and vice versa.
The extent of catchment area between the ridge and valley will be worked out from the surveyed maps or Topo maps.
The Discharge will be worked based on the catchment area using rational / empherical / Dicken’s / Unit Hydrograph formulae. Suitable design factor will be applied as per standard code of practice to arrive at the design discharges.
The section of the drain will be designed as trapezoidal and lined. Manning’s formula will be used for velocity calculations. The bed gradient adopted will achieve velocity on the scouring side to avoid any stagnation of water in the drain.
The longitudinal drains will drain in to natural streams / channels / rivers etc by providing suitable outfall structures.
The flood level in the drains will be so fixed that it will be always below the sub-grade of the road for efficient disposal of water even from sub base.
6.21 Traffic Control Devices, Road Safety Devices and Road Side Furniture
Traffic Control Devices, Road Safety Devices and Road Side Furniture shall comprise of road signs, road markings, object markers, hazard markers, studs, delineators, attenuators, safety barriers, boundary fences, boundary stones, kilometre stones, etc. Relevant IRC Guidelines (IRC 2, IRC 8, IRC 35, IRC 67,etc), MORTH Guidelines for Expressways manual and Section 800 of MORTH Specifications shall be followed.
6.22 Traffic Management Systems
Advance Traffic Management Systems (ATMS) shall be provided as per Clause-816 of MORTH Specifications for road and bridge works. ATMS shall have the following sub-systems and shall be provided as per site conditions and design Proposals.
Emergency Call Boxes
Mobile Communication System
Variable Message Signs System
Meteorological Data System
Automatic Traffic Counter and Vehicle Classification
Video Surveillance System
Video Incident Detection System (VIDS)
6.23 Toll Plazas
Toll plazas shall be provided as per MORTH Guidelines for Expressways manual.
Toll plaza shall be designed for peak hour traffic projected for minimum 25 years. The total number of toll booths and lanes shall be designed to ensure the service time of not more than 10 seconds per vehicle at peak flow. The width of each ETC toll lane shall be 3.5m, for manual/smart card lanes shall be 3.2 meters and for the lane for over dimensional vehicles, it shall be 4.5 m. between each toll lane, traffic islands will be provided so as to accommodate toll booth. These islands shall be of minimum 25 m length and 1.8 m width. Protective barriers of reinforced concrete shall be placed at the front of each island to prevent out of control approaching vehicles crashing into the toll booth. They would be painted with reflective chevron markings. The area of toll plaza covering the flared portion shall be provided with concrete pavement. The toll plaza(s) shall be provided for collection of toll/fee as per the Proposal. The fee collection system shall be electronic toll collection (ETC) system. The design of the Toll Plaza(s) shall be aesthetically pleasing. The fee collection staff should be efficient, courteous and adequately trained before deployment.

Consultancy Services for preparation of DPR for development of Economic Corridors, Inter Corridors, Feeder Routes and National corridors (GQ and NS-EW Corridors) to improve the efficiency of freight movement in India under Bharatmala Pariyojana (Chennai-Salem Highway)
Feasibility Report Volume – I (Main Report)
Design Standard and specification
Feedback Infra Pvt. Ltd. 6-11 National Highways Authority of India
6.24 Project Facilities
Project facilities like service areas, Rest areas, Truck lay byes, etc. shall be provided in accordance to the MORTH Guidelines for Expressways manual.
6.25 Design criteria for Structures
6.25.1 Definition of Structures
Interchanges: Interchange is a system of interconnecting raods (ramps and loops) in conjuction with one or more grade separations that provide for the uninterrupted movement of traffic between two or more roads.
Culverts: Cross drainage structures having length ≤ 6 m shall be classified as culverts.
Major and minor bridges: Bridges having length upto 60m shall be classified as minor bridges and bridges having length greater than 60m shall be classified as major bridges.
ROBs: Structure provided over the railway lines to carry the Project Highway.
RUBs: Structure provided below the railway lines to carry the Project
Highway.
Vehicular Underpass(VUP): Grade separated structure which is provided for crossing of vehicles under the Project Highway
Vehicular Overpass(VOP): Grade separated structure which is provided for crossing of vehicles over the Project Highway
Viaducts: Structures carrying the project road over land and spanning across the valleys are termed as viaducts.
6.25.2 Design Standards-Structures
T The design shall cover all aspects of preliminary design pertaining to various parts of bridges / grade separators / ROBs, foundations, protective works etc. The design shall generally be based on relevant IRC codes of practice, MoRTH circulars. However, where the IRC codes are not applicable or silent, appropriate BIS or other international Codes of Practice, such as, British / American / Australian Codes based on sound engineering practice shall be used.
This section below outlines the standards to be adopted for the design of the structures t which include Flyovers and Interchanges, Culverts, Major Bridges, & CUPs.
The IRC codes/Standards/Act, MoRTH Publications, IS & BIS codes shall be followed in the project. Design of all proposed structures shall be done in accordance with the provisions of the following IRC Codes:

Consultancy Services for preparation of DPR for development of Economic Corridors, Inter Corridors, Feeder Routes and National corridors (GQ and NS-EW Corridors) to improve the efficiency of freight movement in India under Bharatmala Pariyojana (Chennai-Salem Highway)
Feasibility Report Volume – I (Main Report)
Design Standard and specification
Feedback Infra Pvt. Ltd. 6-12 National Highways Authority of India
List of IRC Codes
IRC: 5 - 2015 - Section I- General Features of Design (Eighth Revision) IRC: 6 - 2017 - Section II- Loads and Stresses IRC: 22 - 2015 - Section IV-Composite construction for Road Bridges (Second
Revision) IRC: 24 - 2010 - Section V-Steel Road Bridges (Second Revision) IRC: 78 - 2014 - Section VII- Foundations and Substructure (Second Revision) IRC:83(Part-II) - 2015 - Section IX- Bearings, Part II: Elastomeric Bearings IRC: 83(Part-III) - 2002 - Section IX-Bearings, Part III: POT, POT- CUM-PTFE, Pin
and Metallic Guide Bearings IRC: 87 - 2011 - Guidelines for the Design and Erection of False work for
Road Bridges IRC: 89 - 1997 - Guidelines for Design and Construction of River Training and
Control Works for Road Bridges (First Revision) IRC:112 - 2014 - Code of Practice for Concrete Road Bridges IRC: SP13 - 2004 - Guidelines for Design of Small Bridges and Culverts IRC: SP:40 - 1993 - Techniques for strengthening & rehabilitation of bridges. IRC: SP:64 - 2005 - Guidelines for the Analysis and Design of Cast-in-Place
Voided Slab Superstructure IRC: SP:66 - 2005 - Guidelines for Design of Continuous Bridges IRC: SP:69 - 2005 - Guidelines & Specifications for Expansion Joints IRC: SP:70 – 2005 IS:14593-1995 IS:13620-1993 IS: 2062-2011 IS:14268-1995
- Guidelines for the Use of High Performance Concrete in Bridges. Design and Construction of Bored cast in situ Piles founded on Rocks. Fusion bonded epoxy coated reinforcement. Hot rolled medium and high tensile structural steel specifications. Uncoated stress relieved low relaxation seven Ply strand for pre stressed concrete specifications.
IS-2911-2010 For Pile foundations
MoRTH Specifications for Road and Bridges Works, 2001 (Fourth Revision) MoRTH Circular No. RW/NH-34059/1/96-S&R dated30.11.2000 regarding expansion joints. IS 13620 regarding coating of reinforcement bars Ministry of Road Transport and Highways Circular no.RW/NH/34041/44/91-S&R dated 21.3.2000 regarding coating of reinforcement bars in marine environment.
6.25.3 Special Design Requirements
The complete structure shall be designed to be safe against collapse and to maintain at all times an acceptable serviceability level. These shall be also designed to be durable to withstand the deteriorating effects of climate and environment.
All new bridges shall have independent superstructures for each direction of travel. Choice of single or independent structure for culverts shall be decided based site condition. Width of median in structural portion will be maintained same as that in the approaches.
In cases where median is kept open to sky, suitable provision will be made for retaining the earth likely to spill from median portion of immediate embankment.
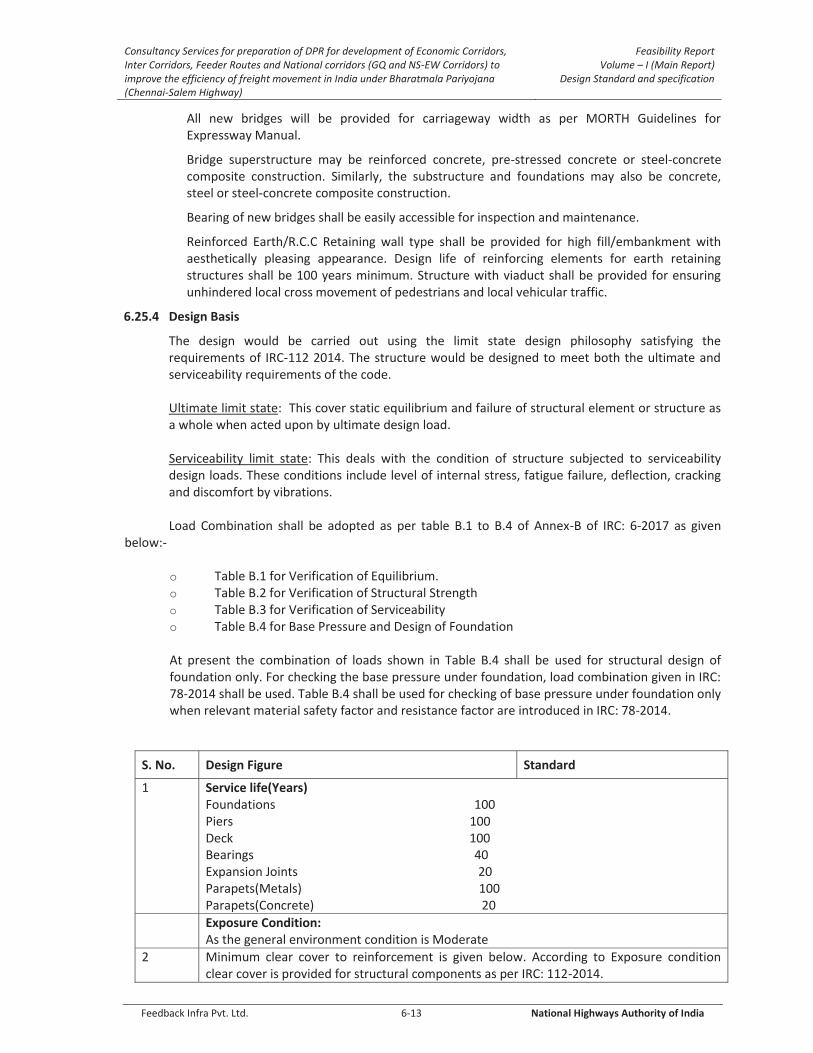
Consultancy Services for preparation of DPR for development of Economic Corridors, Inter Corridors, Feeder Routes and National corridors (GQ and NS-EW Corridors) to improve the efficiency of freight movement in India under Bharatmala Pariyojana (Chennai-Salem Highway)
Feasibility Report Volume – I (Main Report)
Design Standard and specification
Feedback Infra Pvt. Ltd. 6-13 National Highways Authority of India
All new bridges will be provided for carriageway width as per MORTH Guidelines for Expressway Manual.
Bridge superstructure may be reinforced concrete, pre-stressed concrete or steel-concrete composite construction. Similarly, the substructure and foundations may also be concrete, steel or steel-concrete composite construction.
Bearing of new bridges shall be easily accessible for inspection and maintenance.
Reinforced Earth/R.C.C Retaining wall type shall be provided for high fill/embankment with aesthetically pleasing appearance. Design life of reinforcing elements for earth retaining structures shall be 100 years minimum. Structure with viaduct shall be provided for ensuring unhindered local cross movement of pedestrians and local vehicular traffic.
6.25.4 Design Basis
The design would be carried out using the limit state design philosophy satisfying the requirements of IRC-112 2014. The structure would be designed to meet both the ultimate and serviceability requirements of the code.
Ultimate limit state: This cover static equilibrium and failure of structural element or structure as a whole when acted upon by ultimate design load.
Serviceability limit state: This deals with the condition of structure subjected to serviceability design loads. These conditions include level of internal stress, fatigue failure, deflection, cracking and discomfort by vibrations.
Load Combination shall be adopted as per table B.1 to B.4 of Annex-B of IRC: 6-2017 as given
below:-
o Table B.1 for Verification of Equilibrium. o Table B.2 for Verification of Structural Strength o Table B.3 for Verification of Serviceability o Table B.4 for Base Pressure and Design of Foundation
At present the combination of loads shown in Table B.4 shall be used for structural design of foundation only. For checking the base pressure under foundation, load combination given in IRC: 78-2014 shall be used. Table B.4 shall be used for checking of base pressure under foundation only when relevant material safety factor and resistance factor are introduced in IRC: 78-2014.
S. No. Design Figure Standard
1 Service life(Years) Foundations 100 Piers 100 Deck 100 Bearings 40 Expansion Joints 20 Parapets(Metals) 100 Parapets(Concrete) 20
Exposure Condition: As the general environment condition is Moderate
2 Minimum clear cover to reinforcement is given below. According to Exposure condition clear cover is provided for structural components as per IRC: 112-2014.

Consultancy Services for preparation of DPR for development of Economic Corridors, Inter Corridors, Feeder Routes and National corridors (GQ and NS-EW Corridors) to improve the efficiency of freight movement in India under Bharatmala Pariyojana (Chennai-Salem Highway)
Feasibility Report Volume – I (Main Report)
Design Standard and specification
Feedback Infra Pvt. Ltd. 6-14 National Highways Authority of India
S. No. Design Figure Standard
i Superstructures 40mm
ii Crash Barrier 50mm
iii Substructures 50mm
iv Pre-stressing cable duct 75/90mm
v Pre-cast elements 45mm
vi Foundations 75mm
vii Earth Face of Abutment, return wall, retaining wall, box side wall
75mm
viii Non Earth Face 50mm 3 Grade of Steel i HYSD bars Fe500D (Section 1600 of
Specifications: High yield strength deformed bars Fe500 conforming to IS: 1786)
ii Structural Steel Fe490(IS 2062)
4 Grade of Concrete i Pre stressed Concrete
Girder and Box Girder M45
ii RCC Deck slab over PSC Girder M45
iii RCC Box type structure-MNB M35
iv Pier and Pier Cap M35
v Bearing Pedestal M40
vi RCC Abutment, Abutment cap, Return Wall, Dirt wall.
M35
vii Open foundation, Pile and Pile cap M35
viii Crash Barrier M40
ix Approach slab M30
x Box Culverts M30
xi Leveling course M10/M15
xii Head Wall M20 5 Dead load-(unit wt.)
i Pre-stressed Concrete 2.5 T/m³
ii Reinforced Concrete (RCC) 2.5 T/m³
iii Plain Cement Concrete (PCC) 2.5 T/m³
iv Steel 7.854 T/m³
v Wearing Coat 2.2 T/m³
6 Live Load
i Footpath 400 Kg/m² (Rural area)
500 Kg/m²(Urban area)
ii c/w 5.3m to 9.6m One lane of class 70R or Two lane of Class A
iii c/w 9.6m to 13.1 m One lane of class 70R for every two lanes with one lane of class A on the remaining lane or 3 lanes of class A

Consultancy Services for preparation of DPR for development of Economic Corridors, Inter Corridors, Feeder Routes and National corridors (GQ and NS-EW Corridors) to improve the efficiency of freight movement in India under Bharatmala Pariyojana (Chennai-Salem Highway)
Feasibility Report Volume – I (Main Report)
Design Standard and specification
Feedback Infra Pvt. Ltd. 6-15 National Highways Authority of India
S. No. Design Figure Standard
7 Impact factor
Concrete Bridges
i for Class A 4.5/(6+L)
ii for Class 70 RT and 70RW Upto-9m For Tracked-25% for span up to 5m and linear reducing to 10% for span up to 9m. For Wheeled-25% for span up to 9m More than 9 m- For Tracked-10% for span between 9m to 40m.As per curve for span more than 40m. For wheeled-25% for span up to 12m and as per curve for span more than 12m
Steel Bridges
i for Class A 9/(13.5+L)
ii for Class 70 RT & Class 70 R W Up to -9m For Tracked-25% for span up to 5m and linear reducing to 10% for span up to 9m. For wheeled-25% for span up to 9m More than 9m- For Tracked-10% for all spans. For wheeled-25% for span up to 23m and as per curve for span more than 23m.
8 Wind Load
i As per basic wind speed and Type of the structure (IRC:6-2017,clause 209).
9 Horizontal Forces due to water current
i Case-I Parallel to pier
ii Case-II At inclination of (20±θ) to the pier
10 Longitudinal forces i Case-I In case of single lane and two lane
20% of first train load plus 10% of load of succeeding train or part thereof
ii Case-II In case of bridges with more than two lane braking force for two lane plus 5 % of the loads on the lanes in excess of two

Consultancy Services for preparation of DPR for development of Economic Corridors, Inter Corridors, Feeder Routes and National corridors (GQ and NS-EW Corridors) to improve the efficiency of freight movement in India under Bharatmala Pariyojana (Chennai-Salem Highway)
Feasibility Report Volume – I (Main Report)
Design Standard and specification
Feedback Infra Pvt. Ltd. 6-16 National Highways Authority of India
S. No. Design Figure Standard
11 Buoyancy
i 100 % buoyancy for stability check
ii 15 % buoyancy for design
12 Temperature (as per IRC:6-2017 clause 215)
For bridge having difference between max and min air shade temperature-
>20 degree C Mean of Maximum and Minimum air shade temperature +,- 10˚C whichever is critical
<20 degree C Mean of Maximum and Minimum air shade temperature +,- 5˚C whichever is critical
The nonlinear temperature gradient for design of superstructure shall be considered as per clause 215.3 of IRC: 6-2017.
13 Seismic force (as per IRC:6-2017, clause 219)
i Zone-III Bridges in Seismic Zone- III need not to be designed for seismic forces if span in less than 15.0m and total length of bridge is less than 60.0m. For all other cases seismic forces shall be considered as per Clause 219 of IRC 6-2017
14 Expansion Joints
i Filler type For span up to 10m(Section 2600 of the specification)
ii Strip Seal Type For Span >10m and movement up to ±80(Section 2600 of specification)
iii Modular Type movement more than ±80(Section 2600 of specification)
15 Bearing
i Tar paper Solid slab up to 10m
ii Elastomeric As per design requirements
iii Pot cum PTFE As per design requirements
iv Pin and Guided Bearing As per design requirements
16 Wearing Coat 50 mm thick
17
Pre stressing (IS: 14268, section 1800 of Specifications: Uncoated stress relieved low relaxation steel) Type of Strand-Stress relieved multiply strands of low relaxation Ultimate Stress in Cable -1861 MPa Maximum pre stress jacking force-0.783(90% of 0.1% of proof load) 1) The maximum force applied to a tendon at active end during

Consultancy Services for preparation of DPR for development of Economic Corridors, Inter Corridors, Feeder Routes and National corridors (GQ and NS-EW Corridors) to improve the efficiency of freight movement in India under Bharatmala Pariyojana (Chennai-Salem Highway)
Feasibility Report Volume – I (Main Report)
Design Standard and specification
Feedback Infra Pvt. Ltd. 6-17 National Highways Authority of India
S. No. Design Figure Standard
tensioning, shall not exceed 90% of 0.1% proof stress 2) The analysis of pre stressed section would be as per the stress strain properties given in clause 6.3.5 of IRC-112. 3) Maximum pre stressing force applied to structure immediately after transfer shall not be greater than 75% of characteristic tensile strength of pre stressing steel or 0.85 of 0.1% of proof load whichever less is. 4)For serviceability limit state the section would be checked for 10% higher and 10% lower values of pre stressing force as per IRC -112
18 Sheathing HDPE
19 Shrinkage Total shrinkage is drying shrinkage and auto-generous shrinkage
20 Creep Creep to be calculated as per IRC112
21 Coefficient of thermal Expansion-12x10-6/degree C
22 Modulus of Elasticity-Modulus of Elasticity to be calculated as per short term and long term creep and shrinkage
23 Minimum Bar Diameter 10 mm (refer Table 15.1,IRC112)
Diameter if any reinforcing bar including transverse ties, stirrups etc. shall not be less than 10 mm. Diameter of any longitudinal reinforcement bars in columns/ vertical member shall not be less than 12 mm. However diameter of the reinforcing bars shall not exceed 25 mm in slabs and 32 mm in other member.
20 Margin in Material (FOS)
All critical sections shall be checked for stresses under various load combinations. A suitable margin (preferably 5%) shall be there between maximum stress and allowable stress in concrete as well as reinforcement in the final design.
6.25.5 Design Load and Stresses
design loads shall be as per IRC: 6-2017, appropriate for the proposed carriageway width, type and properties of stream, location, altitude, etc. Dead Load (DL) The dead load i.e. the self-weight of the superstructure, substructure and foundations, backfill will be considered as per the Cl. 203 of IRC: 6 -2017 and are summarized as below: Wet concrete including reinforcement - 2.6 t/m3 (IRC: 87 – 2011) Concrete (Cement Reinforced) - 2.5 t/m3 Concrete (Cement Prestressed) - 2.5 t/m3
Concrete (Asphalt) - 2.2 t/m3 Earth (Compacted) - 2.0 t/m3 Concrete (Cement - plain with plum) - 2.5 t/m3
Superimposed Dead Load (SIDL) SIDL comprises of the following items Crash barrier without Hand Rail – 0.8 t/m Crash barrier with Hand Rail – 1.0 t/m Wearing Course – 0.246 t/m2
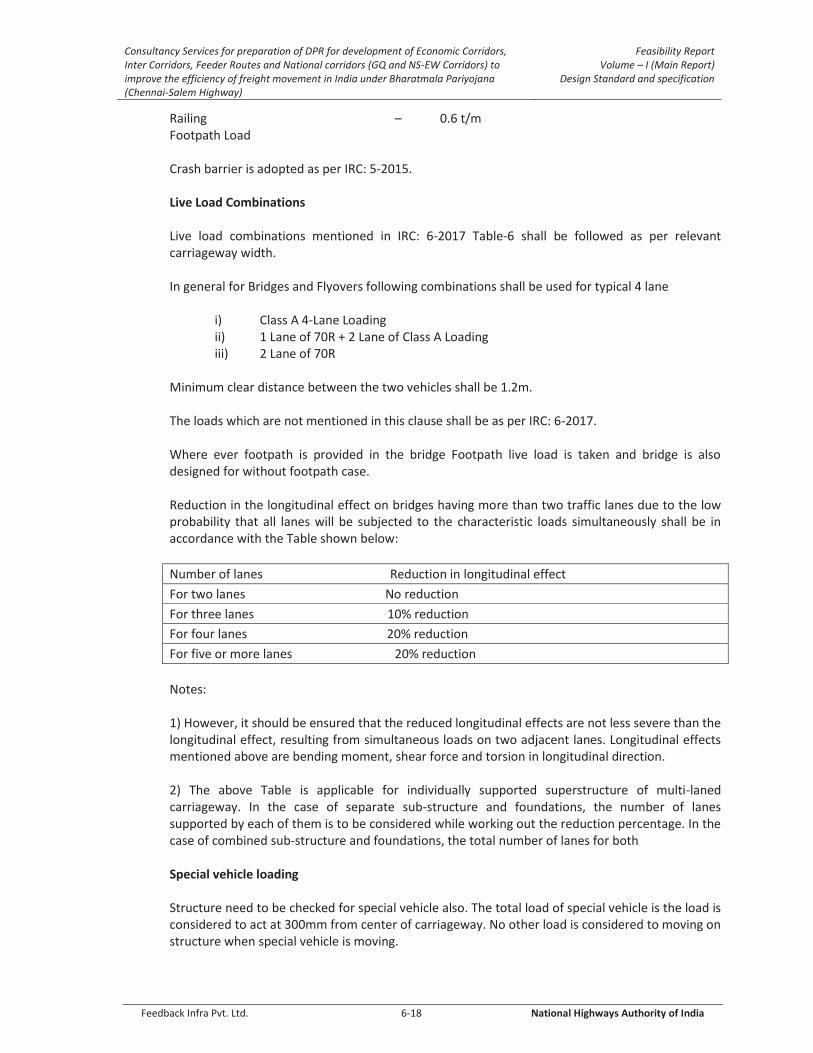
Consultancy Services for preparation of DPR for development of Economic Corridors, Inter Corridors, Feeder Routes and National corridors (GQ and NS-EW Corridors) to improve the efficiency of freight movement in India under Bharatmala Pariyojana (Chennai-Salem Highway)
Feasibility Report Volume – I (Main Report)
Design Standard and specification
Feedback Infra Pvt. Ltd. 6-18 National Highways Authority of India
Railing – 0.6 t/m Footpath Load Crash barrier is adopted as per IRC: 5-2015. Live Load Combinations Live load combinations mentioned in IRC: 6-2017 Table-6 shall be followed as per relevant carriageway width. In general for Bridges and Flyovers following combinations shall be used for typical 4 lane
i) Class A 4-Lane Loading ii) 1 Lane of 70R + 2 Lane of Class A Loading iii) 2 Lane of 70R
Minimum clear distance between the two vehicles shall be 1.2m. The loads which are not mentioned in this clause shall be as per IRC: 6-2017. Where ever footpath is provided in the bridge Footpath live load is taken and bridge is also designed for without footpath case.
Reduction in the longitudinal effect on bridges having more than two traffic lanes due to the low probability that all lanes will be subjected to the characteristic loads simultaneously shall be in accordance with the Table shown below:
Number of lanes Reduction in longitudinal effect
For two lanes No reduction
For three lanes 10% reduction
For four lanes 20% reduction
For five or more lanes 20% reduction
Notes: 1) However, it should be ensured that the reduced longitudinal effects are not less severe than the longitudinal effect, resulting from simultaneous loads on two adjacent lanes. Longitudinal effects mentioned above are bending moment, shear force and torsion in longitudinal direction. 2) The above Table is applicable for individually supported superstructure of multi-laned carriageway. In the case of separate sub-structure and foundations, the number of lanes supported by each of them is to be considered while working out the reduction percentage. In the case of combined sub-structure and foundations, the total number of lanes for both Special vehicle loading Structure need to be checked for special vehicle also. The total load of special vehicle is the load is considered to act at 300mm from center of carriageway. No other load is considered to moving on structure when special vehicle is moving.
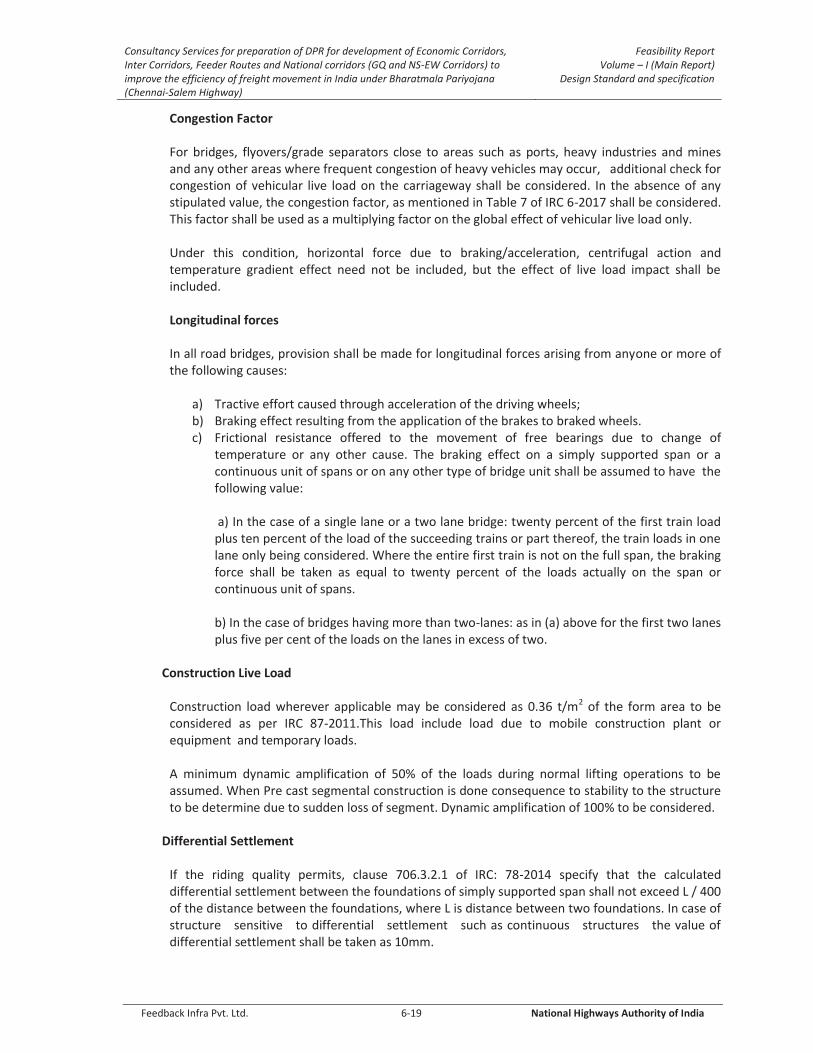
Consultancy Services for preparation of DPR for development of Economic Corridors, Inter Corridors, Feeder Routes and National corridors (GQ and NS-EW Corridors) to improve the efficiency of freight movement in India under Bharatmala Pariyojana (Chennai-Salem Highway)
Feasibility Report Volume – I (Main Report)
Design Standard and specification
Feedback Infra Pvt. Ltd. 6-19 National Highways Authority of India
Congestion Factor For bridges, flyovers/grade separators close to areas such as ports, heavy industries and mines and any other areas where frequent congestion of heavy vehicles may occur, additional check for congestion of vehicular live load on the carriageway shall be considered. In the absence of any stipulated value, the congestion factor, as mentioned in Table 7 of IRC 6-2017 shall be considered. This factor shall be used as a multiplying factor on the global effect of vehicular live load only. Under this condition, horizontal force due to braking/acceleration, centrifugal action and temperature gradient effect need not be included, but the effect of live load impact shall be included. Longitudinal forces In all road bridges, provision shall be made for longitudinal forces arising from anyone or more of the following causes:
a) Tractive effort caused through acceleration of the driving wheels; b) Braking effect resulting from the application of the brakes to braked wheels. c) Frictional resistance offered to the movement of free bearings due to change of
temperature or any other cause. The braking effect on a simply supported span or a continuous unit of spans or on any other type of bridge unit shall be assumed to have the following value:
a) In the case of a single lane or a two lane bridge: twenty percent of the first train load plus ten percent of the load of the succeeding trains or part thereof, the train loads in one lane only being considered. Where the entire first train is not on the full span, the braking force shall be taken as equal to twenty percent of the loads actually on the span or continuous unit of spans.
b) In the case of bridges having more than two-lanes: as in (a) above for the first two lanes plus five per cent of the loads on the lanes in excess of two.
Construction Live Load
Construction load wherever applicable may be considered as 0.36 t/m2 of the form area to be considered as per IRC 87-2011.This load include load due to mobile construction plant or equipment and temporary loads. A minimum dynamic amplification of 50% of the loads during normal lifting operations to be assumed. When Pre cast segmental construction is done consequence to stability to the structure to be determine due to sudden loss of segment. Dynamic amplification of 100% to be considered.
Differential Settlement
If the riding quality permits, clause 706.3.2.1 of IRC: 78-2014 specify that the calculated differential settlement between the foundations of simply supported span shall not exceed L / 400 of the distance between the foundations, where L is distance between two foundations. In case of structure sensitive to differential settlement such as continuous structures the value of differential settlement shall be taken as 10mm.

Consultancy Services for preparation of DPR for development of Economic Corridors, Inter Corridors, Feeder Routes and National corridors (GQ and NS-EW Corridors) to improve the efficiency of freight movement in India under Bharatmala Pariyojana (Chennai-Salem Highway)
Feasibility Report Volume – I (Main Report)
Design Standard and specification
Feedback Infra Pvt. Ltd. 6-20 National Highways Authority of India
Temperature Gradient Effective bridge temperature shall be estimated from the isotherms of shade air temperature given in fig 15 and fig 16 of IRC: 6-2017. Difference in temperature between the top surface and other levels through the depth of the structure, where ever applicable shall be taken in accordance with clause :215.3 of IRC:6-2017.
Centrifugal Forces Centrifugal forces are considered for spans in curved portion as per IRC 6-2017 Centrifugal forces shall be determined from following formula:
C= WV2/127R Where, C =Centrifugal force acting normal to the traffic. W = Live load (tons/m) V= Design speed of vehicles (Km/ hour) R = Radius of curvature (m)
It is considered to be acting at 1.2m above deck level.
Earth Pressure 1. All earth retaining structures like Abutment and Other Earth Retaining Structures designed to
retain earth fills shall be proportioned to withstand pressure calculated in accordance with any rational theory. Coulomb's theory, subject to the modification that the center of pressure exerted by the backfill, when considered dry, is located at an elevation of 0.42 of the height of the wall above the base instead of 0.33 of that height.
2. For RCC Box Structure-Active Earth pressure / Earth pressure at rest will be considered to be acting on the vertical walls of the RCC Box. The Co-efficient of such Earth pressure will be taken as 0.5.
3. Surcharge Pressure-All Earth retaining wall are designed for a live load surcharge pressure equivalent to 1.2 m earth fill as per IRC 6-2017.
Wind forces
1. The superstructure shall be designed for wind induced horizontal forces (acting in the
transverse and longitudinal direction) and vertical loads acting simultaneously. The assumed wind direction shall be perpendicular to longitudinal axis for a straight structure or to an axis chosen to maximize the wind induced effects for a structure curved in plan.
2. The substructure shall be designed for wind induced loads transmitted to it from the Super structure and wind loads acting directly on the substructure. Loads for wind directions both normal and skewed to the longitudinal center line of the superstructure shall be considered.
3. The longitudinal force on bridge superstructure (in N) shall be taken as 25% and 50% of the transverse wind load as calculated as per Clause 209 for beam/box/ plate girder bridges and truss girder bridges respectively.
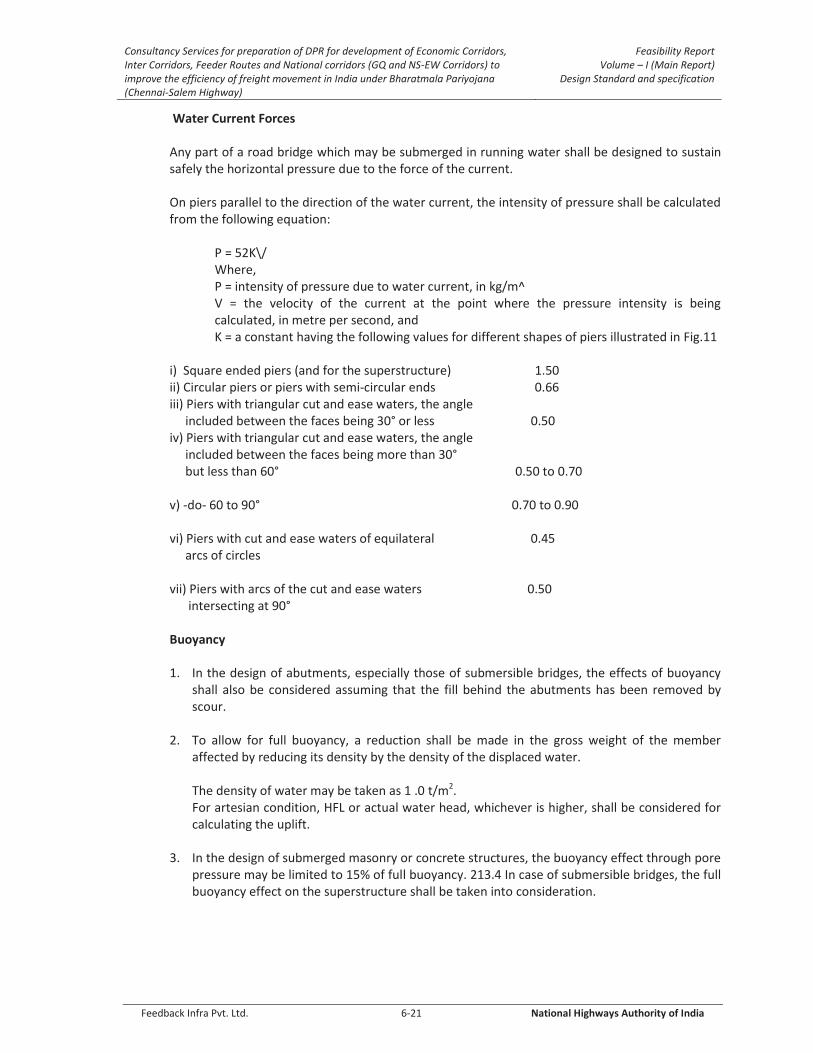
Consultancy Services for preparation of DPR for development of Economic Corridors, Inter Corridors, Feeder Routes and National corridors (GQ and NS-EW Corridors) to improve the efficiency of freight movement in India under Bharatmala Pariyojana (Chennai-Salem Highway)
Feasibility Report Volume – I (Main Report)
Design Standard and specification
Feedback Infra Pvt. Ltd. 6-21 National Highways Authority of India
Water Current Forces Any part of a road bridge which may be submerged in running water shall be designed to sustain safely the horizontal pressure due to the force of the current.
On piers parallel to the direction of the water current, the intensity of pressure shall be calculated from the following equation:
P = 52K\/ Where, P = intensity of pressure due to water current, in kg/m^ V = the velocity of the current at the point where the pressure intensity is being calculated, in metre per second, and K = a constant having the following values for different shapes of piers illustrated in Fig.11
i) Square ended piers (and for the superstructure) 1.50 ii) Circular piers or piers with semi-circular ends 0.66 iii) Piers with triangular cut and ease waters, the angle included between the faces being 30° or less 0.50 iv) Piers with triangular cut and ease waters, the angle included between the faces being more than 30° but less than 60° 0.50 to 0.70 v) -do- 60 to 90° 0.70 to 0.90 vi) Piers with cut and ease waters of equilateral 0.45 arcs of circles vii) Piers with arcs of the cut and ease waters 0.50 intersecting at 90°
Buoyancy
1. In the design of abutments, especially those of submersible bridges, the effects of buoyancy
shall also be considered assuming that the fill behind the abutments has been removed by scour.
2. To allow for full buoyancy, a reduction shall be made in the gross weight of the member affected by reducing its density by the density of the displaced water. The density of water may be taken as 1 .0 t/m2. For artesian condition, HFL or actual water head, whichever is higher, shall be considered for calculating the uplift.
3. In the design of submerged masonry or concrete structures, the buoyancy effect through pore pressure may be limited to 15% of full buoyancy. 213.4 In case of submersible bridges, the full buoyancy effect on the superstructure shall be taken into consideration.

Consultancy Services for preparation of DPR for development of Economic Corridors, Inter Corridors, Feeder Routes and National corridors (GQ and NS-EW Corridors) to improve the efficiency of freight movement in India under Bharatmala Pariyojana (Chennai-Salem Highway)
Feasibility Report Volume – I (Main Report)
Design Standard and specification
Feedback Infra Pvt. Ltd. 6-22 National Highways Authority of India
Seismic Forces The project corridor falls under seismic zone-III which is Moderate seismic zone. Seismic design is carried out as per zone and as per codal provisions along with provision of ductile detailing and seismic arrestor Block. All bridges supported on piers, pier bents and arches, directly or through bearings, and not exempted below in the category (a) and (b), are to be designed for horizontal and Vertical forces as given in the following clauses. The following types of bridges need not be checked for seismic effects:
a) Culverts and minor bridges up to 10 m span in all seismic zones.
b) Bridges in seismic zones II and Ill satisfying both limits of total length not exceeding 60 m and spans not exceeding 15 m
6.25.6 Culverts
As per Manual the culverts with vertical clearance 2m can be used by cattle and pedestrians during dry season.
6.26 Hydrology and Flood Control
The following Indian Standards have been considered:
Design flood events based on the 100-year flood level, except in case that only agricultural areas are at stake, it will be reduced to the 25-year event;
Calculations for the 100-year flood level based on the 100-year flood discharge, calculated using the log-Pearson III equation;
The minimum width to be left between the river bank and the embankment will be based on Lacey's wetted perimeter.The riverbank will be the farthest envelope visible on SOI maps or Satellie imagry.
Design if drainage of areas outside the Expressway embankment will require an agreement on a combination of rainfall intensity and its duration.The design discharge will be worked out by synthetic unit hydrograph method. The HFL will be taken based on local inquiry.
The relevant publications and Indian Standards are given below:
Designation Issued by Date of issue
River behaviour Management and Training (vol I & II)
Central Board of Irrigation & Power
1994
IS 12094 : 2000- Guidelines for planning and design of river embankments
B.I.S 2000
IS 12169 : 1997- Criteria for design of small embankment dam up to 15 m height
B.I.S 1997
Embankment Manual, Investigation, Design, Construction and Maintenance
Central Board of Irrigation & Power
IS 11532 : 1985- Guidelines for construction of river embankments
B.I.S 1985
SP13 : Guidelines for the design of IRC 2004
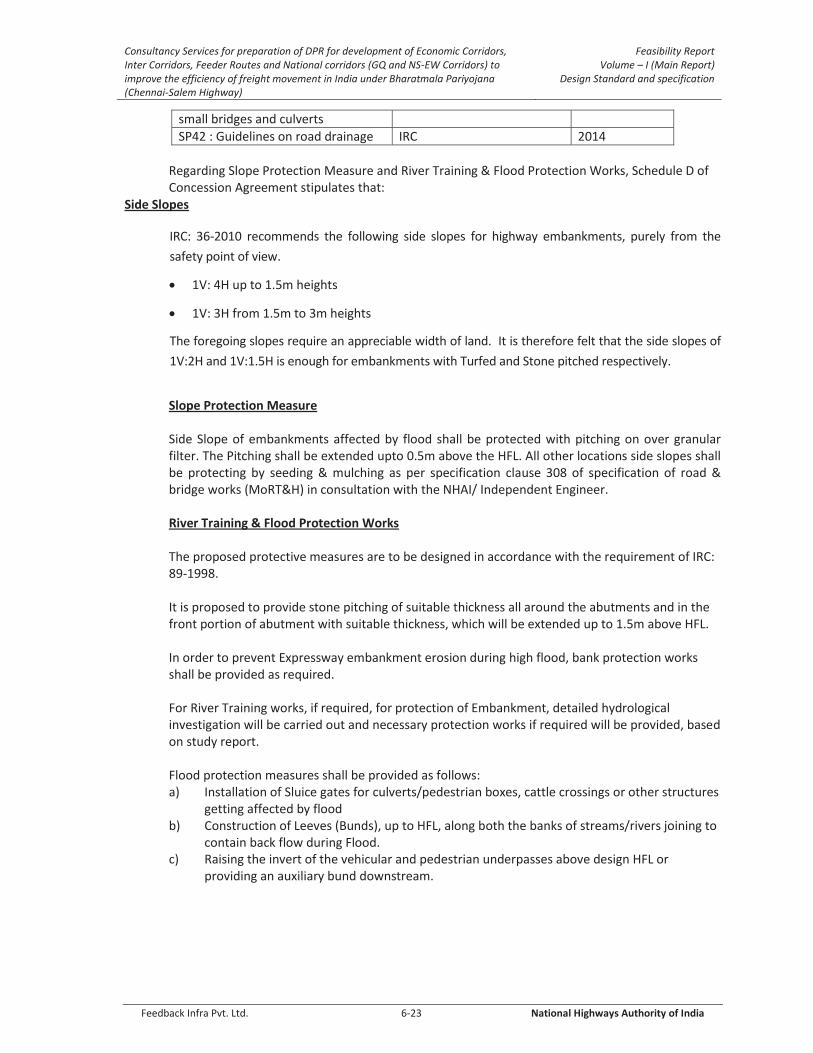
Consultancy Services for preparation of DPR for development of Economic Corridors, Inter Corridors, Feeder Routes and National corridors (GQ and NS-EW Corridors) to improve the efficiency of freight movement in India under Bharatmala Pariyojana (Chennai-Salem Highway)
Feasibility Report Volume – I (Main Report)
Design Standard and specification
Feedback Infra Pvt. Ltd. 6-23 National Highways Authority of India
small bridges and culverts SP42 : Guidelines on road drainage IRC 2014
Regarding Slope Protection Measure and River Training & Flood Protection Works, Schedule D of Concession Agreement stipulates that:
Side Slopes
IRC: 36-2010 recommends the following side slopes for highway embankments, purely from the
safety point of view.
1V: 4H up to 1.5m heights
1V: 3H from 1.5m to 3m heights
The foregoing slopes require an appreciable width of land. It is therefore felt that the side slopes of
1V:2H and 1V:1.5H is enough for embankments with Turfed and Stone pitched respectively.
Slope Protection Measure Side Slope of embankments affected by flood shall be protected with pitching on over granular filter. The Pitching shall be extended upto 0.5m above the HFL. All other locations side slopes shall be protecting by seeding & mulching as per specification clause 308 of specification of road & bridge works (MoRT&H) in consultation with the NHAI/ Independent Engineer. River Training & Flood Protection Works The proposed protective measures are to be designed in accordance with the requirement of IRC: 89-1998. It is proposed to provide stone pitching of suitable thickness all around the abutments and in the front portion of abutment with suitable thickness, which will be extended up to 1.5m above HFL. In order to prevent Expressway embankment erosion during high flood, bank protection works shall be provided as required. For River Training works, if required, for protection of Embankment, detailed hydrological investigation will be carried out and necessary protection works if required will be provided, based on study report. Flood protection measures shall be provided as follows: a) Installation of Sluice gates for culverts/pedestrian boxes, cattle crossings or other structures
getting affected by flood b) Construction of Leeves (Bunds), up to HFL, along both the banks of streams/rivers joining to
contain back flow during Flood. c) Raising the invert of the vehicular and pedestrian underpasses above design HFL or
providing an auxiliary bund downstream.
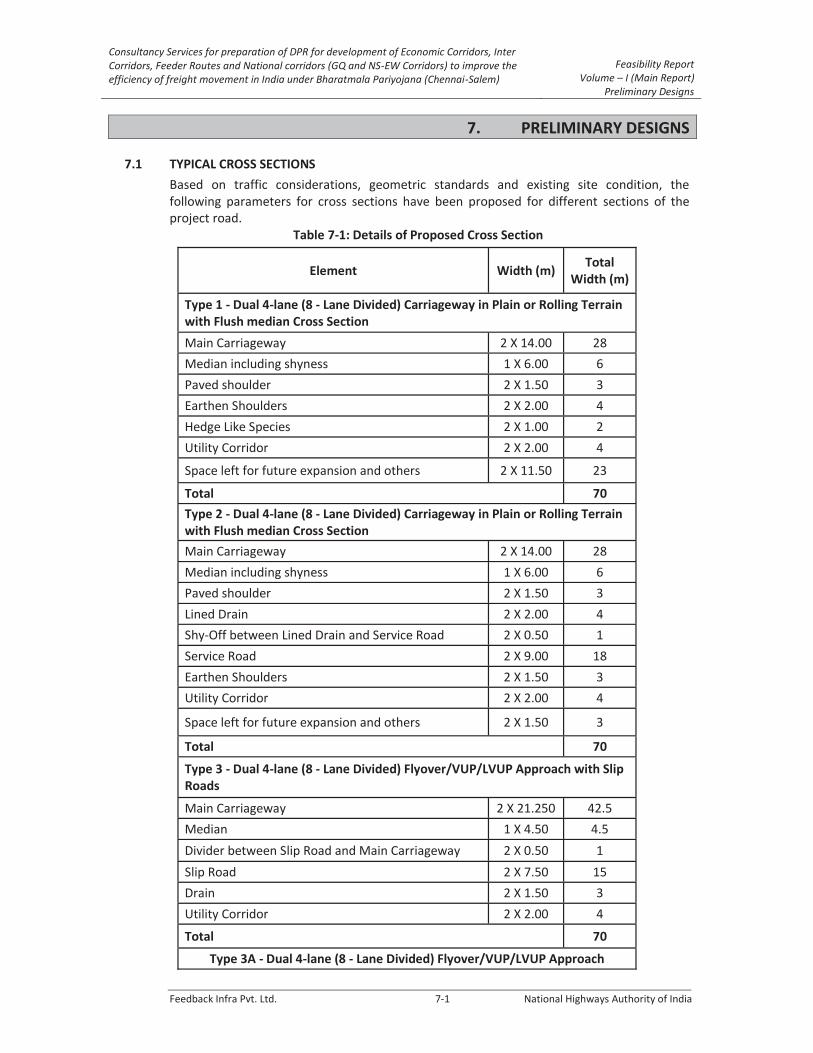
Consultancy Services for preparation of DPR for development of Economic Corridors, Inter Corridors, Feeder Routes and National corridors (GQ and NS-EW Corridors) to improve the efficiency of freight movement in India under Bharatmala Pariyojana (Chennai-Salem)
Feasibility Report Volume – I (Main Report)
Preliminary Designs
Feedback Infra Pvt. Ltd. 7-1 National Highways Authority of India
7. PRELIMINARY DESIGNS 7.1 TYPICAL CROSS SECTIONS
Based on traffic considerations, geometric standards and existing site condition, the following parameters for cross sections have been proposed for different sections of the project road.
Table 7-1: Details of Proposed Cross Section
Element Width (m) Total
Width (m)
Type 1 - Dual 4-lane (8 - Lane Divided) Carriageway in Plain or Rolling Terrain with Flush median Cross Section
Main Carriageway 2 X 14.00 28
Median including shyness 1 X 6.00 6
Paved shoulder 2 X 1.50 3
Earthen Shoulders 2 X 2.00 4
Hedge Like Species 2 X 1.00 2
Utility Corridor 2 X 2.00 4
Space left for future expansion and others 2 X 11.50 23
Total 70
Type 2 - Dual 4-lane (8 - Lane Divided) Carriageway in Plain or Rolling Terrain with Flush median Cross Section
Main Carriageway 2 X 14.00 28
Median including shyness 1 X 6.00 6
Paved shoulder 2 X 1.50 3
Lined Drain 2 X 2.00 4
Shy-Off between Lined Drain and Service Road 2 X 0.50 1
Service Road 2 X 9.00 18
Earthen Shoulders 2 X 1.50 3
Utility Corridor 2 X 2.00 4
Space left for future expansion and others 2 X 1.50 3
Total 70
Type 3 - Dual 4-lane (8 - Lane Divided) Flyover/VUP/LVUP Approach with Slip Roads
Main Carriageway 2 X 21.250 42.5
Median 1 X 4.50 4.5
Divider between Slip Road and Main Carriageway 2 X 0.50 1
Slip Road 2 X 7.50 15
Drain 2 X 1.50 3
Utility Corridor 2 X 2.00 4
Total 70
Type 3A - Dual 4-lane (8 - Lane Divided) Flyover/VUP/LVUP Approach
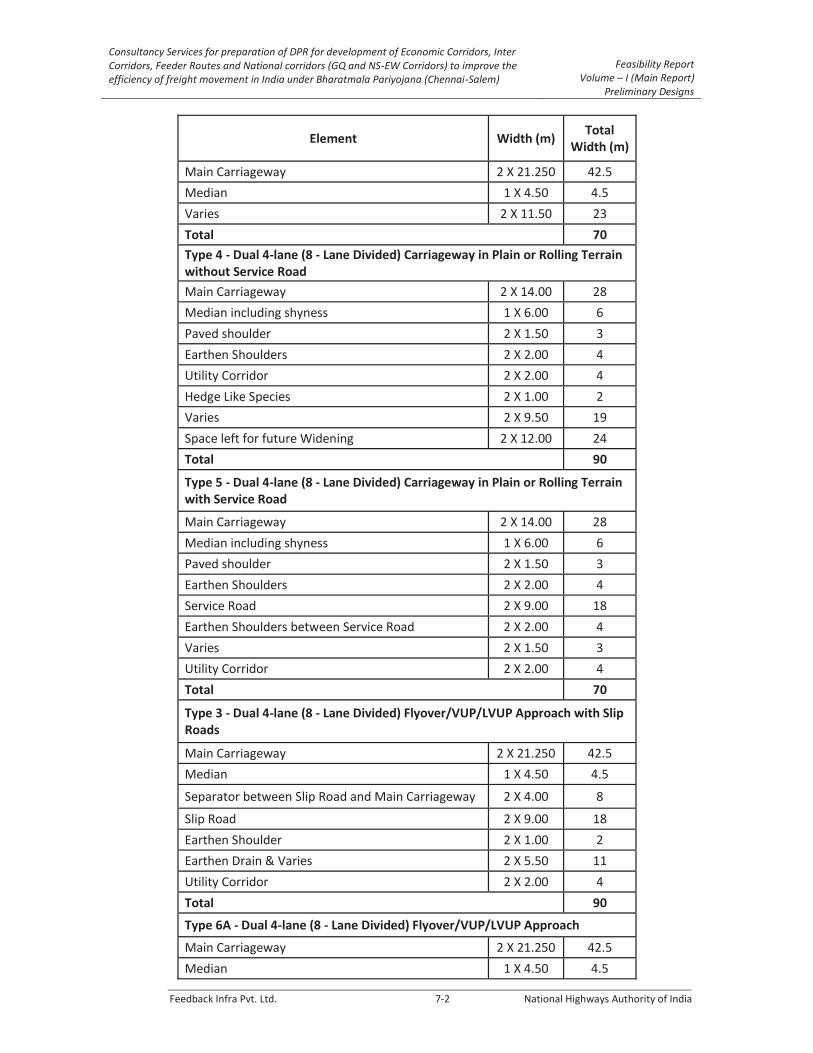
Consultancy Services for preparation of DPR for development of Economic Corridors, Inter Corridors, Feeder Routes and National corridors (GQ and NS-EW Corridors) to improve the efficiency of freight movement in India under Bharatmala Pariyojana (Chennai-Salem)
Feasibility Report Volume – I (Main Report)
Preliminary Designs
Feedback Infra Pvt. Ltd. 7-2 National Highways Authority of India
Element Width (m) Total
Width (m)
Main Carriageway 2 X 21.250 42.5
Median 1 X 4.50 4.5
Varies 2 X 11.50 23
Total 70
Type 4 - Dual 4-lane (8 - Lane Divided) Carriageway in Plain or Rolling Terrain without Service Road
Main Carriageway 2 X 14.00 28
Median including shyness 1 X 6.00 6
Paved shoulder 2 X 1.50 3
Earthen Shoulders 2 X 2.00 4
Utility Corridor 2 X 2.00 4
Hedge Like Species 2 X 1.00 2
Varies 2 X 9.50 19
Space left for future Widening 2 X 12.00 24
Total 90
Type 5 - Dual 4-lane (8 - Lane Divided) Carriageway in Plain or Rolling Terrain with Service Road
Main Carriageway 2 X 14.00 28
Median including shyness 1 X 6.00 6
Paved shoulder 2 X 1.50 3
Earthen Shoulders 2 X 2.00 4
Service Road 2 X 9.00 18
Earthen Shoulders between Service Road 2 X 2.00 4
Varies 2 X 1.50 3
Utility Corridor 2 X 2.00 4
Total 70
Type 3 - Dual 4-lane (8 - Lane Divided) Flyover/VUP/LVUP Approach with Slip Roads
Main Carriageway 2 X 21.250 42.5
Median 1 X 4.50 4.5
Separator between Slip Road and Main Carriageway 2 X 4.00 8
Slip Road 2 X 9.00 18
Earthen Shoulder 2 X 1.00 2
Earthen Drain & Varies 2 X 5.50 11
Utility Corridor 2 X 2.00 4
Total 90
Type 6A - Dual 4-lane (8 - Lane Divided) Flyover/VUP/LVUP Approach
Main Carriageway 2 X 21.250 42.5
Median 1 X 4.50 4.5

Consultancy Services for preparation of DPR for development of Economic Corridors, Inter Corridors, Feeder Routes and National corridors (GQ and NS-EW Corridors) to improve the efficiency of freight movement in India under Bharatmala Pariyojana (Chennai-Salem)
Feasibility Report Volume – I (Main Report)
Preliminary Designs
Feedback Infra Pvt. Ltd. 7-3 National Highways Authority of India
Element Width (m) Total
Width (m)
Varies 2 X 11.50 43
Total 90
Type -7 - 4-lane Divided Carriageway with Paved Shoulders for Realignment/Bypass in Rural Area
Main Carriageway 2 X 7.00 14
Median including shyness 1 X 5.00 5
Paved shoulder 2 X 1.50 3
Earthen Shoulders 2 X 2.00 4
Space for Services 2 X 2.00 4
Space left for Future Widening and Earthen Drain 2 X 15.00 30
Total 60
Type -7A - 4-lane Divided Carriageway with Paved Shoulders for Concentric Widening in Rural Area
Main Carriageway 2 X 7.00 14
Median including shyness 1 X 5.00 5
Paved shoulder 2 X 1.50 3
Earthen Shoulders 2 X 2.00 4
Space for Services 2 X 2.00 4
Space left for Future Widening and Earthen Drain 2 X 15.00 30
Total 60
Type -7B - 4-lane Divided Carriageway with Paved Shoulders for Eccentric Widening in Rural Area
Main Carriageway 2 X 7.00 14
Median including shyness 1 X 5.00 5
Paved shoulder 2 X 1.50 3
Earthen Shoulders 2 X 2.00 4
Space for Services 2 X 2.00 4
Space left for Future Widening and Earthen Drain 2 X 15.00 30
Total 60
Type -8 - 4-lane Divided Carriageway with Lined Drain for Concentric Widening in Built - Up Area
Main Carriageway 2 X 7.00 14
Median including shyness 1 X 2.50 2.5
Paved shoulder 2 X 2.00 4
Earthen Shoulders 2 X 2.00 4
Earthen Shoulders on service road 2 X 1.50 3
Drain/Future Widening 2 X 5.25 10.5
Service Road 2 X 7.50 15
Drain 2 X 1.50 3
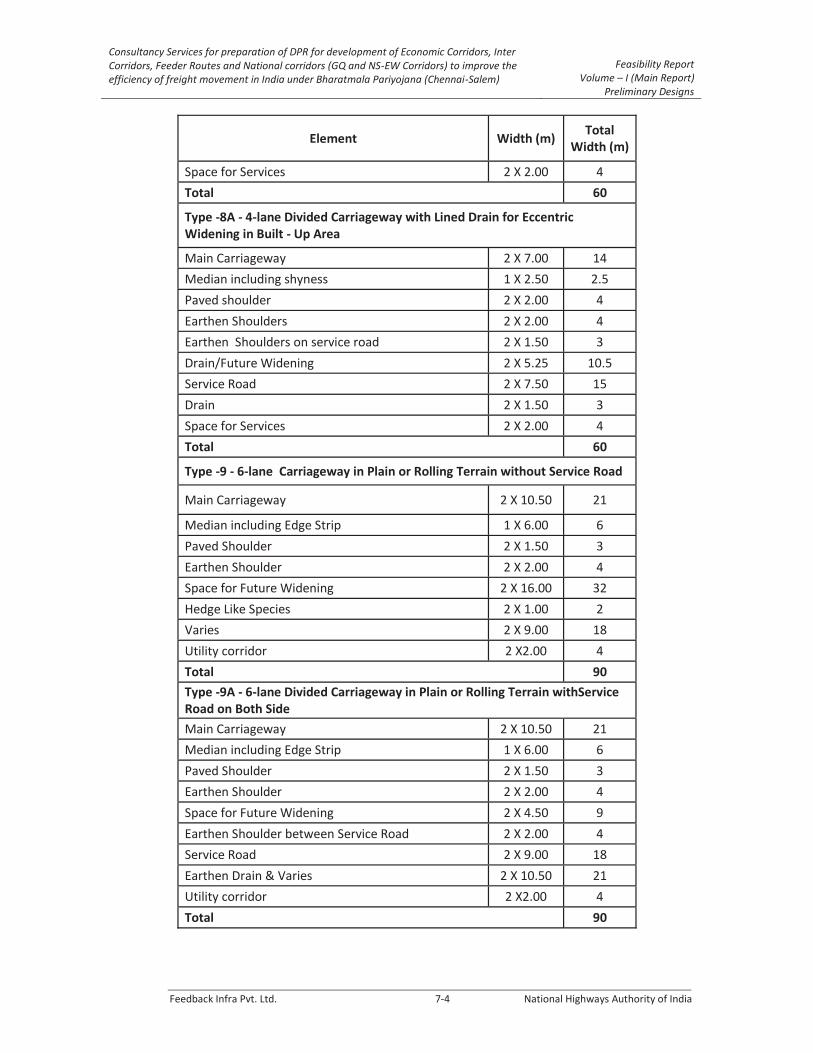
Consultancy Services for preparation of DPR for development of Economic Corridors, Inter Corridors, Feeder Routes and National corridors (GQ and NS-EW Corridors) to improve the efficiency of freight movement in India under Bharatmala Pariyojana (Chennai-Salem)
Feasibility Report Volume – I (Main Report)
Preliminary Designs
Feedback Infra Pvt. Ltd. 7-4 National Highways Authority of India
Element Width (m) Total
Width (m)
Space for Services 2 X 2.00 4
Total 60
Type -8A - 4-lane Divided Carriageway with Lined Drain for Eccentric Widening in Built - Up Area
Main Carriageway 2 X 7.00 14
Median including shyness 1 X 2.50 2.5
Paved shoulder 2 X 2.00 4
Earthen Shoulders 2 X 2.00 4
Earthen Shoulders on service road 2 X 1.50 3
Drain/Future Widening 2 X 5.25 10.5
Service Road 2 X 7.50 15
Drain 2 X 1.50 3
Space for Services 2 X 2.00 4
Total 60
Type -9 - 6-lane Carriageway in Plain or Rolling Terrain without Service Road
Main Carriageway 2 X 10.50 21
Median including Edge Strip 1 X 6.00 6
Paved Shoulder 2 X 1.50 3
Earthen Shoulder 2 X 2.00 4
Space for Future Widening 2 X 16.00 32
Hedge Like Species 2 X 1.00 2
Varies 2 X 9.00 18
Utility corridor 2 X2.00 4
Total 90
Type -9A - 6-lane Divided Carriageway in Plain or Rolling Terrain withService Road on Both Side
Main Carriageway 2 X 10.50 21
Median including Edge Strip 1 X 6.00 6
Paved Shoulder 2 X 1.50 3
Earthen Shoulder 2 X 2.00 4
Space for Future Widening 2 X 4.50 9
Earthen Shoulder between Service Road 2 X 2.00 4
Service Road 2 X 9.00 18
Earthen Drain & Varies 2 X 10.50 21
Utility corridor 2 X2.00 4
Total 90

Cons
ulta
ncy
serv
ices f
or P
repa
ratio
n of
Det
aile
d Pr
ojec
t Rep
ort o
f Eco
nom
ic Co
rrid
ors,
Inte
r Cor
ridor
s, Fe
eder
rout
es a
nd N
atio
nal C
orrid
ors u
nder
Bh
arat
mal
a Pa
riyoj
ana
(Lot
-6/P
acka
ge -1
) Fe
asib
ility
Rep
ort
Volu
me –
I (M
ain
Repo
rt)
P
relim
inar
y De
signs
Fee
db
ack
Infr
a P
vt. L
td.
7-5
N
atio
nal
Hig
hw
ays
Au
tho
rity
of
Ind
ia

Cons
ulta
ncy
serv
ices f
or P
repa
ratio
n of
Det
aile
d Pr
ojec
t Rep
ort o
f Eco
nom
ic Co
rrid
ors,
Inte
r Cor
ridor
s, Fe
eder
rout
es a
nd N
atio
nal C
orrid
ors u
nder
Bh
arat
mal
a Pa
riyoj
ana
(Lot
-6/P
acka
ge -1
) Fe
asib
ility
Rep
ort
Volu
me –
I (M
ain
Repo
rt)
P
relim
inar
y De
signs
Fee
db
ack
Infr
a P
vt. L
td.
7-6
N
atio
nal
Hig
hw
ays
Au
tho
rity
of
Ind
ia

Cons
ulta
ncy
serv
ices f
or P
repa
ratio
n of
Det
aile
d Pr
ojec
t Rep
ort o
f Eco
nom
ic Co
rrid
ors,
Inte
r Cor
ridor
s, Fe
eder
rout
es a
nd N
atio
nal C
orrid
ors u
nder
Bh
arat
mal
a Pa
riyoj
ana
(Lot
-6/P
acka
ge -1
) Fe
asib
ility
Rep
ort
Volu
me –
I (M
ain
Repo
rt)
P
relim
inar
y De
signs
Fee
db
ack
Infr
a P
vt. L
td.
7-7
N
atio
nal
Hig
hw
ays
Au
tho
rity
of
Ind
ia

Cons
ulta
ncy
serv
ices f
or P
repa
ratio
n of
Det
aile
d Pr
ojec
t Rep
ort o
f Eco
nom
ic Co
rrid
ors,
Inte
r Cor
ridor
s, Fe
eder
rout
es a
nd N
atio
nal C
orrid
ors u
nder
Bh
arat
mal
a Pa
riyoj
ana
(Lot
-6/P
acka
ge -1
) Fe
asib
ility
Rep
ort
Volu
me –
I (M
ain
Repo
rt)
P
relim
inar
y De
signs
Fee
db
ack
Infr
a P
vt. L
td.
7-8
N
atio
nal
Hig
hw
ays
Au
tho
rity
of
Ind
ia
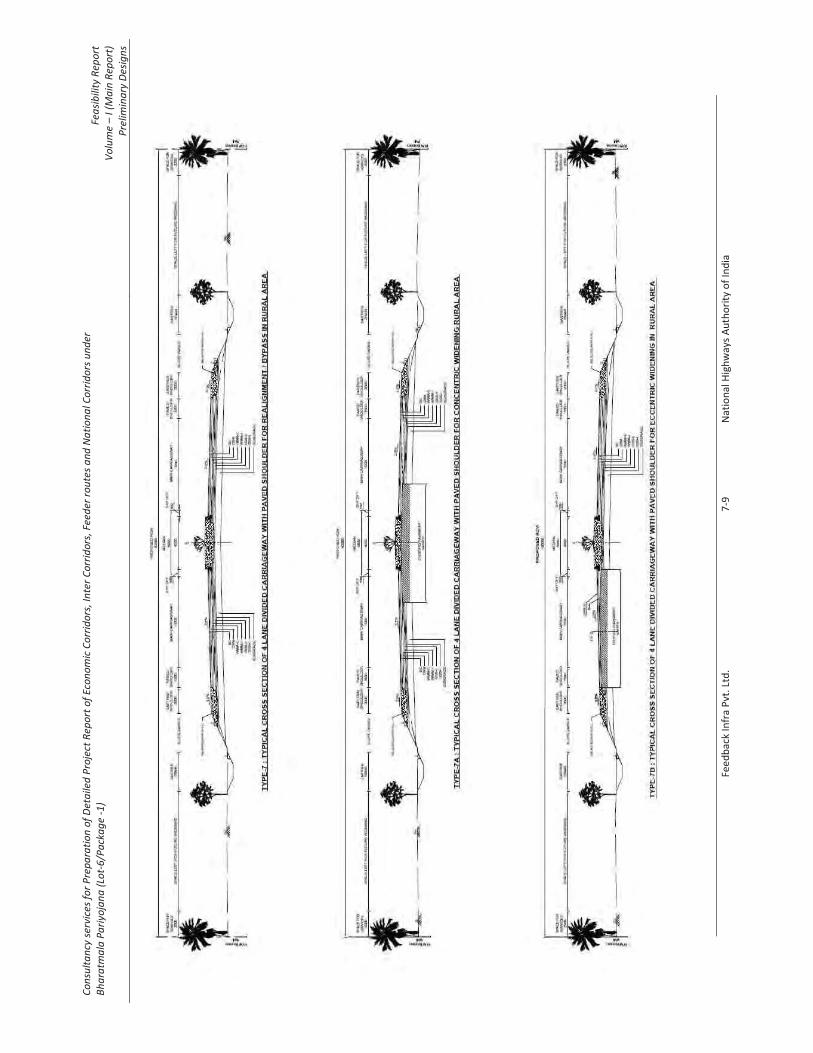
Cons
ulta
ncy
serv
ices f
or P
repa
ratio
n of
Det
aile
d Pr
ojec
t Rep
ort o
f Eco
nom
ic Co
rrid
ors,
Inte
r Cor
ridor
s, Fe
eder
rout
es a
nd N
atio
nal C
orrid
ors u
nder
Bh
arat
mal
a Pa
riyoj
ana
(Lot
-6/P
acka
ge -1
) Fe
asib
ility
Rep
ort
Volu
me –
I (M
ain
Repo
rt)
P
relim
inar
y De
signs
Fee
db
ack
Infr
a P
vt. L
td.
7-9
N
atio
nal
Hig
hw
ays
Au
tho
rity
of
Ind
ia

Cons
ulta
ncy
serv
ices f
or P
repa
ratio
n of
Det
aile
d Pr
ojec
t Rep
ort o
f Eco
nom
ic Co
rrid
ors,
Inte
r Cor
ridor
s, Fe
eder
rout
es a
nd N
atio
nal C
orrid
ors u
nder
Bh
arat
mal
a Pa
riyoj
ana
(Lot
-6/P
acka
ge -1
) Fe
asib
ility
Rep
ort
Volu
me –
I (M
ain
Repo
rt)
P
relim
inar
y De
signs
Fee
db
ack
Infr
a P
vt. L
td.
7-1
0
Nat
ion
al H
igh
way
s A
uth
ori
ty o
f In
dia

Cons
ulta
ncy
serv
ices f
or P
repa
ratio
n of
Det
aile
d Pr
ojec
t Rep
ort o
f Eco
nom
ic Co
rrid
ors,
Inte
r Cor
ridor
s, Fe
eder
rout
es a
nd N
atio
nal C
orrid
ors u
nder
Bh
arat
mal
a Pa
riyoj
ana
(Lot
-6/P
acka
ge -1
) Fe
asib
ility
Rep
ort
Volu
me –
I (M
ain
Repo
rt)
P
relim
inar
y De
signs
Fee
db
ack
Infr
a P
vt. L
td.
7-1
1
Nat
ion
al H
igh
way
s A
uth
ori
ty o
f In
dia

Consultancy Services for preparation of DPR for development of Economic Corridors, Inter Corridors, Feeder Routes and National corridors (GQ and NS-EW Corridors) to improve the efficiency of freight movement in India under Bharatmala Pariyojana (Chennai-Salem)
Feasibility Report Volume – I (Main Report)
Preliminary Designs
Feedback Infra Pvt. Ltd. 7-12 National Highways Authority of India
7.2 SCHEME OF WIDENING
The existing project stretch under study has multidimensional facets in terms of geometry, pavement condition, existing utilities, religious structures, etc. and considering all these aspects the section-wise policy is adopted for widening based on the initial investigations. The adopted type of widening scheme is summarised in Table 7-2.
Table 7-2: Widening Scheme for Chennai – Salem Main Alignment
S.No Design Chainage
Length (m) Type of
TCS Remarks
From To
1 0+000 1+700 1700 2
NH-179B
2 1+700 2+700 1000 3
3 2+700 6+110 3410 1
4 6+110 6+200 90 3A
5 6+200 6+810 610 3
6 6+810 7+990 1180 2
7 7+990 8+890 900 3
8 8+890 10+000 1110 2
9 10+000 10+890 890 1
10 10+890 11+000 110 3A
11 11+000 11+600 600 3
12 11+600 11+790 190 3A
13 11+790 13+020 1230 1
14 13+020 13+920 900 3A
15 13+920 14+960 1040 1
16 14+960 15+000 40 3A
17 15+000 15+960 960 3
18 15+960 18+720 2760 2
19 18+720 19+620 900 3
20 19+620 20+590 970 2
21 20+590 21+290 700 3
22 21+290 23+460 2170 2
23 23+460 25+200 1740 3
24 25+200 25+600 400 1
25 25+600 25+820 220 4
26 25+820 26+000 180 6A
27 26+000 26+400 400 6
28 26+400 26+720 320 6A
29 26+720 27+640 920 4
30 27+640 28+540 900 6A
31 28+540 30+360 1820 4
32 30+360 31+260 900 6A
33 31+260 34+065 2805 4
34 34+065 34+965 900 6A
35 34+965 37+845 2880 4

Consultancy Services for preparation of DPR for development of Economic Corridors, Inter Corridors, Feeder Routes and National corridors (GQ and NS-EW Corridors) to improve the efficiency of freight movement in India under Bharatmala Pariyojana (Chennai-Salem)
Feasibility Report Volume – I (Main Report)
Preliminary Designs
Feedback Infra Pvt. Ltd. 7-13 National Highways Authority of India
S.No Design Chainage
Length (m) Type of
TCS Remarks
From To
36 37+845 38+545 700 6A
NH-179B
37 38+545 43+210 4665 4
38 43+210 44+210 1000 6A
39 44+210 47+000 2790 4
40 47+000 47+600 600 5
41 47+600 48+000 400 6
42 48+000 48+300 300 6A
43 48+300 53+190 4890 4
44 53+190 53+890 700 6A
45 53+890 56+300 2410 4
46 56+300 56+555 255 5
47 56+555 57+100 545 6
48 57+100 57+455 355 6A
49 57+455 59+610 2155 4
50 59+610 60+610 1000 6A
51 60+610 62+270 1660 4
52 62+270 62+970 700 6A
53 62+970 65+570 2600 4
54 65+570 66+270 700 6A
55 66+270 66+895 625 4
56 66+895 67+895 1000 6
57 67+895 71+700 3805 4
58 71+700 72+400 700 6A
59 72+400 74+840 2440 4
60 74+840 75+740 900 6A
61 75+740 77+830 2090 4
62 77+830 78+530 700 6A
63 78+530 78+950 420 4
64 78+950 79+850 900 6A
65 79+850 82+970 3120 4
66 82+970 83+200 230 6A
67 83+200 83+500 300 6
68 83+500 83+870 370 6A
69 83+870 84+500 630 4
70 84+500 85+790 1290 5
71 85+790 86+400 610 6
72 86+400 86+690 290 6A
73 86+690 87+400 710 4
74 87+400 88+100 700 5
75 88+100 88+600 500 6
76 88+600 88+800 200 6A
77 88+800 93+100 4300 4

Consultancy Services for preparation of DPR for development of Economic Corridors, Inter Corridors, Feeder Routes and National corridors (GQ and NS-EW Corridors) to improve the efficiency of freight movement in India under Bharatmala Pariyojana (Chennai-Salem)
Feasibility Report Volume – I (Main Report)
Preliminary Designs
Feedback Infra Pvt. Ltd. 7-14 National Highways Authority of India
S.No Design Chainage
Length (m) Type of
TCS Remarks
From To
78 93+100 94+005 905 5
NH-179B
79 94+005 95+005 1000 6
80 95+005 95+480 475 4
81 95+480 96+180 700 6A
82 96+180 98+480 2300 4
83 98+480 99+180 700 6A
84 99+180 105+160 5980 4
85 105+160 106+060 900 6A
86 106+060 110+105 4045 4
87 110+105 110+805 700 6A
88 110+805 115+300 4495 4
89 115+300 116+200 900 6A
90 116+200 121+260 5060 4
91 121+260 121+600 340 6A
92 121+600 122+260 660 6
93 122+260 123+170 910 6
94 123+170 125+050 1880 4
95 125+050 125+300 250 6A
96 125+300 125+950 650 6
97 125+950 128+000 2050 5
98 128+000 131+000 3000 4
99 131+000 131+900 900 6A
100 131+900 134+300 2400 4
101 134+300 135+000 700 5
102 135+000 137+000 2000 4
103 137+000 137+730 730 5
104 137+730 138+300 570 6
105 138+300 138+630 330 6A
106 138+630 141+200 2570 4
107 141+200 141+400 200 5
108 141+400 141+800 400 6
109 141+800 142+100 300 6A
110 142+100 142+930 830 4
111 142+930 143+830 900 6A
112 143+830 146+710 2880 4
113 146+710 147+410 700 6A
114 147+410 150+100 2690 4
115 150+100 150+310 210 5
116 150+310 150+900 590 6
117 150+900 151+210 310 6A
118 151+210 156+000 4790 4
119 156+000 157+380 1380 5
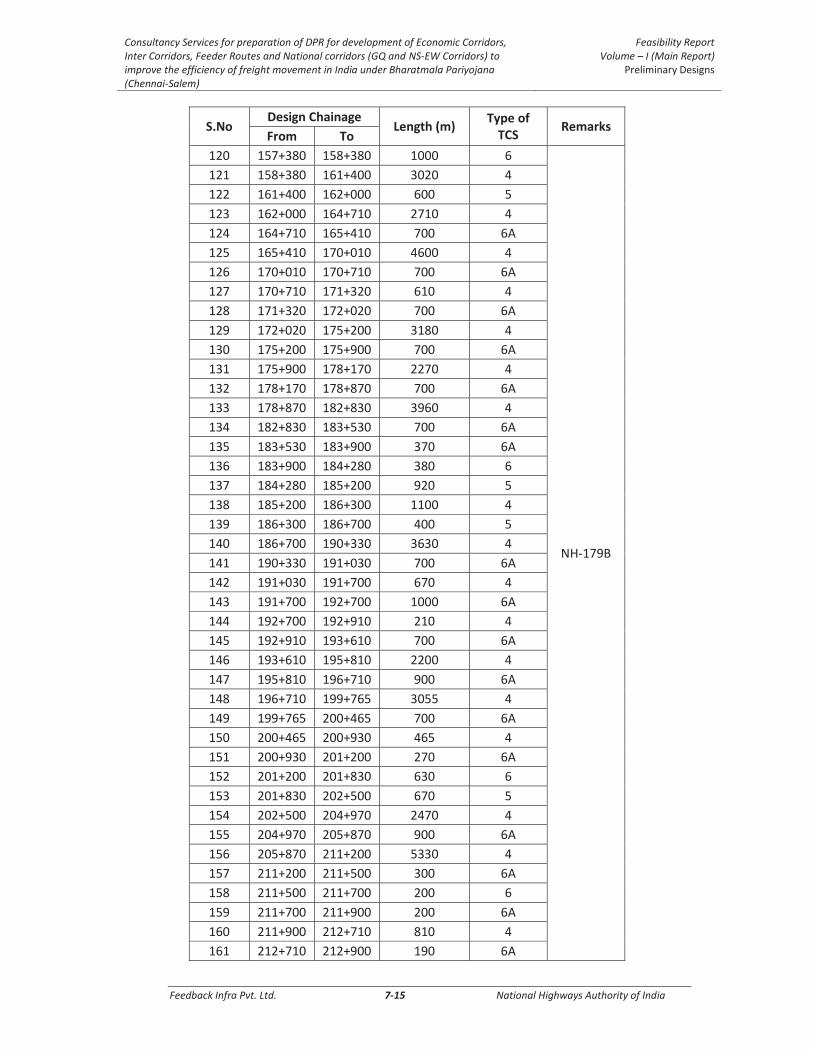
Consultancy Services for preparation of DPR for development of Economic Corridors, Inter Corridors, Feeder Routes and National corridors (GQ and NS-EW Corridors) to improve the efficiency of freight movement in India under Bharatmala Pariyojana (Chennai-Salem)
Feasibility Report Volume – I (Main Report)
Preliminary Designs
Feedback Infra Pvt. Ltd. 7-15 National Highways Authority of India
S.No Design Chainage
Length (m) Type of
TCS Remarks
From To
120 157+380 158+380 1000 6
NH-179B
121 158+380 161+400 3020 4
122 161+400 162+000 600 5
123 162+000 164+710 2710 4
124 164+710 165+410 700 6A
125 165+410 170+010 4600 4
126 170+010 170+710 700 6A
127 170+710 171+320 610 4
128 171+320 172+020 700 6A
129 172+020 175+200 3180 4
130 175+200 175+900 700 6A
131 175+900 178+170 2270 4
132 178+170 178+870 700 6A
133 178+870 182+830 3960 4
134 182+830 183+530 700 6A
135 183+530 183+900 370 6A
136 183+900 184+280 380 6
137 184+280 185+200 920 5
138 185+200 186+300 1100 4
139 186+300 186+700 400 5
140 186+700 190+330 3630 4
141 190+330 191+030 700 6A
142 191+030 191+700 670 4
143 191+700 192+700 1000 6A
144 192+700 192+910 210 4
145 192+910 193+610 700 6A
146 193+610 195+810 2200 4
147 195+810 196+710 900 6A
148 196+710 199+765 3055 4
149 199+765 200+465 700 6A
150 200+465 200+930 465 4
151 200+930 201+200 270 6A
152 201+200 201+830 630 6
153 201+830 202+500 670 5
154 202+500 204+970 2470 4
155 204+970 205+870 900 6A
156 205+870 211+200 5330 4
157 211+200 211+500 300 6A
158 211+500 211+700 200 6
159 211+700 211+900 200 6A
160 211+900 212+710 810 4
161 212+710 212+900 190 6A
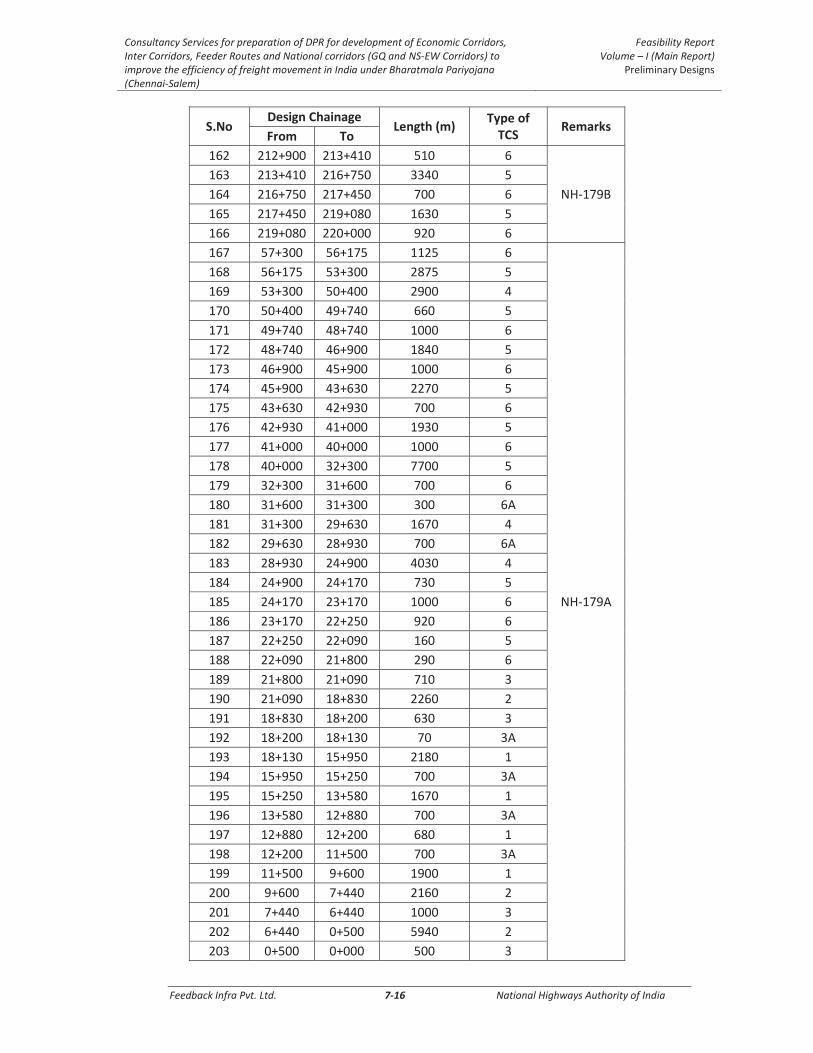
Consultancy Services for preparation of DPR for development of Economic Corridors, Inter Corridors, Feeder Routes and National corridors (GQ and NS-EW Corridors) to improve the efficiency of freight movement in India under Bharatmala Pariyojana (Chennai-Salem)
Feasibility Report Volume – I (Main Report)
Preliminary Designs
Feedback Infra Pvt. Ltd. 7-16 National Highways Authority of India
S.No Design Chainage
Length (m) Type of
TCS Remarks
From To
162 212+900 213+410 510 6
NH-179B
163 213+410 216+750 3340 5
164 216+750 217+450 700 6
165 217+450 219+080 1630 5
166 219+080 220+000 920 6
167 57+300 56+175 1125 6
NH-179A
168 56+175 53+300 2875 5
169 53+300 50+400 2900 4
170 50+400 49+740 660 5
171 49+740 48+740 1000 6
172 48+740 46+900 1840 5
173 46+900 45+900 1000 6
174 45+900 43+630 2270 5
175 43+630 42+930 700 6
176 42+930 41+000 1930 5
177 41+000 40+000 1000 6
178 40+000 32+300 7700 5
179 32+300 31+600 700 6
180 31+600 31+300 300 6A
181 31+300 29+630 1670 4
182 29+630 28+930 700 6A
183 28+930 24+900 4030 4
184 24+900 24+170 730 5
185 24+170 23+170 1000 6
186 23+170 22+250 920 6
187 22+250 22+090 160 5
188 22+090 21+800 290 6
189 21+800 21+090 710 3
190 21+090 18+830 2260 2
191 18+830 18+200 630 3
192 18+200 18+130 70 3A
193 18+130 15+950 2180 1
194 15+950 15+250 700 3A
195 15+250 13+580 1670 1
196 13+580 12+880 700 3A
197 12+880 12+200 680 1
198 12+200 11+500 700 3A
199 11+500 9+600 1900 1
200 9+600 7+440 2160 2
201 7+440 6+440 1000 3
202 6+440 0+500 5940 2
203 0+500 0+000 500 3

Consultancy Services for preparation of DPR for development of Economic Corridors, Inter Corridors, Feeder Routes and National corridors (GQ and NS-EW Corridors) to improve the efficiency of freight movement in India under Bharatmala Pariyojana (Chennai-Salem)
Feasibility Report Volume – I (Main Report)
Preliminary Designs
Feedback Infra Pvt. Ltd. 7-17 National Highways Authority of India
Table 7-3: Widening Scheme for Kanchipuram Spur
Sl. No
Design Chainage Design Length
(m)
Type of C/S
Type of Widening From To
1 0+000 0+200 200 8A Ecentric Right
2 0+200 0+500 300 8A Ecentric Left
3 0+500 0+700 200 8A Ecentric Right
4 0+700 0+900 200 8A Ecentric Left
5 0+900 2+100 1200 8A Ecentric Right
6 2+100 2+700 600 8A Ecentric Left
7 2+700 2+900 200 8A Ecentric Right
8 2+900 3+200 300 8A Ecentric Left
9 3+200 3+360 160 8A Ecentric Right
10 3+360 3+560 200 8A Ecentric Left
11 3+560 3+700 140 8A Ecentric Right
12 3+700 3+920 220 8A Ecentric Left
13 3+920 4+100 180 8A Ecentric Right
14 4+100 5+000 900 8 Concentric
15 5+000 5+200 200 8A Ecentric Right
16 5+200 5+300 100 8A Ecentric Left
17 5+300 5+400 100 8A Ecentric Right
18 5+400 5+700 300 8A Ecentric Left
19 5+700 7+100 1400 8 Concentric
20 7+100 7+600 500 8A Curve Improvement
21 7+600 7+900 300 8 Concentric
22 7+900 8+080 180 8A Ecentric Left
23 8+080 8+700 620 8A Ecentric Right
24 8+700 11+100 2400 8 Concentric
25 11+100 11+420 320 8A Ecentric Left
26 11+420 11+900 480 8A Ecentric Right
27 11+900 12+150 250 8A Realignment
28 12+150 15+900 3750 8 Concentric
29 15+900 18+700 2800 7B Ecentric Right
30 18+700 22+900 4200 8A Ecentric Right
31 22+900 23+300 400 8A Ecentric Left
32 23+300 24+100 800 8 Concentric
33 24+100 25+500 1400 8A Ecentric Right
34 25+500 29+635 4135 8 Concentric
Table 7-4: Widening Scheme for Chetpet Spur
Sl. No Design Chainage Design Length
(m) Type of C/S
Type of Widening From To
1 0+000 3+300 3300 7B Eccentric Lift
2 3+300 4+900 1600 7B Eccentric Right

Consultancy Services for preparation of DPR for development of Economic Corridors, Inter Corridors, Feeder Routes and National corridors (GQ and NS-EW Corridors) to improve the efficiency of freight movement in India under Bharatmala Pariyojana (Chennai-Salem)
Feasibility Report Volume – I (Main Report)
Preliminary Designs
Feedback Infra Pvt. Ltd. 7-18 National Highways Authority of India
Table 7-5: Widening Scheme for Tiruvanamalai Spur
Sl. No
Design Chainage Design Length
(m)
Type of C/S
Type of Widening From To
1 0+000 0+900 900 7 Realignment
2 0+900 1+300 400 7B Eccentric Left
3 1+300 2+200 900 7B Eccentric Right
4 2+200 3+600 1400 8 Concentric
5 3+600 4+100 500 8A Eccentric Left
6 4+100 4+700 600 7B Eccentric Left
7 4+700 6+300 1600 8 Concentic
8 6+300 6+700 400 7A Concentic
9 6+700 7+400 700 7B Ecentric left
10 7+400 7+900 500 7B Ecentric Right
11 7+900 8+600 700 7B Ecentric left
12 8+600 9+200 600 7B Ecentric Right
13 9+200 9+700 500 8 Concentic
14 9+700 10+300 600 7B Ecentric Right
15 10+300 10+900 600 8A Ecentric Right
16 10+900 11+600 700 8 Concentric
17 11+600 13+600 2000 7B Ecentric Right
18 13+600 13+900 300 8A Ecentric left
19 13+900 14+400 500 8A Ecentric Right
20 14+400 15+200 800 8A Ecentric left
21 15+200 16+200 1000 8 Concentic
7.3 Curve Details
Table 7-6: Curve Details
S.No Design Chainage Radius Design Speed Remarks
1 1+064 700 120
NH-179B
2 2+174 700 120
3 3+046 3000 120
4 4+734 3000 120
5 6+453 3000 120
6 9+969 3000 120
7 11+514 700 120
8 14+026 3000 120
9 21+115 1000 120
10 23+449 700 120
11 25+916 2000 120
12 28+911 5000 120
13 31+391 3000 120
14 34+159 3000 120

Consultancy Services for preparation of DPR for development of Economic Corridors, Inter Corridors, Feeder Routes and National corridors (GQ and NS-EW Corridors) to improve the efficiency of freight movement in India under Bharatmala Pariyojana (Chennai-Salem)
Feasibility Report Volume – I (Main Report)
Preliminary Designs
Feedback Infra Pvt. Ltd. 7-19 National Highways Authority of India
S.No Design Chainage Radius Design Speed Remarks
15 39+983 3000 120
NH-179B
16 44+902 3000 120
17 47+302 3000 120
18 49+511 5000 120
19 51+646 3000 120
20 59+131 2000 120
21 64+416 3000 120
22 67+242 3000 120
23 71+693 3000 120
24 78+333 3000 120
25 82+006 2000 120
26 84+773 2000 120
27 87+299 5000 120
28 91+458 3000 120
29 94+479 3000 120
30 97+321 2000 120
31 99+727 3000 120
32 103+043 10000 120
33 106+361 10000 120
34 109+162 3000 120
35 112+637 3000 120
36 120+768 3000 120
37 125+743 3000 120
38 130+599 3000 120
39 133+894 10000 120
40 138+179 10000 120
41 141+127 3000 120
42 145+229 3000 120
43 150+564 3000 120
44 155+100 3000 120
45 164+931 3000 120
46 170+990 3000 120
47 179+478 2000 120
48 184+142 3000 120
49 189+583 2200 120
50 192+270 3000 120
51 200+790 3000 120
52 208+097 3000 120
53 214+980 3000 120
54 53+036 3000 120
NH-179A 55 50+646 3000 120
56 48+955 4000 120
57 43+586 3000 120
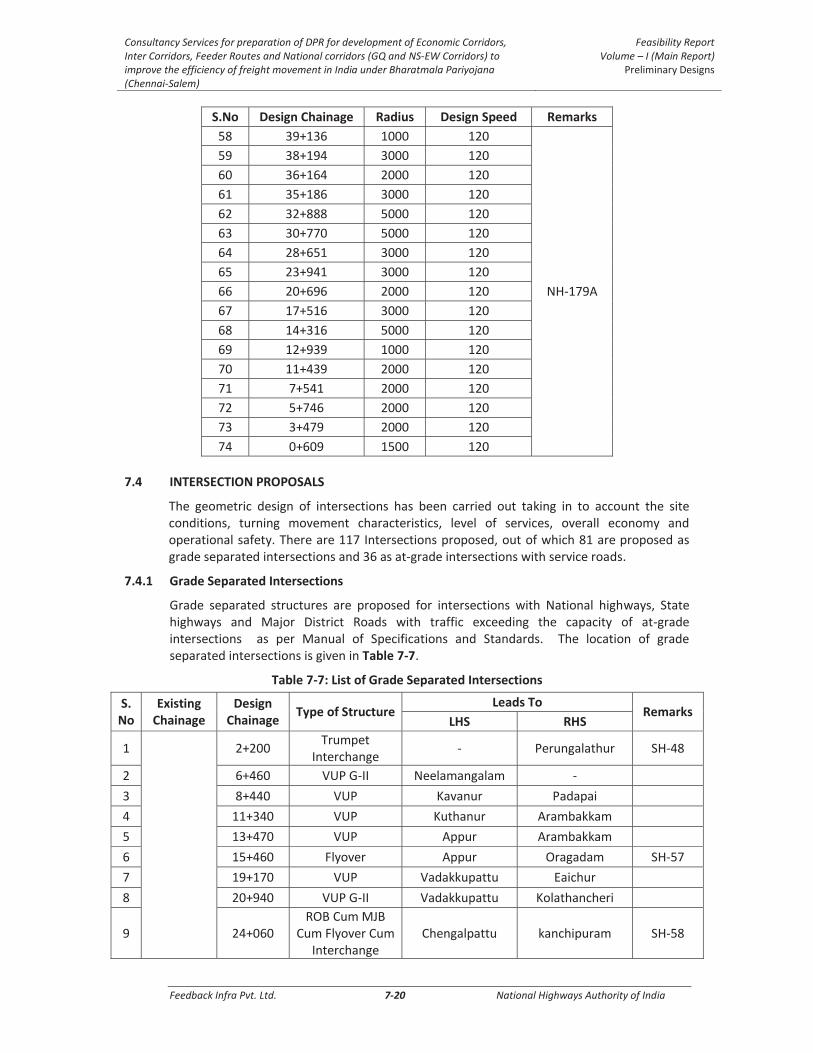
Consultancy Services for preparation of DPR for development of Economic Corridors, Inter Corridors, Feeder Routes and National corridors (GQ and NS-EW Corridors) to improve the efficiency of freight movement in India under Bharatmala Pariyojana (Chennai-Salem)
Feasibility Report Volume – I (Main Report)
Preliminary Designs
Feedback Infra Pvt. Ltd. 7-20 National Highways Authority of India
S.No Design Chainage Radius Design Speed Remarks
58 39+136 1000 120
NH-179A
59 38+194 3000 120
60 36+164 2000 120
61 35+186 3000 120
62 32+888 5000 120
63 30+770 5000 120
64 28+651 3000 120
65 23+941 3000 120
66 20+696 2000 120
67 17+516 3000 120
68 14+316 5000 120
69 12+939 1000 120
70 11+439 2000 120
71 7+541 2000 120
72 5+746 2000 120
73 3+479 2000 120
74 0+609 1500 120
7.4 INTERSECTION PROPOSALS
The geometric design of intersections has been carried out taking in to account the site conditions, turning movement characteristics, level of services, overall economy and operational safety. There are 117 Intersections proposed, out of which 81 are proposed as grade separated intersections and 36 as at-grade intersections with service roads.
7.4.1 Grade Separated Intersections
Grade separated structures are proposed for intersections with National highways, State highways and Major District Roads with traffic exceeding the capacity of at-grade intersections as per Manual of Specifications and Standards. The location of grade separated intersections is given in Table 7-7.
Table 7-7: List of Grade Separated Intersections
S.No
Existing Chainage
Design Chainage
Type of Structure Leads To
Remarks LHS RHS
1
2+200 Trumpet
Interchange - Perungalathur SH-48
2 6+460 VUP G-II Neelamangalam -
3 8+440 VUP Kavanur Padapai
4 11+340 VUP Kuthanur Arambakkam
5 13+470 VUP Appur Arambakkam
6 15+460 Flyover Appur Oragadam SH-57
7 19+170 VUP Vadakkupattu Eaichur
8 20+940 VUP G-II Vadakkupattu Kolathancheri
9 24+060 ROB Cum MJB
Cum Flyover Cum Interchange
Chengalpattu kanchipuram SH-58

Consultancy Services for preparation of DPR for development of Economic Corridors, Inter Corridors, Feeder Routes and National corridors (GQ and NS-EW Corridors) to improve the efficiency of freight movement in India under Bharatmala Pariyojana (Chennai-Salem)
Feasibility Report Volume – I (Main Report)
Preliminary Designs
Feedback Infra Pvt. Ltd. 7-21 National Highways Authority of India
S.No
Existing Chainage
Design Chainage
Type of Structure Leads To
Remarks LHS RHS
10
Greenfield
26+270 VUP Sathananchery Settancherry
11 28+090 VUP Karumbakkam Pazhveri
12 30+810 VUP Edamachi Tirumukkudal
13 34+515 VUP Alanjeri Tirumukkudal MDR-789
14 38+195 VUP G-II Vayalakkavoor Elayanarvelur
15 43+710 Flyover Uttiramerur kanchipuram SH-118A
16 47+950 VUP G-II Azhisoor -
17 53+540 VUP G-II Elanagar Perunagar
18 57+005 VUP Uttiramerur Sethupattu
19 60+110 MJB Cum Flyover Vandavasi kanchipuram SH-116
20 62+620 VUP G-II Nedungal Athi
21 65+920 VUP G-II Vinayagapuram Erumaivetti
22 67+395 Interchange Vandavasi Arcot SH-5
23 72+050 VUP G-II Thenmavanthal Thachanthangal
24 75+290 VUP Cheyyar Thavasi MDR-709
25 78+180 VUP G-II Melnemili Karivelpattu
26 79+400 VUP Vandavasi Arni MDR-43
27 83+420 VUP Kozhiplyur Peranamallur
28 86+240 MNB Cum VUP Mahadevimangal
am Alliyandal
29 88+450 VUP G-II Visamangalam
R.F Alliyandal
30 90+940 VOP @ 90+940 Anadimangalam Namathodu
31 94+505 Double Trumpet
Intechange Chetpet Arani SH-4
32 95+830 VUP G-II Kothandavady Appedu
33 98+830 VUP G-II Kolakkaravady Murukkananthal
34 103+480 VOP @ 103+480 Chetpet Polur SH-115
35 105+610 VUP Avalurpettai Devikapuram
36 110+455 VUP G-II Peranambakkam Semiyamangalam
37 115+750 VUP Padagam Pelasur
38 121+760 Flyover Tiruvanamalai Polur NH-38
39 122+670 Trumpet
Interchange Tiruvanamalai -
40 125+500 VUP Narthampoondi Kanji
41 131+450 VUP - Kilpotharai
42 138+180 VUP Tiruvanamalai Kanji MDR-503
43 141+750 VUP G-II Alathur Nandimangalam
44 143+380 MNB Cum VUP Vasudevanapattu Padiagragaram
45 147+060 VUP G-II Narasinghanallur Padiagraharm
46 150+760 VUP Melmudiyanur Muthanur MDR-800
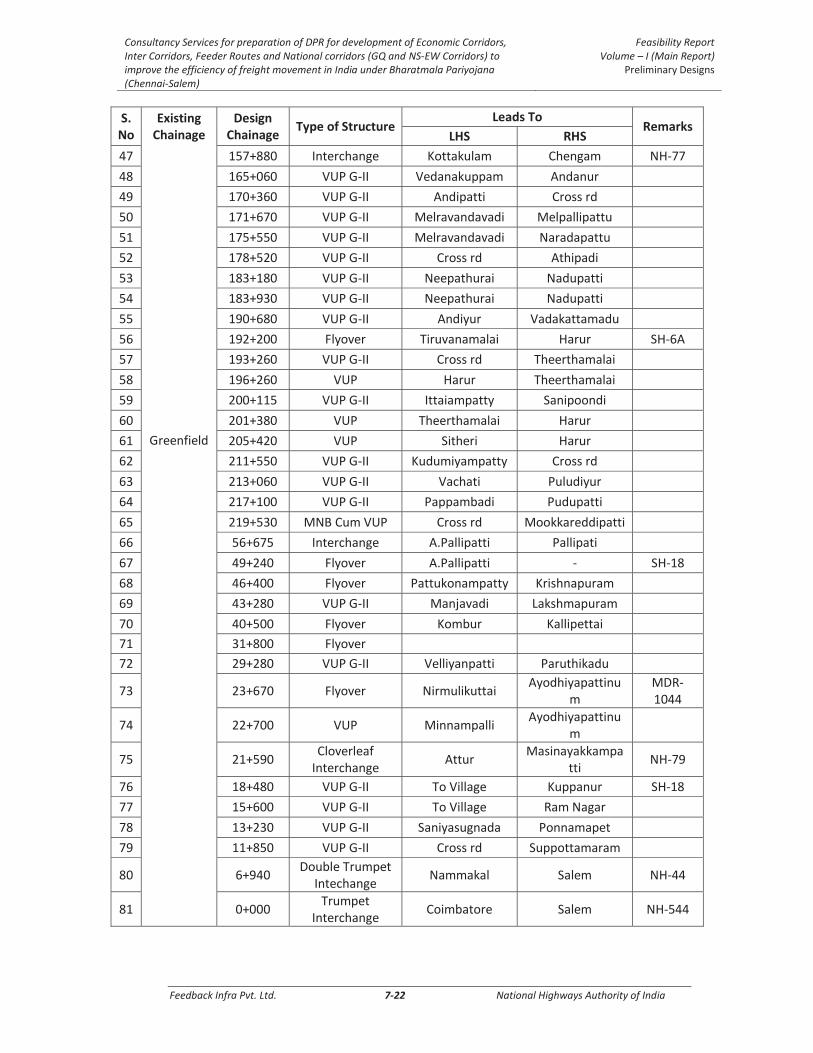
Consultancy Services for preparation of DPR for development of Economic Corridors, Inter Corridors, Feeder Routes and National corridors (GQ and NS-EW Corridors) to improve the efficiency of freight movement in India under Bharatmala Pariyojana (Chennai-Salem)
Feasibility Report Volume – I (Main Report)
Preliminary Designs
Feedback Infra Pvt. Ltd. 7-22 National Highways Authority of India
S.No
Existing Chainage
Design Chainage
Type of Structure Leads To
Remarks LHS RHS
47
Greenfield
157+880 Interchange Kottakulam Chengam NH-77
48 165+060 VUP G-II Vedanakuppam Andanur
49 170+360 VUP G-II Andipatti Cross rd
50 171+670 VUP G-II Melravandavadi Melpallipattu
51 175+550 VUP G-II Melravandavadi Naradapattu
52 178+520 VUP G-II Cross rd Athipadi
53 183+180 VUP G-II Neepathurai Nadupatti
54 183+930 VUP G-II Neepathurai Nadupatti
55 190+680 VUP G-II Andiyur Vadakattamadu
56 192+200 Flyover Tiruvanamalai Harur SH-6A
57 193+260 VUP G-II Cross rd Theerthamalai
58 196+260 VUP Harur Theerthamalai
59 200+115 VUP G-II Ittaiampatty Sanipoondi
60 201+380 VUP Theerthamalai Harur
61 205+420 VUP Sitheri Harur
62 211+550 VUP G-II Kudumiyampatty Cross rd
63 213+060 VUP G-II Vachati Puludiyur
64 217+100 VUP G-II Pappambadi Pudupatti
65 219+530 MNB Cum VUP Cross rd Mookkareddipatti
66 56+675 Interchange A.Pallipatti Pallipati
67 49+240 Flyover A.Pallipatti - SH-18
68 46+400 Flyover Pattukonampatty Krishnapuram
69 43+280 VUP G-II Manjavadi Lakshmapuram
70 40+500 Flyover Kombur Kallipettai
71 31+800 Flyover
72 29+280 VUP G-II Velliyanpatti Paruthikadu
73 23+670 Flyover Nirmulikuttai Ayodhiyapattinu
m MDR-1044
74 22+700 VUP Minnampalli Ayodhiyapattinu
m
75 21+590 Cloverleaf
Interchange Attur
Masinayakkampatti
NH-79
76 18+480 VUP G-II To Village Kuppanur SH-18
77 15+600 VUP G-II To Village Ram Nagar
78 13+230 VUP G-II Saniyasugnada Ponnamapet
79 11+850 VUP G-II Cross rd Suppottamaram
80 6+940 Double Trumpet
Intechange Nammakal Salem NH-44
81 0+000 Trumpet
Interchange Coimbatore Salem NH-544

Consultancy Services for preparation of DPR for development of Economic Corridors, Inter Corridors, Feeder Routes and National corridors (GQ and NS-EW Corridors) to improve the efficiency of freight movement in India under Bharatmala Pariyojana (Chennai-Salem)
Feasibility Report Volume – I (Main Report)
Preliminary Designs
Feedback Infra Pvt. Ltd. 7-23 National Highways Authority of India
7.4.2 At Grade Intersections
At grade intersection shall be provided with the intersecting roads at the following locations as given below, the cross roads shall be regarded and strengthen to have a crust as same of main carriageway for a length shown in the Ministry’s type designs for intersections along-with provision of adequate cross drainage structure on the cross roads. At grade Intersection Improvement proposals are given for in Table 7-8.
Table 7-8: List of At Grade Intersections with Service Roads
Sl.No Ex
KM Design
Chainage Type of
Intersection
Leads to
LHS RHS
1
NH-179B
0+010 Y To Mannivakkam Street -
2 0+100 T To Mannivakkam Street
3 0+580 + To Mannivakkam Street Sri Krishna Nagar
4 26+070 X Meyyur Penayur
5 47+120 X Kannikulam Vengaram
6 56+390 X Manampathi Perunagar
7 66+310 X Erumaivetti Vinayagapuram
8 83+300 X Pudur Ariyapadi
9 84+800 X Injimedu Sandirambadi
10 85+720 X Injimedu Alliyandal
11 93+150 X Anadimangalam Kinnanur
12 127+780 X Kanji Narthampoondi
13 134+400 X Agaram Sibbadi Kanji
14 135+000 Y Kanji
15 137+160 X Agaram Sibbadi Kanji
16 141+400 X Alathur Nandimangalam
17 150+200 Y Narasinghanallur
18 156+200 Y Muthanur
19 156+780 X Cross rd Se.Nachipattu
20 157+580 X Cross rd Se.Nachipattu
21 161+500 Y Chengam
22 161+900 Y Pakkiripalayam
23 184+920 X Neepathurai Vadakattamadu
24 202+230 X Harur Theerthamalai
25 213+840 X Vachati Kokkarapatti
26 215+180 X Pudhu Kokkarapatti Erumiyampatti
27 216+350 X Cross rd Erumiyampatti
28
NH-179A
56+380 X A.Pallipatti Pallipati
29 42+080 + Chinnamanjavadi Cross rd
30 40+800 + Kombur Cross rd
31 24+150 X Cross rd Kullampatty
32 17+350 X Cross rd Masinayakkampatti
33 8+380 X Cross rd Saravana Nagar
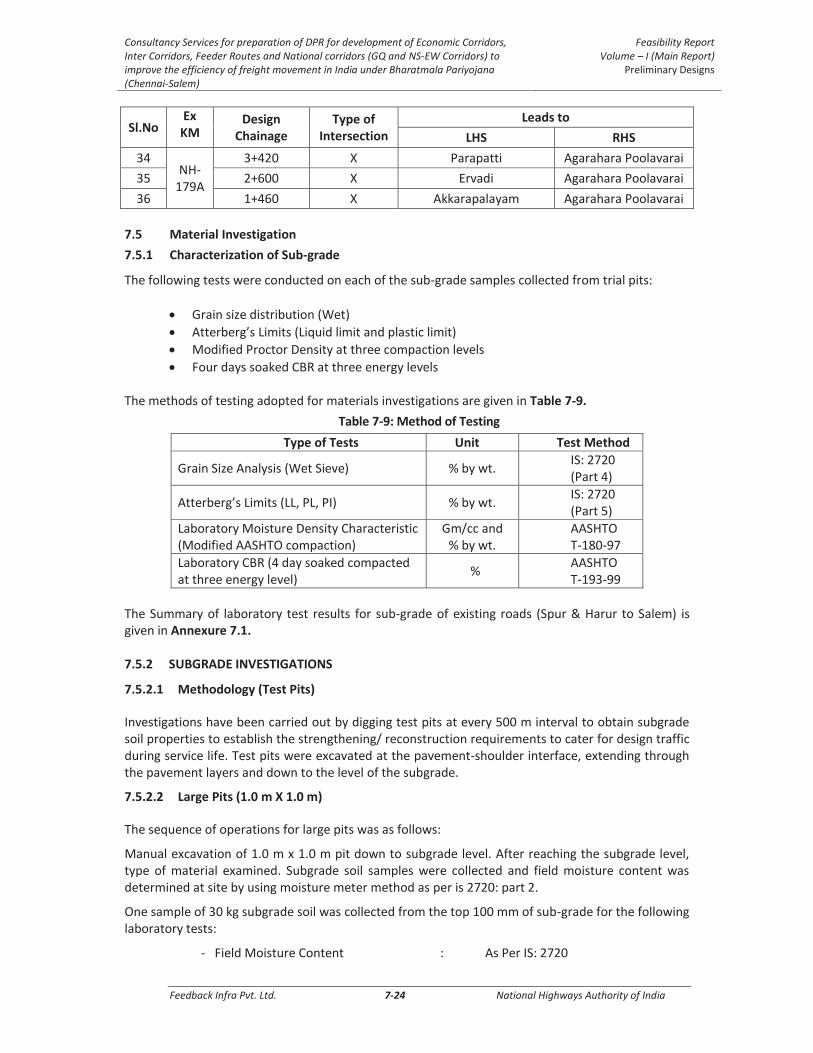
Consultancy Services for preparation of DPR for development of Economic Corridors, Inter Corridors, Feeder Routes and National corridors (GQ and NS-EW Corridors) to improve the efficiency of freight movement in India under Bharatmala Pariyojana (Chennai-Salem)
Feasibility Report Volume – I (Main Report)
Preliminary Designs
Feedback Infra Pvt. Ltd. 7-24 National Highways Authority of India
Sl.No Ex
KM Design
Chainage Type of
Intersection
Leads to
LHS RHS
34 NH-
179A
3+420 X Parapatti Agarahara Poolavarai
35 2+600 X Ervadi Agarahara Poolavarai
36 1+460 X Akkarapalayam Agarahara Poolavarai
7.5 Material Investigation
7.5.1 Characterization of Sub-grade
The following tests were conducted on each of the sub-grade samples collected from trial pits:
Grain size distribution (Wet)
Atterberg’s Limits (Liquid limit and plastic limit)
Modified Proctor Density at three compaction levels
Four days soaked CBR at three energy levels The methods of testing adopted for materials investigations are given in Table 7-9.
Table 7-9: Method of Testing
Type of Tests Unit Test Method
Grain Size Analysis (Wet Sieve) % by wt. IS: 2720 (Part 4)
Atterberg’s Limits (LL, PL, PI) % by wt. IS: 2720 (Part 5)
Laboratory Moisture Density Characteristic (Modified AASHTO compaction)
Gm/cc and % by wt.
AASHTO T-180-97
Laboratory CBR (4 day soaked compacted at three energy level)
% AASHTO T-193-99
The Summary of laboratory test results for sub-grade of existing roads (Spur & Harur to Salem) is given in Annexure 7.1. 7.5.2 SUBGRADE INVESTIGATIONS
7.5.2.1 Methodology (Test Pits)
Investigations have been carried out by digging test pits at every 500 m interval to obtain subgrade soil properties to establish the strengthening/ reconstruction requirements to cater for design traffic during service life. Test pits were excavated at the pavement-shoulder interface, extending through the pavement layers and down to the level of the subgrade.
7.5.2.2 Large Pits (1.0 m X 1.0 m)
The sequence of operations for large pits was as follows:
Manual excavation of 1.0 m x 1.0 m pit down to subgrade level. After reaching the subgrade level, type of material examined. Subgrade soil samples were collected and field moisture content was determined at site by using moisture meter method as per is 2720: part 2.
One sample of 30 kg subgrade soil was collected from the top 100 mm of sub-grade for the following laboratory tests:
- Field Moisture Content : As Per IS: 2720
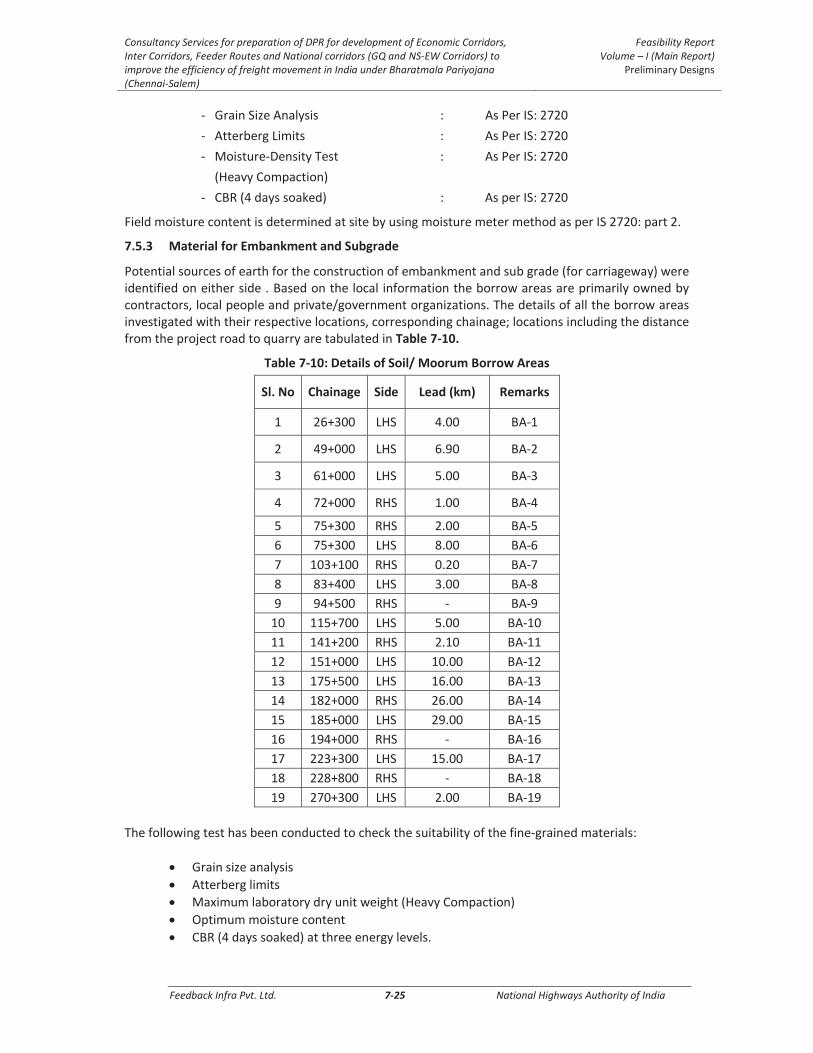
Consultancy Services for preparation of DPR for development of Economic Corridors, Inter Corridors, Feeder Routes and National corridors (GQ and NS-EW Corridors) to improve the efficiency of freight movement in India under Bharatmala Pariyojana (Chennai-Salem)
Feasibility Report Volume – I (Main Report)
Preliminary Designs
Feedback Infra Pvt. Ltd. 7-25 National Highways Authority of India
- Grain Size Analysis : As Per IS: 2720
- Atterberg Limits : As Per IS: 2720
- Moisture-Density Test : As Per IS: 2720
(Heavy Compaction)
- CBR (4 days soaked) : As per IS: 2720
Field moisture content is determined at site by using moisture meter method as per IS 2720: part 2.
7.5.3 Material for Embankment and Subgrade
Potential sources of earth for the construction of embankment and sub grade (for carriageway) were identified on either side . Based on the local information the borrow areas are primarily owned by contractors, local people and private/government organizations. The details of all the borrow areas investigated with their respective locations, corresponding chainage; locations including the distance from the project road to quarry are tabulated in Table 7-10.
Table 7-10: Details of Soil/ Moorum Borrow Areas
Sl. No Chainage Side Lead (km) Remarks
1 26+300 LHS 4.00 BA-1
2 49+000 LHS 6.90 BA-2
3 61+000 LHS 5.00 BA-3
4 72+000 RHS 1.00 BA-4
5 75+300 RHS 2.00 BA-5
6 75+300 LHS 8.00 BA-6
7 103+100 RHS 0.20 BA-7
8 83+400 LHS 3.00 BA-8
9 94+500 RHS - BA-9
10 115+700 LHS 5.00 BA-10
11 141+200 RHS 2.10 BA-11
12 151+000 LHS 10.00 BA-12
13 175+500 LHS 16.00 BA-13
14 182+000 RHS 26.00 BA-14
15 185+000 LHS 29.00 BA-15
16 194+000 RHS - BA-16
17 223+300 LHS 15.00 BA-17
18 228+800 RHS - BA-18
19 270+300 LHS 2.00 BA-19
The following test has been conducted to check the suitability of the fine-grained materials:
Grain size analysis
Atterberg limits
Maximum laboratory dry unit weight (Heavy Compaction)
Optimum moisture content
CBR (4 days soaked) at three energy levels.

Consultancy Services for preparation of DPR for development of Economic Corridors, Inter Corridors, Feeder Routes and National corridors (GQ and NS-EW Corridors) to improve the efficiency of freight movement in India under Bharatmala Pariyojana (Chennai-Salem)
Feasibility Report Volume – I (Main Report)
Preliminary Designs
Feedback Infra Pvt. Ltd. 7-26 National Highways Authority of India
7.5.4 Stone Aggregates
Stone quarries have been primarily identified as stone aggregate source for construction of various components of road, namely, Asphaltic Concrete (AC), Dense Bituminous Macadam (DBM), Wet Mix Macadam (WMM) as well as for the cement concrete works. The sources identified including their location and details, distance from quarry to Project stretch are tabulated in Table 7-11.
Table 7-11: Stone Aggregate Quarries
Sl. No Chainage Side Lead (km) Contact Details
1 28+000 RHS 5.00 RS Enterprices
2 49+000 LHS 14.00 Bhagyalaxmi Crusher
3 56+000 LHS 4.00 GaneshPulamathi Crusher
4 78+000 LHS 14.00 Avaniyapuram Blue Metal
Quarry
5 78+000 RHS 16.00 TRL Stone Crusher
6 82+000 RHS 1.00 KNS Quarry
7 - LHS 0.50 Shri Balaji Blue Metal Service
8 173+000 RHS 1.50 Sri Shanmuga Stone Crusher
9 201+000 LHS 6.00 City Blue Metals
Representative samples from the above stone quarries were collected for testing in the laboratory. The following tests have been conducted on the samples collected.
Los Angeles Abrasion Test : As per IS: 2386 (Part-4)
Aggregate Impact value : As per IS: 2386 (Part-6)
Combined flakiness and elongation indices : As per IS: 2386 (Part-7)
Soundness : As per IS: 2386 (Part-5)
Water absorption : As per IS: 2386 (Part-3)
MoRT&H requirement of stone aggregates for their use in base / surfacing courses of pavement are as follows:
Los Angeles Abrasion Value < 40%
Aggregate Impact Value < 30%
Flakiness and Elongation indices (combined) < 30%
Water absorption < 2% Summary of Laboratory Test Results of Stone Aggregates were given in Annexure 7.1.
Sources of natural sand have been primarily identified for construction works. The nearest existing sand source was identified and the location details are given in Table 7-12.
Table 7-12: Details of Sand Quarries
Sl.No Location/ Chainage Side Lead (Km) Remarks
1
Kanchipuram - Chengalpattu Route Kanchipuram to 16+000
Near Vill Palayasivaram (Palar River)
LHS 0.1 Palar River

Consultancy Services for preparation of DPR for development of Economic Corridors, Inter Corridors, Feeder Routes and National corridors (GQ and NS-EW Corridors) to improve the efficiency of freight movement in India under Bharatmala Pariyojana (Chennai-Salem)
Feasibility Report Volume – I (Main Report)
Preliminary Designs
Feedback Infra Pvt. Ltd. 7-27 National Highways Authority of India
Sl.No Location/ Chainage Side Lead (Km) Remarks
2 Vill. Neeyadipakam Cheyyar River
(Cheyyar-Palar River Bank) RHS 0.0 Cheyyar river
3 Cheyyar river (polur - Vandavasi
Road, Polur to 3.0 Km LHS 3.0 Cheyyar river
4 Salem to Bhavani 60.0 Km. (Bhavani Vill. Kaveri River)
LHS 60.0 Kaveri River
7.6 Pavement Design
7.6.1 GENERAL
The project envisages Greenfield alignment with eight lanes with paved shoulder for the carriageway for augmenting the capacity of the project road and significantly extending its service life. Wide paved shoulders are suggested at certain stretches to further enhance the capacity of project.
The general procedure for design of the flexible pavement green field highway has been followed as per the guidelines of IRC: 37-2012 – “Guidelines for the design of flexible pavements” and IRC: 81-1997- “Guidelines for Strengthening of flexible road pavements using Benkelman Beam Deflection Technique” respectively. The rigid pavements are designed as per the guidelines of IRC: 58-2015 – “Guidelines for the design of rigid pavements for highways” .The design of the Project Expressway conforms to the standards set out in the Manual for expressway IRC: SP: 99-2013.
Based on the evaluation of the functional and structural properties of the pavement, subgrade strength, axle loads and design traffic, the pavement design can be divided into two parts:
1. Design of the new pavement 2. Design of the overlay for spur Roads
New pavement design is based on the design traffic (msa) and the subgrade strength; however the overlay design will vary for each homogenous sections based on its structural and functional adequacy.
7.7 DESIGN CONSIDERATION FOR FLEXIBLE PAVEMENT 7.7.1 Design Life
Pavement design life is the period for which the initial design of pavement crust layers shall be carried out. Design life should not be referred as terminal stage of crust beyond which crust becomes unusable. A design life of 20 years for flexible pavement is to be considered as per IRC SP 99 :2013. Similarly, design life is 30 years for the rigid pavement as per IRC 58:2015 However, for stage construction, the design life of sub-base/ base courses is considered to equal to 20 years post construction. For binder/ wearing course the same is considered as 12 years post construction as per IRC SP 99: 2013.
7.7.2 VDF
Vehicle damage factor (VDF) for different categories of vehicle has been established by carrying fresh axle load survey at Mettupatti (near Valappadi) Ex. km 21.750 (old NH-68),

Consultancy Services for preparation of DPR for development of Economic Corridors, Inter Corridors, Feeder Routes and National corridors (GQ and NS-EW Corridors) to improve the efficiency of freight movement in India under Bharatmala Pariyojana (Chennai-Salem)
Feasibility Report Volume – I (Main Report)
Preliminary Designs
Feedback Infra Pvt. Ltd. 7-28 National Highways Authority of India
Pallikonda (near Vellore) Ex.km 98.520 (old NH-4) and Near Pappireddipatti Jn. (near Harur) Ex.km 31.000 (SH-18) respectively. The vehicle damage factor is a multiplier for converting the number of commercial vehicles of different axle loads to the number of standard axle load repetitions. Cumulative standard axle (CSA) is calculated in accordance with the guidelines provided in IRC: 37 – 2012 and IRC: 81 - 1997. It has been ascertained that the damaging effect of axles on flexible pavement is approximately proportional to the fourth power of the axle load. The VDF values are taken from the traffic report submitted by the consultant, hence detailed calculations are shown in the traffic report. The VDF is calculated by average of the individual vehicles VDF values calculated using fourth power formula suggested by IRC 37-2012. The calculated VDF values at the survey location for Bus, LCV, 2 axle, 3 axle and multi axle trucks are shown in Table 7-13.
Table 7-13: VDF Calculated
Mode
km 97.100 km 129.970 km 97.100 Recommended VDF
Adopted VDF C-S* S-C* C-S* S-C* C-S* S-C*
LCV 0.72 0.79 0.75 0.8 0.65 0.59 0.80 0.80
2-axle 2.62 1.47 1.64 1.87 3.78 2.58 1.16 1.16
3-axle 5.75 4.38 3.93 4.42 6.81 5.19 3.78 3.78
MAV 8.76 7.95 5.5 6.26 9.42 9.5 6.81 4.50
Bus 0.72 1.16 0.83 1.15 0.75 1.1 9.50 6.00
C-S* :Chennai-Salem ;S-C* :Salem-Chennai
* Though axle load survey was performed for 3A and MAVs at survey location, as their respective counts were lesser and the sampling was not representing, the results were found to be skewed. So, the average VDF proposed by IRC 37– 2012 is recommended.
7.7.3 Traffic Growth Rates
To estimate the realistic traffic growth rates methodology recommended in IRC 108: 1996 is adopted. The econometric models developed by elasticity method relate traffic growth to changes in the socio-economic parameters like population, NSDP, per capita income and GDP. The best fit equation (log-log regression) of each mode of vehicles with different combinations of socio-economic parameters considered in estimating growth rates. As per guidelines given in IRC SP 84:2014 the growth rate of commercial vehicles shall not be less than 5% .The estimated and recommended final growth rates are presented in Table 7-14 below.
Table 7-14: Traffic growth rates
Period range Estimated Growth Rates Recommended Growth Rates
LCV Bus 2A 3A MAV LCV Bus 2A 3A MAV
2019-22 9.52 4.52 2.40 3.84 9.45 9.52 5.00 5.00 5.00 9.45
2023-27 8.65 4.14 1.29 2.21 8.90 8.65 5.00 5.00 5.00 8.90
2028-32 7.83 3.76 0.35 1.24 8.09 7.83 5.00 5.00 5.00 8.09
2033-37 6.49 3.12 0.12 0.31 6.53 6.49 5.00 5.00 5.00 6.53
2038-42 4.87 2.34 0.00 0.00 5.06 5.00 5.00 5.00 5.00 5.06
2043-47 4.83 2.32 0.00 0.00 5.02 5.00 5.00 5.00 5.00 5.02
>2047 4.83 2.32 0.00 0.00 5.02 5.00 5.00 5.00 5.00 5.02
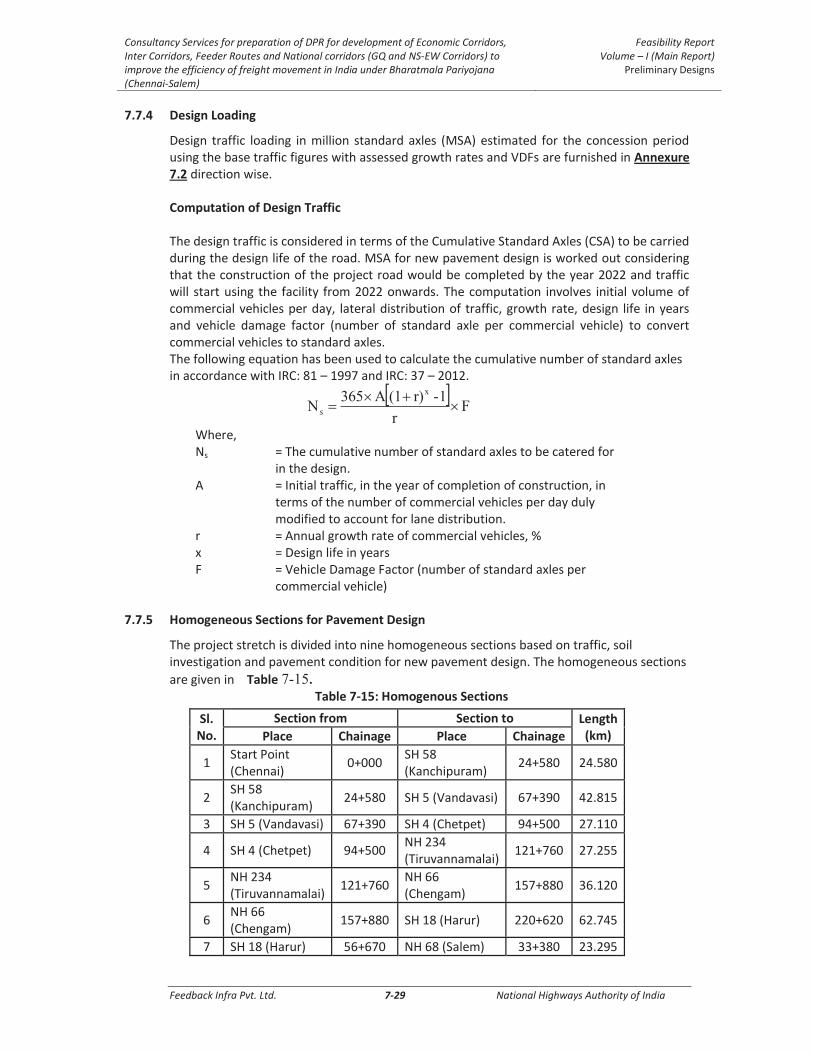
Consultancy Services for preparation of DPR for development of Economic Corridors, Inter Corridors, Feeder Routes and National corridors (GQ and NS-EW Corridors) to improve the efficiency of freight movement in India under Bharatmala Pariyojana (Chennai-Salem)
Feasibility Report Volume – I (Main Report)
Preliminary Designs
Feedback Infra Pvt. Ltd. 7-29 National Highways Authority of India
7.7.4 Design Loading
Design traffic loading in million standard axles (MSA) estimated for the concession period using the base traffic figures with assessed growth rates and VDFs are furnished in Annexure 7.2 direction wise. Computation of Design Traffic The design traffic is considered in terms of the Cumulative Standard Axles (CSA) to be carried during the design life of the road. MSA for new pavement design is worked out considering that the construction of the project road would be completed by the year 2022 and traffic will start using the facility from 2022 onwards. The computation involves initial volume of commercial vehicles per day, lateral distribution of traffic, growth rate, design life in years and vehicle damage factor (number of standard axle per commercial vehicle) to convert commercial vehicles to standard axles. The following equation has been used to calculate the cumulative number of standard axles in accordance with IRC: 81 – 1997 and IRC: 37 – 2012.
s
Where, Ns = The cumulative number of standard axles to be catered for
in the design. A = Initial traffic, in the year of completion of construction, in
terms of the number of commercial vehicles per day duly modified to account for lane distribution.
r = Annual growth rate of commercial vehicles, % x = Design life in years F = Vehicle Damage Factor (number of standard axles per
commercial vehicle)
7.7.5 Homogeneous Sections for Pavement Design
The project stretch is divided into nine homogeneous sections based on traffic, soil investigation and pavement condition for new pavement design. The homogeneous sections
are given in Table . Table 7-15: Homogenous Sections
Sl. No.
Section from Section to Length (km) Place Chainage Place Chainage
1 Start Point (Chennai)
0+000 SH 58 (Kanchipuram)
24+580 24.580
2 SH 58 (Kanchipuram)
24+580 SH 5 (Vandavasi) 67+390 42.815
3 SH 5 (Vandavasi) 67+390 SH 4 (Chetpet) 94+500 27.110
4 SH 4 (Chetpet) 94+500 NH 234 (Tiruvannamalai)
121+760 27.255
5 NH 234 (Tiruvannamalai)
121+760 NH 66 (Chengam)
157+880 36.120
6 NH 66 (Chengam)
157+880 SH 18 (Harur) 220+620 62.745
7 SH 18 (Harur) 56+670 NH 68 (Salem) 33+380 23.295
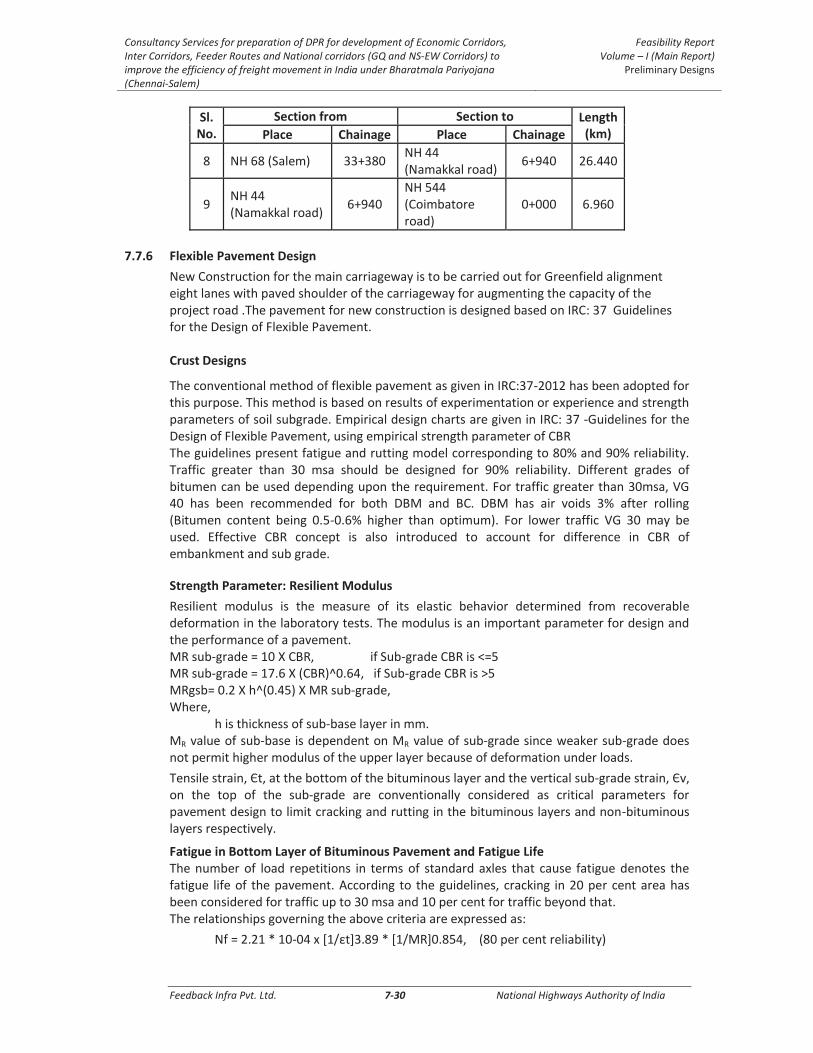
Consultancy Services for preparation of DPR for development of Economic Corridors, Inter Corridors, Feeder Routes and National corridors (GQ and NS-EW Corridors) to improve the efficiency of freight movement in India under Bharatmala Pariyojana (Chennai-Salem)
Feasibility Report Volume – I (Main Report)
Preliminary Designs
Feedback Infra Pvt. Ltd. 7-30 National Highways Authority of India
Sl. No.
Section from Section to Length (km) Place Chainage Place Chainage
8 NH 68 (Salem) 33+380 NH 44 (Namakkal road)
6+940 26.440
9 NH 44 (Namakkal road)
6+940 NH 544 (Coimbatore road)
0+000 6.960
7.7.6 Flexible Pavement Design
New Construction for the main carriageway is to be carried out for Greenfield alignment eight lanes with paved shoulder of the carriageway for augmenting the capacity of the project road .The pavement for new construction is designed based on IRC: 37 Guidelines for the Design of Flexible Pavement. Crust Designs
The conventional method of flexible pavement as given in IRC:37-2012 has been adopted for this purpose. This method is based on results of experimentation or experience and strength parameters of soil subgrade. Empirical design charts are given in IRC: 37 -Guidelines for the Design of Flexible Pavement, using empirical strength parameter of CBR The guidelines present fatigue and rutting model corresponding to 80% and 90% reliability. Traffic greater than 30 msa should be designed for 90% reliability. Different grades of bitumen can be used depending upon the requirement. For traffic greater than 30msa, VG 40 has been recommended for both DBM and BC. DBM has air voids 3% after rolling (Bitumen content being 0.5-0.6% higher than optimum). For lower traffic VG 30 may be used. Effective CBR concept is also introduced to account for difference in CBR of embankment and sub grade.
Strength Parameter: Resilient Modulus
Resilient modulus is the measure of its elastic behavior determined from recoverable deformation in the laboratory tests. The modulus is an important parameter for design and the performance of a pavement. MR sub-grade = 10 X CBR, if Sub-grade CBR is <=5 MR sub-grade = 17.6 X (CBR)^0.64, if Sub-grade CBR is >5 MRgsb= 0.2 X h^(0.45) X MR sub-grade, Where,
h is thickness of sub-base layer in mm. MR value of sub-base is dependent on MR value of sub-grade since weaker sub-grade does not permit higher modulus of the upper layer because of deformation under loads.
Tensile strain, Єt, at the bottom of the bituminous layer and the vertical sub-grade strain, Єv, on the top of the sub-grade are conventionally considered as critical parameters for pavement design to limit cracking and rutting in the bituminous layers and non-bituminous layers respectively.
Fatigue in Bottom Layer of Bituminous Pavement and Fatigue Life The number of load repetitions in terms of standard axles that cause fatigue denotes the fatigue life of the pavement. According to the guidelines, cracking in 20 per cent area has been considered for traffic up to 30 msa and 10 per cent for traffic beyond that. The relationships governing the above criteria are expressed as:
Nf = 2.21 * 10-04 x [1/εt]3.89 * [1/MR]0.854, (80 per cent reliability)

Consultancy Services for preparation of DPR for development of Economic Corridors, Inter Corridors, Feeder Routes and National corridors (GQ and NS-EW Corridors) to improve the efficiency of freight movement in India under Bharatmala Pariyojana (Chennai-Salem)
Feasibility Report Volume – I (Main Report)
Preliminary Designs
Feedback Infra Pvt. Ltd. 7-31 National Highways Authority of India
Nf = 0.711 * 10-04 x [1/εt]3.89 * [1/MR]0.854, (90 per cent reliability)
Where,
Nf = fatigue life in number of standard axles,
εt = Maximum Tensile strain at the bottom of the bituminous layer, and
MR = resilient modulus of the bituminous layer.
Rutting in Pavement
Excessive rutting greatly reduces the serviceability of the pavement and therefore, it has to be limited to a certain reasonable value. According to the guidelines, the limiting rutting is recommended as 20 mm in 20 per cent of the length for design traffic up to 30 msa and 10 per cent of the length for the design traffic beyond.
The relationships governing the above criteria are expressed as:
N = 4.1656 x 10-08 [1/εv] 4.5337
N = 1.41x 10-8x [1/εv] 4.5337
Where,
N = Number of cumulative standard axles, and
εv = Vertical strain in the subgrade

Cons
ulta
ncy
Serv
ices f
or p
repa
ratio
n of
DPR
for d
evel
opm
ent o
f Eco
nom
ic Co
rrid
ors,
Inte
r Cor
ridor
s, Fe
eder
Rou
tes a
nd N
atio
nal
corr
idor
s (GQ
and
NS -
EW C
orrid
ors)
to im
prov
e th
e ef
ficie
ncy
of fr
eigh
t mov
emen
t in
Indi
a un
der B
hara
tmal
a Pa
riyoj
ana
(Che
nnai
-Sal
em)
Feas
ibili
ty R
epor
t Vo
lum
e –
I (M
ain
Repo
rt)
Pre
limin
ary
Des
ign
s
Feed
back
Infra
Pvt
. Ltd
.
7
-32
N
atio
nal H
ighw
ays A
utho
rity
of In
dia
Pav
emen
t d
esig
n f
or
new
car
riag
eway
is d
on
e b
ased
on
IRC
: 37
-20
12, c
on
sid
erin
g co
nst
ruct
ion
per
iod
of
two
yea
rs a
nd
des
ign
life
of
15
yea
rs f
or
bit
um
ino
us
laye
r, b
ase
and
su
b b
ase
cou
rse.
Fo
r th
e se
rvic
e ro
ads,
th
e d
esig
n M
SA is
tak
en a
s 1
0 M
SA A
s p
er IR
C S
P:8
4-2
01
4. T
he
pro
po
sed
p
avem
ent
des
ign
th
ickn
ess
is li
sted
in T
able
7-1
6 a
nd
Tab
le7
-17
.
Tab
le 7
-16
: Pro
po
sed
Pav
eme
nt
De
sign
Pav
em
en
t co
mp
osi
tio
n (
mm
) as
pe
r IR
C 3
7-2
01
2
De
scri
pti
on
H
S I
HS
II
HS
III
HS
IV
HS
V
HS
VI
HS
VII
H
S V
III
HS
IX
Dir
ecti
on
B
oth
Pro
po
sed
Lan
e C
on
figu
rati
on
8
Lan
e
Des
ign
life
Bas
e an
d S
ub
Bas
e (i
n
year
s)
20
Des
ign
life
BT
Laye
rs (
in y
ears
) 2
0
Lan
e D
istr
ibu
tio
n f
acto
r 0
.45
Dir
ecti
on
al D
istr
ibu
tio
n
0.5
0
Init
ial D
esig
n p
erio
d o
f B
T La
yers
(in
ye
ars)
**
12
**
MSA
fo
r B
T La
yers
1
48
.7
11
4.8
1
06
.3
11
6.2
1
41
.2
12
8.6
1
48
.0
98
.6
89
.3
MSA
fo
r B
ase
and
Su
b B
ase
33
2.9
2
55
.5
23
7.3
2
59
.3
31
5.6
2
86
.5
33
0.3
2
20
.0
19
9.8
Ad
op
ted
Eff
ecti
ve C
BR
Val
ue
(%)
10
Gra
de
of
Bit
um
en
V
G 4
0 ,
Va
= 3
% &
Vb
= 1
3 %
Bit
um
ino
us
Co
ncr
ete
, mm
5
0
50
5
0
50
5
0
50
5
0
40
4
0
Den
se B
itu
min
ou
s M
acad
am ,
mm
1
20
1
10
1
05
1
10
1
20
1
15
1
20
1
10
1
10
Gra
nu
lar
Bas
e (W
MM
) , m
m
25
0
25
0
25
0
25
0
25
0
25
0
25
0
25
0
25
0
Gra
nu
lar
Sub
Bas
e ,
mm
2
00
2
00
2
00
2
00
2
00
2
00
2
00
2
00
2
00
Tota
l Th
ickn
ess,
mm
6
20
6
10
6
05
6
10
6
20
6
15
6
20
6
00
6
00
Mat
eria
l Sp
ecif
icat
ion
s
Gra
dat
ion
of
BC
G
rad
ing
2 -
As
per
Tab
le 5
00
-17
of
MO
RTH
sp
ecif
icat
ion
s (F
ifth
Rev
isio
n)
Gra
dat
ion
of
DB
M
Gra
din
g 1
fo
r Th
ickn
ess
bet
wee
n 7
5 -
10
0 m
m a
nd
Gra
din
g 2
fo
r Th
ickn
ess
bet
wee
n 5
0 -
75
mm
- A
s p
er
Tab
le 5
00
-10
of
MO
RTH
sp
ecif
icat
ion
s (F
ifth
Rev
isio
n)
Gra
dat
ion
of
WM
M
Gra
dat
ion
as
per
Tab
le 4
00
-13
of
MO
RTH
sp
ecif
icat
ion
s (F
ifth
Rev
isio
n)
Gra
dat
ion
of
GSB
G
rad
ing
I/II
- A
s p
er T
able
40
0-1
of
MO
RTH
sp
ecif
icat
ion
s (F
ifth
Rev
isio
n)

Cons
ulta
ncy
Serv
ices f
or p
repa
ratio
n of
DPR
for d
evel
opm
ent o
f Eco
nom
ic Co
rrid
ors,
Inte
r Cor
ridor
s, Fe
eder
Rou
tes a
nd N
atio
nal
corr
idor
s (GQ
and
NS -
EW C
orrid
ors)
to im
prov
e th
e ef
ficie
ncy
of fr
eigh
t mov
emen
t in
Indi
a un
der B
hara
tmal
a Pa
riyoj
ana
(Che
nnai
-Sal
em)
Feas
ibili
ty R
epor
t Vo
lum
e –
I (M
ain
Repo
rt)
Pre
limin
ary
Des
ign
s
Feed
back
Infra
Pvt
. Ltd
.
7
-33
N
atio
nal H
ighw
ays A
utho
rity
of In
dia
Pav
em
en
t co
mp
osi
tio
n (
mm
) as
pe
r IR
C 3
7-2
01
2
De
scri
pti
on
H
S I
HS
II
HS
III
HS
IV
HS
V
HS
VI
HS
VII
H
S V
III
HS
IX
** A
ctu
al d
esig
n li
fe is
tak
en a
s 2
0 y
ears
fo
r fl
exib
le p
avem
ent
(Co
nsi
der
ed 1
2 y
ears
as
init
ial d
esig
n p
erio
d a
nd
pav
emen
t st
ren
gth
enin
g fo
r th
e b
alan
ce p
erio
d)
Ta
ble
7-1
7: P
rop
ose
d P
avem
ent
Des
ign
fo
r se
rvic
e ro
ads
& S
pu
r R
oad
s
Sect
ion
C
BR
(%
) M
SA
BC
(m
m)
DB
M (
mm
) W
MM
(m
m)
GSB
(m
m)
I to
IX
&
Spu
r R
oad
s 8
1
0
40
5
0
25
0
20
0

Consultancy Services for preparation of DPR for development of Economic Corridors, Inter Corridors, Feeder Routes and National corridors (GQ and NS-EW Corridors) to improve the efficiency of freight movement in India under Bharatmala Pariyojana (Chennai-Salem)
Feasibility Report Volume – I (Main Report)
Preliminary Designs
Feedback Infra Pvt. Ltd. 7-34 National Highways Authority of India
7.7.7 Rigid Pavement Design
Rigid Pavement is required to be constructed at toll plaza location. At these locations, braking tendency remains to be high and therefore, impact loading is significant in the design. The pavement has been designed based on IRC: 58-2015 Design of Rigid Pavement and for design life of 30 years. Axle load spectrum - The load spectrums obtained from Axle Load survey considered for the design purpose is shown in Error! Reference source not found. to Table 7-29.
Figure 1: Rigid Pavement Design Flow Chart (IRC: 58-2015)
Is Cumulative
fatigue damage <1
No
Yes
Final Thickness for Adoption
Compute Combine (loading & Temp.) Stresses for Various Axle Load Classes and Cumulative fatigue damage (Bottom UP +Top Down) Top
Compute repetitions of axle loads of different magnitudes for design period
Select Slab Thickness
Axle Load Spectrum by Intensity of Load
Total Commercial Traffic for Design life
Stipulate Design Values for various parameters

Cons
ulta
ncy
Serv
ices f
or p
repa
ratio
n of
DPR
for d
evel
opm
ent o
f Eco
nom
ic Co
rrid
ors,
Inte
r Cor
ridor
s, Fe
eder
Rou
tes
and
Natio
nal
corr
idor
s (GQ
and
NS-
EW C
orrid
ors)
to im
prov
e th
e ef
ficie
ncy
of fr
eigh
t mov
emen
t in
Indi
a un
der B
hara
tmal
a Pa
riyoj
ana
(Che
nnai
-Sal
em)
Feas
ibili
ty R
epor
t Vo
lum
e –
I (M
ain
Repo
rt)
Pre
limin
ary
Des
ign
s
Feed
back
Infr
a Pv
t. Lt
d.
7-35
N
atio
nal H
ighw
ays A
utho
rity
of In
dia
Tab
le 7
-18
: Axl
e lo
ad s
pec
tru
m a
t lo
cati
on
1 M
ettu
pat
ti E
x.km
.21
.75
0 (
old
NH
-68
) (C
hen
nai
-Sa
lem
)
Load
Gro
up
M
id-
po
int
o
f lo
ad
No
s Fr
eq
ue
ncy
Lo
ad G
rou
p
Mid
-p
oin
t
of
load
N
os
Fre
qu
en
cy
Load
Gro
up
M
id-
po
int
o
f lo
ad
No
s Fr
equ
ency
18
5
19
5
19
0
0
0.0
0
38
0
40
0
39
0
0
0.0
0
53
0
56
0
54
5
0
0.0
0
17
5
18
5
18
0
0
0.0
0
36
0
38
0
37
0
0
0.0
0
50
0
53
0
51
5
0
0.0
0
16
5
17
5
17
0
0
0.0
0
34
0
36
0
35
0
0
0.0
0
47
0
50
0
48
5
0
0.0
0
15
5
16
5
16
0
0
0.0
0
32
0
34
0
33
0
1
1.0
5
44
0
47
0
45
5
0
0.0
0
14
5
15
5
15
0
1
0.5
0
30
0
32
0
31
0
0
0.0
0
41
0
44
0
42
5
0
0.0
0
13
5
14
5
14
0
3
1.5
0
28
0
30
0
29
0
1
1.0
5
38
0
41
0
39
5
0
0.0
0
12
5
13
5
13
0
3
1.5
0
26
0
28
0
27
0
6
6.3
2
35
0
38
0
36
5
1
12
.50
11
5
12
5
12
0
9
4.5
0
24
0
26
0
25
0
15
1
5.7
9
32
0
35
0
33
5
2
25
.00
10
5
11
5
11
0
21
1
0.5
0
22
0
24
0
23
0
15
1
5.7
9
29
0
32
0
30
5
1
12
.50
95
1
05
1
00
1
7
8.5
0
20
0
22
0
21
0
23
2
4.2
1
26
0
29
0
27
5
1
12
.50
85
9
5
90
2
2
11
.00
1
80
2
00
1
90
1
1
11
.58
2
30
2
60
2
45
0
0
.00
< 8
5
80
1
24
6
2.0
0
< 1
80
1
70
2
3
24
.21
<
2
30
2
15
3
3
7.5
0
Tota
l 2
00
1
00
.00
To
tal
95
1
00
.00
To
tal
8
10
0.0
0
Ta
ble
7-1
9: R
esu
lt o
f A
xle
load
sp
ect
rum
loca
tio
n 1
Met
tup
atti
Ex.
km.2
1.7
50
(o
ld N
H-6
8)
(Ch
enn
ai -
Sale
m)
Tota
l No
of
axle
s 5
55
Ave
rage
No
of
axle
s p
er c
om
mer
cial
veh
icle
, B
2.2
02
Pro
po
rtio
n o
f Fr
on
t si
ngl
e (s
teer
ing)
Axl
es, K
1
0.4
54
Pro
po
rtio
n o
f R
ear
sin
gle
Axl
es,K
2
0.3
60
Pro
po
rtio
n o
f ta
nd
em A
xles
, K3
0
.17
1
Pro
po
rtio
n o
f Tr
idem
Axl
es, K
4 =
(1
-K1
-K2
-K3
) 0
.01
4

Cons
ulta
ncy
Serv
ices f
or p
repa
ratio
n of
DPR
for d
evel
opm
ent o
f Eco
nom
ic Co
rrid
ors,
Inte
r Cor
ridor
s, Fe
eder
Rou
tes
and
Natio
nal
corr
idor
s (GQ
and
NS-
EW C
orrid
ors)
to im
prov
e th
e ef
ficie
ncy
of fr
eigh
t mov
emen
t in
Indi
a un
der B
hara
tmal
a Pa
riyoj
ana
(Che
nnai
-Sal
em)
Feas
ibili
ty R
epor
t Vo
lum
e –
I (M
ain
Repo
rt)
Pre
limin
ary
Des
ign
s
Feed
back
Infr
a Pv
t. Lt
d.
7-36
N
atio
nal H
ighw
ays A
utho
rity
of In
dia
Tab
le 7
-20
: Axl
e lo
ad s
pec
tru
m a
t lo
cati
on
1 M
ettu
pat
ti E
x.km
.21
.75
0 (
old
NH
-68
) (
Sale
m -
Ch
enn
ai)
Load
Gro
up
M
id-
po
int
o
f lo
ad
No
s Fr
eq
ue
ncy
Lo
ad G
rou
p
Mid
-p
oin
t
of
load
N
os
Fre
qu
en
cy
Load
Gro
up
M
id-
po
int
o
f lo
ad
No
s Fr
equ
ency
18
5
19
5
19
0
0
0.0
0
38
0
40
0
39
0
0
0.0
0
53
0
56
0
54
5
0
0.0
0
17
5
18
5
18
0
0
0.0
0
36
0
38
0
37
0
0
0.0
0
50
0
53
0
51
5
0
0.0
0
16
5
17
5
17
0
0
0.0
0
34
0
36
0
35
0
0
0.0
0
47
0
50
0
48
5
0
0.0
0
15
5
16
5
16
0
0
0.0
0
32
0
34
0
33
0
0
0.0
0
44
0
47
0
45
5
1
50
.00
14
5
15
5
15
0
0
0.0
0
30
0
32
0
31
0
1
1.0
3
41
0
44
0
42
5
0
0.0
0
13
5
14
5
14
0
0
0.0
0
28
0
30
0
29
0
2
2.0
6
38
0
41
0
39
5
0
0.0
0
12
5
13
5
13
0
1
0.5
1
26
0
28
0
27
0
3
3.0
9
35
0
38
0
36
5
0
0.0
0
11
5
12
5
12
0
3
1.5
2
24
0
26
0
25
0
10
1
0.3
1
32
0
35
0
33
5
0
0.0
0
10
5
11
5
11
0
6
3.0
3
22
0
24
0
23
0
10
1
0.3
1
29
0
32
0
30
5
0
0.0
0
95
1
05
1
00
1
6
8.0
8
20
0
22
0
21
0
25
2
5.7
7
26
0
29
0
27
5
0
0.0
0
85
9
5
90
1
8
9.0
9
18
0
20
0
19
0
14
1
4.4
3
23
0
26
0
24
5
0
0.0
0
< 8
5
80
1
54
7
7.7
8
< 1
80
1
70
3
2
32
.99
<
2
30
2
15
1
5
0.0
0
Tota
l 1
98
1
00
.00
To
tal
97
1
00
.00
To
tal
2
10
0.0
0
Ta
ble
7-2
1: R
esu
lt o
f A
xle
load
sp
ect
rum
at
loca
tio
n 1
Met
tup
atti
Ex.
km.2
1.7
50
(o
ld N
H-6
8)
(Sa
lem
- C
hen
nai
)
Tota
l No
of
axle
s 5
42
Ave
rage
No
of
axle
s p
er c
om
mer
cial
veh
icle
, B
2.2
12
Pro
po
rtio
n o
f Fr
on
t si
ngl
e (s
teer
ing)
Axl
es, K
1
0.4
52
Pro
po
rtio
n o
f R
ear
sin
gle
Axl
es,K
2
0.3
65
Pro
po
rtio
n o
f ta
nd
em A
xles
, K3
0
.17
9
Pro
po
rtio
n o
f Tr
idem
Axl
es, K
4 =
(1
-K1
-K2
-K3
) 0
.00
4

Cons
ulta
ncy
Serv
ices f
or p
repa
ratio
n of
DPR
for d
evel
opm
ent o
f Eco
nom
ic Co
rrid
ors,
Inte
r Cor
ridor
s, Fe
eder
Rou
tes
and
Natio
nal
corr
idor
s (GQ
and
NS-
EW C
orrid
ors)
to im
prov
e th
e ef
ficie
ncy
of fr
eigh
t mov
emen
t in
Indi
a un
der B
hara
tmal
a Pa
riyoj
ana
(Che
nnai
-Sal
em)
Feas
ibili
ty R
epor
t Vo
lum
e –
I (M
ain
Repo
rt)
Pre
limin
ary
Des
ign
s
Feed
back
Infr
a Pv
t. Lt
d.
7-37
N
atio
nal H
ighw
ays A
utho
rity
of In
dia
Tab
le 7
-22
: Axl
e lo
ad s
pec
tru
m a
t lo
cati
on
2 P
allik
on
da
Ex.k
m.k
m 9
8.5
20
(o
ld N
H-4
) (C
hen
nai
-Sa
lem
)
Load
Gro
up
M
id-
po
int
o
f lo
ad
No
s Fr
eq
ue
ncy
Lo
ad G
rou
p
Mid
-p
oin
t
of
load
N
os
Fre
qu
en
cy
Load
Gro
up
M
id-
po
int
o
f lo
ad
No
s Fr
equ
ency
18
5
19
5
19
0
0
0.0
0
38
0
40
0
39
0
0
0.0
0
53
0
56
0
54
5
0
0
17
5
18
5
18
0
0
0.0
0
36
0
38
0
37
0
0
0.0
0
50
0
53
0
51
5
0
0
16
5
17
5
17
0
0
0.0
0
34
0
36
0
35
0
0
0.0
0
47
0
50
0
48
5
0
0
15
5
16
5
16
0
0
0.0
0
32
0
34
0
33
0
0
0.0
0
44
0
47
0
45
5
0
0
14
5
15
5
15
0
0
0.0
0
30
0
32
0
31
0
0
0.0
0
41
0
44
0
42
5
0
0
13
5
14
5
14
0
0
0.0
0
28
0
30
0
29
0
0
0.0
0
38
0
41
0
39
5
0
0
12
5
13
5
13
0
0
0.0
0
26
0
28
0
27
0
1
11
.11
3
50
3
80
3
65
0
0
11
5
12
5
12
0
1
7.6
9
24
0
26
0
25
0
0
0.0
0
32
0
35
0
33
5
0
0
10
5
11
5
11
0
0
0.0
0
22
0
24
0
23
0
1
11
.11
2
90
3
20
3
05
0
0
95
1
05
1
00
1
7
.69
2
00
2
20
2
10
1
1
1.1
1
26
0
29
0
27
5
0
0
85
9
5
90
0
0
.00
1
80
2
00
1
90
0
0
.00
2
30
2
60
2
45
0
0
< 8
5
80
1
1
84
.62
<
18
0
17
0
6
66
.67
<
2
30
2
15
0
0
Tota
l 1
3
10
0.0
0
Tota
l 9
1
00
.00
To
tal
0
0
Ta
ble
7-2
3: R
esu
lt o
f A
xle
load
sp
ect
rum
at
loca
tio
n 2
Pal
liko
nd
a Ex
.km
.km
98
.52
0 (
old
NH
-4)(
Ch
enn
ai -
Sale
m)
Tota
l No
of
axle
s 4
1
Ave
rage
No
of
axle
s p
er c
om
mer
cial
veh
icle
, B
2.1
58
Pro
po
rtio
n o
f Fr
on
t si
ngl
e (s
teer
ing)
Axl
es, K
1
0.4
63
Pro
po
rtio
n o
f R
ear
sin
gle
Axl
es,K
2
0.3
17
Pro
po
rtio
n o
f ta
nd
em A
xles
, K3
0
.22
0
Pro
po
rtio
n o
f Tr
idem
Axl
es, K
4 =
(1
-K1
-K2
-K3
) 0
.00
0

Cons
ulta
ncy
Serv
ices f
or p
repa
ratio
n of
DPR
for d
evel
opm
ent o
f Eco
nom
ic Co
rrid
ors,
Inte
r Cor
ridor
s, Fe
eder
Rou
tes
and
Natio
nal
corr
idor
s (GQ
and
NS-
EW C
orrid
ors)
to im
prov
e th
e ef
ficie
ncy
of fr
eigh
t mov
emen
t in
Indi
a un
der B
hara
tmal
a Pa
riyoj
ana
(Che
nnai
-Sal
em)
Feas
ibili
ty R
epor
t Vo
lum
e –
I (M
ain
Repo
rt)
Pre
limin
ary
Des
ign
s
Feed
back
Infr
a Pv
t. Lt
d.
7-38
N
atio
nal H
ighw
ays A
utho
rity
of In
dia
Tab
le 7
-24
: Axl
e lo
ad s
pec
tru
m a
t lo
cati
on
2 P
allik
on
da
Ex.k
m.k
m 9
8.5
20
(o
ld N
H-4
) (S
alem
- C
hen
nai
)
Load
Gro
up
M
id-
po
int
o
f lo
ad
No
s Fr
eq
ue
ncy
Lo
ad G
rou
p
Mid
-p
oin
t
of
load
N
os
Fre
qu
en
cy
Load
Gro
up
M
id-
po
int
o
f lo
ad
No
s Fr
equ
ency
18
5
19
5
19
0
0
0.0
0
38
0
40
0
39
0
0
0.0
0
53
0
56
0
54
5
0
0.0
0
17
5
18
5
18
0
0
0.0
0
36
0
38
0
37
0
0
0.0
0
50
0
53
0
51
5
0
0.0
0
16
5
17
5
17
0
0
0.0
0
34
0
36
0
35
0
0
0.0
0
47
0
50
0
48
5
0
0.0
0
15
5
16
5
16
0
0
0.0
0
32
0
34
0
33
0
0
0.0
0
44
0
47
0
45
5
0
0.0
0
14
5
15
5
15
0
0
0.0
0
30
0
32
0
31
0
0
0.0
0
41
0
44
0
42
5
0
0.0
0
13
5
14
5
14
0
1
0.8
1
28
0
30
0
29
0
1
1.4
1
38
0
41
0
39
5
1
14
.29
12
5
13
5
13
0
1
0.8
1
26
0
28
0
27
0
1
1.4
1
35
0
38
0
36
5
3
42
.86
11
5
12
5
12
0
4
3.2
3
24
0
26
0
25
0
4
5.6
3
32
0
35
0
33
5
2
28
.57
10
5
11
5
11
0
5
4.0
3
22
0
24
0
23
0
9
12
.68
2
90
3
20
3
05
0
0
.00
95
1
05
1
00
1
2
9.6
8
20
0
22
0
21
0
19
2
6.7
6
26
0
29
0
27
5
0
0.0
0
85
9
5
90
1
1
8.8
7
18
0
20
0
19
0
10
1
4.0
8
23
0
26
0
24
5
0
0.0
0
< 8
5
80
9
0
72
.58
<
18
0
17
0
27
3
8.0
3
<
23
0
21
5
1
14
.29
Tota
l 1
24
1
00
.00
To
tal
71
1
00
.00
To
tal
7
10
0.0
0
Ta
ble
7-2
5: R
esu
lt o
f A
xle
load
sp
ect
rum
at
loca
tio
n 2
Pal
liko
nd
a Ex
.km
.km
98
.52
0 (
old
NH
-4)
(Sal
em -
Ch
enn
ai)
Tota
l No
of
axle
s 3
56
Ave
rage
No
of
axle
s p
er c
om
mer
cial
ve
hic
le, B
2
.31
2
Pro
po
rtio
n o
f Fr
on
t si
ngl
e (s
teer
ing)
Axl
es, K
1
0.4
33
Pro
po
rtio
n o
f R
ear
sin
gle
Axl
es,K
2
0.3
48
Pro
po
rtio
n o
f ta
nd
em A
xles
, K3
0
.19
9
Pro
po
rtio
n o
f Tr
idem
Axl
es, K
4 =
(1
-K1
-K2
-K3
) 0
.02
0
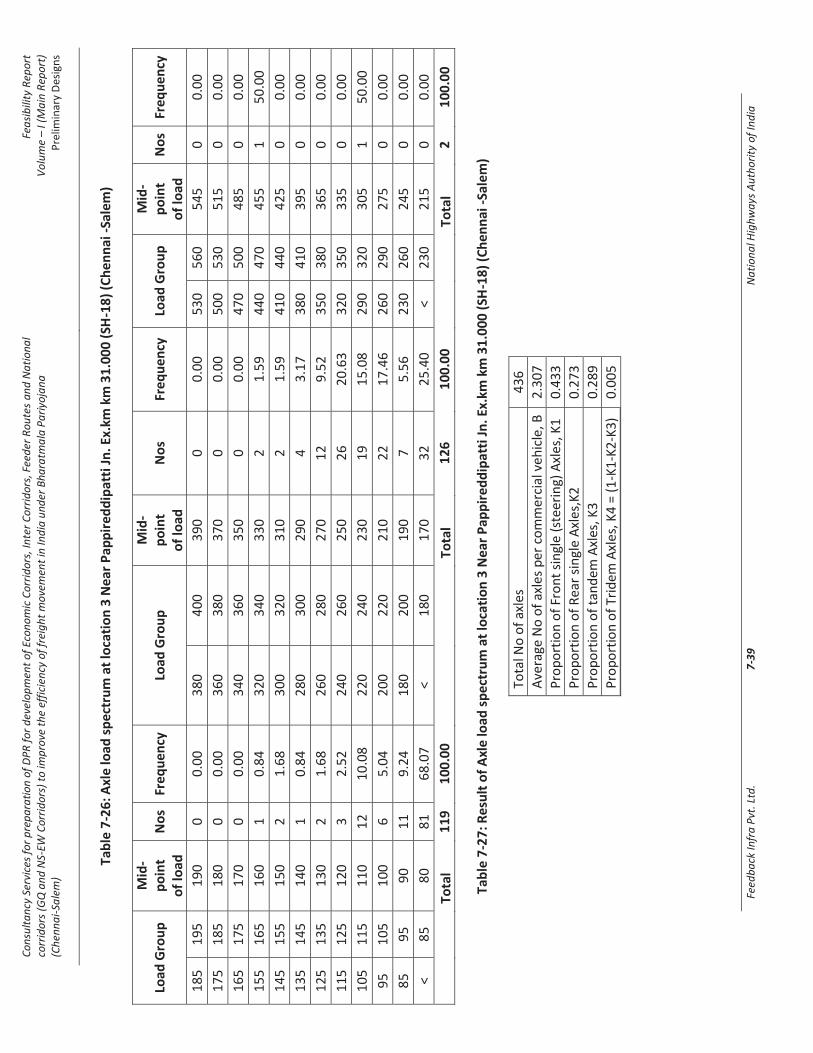
Cons
ulta
ncy
Serv
ices f
or p
repa
ratio
n of
DPR
for d
evel
opm
ent o
f Eco
nom
ic Co
rrid
ors,
Inte
r Cor
ridor
s, Fe
eder
Rou
tes
and
Natio
nal
corr
idor
s (GQ
and
NS-
EW C
orrid
ors)
to im
prov
e th
e ef
ficie
ncy
of fr
eigh
t mov
emen
t in
Indi
a un
der B
hara
tmal
a Pa
riyoj
ana
(Che
nnai
-Sal
em)
Feas
ibili
ty R
epor
t Vo
lum
e –
I (M
ain
Repo
rt)
Pre
limin
ary
Des
ign
s
Feed
back
Infr
a Pv
t. Lt
d.
7-39
N
atio
nal H
ighw
ays A
utho
rity
of In
dia
Tab
le 7
-26
: Axl
e lo
ad s
pe
ctru
m a
t lo
cati
on
3 N
ear
Pap
pir
ed
dip
atti
Jn
. Ex.
km k
m 3
1.0
00
(SH
-18
) (C
he
nn
ai -
Sale
m)
Load
Gro
up
M
id-
po
int
o
f lo
ad
No
s Fr
eq
ue
ncy
Lo
ad G
rou
p
Mid
-p
oin
t
of
load
N
os
Fre
qu
en
cy
Load
Gro
up
M
id-
po
int
o
f lo
ad
No
s Fr
equ
ency
18
5
19
5
19
0
0
0.0
0
38
0
40
0
39
0
0
0.0
0
53
0
56
0
54
5
0
0.0
0
17
5
18
5
18
0
0
0.0
0
36
0
38
0
37
0
0
0.0
0
50
0
53
0
51
5
0
0.0
0
16
5
17
5
17
0
0
0.0
0
34
0
36
0
35
0
0
0.0
0
47
0
50
0
48
5
0
0.0
0
15
5
16
5
16
0
1
0.8
4
32
0
34
0
33
0
2
1.5
9
44
0
47
0
45
5
1
50
.00
14
5
15
5
15
0
2
1.6
8
30
0
32
0
31
0
2
1.5
9
41
0
44
0
42
5
0
0.0
0
13
5
14
5
14
0
1
0.8
4
28
0
30
0
29
0
4
3.1
7
38
0
41
0
39
5
0
0.0
0
12
5
13
5
13
0
2
1.6
8
26
0
28
0
27
0
12
9
.52
3
50
3
80
3
65
0
0
.00
11
5
12
5
12
0
3
2.5
2
24
0
26
0
25
0
26
2
0.6
3
32
0
35
0
33
5
0
0.0
0
10
5
11
5
11
0
12
1
0.0
8
22
0
24
0
23
0
19
1
5.0
8
29
0
32
0
30
5
1
50
.00
95
1
05
1
00
6
5
.04
2
00
2
20
2
10
2
2
17
.46
2
60
2
90
2
75
0
0
.00
85
9
5
90
1
1
9.2
4
18
0
20
0
19
0
7
5.5
6
23
0
26
0
24
5
0
0.0
0
< 8
5
80
8
1
68
.07
<
18
0
17
0
32
2
5.4
0
<
23
0
21
5
0
0.0
0
Tota
l 1
19
1
00
.00
To
tal
12
6
10
0.0
0
Tota
l 2
1
00
.00
Ta
ble
7-2
7: R
esu
lt o
f A
xle
load
sp
ect
rum
at
loca
tio
n 3
Nea
r P
app
ired
dip
atti
Jn
. Ex.
km k
m 3
1.0
00
(SH
-18
) (C
hen
nai
-Sa
lem
)
Tota
l No
of
axle
s 4
36
Ave
rage
No
of
axle
s p
er c
om
mer
cial
veh
icle
, B
2.3
07
Pro
po
rtio
n o
f Fr
on
t si
ngl
e (
stee
rin
g) A
xles
, K1
0
.43
3
Pro
po
rtio
n o
f R
ear
sin
gle
Axl
es,K
2
0.2
73
Pro
po
rtio
n o
f ta
nd
em A
xles
, K3
0
.28
9
Pro
po
rtio
n o
f Tr
idem
Axl
es, K
4 =
(1
-K1
-K2
-K3
) 0
.00
5
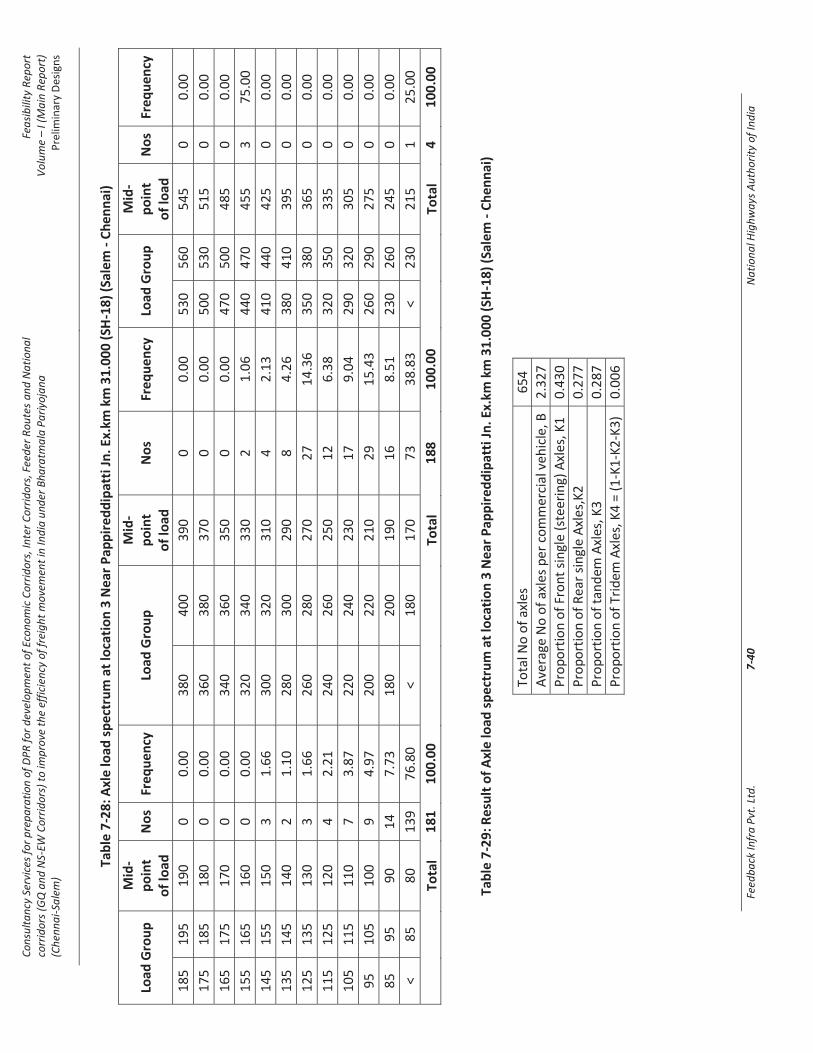
Cons
ulta
ncy
Serv
ices f
or p
repa
ratio
n of
DPR
for d
evel
opm
ent o
f Eco
nom
ic Co
rrid
ors,
Inte
r Cor
ridor
s, Fe
eder
Rou
tes
and
Natio
nal
corr
idor
s (GQ
and
NS-
EW C
orrid
ors)
to im
prov
e th
e ef
ficie
ncy
of fr
eigh
t mov
emen
t in
Indi
a un
der B
hara
tmal
a Pa
riyoj
ana
(Che
nnai
-Sal
em)
Feas
ibili
ty R
epor
t Vo
lum
e –
I (M
ain
Repo
rt)
Pre
limin
ary
Des
ign
s
Feed
back
Infr
a Pv
t. Lt
d.
7-40
N
atio
nal H
ighw
ays A
utho
rity
of In
dia
Tab
le 7
-28
: Axl
e lo
ad s
pe
ctru
m a
t lo
cati
on
3 N
ear
Pap
pir
ed
dip
atti
Jn
. Ex.
km k
m 3
1.0
00
(SH
-18
) (S
ale
m -
Ch
en
nai
)
Load
Gro
up
M
id-
po
int
o
f lo
ad
No
s Fr
eq
ue
ncy
Lo
ad G
rou
p
Mid
-p
oin
t
of
load
N
os
Fre
qu
en
cy
Load
Gro
up
M
id-
po
int
o
f lo
ad
No
s Fr
equ
ency
18
5
19
5
19
0
0
0.0
0
38
0
40
0
39
0
0
0.0
0
53
0
56
0
54
5
0
0.0
0
17
5
18
5
18
0
0
0.0
0
36
0
38
0
37
0
0
0.0
0
50
0
53
0
51
5
0
0.0
0
16
5
17
5
17
0
0
0.0
0
34
0
36
0
35
0
0
0.0
0
47
0
50
0
48
5
0
0.0
0
15
5
16
5
16
0
0
0.0
0
32
0
34
0
33
0
2
1.0
6
44
0
47
0
45
5
3
75
.00
14
5
15
5
15
0
3
1.6
6
30
0
32
0
31
0
4
2.1
3
41
0
44
0
42
5
0
0.0
0
13
5
14
5
14
0
2
1.1
0
28
0
30
0
29
0
8
4.2
6
38
0
41
0
39
5
0
0.0
0
12
5
13
5
13
0
3
1.6
6
26
0
28
0
27
0
27
1
4.3
6
35
0
38
0
36
5
0
0.0
0
11
5
12
5
12
0
4
2.2
1
24
0
26
0
25
0
12
6
.38
3
20
3
50
3
35
0
0
.00
10
5
11
5
11
0
7
3.8
7
22
0
24
0
23
0
17
9
.04
2
90
3
20
3
05
0
0
.00
95
1
05
1
00
9
4
.97
2
00
2
20
2
10
2
9
15
.43
2
60
2
90
2
75
0
0
.00
85
9
5
90
1
4
7.7
3
18
0
20
0
19
0
16
8
.51
2
30
2
60
2
45
0
0
.00
< 8
5
80
1
39
7
6.8
0
< 1
80
1
70
7
3
38
.83
<
2
30
2
15
1
2
5.0
0
Tota
l 1
81
1
00
.00
To
tal
18
8
10
0.0
0
Tota
l 4
1
00
.00
Tab
le 7
-29
: Res
ult
of
Axl
e lo
ad s
pe
ctru
m a
t lo
cati
on
3 N
ear
Pap
pir
edd
ipat
ti J
n. E
x.km
km
31
.00
0 (
SH-1
8)
(Sal
em -
Ch
enn
ai)
Tota
l No
of
axle
s 6
54
Ave
rage
No
of
axle
s p
er c
om
mer
cial
veh
icle
, B
2.3
27
Pro
po
rtio
n o
f Fr
on
t si
ngl
e (s
teer
ing)
Axl
es, K
1
0.4
30
Pro
po
rtio
n o
f R
ear
sin
gle
Axl
es,K
2
0.2
77
Pro
po
rtio
n o
f ta
nd
em A
xles
, K3
0
.28
7
Pro
po
rtio
n o
f Tr
idem
Axl
es, K
4 =
(1
-K1
-K2
-K3
) 0
.00
6
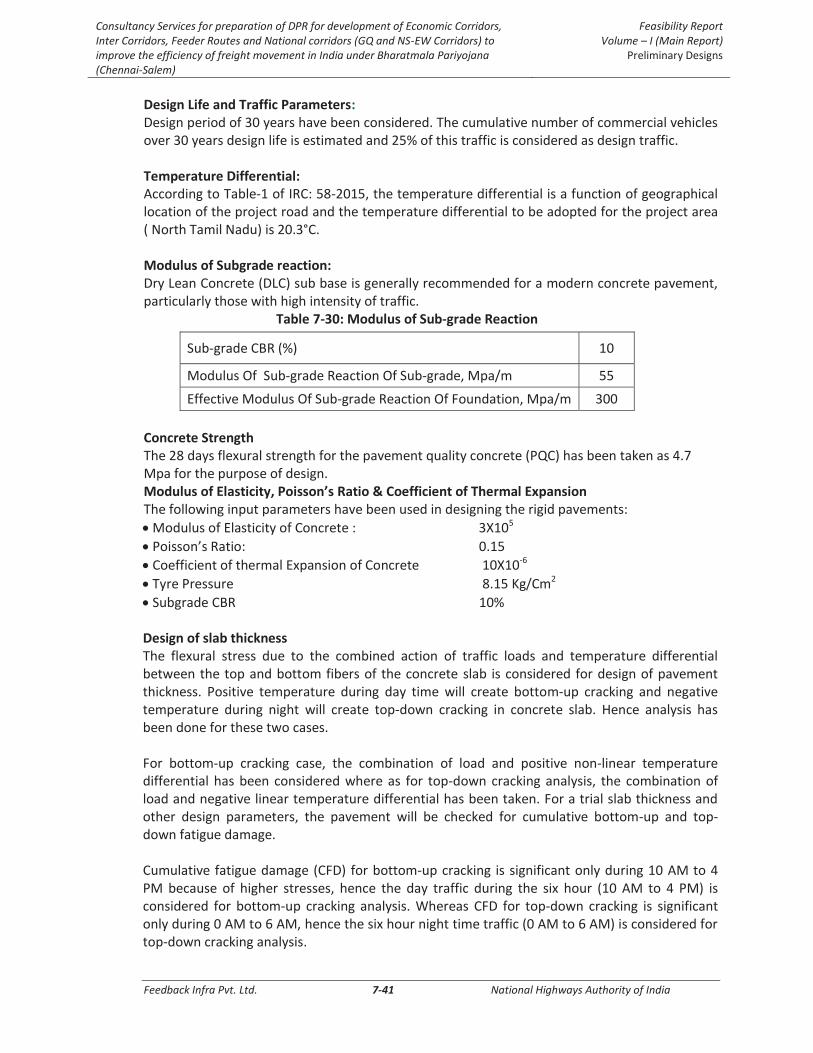
Consultancy Services for preparation of DPR for development of Economic Corridors, Inter Corridors, Feeder Routes and National corridors (GQ and NS-EW Corridors) to improve the efficiency of freight movement in India under Bharatmala Pariyojana (Chennai-Salem)
Feasibility Report Volume – I (Main Report)
Preliminary Designs
Feedback Infra Pvt. Ltd. 7-41 National Highways Authority of India
Design Life and Traffic Parameters: Design period of 30 years have been considered. The cumulative number of commercial vehicles over 30 years design life is estimated and 25% of this traffic is considered as design traffic. Temperature Differential: According to Table-1 of IRC: 58-2015, the temperature differential is a function of geographical location of the project road and the temperature differential to be adopted for the project area ( North Tamil Nadu) is 20.3°C. Modulus of Subgrade reaction: Dry Lean Concrete (DLC) sub base is generally recommended for a modern concrete pavement, particularly those with high intensity of traffic.
Table 7-30: Modulus of Sub-grade Reaction
Sub-grade CBR (%) 10
Modulus Of Sub-grade Reaction Of Sub-grade, Mpa/m 55
Effective Modulus Of Sub-grade Reaction Of Foundation, Mpa/m 300
Concrete Strength The 28 days flexural strength for the pavement quality concrete (PQC) has been taken as 4.7 Mpa for the purpose of design. Modulus of Elasticity, Poisson’s Ratio & Coefficient of Thermal Expansion The following input parameters have been used in designing the rigid pavements:
Modulus of Elasticity of Concrete : 3X10⁵
Poisson’s Ratio: 0.15
Coefficient of thermal Expansion of Concrete 10X10-6
Tyre Pressure 8.15 Kg/Cm2
Subgrade CBR 10% Design of slab thickness The flexural stress due to the combined action of traffic loads and temperature differential between the top and bottom fibers of the concrete slab is considered for design of pavement thickness. Positive temperature during day time will create bottom-up cracking and negative temperature during night will create top-down cracking in concrete slab. Hence analysis has been done for these two cases. For bottom-up cracking case, the combination of load and positive non-linear temperature differential has been considered where as for top-down cracking analysis, the combination of load and negative linear temperature differential has been taken. For a trial slab thickness and other design parameters, the pavement will be checked for cumulative bottom-up and top-down fatigue damage. Cumulative fatigue damage (CFD) for bottom-up cracking is significant only during 10 AM to 4 PM because of higher stresses, hence the day traffic during the six hour (10 AM to 4 PM) is considered for bottom-up cracking analysis. Whereas CFD for top-down cracking is significant only during 0 AM to 6 AM, hence the six hour night time traffic (0 AM to 6 AM) is considered for top-down cracking analysis.

Consultancy Services for preparation of DPR for development of Economic Corridors, Inter Corridors, Feeder Routes and National corridors (GQ and NS-EW Corridors) to improve the efficiency of freight movement in India under Bharatmala Pariyojana (Chennai-Salem)
Feasibility Report Volume – I (Main Report)
Preliminary Designs
Feedback Infra Pvt. Ltd. 7-42 National Highways Authority of India
Design of Sub-Grade and Sub-Base As per clause 5.7.3.6 of IRC 58-2015, 500 mm sub-grade of effective design CBR of 15% and 150 mm Granular Sub-base of minimum 30% CBR shall be provided. This sub-base layer shall act as drainage layer as well. Dry Lean Concrete As per clause 5.4.2 (ii) of manual, Dry lean concrete of 150 mm thickness shall be provided as base for better load distribution, and better support for concrete Paver. Minimum strength requirement of DLC shall be as per MoRTH Clause 601.3.4 “the average compressive strength of each consecutive group of 5 cubes made in accordance with Clause 903.5.1.1 shall not be less than 10 MPa at 7 days. In addition, the minimum compressive strength of any individual cube shall not be less than 7.5 MPa at 7 days.” Pavement Quality Concrete (PQC) M-45 grade concrete has been considered for the Pavement Quality Concrete. The minimum characteristic flexural strength of concrete is to be achieved at site during construction is 4.7 MPa by carrying out mix design for the fly ash mixed PQC. As per IRC: 58-2015, detailed designs of rigid pavement for Main carriageway & toll lanes are given in Annexure 7.3. Based on the above parameters the rigid pavement design is proposed as given in Table 7-31

Consultancy Services for preparation of DPR for development of Economic Corridors, Inter Corridors, Feeder Routes and National corridors (GQ and NS-EW Corridors) to improve the efficiency of freight movement in India under Bharatmala Pariyojana (Chennai-Salem)
Feasibility Report Volume – I (Main Report)
Preliminary Designs
Feedback Infra Pvt. Ltd. 7-43 National Highways Authority of India
Table 7-31: Proposed Rigid Pavement Design
Toll Plaza
Location Direction
Rigid Pavement Composition (mm)
PQC DLC GSB
Sub-grade with
material having
effective CBR of 10%
Plain Dowel Bar Details
Deformed Tie Bar Details
Remarks
For Main Carriageway
I to V
C-S 260 150 150 500 32 mm Dia at 300 mm c/c, 450 mm
long
12 mm Dia at 700 mm c/c, 650 mm
long
S-C 260 150 150 500 32 mm Dia at 300 mm c/c, 450 mm
long
12 mm Dia at 700 mm c/c, 650 mm
long
VI
C-S 280 150 150 500 32 mm Dia at 300 mm c/c, 450 mm
long
12 mm Dia at 700 mm c/c, 650 mm
long
S-C 270 150 150 500 32 mm Dia at 300 mm c/c, 450 mm
long
12 mm Dia at 700 mm c/c, 650 mm
long
VII
C-S 280 150 150 500 32 mm Dia at 300 mm c/c, 450 mm
long
12 mm Dia at 700 mm c/c, 650 mm
long
S-C 280 150 150 500 32 mm Dia at 300 mm c/c, 450 mm
long
12 mm Dia at 700 mm c/c, 650 mm
long
VIII & IX
C-S 250 150 150 500 32 mm Dia at 300 mm c/c, 450 mm
long
12 mm Dia at 700 mm c/c, 650 mm
long
S-C 250 150 150 500 32 mm Dia at 300 mm c/c, 450 mm
long
12 mm Dia at 700 mm c/c, 650 mm
long

Cons
ulta
ncy
Serv
ices
for p
repa
ratio
n of
DPR
for d
evel
opm
ent o
f Eco
nom
ic C
orrid
ors,
Inte
r Cor
ridor
s, Fe
eder
Rou
tes
and
Natio
nal c
orrid
ors
(GQ
and
NS-
EW C
orrid
ors)
to im
prov
e th
e ef
ficie
ncy
of fr
eigh
t mov
emen
t in
Indi
a un
der B
hara
tmal
a Pa
riyoj
ana
(Che
nnai
-Sal
em)
Feas
ibili
ty R
epor
t Vo
lum
e –
I (M
ain
Repo
rt)
Prel
imin
ary
Desig
ns
Feed
back
Infra
Pvt
. Ltd
.
7
-44
Nat
iona
l Hig
hway
s Aut
horit
y of
Indi
a
7.8
PR
OP
OSA
LS F
OR
STR
UC
TUR
ES
Alo
ng
the
pro
ject
str
etch
23
Maj
or
bri
dge
s, 1
MJB
Cu
m R
OB
, 15
6 M
ino
r b
rid
ges,
2 M
NB
Cu
m V
UP
, 2 M
NB
Cu
m V
UP
Gra
de-
II, 1
RO
B C
um
MJB
Cu
m F
lyo
ver
Cu
m
Inte
rch
ange
, 2
RO
B’s
, 3
In
terc
han
ge,
3 T
rum
pet
In
terc
han
ge,
2 D
ou
ble
Tru
mp
et I
nte
rch
ange
, 1
Clo
verl
eaf
Inte
rch
ange
, 9
Fly
ove
rs,
1 M
JB C
um
Fly
ove
r, 2
2
VU
P’s
, 2 V
OP
’s, 3
3 V
UP
Gra
de-
II a
nd
3 t
un
nel
s ar
e p
rop
ose
d. S
um
mar
y o
f st
ruct
ure
s ar
e gi
ven
in b
elo
w T
able
.
Tab
le 7
-32
Su
mm
ary
of
Stru
ctu
res
Sl.
No .
Typ
e o
f st
ruct
ure
N
ew
Co
nst
ruct
ion
R
eco
nst
ruct
ion
Wid
enin
g w
ith
m
ino
r re
pai
rs
Re
tain
+
New
C
on
stru
ctio
n
Re
con
stru
cti
on
+ N
ew
Co
nst
ruct
ion
SR-N
ew
Co
nst
ruti
on
+
MC
W-N
ew
Co
nst
ruct
ion
SR-N
ew
Co
nst
ruti
on
+
MC
W-
Re
con
stru
ctio
n
Tota
l
1
Maj
or
bri
dge
2
3
- -
- -
- -
23
2
Maj
or
bri
dge
Cu
m
Fly
ove
r 1
-
- -
- -
- 1
3
Maj
or
bri
dge
cu
m
RO
B
1
- -
- -
- -
1
4
RO
B C
um
MJB
C
um
Fly
ove
r
Cu
m In
terc
han
ge
1
- -
- -
- -
1
5
Min
or
bri
dge
1
16
1
-
38
1
1
56
6
Flyo
ver
9
- -
- -
- -
9
7
VU
P
22
-
- -
- -
- 2
2
8
VO
P
2
- -
- -
- -
2

Cons
ulta
ncy
Serv
ices
for p
repa
ratio
n of
DPR
for d
evel
opm
ent o
f Eco
nom
ic C
orrid
ors,
Inte
r Cor
ridor
s, Fe
eder
Rou
tes
and
Natio
nal c
orrid
ors
(GQ
and
NS-
EW C
orrid
ors)
to im
prov
e th
e ef
ficie
ncy
of fr
eigh
t mov
emen
t in
Indi
a un
der B
hara
tmal
a Pa
riyoj
ana
(Che
nnai
-Sal
em)
Feas
ibili
ty R
epor
t Vo
lum
e –
I (M
ain
Repo
rt)
Prel
imin
ary
Desig
ns
Feed
back
Infra
Pvt
. Ltd
.
7
-45
Nat
iona
l Hig
hway
s Aut
horit
y of
Indi
a
Sl.
No .
Typ
e o
f st
ruct
ure
N
ew
Co
nst
ruct
ion
R
eco
nst
ruct
ion
Wid
enin
g w
ith
m
ino
r re
pai
rs
Re
tain
+
New
C
on
stru
ctio
n
Re
con
stru
cti
on
+ N
ew
Co
nst
ruct
ion
SR-N
ew
Co
nst
ruti
on
+
MC
W-N
ew
Co
nst
ruct
ion
SR-N
ew
Co
nst
ruti
on
+
MC
W-
Re
con
stru
ctio
n
Tota
l
9
VU
P-G
rad
e-II
33
-
- -
- -
- 3
3
10
M
NB
Cu
m V
UP
2
-
- -
- -
- 2
11
M
NB
Cu
m V
UP
Gra
de
-II
2
2
12
In
terc
han
ge
3
- -
- -
- -
3
13
Tr
um
pet
Inte
rch
ange
3
3
14
D
ou
ble
Tru
mp
et
Inte
rch
ange
2
2
15
C
love
rlea
f In
terc
han
ge
1
1
16
R
OB
2
-
- -
- -
- 2
17
Tu
nn
els
3
- -
- -
- -
3
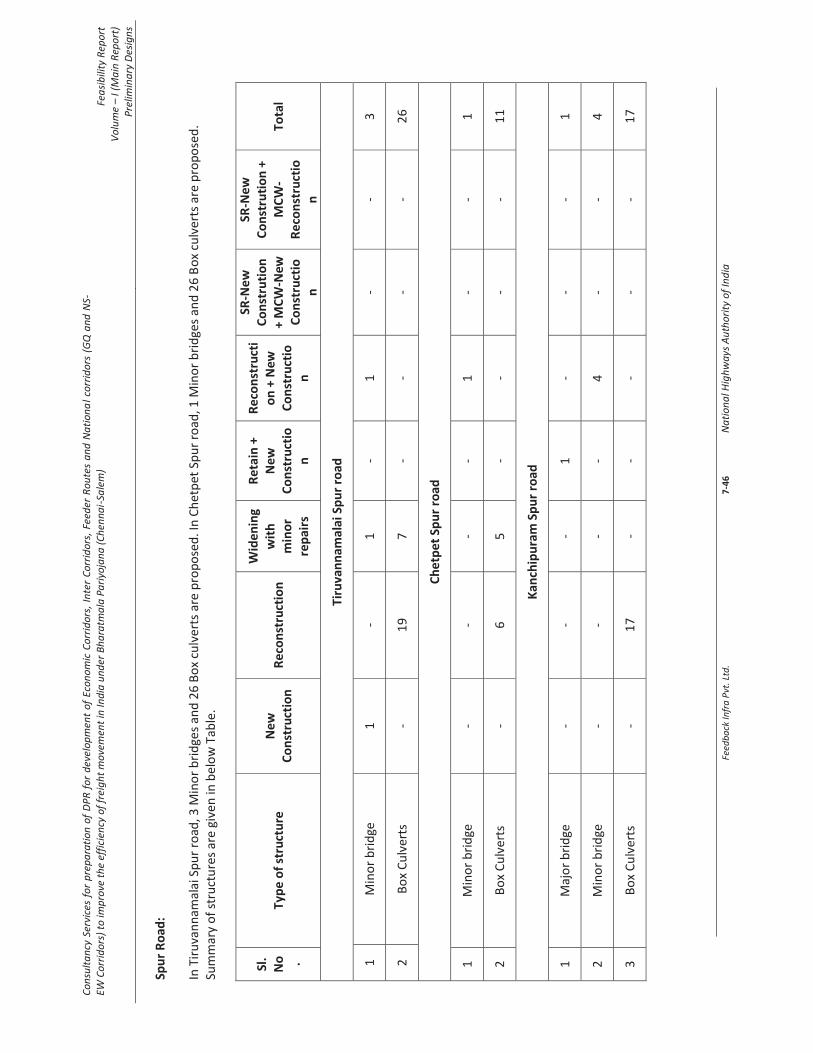
Cons
ulta
ncy
Serv
ices
for p
repa
ratio
n of
DPR
for d
evel
opm
ent o
f Eco
nom
ic C
orrid
ors,
Inte
r Cor
ridor
s, Fe
eder
Rou
tes
and
Natio
nal c
orrid
ors
(GQ
and
NS-
EW C
orrid
ors)
to im
prov
e th
e ef
ficie
ncy
of fr
eigh
t mov
emen
t in
Indi
a un
der B
hara
tmal
a Pa
riyoj
ana
(Che
nnai
-Sal
em)
Feas
ibili
ty R
epor
t Vo
lum
e –
I (M
ain
Repo
rt)
Prel
imin
ary
Desig
ns
Feed
back
Infra
Pvt
. Ltd
.
7
-46
Nat
iona
l Hig
hway
s Aut
horit
y of
Indi
a
Spu
r R
oad
: In
Tir
uva
nn
amal
ai S
pu
r ro
ad, 3
Min
or
bri
dge
s an
d 2
6 B
ox
culv
erts
are
pro
po
sed
. In
Ch
etp
et S
pu
r ro
ad, 1
Min
or
bri
dge
s an
d 2
6 B
ox
culv
erts
are
pro
po
sed
. Su
mm
ary
of
stru
ctu
res
are
give
n in
bel
ow
Tab
le.
Sl.
No .
Typ
e o
f st
ruct
ure
N
ew
Co
nst
ruct
ion
R
eco
nst
ruct
ion
Wid
enin
g w
ith
m
ino
r re
pai
rs
Re
tain
+
New
C
on
stru
ctio
n
Re
con
stru
cti
on
+ N
ew
Co
nst
ruct
ion
SR-N
ew
Co
nst
ruti
on
+
MC
W-N
ew
Co
nst
ruct
ion
SR-N
ew
Co
nst
ruti
on
+
MC
W-
Re
con
stru
ctio
n
Tota
l
Tiru
van
nam
alai
Sp
ur
road
1 M
ino
r b
rid
ge
1
- 1
-
1
- -
3
2 B
ox
Cu
lver
ts
- 1
9
7
- -
- -
26
Ch
etp
et
Spu
r ro
ad
1
Min
or
bri
dge
-
- -
- 1
-
- 1
2
Bo
x C
ulv
erts
-
6
5
- -
- -
11
Kan
chip
ura
m S
pu
r ro
ad
1
Maj
or
bri
dge
-
- -
1
- -
- 1
2
Min
or
bri
dge
-
- -
- 4
-
- 4
3
Bo
x C
ulv
erts
-
17
-
- -
- -
17
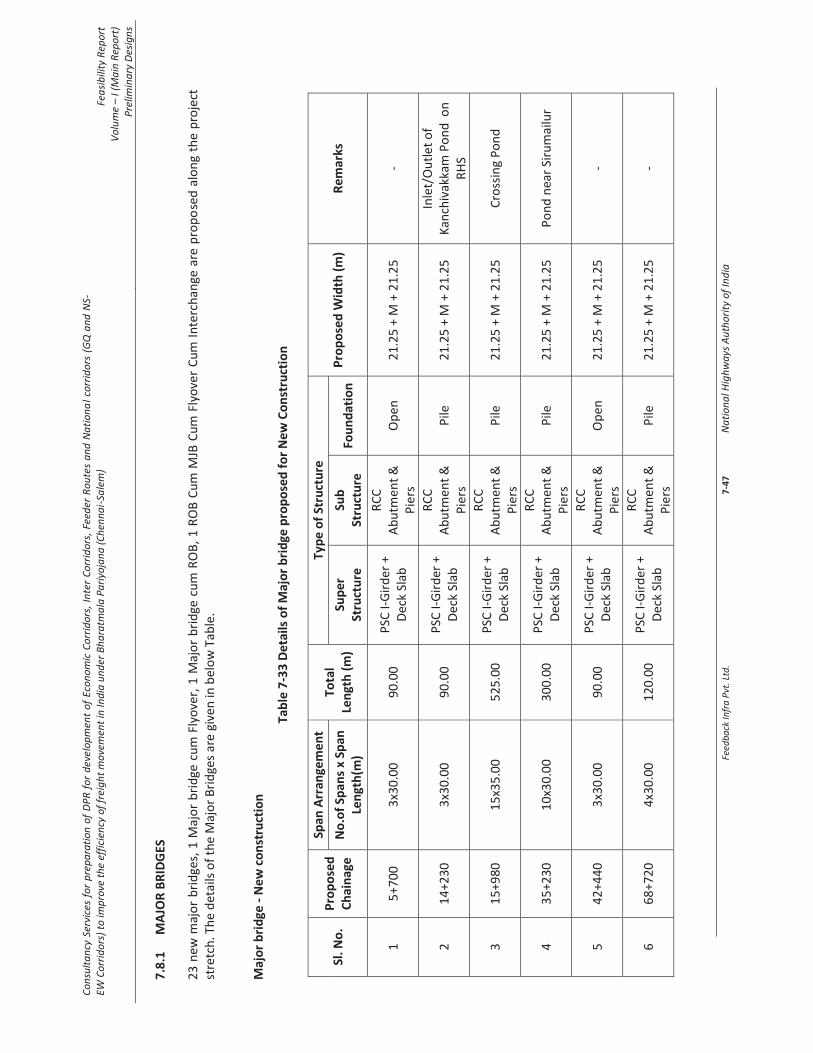
Cons
ulta
ncy
Serv
ices
for p
repa
ratio
n of
DPR
for d
evel
opm
ent o
f Eco
nom
ic C
orrid
ors,
Inte
r Cor
ridor
s, Fe
eder
Rou
tes
and
Natio
nal c
orrid
ors
(GQ
and
NS-
EW C
orrid
ors)
to im
prov
e th
e ef
ficie
ncy
of fr
eigh
t mov
emen
t in
Indi
a un
der B
hara
tmal
a Pa
riyoj
ana
(Che
nnai
-Sal
em)
Feas
ibili
ty R
epor
t Vo
lum
e –
I (M
ain
Repo
rt)
Prel
imin
ary
Desig
ns
Feed
back
Infra
Pvt
. Ltd
.
7
-47
Nat
iona
l Hig
hway
s Aut
horit
y of
Indi
a
7.8
.1M
AJO
R B
RID
GES
23
new
maj
or
bri
dge
s, 1
Maj
or
bri
dge
cu
m F
lyo
ver,
1 M
ajo
r b
rid
ge c
um
RO
B,
1 R
OB
Cu
m M
JB C
um
Fly
ove
r C
um
In
terc
han
ge a
re p
rop
ose
d a
lon
g th
e p
roje
ct
stre
tch
. Th
e d
etai
ls o
f th
e M
ajo
r B
rid
ges
are
give
n in
bel
ow
Tab
le.
Maj
or
bri
dge
- N
ew c
on
stru
ctio
n
Tab
le 7
-33
De
tails
of
Maj
or
bri
dge
pro
po
sed
fo
r N
ew C
on
stru
ctio
n
Sl. N
o.
Pro
po
sed
C
hai
nag
e
Span
Arr
ange
me
nt
Tota
l Le
ngt
h (
m)
Typ
e o
f St
ruct
ure
Pro
po
sed
Wid
th (
m)
Re
mar
ks
No
.of
Span
s x
Span
Le
ngt
h(m
) Su
per
St
ruct
ure
Su
b
Stru
ctu
re
Fou
nd
atio
n
1
5+7
00
3
x30
.00
9
0.0
0
PSC
I-G
ird
er +
D
eck
Slab
RC
C
Ab
utm
ent
&
Pie
rs
Op
en
21
.25
+ M
+ 2
1.2
5
-
2
14
+23
0
3x3
0.0
0
90
.00
P
SC I-
Gir
der
+
Dec
k Sl
ab
RC
C
Ab
utm
ent
&
Pie
rs
Pile
2
1.2
5 +
M +
21
.25
In
let/
Ou
tlet
of
Kan
chiv
akka
m P
on
d o
n
RH
S
3
15
+98
0
15
x35
.00
5
25
.00
PSC
I-G
ird
er +
D
eck
Slab
RC
C
Ab
utm
ent
&
Pie
rs
Pile
2
1.2
5 +
M +
21
.25
C
ross
ing
Po
nd
4
35
+23
0
10
x30
.00
3
00
.00
PSC
I-G
ird
er +
D
eck
Slab
RC
C
Ab
utm
ent
&
Pie
rs
Pile
2
1.2
5 +
M +
21
.25
P
on
d n
ear
Siru
mai
lur
5
42
+44
0
3x3
0.0
0
90
.00
P
SC I-
Gir
der
+
Dec
k Sl
ab
RC
C
Ab
utm
ent
&
Pie
rs
Op
en
21
.25
+ M
+ 2
1.2
5
-
6
68
+72
0
4x3
0.0
0
12
0.0
0
PSC
I-G
ird
er +
D
eck
Slab
RC
C
Ab
utm
ent
&
Pie
rs
Pile
2
1.2
5 +
M +
21
.25
-

Cons
ulta
ncy
Serv
ices
for p
repa
ratio
n of
DPR
for d
evel
opm
ent o
f Eco
nom
ic C
orrid
ors,
Inte
r Cor
ridor
s, Fe
eder
Rou
tes
and
Natio
nal c
orrid
ors
(GQ
and
NS-
EW C
orrid
ors)
to im
prov
e th
e ef
ficie
ncy
of fr
eigh
t mov
emen
t in
Indi
a un
der B
hara
tmal
a Pa
riyoj
ana
(Che
nnai
-Sal
em)
Feas
ibili
ty R
epor
t Vo
lum
e –
I (M
ain
Repo
rt)
Prel
imin
ary
Desig
ns
Feed
back
Infra
Pvt
. Ltd
.
7
-48
Nat
iona
l Hig
hway
s Aut
horit
y of
Indi
a
Sl. N
o.
Pro
po
sed
C
hai
nag
e
Span
Arr
ange
me
nt
Tota
l Le
ngt
h (
m)
Typ
e o
f St
ruct
ure
Pro
po
sed
Wid
th (
m)
Re
mar
ks
No
.of
Span
s x
Span
Le
ngt
h(m
) Su
per
St
ruct
ure
Su
b
Stru
ctu
re
Fou
nd
atio
n
7
70
+72
0
7x3
0.0
0
21
0.0
0
PSC
I-G
ird
er +
D
eck
Slab
RC
C
Ab
utm
ent
&
Pie
rs
Pile
2
1.2
5 +
M +
21
.25
-
8
77
+25
0
6x3
0.0
0
18
0.0
0
PSC
I-G
ird
er +
D
eck
Slab
RC
C
Ab
utm
ent
&
Pie
rs
Op
en
21
.25
+ M
+ 2
1.2
5
-
9
82
+07
0
6x3
0.0
0
18
0.0
0
PSC
I-G
ird
er +
D
eck
Slab
RC
C
Ab
utm
ent
&
Pie
rs
Op
en
2
1.2
5 +
M +
21
.25
-
10
1
17
+0
00
1
0x3
0.0
0
30
0.0
0 P
SC I-
Gir
der
+
Dec
k Sl
ab
RC
C
Ab
utm
ent
&
Pie
rs
Op
en
21
.25
+ M
+ 2
1.2
5
-
11
1
38
+4
80
3
x30
.00
9
0.0
0
PSC
I-G
ird
er +
D
eck
Slab
RC
C
Ab
utm
ent
&
Pie
rs
Op
en
21
.25
+ M
+ 2
1.2
5
Cro
ssin
g C
hey
yar
Riv
er
12
1
40
+9
30
4
x30
.00
1
20
.00
P
SC I-
Gir
der
+
Dec
k Sl
ab
RC
C
Ab
utm
ent
&
Pie
rs
Op
en
21
.25
+ M
+ 2
1.2
5
-
13
1
57
+2
60
4
x30
.00
1
20
.00
P
SC I-
Gir
der
+
Dec
k Sl
ab
RC
C
Ab
utm
ent
&
Pie
rs
Op
en
21
.25
+ M
+ 2
1.2
5
Cro
ssin
g C
hey
yar
Riv
er
14
1
59
+3
95
1
1x3
5.0
0
38
5.0
0 P
SC I-
Gir
der
+
Dec
k Sl
ab
RC
C
Ab
utm
ent
&
Pie
rs
Pile
2
1.2
5 +
M +
21
.25
-
15
1
62
+5
20
1
1x4
0.0
0
44
0.0
0 P
SC I-
Gir
der
+
Dec
k Sl
ab
RC
C
Ab
utm
ent
&
Pie
rs
Pile
2
1.2
5 +
M +
21
.25
-
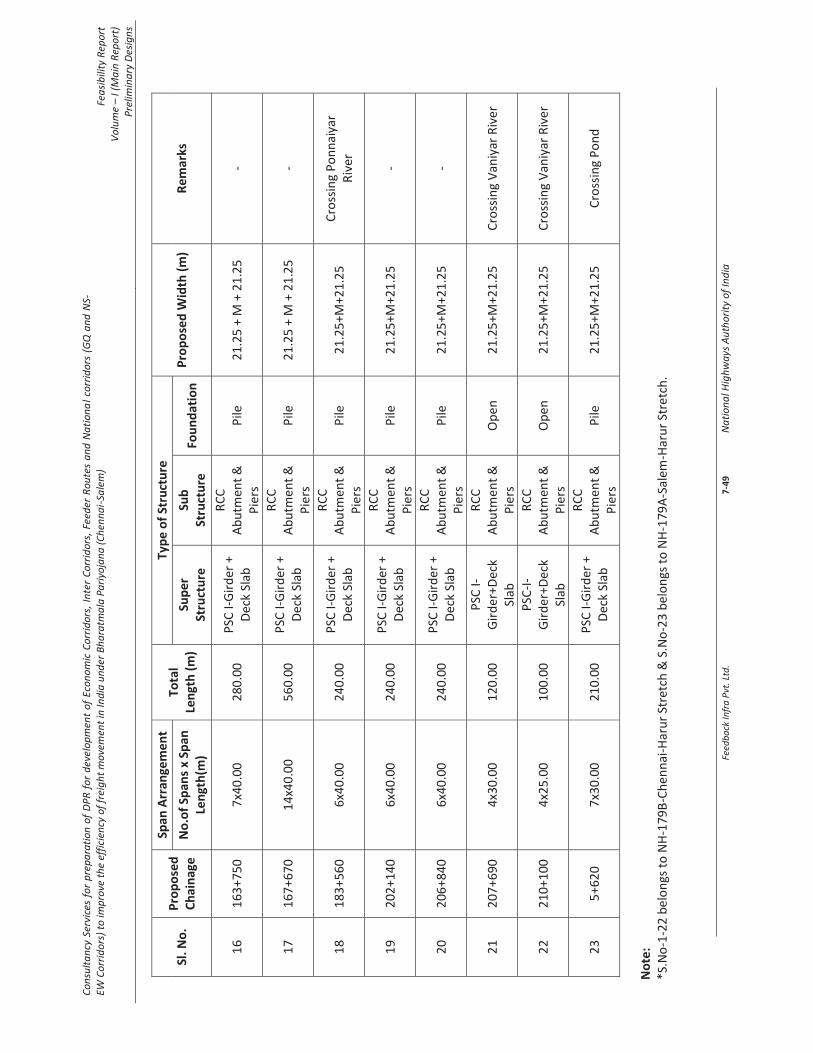
Cons
ulta
ncy
Serv
ices
for p
repa
ratio
n of
DPR
for d
evel
opm
ent o
f Eco
nom
ic C
orrid
ors,
Inte
r Cor
ridor
s, Fe
eder
Rou
tes
and
Natio
nal c
orrid
ors
(GQ
and
NS-
EW C
orrid
ors)
to im
prov
e th
e ef
ficie
ncy
of fr
eigh
t mov
emen
t in
Indi
a un
der B
hara
tmal
a Pa
riyoj
ana
(Che
nnai
-Sal
em)
Feas
ibili
ty R
epor
t Vo
lum
e –
I (M
ain
Repo
rt)
Prel
imin
ary
Desig
ns
Feed
back
Infra
Pvt
. Ltd
.
7
-49
Nat
iona
l Hig
hway
s Aut
horit
y of
Indi
a
Sl. N
o.
Pro
po
sed
C
hai
nag
e
Span
Arr
ange
me
nt
Tota
l Le
ngt
h (
m)
Typ
e o
f St
ruct
ure
Pro
po
sed
Wid
th (
m)
Re
mar
ks
No
.of
Span
s x
Span
Le
ngt
h(m
) Su
per
St
ruct
ure
Su
b
Stru
ctu
re
Fou
nd
atio
n
16
1
63
+7
50
7
x40
.00
2
80
.00
P
SC I-
Gir
der
+
Dec
k Sl
ab
RC
C
Ab
utm
ent
&
Pie
rs
Pile
2
1.2
5 +
M +
21
.25
-
17
1
67
+6
70
1
4x4
0.0
0
56
0.0
0 P
SC I-
Gir
der
+
Dec
k Sl
ab
RC
C
Ab
utm
ent
&
Pie
rs
Pile
2
1.2
5 +
M +
21
.25
-
18
1
83
+5
60
6
x40
.00
2
40
.00
P
SC I-
Gir
der
+
Dec
k Sl
ab
RC
C
Ab
utm
ent
&
Pie
rs
Pile
2
1.2
5+M
+21
.25
C
ross
ing
Po
nn
aiya
r R
iver
19
2
02
+1
40
6
x40
.00
2
40
.00
P
SC I-
Gir
der
+
Dec
k Sl
ab
RC
C
Ab
utm
ent
&
Pie
rs
Pile
2
1.2
5+M
+21
.25
-
20
2
06
+8
40
6
x40
.00
2
40
.00
P
SC I-
Gir
der
+
Dec
k Sl
ab
RC
C
Ab
utm
ent
&
Pie
rs
Pile
2
1.2
5+M
+21
.25
-
21
2
07
+6
90
4
x30
.00
1
20
.00
P
SC I-
Gir
der
+Dec
k Sl
ab
RC
C
Ab
utm
ent
&
Pie
rs
Op
en
21
.25
+M+2
1.2
5
Cro
ssin
g V
aniy
ar R
iver
22
2
10
+1
00
4
x25
.00
1
00
.00
P
SC-I
-G
ird
er+D
eck
Slab
RC
C
Ab
utm
ent
&
Pie
rs
Op
en
21
.25
+M+2
1.2
5
Cro
ssin
g V
aniy
ar R
iver
23
5
+6
20
7x3
0.0
0
21
0.0
0
PSC
I-G
ird
er +
D
eck
Slab
RC
C
Ab
utm
ent
&
Pie
rs
Pile
2
1.2
5+M
+21
.25
C
ross
ing
Po
nd
No
te:
*S.N
o-1
-22
bel
on
gs t
o N
H-1
79
B-C
hen
nai
-Har
ur
Stre
tch
& S
.No
-23
bel
on
gs t
o N
H-1
79
A-S
alem
-Har
ur
Stre
tch
.

Cons
ulta
ncy
Serv
ices
for p
repa
ratio
n of
DPR
for d
evel
opm
ent o
f Eco
nom
ic C
orrid
ors,
Inte
r Cor
ridor
s, Fe
eder
Rou
tes
and
Natio
nal c
orrid
ors
(GQ
and
NS-
EW C
orrid
ors)
to im
prov
e th
e ef
ficie
ncy
of fr
eigh
t mov
emen
t in
Indi
a un
der B
hara
tmal
a Pa
riyoj
ana
(Che
nnai
-Sal
em)
Feas
ibili
ty R
epor
t Vo
lum
e –
I (M
ain
Repo
rt)
Prel
imin
ary
Desig
ns
Feed
back
Infra
Pvt
. Ltd
.
7
-50
Nat
iona
l Hig
hway
s Aut
horit
y of
Indi
a
7.8
.2M
ajo
r b
rid
ge C
um
Fly
ove
r -
New
co
nst
ruct
ion
The
det
ails
of
the
Maj
or
Bri
dge
Cu
m F
lyo
ver
are
give
n in
bel
ow
Tab
le.
Ta
ble
7-3
4: D
eta
ils o
f M
ajo
r b
rid
ge C
um
Fly
ove
r p
rop
ose
d f
or
New
Co
nst
ruct
ion
Sl. N
o.
Pro
po
sed
C
hai
nag
e
Span
Arr
ange
me
nt
Tota
l Le
ngt
h (
m)
Typ
e o
f St
ruct
ure
P
rop
ose
d W
idth
(m
) R
em
arks
N
o.o
f Sp
ans
x Sp
an
Len
gth
(m)
Sup
er
Stru
ctu
re
Sub
Str
uct
ure
Fo
un
dat
ion
1
60
+11
0
2x3
0.0
0 (
Po
nd
) +
1x3
0.0
0 (
Ro
ad)
+ 3
x30
.00
(P
on
d)
18
0.0
0
PSC
I-G
ird
er
+ D
eck
Slab
R
CC
Ab
utm
ent
& P
iers
P
ile
21
.25
+ M
+
21
.25
Cro
ssin
g SH
-11
6; L
HS-
Van
dav
asi,
RH
S-K
anch
ipu
ram
7.8
.3M
ajo
r b
rid
ge C
um
RO
B -
New
co
nst
ruct
ion
The
det
ails
of
the
Maj
or
Bri
dge
Cu
m R
OB
are
giv
en in
bel
ow
Tab
le.
Ta
ble
7-3
5: D
eta
ils o
f M
ajo
r b
rid
ge C
um
RO
B p
rop
ose
d f
or
New
Co
nst
ruct
ion
Sl. N
o.
Pro
po
sed
C
hai
nag
e
Span
Arr
ange
me
nt
Tota
l Le
ngt
h
(m)
Typ
e o
f St
ruct
ure
P
rop
ose
d W
idth
(m
) R
em
arks
N
o.o
f Sp
ans
x Sp
an
Len
gth
(m)
Sup
er S
tru
ctu
re
Sub
St
ruct
ure
Fo
un
dat
ion
1
12
0+
54
5
7x3
0.0
0 +
1x4
5.4
0 +
1
x20
.00
2
75
.40
Bo
w s
trin
g G
ird
er
& P
SC I-
Gir
der
&
RC
C I-
Gir
der
+
Dec
k Sl
ab
RC
C
Ab
utm
ent
& P
iers
Pile
&
Op
en
21
.25
+ M
+
21
.25
Cro
ssin
g R
ailw
ay L
ine&
P
on
d; L
HS-
Thu
rin
jap
ura
m
Rai
lway
Sta
tio
n; R
HS-
Kal
amb
ur
Rai
lway
Sta
tio
n

Cons
ulta
ncy
Serv
ices
for p
repa
ratio
n of
DPR
for d
evel
opm
ent o
f Eco
nom
ic C
orrid
ors,
Inte
r Cor
ridor
s, Fe
eder
Rou
tes
and
Natio
nal c
orrid
ors
(GQ
and
NS-
EW C
orrid
ors)
to im
prov
e th
e ef
ficie
ncy
of fr
eigh
t mov
emen
t in
Indi
a un
der B
hara
tmal
a Pa
riyoj
ana
(Che
nnai
-Sal
em)
Feas
ibili
ty R
epor
t Vo
lum
e –
I (M
ain
Repo
rt)
Prel
imin
ary
Desig
ns
Feed
back
Infra
Pvt
. Ltd
.
7
-51
Nat
iona
l Hig
hway
s Aut
horit
y of
Indi
a
7.8
.4R
OB
Cu
m M
JB C
um
Fly
ove
r C
um
Inte
rch
ange
- N
ew c
on
stru
ctio
n
The
det
ails
of
the
RO
B C
um
MJB
Cu
m F
lyo
ver
Cu
m In
terc
han
ge a
re g
iven
in b
elo
w T
able
.
Tab
le 7
-36
: De
tails
of
RO
B C
um
Fly
ove
r C
um
Inte
rch
ange
Cu
m M
JB p
rop
ose
d f
or
New
Co
nst
ruct
ion
Sl. N
o.
Pro
po
sed
C
hai
nag
e
Span
Arr
ange
me
nt
Tota
l Le
ngt
h
(m)
Typ
e o
f St
ruct
ure
P
rop
ose
d
Wid
th (
m)
Re
mar
ks
No
.of
Span
s x
Span
Len
gth
(m)
Sup
er
Stru
ctu
re
Sub
St
ruct
ure
Fo
un
dat
ion
1
24
+58
0
3x2
0.0
0+1
x37
.20
(Rai
lway
Sp
an)+
2x2
5.0
0+1
x25
.00
(SH
- 58
C
ross
ing)
+6x3
5.0
0+2
8x3
5.0
0(R
iver
Sp
ans)
, Lo
op
-1
x20
.00
+1x3
7.2
0(R
ailw
ay
Span
)+6
x35
.00
(Po
nd
)
16
29
.40
RC
C-I
-Gir
der
&
PSC
-I-G
ird
er &
St
eel
Co
mp
osi
te
Gir
der
(Rai
lway
Sp
an)
+ D
eck
Slab
RC
C
Ab
utm
ent
&
Pie
rs
Pile
2
1.2
5 +
M +
2
1.2
5
Cro
ssin
g P
alar
R
iver
an
d S
H-5
8
and
Rai
lway
tr
ack;
LHS-
Vill
iyam
bak
kam
R
ailw
ay
Stat
ion
;RH
S-P
alu
r ra
ilway
Sta
tio
n
N
ote
: *S
.No
-1 b
elo
ngs
to
NH
-17
9B
-Ch
enn
ai-H
aru
r St
retc
h.
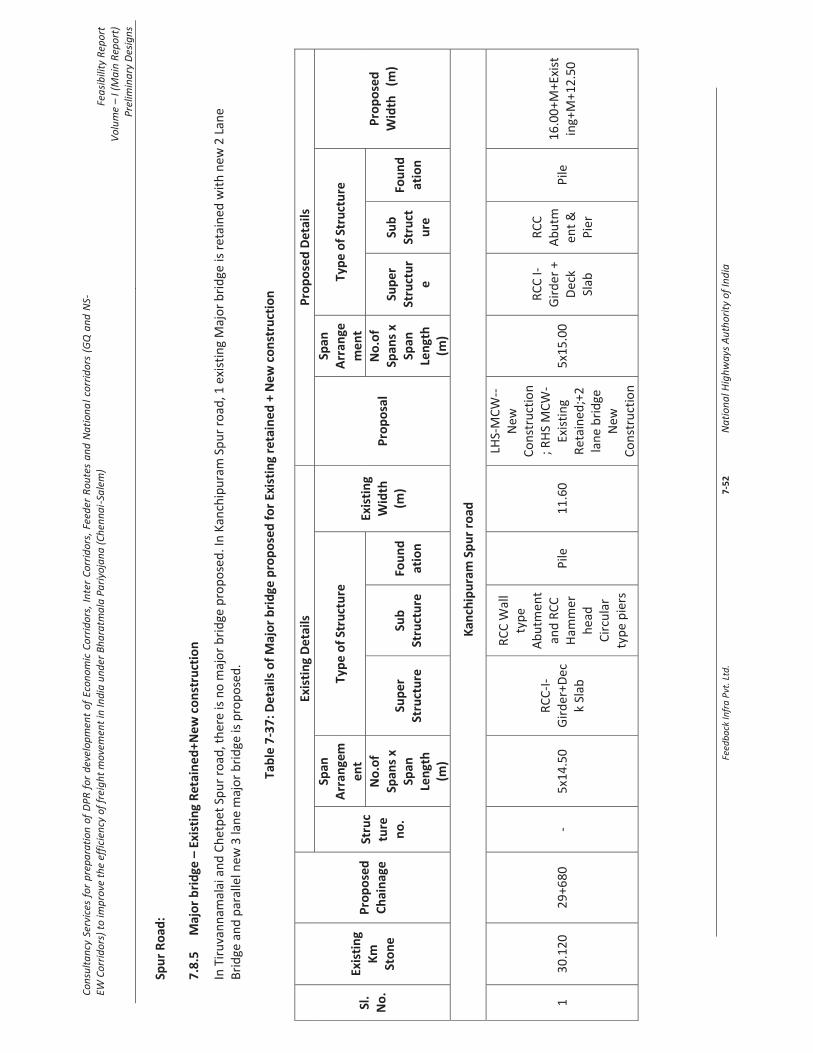
Cons
ulta
ncy
Serv
ices
for p
repa
ratio
n of
DPR
for d
evel
opm
ent o
f Eco
nom
ic C
orrid
ors,
Inte
r Cor
ridor
s, Fe
eder
Rou
tes
and
Natio
nal c
orrid
ors
(GQ
and
NS-
EW C
orrid
ors)
to im
prov
e th
e ef
ficie
ncy
of fr
eigh
t mov
emen
t in
Indi
a un
der B
hara
tmal
a Pa
riyoj
ana
(Che
nnai
-Sal
em)
Feas
ibili
ty R
epor
t Vo
lum
e –
I (M
ain
Repo
rt)
Prel
imin
ary
Desig
ns
Feed
back
Infra
Pvt
. Ltd
.
7
-52
Nat
iona
l Hig
hway
s Aut
horit
y of
Indi
a
Spu
r R
oad
: 7
.8.5
Maj
or
bri
dge
– E
xist
ing
Ret
ain
ed
+N
ew
co
nst
ruct
ion
In T
iru
van
nam
alai
an
d C
het
pet
Sp
ur
road
, th
ere
is n
o m
ajo
r b
rid
ge p
rop
ose
d. I
n K
anch
ipu
ram
Sp
ur
road
, 1 e
xist
ing
Maj
or
bri
dge
is r
etai
ned
wit
h n
ew 2
Lan
e B
rid
ge a
nd
par
alle
l new
3 la
ne
maj
or
bri
dge
is p
rop
ose
d.
Tab
le 7
-37
: De
tails
of
Maj
or
bri
dge
pro
po
sed
fo
r Ex
isti
ng
reta
ine
d +
New
co
nst
ruct
ion
Sl.
No
.
Exis
tin
g K
m
Sto
ne
Pro
po
sed
C
hai
nag
e
Exis
tin
g D
eta
ils
Pro
po
sed
De
tails
Stru
ctu
re
no
.
Span
A
rran
gem
en
t Ty
pe
of
Stru
ctu
re
Exis
tin
g W
idth
(m
) P
rop
osa
l
Span
A
rran
gem
en
t Ty
pe
of
Stru
ctu
re
Pro
po
sed
W
idth
(m
) N
o.o
f Sp
ans
x Sp
an
Len
gth
(m
)
Sup
er
Stru
ctu
re
Sub
St
ruct
ure
Fo
un
dat
ion
No
.of
Span
s x
Span
Le
ngt
h
(m)
Sup
er
Stru
ctu
re
Sub
St
ruct
ure
Fou
nd
atio
n
Kan
chip
ura
m S
pu
r ro
ad
1 3
0.1
20
2
9+6
80
-
5x1
4.5
0
RC
C-I
-G
ird
er+D
eck
Slab
RC
C W
all
typ
e A
bu
tmen
t an
d R
CC
H
amm
er
hea
d
Cir
cula
r ty
pe
pie
rs
Pile
1
1.6
0
LHS-
MC
W--
New
C
on
stru
ctio
n; R
HS
MC
W-
Exis
tin
g R
etai
ned
;+2
la
ne
bri
dge
N
ew
Co
nst
ruct
ion
5x1
5.0
0
RC
C I-
Gir
der
+
De
ck
Slab
RC
C
Ab
utm
ent
&
Pie
r
Pile
1
6.0
0+M
+Exi
stin
g+M
+12
.50

Cons
ulta
ncy
Serv
ices
for p
repa
ratio
n of
DPR
for d
evel
opm
ent o
f Eco
nom
ic C
orrid
ors,
Inte
r Cor
ridor
s, Fe
eder
Rou
tes
and
Natio
nal c
orrid
ors
(GQ
and
NS-
EW C
orrid
ors)
to im
prov
e th
e ef
ficie
ncy
of fr
eigh
t mov
emen
t in
Indi
a un
der B
hara
tmal
a Pa
riyoj
ana
(Che
nnai
-Sal
em)
Feas
ibili
ty R
epor
t Vo
lum
e –
I (M
ain
Repo
rt)
Prel
imin
ary
Desig
ns
Feed
back
Infra
Pvt
. Ltd
.
7
-53
Nat
iona
l Hig
hway
s Aut
horit
y of
Indi
a
7.8
.6M
ino
r B
rid
ges
15
6 M
ino
r b
rid
ges
are
pro
po
sed
alo
ng
the
pro
ject
str
etch
of
wh
ich
11
6 m
ino
r b
rid
ges
are
pro
po
sed
fo
r n
ew c
on
stru
ctio
n,
1 m
ino
r b
rid
ge i
s p
rop
ose
d f
or
reco
nst
ruct
ion
, 38
min
or
bri
dge
s ar
e p
rop
ose
d f
or
new
co
nst
ruct
ion
wit
h s
ervi
ce r
oad
on
bo
th s
ides
, 1 e
xist
ing
min
or
bri
dge
is p
rop
ose
d f
or
rec
on
stru
ctio
n o
n
on
e si
de
mai
n c
arri
agew
ay a
nd
par
alle
l ne
w b
rid
ge o
n o
ther
sid
e m
ain
car
riag
eway
an
d n
ew s
ervi
ce r
oad
bri
dge
s ar
e p
rop
ose
d.
Min
or
bri
dge
- N
ew c
on
stru
ctio
n
Tab
le 7
-38
: De
tails
of
Min
or
Bri
dge
s p
rop
ose
d f
or
Ne
w C
on
stru
ctio
n
Sl. N
o.
Pro
po
sed
C
hai
nag
e
Span
Arr
ange
me
nt
Typ
e o
f St
ruct
ure
P
rop
ose
d W
idth
(m
) R
em
arks
N
o.o
f Sp
ans
x Sp
an
Len
gth
(m)
Sup
er S
tru
ctu
re
Sub
St
ruct
ure
Fo
un
dat
ion
1
5.0
60
1
x20
.00
R
CC
I-G
ird
er +
D
eck
Slab
R
CC
A
bu
tmen
t O
pen
2
1.2
5 +
M +
21
.25
-
2
12
.96
0
1x1
0.0
0
RC
C S
olid
Sla
b
RC
C
Ab
utm
ent
Op
en
21
.25
+ M
+ 2
1.2
5
Nal
a tr
ain
ing
to b
e d
on
e o
n
RH
S o
f le
ngt
h 4
00
m
3
13
.62
0
1x1
0.0
0
RC
C S
olid
Sla
b
RC
C
Ab
utm
ent
Op
en
21
.25
+ M
+ 2
1.2
5
In g
rad
e se
par
ato
r ap
pro
ach
; N
ala
Trai
nin
g to
be
do
ne
on
R
HS
of
len
gth
25
0m
4
26
.65
0
2x3
0.0
0
PSC
I-G
ird
er +
D
eck
Slab
RC
C
Ab
utm
ent
&
Pie
r P
ile
21
.25
+ M
+ 2
1.2
5
Cro
ssin
g p
on
d
5
26
.98
0
2x3
0.0
0
PSC
I-G
ird
er +
D
eck
Slab
RC
C
Ab
utm
ent
&
Pie
r P
ile
21
.25
+ M
+ 2
1.2
5
-
6
28
.61
5
1x1
0.0
0
RC
C S
olid
Sla
b
RC
C
Ab
utm
ent
Op
en
21
.25
+ M
+ 2
1.2
5
-
7
30
.08
0
2x2
0.0
0
RC
C I-
Gir
der
+
Dec
k Sl
ab
RC
C
Ab
utm
ent
&
Pie
r O
pen
2
1.2
5 +
M +
21
.25
-

Cons
ulta
ncy
Serv
ices
for p
repa
ratio
n of
DPR
for d
evel
opm
ent o
f Eco
nom
ic C
orrid
ors,
Inte
r Cor
ridor
s, Fe
eder
Rou
tes
and
Natio
nal c
orrid
ors
(GQ
and
NS-
EW C
orrid
ors)
to im
prov
e th
e ef
ficie
ncy
of fr
eigh
t mov
emen
t in
Indi
a un
der B
hara
tmal
a Pa
riyoj
ana
(Che
nnai
-Sal
em)
Feas
ibili
ty R
epor
t Vo
lum
e –
I (M
ain
Repo
rt)
Prel
imin
ary
Desig
ns
Feed
back
Infra
Pvt
. Ltd
.
7
-54
Nat
iona
l Hig
hway
s Aut
horit
y of
Indi
a
Sl. N
o.
Pro
po
sed
C
hai
nag
e
Span
Arr
ange
me
nt
Typ
e o
f St
ruct
ure
P
rop
ose
d W
idth
(m
) R
em
arks
N
o.o
f Sp
ans
x Sp
an
Len
gth
(m)
Sup
er S
tru
ctu
re
Sub
St
ruct
ure
Fo
un
dat
ion
8
31
.87
0
1x8
.00
R
CC
Bo
x 2
1.2
5 +
M +
21
.25
-
9
32
.87
5
1x8
.00
R
CC
Bo
x 2
1.2
5 +
M +
21
.25
N
ala
trai
nin
g to
be
do
ne
on
R
HS
10
3
3.0
00
1
x8.0
0
RC
C B
ox
21
.25
+ M
+ 2
1.2
5
Nal
a tr
ain
ing
to b
e d
on
e o
n
LHS
11
3
3.6
70
1
x10
.00
R
CC
So
lid S
lab
R
CC
A
bu
tmen
t O
pen
2
1.2
5 +
M +
21
.25
N
ala
trai
nin
g to
be
do
ne
12
3
5.6
65
1
x8.0
0
RC
C B
ox
21
.25
+ M
+ 2
1.2
5
-
13
3
8.4
30
1
x8.0
0
RC
C B
ox
21
.25
+ M
+ 2
1.2
5
In g
rad
e se
par
ato
r ap
pro
ach
14
3
8.6
20
2
x20
.00
R
CC
I-G
ird
er +
D
eck
Slab
RC
C
Ab
utm
ent
&
Pie
r O
pen
2
1.2
5 +
M +
21
.25
-
15
4
0.8
70
2
x20
.00
R
CC
I-G
ird
er +
D
eck
Slab
RC
C
Ab
utm
ent
&
Pie
r O
pen
2
1.2
5 +
M +
21
.25
-
16
4
2.0
90
1
x8.0
0
RC
C B
ox
21
.25
+ M
+ 2
1.2
5
Nal
a Tr
ain
ing
to b
e d
on
e o
n
bo
thsi
des
17
4
2.9
30
2
x30
.00
P
SC I-
Gir
der
+
Dec
k Sl
ab
RC
C
Ab
utm
ent
&
Pie
r O
pen
2
1.2
5 +
M +
21
.25
-
18
4
3.5
80
1
x15
.00
R
CC
I-G
ird
er +
D
eck
Slab
R
CC
A
bu
tmen
t
Op
en
21
.25
+ M
+ 2
1.2
5
In g
rad
e se
par
ato
r ap
pro
ach
; N
ala
Trai
nin
g to
be
do
ne
19
4
5.6
00
1
x8.0
0
RC
C B
ox
21
.25
+ M
+ 2
1.2
5
-
20
4
6.0
20
1
x8.0
0
RC
C B
ox
21
.25
+ M
+ 2
1.2
5
Nal
a Tr
ain
ing
to b
e d
on
e o
n
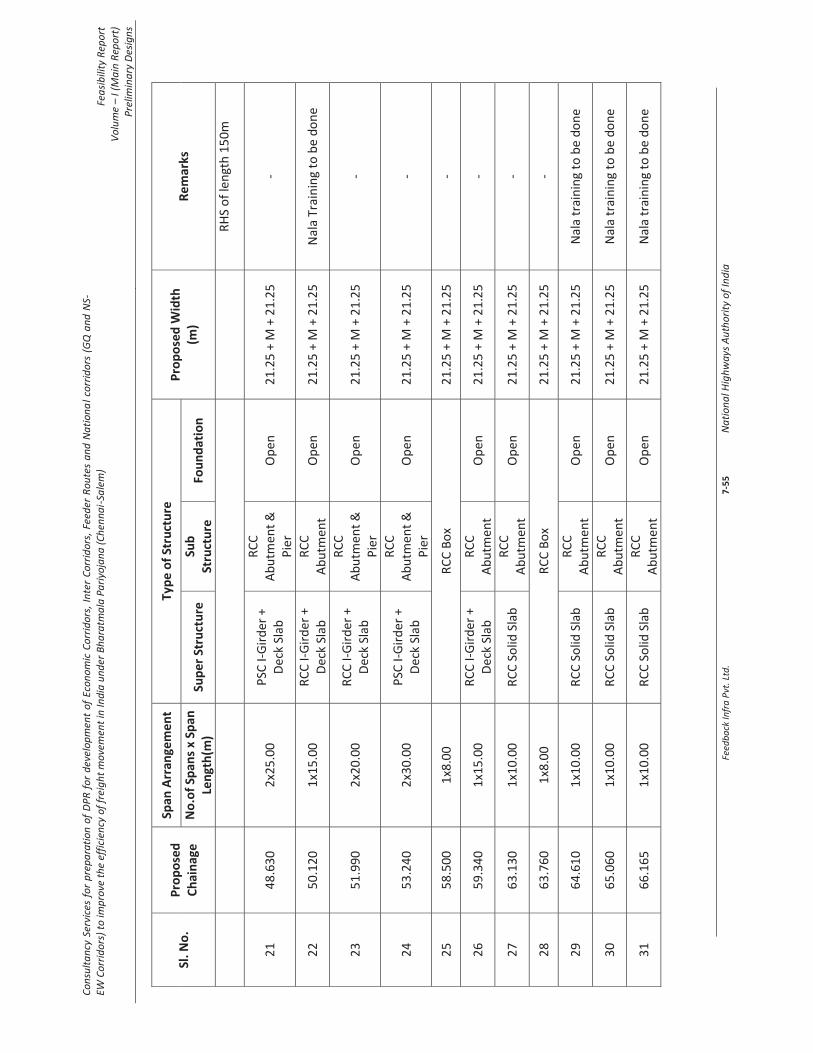
Cons
ulta
ncy
Serv
ices
for p
repa
ratio
n of
DPR
for d
evel
opm
ent o
f Eco
nom
ic C
orrid
ors,
Inte
r Cor
ridor
s, Fe
eder
Rou
tes
and
Natio
nal c
orrid
ors
(GQ
and
NS-
EW C
orrid
ors)
to im
prov
e th
e ef
ficie
ncy
of fr
eigh
t mov
emen
t in
Indi
a un
der B
hara
tmal
a Pa
riyoj
ana
(Che
nnai
-Sal
em)
Feas
ibili
ty R
epor
t Vo
lum
e –
I (M
ain
Repo
rt)
Prel
imin
ary
Desig
ns
Feed
back
Infra
Pvt
. Ltd
.
7
-55
Nat
iona
l Hig
hway
s Aut
horit
y of
Indi
a
Sl. N
o.
Pro
po
sed
C
hai
nag
e
Span
Arr
ange
me
nt
Typ
e o
f St
ruct
ure
P
rop
ose
d W
idth
(m
) R
em
arks
N
o.o
f Sp
ans
x Sp
an
Len
gth
(m)
Sup
er S
tru
ctu
re
Sub
St
ruct
ure
Fo
un
dat
ion
RH
S o
f le
ngt
h 1
50
m
21
4
8.6
30
2
x25
.00
P
SC I-
Gir
der
+
Dec
k Sl
ab
RC
C
Ab
utm
ent
&
Pie
r O
pen
2
1.2
5 +
M +
21
.25
-
22
5
0.1
20
1
x15
.00
R
CC
I-G
ird
er +
D
eck
Slab
R
CC
A
bu
tmen
t
Op
en
21
.25
+ M
+ 2
1.2
5
Nal
a Tr
ain
ing
to b
e d
on
e
23
5
1.9
90
2
x20
.00
R
CC
I-G
ird
er +
D
eck
Slab
RC
C
Ab
utm
ent
&
Pie
r O
pen
2
1.2
5 +
M +
21
.25
-
24
5
3.2
40
2
x30
.00
P
SC I-
Gir
der
+
Dec
k Sl
ab
RC
C
Ab
utm
ent
&
Pie
r O
pen
2
1.2
5 +
M +
21
.25
-
25
5
8.5
00
1
x8.0
0
RC
C B
ox
21
.25
+ M
+ 2
1.2
5
-
26
5
9.3
40
1
x15
.00
R
CC
I-G
ird
er +
D
eck
Slab
R
CC
A
bu
tmen
t O
pen
2
1.2
5 +
M +
21
.25
-
27
6
3.1
30
1
x10
.00
R
CC
So
lid S
lab
R
CC
A
bu
tmen
t O
pen
2
1.2
5 +
M +
21
.25
-
28
6
3.7
60
1
x8.0
0
RC
C B
ox
21
.25
+ M
+ 2
1.2
5
-
29
6
4.6
10
1
x10
.00
R
CC
So
lid S
lab
R
CC
A
bu
tmen
t O
pen
2
1.2
5 +
M +
21
.25
N
ala
trai
nin
g to
be
do
ne
30
6
5.0
60
1
x10
.00
R
CC
So
lid S
lab
R
CC
A
bu
tmen
t O
pen
2
1.2
5 +
M +
21
.25
N
ala
trai
nin
g to
be
do
ne
31
6
6.1
65
1
x10
.00
R
CC
So
lid S
lab
R
CC
A
bu
tmen
t O
pen
2
1.2
5 +
M +
21
.25
N
ala
trai
nin
g to
be
do
ne
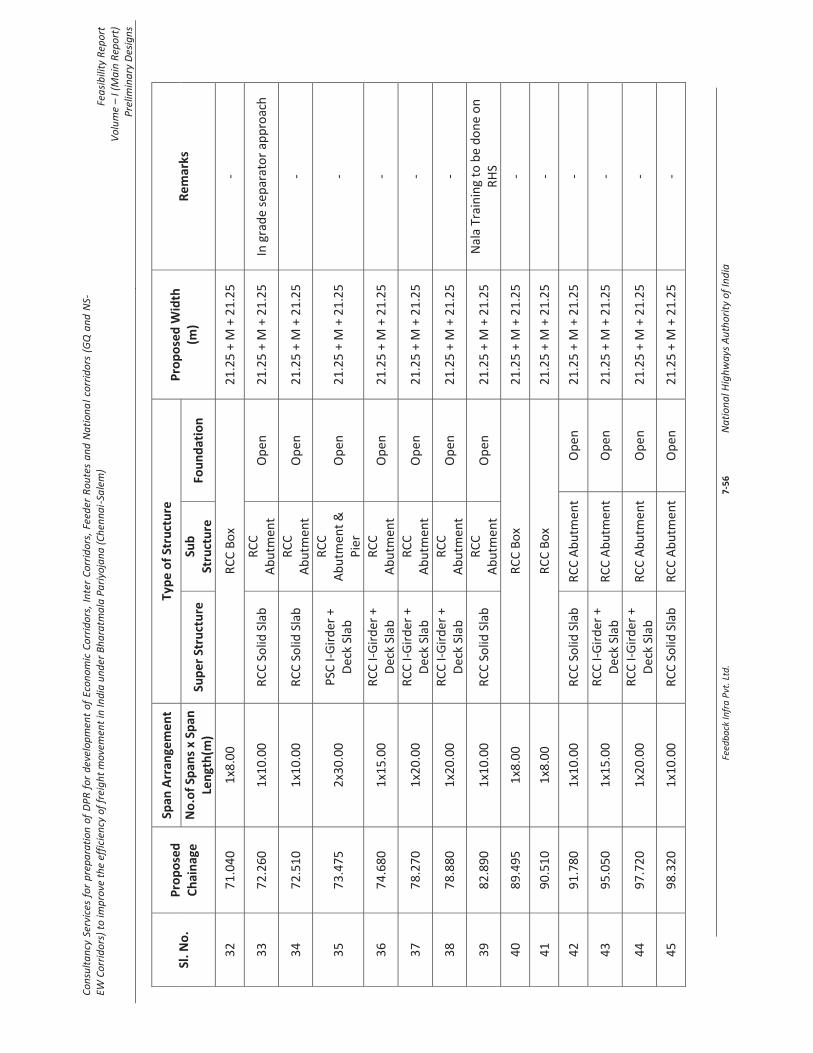
Cons
ulta
ncy
Serv
ices
for p
repa
ratio
n of
DPR
for d
evel
opm
ent o
f Eco
nom
ic C
orrid
ors,
Inte
r Cor
ridor
s, Fe
eder
Rou
tes
and
Natio
nal c
orrid
ors
(GQ
and
NS-
EW C
orrid
ors)
to im
prov
e th
e ef
ficie
ncy
of fr
eigh
t mov
emen
t in
Indi
a un
der B
hara
tmal
a Pa
riyoj
ana
(Che
nnai
-Sal
em)
Feas
ibili
ty R
epor
t Vo
lum
e –
I (M
ain
Repo
rt)
Prel
imin
ary
Desig
ns
Feed
back
Infra
Pvt
. Ltd
.
7
-56
Nat
iona
l Hig
hway
s Aut
horit
y of
Indi
a
Sl. N
o.
Pro
po
sed
C
hai
nag
e
Span
Arr
ange
me
nt
Typ
e o
f St
ruct
ure
P
rop
ose
d W
idth
(m
) R
em
arks
N
o.o
f Sp
ans
x Sp
an
Len
gth
(m)
Sup
er S
tru
ctu
re
Sub
St
ruct
ure
Fo
un
dat
ion
32
7
1.0
40
1
x8.0
0
RC
C B
ox
21
.25
+ M
+ 2
1.2
5
-
33
7
2.2
60
1
x10
.00
R
CC
So
lid S
lab
R
CC
A
bu
tmen
t O
pen
2
1.2
5 +
M +
21
.25
In
gra
de
sep
arat
or
app
roac
h
34
7
2.5
10
1
x10
.00
R
CC
So
lid S
lab
R
CC
A
bu
tmen
t O
pen
2
1.2
5 +
M +
21
.25
-
35
7
3.4
75
2
x30
.00
P
SC I-
Gir
der
+
Dec
k Sl
ab
RC
C
Ab
utm
ent
&
Pie
r O
pen
2
1.2
5 +
M +
21
.25
-
36
7
4.6
80
1
x15
.00
R
CC
I-G
ird
er +
D
eck
Slab
R
CC
A
bu
tmen
t O
pen
2
1.2
5 +
M +
21
.25
-
37
7
8.2
70
1
x20
.00
R
CC
I-G
ird
er +
D
eck
Slab
R
CC
A
bu
tmen
t
Op
en
21
.25
+ M
+ 2
1.2
5
-
38
7
8.8
80
1
x20
.00
R
CC
I-G
ird
er +
D
eck
Slab
R
CC
A
bu
tmen
t
Op
en
21
.25
+ M
+ 2
1.2
5
-
39
8
2.8
90
1
x10
.00
R
CC
So
lid S
lab
R
CC
A
bu
tmen
t O
pen
2
1.2
5 +
M +
21
.25
N
ala
Trai
nin
g to
be
do
ne
on
R
HS
40
8
9.4
95
1
x8.0
0
RC
C B
ox
21
.25
+ M
+ 2
1.2
5
-
41
9
0.5
10
1
x8.0
0
RC
C B
ox
21
.25
+ M
+ 2
1.2
5
-
42
9
1.7
80
1
x10
.00
R
CC
So
lid S
lab
R
CC
Ab
utm
ent
Op
en
21
.25
+ M
+ 2
1.2
5
-
43
9
5.0
50
1
x15
.00
R
CC
I-G
ird
er +
D
eck
Slab
R
CC
Ab
utm
ent
O
pen
2
1.2
5 +
M +
21
.25
-
44
9
7.7
20
1
x20
.00
R
CC
I-G
ird
er +
D
eck
Slab
R
CC
Ab
utm
ent
O
pen
2
1.2
5 +
M +
21
.25
-
45
9
8.3
20
1
x10
.00
R
CC
So
lid S
lab
R
CC
Ab
utm
ent
Op
en
21
.25
+ M
+ 2
1.2
5
-
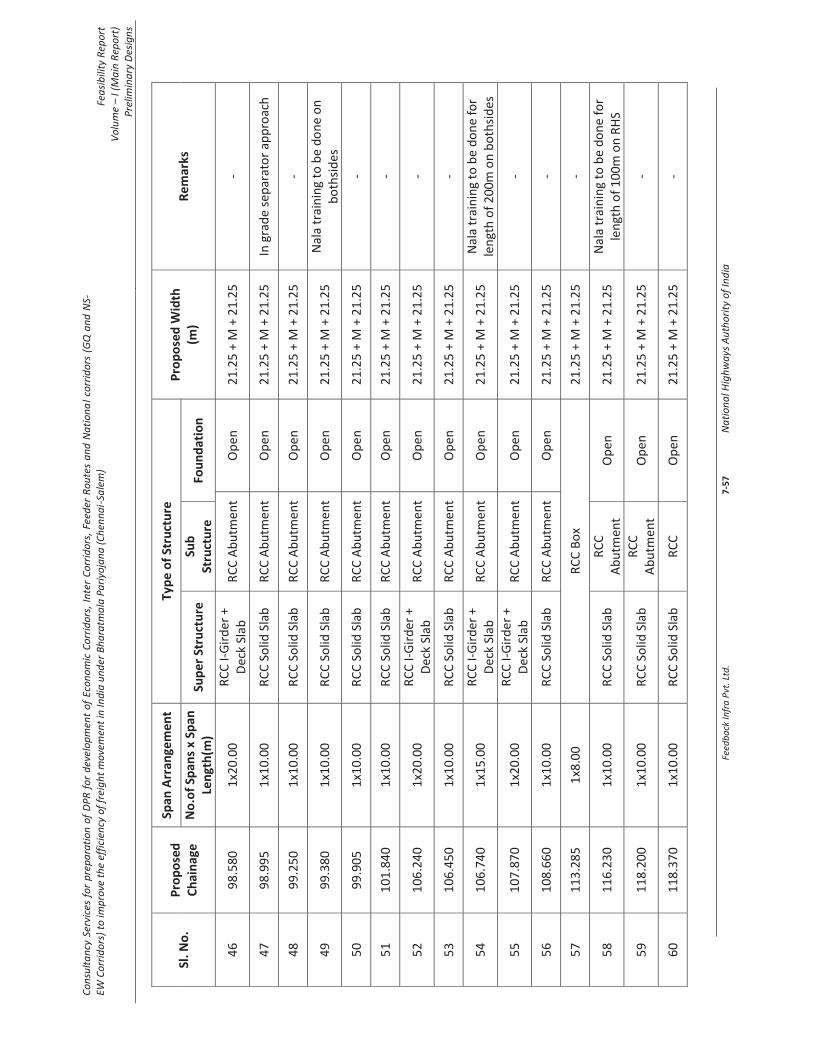
Cons
ulta
ncy
Serv
ices
for p
repa
ratio
n of
DPR
for d
evel
opm
ent o
f Eco
nom
ic C
orrid
ors,
Inte
r Cor
ridor
s, Fe
eder
Rou
tes
and
Natio
nal c
orrid
ors
(GQ
and
NS-
EW C
orrid
ors)
to im
prov
e th
e ef
ficie
ncy
of fr
eigh
t mov
emen
t in
Indi
a un
der B
hara
tmal
a Pa
riyoj
ana
(Che
nnai
-Sal
em)
Feas
ibili
ty R
epor
t Vo
lum
e –
I (M
ain
Repo
rt)
Prel
imin
ary
Desig
ns
Feed
back
Infra
Pvt
. Ltd
.
7
-57
Nat
iona
l Hig
hway
s Aut
horit
y of
Indi
a
Sl. N
o.
Pro
po
sed
C
hai
nag
e
Span
Arr
ange
me
nt
Typ
e o
f St
ruct
ure
P
rop
ose
d W
idth
(m
) R
em
arks
N
o.o
f Sp
ans
x Sp
an
Len
gth
(m)
Sup
er S
tru
ctu
re
Sub
St
ruct
ure
Fo
un
dat
ion
46
9
8.5
80
1
x20
.00
R
CC
I-G
ird
er +
D
eck
Slab
R
CC
Ab
utm
ent
Op
en
21
.25
+ M
+ 2
1.2
5
-
47
9
8.9
95
1
x10
.00
R
CC
So
lid S
lab
R
CC
Ab
utm
ent
Op
en
21
.25
+ M
+ 2
1.2
5
In g
rad
e se
par
ato
r ap
pro
ach
48
9
9.2
50
1
x10
.00
R
CC
So
lid S
lab
R
CC
Ab
utm
ent
Op
en
21
.25
+ M
+ 2
1.2
5
-
49
9
9.3
80
1
x10
.00
R
CC
So
lid S
lab
R
CC
Ab
utm
ent
Op
en
21
.25
+ M
+ 2
1.2
5
Nal
a tr
ain
ing
to b
e d
on
e o
n
bo
thsi
des
50
9
9.9
05
1
x10
.00
R
CC
So
lid S
lab
R
CC
Ab
utm
ent
Op
en
21
.25
+ M
+ 2
1.2
5
-
51
1
01
.84
0
1x1
0.0
0
RC
C S
olid
Sla
b
RC
C A
bu
tmen
t O
pen
2
1.2
5 +
M +
21
.25
-
52
1
06
.24
0
1x2
0.0
0
RC
C I-
Gir
der
+
Dec
k Sl
ab
RC
C A
bu
tmen
t O
pen
2
1.2
5 +
M +
21
.25
-
53
1
06
.45
0
1x1
0.0
0
RC
C S
olid
Sla
b
RC
C A
bu
tmen
t O
pen
2
1.2
5 +
M +
21
.25
-
54
1
06
.74
0
1x1
5.0
0
RC
C I-
Gir
der
+
Dec
k Sl
ab
RC
C A
bu
tmen
t O
pen
2
1.2
5 +
M +
21
.25
N
ala
trai
nin
g to
be
do
ne
for
len
gth
of
20
0m
on
bo
thsi
des
55
1
07
.87
0
1x2
0.0
0
RC
C I-
Gir
der
+
Dec
k Sl
ab
RC
C A
bu
tmen
t O
pen
2
1.2
5 +
M +
21
.25
-
56
1
08
.66
0
1x1
0.0
0
RC
C S
olid
Sla
b
RC
C A
bu
tmen
t O
pen
2
1.2
5 +
M +
21
.25
-
57
1
13
.28
5
1x8
.00
R
CC
Bo
x 2
1.2
5 +
M +
21
.25
-
58
1
16
.23
0
1x1
0.0
0
RC
C S
olid
Sla
b
RC
C
Ab
utm
ent
Op
en
21
.25
+ M
+ 2
1.2
5
Nal
a tr
ain
ing
to b
e d
on
e fo
r le
ngt
h o
f 1
00
m o
n R
HS
59
1
18
.20
0
1x1
0.0
0
RC
C S
olid
Sla
b
RC
C
Ab
utm
ent
Op
en
21
.25
+ M
+ 2
1.2
5
-
60
1
18
.37
0
1x1
0.0
0
RC
C S
olid
Sla
b
RC
C
Op
en
21
.25
+ M
+ 2
1.2
5
-

Cons
ulta
ncy
Serv
ices
for p
repa
ratio
n of
DPR
for d
evel
opm
ent o
f Eco
nom
ic C
orrid
ors,
Inte
r Cor
ridor
s, Fe
eder
Rou
tes
and
Natio
nal c
orrid
ors
(GQ
and
NS-
EW C
orrid
ors)
to im
prov
e th
e ef
ficie
ncy
of fr
eigh
t mov
emen
t in
Indi
a un
der B
hara
tmal
a Pa
riyoj
ana
(Che
nnai
-Sal
em)
Feas
ibili
ty R
epor
t Vo
lum
e –
I (M
ain
Repo
rt)
Prel
imin
ary
Desig
ns
Feed
back
Infra
Pvt
. Ltd
.
7
-58
Nat
iona
l Hig
hway
s Aut
horit
y of
Indi
a
Sl. N
o.
Pro
po
sed
C
hai
nag
e
Span
Arr
ange
me
nt
Typ
e o
f St
ruct
ure
P
rop
ose
d W
idth
(m
) R
em
arks
N
o.o
f Sp
ans
x Sp
an
Len
gth
(m)
Sup
er S
tru
ctu
re
Sub
St
ruct
ure
Fo
un
dat
ion
Ab
utm
ent
61
1
23
.58
0
1x2
0.0
0
RC
C I-
Gir
der
+
Dec
k Sl
ab
RC
C
Ab
utm
ent
Op
en
21
.25
+ M
+ 2
1.2
5
-
62
1
32
.72
0
1x1
5.0
0
RC
C I-
Gir
der
+
Dec
k Sl
ab
RC
C
Ab
utm
ent
Op
en
21
.25
+ M
+ 2
1.2
5
Nal
a tr
ain
ing
is t
o b
e d
on
e o
n
LHS
of
len
gth
18
0.0
m
63
1
33
.68
0
1x8
.00
R
CC
Bo
x 2
1.2
5 +
M +
21
.25
-
64
1
38
.94
0
1x1
0.0
0
RC
C S
olid
Sla
b
RC
C
Ab
utm
ent
Op
en
21
.25
+ M
+ 2
1.2
5
-
65
1
39
.20
0
1x1
0.0
0
RC
C S
olid
Sla
b
RC
C
Ab
utm
ent
Op
en
21
.25
+ M
+ 2
1.2
5
-
66
1
39
.94
0
1x1
0.0
0
RC
C S
olid
Sla
b
RC
C
Ab
utm
ent
Op
en
21
.25
+ M
+ 2
1.2
5
-
67
1
42
.68
0
1x1
5.0
0
RC
C I-
Gir
der
+
Dec
k Sl
ab
RC
C
Ab
utm
ent
Op
en
21
.25
+ M
+ 2
1.2
5
Nal
a tr
ain
ing
is t
o b
e d
on
e o
n
LHS
of
len
gth
30
0.0
m
68
1
45
.99
0
2x3
0.0
0
PSC
I-G
ird
er +
D
eck
Slab
RC
C
Ab
utm
ent
&
Pie
r O
pen
2
1.2
5 +
M +
21
.25
C
ross
ing
Ch
eyya
r R
iver
69
1
46
.70
0
1x8
.00
R
CC
Bo
x 2
1.2
5 +
M +
21
.25
N
ala
trai
nin
g is
to
be
do
ne
on
LH
S o
f le
ngt
h 1
50
.0m
70
1
47
.11
0
1x1
0.0
0
RC
C S
olid
Sla
b
RC
C
Ab
utm
ent
Op
en
21
.25
+ M
+ 2
1.2
5
Nal
a tr
ain
ing
is t
o b
e d
on
e o
n
LHS
of
len
gth
15
0.0
m
71
1
47
.34
0
2x3
0.0
0
PSC
I-G
ird
er +
D
eck
Slab
RC
C
Ab
utm
ent
&
Pie
r O
pen
2
1.2
5 +
M +
21
.25
C
ross
ing
Ch
eyya
r R
iver
72
1
52
.02
0
2x2
0.0
0
RC
C I-
Gir
der
+
Dec
k Sl
ab
RC
C
Ab
utm
ent
&
Op
en
21
.25
+ M
+ 2
1.2
5
-
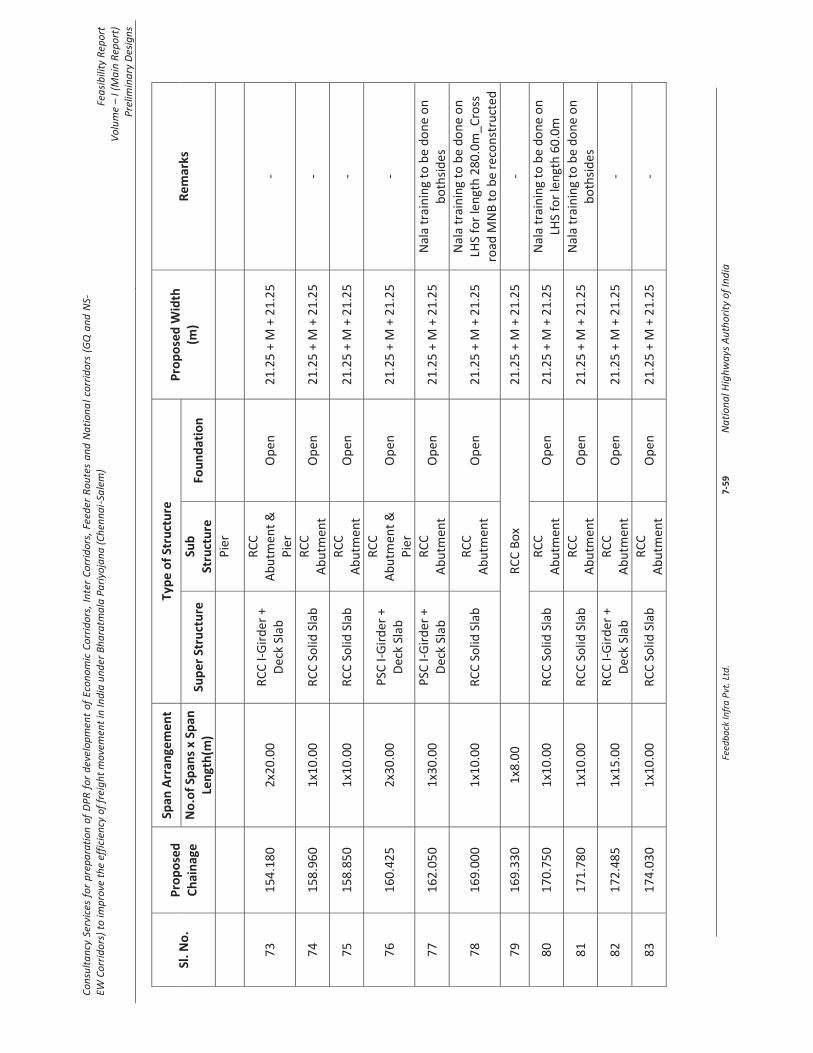
Cons
ulta
ncy
Serv
ices
for p
repa
ratio
n of
DPR
for d
evel
opm
ent o
f Eco
nom
ic C
orrid
ors,
Inte
r Cor
ridor
s, Fe
eder
Rou
tes
and
Natio
nal c
orrid
ors
(GQ
and
NS-
EW C
orrid
ors)
to im
prov
e th
e ef
ficie
ncy
of fr
eigh
t mov
emen
t in
Indi
a un
der B
hara
tmal
a Pa
riyoj
ana
(Che
nnai
-Sal
em)
Feas
ibili
ty R
epor
t Vo
lum
e –
I (M
ain
Repo
rt)
Prel
imin
ary
Desig
ns
Feed
back
Infra
Pvt
. Ltd
.
7
-59
Nat
iona
l Hig
hway
s Aut
horit
y of
Indi
a
Sl. N
o.
Pro
po
sed
C
hai
nag
e
Span
Arr
ange
me
nt
Typ
e o
f St
ruct
ure
P
rop
ose
d W
idth
(m
) R
em
arks
N
o.o
f Sp
ans
x Sp
an
Len
gth
(m)
Sup
er S
tru
ctu
re
Sub
St
ruct
ure
Fo
un
dat
ion
Pie
r
73
1
54
.18
0
2x2
0.0
0
RC
C I-
Gir
der
+
Dec
k Sl
ab
RC
C
Ab
utm
ent
&
Pie
r O
pen
2
1.2
5 +
M +
21
.25
-
74
1
58
.96
0
1x1
0.0
0
RC
C S
olid
Sla
b
RC
C
Ab
utm
ent
Op
en
21
.25
+ M
+ 2
1.2
5
-
75
1
58
.85
0
1x1
0.0
0
RC
C S
olid
Sla
b
RC
C
Ab
utm
ent
Op
en
21
.25
+ M
+ 2
1.2
5
-
76
1
60
.42
5
2x3
0.0
0
PSC
I-G
ird
er +
D
eck
Slab
RC
C
Ab
utm
ent
&
Pie
r O
pen
2
1.2
5 +
M +
21
.25
-
77
1
62
.05
0
1x3
0.0
0
PSC
I-G
ird
er +
D
eck
Slab
R
CC
A
bu
tmen
t O
pen
2
1.2
5 +
M +
21
.25
N
ala
trai
nin
g to
be
do
ne
on
b
oth
sid
es
78
1
69
.00
0
1x1
0.0
0
RC
C S
olid
Sla
b
RC
C
Ab
utm
ent
Op
en
21
.25
+ M
+ 2
1.2
5
Nal
a tr
ain
ing
to b
e d
on
e o
n
LHS
for
len
gth
28
0.0
m_C
ross
ro
ad M
NB
to
be
reco
nst
ruct
ed
79
1
69
.33
0
1x8
.00
R
CC
Bo
x 2
1.2
5 +
M +
21
.25
-
80
1
70
.75
0
1x1
0.0
0
RC
C S
olid
Sla
b
RC
C
Ab
utm
ent
Op
en
21
.25
+ M
+ 2
1.2
5
Nal
a tr
ain
ing
to b
e d
on
e o
n
LHS
for
len
gth
60
.0m
81
1
71
.78
0
1x1
0.0
0
RC
C S
olid
Sla
b
RC
C
Ab
utm
ent
Op
en
21
.25
+ M
+ 2
1.2
5
Nal
a tr
ain
ing
to b
e d
on
e o
n
bo
thsi
des
82
1
72
.48
5
1x1
5.0
0
RC
C I-
Gir
der
+
Dec
k Sl
ab
RC
C
Ab
utm
ent
Op
en
21
.25
+ M
+ 2
1.2
5
-
83
1
74
.03
0
1x1
0.0
0
RC
C S
olid
Sla
b
RC
C
Ab
utm
ent
Op
en
21
.25
+ M
+ 2
1.2
5
-

Cons
ulta
ncy
Serv
ices
for p
repa
ratio
n of
DPR
for d
evel
opm
ent o
f Eco
nom
ic C
orrid
ors,
Inte
r Cor
ridor
s, Fe
eder
Rou
tes
and
Natio
nal c
orrid
ors
(GQ
and
NS-
EW C
orrid
ors)
to im
prov
e th
e ef
ficie
ncy
of fr
eigh
t mov
emen
t in
Indi
a un
der B
hara
tmal
a Pa
riyoj
ana
(Che
nnai
-Sal
em)
Feas
ibili
ty R
epor
t Vo
lum
e –
I (M
ain
Repo
rt)
Prel
imin
ary
Desig
ns
Feed
back
Infra
Pvt
. Ltd
.
7
-60
Nat
iona
l Hig
hway
s Aut
horit
y of
Indi
a
Sl. N
o.
Pro
po
sed
C
hai
nag
e
Span
Arr
ange
me
nt
Typ
e o
f St
ruct
ure
P
rop
ose
d W
idth
(m
) R
em
arks
N
o.o
f Sp
ans
x Sp
an
Len
gth
(m)
Sup
er S
tru
ctu
re
Sub
St
ruct
ure
Fo
un
dat
ion
84
1
75
.76
0
1x8
.00
R
CC
Bo
x 2
1.2
5 +
M +
21
.25
In
gra
de
sep
arat
or
app
roac
h
85
1
79
.12
0
1x2
5.0
0
PSC
I-G
ird
er +
D
eck
Slab
R
CC
A
bu
tmen
t O
pen
2
1.2
5 +
M +
21
.25
N
ala
trai
nin
g to
be
do
ne
on
R
HS
for
len
gth
20
0.0
m &
1
00
.0m
at
Dch
.17
9.5
50
86
1
80
.94
0
1x2
5.0
0
PSC
I-G
ird
er+D
eck
Slab
R
CC
A
bu
tmen
t O
pen
2
1.2
5 +
M+
21
.25
-
87
1
81
.26
0
1x2
5.0
0
PSC
I-G
ird
er+D
eck
Slab
R
CC
A
bu
tmen
t O
pen
2
1.2
5 +
M+
21
.25
-
88
1
81
.26
0
1x8
.00
R
CC
Bo
x 2
1.2
5 +
M+
21
.25
-
89
1
86
.14
0
1x8
.00
R
CC
Bo
x 2
1.2
5 +
M+
21
.25
-
90
1
87
.36
0
1x8
.00
R
CC
Bo
x 2
1.2
5 +
M+
21
.25
-
91
1
88
.64
0
1x2
0.0
0
RC
C I-
Gir
der
+Dec
k Sl
ab
RC
C
Ab
utm
ent
Op
en
21
.25
+ M
+ 2
1.2
5
-
92
1
88
.97
0
2x3
0.0
0
PSC
I-G
ird
er+D
eck
Slab
RC
C
Ab
utm
ent
&
Pie
r O
pen
2
1.2
5 +
M+
21
.25
-
93
1
92
.90
0
1x1
0.0
0
RC
C S
olid
Sla
b
RC
C
Ab
utm
ent
Op
en
21
.25
+ M
+ 2
1.2
5
-
94
1
93
.75
0
1x8
.00
R
CC
Bo
x 2
1.2
5 +
M+
21
.25
N
ala
trai
nin
g to
be
do
ne
on
R
HS
of
len
gth
10
0m
95
1
94
.04
0
1x8
.00
R
CC
Bo
x 2
1.2
5 +
M+
21
.25
-
96
1
94
.88
0
1x8
.00
R
CC
Bo
x 2
1.2
5 +
M+
21
.25
-

Cons
ulta
ncy
Serv
ices
for p
repa
ratio
n of
DPR
for d
evel
opm
ent o
f Eco
nom
ic C
orrid
ors,
Inte
r Cor
ridor
s, Fe
eder
Rou
tes
and
Natio
nal c
orrid
ors
(GQ
and
NS-
EW C
orrid
ors)
to im
prov
e th
e ef
ficie
ncy
of fr
eigh
t mov
emen
t in
Indi
a un
der B
hara
tmal
a Pa
riyoj
ana
(Che
nnai
-Sal
em)
Feas
ibili
ty R
epor
t Vo
lum
e –
I (M
ain
Repo
rt)
Prel
imin
ary
Desig
ns
Feed
back
Infra
Pvt
. Ltd
.
7
-61
Nat
iona
l Hig
hway
s Aut
horit
y of
Indi
a
Sl. N
o.
Pro
po
sed
C
hai
nag
e
Span
Arr
ange
me
nt
Typ
e o
f St
ruct
ure
P
rop
ose
d W
idth
(m
) R
em
arks
N
o.o
f Sp
ans
x Sp
an
Len
gth
(m)
Sup
er S
tru
ctu
re
Sub
St
ruct
ure
Fo
un
dat
ion
97
1
96
.16
0
1x8
.00
R
CC
Bo
x 2
1.2
5 +
M +
21
.25
In a
pp
roac
h o
f G
rad
e se
par
ato
r_N
ala
trai
nin
g is
re
qu
ired
an
d c
ross
ro
ad b
rid
ge
nee
d t
o b
e re
con
stru
cted
98
1
96
.48
0
1x8
.00
R
CC
Bo
x 2
1.2
5 +
M +
21
.25
-
99
1
97
.60
0
1x3
0.0
0
PSC
-I-
Gir
der
+Dec
k Sl
ab
RC
C
Ab
utm
ent
Op
en
21
.25
+ M
+ 2
1.2
5
Nal
a_N
ala
trai
nin
g to
be
do
ne
on
RH
S o
f le
ngt
h 2
00
m
10
0
19
7.9
20
1
x10
.00
R
CC
So
lid S
lab
R
CC
A
bu
tmen
t O
pen
2
1.2
5 +
M+
21
.25
-
10
1
20
3.7
80
1
x8.0
0
RC
C B
ox
- -
21
.25
+ M
+ 2
1.2
5
Nal
a tr
ain
ing
to b
e d
on
e o
f le
ngt
h 1
00
m
10
2
20
4.7
00
2
x30
.00
P
SC I-
Gir
der
+Dec
k Sl
ab
RC
C
Ab
utm
ent
&
Pie
r O
pen
2
1.2
5 +
M+
21
.25
N
ala
tain
ing
to b
e d
on
e o
f le
ngt
h 1
80
m
10
3
20
7.0
80
1
x10
.00
R
CC
So
lid S
lab
R
CC
A
bu
tmen
t O
pen
2
1.2
5 +
M+
21
.25
-
10
4
20
9.7
60
2
x20
.00
R
CC
I-G
ird
er+D
eck
Slab
RC
C
Ab
utm
ent
&
Pie
r O
pen
2
1.2
5 +
M+
21
.25
C
ross
ing
Van
iyar
Riv
er
10
5
21
1.8
50
1
x25
.00
P
SC I-
Gir
der
+Dec
k Sl
ab
RC
C
Ab
utm
ent
O
pen
2
1.2
5 +
M +
21
.25
-
10
6
53
.00
0
1x8
.00
R
CC
Bo
x 2
1.2
5+M
+21
.25
-
10
7
52
.44
0
1x3
0.0
0
PSC
I-G
ird
er +
D
eck
Slab
R
CC
A
bu
tmen
t O
pen
2
1.2
5+M
+21
.25
-
10
8
50
.73
0
1x3
0.0
0
PSC
I-G
ird
er +
D
eck
Slab
R
CC
A
bu
tmen
t O
pen
2
1.2
5+M
+21
.25
-

Cons
ulta
ncy
Serv
ices
for p
repa
ratio
n of
DPR
for d
evel
opm
ent o
f Eco
nom
ic C
orrid
ors,
Inte
r Cor
ridor
s, Fe
eder
Rou
tes
and
Natio
nal c
orrid
ors
(GQ
and
NS-
EW C
orrid
ors)
to im
prov
e th
e ef
ficie
ncy
of fr
eigh
t mov
emen
t in
Indi
a un
der B
hara
tmal
a Pa
riyoj
ana
(Che
nnai
-Sal
em)
Feas
ibili
ty R
epor
t Vo
lum
e –
I (M
ain
Repo
rt)
Prel
imin
ary
Desig
ns
Feed
back
Infra
Pvt
. Ltd
.
7
-62
Nat
iona
l Hig
hway
s Aut
horit
y of
Indi
a
Sl. N
o.
Pro
po
sed
C
hai
nag
e
Span
Arr
ange
me
nt
Typ
e o
f St
ruct
ure
P
rop
ose
d W
idth
(m
) R
em
arks
N
o.o
f Sp
ans
x Sp
an
Len
gth
(m)
Sup
er S
tru
ctu
re
Sub
St
ruct
ure
Fo
un
dat
ion
10
9
50
.45
0
1x3
0.0
0
PSC
I-G
ird
er +
D
eck
Slab
R
CC
A
bu
tmen
t O
pen
2
1.2
5+M
+21
.25
-
11
0
31
.38
0
1x1
1.0
0
RC
C S
olid
Sla
b
RC
C
Ab
utm
ent
Op
en
21
.25
+M+2
1.2
5
-
11
1
30
.22
0
1x1
1.0
0
RC
C S
olid
Sla
b
RC
C
Ab
utm
ent
Op
en
21
.25
+ M
+ 2
1.2
5
-
11
2
26
.50
0
1x1
0.0
0
RC
C S
olid
Sla
b
RC
C
Ab
utm
ent
Op
en
21
.25
+ M
+ 2
1.2
5
-
11
3
25
.22
0
1x1
2.0
0
RC
C S
olid
Sla
b
RC
C
Ab
utm
ent
Op
en
21
.25
+ M
+ 2
1.2
5
Nal
a tr
ain
ing
to b
e d
on
e
11
4
17
.20
0
1x1
0.0
0
RC
C S
olid
Sla
b
RC
C
Ab
utm
ent
Op
en
21
.25
+ M
+ 2
1.2
5
Nal
a tr
ain
ing
to b
e d
on
e
11
5
14
.96
0
1x1
0.0
0
RC
C S
olid
Sla
b
RC
C
Ab
utm
ent
Op
en
21
.25
+ M
+ 2
1.2
5
Nal
a tr
ain
ing
to b
e d
on
e
11
6
9.9
40
1
x15
.00
R
CC
I G
ird
er+D
eck
Slab
R
CC
A
bu
tmen
t O
pen
2
1.2
5 +
M+
21
.25
-
No
te:
*S.N
o-1
-10
5 b
elo
ngs
to
NH
-17
9B
-Ch
enn
ai-H
aru
r St
retc
h &
S.N
o-1
06
-11
6 b
elo
ngs
to
NH
-17
9A
-Sal
em-H
aru
r St
retc
h.

Cons
ulta
ncy
Serv
ices
for p
repa
ratio
n of
DPR
for d
evel
opm
ent o
f Eco
nom
ic C
orrid
ors,
Inte
r Cor
ridor
s, Fe
eder
Rou
tes
and
Natio
nal c
orrid
ors
(GQ
and
NS-
EW C
orrid
ors)
to im
prov
e th
e ef
ficie
ncy
of fr
eigh
t mov
emen
t in
Indi
a un
der B
hara
tmal
a Pa
riyoj
ana
(Che
nnai
-Sal
em)
Feas
ibili
ty R
epor
t Vo
lum
e –
I (M
ain
Repo
rt)
Prel
imin
ary
Desig
ns
Feed
back
Infra
Pvt
. Ltd
.
7
-63
Nat
iona
l Hig
hway
s Aut
horit
y of
Indi
a
Min
or
Bri
dge
– R
eco
nst
ruct
ion
Tab
le 7
-39
: De
tails
of
Min
or
Bri
dge
s p
rop
ose
d f
or
Rec
on
stru
ctio
n
Sl.
No
.
Exis
tin
g K
m
Sto
ne
Pro
po
sed
C
hai
nag
e
Exis
tin
g D
eta
ils
Pro
po
sed
De
tails
Stru
ctu
re
no
.
Span
A
rran
gem
ent
Typ
e o
f St
ruct
ure
Exis
tin
g W
idth
(m
) P
rop
osa
l
Span
A
rran
gem
en
t Ty
pe
of
Stru
ctu
re
Pro
po
sed
Wid
th
(m)
No
.of
Span
s x
Span
Le
ngt
h
(m)
Sup
er
Stru
ctu
re
Sub
St
ruct
ure
Fo
un
dat
ion
No
.of
Span
s x
Span
Le
ngt
h
(m)
Sup
er
Stru
ctu
re
Sub
St
ruct
ure
Fo
un
dat
ion
1 *
13
9+
56
0
- 2
x20
.00
-
- -
7.0
0
Rec
on
stru
ctio
n
2x2
0.0
0
RC
C
Gir
der
+
Dec
k Sl
ab
RC
C
Ab
utm
ent
& P
ier
Op
en
21
.25
+
M +
2
1.2
5
*Min
or
Bri
dge
on
Cro
ssro
ad is
rec
on
stru
cted
.

Cons
ulta
ncy
Serv
ices
for p
repa
ratio
n of
DPR
for d
evel
opm
ent o
f Eco
nom
ic C
orrid
ors,
Inte
r Cor
ridor
s, Fe
eder
Rou
tes
and
Natio
nal c
orrid
ors
(GQ
and
NS-
EW C
orrid
ors)
to im
prov
e th
e ef
ficie
ncy
of fr
eigh
t mov
emen
t in
Indi
a un
der B
hara
tmal
a Pa
riyoj
ana
(Che
nnai
-Sal
em)
Feas
ibili
ty R
epor
t Vo
lum
e –
I (M
ain
Repo
rt)
Prel
imin
ary
Desig
ns
Feed
back
Infra
Pvt
. Ltd
.
7
-64
Nat
iona
l Hig
hway
s Aut
horit
y of
Indi
a
Min
or
Bri
dge
– S
R-N
ew
Co
nst
ruct
ion
+ M
CW
-New
Co
nst
ruct
ion
Ta
ble
7-4
0: D
eta
ils o
f M
ino
r B
rid
ges
pro
po
sed
fo
r SR
-Ne
w C
on
stru
ctio
n +
MC
W-N
ew C
on
stru
ctio
n
Sl. N
o.
Pro
po
sed
C
hai
nag
e
Span
Arr
ange
me
nt
Typ
e o
f St
ruct
ure
P
rop
ose
d W
idth
(m
) R
em
arks
N
o.o
f Sp
ans
x Sp
an L
engt
h(m
) Su
per
Str
uct
ure
Su
b
Stru
ctu
re
Fou
nd
atio
n
1
1.2
80
1
x20
.00
R
CC
I-G
ird
er +
D
eck
Slab
R
CC
A
bu
tmen
t O
pen
1
1.0
0 +
M +
21
.25
+ M
+
21
.25
+ M
+ 1
1.0
0
-
2
1.3
85
1
x20
.00
R
CC
I-G
ird
er +
D
eck
Slab
R
CC
A
bu
tmen
t O
pen
1
1.0
0 +
M +
21
.25
+ M
+
21
.25
+ M
+ 1
1.0
0
-
3
6.5
70
2
x20
.00
R
CC
I-G
ird
er +
D
eck
Slab
RC
C
Ab
utm
ent
&
Pie
r O
pen
1
1.0
0 +
M +
21
.25
+ M
+
21
.25
+ M
+ 1
1.0
0
In g
rad
e se
par
ato
r ap
pro
ach
4
9.9
50
1
x10
.00
R
CC
So
lid S
lab
R
CC
A
bu
tmen
t O
pen
1
1.0
0 +
M +
21
.25
+ M
+
21
.25
+ M
+ 1
1.0
0
-
5
11
.17
0
1x8
.00
R
CC
Bo
x 1
1.0
0 +
M +
21
.25
+ M
+
21
.25
+ M
+ 1
1.0
0
In g
rad
e se
par
ato
r ap
pro
ach
6
11
.49
5
1x1
5.0
0
RC
C I-
Gir
der
+
Dec
k Sl
ab
RC
C
Ab
utm
ent
Op
en
11
.00
+ M
+ 2
1.2
5 +
M
+ 2
1.2
5 +
M +
11
.00
In
gra
de
sep
arat
or
app
roac
h
7
20
.25
0
2x3
0.0
0
PSC
I-G
ird
er +
D
eck
Slab
RC
C
Ab
utm
ent
&
Pie
r O
pen
1
1.0
0 +
M +
21
.25
+ M
+
21
.25
+ M
+ 1
1.0
0
-
8
20
.74
0
2x2
5.0
0
PSC
I-G
ird
er +
D
eck
Slab
RC
C
Ab
utm
ent
&
Pie
r O
pen
1
1.0
0 +
M +
21
.25
+ M
+
21
.25
+ M
+ 1
1.0
0
In g
rad
e se
par
ato
r ap
pro
ach
9
26
.04
0
1x1
0.0
0
RC
C S
olid
Sla
b
RC
C
Ab
utm
ent
Op
en
11
.00
+ M
+ 2
1.2
5 +
M
+ 2
1.2
5 +
M +
11
.00
In
gra
de
sep
arat
or
app
roac
h
10
2
6.1
70
1
x10
.00
R
CC
So
lid S
lab
R
CC
A
bu
tmen
t O
pen
1
1.0
0 +
M +
21
.25
+ M
+
21
.25
+ M
+ 1
1.0
0
In g
rad
e se
par
ato
r ap
pro
ach
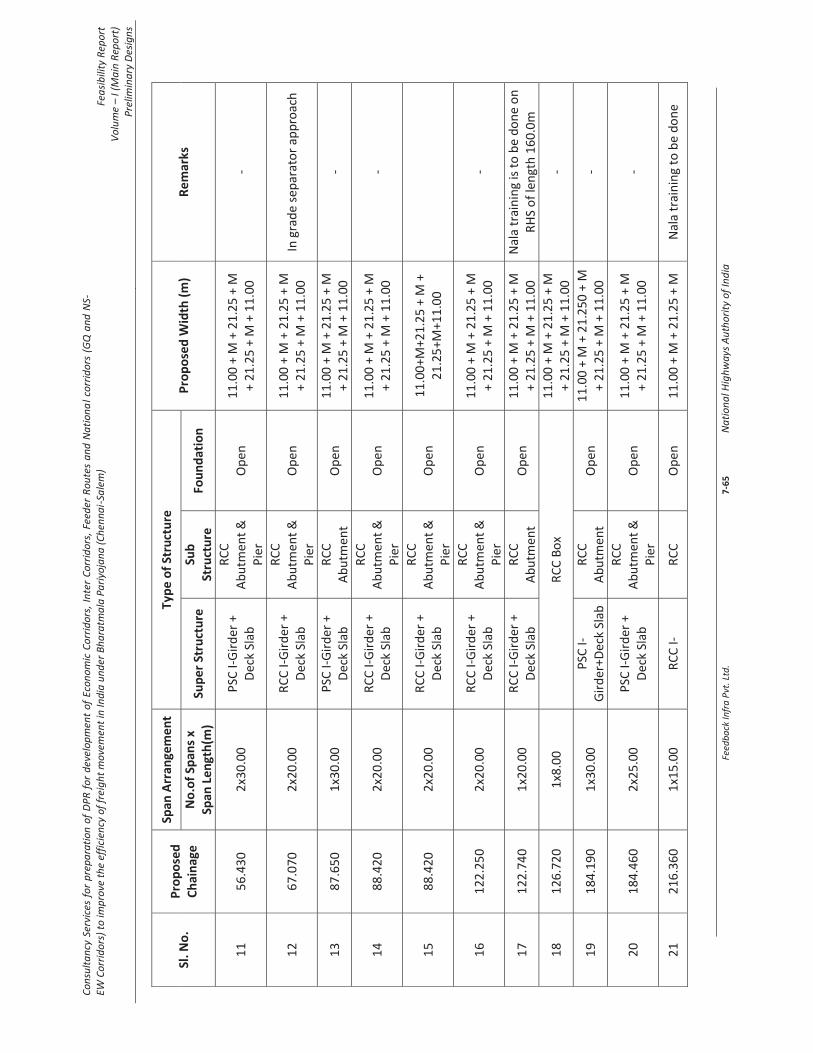
Cons
ulta
ncy
Serv
ices
for p
repa
ratio
n of
DPR
for d
evel
opm
ent o
f Eco
nom
ic C
orrid
ors,
Inte
r Cor
ridor
s, Fe
eder
Rou
tes
and
Natio
nal c
orrid
ors
(GQ
and
NS-
EW C
orrid
ors)
to im
prov
e th
e ef
ficie
ncy
of fr
eigh
t mov
emen
t in
Indi
a un
der B
hara
tmal
a Pa
riyoj
ana
(Che
nnai
-Sal
em)
Feas
ibili
ty R
epor
t Vo
lum
e –
I (M
ain
Repo
rt)
Prel
imin
ary
Desig
ns
Feed
back
Infra
Pvt
. Ltd
.
7
-65
Nat
iona
l Hig
hway
s Aut
horit
y of
Indi
a
Sl. N
o.
Pro
po
sed
C
hai
nag
e
Span
Arr
ange
me
nt
Typ
e o
f St
ruct
ure
P
rop
ose
d W
idth
(m
) R
em
arks
N
o.o
f Sp
ans
x Sp
an L
engt
h(m
) Su
per
Str
uct
ure
Su
b
Stru
ctu
re
Fou
nd
atio
n
11
5
6.4
30
2
x30
.00
P
SC I-
Gir
der
+
Dec
k Sl
ab
RC
C
Ab
utm
ent
&
Pie
r O
pen
1
1.0
0 +
M +
21
.25
+ M
+
21
.25
+ M
+ 1
1.0
0
-
12
6
7.0
70
2
x20
.00
R
CC
I-G
ird
er +
D
eck
Slab
RC
C
Ab
utm
ent
&
Pie
r O
pen
1
1.0
0 +
M +
21
.25
+ M
+
21
.25
+ M
+ 1
1.0
0
In g
rad
e se
par
ato
r ap
pro
ach
13
8
7.6
50
1
x30
.00
P
SC I-
Gir
der
+
Dec
k Sl
ab
RC
C
Ab
utm
ent
O
pen
1
1.0
0 +
M +
21
.25
+ M
+
21
.25
+ M
+ 1
1.0
0
-
14
8
8.4
20
2
x20
.00
R
CC
I-G
ird
er +
D
eck
Slab
RC
C
Ab
utm
ent
&
Pie
r O
pen
1
1.0
0 +
M +
21
.25
+ M
+
21
.25
+ M
+ 1
1.0
0
-
15
8
8.4
20
2
x20
.00
R
CC
I-G
ird
er +
D
eck
Slab
RC
C
Ab
utm
ent
&
Pie
r O
pen
1
1.0
0+M
+21
.25
+ M
+
21
.25
+M+1
1.0
0
16
1
22
.25
0
2x2
0.0
0
RC
C I-
Gir
der
+
Dec
k Sl
ab
RC
C
Ab
utm
ent
&
Pie
r O
pen
1
1.0
0 +
M +
21
.25
+ M
+
21
.25
+ M
+ 1
1.0
0
-
17
1
22
.74
0
1x2
0.0
0
RC
C I-
Gir
der
+
Dec
k Sl
ab
RC
C
Ab
utm
ent
Op
en
11
.00
+ M
+ 2
1.2
5 +
M
+ 2
1.2
5 +
M +
11
.00
N
ala
trai
nin
g is
to
be
do
ne
on
R
HS
of
len
gth
16
0.0
m
18
1
26
.72
0
1x8
.00
R
CC
Bo
x 1
1.0
0 +
M +
21
.25
+ M
+
21
.25
+ M
+ 1
1.0
0
-
19
1
84
.19
0
1x3
0.0
0
PSC
I-G
ird
er+D
eck
Slab
R
CC
A
bu
tmen
t
Op
en
11
.00
+ M
+ 2
1.2
50
+ M
+
21
.25
+ M
+ 1
1.0
0
-
20
1
84
.46
0 2
x25
.00
P
SC I-
Gir
der
+
Dec
k Sl
ab
RC
C
Ab
utm
ent
&
Pie
r O
pen
1
1.0
0 +
M +
21
.25
+ M
+
21
.25
+ M
+ 1
1.0
0
-
21
2
16
.36
0
1x1
5.0
0
RC
C I-
RC
C
Op
en
11
.00
+ M
+ 2
1.2
5 +
M
Nal
a tr
ain
ing
to b
e d
on
e
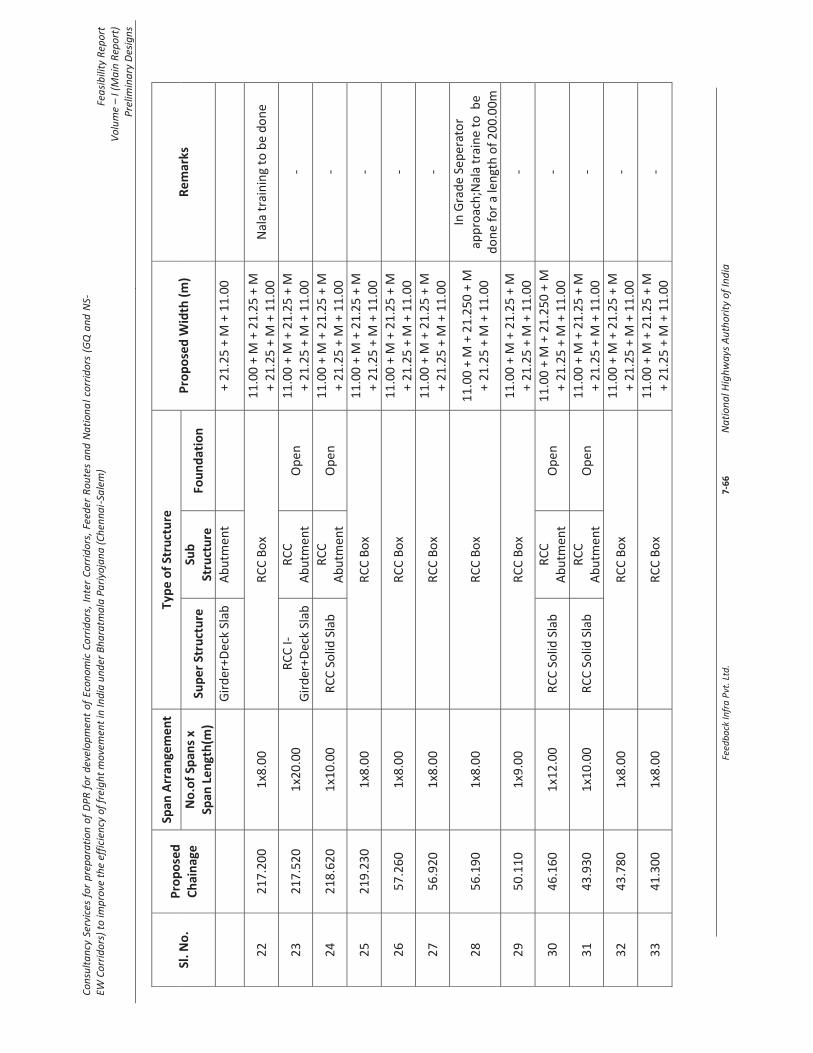
Cons
ulta
ncy
Serv
ices
for p
repa
ratio
n of
DPR
for d
evel
opm
ent o
f Eco
nom
ic C
orrid
ors,
Inte
r Cor
ridor
s, Fe
eder
Rou
tes
and
Natio
nal c
orrid
ors
(GQ
and
NS-
EW C
orrid
ors)
to im
prov
e th
e ef
ficie
ncy
of fr
eigh
t mov
emen
t in
Indi
a un
der B
hara
tmal
a Pa
riyoj
ana
(Che
nnai
-Sal
em)
Feas
ibili
ty R
epor
t Vo
lum
e –
I (M
ain
Repo
rt)
Prel
imin
ary
Desig
ns
Feed
back
Infra
Pvt
. Ltd
.
7
-66
Nat
iona
l Hig
hway
s Aut
horit
y of
Indi
a
Sl. N
o.
Pro
po
sed
C
hai
nag
e
Span
Arr
ange
me
nt
Typ
e o
f St
ruct
ure
P
rop
ose
d W
idth
(m
) R
em
arks
N
o.o
f Sp
ans
x Sp
an L
engt
h(m
) Su
per
Str
uct
ure
Su
b
Stru
ctu
re
Fou
nd
atio
n
Gir
der
+Dec
k Sl
ab
Ab
utm
ent
+ 2
1.2
5 +
M +
11
.00
22
2
17
.20
0
1x8
.00
R
CC
Bo
x 1
1.0
0 +
M +
21
.25
+ M
+
21
.25
+ M
+ 1
1.0
0
Nal
a tr
ain
ing
to b
e d
on
e
23
2
17
.52
0
1x2
0.0
0
RC
C I-
Gir
der
+Dec
k Sl
ab
RC
C
Ab
utm
ent
Op
en
11
.00
+ M
+ 2
1.2
5 +
M
+ 2
1.2
5 +
M +
11
.00
-
24
2
18
.62
0
1x1
0.0
0
RC
C S
olid
Sla
b
RC
C
Ab
utm
ent
Op
en
11
.00
+ M
+ 2
1.2
5 +
M
+ 2
1.2
5 +
M +
11
.00
-
25
2
19
.23
0
1x8
.00
R
CC
Bo
x 1
1.0
0 +
M +
21
.25
+ M
+
21
.25
+ M
+ 1
1.0
0
-
26
5
7.2
60
1
x8.0
0
RC
C B
ox
11
.00
+ M
+ 2
1.2
5 +
M
+ 2
1.2
5 +
M +
11
.00
-
27
5
6.9
20
1
x8.0
0
RC
C B
ox
11
.00
+ M
+ 2
1.2
5 +
M
+ 2
1.2
5 +
M +
11
.00
-
28
5
6.1
90
1
x8.0
0
RC
C B
ox
11
.00
+ M
+ 2
1.2
50
+ M
+
21
.25
+ M
+ 1
1.0
0
In G
rad
e Se
per
ato
r ap
pro
ach
;Nal
a tr
ain
e to
be
do
ne
for
a le
ngt
h o
f 2
00
.00
m
29
5
0.1
10
1
x9.0
0
RC
C B
ox
11
.00
+ M
+ 2
1.2
5 +
M
+ 2
1.2
5 +
M +
11
.00
-
30
4
6.1
60
1
x12
.00
R
CC
So
lid S
lab
R
CC
A
bu
tmen
t O
pen
1
1.0
0 +
M +
21
.25
0 +
M
+ 2
1.2
5 +
M +
11
.00
-
31
4
3.9
30
1
x10
.00
R
CC
So
lid S
lab
R
CC
A
bu
tmen
t O
pen
1
1.0
0 +
M +
21
.25
+ M
+
21
.25
+ M
+ 1
1.0
0
-
32
4
3.7
80
1
x8.0
0
RC
C B
ox
11
.00
+ M
+ 2
1.2
5 +
M
+ 2
1.2
5 +
M +
11
.00
-
33
4
1.3
00
1
x8.0
0
RC
C B
ox
11
.00
+ M
+ 2
1.2
5 +
M
+ 2
1.2
5 +
M +
11
.00
-

Cons
ulta
ncy
Serv
ices
for p
repa
ratio
n of
DPR
for d
evel
opm
ent o
f Eco
nom
ic C
orrid
ors,
Inte
r Cor
ridor
s, Fe
eder
Rou
tes
and
Natio
nal c
orrid
ors
(GQ
and
NS-
EW C
orrid
ors)
to im
prov
e th
e ef
ficie
ncy
of fr
eigh
t mov
emen
t in
Indi
a un
der B
hara
tmal
a Pa
riyoj
ana
(Che
nnai
-Sal
em)
Feas
ibili
ty R
epor
t Vo
lum
e –
I (M
ain
Repo
rt)
Prel
imin
ary
Desig
ns
Feed
back
Infra
Pvt
. Ltd
.
7
-67
Nat
iona
l Hig
hway
s Aut
horit
y of
Indi
a
Sl. N
o.
Pro
po
sed
C
hai
nag
e
Span
Arr
ange
me
nt
Typ
e o
f St
ruct
ure
P
rop
ose
d W
idth
(m
) R
em
arks
N
o.o
f Sp
ans
x Sp
an L
engt
h(m
) Su
per
Str
uct
ure
Su
b
Stru
ctu
re
Fou
nd
atio
n
34
4
0.5
40
1
x8.0
0
RC
C B
ox
11
.00
+ M
+ 2
1.2
5 +
M
+ 2
1.2
5 +
M +
11
.00
N
ala
trai
nin
g to
be
do
ne
35
2
1.8
00
1
x30
.00
P
SC I-
Gir
der
+
Dec
k Sl
ab
RC
C
Ab
utm
ent
Op
en
11
.00
+ M
+ 2
1.2
5 +
M
+ 2
1.2
5 +
M +
11
.00
-
36
6
.50
0
1x1
2.0
0
RC
C S
olid
Sla
b
RC
C
Ab
utm
ent
Op
en
11
.00
+ M
+ 2
1.2
50
+ M
+
21
.25
+ M
+ 1
1.0
0
-
37
3
.96
0
1x1
2.0
0
RC
C S
olid
Sla
b
RC
C
Ab
utm
ent
Op
en
11
.00
+ M
+ 2
1.2
5 +
M
+ 2
1.2
5 +
M +
11
.00
P
on
d o
n L
HS
38
0
.66
0
2x3
0.0
0
PSC
I-G
ird
er +
D
eck
Slab
RC
C
Ab
utm
ent
&
Pie
r P
ile
11
.00
+ M
+ 2
1.2
5 +
M
+ 2
1.2
5 +
M +
11
.00
C
ross
ing
Riv
er
No
te:
*S.N
o-1
-25
bel
on
gs t
o N
H-1
79
B-C
hen
nai
-Har
ur
Stre
tch
& S
.No
-26
-38
bel
on
gs t
o N
H-1
79
A-S
alem
-Har
ur
Stre
tch
.
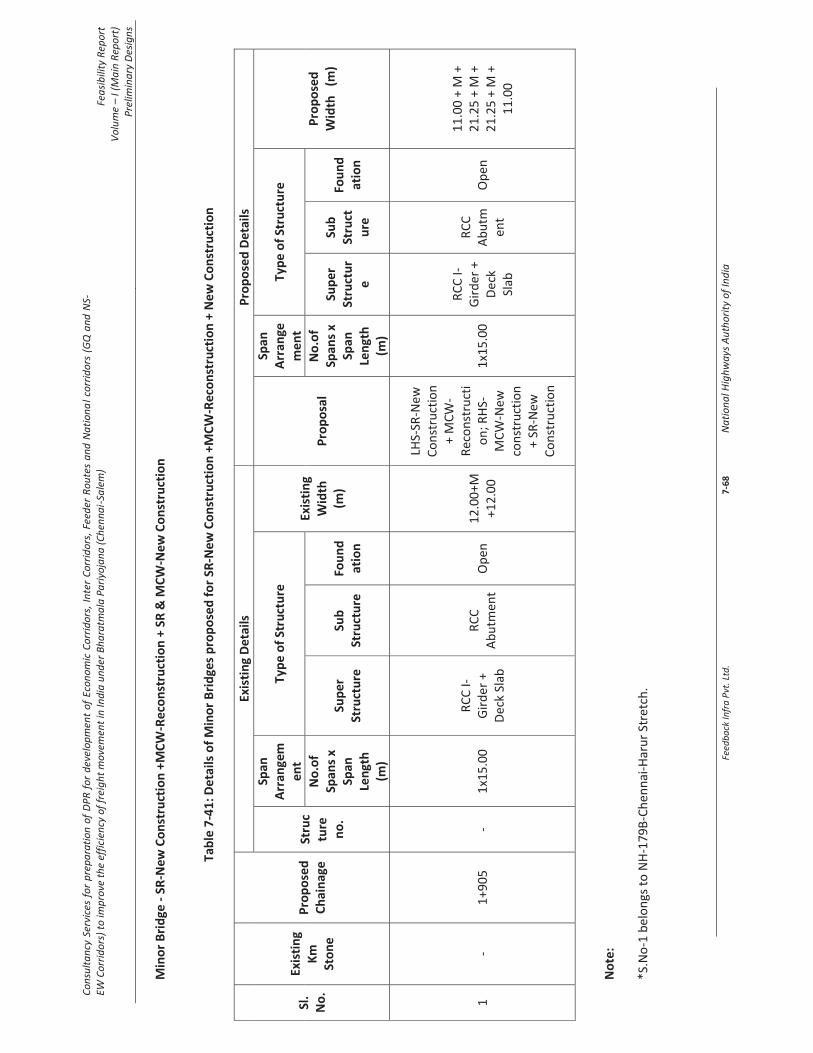
Cons
ulta
ncy
Serv
ices
for p
repa
ratio
n of
DPR
for d
evel
opm
ent o
f Eco
nom
ic C
orrid
ors,
Inte
r Cor
ridor
s, Fe
eder
Rou
tes
and
Natio
nal c
orrid
ors
(GQ
and
NS-
EW C
orrid
ors)
to im
prov
e th
e ef
ficie
ncy
of fr
eigh
t mov
emen
t in
Indi
a un
der B
hara
tmal
a Pa
riyoj
ana
(Che
nnai
-Sal
em)
Feas
ibili
ty R
epor
t Vo
lum
e –
I (M
ain
Repo
rt)
Prel
imin
ary
Desig
ns
Feed
back
Infra
Pvt
. Ltd
.
7
-68
Nat
iona
l Hig
hway
s Aut
horit
y of
Indi
a
Min
or
Bri
dge
- S
R-N
ew C
on
stru
ctio
n +
MC
W-R
eco
nst
ruct
ion
+ S
R &
MC
W-N
ew C
on
stru
ctio
n
Tab
le 7
-41
: De
tails
of
Min
or
Bri
dge
s p
rop
ose
d f
or
SR-N
ew
Co
nst
ruct
ion
+M
CW
-Re
con
stru
ctio
n +
New
Co
nst
ruct
ion
Sl.
No
.
Exis
tin
g K
m
Sto
ne
Pro
po
sed
C
hai
nag
e
Exis
tin
g D
eta
ils
Pro
po
sed
De
tails
Stru
ctu
re
no
.
Span
A
rran
gem
en
t Ty
pe
of
Stru
ctu
re
Exis
tin
g W
idth
(m
) P
rop
osa
l
Span
A
rran
gem
en
t Ty
pe
of
Stru
ctu
re
Pro
po
sed
W
idth
(m
) N
o.o
f Sp
ans
x Sp
an
Len
gth
(m
)
Sup
er
Stru
ctu
re
Sub
St
ruct
ure
Fo
un
dat
ion
No
.of
Span
s x
Span
Le
ngt
h
(m)
Sup
er
Stru
ctu
re
Sub
St
ruct
ure
Fou
nd
atio
n
1 -
1+9
05
-
1x1
5.0
0
RC
C I-
Gir
der
+
Dec
k Sl
ab
RC
C
Ab
utm
ent
Op
en
12
.00
+M+
12
.00
LH
S -SR
-New
C
on
stru
ctio
n
+ M
CW
-R
eco
nst
ruct
io
n; R
HS-
MC
W- N
ew
con
stru
ctio
n
+ SR
-New
C
on
stru
ctio
n
1x1
5.0
0
RC
C I-
Gir
der
+
De
ck
Slab
RC
C
Ab
utm
ent
Op
en
11
.00
+ M
+
21
.25
+ M
+
21
.25
+ M
+
11
.00
No
te:
*S.N
o-1
bel
on
gs t
o N
H-1
79
B-C
hen
nai
-Har
ur
Stre
tch
.
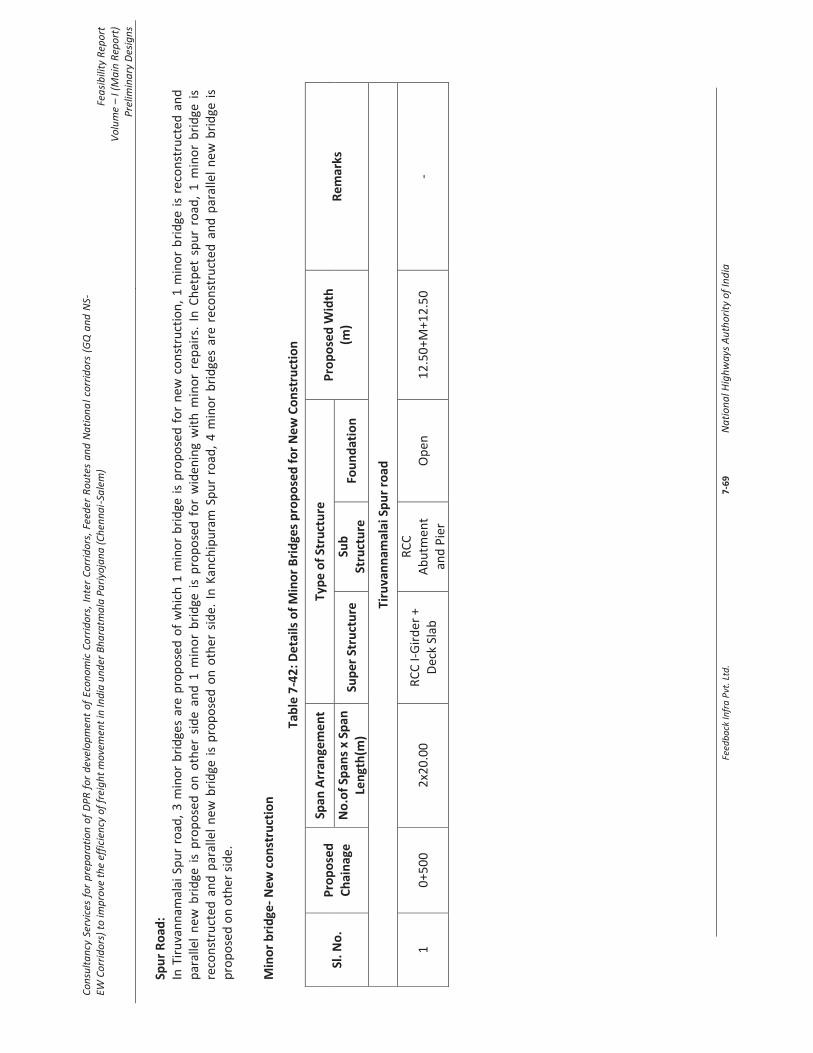
Cons
ulta
ncy
Serv
ices
for p
repa
ratio
n of
DPR
for d
evel
opm
ent o
f Eco
nom
ic C
orrid
ors,
Inte
r Cor
ridor
s, Fe
eder
Rou
tes
and
Natio
nal c
orrid
ors
(GQ
and
NS-
EW C
orrid
ors)
to im
prov
e th
e ef
ficie
ncy
of fr
eigh
t mov
emen
t in
Indi
a un
der B
hara
tmal
a Pa
riyoj
ana
(Che
nnai
-Sal
em)
Feas
ibili
ty R
epor
t Vo
lum
e –
I (M
ain
Repo
rt)
Prel
imin
ary
Desig
ns
Feed
back
Infra
Pvt
. Ltd
.
7
-69
Nat
iona
l Hig
hway
s Aut
horit
y of
Indi
a
Spu
r R
oad
: In
Tir
uva
nn
amal
ai S
pu
r ro
ad,
3 m
ino
r b
rid
ges
are
pro
po
sed
of
wh
ich
1 m
ino
r b
rid
ge i
s p
rop
ose
d f
or
new
co
nst
ruct
ion
, 1
min
or
bri
dge
is
reco
nst
ruct
ed a
nd
p
aral
lel
new
bri
dge
is
pro
po
sed
on
oth
er s
ide
and
1 m
ino
r b
rid
ge i
s p
rop
ose
d f
or
wid
enin
g w
ith
min
or
rep
airs
. In
Ch
etp
et s
pu
r ro
ad,
1 m
ino
r b
rid
ge i
s re
con
stru
cted
an
d p
aral
lel
new
bri
dge
is
pro
po
sed
on
oth
er s
ide.
In
Kan
chip
ura
m S
pu
r ro
ad,
4 m
ino
r b
rid
ges
are
reco
nst
ruct
ed a
nd
par
alle
l n
ew b
rid
ge i
s p
rop
ose
d o
n o
ther
sid
e.
Min
or
bri
dge
- N
ew c
on
stru
ctio
n
Tab
le 7
-42
: De
tails
of
Min
or
Bri
dge
s p
rop
ose
d f
or
Ne
w C
on
stru
ctio
n
Sl. N
o.
Pro
po
sed
C
hai
nag
e
Span
Arr
ange
me
nt
Typ
e o
f St
ruct
ure
P
rop
ose
d W
idth
(m
) R
em
arks
N
o.o
f Sp
ans
x Sp
an
Len
gth
(m)
Sup
er S
tru
ctu
re
Sub
St
ruct
ure
Fo
un
dat
ion
Tiru
van
nam
alai
Sp
ur
road
1
0+5
00
2
x20
.00
R
CC
I-G
ird
er +
D
eck
Slab
RC
C
Ab
utm
ent
and
Pie
r O
pen
1
2.5
0+M
+12
.50
-

Cons
ulta
ncy
Serv
ices
for p
repa
ratio
n of
DPR
for d
evel
opm
ent o
f Eco
nom
ic C
orrid
ors,
Inte
r Cor
ridor
s, Fe
eder
Rou
tes
and
Natio
nal c
orrid
ors
(GQ
and
NS-
EW C
orrid
ors)
to im
prov
e th
e ef
ficie
ncy
of fr
eigh
t mov
emen
t in
Indi
a un
der B
hara
tmal
a Pa
riyoj
ana
(Che
nnai
-Sal
em)
Feas
ibili
ty R
epor
t Vo
lum
e –
I (M
ain
Repo
rt)
Prel
imin
ary
Desig
ns
Feed
back
Infra
Pvt
. Ltd
.
7
-70
Nat
iona
l Hig
hway
s Aut
horit
y of
Indi
a
Min
or
bri
dge
– R
eco
nst
ruct
ion
+New
co
nst
ruct
ion
In T
iru
van
nam
alai
an
d C
het
pet
Sp
ur
road
, th
ere
is n
o m
ajo
r b
rid
ge p
rop
ose
d. I
n K
anch
ipu
ram
Sp
ur
road
, 1 e
xist
ing
Maj
or
bri
dge
is r
etai
ned
wit
h n
ew 2
lan
e b
rid
ge a
nd
par
alle
l new
3 la
ne
maj
or
bri
dge
is p
rop
ose
d.
Tab
le 7
-43
: De
tails
of
Min
or
bri
dge
pro
po
sed
fo
r R
eco
nst
ruct
ion
+ N
ew c
on
stru
ctio
n
Sl.
No
.
Exis
tin
g K
m
Sto
ne
Pro
po
sed
C
hai
nag
e
Exis
tin
g D
eta
ils
Pro
po
sed
De
tails
Stru
ctu
re
no
.
Span
A
rran
gem
en
t Ty
pe
of
Stru
ctu
re
Exis
tin
g W
idth
(m
) P
rop
osa
l
Span
A
rran
ge
me
nt
Typ
e o
f St
ruct
ure
Pro
po
sed
Wid
th
(m)
No
.of
Span
s x
Span
Le
ngt
h
(m)
Sup
er
Stru
ctu
re
Sub
St
ruct
ure
Fo
un
dat
ion
No
.of
Span
s x
Span
Le
ngt
h
(m)
Sup
er
Stru
ctu
re
Sub
St
ruct
ure
Fou
nd
atio
n
Tiru
van
nam
alai
Sp
ur
road
1 1
32
.41
0
10
+00
0
- 1
x6.8
0
RC
C S
olid
Sl
ab
PC
C
Ab
utm
ent
Op
en
12
.00
LHS
MC
W-
Rec
on
stru
ctio
n;
RH
S M
CW
-New
C
on
stru
ctio
n
1x7
.00
R
CC
B
ox
- -
12
.50
+M+1
2.5
0
Ch
etp
et
Spu
r ro
ad
1 5
0.2
10
4
+09
0
LHS-
2x3
.70
C
/C
RH
S-2
x3.4
0
Cle
ar
LHS-
RC
C
Solid
Sla
b
RH
S-R
CC
B
ox
LHS-
BB
M
Ab
utm
ent
and
Pie
rs
Op
en
13
.50
LHS-
MC
W-
Rec
on
stru
ctio
n;
RH
S -M
CW
-New
C
on
stru
ctio
n
2x4
.00
R
CC
B
ox
- -
12
.50
+M+1
2.5
0
Kan
chip
ura
m S
pu
r ro
ad

Cons
ulta
ncy
Serv
ices
for p
repa
ratio
n of
DPR
for d
evel
opm
ent o
f Eco
nom
ic C
orrid
ors,
Inte
r Cor
ridor
s, Fe
eder
Rou
tes
and
Natio
nal c
orrid
ors
(GQ
and
NS-
EW C
orrid
ors)
to im
prov
e th
e ef
ficie
ncy
of fr
eigh
t mov
emen
t in
Indi
a un
der B
hara
tmal
a Pa
riyoj
ana
(Che
nnai
-Sal
em)
Feas
ibili
ty R
epor
t Vo
lum
e –
I (M
ain
Repo
rt)
Prel
imin
ary
Desig
ns
Feed
back
Infra
Pvt
. Ltd
.
7
-71
Nat
iona
l Hig
hway
s Aut
horit
y of
Indi
a
Sl.
No
.
Exis
tin
g K
m
Sto
ne
Pro
po
sed
C
hai
nag
e
Exis
tin
g D
eta
ils
Pro
po
sed
De
tails
Stru
ctu
re
no
.
Span
A
rran
gem
en
t Ty
pe
of
Stru
ctu
re
Exis
tin
g W
idth
(m
) P
rop
osa
l
Span
A
rran
ge
me
nt
Typ
e o
f St
ruct
ure
Pro
po
sed
Wid
th
(m)
No
.of
Span
s x
Span
Le
ngt
h
(m)
Sup
er
Stru
ctu
re
Sub
St
ruct
ure
Fo
un
dat
ion
No
.of
Span
s x
Span
Le
ngt
h
(m)
Sup
er
Stru
ctu
re
Sub
St
ruct
ure
Fou
nd
atio
n
1 5
7.7
00
1
+38
0
58
/1
2x3
.70
R
CC
So
lid
Slab
PC
C
Ab
utm
ent
and
Pie
rs
Op
en
15
.00
LHS-
MC
W-
Rec
on
stru
ctio
n;
RH
S -M
CW
-New
C
on
stru
ctio
n
2x4
.00
R
CC
B
ox
- -
12
.50
+M+1
2.5
0
2 4
3.2
30
1
6+5
10
-
4x2
.10
H
um
e P
ipe
- -
19
.00
LHS-
MC
W-
Rec
on
stru
ctio
n;
RH
S -M
CW
-New
C
on
stru
ctio
n
1x1
2.0
0
RC
C
Solid
Sl
ab
RC
C
Ab
utm
ent
O
pen
1
2.5
0+M
+12
.50
3 4
3.0
70
1
6+6
50
-
2x2
.10
H
um
e P
ipe
18
.30
LHS-
MC
W-
Rec
on
stru
ctio
n;
RH
S -M
CW
-New
C
on
stru
ctio
n
1x8
.00
R
CC
B
ox
- -
12
.50
+M+1
2.5
0
4 4
0.1
00
1
9+6
50
-
5x1
.00
H
um
e P
ipe
- -
20
.60
LHS-
MC
W-
Rec
on
stru
ctio
n;
RH
S -M
CW
-New
C
on
stru
ctio
n
1x1
0.0
0
RC
C
Solid
Sl
ab
RC
C
Ab
utm
ent
O
pen
1
2.5
0+M
+12
.50

Cons
ulta
ncy
Serv
ices
for p
repa
ratio
n of
DPR
for d
evel
opm
ent o
f Eco
nom
ic C
orrid
ors,
Inte
r Cor
ridor
s, Fe
eder
Rou
tes
and
Natio
nal c
orrid
ors
(GQ
and
NS-
EW C
orrid
ors)
to im
prov
e th
e ef
ficie
ncy
of fr
eigh
t mov
emen
t in
Indi
a un
der B
hara
tmal
a Pa
riyoj
ana
(Che
nnai
-Sal
em)
Feas
ibili
ty R
epor
t Vo
lum
e –
I (M
ain
Repo
rt)
Prel
imin
ary
Desig
ns
Feed
back
Infra
Pvt
. Ltd
.
7
-72
Nat
iona
l Hig
hway
s Aut
horit
y of
Indi
a
Min
or
bri
dge
– W
iden
ing
wit
h m
ino
r re
pai
rs
In T
iru
van
nam
alai
an
d C
het
pet
Sp
ur
road
, th
ere
is n
o m
ajo
r b
rid
ge p
rop
ose
d. I
n K
anch
ipu
ram
Sp
ur
road
, 1 e
xist
ing
Maj
or
bri
dge
is r
etai
ned
wit
h n
ew 2
Lan
e B
rid
ge a
nd
par
alle
l new
3 la
ne
maj
or
bri
dge
is p
rop
ose
d.
Tab
le 7
-44
: De
tails
of
Min
or
bri
dge
pro
po
sed
fo
r W
ide
nin
g w
ith
min
or
rep
airs
Sl.
No
.
Exis
tin
g K
m
Sto
ne
Pro
po
sed
C
hai
nag
e
Exis
tin
g D
eta
ils
Pro
po
sed
De
tails
Stru
ctu
re
no
.
Span
A
rran
gem
en
t Ty
pe
of
Stru
ctu
re
Exis
tin
g W
idth
(m
) P
rop
osa
l
Span
A
rran
gem
en
t Ty
pe
of
Stru
ctu
re
Pro
po
sed
Wid
th
(m)
No
.of
Span
s x
Span
Le
ngt
h
(m)
Sup
er
Stru
ctu
re
Sub
St
ruct
ure
Fo
un
dat
ion
No
.of
Span
s x
Span
Le
ngt
h
(m)
Sup
er
Stru
ctu
re
Sub
St
ruct
ure
Fou
nd
atio
n
Tiru
van
nam
alai
Sp
ur
road
1 1
36
.10
0
13
+62
5
- 3
x5.0
0
RC
C B
ox
- -
12
.30
MC
W-
Wid
enin
g w
ith
min
or
rep
airs
3x5
.00
R
CC
Bo
x -
- 1
2.5
0+M
+12
.50
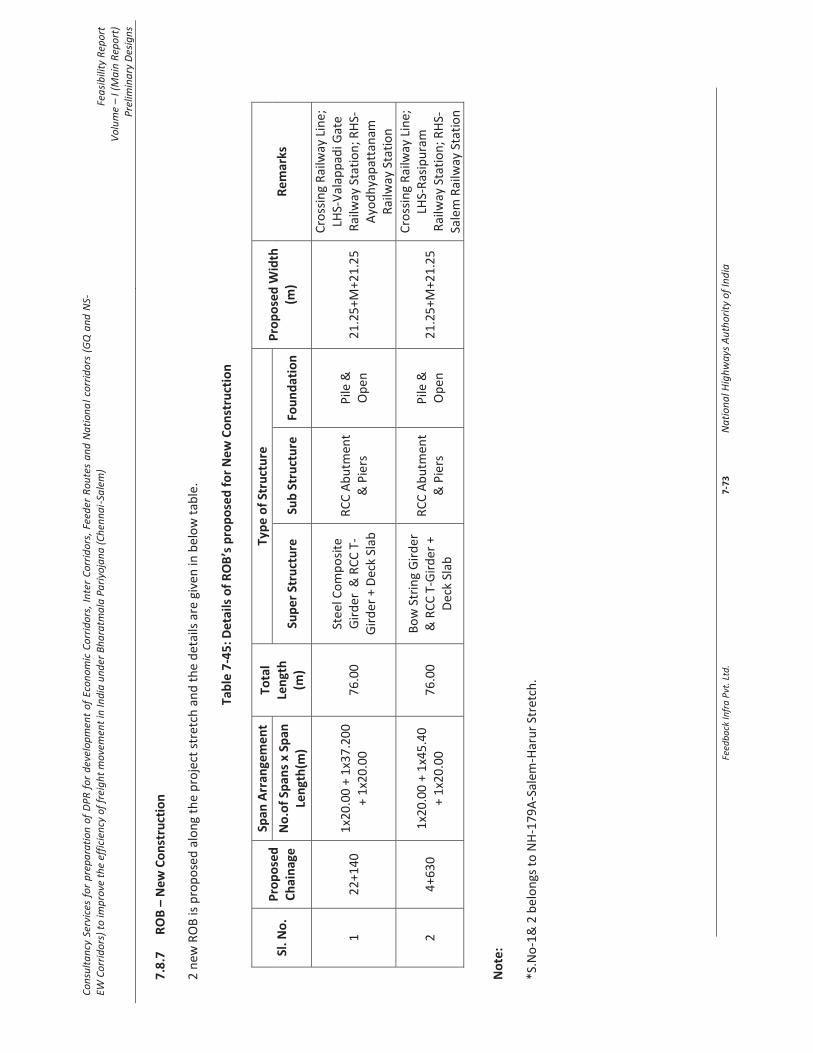
Cons
ulta
ncy
Serv
ices
for p
repa
ratio
n of
DPR
for d
evel
opm
ent o
f Eco
nom
ic C
orrid
ors,
Inte
r Cor
ridor
s, Fe
eder
Rou
tes
and
Natio
nal c
orrid
ors
(GQ
and
NS-
EW C
orrid
ors)
to im
prov
e th
e ef
ficie
ncy
of fr
eigh
t mov
emen
t in
Indi
a un
der B
hara
tmal
a Pa
riyoj
ana
(Che
nnai
-Sal
em)
Feas
ibili
ty R
epor
t Vo
lum
e –
I (M
ain
Repo
rt)
Prel
imin
ary
Desig
ns
Feed
back
Infra
Pvt
. Ltd
.
7
-73
Nat
iona
l Hig
hway
s Aut
horit
y of
Indi
a
7.8
.7R
OB
– N
ew C
on
stru
ctio
n
2 n
ew R
OB
is p
rop
ose
d a
lon
g th
e p
roje
ct s
tret
ch a
nd
th
e d
etai
ls a
re g
iven
in b
elo
w t
able
.
Tab
le 7
-45
: De
tails
of
RO
B’s
pro
po
sed
fo
r N
ew C
on
stru
ctio
n
Sl. N
o.
Pro
po
sed
C
hai
nag
e
Span
Arr
ange
me
nt
Tota
l Le
ngt
h
(m)
Typ
e o
f St
ruct
ure
P
rop
ose
d W
idth
(m
) R
em
arks
N
o.o
f Sp
ans
x Sp
an
Len
gth
(m)
Sup
er S
tru
ctu
re
Sub
Str
uct
ure
Fo
un
dat
ion
1
22
+14
0
1x2
0.0
0 +
1x3
7.2
00
+
1x2
0.0
0
76
.00
St
eel C
om
po
site
G
ird
er &
RC
C T
-G
ird
er +
Dec
k Sl
ab
RC
C A
bu
tmen
t &
Pie
rs
Pile
&
Op
en
21
.25
+M+2
1.2
5
Cro
ssin
g R
ailw
ay L
ine;
LH
S-V
alap
pad
i Gat
e R
ailw
ay S
tati
on
; RH
S-A
yod
hya
pat
tan
am
Rai
lway
Sta
tio
n
2
4+6
30
1
x20
.00
+ 1
x45
.40
+
1x2
0.0
0
76
.00
B
ow
Str
ing
Gir
der
&
RC
C T
-Gir
der
+
Dec
k Sl
ab
RC
C A
bu
tmen
t &
Pie
rs
Pile
&
Op
en
21
.25
+M+2
1.2
5
Cro
ssin
g R
ailw
ay L
ine;
LH
S-R
asip
ura
m
Rai
lway
Sta
tio
n; R
HS-
Sale
m R
ailw
ay S
tati
on
No
te:
*S.N
o-1
& 2
bel
on
gs t
o N
H-1
79
A-S
alem
-Har
ur
Stre
tch
.

Cons
ulta
ncy
Serv
ices
for p
repa
ratio
n of
DPR
for d
evel
opm
ent o
f Eco
nom
ic C
orrid
ors,
Inte
r Cor
ridor
s, Fe
eder
Rou
tes
and
Natio
nal c
orrid
ors
(GQ
and
NS-
EW C
orrid
ors)
to im
prov
e th
e ef
ficie
ncy
of fr
eigh
t mov
emen
t in
Indi
a un
der B
hara
tmal
a Pa
riyoj
ana
(Che
nnai
-Sal
em)
Feas
ibili
ty R
epor
t Vo
lum
e –
I (M
ain
Repo
rt)
Prel
imin
ary
Desig
ns
Feed
back
Infra
Pvt
. Ltd
.
7
-74
Nat
iona
l Hig
hway
s Aut
horit
y of
Indi
a
7.8
.8Tu
nn
els–
New
Co
nst
ruct
ion
3 n
ew T
un
nel
s ar
e p
rop
ose
d a
lon
g th
e p
roje
ct s
tret
ch a
nd
th
e d
etai
ls a
re g
iven
in b
elo
w t
able
.
Tab
le 7
-46
: Det
ails
of
Tun
nel
s p
rop
ose
d f
or
New
Co
nst
ruct
ion
Sl. N
o.
Pro
po
sed
C
hai
nag
e
Span
Arr
ange
me
nt
Tota
l Le
ngt
h
(m)
Typ
e o
f St
ruct
ure
P
rop
ose
d W
idth
(m
) R
em
arks
N
o.o
f Sp
ans
x Sp
an
Len
gth
(m)
Sup
er S
tru
ctu
re
Sub
Str
uct
ure
Fo
un
dat
ion
1
13
+70
0
1x1
00
0.0
0
10
00
.00
Tu
nn
el
- -
21
.45
+M+2
1.4
5
-
2
12
+42
5
1x7
50
.00
7
50
.00
Tun
nel
-
- 2
1.4
5+M
+21
.45
-
3
10
+73
5
1x7
50
.00
7
50
.00
Tun
nel
-
- 2
1.4
5+M
+21
.45
-
No
te:
*S.N
o-1
-3 b
elo
ngs
to
NH
-17
9A
-Sal
em-H
aru
r St
retc
h.
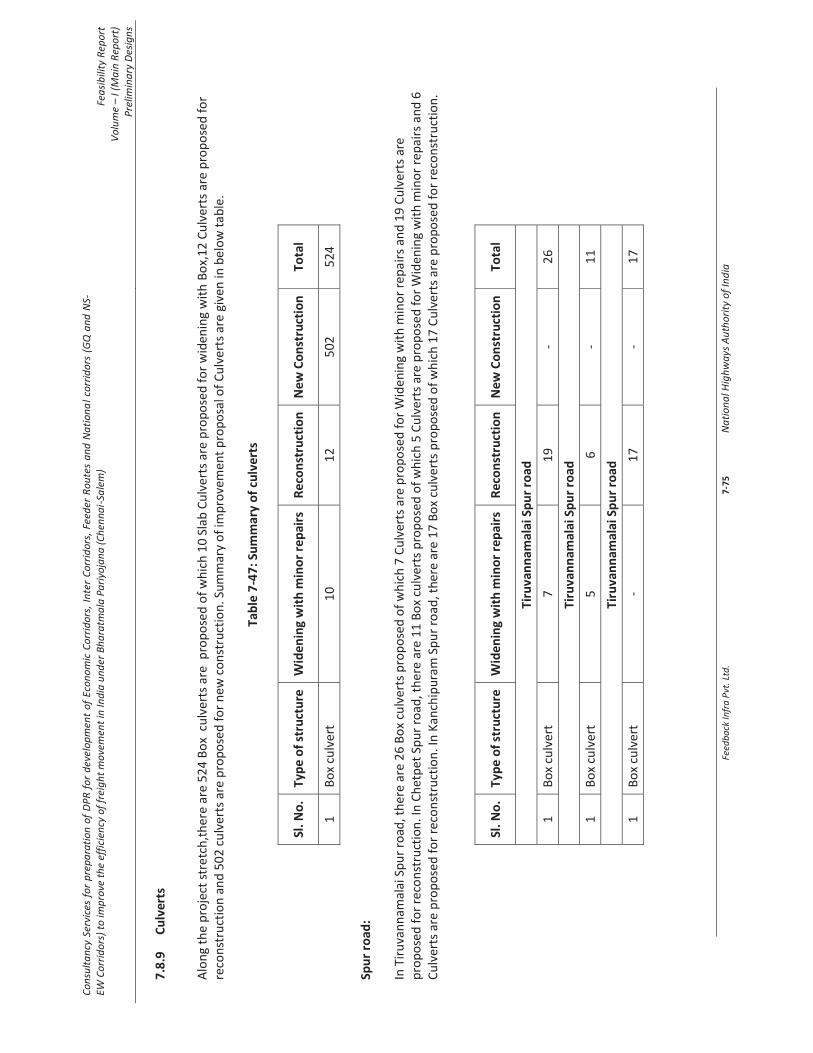
Cons
ulta
ncy
Serv
ices
for p
repa
ratio
n of
DPR
for d
evel
opm
ent o
f Eco
nom
ic C
orrid
ors,
Inte
r Cor
ridor
s, Fe
eder
Rou
tes
and
Natio
nal c
orrid
ors
(GQ
and
NS-
EW C
orrid
ors)
to im
prov
e th
e ef
ficie
ncy
of fr
eigh
t mov
emen
t in
Indi
a un
der B
hara
tmal
a Pa
riyoj
ana
(Che
nnai
-Sal
em)
Feas
ibili
ty R
epor
t Vo
lum
e –
I (M
ain
Repo
rt)
Prel
imin
ary
Desig
ns
Feed
back
Infra
Pvt
. Ltd
.
7
-75
Nat
iona
l Hig
hway
s Aut
horit
y of
Indi
a
7.8
.9C
ulv
erts
Alo
ng
the
pro
ject
str
etch
,th
ere
are
52
4 B
ox
cu
lver
ts a
re p
rop
ose
d o
f w
hic
h 1
0 S
lab
Cu
lver
ts a
re p
rop
ose
d f
or
wid
enin
g w
ith
Bo
x,1
2 C
ulv
erts
are
pro
po
sed
fo
r re
con
stru
ctio
n a
nd
50
2 c
ulv
erts
are
pro
po
sed
fo
r n
ew c
on
stru
ctio
n. S
um
mar
y o
f im
pro
vem
ent
pro
po
sal o
f C
ulv
erts
are
giv
en in
bel
ow
ta
ble
.
Tab
le 7
-47
: Su
mm
ary
of
culv
erts
Sl. N
o.
Typ
e o
f st
ruct
ure
W
iden
ing
wit
h m
ino
r re
pai
rs
Re
con
stru
ctio
n
New
Co
nst
ruct
ion
To
tal
1
Bo
x cu
lver
t 1
0
12
5
02
5
24
Spu
r ro
ad:
In T
iru
van
nam
alai
Sp
ur
road
, th
ere
are
26
Bo
x cu
lver
ts p
rop
ose
d o
f w
hic
h 7
Cu
lver
ts a
re p
rop
ose
d f
or
Wid
enin
g w
ith
min
or
rep
air
s an
d 1
9 C
ulv
erts
are
p
rop
ose
d f
or
reco
nst
ruct
ion
. In
Ch
etp
et S
pu
r ro
ad, t
her
e ar
e 1
1 B
ox
culv
erts
pro
po
sed
of
wh
ich
5 C
ulv
erts
are
pro
po
sed
fo
r W
ide
nin
g w
ith
min
or
rep
airs
an
d 6
C
ulv
erts
are
pro
po
sed
fo
r re
con
stru
ctio
n. I
n K
anch
ipu
ram
Sp
ur
road
, th
ere
are
17
Bo
x cu
lver
ts p
rop
ose
d o
f w
hic
h 1
7 C
ulv
erts
are
pro
po
sed
fo
r re
con
stru
ctio
n.
Sl. N
o.
Typ
e o
f st
ruct
ure
W
iden
ing
wit
h m
ino
r re
pai
rs
Re
con
stru
ctio
n
New
Co
nst
ruct
ion
To
tal
Tiru
van
nam
alai
Sp
ur
road
1
Bo
x cu
lver
t 7
1
9
- 2
6
Tiru
van
nam
alai
Sp
ur
road
1
Bo
x cu
lver
t 5
6
-
11
Tiru
van
nam
alai
Sp
ur
road
1
Bo
x cu
lver
t -
17
-
17

Cons
ulta
ncy
Serv
ices
for p
repa
ratio
n of
DPR
for d
evel
opm
ent o
f Eco
nom
ic C
orrid
ors,
Inte
r Cor
ridor
s, Fe
eder
Rou
tes
and
Natio
nal c
orrid
ors
(GQ
and
NS-
EW C
orrid
ors)
to im
prov
e th
e ef
ficie
ncy
of fr
eigh
t mov
emen
t in
Indi
a un
der B
hara
tmal
a Pa
riyoj
ana
(Che
nnai
-Sal
em)
Feas
ibili
ty R
epor
t Vo
lum
e –
I (M
ain
Repo
rt)
Prel
imin
ary
Desig
ns
Feed
back
Infra
Pvt
. Ltd
.
7
-76
Nat
iona
l Hig
hway
s Aut
horit
y of
Indi
a
7.8
.10
Gra
de
Sep
arat
or
Ther
e ar
e 7
9 g
rad
e se
par
ato
rs a
re p
rop
ose
d a
lon
g th
e p
roje
ct s
tret
ch o
f w
hic
h 9
Fly
ove
rs, 2
2 V
UP
’s,2
VO
P’s
, 33
VU
P G
rad
e-I
I, 3
MN
B C
um
VU
P,1
MN
B C
um
V
UP
Gra
de
-II,
3 In
terc
han
ges,
3 T
rum
pet
Inte
rch
ange
,2 D
ou
ble
Tru
mp
et In
terc
han
ge a
nd
1 C
love
rlea
f In
terc
han
ge is
pro
po
sed
an
d t
he
det
ails
are
giv
en in
bel
ow
ta
ble
.
Tab
le 7
-48
: Det
ails
of
Gra
de
Sep
arat
ors
pro
po
sed
fo
r N
ew C
on
stru
ctio
n
Sl.
No
.
Pro
po
sed
C
hai
nag
e
Pro
po
sed
Ty
pe
of
Stru
ctu
re
Pro
po
sed
De
tails
Re
mar
ks
Span
Arr
ange
me
nt
Tota
l Le
ngt
h
Stru
ctu
re D
eta
ils
Pro
po
sed
De
ck
Wid
th
No
. of
Span
s x
Span
Le
ngt
h
Sup
er s
tru
ctu
re
Sub
st
ruct
ure
Fo
un
dat
ion
(km
) -
(m)
(m)
- -
- (m
) -
1
2.2
00
Tr
um
pet
In
terc
han
ge
2x3
0.0
0
60
.00
P
SC I-
Gir
der
+
Dec
k Sl
ab
RC
C
Ab
utm
ent
& P
ier
Pile
2
1.2
5 +
M +
2
1.2
5
Star
t o
f B
ypas
s; R
HS-
SH-4
8
2
6.4
60
V
UP
G-I
I 1
x12
.00
1
2.0
0
RC
C B
ox
- -
21
.25
+ M
+
21
.25
C
ross
ing
Vill
age
Ro
ad_L
HS-
Gu
du
van
chey
, RH
S-P
adap
ai
3
8.4
40
V
UP
1
x15
.00
1
5.0
0
RC
C B
ox
- -
21
.25
+ M
+
21
.25
Vill
age
Ro
ad/M
DR
_Ort
ahu
r b
uilt
-U
p; L
HS-
Kat
tan
kula
thu
r, R
HS-
Pad
apai
4
11
.34
0
VU
P
1x1
5.0
0
15
.00
R
CC
Bo
x -
- 2
1.2
5 +
M +
2
1.2
5
Cro
ssin
g V
illag
e R
oad
/MD
R;L
HS-
Ort
ahu
r;R
HS-
Ara
mb
akka
m;
Co
nec
tin
g to
NH
-45
& S
H-5
7
5
13
.47
0
VU
P
1x1
5.0
0
15
.00
R
CC
Bo
x -
- 2
1.2
5 +
M +
2
1.2
5
Cro
ssin
g V
illag
e R
oad
/MD
R;L
HS-
Ap
pu
r, R
HS-
Ara
mb
akka
m;
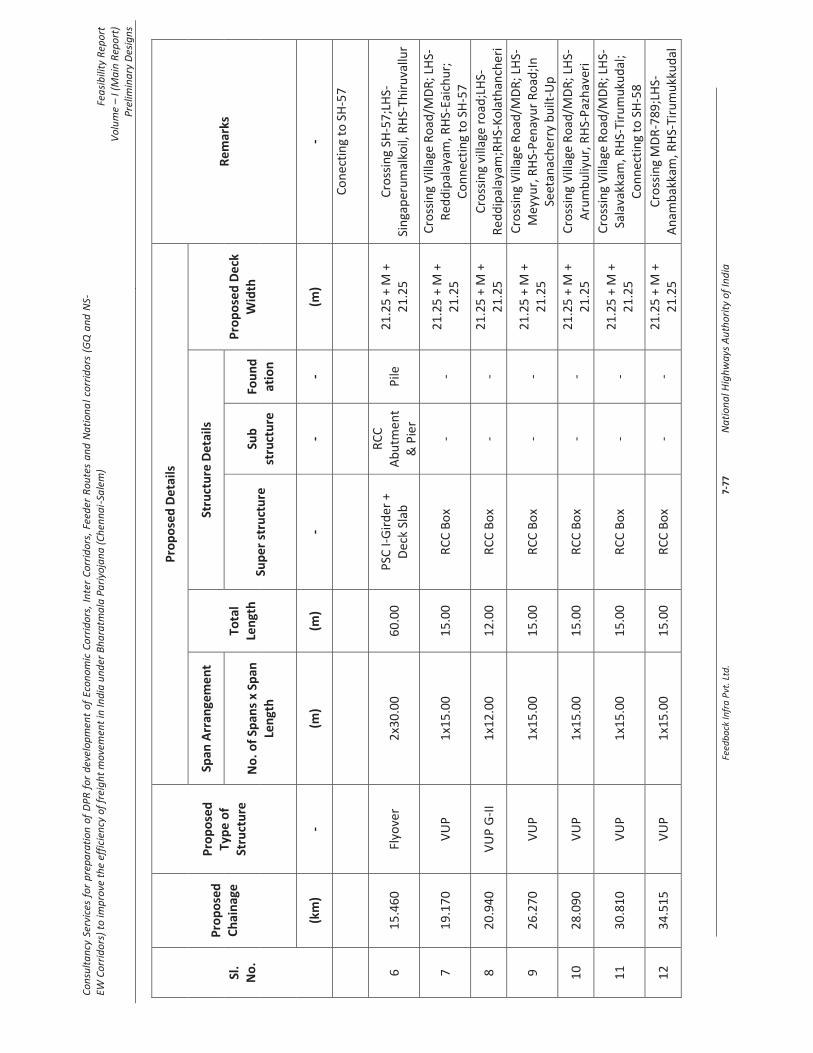
Cons
ulta
ncy
Serv
ices
for p
repa
ratio
n of
DPR
for d
evel
opm
ent o
f Eco
nom
ic C
orrid
ors,
Inte
r Cor
ridor
s, Fe
eder
Rou
tes
and
Natio
nal c
orrid
ors
(GQ
and
NS-
EW C
orrid
ors)
to im
prov
e th
e ef
ficie
ncy
of fr
eigh
t mov
emen
t in
Indi
a un
der B
hara
tmal
a Pa
riyoj
ana
(Che
nnai
-Sal
em)
Feas
ibili
ty R
epor
t Vo
lum
e –
I (M
ain
Repo
rt)
Prel
imin
ary
Desig
ns
Feed
back
Infra
Pvt
. Ltd
.
7
-77
Nat
iona
l Hig
hway
s Aut
horit
y of
Indi
a
Sl.
No
.
Pro
po
sed
C
hai
nag
e
Pro
po
sed
Ty
pe
of
Stru
ctu
re
Pro
po
sed
De
tails
Re
mar
ks
Span
Arr
ange
me
nt
Tota
l Le
ngt
h
Stru
ctu
re D
eta
ils
Pro
po
sed
De
ck
Wid
th
No
. of
Span
s x
Span
Le
ngt
h
Sup
er s
tru
ctu
re
Sub
st
ruct
ure
Fo
un
dat
ion
(km
) -
(m)
(m)
- -
- (m
) -
Co
nec
tin
g to
SH
-57
6
15
.46
0
Flyo
ver
2x3
0.0
0
60
.00
P
SC I-
Gir
der
+
Dec
k Sl
ab
RC
C
Ab
utm
ent
& P
ier
Pile
2
1.2
5 +
M +
2
1.2
5
Cro
ssin
g SH
-57
;LH
S-Si
nga
per
um
alko
il, R
HS-
Thir
uva
llur
7
19
.17
0
VU
P
1x1
5.0
0
15
.00
R
CC
Bo
x -
- 2
1.2
5 +
M +
2
1.2
5
Cro
ssin
g V
illag
e R
oad
/MD
R; L
HS-
Red
dip
alay
am, R
HS-
Eaic
hu
r;
Co
nn
ecti
ng
to S
H-5
7
8
20
.94
0
VU
P G
-II
1x1
2.0
0
12
.00
R
CC
Bo
x -
- 2
1.2
5 +
M +
2
1.2
5
Cro
ssin
g vi
llage
ro
ad;L
HS-
Red
dip
alay
am;R
HS-
Ko
lath
anch
eri
9
26
.27
0
VU
P
1x1
5.0
0
15
.00
R
CC
Bo
x -
- 2
1.2
5 +
M +
2
1.2
5
Cro
ssin
g V
illag
e R
oad
/MD
R; L
HS-
Mey
yur,
RH
S-P
enay
ur
Ro
ad;I
n
Seet
anac
her
ry b
uilt
-Up
10
28
.09
0
VU
P
1x1
5.0
0
15
.00
R
CC
Bo
x -
- 2
1.2
5 +
M +
2
1.2
5
Cro
ssin
g V
illag
e R
oad
/MD
R; L
HS-
Aru
mb
uliy
ur,
RH
S-P
azh
aver
i
11
30
.81
0
VU
P
1x1
5.0
0
15
.00
R
CC
Bo
x -
- 2
1.2
5 +
M +
2
1.2
5
Cro
ssin
g V
illag
e R
oad
/MD
R; L
HS-
Sala
vakk
am, R
HS-
Tiru
mu
kud
al;
Co
nn
ecti
ng
to S
H-5
8
12
34
.51
5
VU
P
1x1
5.0
0
15
.00
R
CC
Bo
x -
- 2
1.2
5 +
M +
2
1.2
5
Cro
ssin
g M
DR
-78
9;L
HS-
An
amb
akka
m, R
HS-
Tiru
mu
kku
dal
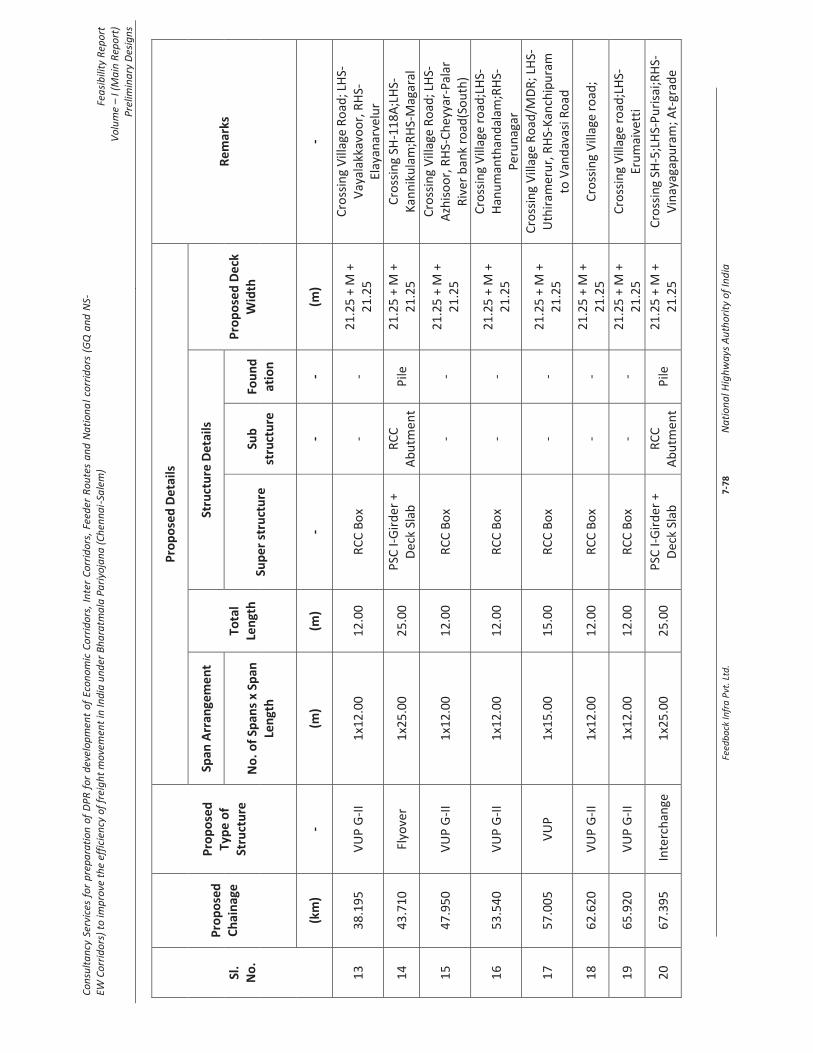
Cons
ulta
ncy
Serv
ices
for p
repa
ratio
n of
DPR
for d
evel
opm
ent o
f Eco
nom
ic C
orrid
ors,
Inte
r Cor
ridor
s, Fe
eder
Rou
tes
and
Natio
nal c
orrid
ors
(GQ
and
NS-
EW C
orrid
ors)
to im
prov
e th
e ef
ficie
ncy
of fr
eigh
t mov
emen
t in
Indi
a un
der B
hara
tmal
a Pa
riyoj
ana
(Che
nnai
-Sal
em)
Feas
ibili
ty R
epor
t Vo
lum
e –
I (M
ain
Repo
rt)
Prel
imin
ary
Desig
ns
Feed
back
Infra
Pvt
. Ltd
.
7
-78
Nat
iona
l Hig
hway
s Aut
horit
y of
Indi
a
Sl.
No
.
Pro
po
sed
C
hai
nag
e
Pro
po
sed
Ty
pe
of
Stru
ctu
re
Pro
po
sed
De
tails
Re
mar
ks
Span
Arr
ange
me
nt
Tota
l Le
ngt
h
Stru
ctu
re D
eta
ils
Pro
po
sed
De
ck
Wid
th
No
. of
Span
s x
Span
Le
ngt
h
Sup
er s
tru
ctu
re
Sub
st
ruct
ure
Fo
un
dat
ion
(km
) -
(m)
(m)
- -
- (m
) -
13
38
.19
5
VU
P G
-II
1x1
2.0
0
12
.00
R
CC
Bo
x -
- 2
1.2
5 +
M +
2
1.2
5
Cro
ssin
g V
illag
e R
oad
; LH
S-V
ayal
akka
voo
r, R
HS-
Elay
anar
velu
r
14
43
.71
0
Flyo
ver
1x2
5.0
0
25
.00
P
SC I-
Gir
der
+
Dec
k Sl
ab
RC
C
Ab
utm
ent
P
ile
21
.25
+ M
+
21
.25
C
ross
ing
SH-1
18
A;L
HS-
Kan
nik
ula
m;R
HS-
Mag
aral
15
47
.95
0
VU
P G
-II
1x1
2.0
0
12
.00
R
CC
Bo
x -
- 2
1.2
5 +
M +
2
1.2
5
Cro
ssin
g V
illag
e R
oad
; LH
S-A
zhis
oo
r, R
HS-
Ch
eyya
r-P
alar
R
iver
ban
k ro
ad(S
ou
th)
16
53
.54
0
VU
P G
-II
1x1
2.0
0
12
.00
R
CC
Bo
x -
- 2
1.2
5 +
M +
2
1.2
5
Cro
ssin
g V
illag
e ro
ad;L
HS-
Han
um
anth
and
alam
;RH
S-P
eru
nag
ar
17
57
.00
5
VU
P
1x1
5.0
0
15
.00
R
CC
Bo
x -
- 2
1.2
5 +
M +
2
1.2
5
Cro
ssin
g V
illag
e R
oad
/MD
R; L
HS-
Uth
iram
eru
r, R
HS-
Kan
chip
ura
m
to V
and
avas
i Ro
ad
18
62
.62
0
VU
P G
-II
1x1
2.0
0
12
.00
R
CC
Bo
x -
- 2
1.2
5 +
M +
2
1.2
5
Cro
ssin
g V
illag
e ro
ad;
19
65
.92
0
VU
P G
-II
1x1
2.0
0
12
.00
R
CC
Bo
x -
- 2
1.2
5 +
M +
2
1.2
5
Cro
ssin
g V
illag
e ro
ad;L
HS-
Eru
mai
vett
i
20
67
.39
5
Inte
rch
ange
1
x25
.00
2
5.0
0
PSC
I-G
ird
er +
D
eck
Slab
R
CC
A
bu
tmen
t
Pile
2
1.2
5 +
M +
2
1.2
5
Cro
ssin
g SH
-5;L
HS-
Pu
risa
i;RH
S-V
inay
agap
ura
m; A
t-gr
ade
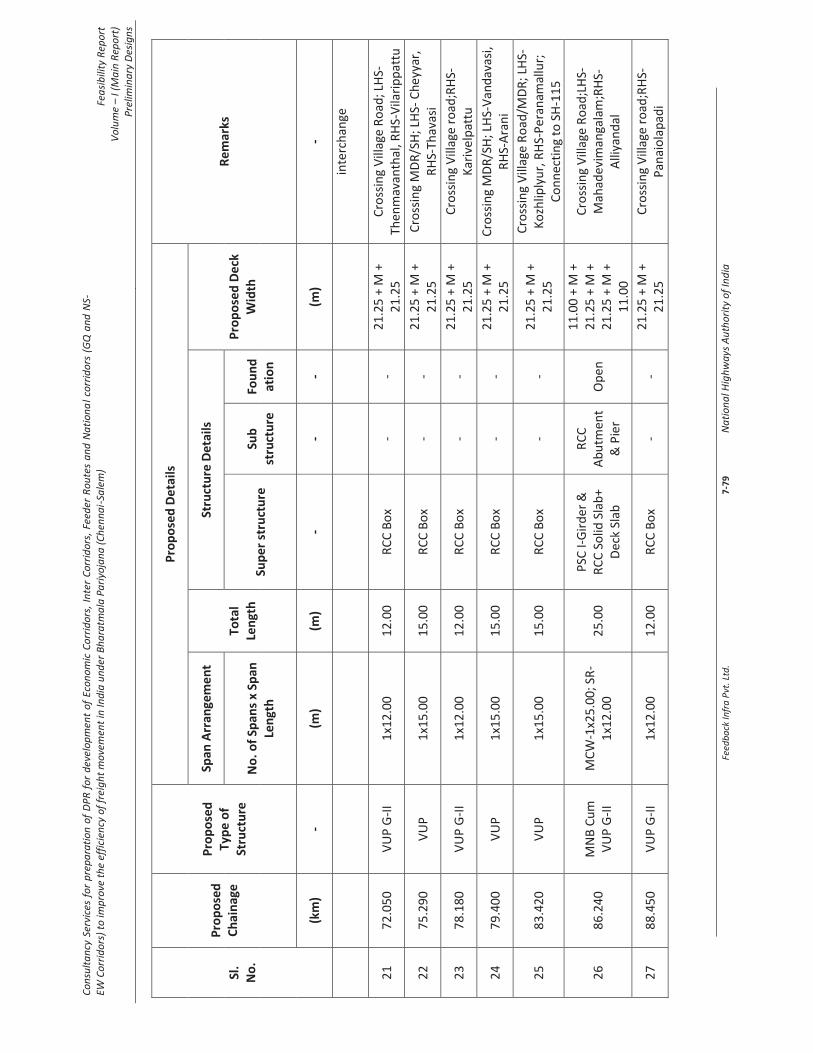
Cons
ulta
ncy
Serv
ices
for p
repa
ratio
n of
DPR
for d
evel
opm
ent o
f Eco
nom
ic C
orrid
ors,
Inte
r Cor
ridor
s, Fe
eder
Rou
tes
and
Natio
nal c
orrid
ors
(GQ
and
NS-
EW C
orrid
ors)
to im
prov
e th
e ef
ficie
ncy
of fr
eigh
t mov
emen
t in
Indi
a un
der B
hara
tmal
a Pa
riyoj
ana
(Che
nnai
-Sal
em)
Feas
ibili
ty R
epor
t Vo
lum
e –
I (M
ain
Repo
rt)
Prel
imin
ary
Desig
ns
Feed
back
Infra
Pvt
. Ltd
.
7
-79
Nat
iona
l Hig
hway
s Aut
horit
y of
Indi
a
Sl.
No
.
Pro
po
sed
C
hai
nag
e
Pro
po
sed
Ty
pe
of
Stru
ctu
re
Pro
po
sed
De
tails
Re
mar
ks
Span
Arr
ange
me
nt
Tota
l Le
ngt
h
Stru
ctu
re D
eta
ils
Pro
po
sed
De
ck
Wid
th
No
. of
Span
s x
Span
Le
ngt
h
Sup
er s
tru
ctu
re
Sub
st
ruct
ure
Fo
un
dat
ion
(km
) -
(m)
(m)
- -
- (m
) -
inte
rch
ange
21
72
.05
0
VU
P G
-II
1x1
2.0
0
12
.00
R
CC
Bo
x -
- 2
1.2
5 +
M +
2
1.2
5
Cro
ssin
g V
illag
e R
oad
; LH
S-Th
enm
avan
thal
, RH
S-V
ilari
pp
attu
22
75
.29
0
VU
P
1x1
5.0
0
15
.00
R
CC
Bo
x -
- 2
1.2
5 +
M +
2
1.2
5
Cro
ssin
g M
DR
/SH
; LH
S- C
hey
yar,
R
HS-
Thav
asi
23
78
.18
0
VU
P G
-II
1x1
2.0
0
12
.00
R
CC
Bo
x -
- 2
1.2
5 +
M +
2
1.2
5
Cro
ssin
g V
illag
e ro
ad;R
HS-
Kar
ivel
pat
tu
24
79
.40
0
VU
P
1x1
5.0
0
15
.00
R
CC
Bo
x -
- 2
1.2
5 +
M +
2
1.2
5
Cro
ssin
g M
DR
/SH
; LH
S-V
and
avas
i, R
HS-
Ara
ni
25
83
.42
0
VU
P
1x1
5.0
0
15
.00
R
CC
Bo
x -
- 2
1.2
5 +
M +
2
1.2
5
Cro
ssin
g V
illag
e R
oad
/MD
R; L
HS-
Ko
zhlip
lyu
r, R
HS-
Per
anam
allu
r;
Co
nn
ecti
ng
to S
H-1
15
26
86
.24
0
MN
B C
um
V
UP
G-I
I M
CW
-1x2
5.0
0; S
R-
1x1
2.0
0
25
.00
P
SC I-
Gir
der
&
RC
C S
olid
Sla
b+
Dec
k Sl
ab
RC
C
Ab
utm
ent
& P
ier
Op
en
11
.00
+ M
+
21
.25
+ M
+
21
.25
+ M
+
11
.00
Cro
ssin
g V
illag
e R
oad
;LH
S-M
ahad
evim
anga
lam
;RH
S-A
lliya
nd
al
27
88
.45
0
VU
P G
-II
1x1
2.0
0
12
.00
R
CC
Bo
x -
- 2
1.2
5 +
M +
2
1.2
5
Cro
ssin
g V
illag
e ro
ad;R
HS-
Pan
aio
lap
adi
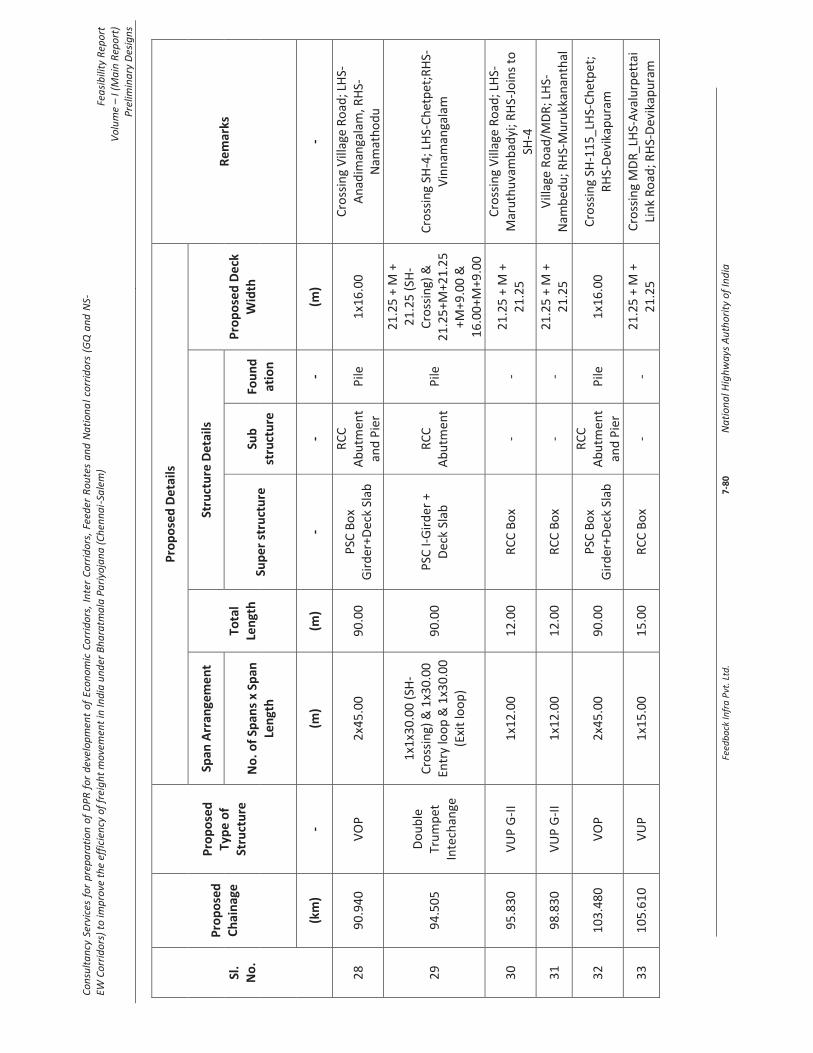
Cons
ulta
ncy
Serv
ices
for p
repa
ratio
n of
DPR
for d
evel
opm
ent o
f Eco
nom
ic C
orrid
ors,
Inte
r Cor
ridor
s, Fe
eder
Rou
tes
and
Natio
nal c
orrid
ors
(GQ
and
NS-
EW C
orrid
ors)
to im
prov
e th
e ef
ficie
ncy
of fr
eigh
t mov
emen
t in
Indi
a un
der B
hara
tmal
a Pa
riyoj
ana
(Che
nnai
-Sal
em)
Feas
ibili
ty R
epor
t Vo
lum
e –
I (M
ain
Repo
rt)
Prel
imin
ary
Desig
ns
Feed
back
Infra
Pvt
. Ltd
.
7
-80
Nat
iona
l Hig
hway
s Aut
horit
y of
Indi
a
Sl.
No
.
Pro
po
sed
C
hai
nag
e
Pro
po
sed
Ty
pe
of
Stru
ctu
re
Pro
po
sed
De
tails
Re
mar
ks
Span
Arr
ange
me
nt
Tota
l Le
ngt
h
Stru
ctu
re D
eta
ils
Pro
po
sed
De
ck
Wid
th
No
. of
Span
s x
Span
Le
ngt
h
Sup
er s
tru
ctu
re
Sub
st
ruct
ure
Fo
un
dat
ion
(km
) -
(m)
(m)
- -
- (m
) -
28
90
.94
0
VO
P
2x4
5.0
0
90
.00
P
SC B
ox
Gir
der
+Dec
k Sl
ab
RC
C
Ab
utm
ent
and
Pie
r P
ile
1x1
6.0
0
Cro
ssin
g V
illag
e R
oad
; LH
S-A
nad
iman
gala
m, R
HS-
Nam
ath
od
u
29
94
.50
5
Do
ub
le
Tru
mp
et
Inte
chan
ge
1x1
x30
.00
(SH
-C
ross
ing)
& 1
x30
.00
En
try
loo
p &
1x3
0.0
0
(Exi
t lo
op
)
90
.00
P
SC I-
Gir
der
+
Dec
k Sl
ab
RC
C
Ab
utm
ent
P
ile
21
.25
+ M
+
21
.25
(SH
-C
ross
ing)
&
21
.25
+M+2
1.2
5+M
+9.0
0 &
1
6.0
0+M
+9.0
0
Cro
ssin
g SH
-4; L
HS-
Ch
etp
et;R
HS-
Vin
nam
anga
lam
30
95
.83
0
VU
P G
-II
1x1
2.0
0
12
.00
R
CC
Bo
x -
- 2
1.2
5 +
M +
2
1.2
5
Cro
ssin
g V
illag
e R
oad
; LH
S-M
aru
thu
vam
bad
yi; R
HS-
Join
s to
SH
-4
31
98
.83
0
VU
P G
-II
1x1
2.0
0
12
.00
R
CC
Bo
x -
- 2
1.2
5 +
M +
2
1.2
5
Vill
age
Ro
ad/M
DR
; LH
S-N
amb
edu
; RH
S-M
uru
kkan
anth
al
32
10
3.4
80
V
OP
2
x45
.00
9
0.0
0
PSC
Bo
x G
ird
er+D
eck
Slab
RC
C
Ab
utm
ent
and
Pie
r P
ile
1x1
6.0
0
Cro
ssin
g SH
-11
5_L
HS-
Ch
etp
et;
RH
S-D
evik
apu
ram
33
10
5.6
10
V
UP
1
x15
.00
1
5.0
0
RC
C B
ox
- -
21
.25
+ M
+
21
.25
C
ross
ing
MD
R_L
HS-
Ava
lurp
etta
i Li
nk
Ro
ad; R
HS-
Dev
ikap
ura
m

Cons
ulta
ncy
Serv
ices
for p
repa
ratio
n of
DPR
for d
evel
opm
ent o
f Eco
nom
ic C
orrid
ors,
Inte
r Cor
ridor
s, Fe
eder
Rou
tes
and
Natio
nal c
orrid
ors
(GQ
and
NS-
EW C
orrid
ors)
to im
prov
e th
e ef
ficie
ncy
of fr
eigh
t mov
emen
t in
Indi
a un
der B
hara
tmal
a Pa
riyoj
ana
(Che
nnai
-Sal
em)
Feas
ibili
ty R
epor
t Vo
lum
e –
I (M
ain
Repo
rt)
Prel
imin
ary
Desig
ns
Feed
back
Infra
Pvt
. Ltd
.
7
-81
Nat
iona
l Hig
hway
s Aut
horit
y of
Indi
a
Sl.
No
.
Pro
po
sed
C
hai
nag
e
Pro
po
sed
Ty
pe
of
Stru
ctu
re
Pro
po
sed
De
tails
Re
mar
ks
Span
Arr
ange
me
nt
Tota
l Le
ngt
h
Stru
ctu
re D
eta
ils
Pro
po
sed
De
ck
Wid
th
No
. of
Span
s x
Span
Le
ngt
h
Sup
er s
tru
ctu
re
Sub
st
ruct
ure
Fo
un
dat
ion
(km
) -
(m)
(m)
- -
- (m
) -
34
11
0.4
55
V
UP
G-I
I 1
x12
.00
1
2.0
0
RC
C B
ox
- -
21
.25
+ M
+
21
.25
Vill
age
Ro
ad/M
DR
; LH
S-C
hit
tath
ura
i; R
HS-
Sem
iyam
anga
lam
35
11
5.7
50
V
UP
1
x15
.00
1
5.0
0
RC
C B
ox
- -
21
.25
+ M
+
21
.25
Cro
ssin
g M
DR
; LH
S-P
adag
em;
RH
S-K
om
man
anth
al c
on
nec
tin
gt
o S
H-1
15
36
12
1.7
60
Fl
yove
r 1
x15
.00
+ 1
x30
.00
+
1x1
5.0
0
60
.00
P
SC I-
Gir
der
&
RC
C I-
Gir
der
+
Dec
k Sl
ab
RC
C
Ab
utm
ent
& P
iers
P
ile
21
.25
+ M
+
21
.25
C
ross
ing
NH
-23
4; L
HS-
Tiru
van
nam
alai
; RH
S-V
ello
re
37
12
2.6
70
Tr
um
pet
In
terc
han
ge
2x3
0.0
0
60
.00
P
SC I-
Gir
der
+
Dec
k Sl
ab
RC
C
Ab
utm
ent
& P
ier
Pile
2
1.2
5 +
M +
2
1.2
5
At
the
star
t o
f Ti
ruva
nn
amal
ai
Spu
r ro
ad
38
12
5.5
00
V
UP
1
x15
.00
1
5.0
0
RC
C B
ox
- -
21
.25
+ M
+
21
.25
C
ross
ing
SH/M
DR
; LH
S-A
gara
mSi
bb
and
hi;
RH
S-K
anji
39
13
1.4
50
V
UP
1
x15
.00
1
5.0
0
RC
C B
ox
- -
21
.25
+ M
+
21
.25
C
ross
ing
SH/M
DR
; LH
S-A
gara
mSi
bb
and
hi;
RH
S-K
anji
40
13
8.1
80
V
UP
1
x15
.00
1
5.0
0
RC
C B
ox
- -
21
.25
+ M
+
21
.25
C
ross
ing
SH/M
DR
; LH
S-Ti
ruva
nn
amal
ai; R
HS-
Kan
ji
41
14
1.7
50
V
UP
G-I
I 1
x12
.00
1
2.0
0
RC
C B
ox
- -
21
.25
+ M
+
21
.25
C
ross
ing
Vill
age
Ro
ad/M
DR
;RH
S-P
anai
ola
pad
i
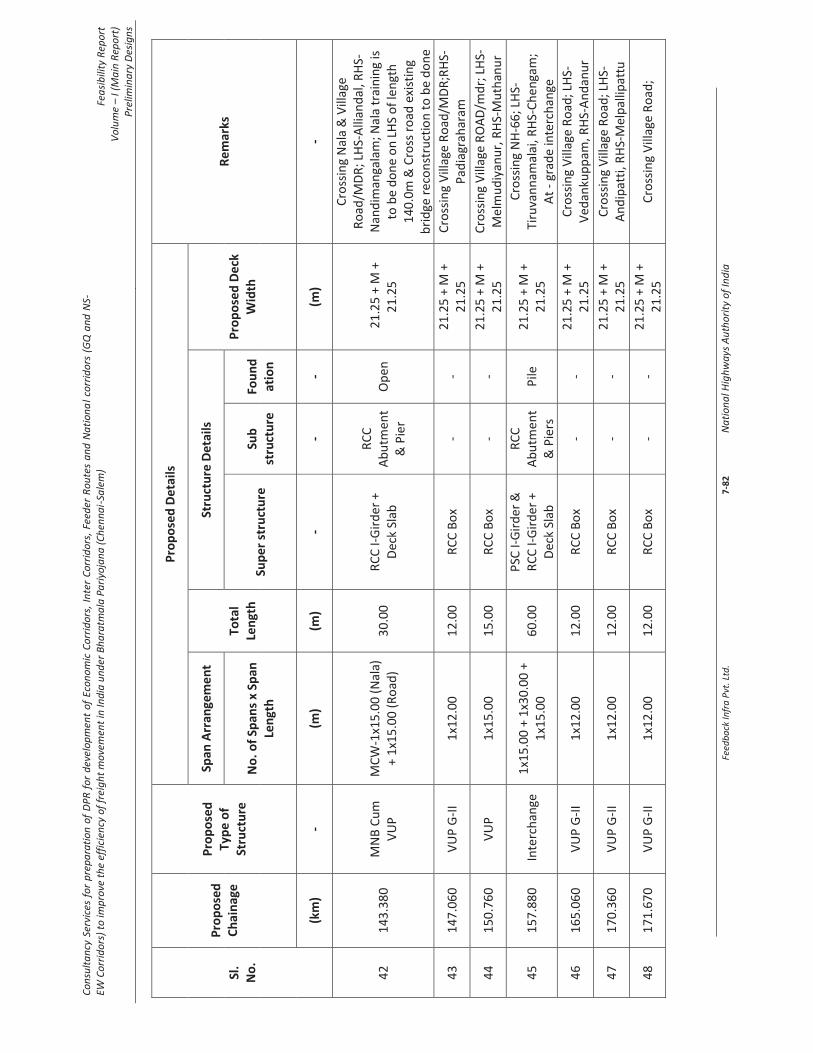
Cons
ulta
ncy
Serv
ices
for p
repa
ratio
n of
DPR
for d
evel
opm
ent o
f Eco
nom
ic C
orrid
ors,
Inte
r Cor
ridor
s, Fe
eder
Rou
tes
and
Natio
nal c
orrid
ors
(GQ
and
NS-
EW C
orrid
ors)
to im
prov
e th
e ef
ficie
ncy
of fr
eigh
t mov
emen
t in
Indi
a un
der B
hara
tmal
a Pa
riyoj
ana
(Che
nnai
-Sal
em)
Feas
ibili
ty R
epor
t Vo
lum
e –
I (M
ain
Repo
rt)
Prel
imin
ary
Desig
ns
Feed
back
Infra
Pvt
. Ltd
.
7
-82
Nat
iona
l Hig
hway
s Aut
horit
y of
Indi
a
Sl.
No
.
Pro
po
sed
C
hai
nag
e
Pro
po
sed
Ty
pe
of
Stru
ctu
re
Pro
po
sed
De
tails
Re
mar
ks
Span
Arr
ange
me
nt
Tota
l Le
ngt
h
Stru
ctu
re D
eta
ils
Pro
po
sed
De
ck
Wid
th
No
. of
Span
s x
Span
Le
ngt
h
Sup
er s
tru
ctu
re
Sub
st
ruct
ure
Fo
un
dat
ion
(km
) -
(m)
(m)
- -
- (m
) -
42
14
3.3
80
M
NB
Cu
m
VU
P
MC
W-1
x15
.00
(N
ala)
+
1x1
5.0
0 (
Ro
ad)
30
.00
R
CC
I-G
ird
er +
D
eck
Slab
RC
C
Ab
utm
ent
& P
ier
Op
en
21
.25
+ M
+
21
.25
Cro
ssin
g N
ala
& V
illag
e R
oad
/MD
R; L
HS-
Alli
and
al, R
HS-
Nan
dim
anga
lam
; Nal
a tr
ain
ing
is
to b
e d
on
e o
n L
HS
of
len
gth
1
40
.0m
& C
ross
ro
ad e
xist
ing
bri
dge
rec
on
stru
ctio
n t
o b
e d
on
e
43
14
7.0
60
V
UP
G-I
I 1
x12
.00
1
2.0
0
RC
C B
ox
- -
21
.25
+ M
+
21
.25
C
ross
ing
Vill
age
Ro
ad/M
DR
;RH
S-P
adia
grah
aram
44
15
0.7
60
V
UP
1
x15
.00
1
5.0
0
RC
C B
ox
- -
21
.25
+ M
+
21
.25
C
ross
ing
Vill
age
RO
AD
/md
r; L
HS-
Mel
mu
diy
anu
r, R
HS-
Mu
than
ur
45
15
7.8
80
In
terc
han
ge
1x1
5.0
0 +
1x3
0.0
0 +
1
x15
.00
6
0.0
0
PSC
I-G
ird
er &
R
CC
I-G
ird
er +
D
eck
Slab
RC
C
Ab
utm
ent
& P
iers
P
ile
21
.25
+ M
+
21
.25
Cro
ssin
g N
H-6
6; L
HS-
Tiru
van
nam
alai
, RH
S-C
hen
gam
; A
t -
grad
e in
terc
han
ge
46
16
5.0
60
V
UP
G-I
I 1
x12
.00
1
2.0
0
RC
C B
ox
- -
21
.25
+ M
+
21
.25
C
ross
ing
Vill
age
Ro
ad; L
HS-
Ved
anku
pp
am, R
HS-
An
dan
ur
47
17
0.3
60
V
UP
G-I
I 1
x12
.00
1
2.0
0
RC
C B
ox
- -
21
.25
+ M
+
21
.25
C
ross
ing
Vill
age
Ro
ad; L
HS-
An
dip
atti
, RH
S-M
elp
allip
attu
48
17
1.6
70
V
UP
G-I
I 1
x12
.00
1
2.0
0
RC
C B
ox
- -
21
.25
+ M
+
21
.25
C
ross
ing
Vill
age
Ro
ad;
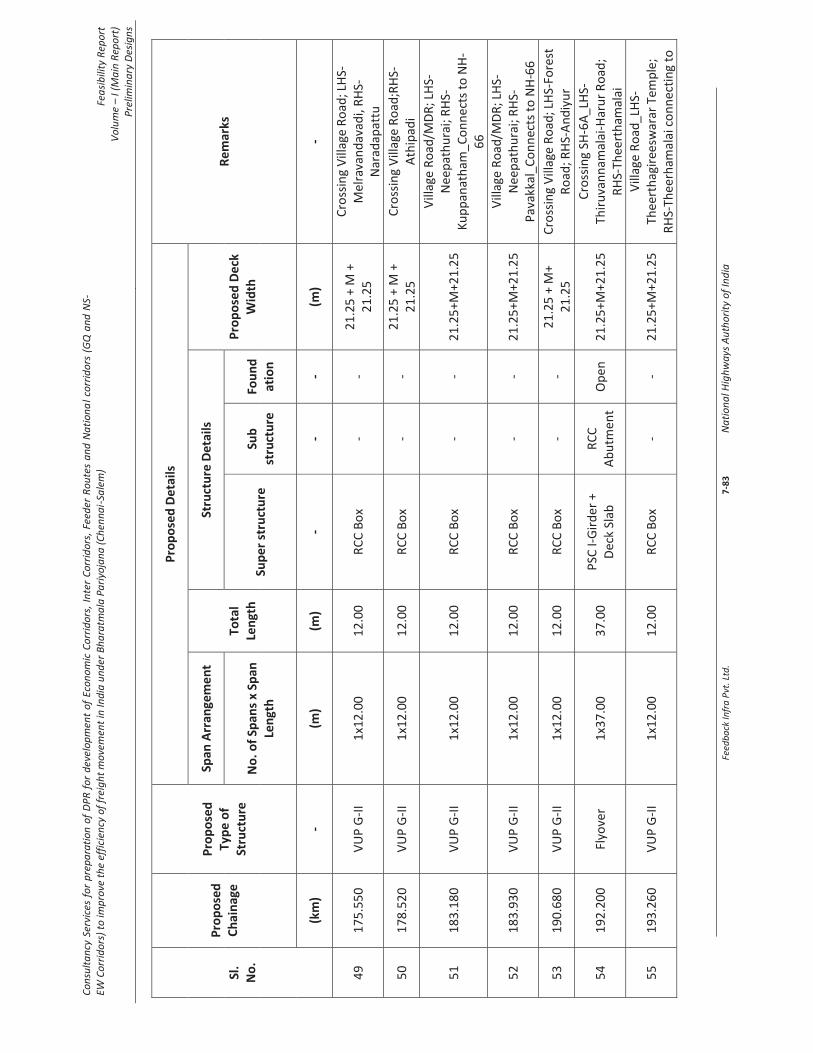
Cons
ulta
ncy
Serv
ices
for p
repa
ratio
n of
DPR
for d
evel
opm
ent o
f Eco
nom
ic C
orrid
ors,
Inte
r Cor
ridor
s, Fe
eder
Rou
tes
and
Natio
nal c
orrid
ors
(GQ
and
NS-
EW C
orrid
ors)
to im
prov
e th
e ef
ficie
ncy
of fr
eigh
t mov
emen
t in
Indi
a un
der B
hara
tmal
a Pa
riyoj
ana
(Che
nnai
-Sal
em)
Feas
ibili
ty R
epor
t Vo
lum
e –
I (M
ain
Repo
rt)
Prel
imin
ary
Desig
ns
Feed
back
Infra
Pvt
. Ltd
.
7
-83
Nat
iona
l Hig
hway
s Aut
horit
y of
Indi
a
Sl.
No
.
Pro
po
sed
C
hai
nag
e
Pro
po
sed
Ty
pe
of
Stru
ctu
re
Pro
po
sed
De
tails
Re
mar
ks
Span
Arr
ange
me
nt
Tota
l Le
ngt
h
Stru
ctu
re D
eta
ils
Pro
po
sed
De
ck
Wid
th
No
. of
Span
s x
Span
Le
ngt
h
Sup
er s
tru
ctu
re
Sub
st
ruct
ure
Fo
un
dat
ion
(km
) -
(m)
(m)
- -
- (m
) -
49
17
5.5
50
V
UP
G-I
I 1
x12
.00
1
2.0
0
RC
C B
ox
- -
21
.25
+ M
+
21
.25
Cro
ssin
g V
illag
e R
oad
; LH
S-M
elra
van
dav
adi,
RH
S-N
arad
apat
tu
50
17
8.5
20
V
UP
G-I
I 1
x12
.00
1
2.0
0
RC
C B
ox
- -
21
.25
+ M
+
21
.25
C
ross
ing
Vill
age
Ro
ad;R
HS-
Ath
ipad
i
51
18
3.1
80
V
UP
G-I
I 1
x12
.00
1
2.0
0
RC
C B
ox
- -
21
.25
+M+2
1.2
5
Vill
age
Ro
ad/M
DR
; LH
S-N
eep
ath
ura
i; R
HS-
Ku
pp
anat
ham
_Co
nn
ects
to
NH
-6
6
52
18
3.9
30
V
UP
G-I
I 1
x12
.00
1
2.0
0
RC
C B
ox
- -
21
.25
+M+2
1.2
5
Vill
age
Ro
ad/M
DR
; LH
S-N
eep
ath
ura
i; R
HS-
P
avak
kal_
Co
nn
ects
to
NH
-66
53
19
0.6
80
V
UP
G-I
I 1
x12
.00
1
2.0
0
RC
C B
ox
- -
21
.25
+ M
+ 2
1.2
5
Cro
ssin
g V
illag
e R
oad
; LH
S-Fo
rest
R
oad
; RH
S-A
nd
iyu
r
54
19
2.2
00
Fl
yove
r 1
x37
.00
3
7.0
0
PSC
I-G
ird
er +
D
eck
Slab
R
CC
A
bu
tmen
t O
pen
2
1.2
5+M
+21
.25
C
ross
ing
SH-6
A_L
HS-
Thir
uva
nn
amal
ai-H
aru
r R
oad
; R
HS-
Thee
rth
amal
ai
55
19
3.2
60
V
UP
G-I
I 1
x12
.00
1
2.0
0
RC
C B
ox
- -
21
.25
+M+2
1.2
5
Vill
age
Ro
ad_L
HS-
Thee
rth
agir
eesw
arar
Tem
ple
; R
HS-
Thee
rham
alai
co
nn
ecti
ng
to

Cons
ulta
ncy
Serv
ices
for p
repa
ratio
n of
DPR
for d
evel
opm
ent o
f Eco
nom
ic C
orrid
ors,
Inte
r Cor
ridor
s, Fe
eder
Rou
tes
and
Natio
nal c
orrid
ors
(GQ
and
NS-
EW C
orrid
ors)
to im
prov
e th
e ef
ficie
ncy
of fr
eigh
t mov
emen
t in
Indi
a un
der B
hara
tmal
a Pa
riyoj
ana
(Che
nnai
-Sal
em)
Feas
ibili
ty R
epor
t Vo
lum
e –
I (M
ain
Repo
rt)
Prel
imin
ary
Desig
ns
Feed
back
Infra
Pvt
. Ltd
.
7
-84
Nat
iona
l Hig
hway
s Aut
horit
y of
Indi
a
Sl.
No
.
Pro
po
sed
C
hai
nag
e
Pro
po
sed
Ty
pe
of
Stru
ctu
re
Pro
po
sed
De
tails
Re
mar
ks
Span
Arr
ange
me
nt
Tota
l Le
ngt
h
Stru
ctu
re D
eta
ils
Pro
po
sed
De
ck
Wid
th
No
. of
Span
s x
Span
Le
ngt
h
Sup
er s
tru
ctu
re
Sub
st
ruct
ure
Fo
un
dat
ion
(km
) -
(m)
(m)
- -
- (m
) -
SH-6
A
56
19
6.2
60
V
UP
1
x22
.00
2
2.0
0
RC
C I
Gir
der
+Dec
k Sl
ab
RC
C
Ab
utm
ent
Op
en
21
.25
+M+2
1.2
5
Cro
ssin
g SH
/MD
R; L
HS-
Har
ur;
R
HS-
Thee
rth
amal
ai
57
20
0.1
15
V
UP
G-I
I 1
x12
.00
1
2.0
0
RC
C B
ox
- -
21
.25
+ M
+
21
.25
C
ross
ing
Vill
age
Ro
ad;L
HS-
Itta
imp
atty
58
20
1.3
80
V
UP
1
x26
.00
2
6.0
0
PSC
I-G
ird
er+D
eck
Slab
R
CC
A
bu
tmen
t O
pen
2
1.2
5+M
+21
.25
C
ross
ing
SH/M
DR
; LH
S-Th
eert
ham
alai
; RH
S-H
aru
r
59
20
5.4
20
V
UP
1
x17
.00
1
7.0
0
RC
C I
Gir
der
+Dec
k Sl
ab
RC
C
Ab
utm
ent
Op
en
21
.25
+M+2
1.2
5
Cro
ssin
g SH
/MD
R; L
HS-
Sith
eri;
RH
S-H
aru
r
60
21
1.5
50
V
UP
G-I
I 1
x12
.00
1
2.0
0
RC
C B
ox
- -
21
.25
+M+2
1.2
5
Cro
ssin
g V
illag
e R
oad
; LH
S-A
chal
vad
i; R
HS-
Go
bin
ath
amp
atti
61
21
3.0
60
V
UP
G-I
I 1
x12
.00
1
2.0
0
RC
C B
ox
- -
21
.25
+M+2
1.2
5
Cro
ssin
g V
illag
e R
oad
; LH
S-P
eth
ath
amp
atti
; RH
S-G
ob
inat
ham
pat
ti c
on
nec
tin
g to
SH
-18
62
21
7.1
00
V
UP
G-I
I 1
x12
.00
1
2.0
0
RC
C B
ox
- -
21
.25
+ M
+
21
.25
C
ross
ing
Vill
age
Ro
ad;
63
21
9.5
30
M
NB
Cu
m
VU
P
MC
W-2
x15
.00
SR
-1x1
5.0
0
30
.00
R
CC
I-G
ird
er+D
eck
Slab
R
CC
A
bu
tmen
t O
pen
1
1.0
0 +
M +
2
1.2
5 +
M+
Cro
ssin
g N
ala
& V
illag
e R
oad
; LH
S-V
illag
e R
oad
; RH
S-

Cons
ulta
ncy
Serv
ices
for p
repa
ratio
n of
DPR
for d
evel
opm
ent o
f Eco
nom
ic C
orrid
ors,
Inte
r Cor
ridor
s, Fe
eder
Rou
tes
and
Natio
nal c
orrid
ors
(GQ
and
NS-
EW C
orrid
ors)
to im
prov
e th
e ef
ficie
ncy
of fr
eigh
t mov
emen
t in
Indi
a un
der B
hara
tmal
a Pa
riyoj
ana
(Che
nnai
-Sal
em)
Feas
ibili
ty R
epor
t Vo
lum
e –
I (M
ain
Repo
rt)
Prel
imin
ary
Desig
ns
Feed
back
Infra
Pvt
. Ltd
.
7
-85
Nat
iona
l Hig
hway
s Aut
horit
y of
Indi
a
Sl.
No
.
Pro
po
sed
C
hai
nag
e
Pro
po
sed
Ty
pe
of
Stru
ctu
re
Pro
po
sed
De
tails
Re
mar
ks
Span
Arr
ange
me
nt
Tota
l Le
ngt
h
Stru
ctu
re D
eta
ils
Pro
po
sed
De
ck
Wid
th
No
. of
Span
s x
Span
Le
ngt
h
Sup
er s
tru
ctu
re
Sub
st
ruct
ure
Fo
un
dat
ion
(km
) -
(m)
(m)
- -
- (m
) -
& P
iers
2
1.2
5 +
M +
1
1.0
0
Mo
okk
ared
dip
atti
; Nal
a tr
ain
ing
to b
e d
on
e o
f le
ngt
h 1
80
.00
m
64
56
.67
5
Inte
rch
ange
1
x25
.00
2
5.0
0
PSC
I-G
ird
er +
D
eck
Slab
R
CC
A
bu
tmen
t O
pen
2
1.2
5+M
+21
.25
En
d o
f B
yap
ss; R
HS-
Pal
lipat
ti
65
49
.24
0
Flyo
ver
1x2
5.0
0
25
.00
P
SC I-
Gir
der
+
Dec
k Sl
ab
RC
C
Ab
utm
ent
O
pen
2
1.2
5+M
+21
.25
C
ross
ing
SH-1
8; L
HS-
Van
iyam
bad
i
66
46
.40
0
Flyo
ver
1x2
5.0
0
25
.00
P
SC I-
Gir
der
+
Dec
k Sl
ab
RC
C
Ab
utm
ent
O
pen
2
1.2
5+M
+21
.25
St
art
of
Byp
ass;
RH
S-SH
-18
67
43
.28
0
VU
P G
-II
1x1
2.0
0
12
.00
R
CC
Bo
x -
- 2
1.2
5 +
M+
21
.25
Cro
ssin
g V
illag
e R
aod
; LH
S-M
anja
vad
i Res
erve
Fo
rest
; RH
S -
Lask
hm
apu
ram
68
40
.50
0 Fl
yove
r 1
x25
.00
2
5.0
0
PSC
I-G
ird
er +
D
eck
Slab
R
CC
A
bu
tmen
t
Op
en
21
.25
+M+2
1.2
5
End
of
Byp
ass;
RH
S-SH
-18
69
31
.80
0
Flyo
ver
1x2
5.0
0
25
.00
P
SC I
-Gir
der
+
Dec
k Sl
ab
RC
C
Ab
utm
ent
Op
en
21
.25
+M+2
1.2
5
Star
t o
f B
ypas
s; R
HS-
Ach
angu
ttap
atti
pu
du
r, S
H-1
8
70
29
.28
0 M
NB
Cu
m
VU
P G
-II
1x2
5.0
0
25
.00
P
SC-I
-G
ird
er+D
eck
Slab
RC
C
Ab
utm
ne
nt
O
pen
2
1.2
5 +
M +
2
1.2
5
Cro
ssin
g V
illag
e R
oad
;RH
S-P
aru
thik
adu
u
71
23
.67
0
Flyo
ver
1x2
5.0
0
25
.00
P
SC I-
Gir
der
+
Dec
k Sl
ab
RC
C
Ab
utm
ent
Op
en
21
.25
+M+2
1.2
5
Cro
ssin
g SH
/MD
R;R
HS-
Ayo
thiy
apat
tin
am

Cons
ulta
ncy
Serv
ices
for p
repa
ratio
n of
DPR
for d
evel
opm
ent o
f Eco
nom
ic C
orrid
ors,
Inte
r Cor
ridor
s, Fe
eder
Rou
tes
and
Natio
nal c
orrid
ors
(GQ
and
NS-
EW C
orrid
ors)
to im
prov
e th
e ef
ficie
ncy
of fr
eigh
t mov
emen
t in
Indi
a un
der B
hara
tmal
a Pa
riyoj
ana
(Che
nnai
-Sal
em)
Feas
ibili
ty R
epor
t Vo
lum
e –
I (M
ain
Repo
rt)
Prel
imin
ary
Desig
ns
Feed
back
Infra
Pvt
. Ltd
.
7
-86
Nat
iona
l Hig
hway
s Aut
horit
y of
Indi
a
Sl.
No
.
Pro
po
sed
C
hai
nag
e
Pro
po
sed
Ty
pe
of
Stru
ctu
re
Pro
po
sed
De
tails
Re
mar
ks
Span
Arr
ange
me
nt
Tota
l Le
ngt
h
Stru
ctu
re D
eta
ils
Pro
po
sed
De
ck
Wid
th
No
. of
Span
s x
Span
Le
ngt
h
Sup
er s
tru
ctu
re
Sub
st
ruct
ure
Fo
un
dat
ion
(km
) -
(m)
(m)
- -
- (m
) -
72
22
.70
0
VU
P
1x1
5.0
0
15
.00
R
CC
Bo
x -
- 2
1.2
5 +
M +
2
1.2
5
Cro
ssin
g M
DR
; LH
S-M
inn
amp
alli
73
21
.59
0
Clo
verl
eaf
Inte
rch
ange
1
x15
.00
+2x3
0.0
0+1
x1
5.0
0
90
.00
P
SC I-
Gir
der
+R
CC
I G
ird
er +
Dec
k Sl
ab
RC
C
Ab
utm
ent
& P
ier
Pile
2
1.2
5+M
+21
.25
C
ross
ing
NH
-68
; LH
S-K
alla
kurc
hi;
RH
S-Sa
lem
74
18
.48
0
VU
P G
-II
1x1
2.0
0
12
.00
R
CC
Bo
x -
- 2
1.2
5 +
M +
2
1.2
5
Cro
ssin
g V
illag
e R
oad
;
75
15
.60
0
VU
P G
-II
1x1
2.0
0
12
.00
R
CC
Bo
x -
- 2
1.2
5 +
M +
2
1.2
5
Cro
ssin
g V
illag
e R
oad
76
13
.23
0
VU
P G
-II
1x1
2.0
0
12
.00
R
CC
Bo
x -
- 2
1.2
5 +
M +
2
1.2
5
Cro
ssin
g V
illag
e R
oad
;RH
S-Sa
nya
sigu
nd
u
77
11
.85
0
VU
P G
-II
1x1
2.0
0
12
.00
R
CC
Bo
x -
- 2
1.2
5 +
M +
2
1.2
5
Cro
ssin
g V
illag
e R
oad
;RH
S-P
aru
thik
adu
u
78
6.9
40
D
ou
ble
Tr
um
pet
In
tech
ange
1x1
x30
.00
(SH
-C
ross
ing)
& 1
x30
.00
En
try
loo
p &
1x3
0.0
0
(Exi
t lo
op
)
90
.00
P
SC I-
Gir
der
+
Dec
k Sl
ab
RC
C
Ab
utm
ent
P
ile
21
.25
+ M
+
21
.25
(SH
-C
ross
ing)
&
21
.25
+M+2
1.2
5+M
+9.0
0 &
1
6.0
0+M
+9.0
0
Cro
ssin
g N
H-7
; LH
S-N
amak
kal;
RH
S-Sa
lem
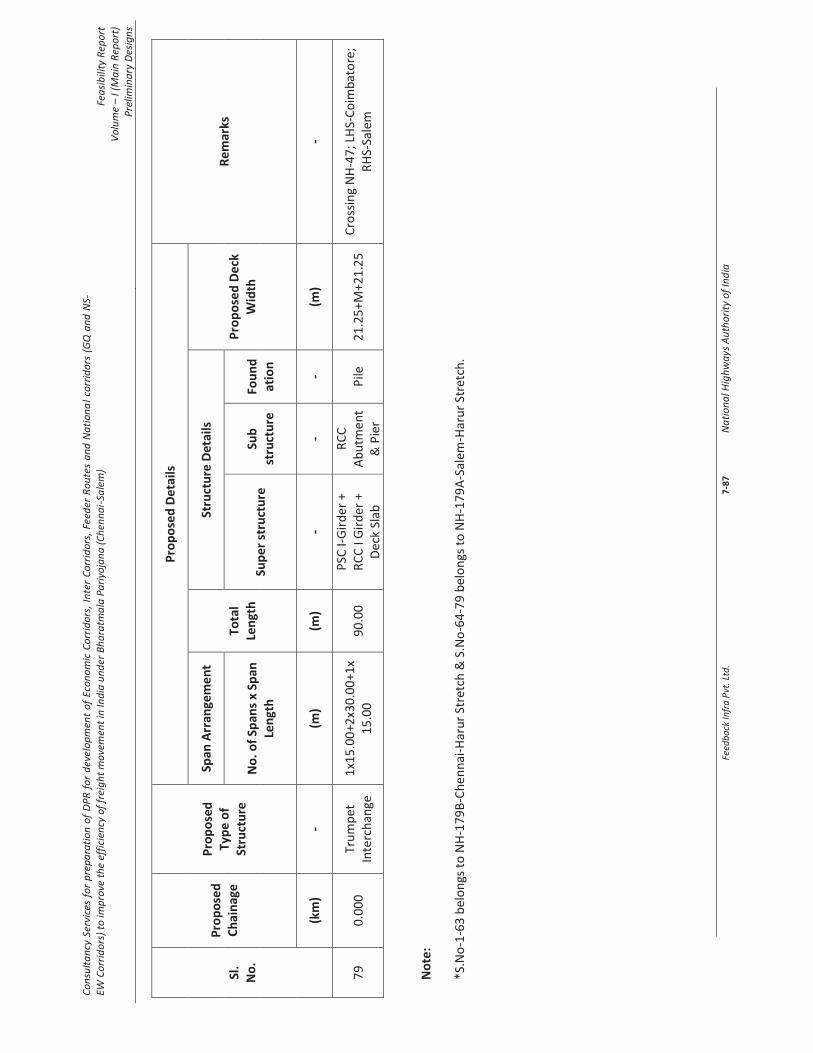
Cons
ulta
ncy
Serv
ices
for p
repa
ratio
n of
DPR
for d
evel
opm
ent o
f Eco
nom
ic C
orrid
ors,
Inte
r Cor
ridor
s, Fe
eder
Rou
tes
and
Natio
nal c
orrid
ors
(GQ
and
NS-
EW C
orrid
ors)
to im
prov
e th
e ef
ficie
ncy
of fr
eigh
t mov
emen
t in
Indi
a un
der B
hara
tmal
a Pa
riyoj
ana
(Che
nnai
-Sal
em)
Feas
ibili
ty R
epor
t Vo
lum
e –
I (M
ain
Repo
rt)
Prel
imin
ary
Desig
ns
Feed
back
Infra
Pvt
. Ltd
.
7
-87
Nat
iona
l Hig
hway
s Aut
horit
y of
Indi
a
Sl.
No
.
Pro
po
sed
C
hai
nag
e
Pro
po
sed
Ty
pe
of
Stru
ctu
re
Pro
po
sed
De
tails
Re
mar
ks
Span
Arr
ange
me
nt
Tota
l Le
ngt
h
Stru
ctu
re D
eta
ils
Pro
po
sed
De
ck
Wid
th
No
. of
Span
s x
Span
Le
ngt
h
Sup
er s
tru
ctu
re
Sub
st
ruct
ure
Fo
un
dat
ion
(km
) -
(m)
(m)
- -
- (m
) -
79
0.0
00
Tr
um
pet
In
terc
han
ge
1x1
5.0
0+2
x30
.00
+1x
15
.00
9
0.0
0
PSC
I-G
ird
er +
R
CC
I G
ird
er +
D
eck
Slab
RC
C
Ab
utm
ent
& P
ier
Pile
2
1.2
5+M
+21
.25
C
ross
ing
NH
-47
; LH
S-C
oim
bat
ore
; R
HS-
Sale
m
No
te:
*S.N
o-1
-63
bel
on
gs t
o N
H-1
79
B-C
hen
nai
-Har
ur
Stre
tch
& S
.No
-64
-79
bel
on
gs t
o N
H-1
79
A-S
alem
-Har
ur
Stre
tch
.

Consultancy services for Preparation of Detailed Project Report of Economic Corridors, Inter Corridors, Feeder routes and National Corridors under Bharatmala Pariyojana (Lot-6/Package -1)
Feasibility Report Volume I (Main Report)
Project Facilities
Feedback Infra Pvt. Ltd. 8-1 National Highways Authority of India
8. Project Facilities
8.1 General
Project facilities shall be planned and provided as wayside amenities for users of the Expressways to enable them to stop, take rest and refresh themselves so as to ease their fatigue. These Areas also cover facilities for providing fuel for vehicle and emergency requirements without having to exit from the expressway. Thus, Provision of service area and their operation and maintenance are to be an integral part of the project Expressway for comfortable and safe driving.
8.2 Service Area
Service area shall be provided for facilities of Expressway Users. The service areas may be planned at approximately 50 km interval. Subjective opinion of the drivers regarding necessity of Parking Lot is gathered. It consists of deceleration and acceleration lane of length 85.0m with central parking area of 250.0 m length and 7.0 m wide, with 1.0m wide raised kerb island separating carriageway & Lay bye. Sufficient working area and space for roadside establishments such as repair shops, vulcanising shops, service centre, spare parts shops, and telephone booth and light refreshments with first aid facilities is provided. The Tentative locations of the truck lay byes are presented in Table 8-1.
Table 8-1: Proposed Service Area locations
Sl. No.
Design Chainage
Side Location
1 25+800 LHS Seettacherry
2 27+600 RHS Seethapuram
3 74+200 LHS Kovilur
4 75+000 RHS Kovilur
5 121+200 LHS Thenpallipattu
6 122+900 RHS Nellimedu
7 174+400 LHS Naradapattu
8 175+400 RHS Naradapattu
9 54+200 LHS Alamelupuram
10 53+600 RHS Alamelupuram
The Service areas will have the following provisions:
Restaurant / Cafeteria
Dormitory with toilet facilities
Shopping Kiosks / ATM facility

Consultancy services for Preparation of Detailed Project Report of Economic Corridors, Inter Corridors, Feeder routes and National Corridors under Bharatmala Pariyojana (Lot-6/Package -1)
Feasibility Report Volume I (Main Report)
Project Facilities
Feedback Infra Pvt. Ltd. 8-2 National Highways Authority of India
Fuel station with air and water
Tourist / Information centre
Emergency First Aid
Repair / Maintenance facility
Parking provisions for trucks and cars
Police outpost
8.3 Laybyes
In addition to the regular service areas, Only toilet facilities are also to be provided. Their Locations may be approximately half way between the service areas. These toilet facilities may be on short laybyes off the expressway shoulders but with proper deceleration and acceleration lanes. The laybyes tentatively proposed; details are given in
Table 8-2.
Table 8-2: Proposed Laybyes locations
Sl.no Ds.Chainage Side Location
1 48+900 LHS Vengaram
2 49+500 RHS Vengaram
3 99+600 LHS Kolakkaravady
4 100+600 RHS Kolakkaravady
5 148+400 LHS Thorapadi
6 149+500 RHS Thorapadi
7 200+000 LHS Sanipoondi
8 199+100 RHS Sanipoondi
9 26+800 LHS Kattur
10 25+800 RHS Kattur
8.4 Toll Plazas
The locations of the toll plazas are given below in Table 8-3.
Table 8-3: Toll Plaza locations
S.No Design
Chainage Location Remarks
1 7+500 Near Neelamangalam
2 55+800 Near manampathi
3 94+505 Chetpet Spur At Double Trumpet Interchange
4 122+670 Tiruvannamalai Spur At Trumpet Interchange
5 152+000 Near Chengam
6 56+675 Near Harur At Trumpet Interchange
7 34+200 Near Velampatti R.F
8 8+800 Near Dasanaikenpatty (Near Jerugumalai R.F)

Consultancy services for Preparation of Detailed Project Report of Economic Corridors, Inter Corridors, Feeder routes and National Corridors under Bharatmala Pariyojana (Lot-6/Package -1)
Feasibility Report Volume I (Main Report)
Project Facilities
Feedback Infra Pvt. Ltd. 8-3 National Highways Authority of India
8.5 Road Markings
Road markings perform the important function of guiding and controlling traffic on a highway. The markings serve as psychological barriers and signify the delineation of traffic paths and their lateral clearance from traffic hazards for safe movement of traffic. Road markings are therefore essential to ensure smooth and orderly flow of traffic and to promote road safety. The Code of Practice for Road Markings, IRC: 35 – 2015 has been used in the study as the design basis.
The road markings were carefully planned on carriageways, intersections, toll plazas and bridge locations.
8.6 Road Signs
Cautionary, mandatory and informatory signs have been provided depending on the situation and function they perform in accordance with the IRC: 67 – 2012 guidelines for road signs.
8.7 Kilometre Stones
The details of kilometre stones are in accordance with IRC: 8 – 1980 and MOSRT&H circular guidelines. Both regular and zero/fifth kilometre stones are to be provided on both sides of the road i.e., independently for each direction of travel. The stones shall be fixed at right angles to the centre line of the carriageway.
8.8 200 m Stones and Boundary Stones
The details of 200 m (hectometre) stones and boundary stones conform to IRC: 26 – 1967 and IRC: 25 – 1967, respectively. 200 m stones are located on both the sides of the road as the kilometre stones. The inscription on the stones shall be the numerals 2, 4, 6 and 8 marked in an ascending order in the direction of increasing chainage, away from the starting station. Boundary stones shall be located on either side of the road opposite every 200 m stone and kilometre stone. In addition these shall be fixed at all angular points of the boundary. Where the boundary is on a curve or the land is of significant value and likely to be encroached upon, the boundary stones shall be installed at closer intervals, as required.
8.9 Delineators and Object Markers
Roadway delineators are intended to mark the edges of the roadway so as to guide drivers on the alignment ahead. Object markers are used to indicate hazards and obstructions within vehicle flow path, for example, channelising islands close to the intersections.
Delineators and object markers are provided as per the details given in the drawings and are provided in accordance with the provisions of IRC: 79 – 1989. Delineators are provided for all curves of radius less than 600 m. They are not provided at locations where Chevron signboards are provided.
8.10 Guard Post
Guard posts are proposed on embankments of height more than 1.0 m, bridge approaches and horizontal curves of radius greater than 170 m. The spacing of guard post shall be 2.0m c/c in these areas. Typical Guard post consists of precast (M20) post of size 200mm x 200mm and a height of 600 mm above ground level. They are encased in M15 cement concrete for a depth of 450 mm below ground level. Guard posts are painted with alternate black and white reflective paint of 150 mm wide bands.
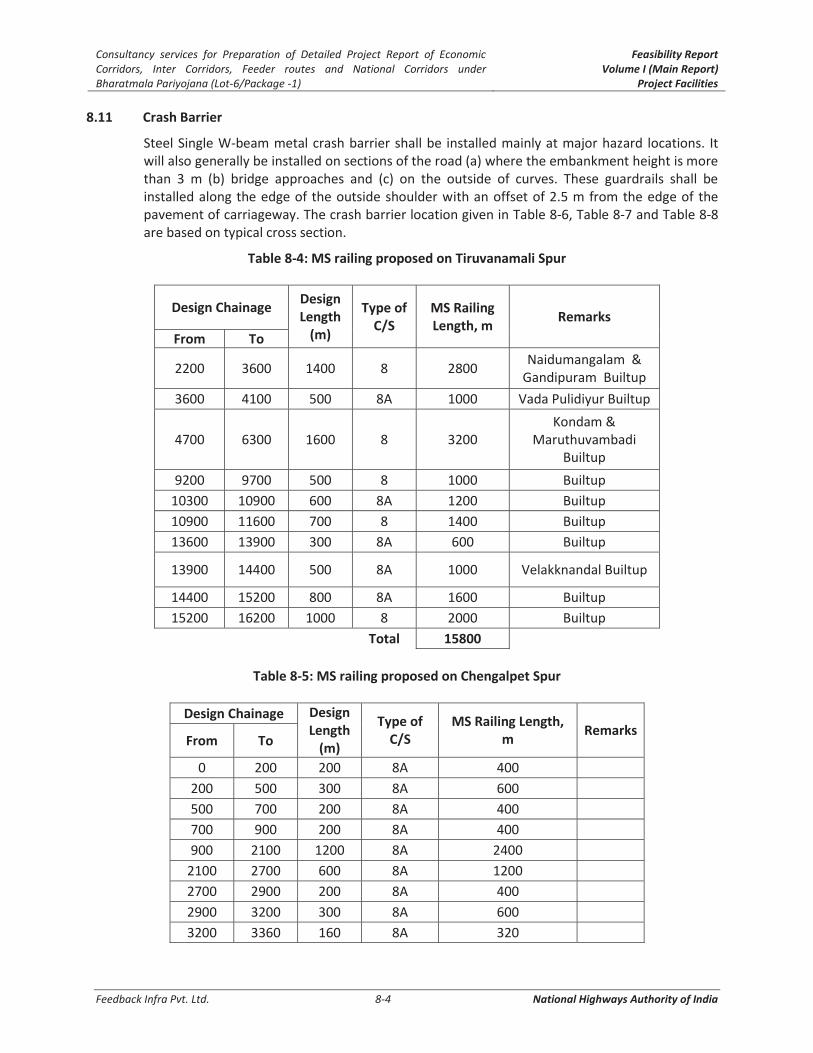
Consultancy services for Preparation of Detailed Project Report of Economic Corridors, Inter Corridors, Feeder routes and National Corridors under Bharatmala Pariyojana (Lot-6/Package -1)
Feasibility Report Volume I (Main Report)
Project Facilities
Feedback Infra Pvt. Ltd. 8-4 National Highways Authority of India
8.11 Crash Barrier
Steel Single W-beam metal crash barrier shall be installed mainly at major hazard locations. It will also generally be installed on sections of the road (a) where the embankment height is more than 3 m (b) bridge approaches and (c) on the outside of curves. These guardrails shall be installed along the edge of the outside shoulder with an offset of 2.5 m from the edge of the pavement of carriageway. The crash barrier location given in Table 8-6, Table 8-7 and Table 8-8 are based on typical cross section.
Table 8-4: MS railing proposed on Tiruvanamali Spur
Design Chainage Design Length
(m)
Type of C/S
MS Railing Length, m
Remarks
From To
2200 3600 1400 8 2800 Naidumangalam &
Gandipuram Builtup
3600 4100 500 8A 1000 Vada Pulidiyur Builtup
4700 6300 1600 8 3200 Kondam &
Maruthuvambadi Builtup
9200 9700 500 8 1000 Builtup
10300 10900 600 8A 1200 Builtup
10900 11600 700 8 1400 Builtup
13600 13900 300 8A 600 Builtup
13900 14400 500 8A 1000 Velakknandal Builtup
14400 15200 800 8A 1600 Builtup
15200 16200 1000 8 2000 Builtup
Total 15800
Table 8-5: MS railing proposed on Chengalpet Spur
Design Chainage Design Length
(m)
Type of C/S
MS Railing Length, m
Remarks From To
0 200 200 8A 400
200 500 300 8A 600
500 700 200 8A 400
700 900 200 8A 400
900 2100 1200 8A 2400
2100 2700 600 8A 1200
2700 2900 200 8A 400
2900 3200 300 8A 600
3200 3360 160 8A 320

Consultancy services for Preparation of Detailed Project Report of Economic Corridors, Inter Corridors, Feeder routes and National Corridors under Bharatmala Pariyojana (Lot-6/Package -1)
Feasibility Report Volume I (Main Report)
Project Facilities
Feedback Infra Pvt. Ltd. 8-5 National Highways Authority of India
Design Chainage Design Length
(m)
Type of C/S
MS Railing Length, m
Remarks From To
3360 3560 200 8A 400
3560 3700 140 8A 280
3700 3920 220 8A 440
3920 4100 180 8A 360
4100 5000 900 8 1800
5000 5200 200 8A 400
5200 5300 100 8A 200
5300 5400 100 8A 200
5400 5700 300 8A 600
5700 7100 1400 8 2800
7100 7600 500 8A 1000
7600 7900 300 8 600
7900 8080 180 8A 360
8080 8700 620 8A 1240
8700 11100 2400 8 4800
11100 11420 320 8A 640
11420 11900 480 8A 960
11900 12150 250 8A 500
12150 15900 3750 8 7500
18700 22900 4200 8A 8400
22900 23300 400 8A 800
23300 24100 800 8 1600
24100 25500 1400 8A 2800
25500 29635 4135 8 8270
Total 53670
Table 8-6: Proposed location of Metal Beam Crash Barrier on Tiruvanamalai Spur
Design Chainage
Design Length
(m)
Type of C/S
MS Railing Length, m
Remarks From To
2200 3600 1400 8 5600 Naidumangalam &
Gandipuram Builtup
3600 4100 500 8A 2000 Vada Pulidiyur
Builtup

Consultancy services for Preparation of Detailed Project Report of Economic Corridors, Inter Corridors, Feeder routes and National Corridors under Bharatmala Pariyojana (Lot-6/Package -1)
Feasibility Report Volume I (Main Report)
Project Facilities
Feedback Infra Pvt. Ltd. 8-6 National Highways Authority of India
Design Chainage
Design Length
(m)
Type of C/S
MS Railing Length, m
Remarks From To
4700 6300 1600 8 6400 Kondam &
Maruthuvambadi Builtup
9200 9700 500 8 2000 Builtup
10300 10900 600 8A 2400 Builtup
10900 11600 700 8 2800 Builtup
13600 13900 300 8A 1200 Builtup
13900 14400 500 8A 2000 Velakknandal
Builtup
14400 15200 800 8A 3200 Builtup
15200 16200 1000 8 4000 Builtup
Total 31600
Table 8-7: Proposed location of Metal Beam Crash Barrier on Chengalpet Spur
Design Chainage Design Length
(m)
Type of C/S
MS Railing Length, m
Remarks From To
200 500 300 8A 1200
500 700 200 8A 800
700 900 200 8A 800
900 2100 1200 8A 4800
2100 2700 600 8A 2400
2700 2900 200 8A 800
2900 3200 300 8A 1200
3200 3360 160 8A 640
3360 3560 200 8A 800
3560 3700 140 8A 560
3700 3920 220 8A 880
3920 4100 180 8A 720
4100 5000 900 8 3600
5000 5200 200 8A 800
5200 5300 100 8A 400
5300 5400 100 8A 400
5400 5700 300 8A 1200
5700 7100 1400 8 5600
7100 7600 500 8A 2000
7600 7900 300 8 1200
7900 8080 180 8A 720

Consultancy services for Preparation of Detailed Project Report of Economic Corridors, Inter Corridors, Feeder routes and National Corridors under Bharatmala Pariyojana (Lot-6/Package -1)
Feasibility Report Volume I (Main Report)
Project Facilities
Feedback Infra Pvt. Ltd. 8-7 National Highways Authority of India
Design Chainage Design Length
(m)
Type of C/S
MS Railing Length, m
Remarks From To
8080 8700 620 8A 2480
8700 11100 2400 8 9600
11100 11420 320 8A 1280
11420 11900 480 8A 1920
11900 12150 250 8A 1000
12150 15900 3750 8 15000
18700 22900 4200 8A 16800
22900 23300 400 8A 1600
23300 24100 800 8 3200
24100 25500 1400 8A 5600
25500 29635 4135 8 16540
Total 106540
Table 8-8: Proposed location of Metal Beam Crash Barrier on Chennai Salem Alignment
Design Chainage Design Length
(m)
Type of C/S
MS Railing Length, m
Remarks From To
2+700 6+110 3410 1 6820 10+000 10+890 890 1 1780 11+790 13+020 1230 1 2460 13+920 14+960 1040 1 2080 25+200 25+600 400 1 800 25+600 25+820 220 4 440 26+720 27+640 920 4 1840 28+540 30+360 1820 4 3640 31+260 34+065 2805 4 5610 34+965 37+845 2880 4 5760 38+545 43+210 4665 4 9330 44+210 47+000 2790 4 5580 47+000 47+600 600 5 1200 48+300 53+190 4890 4 9780 53+890 56+300 2410 4 4820 56+300 56+555 255 5 510 57+455 59+610 2155 4 4310 60+610 62+270 1660 4 3320 62+970 65+570 2600 4 5200 66+270 66+895 625 4 1250 67+895 71+700 3805 4 7610
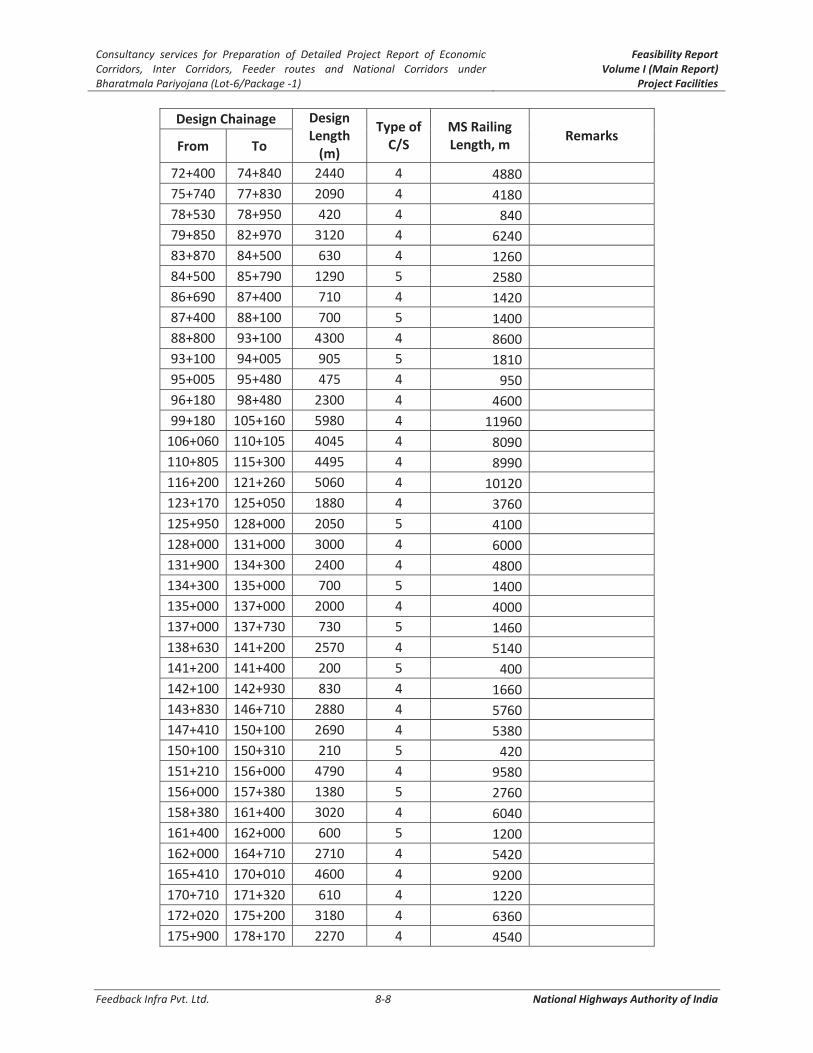
Consultancy services for Preparation of Detailed Project Report of Economic Corridors, Inter Corridors, Feeder routes and National Corridors under Bharatmala Pariyojana (Lot-6/Package -1)
Feasibility Report Volume I (Main Report)
Project Facilities
Feedback Infra Pvt. Ltd. 8-8 National Highways Authority of India
Design Chainage Design Length
(m)
Type of C/S
MS Railing Length, m
Remarks From To
72+400 74+840 2440 4 4880 75+740 77+830 2090 4 4180 78+530 78+950 420 4 840 79+850 82+970 3120 4 6240 83+870 84+500 630 4 1260 84+500 85+790 1290 5 2580 86+690 87+400 710 4 1420 87+400 88+100 700 5 1400 88+800 93+100 4300 4 8600 93+100 94+005 905 5 1810 95+005 95+480 475 4 950 96+180 98+480 2300 4 4600 99+180 105+160 5980 4 11960
106+060 110+105 4045 4 8090 110+805 115+300 4495 4 8990 116+200 121+260 5060 4 10120 123+170 125+050 1880 4 3760 125+950 128+000 2050 5 4100 128+000 131+000 3000 4 6000 131+900 134+300 2400 4 4800 134+300 135+000 700 5 1400 135+000 137+000 2000 4 4000 137+000 137+730 730 5 1460 138+630 141+200 2570 4 5140 141+200 141+400 200 5 400 142+100 142+930 830 4 1660 143+830 146+710 2880 4 5760 147+410 150+100 2690 4 5380 150+100 150+310 210 5 420 151+210 156+000 4790 4 9580 156+000 157+380 1380 5 2760 158+380 161+400 3020 4 6040 161+400 162+000 600 5 1200 162+000 164+710 2710 4 5420 165+410 170+010 4600 4 9200 170+710 171+320 610 4 1220 172+020 175+200 3180 4 6360 175+900 178+170 2270 4 4540

Consultancy services for Preparation of Detailed Project Report of Economic Corridors, Inter Corridors, Feeder routes and National Corridors under Bharatmala Pariyojana (Lot-6/Package -1)
Feasibility Report Volume I (Main Report)
Project Facilities
Feedback Infra Pvt. Ltd. 8-9 National Highways Authority of India
Design Chainage Design Length
(m)
Type of C/S
MS Railing Length, m
Remarks From To
178+870 182+830 3960 4 7920 184+280 185+200 920 5 1840 185+200 186+300 1100 4 2200 186+300 186+700 400 5 800 186+700 190+330 3630 4 7260 191+030 191+700 670 4 1340 192+700 192+910 210 4 420 193+610 195+810 2200 4 4400 196+710 199+765 3055 4 6110 200+465 200+930 465 4 930 201+830 202+500 670 5 1340 202+500 204+970 2470 4 4940 205+870 211+200 5330 4 10660 211+900 212+710 810 4 1620 213+410 216+750 3340 5 6680 217+450 219+080 1630 5 3260 56+175 53+300 2875 5 5750 53+300 50+400 2900 4 5800 50+400 49+740 660 5 1320 48+740 46+900 1840 5 3680 45+900 43+630 2270 5 4540 42+930 41+000 1930 5 3860 40+000 32+300 7700 5 15400 31+300 29+630 1670 4 3340 28+930 24+900 4030 4 8060 24+900 24+170 730 5 1460 22+250 22+090 160 5 320 18+130 15+950 2180 1 4360 15+250 13+580 1670 1 3340 12+880 12+200 680 1 1360 11+500 9+600 1900 1 3800
Total 380770

Consultancy Services for preparation of DPR for development of Economic Corridors, Inter Corridors, Feeder Routes and National corridors (GQ and NS-EW Corridors) to improve the efficiency of freight movement in India under Bharatmala Pariyojana (Chennai-Salem Highway)
Feasibility Report Volume – I (Main Report)
Cost Estimate
Feedback Infra Pvt. Ltd. 9-1 National Highways Authority of India
9. COST ESTIMATE
9.1 INTRODUCTION AND ASSUMPTIONS
Cost estimation is important for the feasibility study as it provides vital input to the economic and financial evaluation of the project. The cost estimates have been prepared for the Project road considering the recommended alignment. The estimate has been prepared for the proposed Greenfield alignment considering Dual Four lane carriageway and Dual two lane carriageway for Spur alignments including strengthening / widening/reconstruction of existing structures, new bridges on the proposed realignments etc.
9.2 ADOPTION OF UNIT RATES
The Unit rates of all items of construction work have been analysed as per the guidelines
given in Standard Data Book of MORT&H. The basic rates of materials are obtained from the
latest edition of Tamilnadu Standard Schedule of Rates (SSR). Market rates are adopted for
items for which the rates are not available in SSR. The location of material quarries like
gravel, sand, crushed aggregate are obtained from the material investigations. The leads of
different materials are obtained by drawing the lead chart. In respect of hourly hire and
operating cost of various road construction machinery and equipment, rates given in
MORT&H Standard Data Book and SSR are considered. For machinery and equipment not
covered by these two, the prevailing market rates are considered. The labour rates are taken
from Tamilnadu SOR. Unit rates so arrived have been compared with reference to the rates
of similar items in the ongoing projects under NHAI and are found comparable.
9.3 BILL OF QUANTITIES FOR CIVIL WORKS
The bill of quantities for civil works has been prepared on the basis of preliminary design
9.4 COSTING FOR SAFETY DEVICES Adequate numbers of road signage and pavement markings have been considered as a safety measures while making costing for road safety to give proper information to the road users to avoid accident on the project road
9.5 LAND ACQUISITION COST Total land required for the improvement of the project corridor is 2791 hectares. The land acquisition cost along with R & R cost is mentioned further in the given table.
9.6 COST OF R & R
A tentative estimate of cost for Rehabilitation & Resettlement has been worked out to Rs. 415.1385 Crores, which covers all components of compensation, assistance and entitlements. The broad break up of R & R budget is given below Table 9-1;

Consultancy Services for preparation of DPR for development of Economic Corridors, Inter Corridors, Feeder Routes and National corridors (GQ and NS-EW Corridors) to improve the efficiency of freight movement in India under Bharatmala Pariyojana (Chennai-Salem Highway)
Feasibility Report Volume – I (Main Report)
Cost Estimate
Feedback Infra Pvt. Ltd. 9-2 National Highways Authority of India
Table 9-1: ESTIMATED BUDGET FOR R&R ACTIVITIES.
Sl.
No Particulars Amount (Rs.)
A Compensation for Land Acquisition
1 #Compensation for Structure/Agriculture/barren land 2791 hectars ( See
table 8.19 & 8.20) 2582,00,00,000
2 Value of the 1141 structures x200000 22,82,00,000
3 Value of Wooden/Koisks @25000x104 26,00,000
Total 2605,08,00,000
B R&R Entitlements
4 Subsistence Allowance Rs3000x12 months=36000 x1141structures 4,10,76,000
5 Subsistence Allowance Rs3000x12 months=36000 x104 Squatters 37,44,000
Total 4,48,20,000
C Religious
9 Temples/Samadhis/Mazars 30x2,00,000 60,00,000
Total 60,00,000
D Others Services
10 N.G.O Service Charges 25,00,000
11 Administrative Cost 30,00,000
12 M & E consultant Lump sum 40,00,000
13 HIV/AIDS awareness 20,00,000
Total 1,15,00,000
A+B+C+D 2611,23,20,000
14 Contingency 15% 391,68,48,000
15 Grand Total 3002,91,68,000
Consultancy Services for preparation of DPR for development of Economic Corridors, Inter Corridors, Feeder Routes and National corridors (GQ and NS-EW Corridors) to improve the efficiency of freight movement in India under Bharatmala Pariyojana (Chennai-Salem Highway)
Feasibility Report Volume – I (Main Report)
Cost Estimate
Feedback Infra Pvt. Ltd. 9-3 National Highways Authority of India
9.7 COST OF ENVIRONMENTAL MITIGATION PLAN
Environmental costs include the cost of cutting of trees (compensatory afforestation), rehabilitation of water source such as hand pumps, wells, bore wells and ponds, noise protection measures near sensitive locations, air, water and noise quality monitoring at different stages and the cost of environmental enhancement along the project road. Details are given in Chapter 10 of the report.
9.8 ANY OTHER ASSOCIATED COST
No other associated cost has been taken. Clause 11.9 reflects total project cost breakup of the project.
9.9 TOTAL COST ESTIMATES
There are four options based on the lane configuration have worked out as below Dual Three Lane Carriageway Option – 1: 6 Lane road & 8 Lane Structures with Flexible Pavement Option – 2: 6 Lane road & 8 Lane Structures with Rigid Pavement Dual Four Lane Carriageway Option – 3: 8 Lane road & 8 Lane Structures with Flexible Pavement Option – 4: 8 Lane road & 8 Lane Structures with Rigid Pavement The summary of project cost has been worked out for each option is given below:

Consultancy Services for preparation of DPR for development of Economic Corridors, Inter Corridors, Feeder Routes and National corridors (GQ and NS-EW Corridors) to improve the efficiency of freight movement in India under Bharatmala Pariyojana (Chennai-Salem Highway)
Feasibility Report Volume – I (Main Report)
Cost Estimate
Feedback Infra Pvt. Ltd. 9-4 National Highways Authority of India
Option – 1: 6 Lane road & 8 Lane Structures with Flexible Pavement

Consultancy Services for preparation of DPR for development of Economic Corridors, Inter Corridors, Feeder Routes and National corridors (GQ and NS-EW Corridors) to improve the efficiency of freight movement in India under Bharatmala Pariyojana (Chennai-Salem Highway)
Feasibility Report Volume – I (Main Report)
Cost Estimate
Feedback Infra Pvt. Ltd. 9-5 National Highways Authority of India
Option – 2: 6 Lane road & 8 Lane Structures with Rigid Pavement
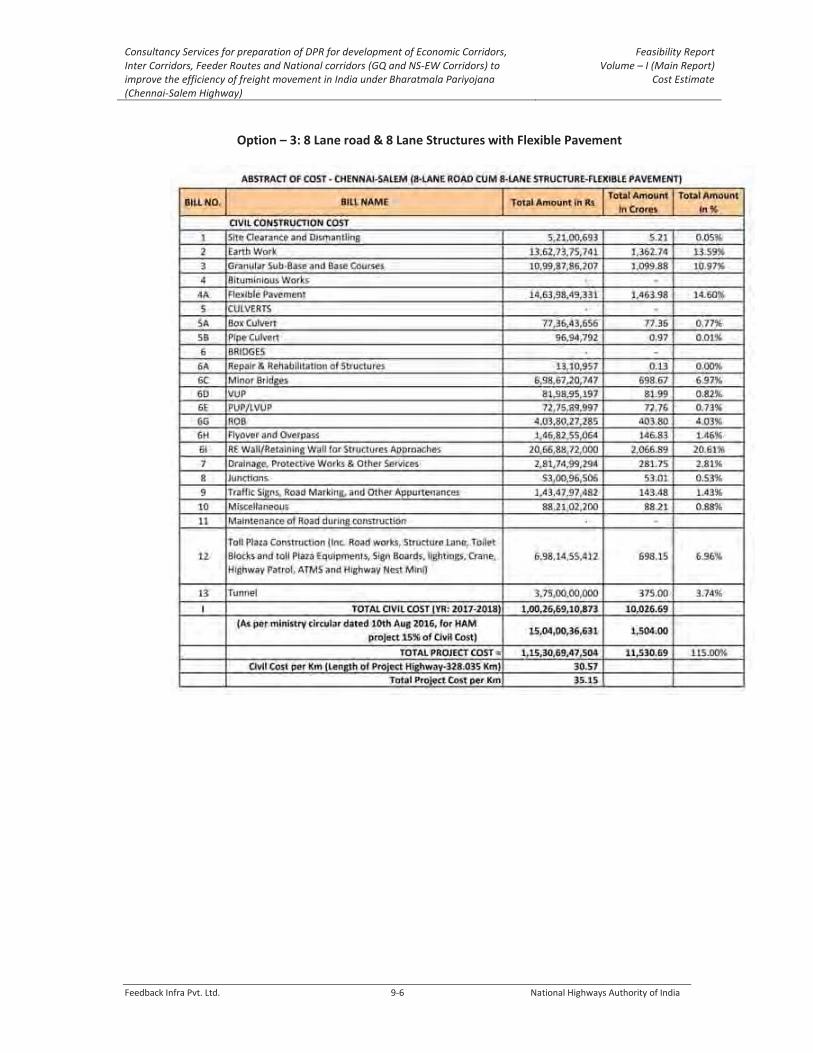
Consultancy Services for preparation of DPR for development of Economic Corridors, Inter Corridors, Feeder Routes and National corridors (GQ and NS-EW Corridors) to improve the efficiency of freight movement in India under Bharatmala Pariyojana (Chennai-Salem Highway)
Feasibility Report Volume – I (Main Report)
Cost Estimate
Feedback Infra Pvt. Ltd. 9-6 National Highways Authority of India
Option – 3: 8 Lane road & 8 Lane Structures with Flexible Pavement

Consultancy Services for preparation of DPR for development of Economic Corridors, Inter Corridors, Feeder Routes and National corridors (GQ and NS-EW Corridors) to improve the efficiency of freight movement in India under Bharatmala Pariyojana (Chennai-Salem Highway)
Feasibility Report Volume – I (Main Report)
Cost Estimate
Feedback Infra Pvt. Ltd. 9-7 National Highways Authority of India
Option – 4: 8 Lane road & 8 Lane Structures with Rigid Pavement
9.10 COMPARISON OF COST WITH SIMILAR PROJECTS IN THE REGION The consultant have studied the similar projects going on in the region and found the cost per km of the project corridor is almost same as that of worked out for this project.
Consultancy services for Preparation of Detailed Project Report of Economic Corridors, Inter Corridors, Feeder routes and National Corridors under Bharatmala Pariyojana (Lot-6/Package -1)
Feasibility Report Volume I (Main Report)
Environmental Screening and Preliminary Environmental Assessment
Feedback Infra Pvt. Ltd. 10-1 National Highways Authority of India
10. ENVIRONMENTAL SCREENING AND PRELIMINARY ENVIRONMENTAL ASSESSMENT
10.1 INTRODUCTION
Road projects are meant for improving the quality of life of people and developing the country’s economy. Along with all positive impacts of the road projects, there may also be some significant detrimental impact on nearby communities and environment. To account for adverse impacts, environmental impact assessment is utmost necessary. These concerns for environmental issue in road projects have also become a part of legal requirements and requirements for obtaining financial support. Environmental assessment is therefore, of prime importance in road projects. Findings and outcome of the prelim environmental assessment are presented in this chapter. Further detailing will be taken up during subsequent stages of the project. This chapter is mainly based on secondary data and prelim field survey.
10.2 STUDY AREA Study area for the prelim assessment is limited for 500m on either side of the proposed alignment. However, eco-sensitive zones have been identified upto the distance of 15km from the proposed alignment. Proposed highway alignment starts from Chennai Outer Ring Road in Kancheepuram District and Ends at out skirt of Ayodhiyapatinam in Salem District after passing through the Truvannamalai, Krishnagiri and Dharmapuri districts.
10.3 SCOPE OF PRELIMINARY ENVIRONMENTAL ASSESSMENT
Preliminary EIA study has been carried out to identify critical issues and areas that would be studied in detailed during EIA study. Further details will be taken up during subsequent stages of the project preparation, if required. In this stage, existing environmental set-up of the study corridor in particular were studied and is described in subsequent sections. The entire study was carried out within existing policy, legal and administrative framework considering the applicable environmental legislation, regulations and guidelines. The present covers the following:
Project Screening in reference to Legal Framework
Brief Baseline Environment Profile of the study area
Probable Environment Impact Assessment
Tentative Management Plan
10.4 METHODOLOGY
Environmental Impact Assessment is a detailed process, which starts from the conception of the project and continues till the operation phases. The steps for environmental impact assessment are varies at different phases. This report deals with preliminary environmental assessment for the feasibility assessment of the proposed improvement proposal.

Consultancy services for Preparation of Detailed Project Report of Economic Corridors, Inter Corridors, Feeder routes and National Corridors under Bharatmala Pariyojana (Lot-6/Package -1)
Feasibility Report Volume I (Main Report)
Environmental Screening and Preliminary Environmental Assessment
Feedback Infra Pvt. Ltd. 10-2 National Highways Authority of India
Following activities were mainly undertaken during the prelim environment assessment.
Study of Background information
Study of Project Documents
Study of Laws and regulations: Laws and regulations enacted by Government of India and Tamilnadu State relevant to road construction and environment were studied.
Study of Guidelines, Standards etc.: Various documents and publications of the Ministry of Environment, Forest and Climate Chanage (MoEF&CC) and Indian Road Congress (IRC) were studied.
10.5 ONSITE STUDY
Some of the important environment components as studied during present scope of chapter or will be studied during Environment Impact Assessment Study are discussed in table below.
Table 10-1: Important Environment Components
S. No. Environmental Attributes Environmental Components
1 Topography Terrain
2 Land use Agriculture, settlements, forest, industrial areas etc.
3 Surface Water resources Rivers, canals, ponds, etc.
4 Forests & Wild Life
Designated Protected Areas like Biosphere Reserves, National Parks and Wildlife Sanctuaries etc.) within 15 Km from the project road Presence of RF, PF other forests in proposed highway alignment Bio-diversity assessment of the area
5 Road side Plantations Plantation in RoW, Green Tunnel, etc.
6 Settlements Towns and villages along side of the proposed alignment Details of affected structures
7 Sensitive Receptors Sensitive receptors such as educational and health facilities etc.
8 Drinking water sources Wells, hand pumps, community water points / taps etc.
10 Religious Structures Temples, shrines, mosque, church, gurudwara etc.
11 Cultural Properties Protected / unprotected archaeological monuments
12 Common Property Resources
Community areas, cremation / burial grounds etc.
14 Environment Conditions
Ambient Air Quality Ambient Noise Level Ground and Surface Water Quality Soil Characteristics
10.6 LEGISLATIVE FRAMEWORK
The Government of India has formulated various policy guidelines; acts and regulations aimed at protection and enhancement of environmental resources. The summary of environment laws and their applicability analysis pertaining to proposed development project are discussed in Table below.
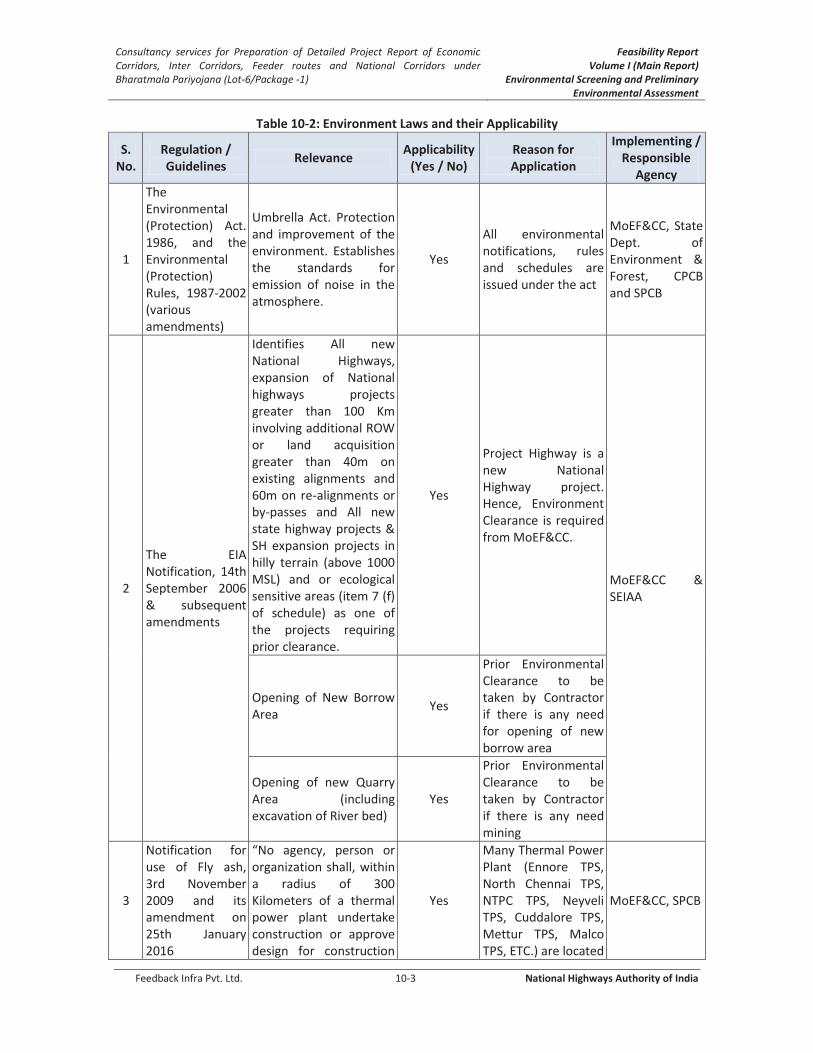
Consultancy services for Preparation of Detailed Project Report of Economic Corridors, Inter Corridors, Feeder routes and National Corridors under Bharatmala Pariyojana (Lot-6/Package -1)
Feasibility Report Volume I (Main Report)
Environmental Screening and Preliminary Environmental Assessment
Feedback Infra Pvt. Ltd. 10-3 National Highways Authority of India
Table 10-2: Environment Laws and their Applicability
S. No.
Regulation / Guidelines
Relevance Applicability
(Yes / No) Reason for Application
Implementing / Responsible
Agency
1
The Environmental (Protection) Act. 1986, and the Environmental (Protection) Rules, 1987-2002 (various amendments)
Umbrella Act. Protection and improvement of the environment. Establishes the standards for emission of noise in the atmosphere.
Yes
All environmental notifications, rules and schedules are issued under the act
MoEF&CC, State Dept. of Environment & Forest, CPCB and SPCB
2
The EIA Notification, 14th September 2006 & subsequent amendments
Identifies All new National Highways, expansion of National highways projects greater than 100 Km involving additional ROW or land acquisition greater than 40m on existing alignments and 60m on re-alignments or by-passes and All new state highway projects & SH expansion projects in hilly terrain (above 1000 MSL) and or ecological sensitive areas (item 7 (f) of schedule) as one of the projects requiring prior clearance.
Yes
Project Highway is a new National Highway project. Hence, Environment Clearance is required from MoEF&CC.
MoEF&CC & SEIAA
Opening of New Borrow Area
Yes
Prior Environmental Clearance to be taken by Contractor if there is any need for opening of new borrow area
Opening of new Quarry Area (including excavation of River bed)
Yes
Prior Environmental Clearance to be taken by Contractor if there is any need mining
3
Notification for use of Fly ash, 3rd November 2009 and its amendment on 25th January 2016
“No agency, person or organization shall, within a radius of 300 Kilometers of a thermal power plant undertake construction or approve design for construction
Yes
Many Thermal Power Plant (Ennore TPS, North Chennai TPS, NTPC TPS, Neyveli TPS, Cuddalore TPS, Mettur TPS, Malco TPS, ETC.) are located
MoEF&CC, SPCB
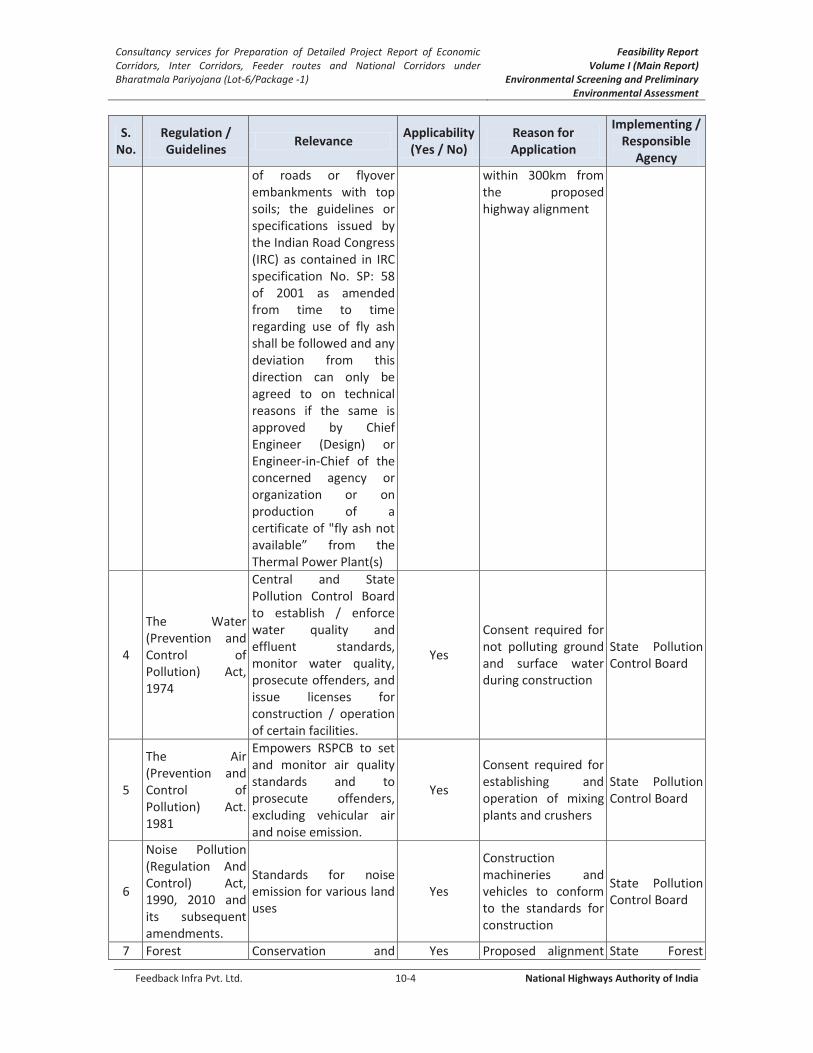
Consultancy services for Preparation of Detailed Project Report of Economic Corridors, Inter Corridors, Feeder routes and National Corridors under Bharatmala Pariyojana (Lot-6/Package -1)
Feasibility Report Volume I (Main Report)
Environmental Screening and Preliminary Environmental Assessment
Feedback Infra Pvt. Ltd. 10-4 National Highways Authority of India
S. No.
Regulation / Guidelines
Relevance Applicability
(Yes / No) Reason for Application
Implementing / Responsible
Agency
of roads or flyover embankments with top soils; the guidelines or specifications issued by the Indian Road Congress (IRC) as contained in IRC specification No. SP: 58 of 2001 as amended from time to time regarding use of fly ash shall be followed and any deviation from this direction can only be agreed to on technical reasons if the same is approved by Chief Engineer (Design) or Engineer-in-Chief of the concerned agency or organization or on production of a certificate of "fly ash not available” from the Thermal Power Plant(s)
within 300km from the proposed highway alignment
4
The Water (Prevention and Control of Pollution) Act, 1974
Central and State Pollution Control Board to establish / enforce water quality and effluent standards, monitor water quality, prosecute offenders, and issue licenses for construction / operation of certain facilities.
Yes
Consent required for not polluting ground and surface water during construction
State Pollution Control Board
5
The Air (Prevention and Control of Pollution) Act. 1981
Empowers RSPCB to set and monitor air quality standards and to prosecute offenders, excluding vehicular air and noise emission.
Yes
Consent required for establishing and operation of mixing plants and crushers
State Pollution Control Board
6
Noise Pollution (Regulation And Control) Act, 1990, 2010 and its subsequent amendments.
Standards for noise emission for various land uses
Yes
Construction machineries and vehicles to conform to the standards for construction
State Pollution Control Board
7 Forest Conservation and Yes Proposed alignment State Forest

Consultancy services for Preparation of Detailed Project Report of Economic Corridors, Inter Corridors, Feeder routes and National Corridors under Bharatmala Pariyojana (Lot-6/Package -1)
Feasibility Report Volume I (Main Report)
Environmental Screening and Preliminary Environmental Assessment
Feedback Infra Pvt. Ltd. 10-5 National Highways Authority of India
S. No.
Regulation / Guidelines
Relevance Applicability
(Yes / No) Reason for Application
Implementing / Responsible
Agency
(Conservation) Act, 1980 its subsequent amendments.
definition of forest areas. Diversion of forest land follows the process as laid by the Forest conservation Act.
passes through Reserved Forests at many locations.
Department, MoEF&CC
8
Coastal Regulatory Zone Notification, 2011 its subsequent amendments.
Protect and manage coastal areas
No
Based on Draft CZMP maps of Tamilnadu, project highway is not falling in the CRZ area.
MoEF&CC, State Department of Environment
9
Wildlife Protection Act, 1972 its subsequent amendments.
Protection of wildlife in sanctuaries and National Park
No
No Wildlife Sanctuary / National Park is located within 10km from project alignment
NBWL, SBWL & Chief Wild Life Warden
10
Ancient Monuments and Archaeological sites & Remains Act 1958 its subsequent amendments.
To protect and conserve cultural and historical remains found.
No
No archaeological Monuments within 300m from the proposed alignment.
Archaeological Survey of India, State Dept. of Archaeology
11
The Motor Vehicle Act. 1988 its subsequent amendments.
Empowers State Transport Authority to enforce standards for vehicular pollution. From August 1997 the "Pollution Under Control Certificate” is issued to reduce vehicular emissions
Yes
All vehicles used for construction will need to comply with the provisions of this act.
State Motor Vehicles Department
12
The Explosives Act (& Rules) 1884 (1983) its subsequent amendments.
Sets out the regulations as to regards the use of explosives and precautionary measures while blasting & quarrying
Yes
Use of blasting materials if required for new quarrying operation and storing of Diesel / Petrol in the camp site, to be obtained by the contractor / Concessionaire
Chief Controller of Explosives
13 Public Liability And Insurance Act,1991
Protection to the general public from accidents due to hazardous materials
Yes
Hazardous materials like Bitumen shall be used for road construction
State Pollution Control Board
14 Hazardous and Other Wastes
Protection to the general public against improper
Yes Hazardous wastes shall be generated
State Pollution Control Board

Consultancy services for Preparation of Detailed Project Report of Economic Corridors, Inter Corridors, Feeder routes and National Corridors under Bharatmala Pariyojana (Lot-6/Package -1)
Feasibility Report Volume I (Main Report)
Environmental Screening and Preliminary Environmental Assessment
Feedback Infra Pvt. Ltd. 10-6 National Highways Authority of India
S. No.
Regulation / Guidelines
Relevance Applicability
(Yes / No) Reason for Application
Implementing / Responsible
Agency
(Management, & Transboundary Movement) Rules, 2016 and its subsequent amendments’
handling and disposal of hazardous wastes
due to activities like of maintenance and repair work on vehicles
15
Construction and Demolition Waste Management Rules, 2016 and Solid Waste Management Rules 2016
Safe disposal of construction waste and municipal solid waste
Yes
Construction waste shall be generated due to the demolition of existing structures & construction activities and municipal waste shall be generated from the construction worker camp
State pollution Control Board
16
Chemical Accidents (Emergency Planning, Preparedness and Response) Rules, 1996
Protection against chemical accident while handling any hazardous chemicals resulting
Yes
Handling of hazardous (flammable, toxic and explosive) chemicals during road construction
District & Local Crisis Group headed by the DM and SDM
17
Mines & Minerals (Regulation & Development) Act, 1957 as amended in 1972
Permission of Mining of aggregates and sand from river bed & aggregates
Yes
Mining of sand, soil or aggregates shall require permission from mining dept.
State Department of Mining
18
The Building & Other Construction Workers (Regulation of Employment & Conditions of Service) BOCW Act, 1996
Employing Labour / workers
Yes Employment of labours
District labour Commissioner
10.7 BASELINE ENVIRONMENT SCENARIO
10.7.1Project Districts
Proposed highway alignment starts from Chennai Outer Ring Road in Kancheepuram District and Ends at out skirt of Ayodhiyapatinam in Salem District after passing through the Truvannamalai, Krishnagiri and Dharmapuri districts.

Consultancy services for Preparation of Detailed Project Report of Economic Corridors, Inter Corridors, Feeder routes and National Corridors under Bharatmala Pariyojana (Lot-6/Package -1)
Feasibility Report Volume I (Main Report)
Environmental Screening and Preliminary Environmental Assessment
Feedback Infra Pvt. Ltd. 10-7 National Highways Authority of India
10.7.2Climate and Meteorology
Proposed alignment is the part of Tropical Savanna Climate (Wet and Dry Climate) as per Köppen climate classification system. Most of the region's annual rainfall is experienced during the wet season and very little precipitation falls during the dry season. Indian Meteorological Dept. is operating 6 nos. of observatories in near vicinity of proposed highway alignment. Details of IMD observatories along with their distance in respect to proposed alignment are given in table below.
Table 10-3: IMD observatories in vicinity of the proposed Highway Alignment
S. No. Name of Observatory Geographical Coordinate Distance from alignment (km)
1 Chennai (Minambakkam) (A) 13° 00'N, 80° 11'E 15 km
2 Chennai (Nungambakkam) 13° 04'N, 80° 15'E 26 km
3 Dharmapuri 12° 08'N, 78° 02'E 35 km
4 Salem 11° 39'N, 78° 10'E 12 km
5 Tiruppattur 12° 29'N, 78° 34'E 33 km
6 Tiruttani 13° 11'N, 79° 37'E 38 km
Considering very close proximity of Chennai (Minambakkam) (A) and Chennai (Nungambakkam) data of Chennai (Minambakkam) (A) observatory has been considered due to proximity with proposed highway. 30 years (1981-2010) long-term climatological data was collected for assessment of prevailing meteorological scenario of the project region. The details of long term climatological conditions are given in Table below.
Table 10-4: Long-term (1981-2000) Climatological Conditions at IMD Observatories
Month Temp Monthly (°C) Humidity (%) Average Wind Speed (kmph)
Dominant Direction
Avg. Rainfall (mm) Max Min Morning Evening
IMD Observatory- Chennai (Minambakkam) (A)
January 31.6 18.6 83 64 5.2 N, NE 31.5
February 34.1 19.1 81 62 6.3 E, SE 4.6
March 37.0 21.2 76 63 7.7 SE, S 4.8
April 39.4 23.6 72 67 9.3 S, SE 14.2
May 42.2 24.2 64 62 10.0 S, SE 52.9
June 40.6 23.8 60 57 10.2 S, SE 63.5
July 38.7 23.0 66 60 8.9 W, SW 107.8
August 37.4 23.0 71 63 8.5 W, SW 137.2
September 36.9 22.6 75 69 7.1 SW, W 145.8
October 35.5 22.2 81 74 5.4 E, W 298.1
November 32.8 20.2 83 75 5.1 N, NE 373
December 30.9 18.9 83 69 5.3 NE, N 166
42.6 18.0 74 65 7.4 S, SE 1399.3
IMD Observatory- Dharampuri
January 32.3 13.9 78 50 5.7 NE, E 5.0
February 35.5 14.7 71 39 5.3 NE, E 3.8
March 38.1 16.7 65 32 4.9 NE, E 22.5
April 39.4 20.4 65 38 4.8 SW, NE 44.2

Consultancy services for Preparation of Detailed Project Report of Economic Corridors, Inter Corridors, Feeder routes and National Corridors under Bharatmala Pariyojana (Lot-6/Package -1)
Feasibility Report Volume I (Main Report)
Environmental Screening and Preliminary Environmental Assessment
Feedback Infra Pvt. Ltd. 10-8 National Highways Authority of India
Month Temp Monthly (°C) Humidity (%) Average Wind Speed (kmph)
Dominant Direction
Avg. Rainfall (mm) Max Min Morning Evening
May 39.6 21.2 64 46 5.8 SW, W 96.7
June 37.4 21.6 65 51 7.9 SW, W 70.0
July 36.7 21.5 67 54 7.6 SW, W 75.6
August 35.8 21.1 69 55 7.2 SW, W 105.5
September 35.1 20.6 73 60 5.1 SW, W 170.5
October 33.3 19.2 78 68 4.2 NE, SW 181.5
November 31.6 16.0 79 67 4.7 NE, E 93.8
December 30.6 14.2 80 60 5.5 NE, E 41.5
40.1 12.9 71 52 5.7 SW, NE 910.4
IMD Observatory- Salem
January 34.6 16.3 74 45 4.3 NE, E 4.4
February 37.2 16.9 71 36 4.7 NE, E 3.4
March 39.3 18.9 67 33 4.5 NE, E 17.3
April 40.1 21.6 68 40 4.3 NE, SW 55.5
May 40.1 21.5 71 49 4.1 SW, NE 109.7
June 38.0 22.0 75 55 4.6 SW, S 72.4
July 37.2 21.5 78 57 4.3 SW, S 108.0
August 36.3 21.2 79 58 3.8 SW, S 140.6
September 36.1 21.0 79 61 2.9 SW, S 176.5
October 34.9 20.1 81 69 2.2 NE, SW 185.5
November 33.7 17.6 79 66 2.6 NE 110.2
December 33.2 16.4 76 56 3.5 NE, E 35.0
40.6 15.4 75 52 3.8 NE, SW 1018.5
IMD Observatory- Tiruppattur
January 33.7 14.0 82 60 2.6 NE 2.4
February 36.7 14.8 77 53 2.9 NE, E 1.8
March 39.2 17.3 71 48 3.1 NE, E 13.8
April 40.7 20.3 70 53 3.0 NE, E 41.7
May 40.8 21.8 70 57 2.9 NE 77.5
June 38.9 22.2 71 59 3.3 W 64.6
July 37.7 21.5 73 61 3.5 W 93.2
August 36.5 21.2 76 65 3.3 W 132.3
September 36.0 20.9 78 67 2.9 W 185.3
October 34.5 19.7 83 74 2.5 NE 152.2
November 32.6 16.4 83 73 2.4 NE 78.7
December 32.0 14.4 84 68 2.3 NE 33.8
41.3 13.2 77 62 2.9 NE 877.3
IMD Observatory- Tiruttani
January 33.0 14.3 79 59 2.9 NE, E 16.0
February 35.4 14.8 78 52 3.1 E, NE 15.6
March 38.8 16.9 74 45 3.6 SE, E 9.7
April 41.9 20.4 68 45 4.5 SE, SW 33.1
May 44.5 21.9 59 44 5.5 SW, W 56.7
June 42.4 22.2 60 49 7.2 SW, W 70.4
July 39.8 21.2 65 56 6.0 SW, W 114.2
August 38.3 21.2 68 58 5.5 SW, W 113.2

Consultancy services for Preparation of Detailed Project Report of Economic Corridors, Inter Corridors, Feeder routes and National Corridors under Bharatmala Pariyojana (Lot-6/Package -1)
Feasibility Report Volume I (Main Report)
Environmental Screening and Preliminary Environmental Assessment
Feedback Infra Pvt. Ltd. 10-9 National Highways Authority of India
Month Temp Monthly (°C) Humidity (%) Average Wind Speed (kmph)
Dominant Direction
Avg. Rainfall (mm) Max Min Morning Evening
September 37.3 21.0 72 64 3.3 SW, NW 222.0
October 35.8 19.5 77 70 2.3 NE, SW 157.4
November 33.5 16.9 79 74 2.4 NE, N 229.9
December 32.1 15.5 80 70 2.9 NE, E 98.8
44.6 13.6 72 57 4.1 SW, NE 1136.9
Review of above data presents that NE and SW are the predominant wind directions in the region. The average annual rainfall found in the range of 877.3mm at Tiruppattur Observatory to 1399.3mm at Chennai (Minambakkam) (A). Project region generally experiences hot and humid climatic conditions. The region receives the rain under the influence of both southeast and northeast monsoons.
10.7.3Terrain and Land use
The proposed road alignment follows mostly plain, partly rolling and partly mountainous terrain and some forest area as well. Elevation varies from about 24m above MSL to 520m above MSL. Proposed alignment mostly passes through the agricultural lands with patches of Forest and Hilly areas. Most of forest area as located along side the alignment is the part of Dharampuri and Tiruvannamalai District. Some settlement areas are also located in close vicinity of proposed alignment.
Table 10-5: Land use map of Project Region 10.7.4Seismicity
Proposed alignment falls under Seismic Zone II and III. Zone - II is most stable and Zone - V is considered to be least stable. The project corridor thus is in a zone of stability. Proposed

Consultancy services for Preparation of Detailed Project Report of Economic Corridors, Inter Corridors, Feeder routes and National Corridors under Bharatmala Pariyojana (Lot-6/Package -1)
Feasibility Report Volume I (Main Report)
Environmental Screening and Preliminary Environmental Assessment
Feedback Infra Pvt. Ltd. 10-10 National Highways Authority of India
highway will be located in Very High Damage Risk Zone (Vb = 50 m/s) as per Wind and Cyclone Hazard Classification of India.
10.7.5Geology and Soil Project region is underlain by Archaean Crystalline formations with recent alluvial deposits of limited areal and vertical extents along major rivers. Soil type along the proposed road varies from brown clayey soil to Alluvial soils (near river bank) to red insitu and lateritic soils.
10.7.6Ambient Air Quality
Monitoring of air quality shall establish the exact scenario and will also help to assess the potential impact of the project on them. To establish the baseline air quality scenario representative ambient air quality-monitoring stations shall be selected within the study corridor. Sampling and analysis of air samples shall be conducted by taking 24 hourly samples at each location as per guidelines of CPCB and the requirements of MoEF&CC. Ambient monitoring stations shall be proposed during application for proposed Terms of Reference for Environment Clearance.
10.7.7Noise
To understand the prevailing condition noise level along side of the proposed alignment shall be monitored by using suitable Noise Level Meter and shall be compared as per CPCB standard. Noise level is likely to increase due to movement of the vehicles in green field area. Day & night time Leq shall be computed from the hourly Leq values as per standards.
10.7.8Water Environment
10.7.8.1 Hydrogeology Project region is underlain by Archaean Crystalline formations with recent alluvial deposits of limited areal and vertical extents along major rivers. The important aquifer systems in the region are constituted by i) unconsolidated & semi-consolidated formations and (ii) weathered and fractured crystalline rocks.
10.7.9 Surface water / Ground Water Scenario
10.7.9.1 Surface Water
Proposed Greenfield alignment is crossing the rivers namely Palar River, Pennaiyar River, etc. Also there are many irrigation lakes/Tanks along the project corridor. The drainage pattern in general is sub-dendritic and radial. All the rivers are seasonal and carry substantial flows during monsoon period.
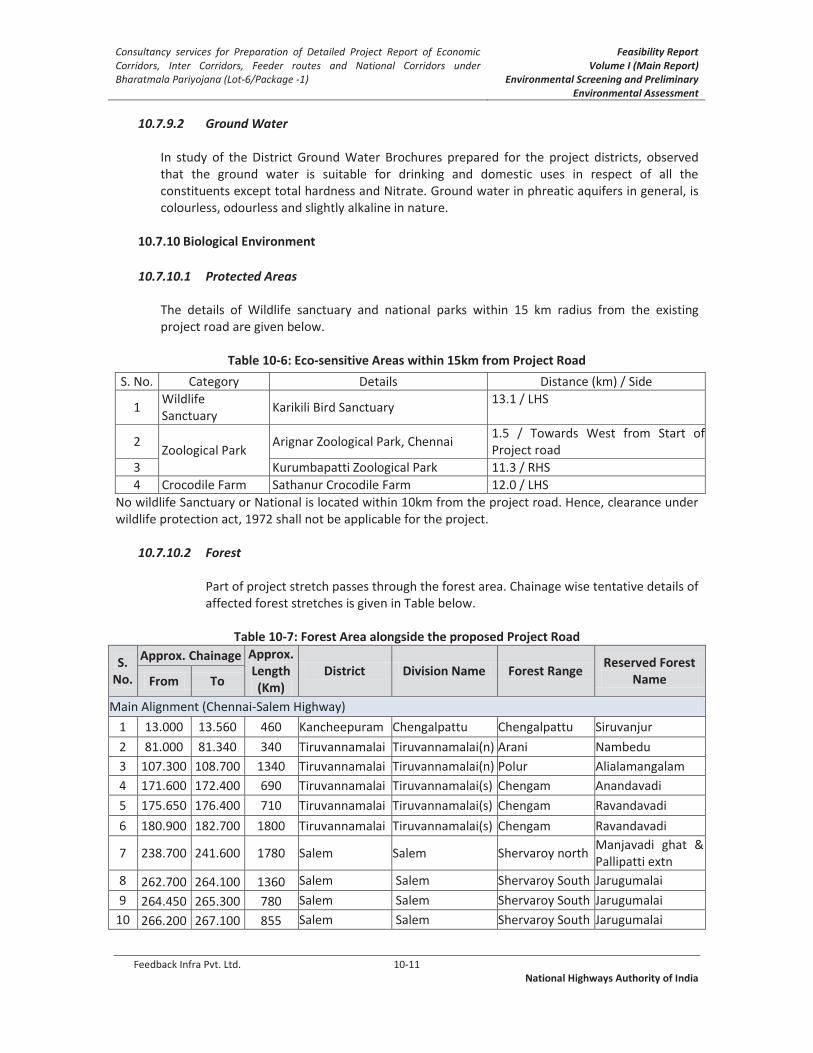
Consultancy services for Preparation of Detailed Project Report of Economic Corridors, Inter Corridors, Feeder routes and National Corridors under Bharatmala Pariyojana (Lot-6/Package -1)
Feasibility Report Volume I (Main Report)
Environmental Screening and Preliminary Environmental Assessment
Feedback Infra Pvt. Ltd. 10-11 National Highways Authority of India
10.7.9.2 Ground Water
In study of the District Ground Water Brochures prepared for the project districts, observed that the ground water is suitable for drinking and domestic uses in respect of all the constituents except total hardness and Nitrate. Ground water in phreatic aquifers in general, is colourless, odourless and slightly alkaline in nature.
10.7.10 Biological Environment
10.7.10.1 Protected Areas
The details of Wildlife sanctuary and national parks within 15 km radius from the existing project road are given below.
Table 10-6: Eco-sensitive Areas within 15km from Project Road
S. No. Category Details Distance (km) / Side
1 Wildlife Sanctuary
Karikili Bird Sanctuary 13.1 / LHS
2 Zoological Park
Arignar Zoological Park, Chennai 1.5 / Towards West from Start of Project road
3 Kurumbapatti Zoological Park 11.3 / RHS
4 Crocodile Farm Sathanur Crocodile Farm 12.0 / LHS
No wildlife Sanctuary or National is located within 10km from the project road. Hence, clearance under wildlife protection act, 1972 shall not be applicable for the project.
10.7.10.2 Forest
Part of project stretch passes through the forest area. Chainage wise tentative details of affected forest stretches is given in Table below.
Table 10-7: Forest Area alongside the proposed Project Road
S. No.
Approx. Chainage Approx. Length (Km)
District Division Name Forest Range Reserved Forest
Name From To
Main Alignment (Chennai-Salem Highway)
1 13.000 13.560 460 Kancheepuram Chengalpattu Chengalpattu Siruvanjur
2 81.000 81.340 340 Tiruvannamalai Tiruvannamalai(n) Arani Nambedu
3 107.300 108.700 1340 Tiruvannamalai Tiruvannamalai(n) Polur Alialamangalam
4 171.600 172.400 690 Tiruvannamalai Tiruvannamalai(s) Chengam Anandavadi
5 175.650 176.400 710 Tiruvannamalai Tiruvannamalai(s) Chengam Ravandavadi
6 180.900 182.700 1800 Tiruvannamalai Tiruvannamalai(s) Chengam Ravandavadi
7 238.700 241.600 1780 Salem Salem Shervaroy north Manjavadi ghat & Pallipatti extn
8 262.700 264.100 1360 Salem Salem Shervaroy South Jarugumalai
9 264.450 265.300 780 Salem Salem Shervaroy South Jarugumalai
10 266.200 267.100 855 Salem Salem Shervaroy South Jarugumalai
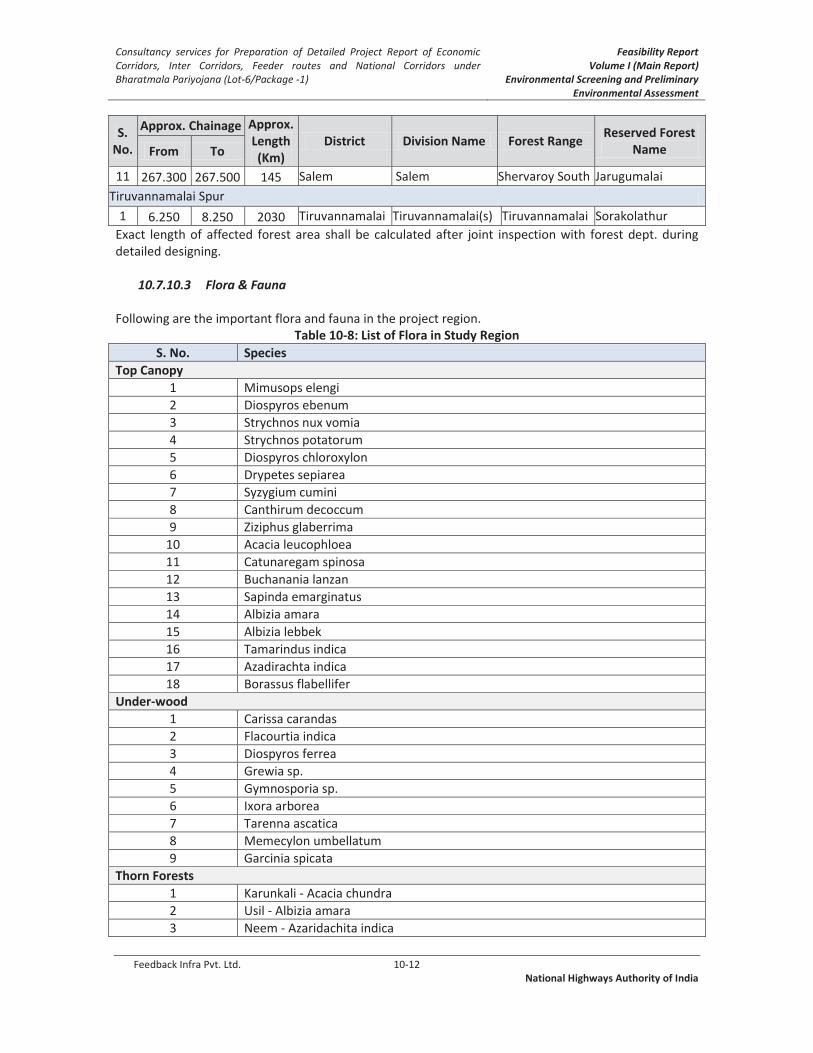
Consultancy services for Preparation of Detailed Project Report of Economic Corridors, Inter Corridors, Feeder routes and National Corridors under Bharatmala Pariyojana (Lot-6/Package -1)
Feasibility Report Volume I (Main Report)
Environmental Screening and Preliminary Environmental Assessment
Feedback Infra Pvt. Ltd. 10-12 National Highways Authority of India
S. No.
Approx. Chainage Approx. Length (Km)
District Division Name Forest Range Reserved Forest
Name From To
11 267.300 267.500 145 Salem Salem Shervaroy South Jarugumalai
Tiruvannamalai Spur
1 6.250 8.250 2030 Tiruvannamalai Tiruvannamalai(s) Tiruvannamalai Sorakolathur
Exact length of affected forest area shall be calculated after joint inspection with forest dept. during detailed designing.
10.7.10.3 Flora & Fauna Following are the important flora and fauna in the project region.
Table 10-8: List of Flora in Study Region
S. No. Species
Top Canopy
1 Mimusops elengi
2 Diospyros ebenum
3 Strychnos nux vomia
4 Strychnos potatorum
5 Diospyros chloroxylon
6 Drypetes sepiarea
7 Syzygium cumini
8 Canthirum decoccum
9 Ziziphus glaberrima
10 Acacia leucophloea
11 Catunaregam spinosa
12 Buchanania lanzan
13 Sapinda emarginatus
14 Albizia amara
15 Albizia lebbek
16 Tamarindus indica
17 Azadirachta indica
18 Borassus flabellifer
Under-wood
1 Carissa carandas
2 Flacourtia indica
3 Diospyros ferrea
4 Grewia sp.
5 Gymnosporia sp.
6 Ixora arborea
7 Tarenna ascatica
8 Memecylon umbellatum
9 Garcinia spicata
Thorn Forests
1 Karunkali - Acacia chundra
2 Usil - Albizia amara
3 Neem - Azaridachita indica
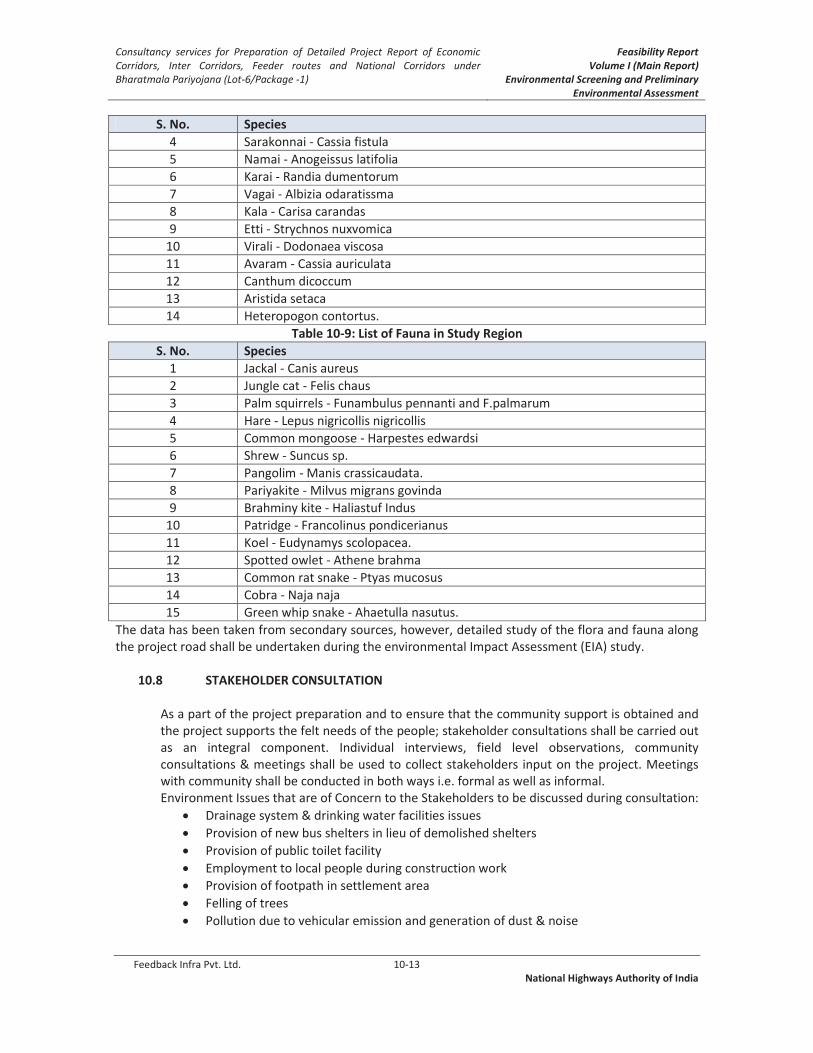
Consultancy services for Preparation of Detailed Project Report of Economic Corridors, Inter Corridors, Feeder routes and National Corridors under Bharatmala Pariyojana (Lot-6/Package -1)
Feasibility Report Volume I (Main Report)
Environmental Screening and Preliminary Environmental Assessment
Feedback Infra Pvt. Ltd. 10-13 National Highways Authority of India
S. No. Species
4 Sarakonnai - Cassia fistula
5 Namai - Anogeissus latifolia
6 Karai - Randia dumentorum
7 Vagai - Albizia odaratissma
8 Kala - Carisa carandas
9 Etti - Strychnos nuxvomica
10 Virali - Dodonaea viscosa
11 Avaram - Cassia auriculata
12 Canthum dicoccum
13 Aristida setaca
14 Heteropogon contortus.
Table 10-9: List of Fauna in Study Region
S. No. Species
1 Jackal - Canis aureus
2 Jungle cat - Felis chaus
3 Palm squirrels - Funambulus pennanti and F.palmarum
4 Hare - Lepus nigricollis nigricollis
5 Common mongoose - Harpestes edwardsi
6 Shrew - Suncus sp.
7 Pangolim - Manis crassicaudata.
8 Pariyakite - Milvus migrans govinda
9 Brahminy kite - Haliastuf Indus
10 Patridge - Francolinus pondicerianus
11 Koel - Eudynamys scolopacea.
12 Spotted owlet - Athene brahma
13 Common rat snake - Ptyas mucosus
14 Cobra - Naja naja
15 Green whip snake - Ahaetulla nasutus.
The data has been taken from secondary sources, however, detailed study of the flora and fauna along the project road shall be undertaken during the environmental Impact Assessment (EIA) study.
10.8 STAKEHOLDER CONSULTATION
As a part of the project preparation and to ensure that the community support is obtained and the project supports the felt needs of the people; stakeholder consultations shall be carried out as an integral component. Individual interviews, field level observations, community consultations & meetings shall be used to collect stakeholders input on the project. Meetings with community shall be conducted in both ways i.e. formal as well as informal. Environment Issues that are of Concern to the Stakeholders to be discussed during consultation:
Drainage system & drinking water facilities issues
Provision of new bus shelters in lieu of demolished shelters
Provision of public toilet facility
Employment to local people during construction work
Provision of footpath in settlement area
Felling of trees
Pollution due to vehicular emission and generation of dust & noise

Consultancy services for Preparation of Detailed Project Report of Economic Corridors, Inter Corridors, Feeder routes and National Corridors under Bharatmala Pariyojana (Lot-6/Package -1)
Feasibility Report Volume I (Main Report)
Environmental Screening and Preliminary Environmental Assessment
Feedback Infra Pvt. Ltd. 10-14 National Highways Authority of India
10.9 POTENTIAL ENVIRONMENTAL IMPACTS
The environmental components are mainly impacted during the construction and operational stages of the project and have to be mitigated for and incorporated in the engineering design. Environmental mitigation measures represent the project’s endeavour to reduce its environmental footprint to the minimum possible. These are conscious efforts from the project to reduce undesirable environmental impacts of the proposed activities and offset these to the degree practicable. Enhancement measures are project’s efforts to gain acceptability in its area of influence. They reflect the pro-active approach of the project towards environmental management. Typical project impacts and management plan suggested thereof are summarized in table below.
Table 10-10: Impact & Mitigation
Particulars Stages Potential Impacts Mitigation Measures
Physiographic Environment
Topography Preconstruction & Construction
Slight changes are expected due to proposed project
Impacts are marginal, but permanent.
Proper planning to keep the land reformation up to bare minimum
If quarry is required then obtain Prior Environmental Clearance from SEIAA (if applicable) and Quarry Development Plan need to be enforced
Geology Preconstruction & Construction
Impacts are moderate because of extraction of sand
If new sand quarry is required then obtain Prior Environmental Clearance from SEIAA (if applicable) and Quarry Development Plan needed
Climate
Temperature / Rainfall / Humidity
Preconstruction & Construction
Tree felling will have an impact of micro-climate of the area
Heat island effect due to increase in paved roads
Low spatially restricted short-term impact
Compensatory afforestation of the trees to be cut as per Forest Dept. guidelines
With the proposed avenue plantation scheme, the micro climate of the project corridor will be smoothening
Land
Loss of Forest Design, Preconstruction & Construction
Diversion of forest Compensatory afforestation
Payment of NPV
Induced Development
Preconstruction & Construction
Change in the land use pattern
Civil authorities to plan and guide any induced development using the prevailing regulatory framework
Soil
Soil Erosion Preconstruction, Construction &
In Road slopes and spoils
Embankment protection through pitching & turfing

Consultancy services for Preparation of Detailed Project Report of Economic Corridors, Inter Corridors, Feeder routes and National Corridors under Bharatmala Pariyojana (Lot-6/Package -1)
Feasibility Report Volume I (Main Report)
Environmental Screening and Preliminary Environmental Assessment
Feedback Infra Pvt. Ltd. 10-15 National Highways Authority of India
Particulars Stages Potential Impacts Mitigation Measures
Operation Erosion in excavated areas
Regular water sprinkling in excavated areas
Contamination of Soil
Preconstruction, Construction & Operation
Scarified bitumen wastes
Oil and diesel spills
Emulsion sprayer and laying of hot mix
Production of hot mix and rejected materials
Residential facilities for the labour and officers
Hazardous and Other Wastes (Management & Transboundary Movement) Rules, 2016
Oil Interceptor will be provided in storage areas for accidental spill of oil and diesel
Rejected material to be laid as directed by monitoring consultant.
Septic tank to be constructed for waste disposal.
Water
Impact on Water Resource
Design, Preconstruction, Construction & Operation
Physical Impact / Partial loss of Water Bodies
Depletion of ground water recharge
Contamination from fuel and lubricants & waste disposal in camp area
Contamination of surface water system due to run-off from road construction area
Wise design; compensatory digging
Provision of Storage / harvesting structure of water, wherever feasible
Oil Interceptor, sedimentation chambers, oils and grease separators and Septic tank in construction camp to be provided.
Enforcement of Hazardous and Other Wastes (Management & Transboundary Movement) Rules, 2016
Both side drain facility to suitably divert the run-off from roads
Air
Dust generation
Preconstruction& Construction
Shifting of utilities, removal of trees & vegetation, transportation of material
Regular Sprinkling of Water
Fine materials to be completely covered, during transport and stocking.
Hot mix plant to be installed in down wind direction with at least 500m distance from nearby settlement.
Regular monitoring of particulate matter in Ambient Air
Gaseous pollutants
Preconstruction, Construction & Operation
Operation of Hot mix plant and vehicle operation for material transportation
Air pollution Norms will be enforced.
Only PUC certified vehicles and machineries shall be deployed
Labourers will be provided with mask.
Regular gaseous pollution monitoring in ambient air
Ambient air quality
Operation Generation of Dust Air pollution from traffic
Paving of shoulders
Compliance with statuary regulatory

Consultancy services for Preparation of Detailed Project Report of Economic Corridors, Inter Corridors, Feeder routes and National Corridors under Bharatmala Pariyojana (Lot-6/Package -1)
Feasibility Report Volume I (Main Report)
Environmental Screening and Preliminary Environmental Assessment
Feedback Infra Pvt. Ltd. 10-16 National Highways Authority of India
Particulars Stages Potential Impacts Mitigation Measures
requirements
Noise
Pre-Construction Activity
Pre-Construction
Man, material and machinery movements Establishment of labour camps, onsite offices, stock yards and construction plants
No Horn Zone sign, Speed Barriers near sensitive receptors
Camps will be setup more than 500m away from settlements.
Construction Activity
Construction
Operation of high noise equipment like hot mix plant, diesel generators etc. Community residing near to the work zones.
Camp will be setup more than 500m away from the settlements, in down wind direction.
Noise pollution regulation to be monitored and enforced.
Provision of Noise barriers etc.
Operation Stage
Operation Indiscriminate blowing of horn near sensitive area
Restriction on use of horns
No Horn Zone sign.
Ecology
Flora Preconstruction, Construction
Loss of vegetation cover Felling of trees
Felling of only unavoidable trees
Compensatory Afforestation as per Forest Dept. guidelines
Plantation of trees along the project road, median and in areas realigned and maintaining the same for a fixed period
Fauna Preconstruction, Construction & Operation
Loss of insect, avian and small mammalian species due to felling of trees Accidental run over
Compensatory Afforestation
Speed breaker and limit in sensitive areas
Wise selection of alignment
Social
Socio Environment
Design, Preconstruction & Construction
Loss of livelihood Loss of CPRs, Religious Structures
Rehabilitation Action Plan
Relocation of CPRs, Religious Structures to suitable place
Public Health and Road Safety
Health and safety
Preconstruction, Construction & Operation
Psychological impacts on project affected people
Migration of worker may lead to sanitation problem creating congenial condition for disease vectors
Discomfort arising of air and noise pollution
Hazards of accident
Continued consultation with PAPs and the competent authority for speedier settlements of appropriate compensation package and resettlement.
Ensuring sanitary measures at construction camp to prevent water borne disease and vector borne disease.
Provision for appropriate personal protective equipment like earplugs, gloves gumboot, and mask to the

Consultancy services for Preparation of Detailed Project Report of Economic Corridors, Inter Corridors, Feeder routes and National Corridors under Bharatmala Pariyojana (Lot-6/Package -1)
Feasibility Report Volume I (Main Report)
Environmental Screening and Preliminary Environmental Assessment
Feedback Infra Pvt. Ltd. 10-17 National Highways Authority of India
Particulars Stages Potential Impacts Mitigation Measures
work force.
Safe traffic management at construction area.
Drive slow sign and speed barriers near community facilities like school, hospital, etc.
10.10 ENVIRONMENTAL BUDGET
Environmental Budget shall be worked out and furnished in detailed EIA Report.

Consultancy Services for preparation of DPR for development of Economic Corridors, Inter Corridors, Feeder Routes and National corridors (GQ and NS-EW Corridors) to improve the efficiency of freight movement in India under Bharatmala Pariyojana (Chennai-Salem Highway)
Feasibility Report Volume – I (Main Report)
Initial Social Impact Assessment
Feedback Infra Pvt. Ltd. 11-1 National Highways Authority of India
11. INITIAL SOCIAL IMPACT ASSESSMENT
11.1 PROJECT BACKGROUND
The Government of India has taken up development of Economic Corridors, Inter
Corridors, Feeder Corridors and National Corridors (GQ and NS-EW Corridors) to improve
the efficiency of Freight Movements in India under Bharatmala Pariyojana. The National
Highways Authority of India (NHAI) has appointed M/s. Feedback Infra Pvt. Ltd. for
providing the required Consultancy services for preparation of Detailed Project Report
for 5 such corridors under LOT 6/Package 1, in Tamil Nadu State. Originally 5 corridors, as
listed below, were included in the project, which were subsequently modified as below:
Classification Corridor
Name Road State
Stretch Name
(Start – End)
Original length (Km)
Revised Length (Km)
Changes Suggested
Economic Corridor
Chennai - Madurai
NH - 132
TN Tindivanam -
Trichy 205 253
The original 6 lane widening of existing
road proposal changed to Chennai – Tiruvannmalai – Harur
Salem Greenfield Highway.
Economic Corridor
Chennai - Madurai
NH -32
TN Maduravoyal - Tambaram
19 0 Road not to be
considered now
Economic Corridor
Chennai - Madurai
NH - 38
TN Tovarankurchi - Madurai
64 27
The road to be changed to
Tovarankurichi – Natham (27 km) for
development of 4 lane facility
Economic Corridor
Mumbai - Kanyakumari
NH - 66
TN Padmanavan
- Kanyakumari
31 0 Road not to be
considered now
Inter Corridor
Coimbatore – Trichy - Tanjavore
NH - 83
TN Tanjavur -
Trichy 56 56 No change
Additional The Salem Bypass (22
km) to be included
Additional
Three Spurs on Chennai Salem
Highway (51 km) to be added
The scope of the project is to establish the technical, economic and financial viability of
the project and prepare Detailed Project Reports for proposed 8 lane access controlled
Chennai Salem greenfield highway of 277.300 km long along with Salem Bypass and
three Spurs (Kanchipuram to Changelpattu Spur of 30.000 km, Chetpet Spur of 4.7 km
and Tiruvannmalai Spur of 16 km), development of Tovarankurichi to Natham road to 4
lane facility and Tanjavur to Trichy road (56 km) to 6 lane facility in a sound technical and
most economical manner, taking into consideration the environment and social aspects
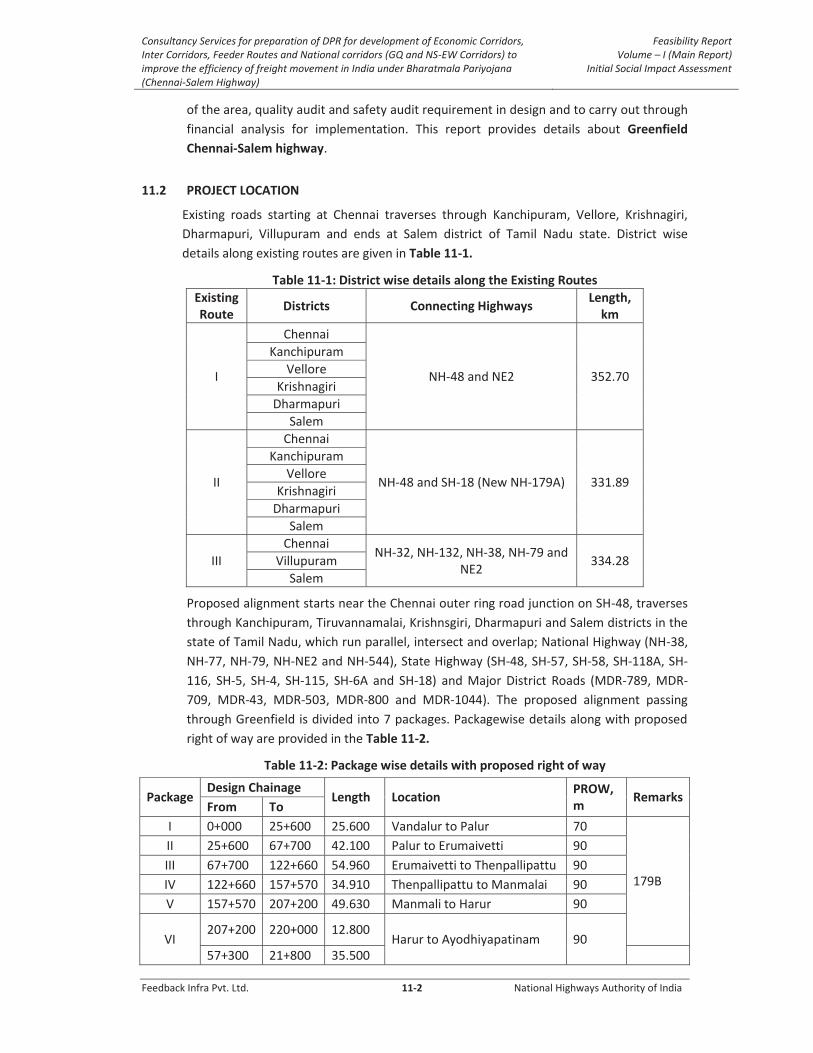
Consultancy Services for preparation of DPR for development of Economic Corridors, Inter Corridors, Feeder Routes and National corridors (GQ and NS-EW Corridors) to improve the efficiency of freight movement in India under Bharatmala Pariyojana (Chennai-Salem Highway)
Feasibility Report Volume – I (Main Report)
Initial Social Impact Assessment
Feedback Infra Pvt. Ltd. 11-2 National Highways Authority of India
of the area, quality audit and safety audit requirement in design and to carry out through
financial analysis for implementation. This report provides details about Greenfield
Chennai-Salem highway.
11.2 PROJECT LOCATION
Existing roads starting at Chennai traverses through Kanchipuram, Vellore, Krishnagiri,
Dharmapuri, Villupuram and ends at Salem district of Tamil Nadu state. District wise
details along existing routes are given in Table 11-1.
Table 11-1: District wise details along the Existing Routes
Existing Route
Districts Connecting Highways Length,
km
I
Chennai
NH-48 and NE2 352.70
Kanchipuram
Vellore
Krishnagiri
Dharmapuri
Salem
II
Chennai
NH-48 and SH-18 (New NH-179A) 331.89
Kanchipuram
Vellore
Krishnagiri
Dharmapuri
Salem
III
Chennai NH-32, NH-132, NH-38, NH-79 and
NE2 334.28 Villupuram
Salem
Proposed alignment starts near the Chennai outer ring road junction on SH-48, traverses
through Kanchipuram, Tiruvannamalai, Krishnsgiri, Dharmapuri and Salem districts in the
state of Tamil Nadu, which run parallel, intersect and overlap; National Highway (NH-38,
NH-77, NH-79, NH-NE2 and NH-544), State Highway (SH-48, SH-57, SH-58, SH-118A, SH-
116, SH-5, SH-4, SH-115, SH-6A and SH-18) and Major District Roads (MDR-789, MDR-
709, MDR-43, MDR-503, MDR-800 and MDR-1044). The proposed alignment passing
through Greenfield is divided into 7 packages. Packagewise details along with proposed
right of way are provided in the Table 11-2.
Table 11-2: Package wise details with proposed right of way
Package Design Chainage
Length Location PROW, m
Remarks From To
I 0+000 25+600 25.600 Vandalur to Palur 70
179B
II 25+600 67+700 42.100 Palur to Erumaivetti 90
III 67+700 122+660 54.960 Erumaivetti to Thenpallipattu 90
IV 122+660 157+570 34.910 Thenpallipattu to Manmalai 90
V 157+570 207+200 49.630 Manmali to Harur 90
VI 207+200 220+000 12.800
Harur to Ayodhiyapatinam 90 57+300 21+800 35.500

Consultancy Services for preparation of DPR for development of Economic Corridors, Inter Corridors, Feeder Routes and National corridors (GQ and NS-EW Corridors) to improve the efficiency of freight movement in India under Bharatmala Pariyojana (Chennai-Salem Highway)
Feasibility Report Volume – I (Main Report)
Initial Social Impact Assessment
Feedback Infra Pvt. Ltd. 11-3 National Highways Authority of India
Package Design Chainage
Length Location PROW, m
Remarks From To
VII 21+800 0+000 21.800 Ayodhiyapattinam to Ariyanur
70 179A
Project road aims to connect (Chennai and Salem) two major districts in the state with the
shortest possible path and also intends to connect many Industrial areas and SEZ along the
project road and the connectivity are contemplated through spurs and interchanges. Taluk wise
details along different districts are given in Location map of project road is given in Figure 11-1.
This green field highway alignment is proposed to be Integrated/connected with other highways
planned/ executed in Tamil Nadu state in the future.
Table 11-3: Taluk wise details along different districts of proposed alignment
Sl. No Name of District Name of Taluk Approx. Length
in Km
1
Kanchipuram
Walajabad
59.100
2 Sriperumbudur
3 Chengalpattu
4 Kanchipuram
5 Uthiramerur
6
Tiruvannamalai Tiruvannamalai
Cheyyaru
123.900
7 Vandavasi
8 Polur
9 Arani
10 Tiruvannamalai
11
12 Chetpet
13 Kalasapakkam
14 Chengam
15 Krishnagiri Uttangarai 2.000
16 Dharmapuri
Harur 56.000
17 Papireddipatty
18
Salem
Yercadu
36.300 19 Valappadi
20 Salem south
21 Salem
Total Length, Km 277.300
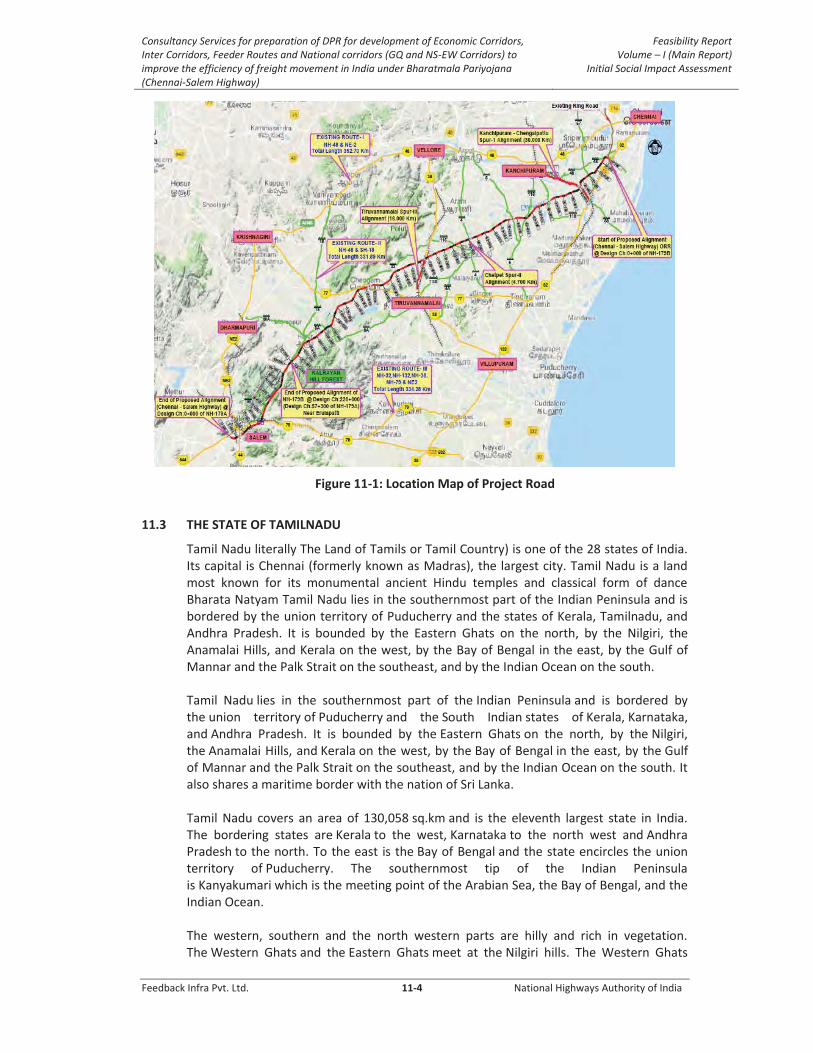
Consultancy Services for preparation of DPR for development of Economic Corridors, Inter Corridors, Feeder Routes and National corridors (GQ and NS-EW Corridors) to improve the efficiency of freight movement in India under Bharatmala Pariyojana (Chennai-Salem Highway)
Feasibility Report Volume – I (Main Report)
Initial Social Impact Assessment
Feedback Infra Pvt. Ltd. 11-4 National Highways Authority of India
Figure 11-1: Location Map of Project Road
11.3 THE STATE OF TAMILNADU
Tamil Nadu literally The Land of Tamils or Tamil Country) is one of the 28 states of India. Its capital is Chennai (formerly known as Madras), the largest city. Tamil Nadu is a land most known for its monumental ancient Hindu temples and classical form of dance Bharata Natyam Tamil Nadu lies in the southernmost part of the Indian Peninsula and is bordered by the union territory of Puducherry and the states of Kerala, Tamilnadu, and Andhra Pradesh. It is bounded by the Eastern Ghats on the north, by the Nilgiri, the Anamalai Hills, and Kerala on the west, by the Bay of Bengal in the east, by the Gulf of Mannar and the Palk Strait on the southeast, and by the Indian Ocean on the south. Tamil Nadu lies in the southernmost part of the Indian Peninsula and is bordered by the union territory of Puducherry and the South Indian states of Kerala, Karnataka, and Andhra Pradesh. It is bounded by the Eastern Ghats on the north, by the Nilgiri, the Anamalai Hills, and Kerala on the west, by the Bay of Bengal in the east, by the Gulf of Mannar and the Palk Strait on the southeast, and by the Indian Ocean on the south. It also shares a maritime border with the nation of Sri Lanka. Tamil Nadu covers an area of 130,058 sq.km and is the eleventh largest state in India. The bordering states are Kerala to the west, Karnataka to the north west and Andhra Pradesh to the north. To the east is the Bay of Bengal and the state encircles the union territory of Puducherry. The southernmost tip of the Indian Peninsula is Kanyakumari which is the meeting point of the Arabian Sea, the Bay of Bengal, and the Indian Ocean. The western, southern and the north western parts are hilly and rich in vegetation. The Western Ghats and the Eastern Ghats meet at the Nilgiri hills. The Western Ghats
Consultancy Services for preparation of DPR for development of Economic Corridors, Inter Corridors, Feeder Routes and National corridors (GQ and NS-EW Corridors) to improve the efficiency of freight movement in India under Bharatmala Pariyojana (Chennai-Salem Highway)
Feasibility Report Volume – I (Main Report)
Initial Social Impact Assessment
Feedback Infra Pvt. Ltd. 11-5 National Highways Authority of India
traverse the entire western border with Kerala, effectively blocking much of the rain bearing clouds of the south west monsoon from entering the state. The eastern parts are fertile coastal plains and the northern parts are a mix of hills and plains. The central and the south central regions are arid plains and receive less rainfall than the other regions. Tamil Nadu has a coastline of about 1,076 km which is the country's second longest coastline. Tamil Nadu is the seventh most populous state in India. 48.4 per cent of the state's population live in urban areas, the highest among large states in India. At the 2011 India census, Tamil Nadu had a population of 72,147,030. Tamil Nadu is mostly dependent on monsoon rains, and thereby is prone to droughts when the monsoons fail. The climate of the state ranges from dry sub-humid to semi-arid. The state has two distinct periods of rainfall: south west monsoon from June to September, with strong southwest winds; North east monsoon from October to December, with dominant north east winds; The annual rainfall of the state is about 945 mm of which 48 per cent is through the north east monsoon, and 32 per cent through the south west monsoon. Since the state is entirely dependent on rains for recharging its water resources, monsoon failures lead to acute water scarcity and severe drought.
11.3.1The District
The project section of Chennai – Salem Project stretch passes through five districts such as Kanchipuram, Tiruvannamalai, Krishnagiri, Dharmapuri and Salem districts. The details about the districts are as below: Kanchipuram district
Kanchipuram district is a district in the northeast of the state of Tamil Nadu in India. In Early Days Chengalpattu was called as the District. In Later Kanchipuram is considered as a District. It is bounded in the west by Vellore District and Thiruvannamalai District, in the north by Tiruvallur District and Chennai District, in the south by Viluppuram District and in the east by the Bay of Bengal. It lies between 11° 00' to 12° 00' latitudes and 77° 28' to 78° 50' longitudes. The district has a total geographical area of 4,432 km2(1,711 sq mi) and coastline of 57 km (35 mi). The town of Kanchipuram is the district headquarters. The Chennai International Airportis located in Tirusulam in Kanchipuram district now under Greater Chennai Corporation Limit. In 2011, Kancheepuramdistrict had a population of 3,998,252. Agriculture is the main occupation of the people with 47% of the population engaged in it. Paddy is the major crop cultivated in this district. Groundnuts, Sugarcane, Cereals & Millets and Pulses are the other major crops cultivated. 76.50 Metric Tonnes lands are cultivated in Fuel wood and 8.039 Tonnes in Cashew. Palar river along with Tanks and wells are the main sources of irrigation in this district. Kancheepuram is also known as 'Silk City' and 'Temple City', since one of the main professions of the people living in and around is weaving silk sarees. The silk weavers of Kanchi settled more than 400 years ago and have given it an enviable reputation as the producer of the best silk sarees in the country.
Consultancy Services for preparation of DPR for development of Economic Corridors, Inter Corridors, Feeder Routes and National corridors (GQ and NS-EW Corridors) to improve the efficiency of freight movement in India under Bharatmala Pariyojana (Chennai-Salem Highway)
Feasibility Report Volume – I (Main Report)
Initial Social Impact Assessment
Feedback Infra Pvt. Ltd. 11-6 National Highways Authority of India
More than 70 percent of the 163 notified areas (megalithic sites) in the state of Tamil Nadu are in Kancheepuram district, including those at, Erumaiyur, Nandampakkam, Sirukalathur, Sikarayapuram, Ayyancheri, Kilambakkam and Nanmangalam. Kanchipuram is also one of the most industrialized districts in the country; kanchipuram district has many automobile manufacturers such as Hyundai, Nissan, Ford, BMW, Daimler, Yamaha etc. thanks to its proximity to the state capital Chennai. Areas surrounding Sriperumbudur have turned out to become one of the largest manufacturing hubs of India. The district is home to the manufacturing units of Hyundai, Ford, Mitsubishi, Nokia, Samsung, Dell, Saint Gobain, etc. The district is also at the center of the Information Technology boom in India. Many multinational IT companies like Tata Consultancy Services (TCS), Infosys, Wipro Technologies, Cognizant Technology Solutions, etc. have set up their offices in Kanchipuram district. TCS and Infosys have built huge offices with capacities of 22,000 and 25,000 employees, respectively.
Tiruvannamalai district
Tiruvannamalai District (also known as Thiruvannaamalai) is one of the districts in the state of Tamil Nadu, in South India. It was formed in the year 1989 from non-existing North Arcot District as Tiruvannamalai Sambuvarayar and Vellore Ambedkar. Tiruvannamalai town is the district headquarters. The district is divided into 12 Taluks . Arani is famous for silk sarees. As of 2011, the district had a population of 4,164,875 with a sex-ratio of 994 females for every 1,000 males. According to 2011 census, Tiruvannamalai District had a population of 2,464,875 with a sex-ratio of 994 females for every 1,000 males, much above the national average of 929. A total of 272,569 were under the age of six, constituting 141,205 males and 131,364 females. Scheduled Castes and Scheduled Tribes accounted for 22.94% and 3.69% of the population respectively. The average literacy of the district was 66%, compared to the national average of 72.99%. The district had a total of 588,836 households. There were a total of 1,238,177 workers, comprising 265,183 cultivators, 351,310 main agricultural labourers, 37,020 in house hold industries, 316,559 other workers, 268,105 marginal workers, 27,458 marginal cultivators, 173,753 marginal agricultural labourers, 9,700 marginal workers in household industries and 57,194 other marginal workers. Tiruvannamalai District has an area of 6,191 km2. It is bounded on the north by Vellore District, on the east by Kanchipuram District, on the south by Villupuram District, and on the west by Dharmapuri and Krishnagiri districts. In the District Arani and Thiruvannamalai regions are highest revenue generations regions respectievely.In 2006 the Ministry of Panchayati Raj named Tiruvannamalai one of the country's 250 most backward districts (out of a total of 640). It is one of the six districts in Tamil Nadu currently receiving funds from the Backward Regions Grant Fund Programme (BRGF). Tiruvannamalai District is known for its two major businesses, agriculture and silk saree weaving. Rice cultivation and processing is one of the biggest businesses in this district. 112013 hectares of paddy cultivation is irrigated by 1965 lakes and 18 reservoirs and small dams. It has 18 regulated markets through which the farmers sell their agri products directly to the government. Through these regulated markets, 271411 metric
Consultancy Services for preparation of DPR for development of Economic Corridors, Inter Corridors, Feeder Routes and National corridors (GQ and NS-EW Corridors) to improve the efficiency of freight movement in India under Bharatmala Pariyojana (Chennai-Salem Highway)
Feasibility Report Volume – I (Main Report)
Initial Social Impact Assessment
Feedback Infra Pvt. Ltd. 11-7 National Highways Authority of India
tonnes of paddy harvested in 2007. There are lots of rice mills to process paddy found throughout the district. The modern rice mill near Cheyyar is the biggest government owned mill and Arani has around 278 rice mills. Kalambur is also has around 20 Rice mills and known for variety of rice called Kalambur Ponni rice. The district has a large populace of weavers who are specialize in making Silk sarees. Hand looms are often engaged for weaving, although recently some have turned to mechanized methods of using Power looms. Arani taluk contributes high percent of Silk weaving. Arani is the most important revenue earning town in the district. Though the town is not popular off the state, a bulk of India's Silk apparels is produced by the people of Arani. The district started to industrialize following the establishment of the industrial complex near Cheyyar by the State Industries Promotion Corporation of Tamil Nadu (SIPCOT). This is evidenced by the recent announcements of a 250-acre (1.0 km2) hi-tech Special Economic Zone for automotive components, a 300-acre (1.2 km2) electronics hardware park and the commitment from the Taiwanese Shoe Company to set up its unit. In November 2009 the Tamil Nadu cabinet approved the Mahindra & Mahindra's Rs 1800 core automobile project in 450 acres. This unit will produce tractors, SUVs and commercial vehicles and auto parts. Aluminum die cast unit by Ashley Alteams, a joint venture by Ashok Leyland and Finland-based Alteams Oy started its production in January 2010. This High pressure die cast will manufacture automobile and telecommunication components with initial capacity of 7000 ton per year. One of the largest sugar mills in the country - Cheyyar co-operative sugars - is situated near Cheyyar. Since Tiruvannamalai District has its capital at Tiruvannamalai City, there are many factories around Tiruvannamalai. Scent factories are large in number due to the high production of flowers around Tiruvannamalai. They are listed as follows: 1. Hindusthan house hold factories, 2. Sarala birla factory of aroma oil, 3. Parthiban cottages aroma oil factory. The Tamil Nadu government is planning for a SIPCOT at naidumangalam and kilpennathur both near Tiruvannamalai. Arani has the factories related to Rice and Silk with in the town and in the Taluk area. As well, there are few other mills near Arani, such as Lakshmi Saraswathi Cotton mills Arni Pvt Ltd and some Engineering Industries. Krishnagiri District
Krishnagiri district is a district in the western part of the state of Tamil Nadu, in India. This district is carved out from Dharmapuri District by 2004. The municipal town of Krishnagiri is the district headquarters. In Tamil NaduKrishnagiri district was formed as the 30th district of Tamil Nadu on February 9, 2004. Krishnagiri District was formed by carving out five taluks and ten blocks of the erstwhile Dharmapuri district. The first collector of Krishnagiri was Mangat Ram Sharma. A district collector heads the district administration. Krishnagiri district is divided into two divisions and five taluks for the purpose of revenue administration. Revenue Divisional Officer heads the divisions and Tahsildar is the head of taluk level administration. Development administration in this district is coordinated by the panchayats (also called as blocks) for the rural areas. There are about ten panchayat unions, seven town panchayats, 352 village Panchayats and 874 revenue villages in this district. Krishnagiri district comprises two revenue divisions Krishnagiri and Hosur. There are seven taluks:

Consultancy Services for preparation of DPR for development of Economic Corridors, Inter Corridors, Feeder Routes and National corridors (GQ and NS-EW Corridors) to improve the efficiency of freight movement in India under Bharatmala Pariyojana (Chennai-Salem Highway)
Feasibility Report Volume – I (Main Report)
Initial Social Impact Assessment
Feedback Infra Pvt. Ltd. 11-8 National Highways Authority of India
Krishnagiri, Hosur, Pochampalli, Uthangarai, Shoolagiri, Bargur and Denkanikottai. There are 12 panchayat unions: Kelamangalam, Thalli, Anchetti, Krishnagiri, Shoolagiri, Vepanapalli, Hosur, Kaveripattinam, Pochampalli, Mathur and Uthangarai. According to the 2011 census, Krishnagiri district had a population of 1,879,809 with a sex-ratio of 963 females for every 1,000 males, much above the national average of 929. A total of 217,323 were under the age of six, constituting 112,832 males and 104,491 females. Scheduled Castes and Scheduled Tribes accounted for 14.22% and 1.19% of the population respectively. The average literacy of the district was 63.2%, compared to the national average of 72.99%.The district had a total of 448,053 households. There were a total of 877,779 workers, comprising 218,600 cultivators, 197,369 main agricultural labourers, 15,237 in house hold industries, 310,795 other workers, 135,778 marginal workers, 17,438 marginal cultivators, 65,959 marginal agricultural labourers, 6,681 marginal workers in household industries and 45,700 other marginal workers. The State industrial Promotion Corporation of Tamil Nadu, (SIPCOT) has developed one of the largest industrial complexes in the country in Hosur in over an area of 1370 acres and to develop Large/Medium/Small industries with SIDCO offering comprehensive services for more than 500 industries. The industries in Hosur are the source of raising the standard of living of people in Krishnagiri district. It is producing goods varying from Pin to Aeroplance. The credit goes to the good climate, incentives and inspiration provided by the State government and Central government. It is at an altitude of 10000m from mean sea level. It is very near to Bangalore, the capital of Karnataka. Industries of various kinds such as electrical, electronic, automobile, chemical, iron & steel are flourishing because of the favorable conditions and infrastructure availability. Information technology has a great scup for investment because of the proximity of Bangalore. Several industrialist of repute have started their units in Hosur. Hosur has been able to attract some of the most prestigious industrial houses in the country including the Tatas, The Birlas, the Hindujas, TVS group companies, Murugappa group of companies, Lakshmi group and also a number of MNC’s. Hosur Industrial area is consists of about 700 industries comprising of Large, Medium, Small and tiny industries. The location of these industries are SIPCOT phase I & II, SIDCO industrial estates, SIDCO electronic industrial estate and the outside industries are scattered in private lands within 20 Kms radius of Hosur towards Krishnagiri, Royakottai & Thalli Roads and few major industries in Harita, Bagalur, Belagondapalli, Thorapalli and other areas. The units located at Hosur manufacture sophisticated products ranging from Trucks, Automobiles and Automobiles parts, Motor Cycles, Mopeds, Diesel Engines, Power shift Transmission, Castings, Forgings, Cigarettes, Watches & Jewellery, Abrasives, Hosiery knilling needles. Machineries, Aircrafts and Pharmaceuticals, Biotech textiles, Chemicals, Electronic, electrical and general engineering. Dharmapuri district
Dharmapuri is a district in Western part of Tamil Nadu in South India. It is the first district created in Tamil Nadu after the independence of India by splitting from then Salem district on 10 October, 1965.
Consultancy Services for preparation of DPR for development of Economic Corridors, Inter Corridors, Feeder Routes and National corridors (GQ and NS-EW Corridors) to improve the efficiency of freight movement in India under Bharatmala Pariyojana (Chennai-Salem Highway)
Feasibility Report Volume – I (Main Report)
Initial Social Impact Assessment
Feedback Infra Pvt. Ltd. 11-9 National Highways Authority of India
The district is located between latitudes N 11 47’ and 12 33’ and longitudes E 77 02’ and 78 40’. Occupies an area of 4497.77 km² (i.e. 3.46% of Tamil Nadu) and has a population of 2,856,300 (as of 2001). It is bounded on the north by Krishnagiri District, on the east by Tiruvannamalai District and Viluppuram District districts, on the south by Salem District, and on the west by Karnataka's Chamarajanagar District. The Whole district is surrounded by hills and forests. The terrain of dharmapuri is of rolling plains type. Dharmapuri is located on the geographically important area in south India. The whole district is predominantly covered with forests. Spider valley located near Hogenakkal is home to many wild animals. The district falls in the migratory path of elephants. Man and elephant conflicts are most common in these parts. Many tribal communities depend on these forests. Vathalmalai, a mountain hamlet on top of Shervarayan hill chain has suitable conditions to cultivate coffee and jack fruit. Wild boars and spotted deers are commonly seen in Morappur and Harur forest region. Gaurs sometimes stroll near villages near Bommidi region. Thoppur ghat section has one of the scenic highways surrounded by mountains and forests. This district lies in a geography where both Western and Eastern ghats make their presence. Dharmapuri and Krishnagiri districts account for more than 60 -70% total mango production in Tamil Nadu. It is a major producer of Ragi and saamai crops in the state. Exotic crops like dates are also being cultivated by some farmers in the areas around Ariyakulam. Dharmapuri district shows vigorous increasing performance in literacy and education. Where by the year 2011 it secured last position in Tamil Nadu by scoring 62%, whereas by the year 2016 it showed 92% literacy by securing 12th rank in Tamil Nadu out of 32. It also shows vigorous increase in educational hubs by having colleges and school in various fields of education. Salem district
Salem District is a district of Tamil Nadu state in southern India.Salem was the biggest district before separating Dharmapuri in Tamilnadu. The district was now separated into Dharmapuri, Krishnagiri and Namakkal as individual district .Salem district is the best location to live in India.Salem is the district headquarters and other major towns in the district include Attur,Mettur Sankagiri and Edappadi. Salem two thousand years ago is evident from the discovery of silver coins of the Greek Emperor Tiberices Claudices Nero (37-68 A.D.) in Koneripatti of Salem in 1987. It was ruled by Mazhavar kings Adhiyamaan and Valvil Ori of sangam age. It comes under Mazhanadu a vast region dated 2nd century BC. Salem was the largest district of Tamilnadu, it was bifurcated into Salem – Dharmapuri districts in 1965 and Namakkal district in 1997. According to 2011 census, Salem district had a population of 3,482,056 with a sex-ratio of 954 females for every 1,000 males, much above the national average of 929. A total of 344,960 were under the age of six, constituting 180,002 males and 164,958 females. Scheduled Castes and Scheduled Tribes accounted for 16.67% and 3.43% of the population respectively. The average literacy of the district was 65.64%, compared to the national average of 72.99%. The district had a total of 915,967 households. There were a total of 1,694,160 workers, comprising 247,011 cultivators, 396,158 main agricultural labourers, 132,700 in house hold industries, 785,161 other workers, 133,130 marginal workers, 9,993 marginal cultivators, 58,052 marginal agricultural labourers, 8,803 marginal workers in household industries and 56,282 other marginal workers.
Consultancy Services for preparation of DPR for development of Economic Corridors, Inter Corridors, Feeder Routes and National corridors (GQ and NS-EW Corridors) to improve the efficiency of freight movement in India under Bharatmala Pariyojana (Chennai-Salem Highway)
Feasibility Report Volume – I (Main Report)
Initial Social Impact Assessment
Feedback Infra Pvt. Ltd. 11-10 National Highways Authority of India
The Salem handloom industry is one of the most ancient cottage industries and producing quality sari, dothi and angavasthram out of silk yarn and cotton yarn. In the recent past, home furnishing items are also woven, mainly for export purposes. More than 75,000 handlooms are working and the total value of cloth produced per annum is estimated at Rs.5,000 crores. With more than 125 spinning mills, with modern weaving units and garment units Salem established itself as one of the major textile center in Tamil Nadu .The history of handloom and spinning mills dates back to pre-independence period in Salem. But till 1960s there were fewer than 5 spinning mills. Private handloom weaving started thriving in the region along with the large scale cooperative sector handloom weaving and marketing units. Small scale hand dying units were started around the region to support the industry. Around 1980s the textile industry grew significantly. Many major spinning mills and waste spinning units came up into existence. Many Handloom societies and dying houses were established. New and increased numbers of Power Loom units were mushroomed in the places like Gugai, Ammapet, Attayampatti, Vennandur, Magudanchavadi, Rasipuram, Komarapalayam Pallipalayam, Jalakandapuram and Ellampillai. The Salem region also houses the Tamil Nadu largest number of Sago industries which are engaged in the production Sago Foods and Starch.In Salem District alone, 34000 hectares of land is under tapioca cultivation which is the raw material for the sago industries and there are 650 units engaged in tapioca processing. In and around Salem the yield of tapioca is about 25-30 T/ha, highest in the World. National average is 19 T/ha and World average production stands at 10 T/ha. Hence it is called land of sago. In 1981, Salem Starch and Sago Manufacturers Service Industrial Co-operative Society Ltd(popularly called as SAGOSERVE) was established to promote the growth of sago industries. Nearly 80% of the national demand for Sago and Starch is being met by the Sagoserv. Salem Steel Plant, a special steel unit of Steel Authority of India Ltd have their plant located in Salem which produces Cold rolled stainless steel and Hot rolled stainless steel/carbon steel. The plant can produce austenitic, ferritic, martensitic and low-nickel stainless steel in the form of coils and sheets with an installed capacity of 70,000 tonnes/year in Cold Rolling Mill and 1,86,000 tonnes/year in Hot Rolling Mill. In addition, the plant has country's first top-of-the-line stainless steel blanking facility with a capacity of 3,600 tonnes/year of coin blanks and utility blanks/circles. Expansion and modernisation of Salem Steel Plant is ongoing. The plan envisages installation of Steel Melting and Continuous Casting facilities to produce 1,80,000 tonnes of slabs along with expansion of Cold Rolling Mill complex, enhancing the capacity of Cold Rolled Stainless Steel Products from 65,000 TPA to 1,46,000 TPA and an additional Roll Grinding Machine for Hot Rolling Mill for increasing production to 3,64,000 TPA. The total project area is 1130 acres and cost of the project is 1780 crores. Southern Iron & Steel Company Ltd (joint venture with JSW Steel) the first integrated steel plant of India at a cost of 2,235 Crores, located near Salem for the production of TMT corrosion resistant bars/alloy steels. The Salem plant is the largest special steel plant in India aims to develop the Kanjamalai, Kavuthimalai and Vediappanmalai iron ore mines in Tamil Nadu on receipt of requisite approvals to improve raw material security. This will facilitate expansion of production capacity to 2 MTPA. It will also allow the unit to diversify into the production of value-added products such as annealed, drawn and
Consultancy Services for preparation of DPR for development of Economic Corridors, Inter Corridors, Feeder Routes and National corridors (GQ and NS-EW Corridors) to improve the efficiency of freight movement in India under Bharatmala Pariyojana (Chennai-Salem Highway)
Feasibility Report Volume – I (Main Report)
Initial Social Impact Assessment
Feedback Infra Pvt. Ltd. 11-11 National Highways Authority of India
peeled steel. The plant is continuously working to develop special grades for critical automotive applications. The Madras Aluminium Company Ltd (MALCO) is part of Vedanta Resources Plc, a London Stock Exchange listed FTSE 100 diversified metals and mining major. MALCO has a state-of-the-art, coal-based Captive Power Plant at the same location which was commissioned in the year 1999. In the year 2004 MALCO augmented its smelter capacity from earlier 25,000TPA to 40,000TPA. It generates 100 MW power from 4 units of 25MW each through power plant located at Mettur, Tamil Nadu. Around 90% of the entire power generated is exported; the rest is used internally. Efficient plant operations enabled MALCO to achieve a higher plant load factor since existence. The region around Salem is rich in mineral ores. Salem has one of the largest magnetite, and bauxite and also irons ore deposits in India. It has many magnesite factories operated by private and public sectors such as Burn Standard & Co, Dalmia Magnesites and Tata Refractories, SAIL refractoriness. The Leigh Bazaar market in Salem is the biggest regional market for agro products. Narasus coffee one of the famous coffee in Tamil Nadu, Nandhi Dall Mills the oldest flour mill company, BSP refineries (Usha Refined Sunflower Oil) are other few companies have their presence in Salem. Being one of the fastest growing tier II cities, the Tamil Nadu government and ELCOT are planning to establish an IT park in Salem covering about 160 acres (0.65 km2). SAIL is planning a Steel SEZ inside the Salem Steel plant covering about 250 acres there is an exclusive Electrical and Electronics Industrial Estate in the Suramangalam area of Salem city. Coimbatore-Erode-Salem stretch was well known for Industries and Textile processing’s and it is announced as Coimbatore-Salem Industrial Corridor and further development works are carried by SIPCOT Linking.
11.4 Scope of the Project
The general scope of work for this study comprises the following:
i. Review of all available reports and published information about the project
road and the project influence area.
ii. Environmental and social impact assessment, including social related to cultural
related properties, natural habitats, involuntary resettlement etc.
ii Public consultation, including consultation with communities located along the
road, NGOs working in the area, other stake holders and relevant Government
Departments at all the different stages of assignment (such as inception stage,
feasibility stage, preliminary design stage and once final designs are
concretized).
iii. Detailed Reconnaissance.
iv. Identification of possible alternative alignments for Green field highway along
with improvements in the existing alignment, if any bypassing congested
locations with alternatives, evaluation of different alternatives comparison on
techno-economic and other considerations and recommendations regarding
most appropriate option.
v. Traffic studies including traffic surveys and Axle load survey and demand
forecasting for next thirty years.

Consultancy Services for preparation of DPR for development of Economic Corridors, Inter Corridors, Feeder Routes and National corridors (GQ and NS-EW Corridors) to improve the efficiency of freight movement in India under Bharatmala Pariyojana (Chennai-Salem Highway)
Feasibility Report Volume – I (Main Report)
Initial Social Impact Assessment
Feedback Infra Pvt. Ltd. 11-12 National Highways Authority of India
vi. Inventory and condition surveys for the spurs (existing road), existing road
portions other than the proposed green field highway.
vii. Inventory and condition surveys for bridges, cross-drainage structures, other
Structures, river Bank training/Protection works and drainage provisions.
viii. Detailed topographic surveys using LIDAR equipped with minimum engineering
grade system or any other better technology having output accuracy not less
than
(a) Specified in IRC SP 19
(b) Total Station
(c) GPS/ DGPS
The use of conventional high precision instruments i.e. Total Station or
equivalent can be used at locations such as major bypasses, water bodies etc.
where it may not be possible to survey using LIDAR.
ix. Pavement investigations.
x. Sub-grade characteristics and strength: investigation of required sub-grade and
sub-soil characteristics and strength for road and embankment design and sub
soil investigation.
xi. Identification of sources of construction materials.
xii. Detailed design of road, its x-sections, horizontal and vertical alignment and
design of embankment of height more than 6m and also in poor soil conditions
and where density consideration require, even lesser height embankment.
Detailed design of structures preparation of GAD and construction drawings
and cross-drainage structures and underpasses etc.
xiii. Identification of the type and the design of intersections.
xiv. Identification and design of grade separated interchanges
xv. Design of complete drainage system and disposal point for storm water.
xvi. Value analysis / value engineering and project costing.
xvii. Economic and financial analysis.
xviii. Contract packaging and implementation schedule.
xix. Strip plan indicating the scheme for schedule for LA: reports documents and
drawings arrangement of estimates for cutting/ transplanting of trees and
shifting of utilities from the concerned department.
xx. To find out financial viability of project for implementation and suggest the
preferred mode on which the project is to be taken up.
xxi. Preparation of detailed project report, cost estimate, approved for construction
Drawings, rate analysis, detailed bill of quantities, bid documents for execution
of civil works through budgeting resources.
xxii. Design of toll plaza and identification of their numbers and location and office
cum residential complex including working drawings.
xxiii. Design of weighing stations, parking areas and road side amenities.
xxiv. Any other user oriented facility en-route toll facility.
xxv. Tie-in of on-going/sanctioned works of MORT&H/ NHAI/ other agencies.
xxvi. Preparation of social plans for the project affected people as per policy of the
lending agencies / Govt. of India R&R Policy.
Consultancy Services for preparation of DPR for development of Economic Corridors, Inter Corridors, Feeder Routes and National corridors (GQ and NS-EW Corridors) to improve the efficiency of freight movement in India under Bharatmala Pariyojana (Chennai-Salem Highway)
Feasibility Report Volume – I (Main Report)
Initial Social Impact Assessment
Feedback Infra Pvt. Ltd. 11-13 National Highways Authority of India
11.5 PROJECT APPRECIATION
Chennai Salem Greenfield Expressway
The present connection between Chennai to Salem is provided by two major routes first one is from NH-48and NH-44 (Chennai – Sriperambudur – Vellore – Krighnagiri – Dharmapuri – Salem which has distance – 372 Km) and the second route is from NH-32, NH-132 and NH-79 (Chennai – Tindivanam- Villupuram – Ulundurpet – Kalakurichi – Salem which has distance – 345 Km)which was four/Six-lane road and by connects by other state highways. However, since NH-44, NH-48, NH-32, NH-132 and NH-79are not fully access-controlled, speed of travel affected by considerable cross movement of traffic through the side roads and access of vehicles from the abutting settlements. In both the existing routes, the existing alignments have either reached their level of service or would be reaching in near future. Hence there is a need to have a larger corridor for high speed facility. Besides, the sections through mountainous terrain have lower radius curves at some places which restrict smooth movement of traffic at design speed. The idea of construction of a high- speed facility like a fully access-controlled expressway has originated from the primary necessity to eliminate the bottlenecks and limitations that exist in the present corridor to reduce the travel time between Chennai –Salem to a considerable extent. It has been felt that substantial reduction of travel time. The Travel time from Chennai to Salem via NH-32, NH-132 and NH-79 is 6 hr 26 mins, which will be reduced to 3 hr 09 mins with travel along the access controlled green field Expreesway.This would,not only fetch direct benefits to the users due to less vehicle operating cost, passenger time saving and other intangible benefits as well. The connectivity provided through interchanges with residential, commercial and industrial hub would also fetch direct and indirect benefits. The project is expected to generate development around the abutting towns connected through proposed spurs from the expressway. Number of openings and employment opportunities to the local people and for the local and National contractors as well, which would satisfy the Federal Govt agenda of employment opportunities. There would be short and long term tangible and intangible benefits could be benefitted by this project.
All the above factors warrant the construction of access controlled expressway ensuring safety and high speed movement of men and materials from production units to consumers in shortest possible time.
11.5.1 Road Alignment
The project road is divided into three sections as given below. 1. Chennai Salem Greenfield Expressway including Salem Bypass and three connecting
spurs 2. Tovarankurichi to Nathan existing road to be upgraded to 4 lane divided highway 3. Thanjavur to Trichi existing NH 83 to be upgraded to 6 lane facility In order to be able to appreciate the site conditions, our team visited and inspected the project section of NH-48 and NH-44 (Chennai – Sriperambudur – Vellore – Krighnagiri – Dharmapuri – Salem which has distance – 372 Km) and NH-32, NH-132 and NH-79 (Chennai – Tindivanam- Villupuram – Ulundurpet – Kalakurichi – Salem which has distance – 345 Km) from Chennai to Salem and collected existing details of project road during reconnaissance survey.The cross roads, leading to the expressway alignment, were also inspected during the site visits.`

Consultancy Services for preparation of DPR for development of Economic Corridors, Inter Corridors, Feeder Routes and National corridors (GQ and NS-EW Corridors) to improve the efficiency of freight movement in India under Bharatmala Pariyojana (Chennai-Salem Highway)
Feasibility Report Volume – I (Main Report)
Initial Social Impact Assessment
Feedback Infra Pvt. Ltd. 11-14 National Highways Authority of India
Photo 1: Existing SH-48 Road - Flyover Proposed at
2+200 Photo 2: Palur river crossing at 24+640
Photo 3: SH-18 (New NH-179A) - Road along valley
portion at 51+000 Photo 4: Kalrayan hill forest at 39+320
Photo 5: End point of proposed alignment at 0+000 (NH-544)
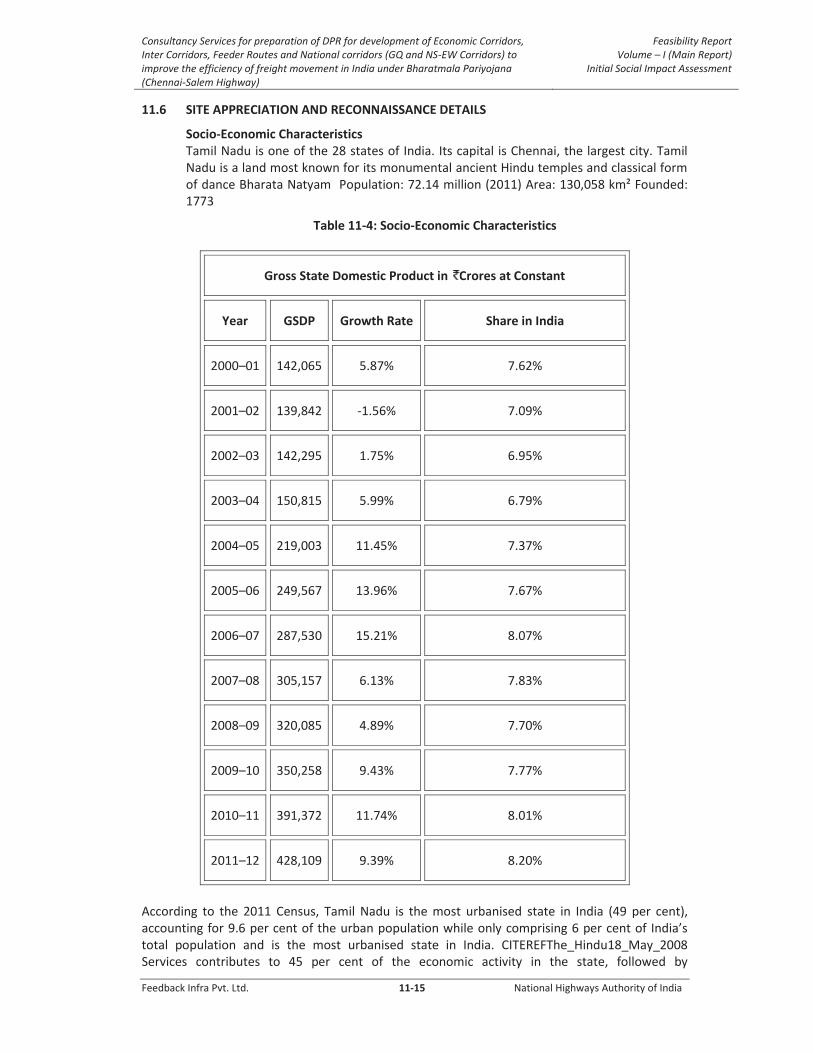
Consultancy Services for preparation of DPR for development of Economic Corridors, Inter Corridors, Feeder Routes and National corridors (GQ and NS-EW Corridors) to improve the efficiency of freight movement in India under Bharatmala Pariyojana (Chennai-Salem Highway)
Feasibility Report Volume – I (Main Report)
Initial Social Impact Assessment
Feedback Infra Pvt. Ltd. 11-15 National Highways Authority of India
11.6 SITE APPRECIATION AND RECONNAISSANCE DETAILS
Socio-Economic Characteristics Tamil Nadu is one of the 28 states of India. Its capital is Chennai, the largest city. Tamil Nadu is a land most known for its monumental ancient Hindu temples and classical form of dance Bharata Natyam Population: 72.14 million (2011) Area: 130,058 km² Founded: 1773
Table 11-4: Socio-Economic Characteristics
Gross State Domestic Product in Crores at Constant
Year GSDP Growth Rate Share in India
2000–01 142,065 5.87% 7.62%
2001–02 139,842 -1.56% 7.09%
2002–03 142,295 1.75% 6.95%
2003–04 150,815 5.99% 6.79%
2004–05 219,003 11.45% 7.37%
2005–06 249,567 13.96% 7.67%
2006–07 287,530 15.21% 8.07%
2007–08 305,157 6.13% 7.83%
2008–09 320,085 4.89% 7.70%
2009–10 350,258 9.43% 7.77%
2010–11 391,372 11.74% 8.01%
2011–12 428,109 9.39% 8.20%
According to the 2011 Census, Tamil Nadu is the most urbanised state in India (49 per cent), accounting for 9.6 per cent of the urban population while only comprising 6 per cent of India’s total population and is the most urbanised state in India. CITEREFThe_Hindu18_May_2008 Services contributes to 45 per cent of the economic activity in the state, followed by

Consultancy Services for preparation of DPR for development of Economic Corridors, Inter Corridors, Feeder Routes and National corridors (GQ and NS-EW Corridors) to improve the efficiency of freight movement in India under Bharatmala Pariyojana (Chennai-Salem Highway)
Feasibility Report Volume – I (Main Report)
Initial Social Impact Assessment
Feedback Infra Pvt. Ltd. 11-16 National Highways Authority of India
manufacturing at 34 per cent and agriculture at 21 per cent. Government is the major investor in the state with 51 per cent of total investments, followed by private Indian investors at 29.9 per cent and foreign private investors at 14.9 per cent. Tamil Nadu has a network of about 113 industrial parks and estates offering developed plots with supporting infrastructure.
According to the publications of the Tamil Nadu government the Gross State Domestic Product at Constant Prices (Base year 2004–2005) for the year 2011–2012 is 428,109 crores, an increase of 9.39 per cent over the previous year. The per capita income at current price is 72,993.
Table 11-5 Districts of Tamil Nadu
District Headquarters Area
Population (2011)
Population density
1 Ariyalur Ariyalur 1,944 km³ 752,481 387 /km²
2 Chennai Chennai 174 km² 4,681,087 26,903 /km²
3 Coimbatore Coimbatore 4,642 km² 3,172,578 648 /km²
4 Cuddalore Cuddalore 3,705 km² 2,600,880 702 /km²
5 Dharmapuri Dharmapuri 4,527 km² 1,502,900 332 /km²
6 Dindigul Dindigul 6,054 km² 2,161,367 357 /km²
7 Erode Erode 5,692 km² 2,259,608 397 /km²
8 Kanchipuram Kanchipuram 4,305 km² 2,690,897 666 /km²
9 Kanyakumari Nagercoil 1,685 km² 1,863,174 1,106 /km²
10 Karur Karur 2,902 km² 1,076,588 371 /km²
11 Krishnagiri Krishnagiri 5,091 km² 1,883,731 370 /km²
12 Madurai Madurai 3,695 km² 2,441,038 663 /km²
13 Nagapattinam Nagapattinam 2,416 km² 1,614,069 668 /km²
14 Namakkal Namakkal 3,402 km² 1,721,179 506 /km²
15 Nilgiris Udagamandalam 2,552 km² 735,071 288 /km²
16 Perambalur Perambalur 1,748 km² 564,511 323 /km²
17 Pudukkottai Pudukkottai 4,652 km² 1,618,725 348 /km²
18 Ramanathapuram Ramanathapuram 4,180 km² 1,337,560 320 /km²
19 Salem Salem 5,249 km² 3,480,008 663 /km²
20 Sivaganga Sivaganga 4,140 km² 1,341,250 324 /km²
21 Thanjavur Thanjavur 3,477 km² 2,302,781 661 /km²
22 Theni Theni 2,872 km² 1,143,684 397 /km²
23 Thoothukudi Thoothukudi 4,599 km² 1,738,376 378 /km²
24 Tiruchirappalli Tiruchirappalli 4,508 km² 2,713,858 602 /km²
25 Tirunelveli Tirunelveli 6,709 km² 3,072,880 458 /km²
26 Tirupur Tirupur 5,192 km² 2,471,222 476 /km²
27 Tiruvallur Tiruvallur 3,552 km² 3,725,697 1,049 /km²
28 Tiruvannamalai Tiruvannamalai 6,188 km² 4,121,965 667 /km²
29 Tiruvarur Tiruvarur 2,379 km² 1,268,094 533 /km²
30 Vellore Vellore 6,081 km² 4,028,106 671 /km²
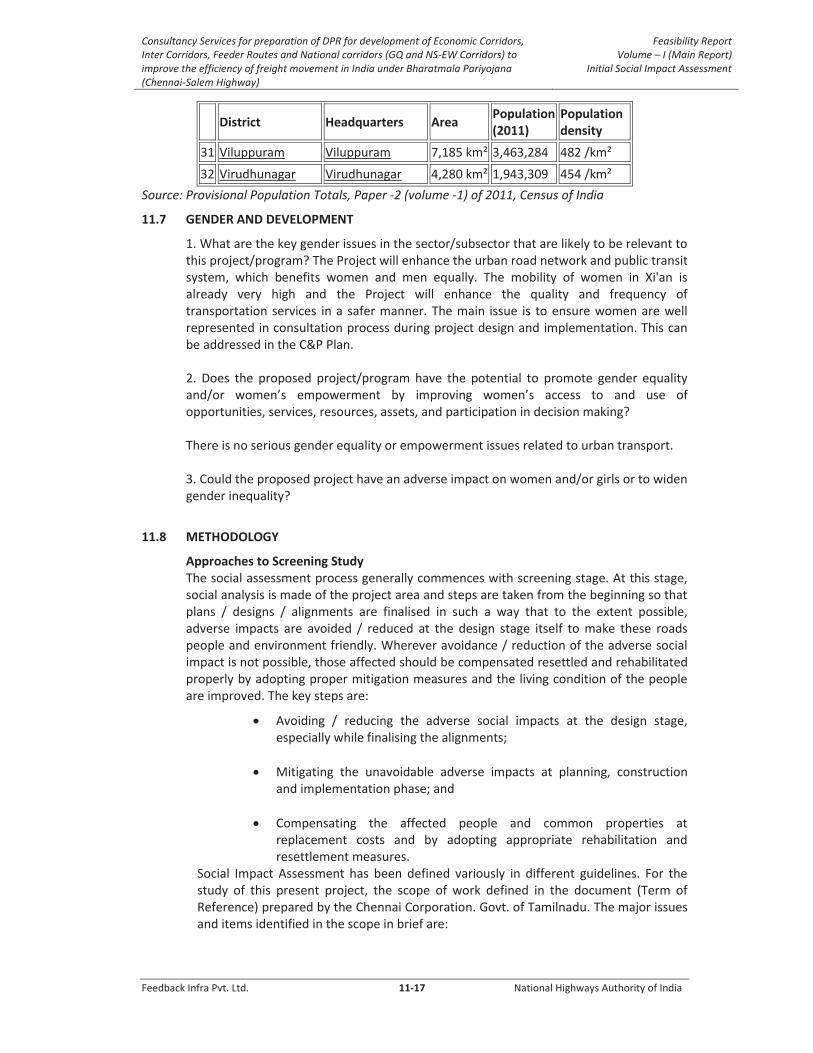
Consultancy Services for preparation of DPR for development of Economic Corridors, Inter Corridors, Feeder Routes and National corridors (GQ and NS-EW Corridors) to improve the efficiency of freight movement in India under Bharatmala Pariyojana (Chennai-Salem Highway)
Feasibility Report Volume – I (Main Report)
Initial Social Impact Assessment
Feedback Infra Pvt. Ltd. 11-17 National Highways Authority of India
District Headquarters Area
Population (2011)
Population density
31 Viluppuram Viluppuram 7,185 km² 3,463,284 482 /km²
32 Virudhunagar Virudhunagar 4,280 km² 1,943,309 454 /km²
Source: Provisional Population Totals, Paper -2 (volume -1) of 2011, Census of India
11.7 GENDER AND DEVELOPMENT
1. What are the key gender issues in the sector/subsector that are likely to be relevant to this project/program? The Project will enhance the urban road network and public transit system, which benefits women and men equally. The mobility of women in Xi'an is already very high and the Project will enhance the quality and frequency of transportation services in a safer manner. The main issue is to ensure women are well represented in consultation process during project design and implementation. This can be addressed in the C&P Plan.
2. Does the proposed project/program have the potential to promote gender equality and/or women’s empowerment by improving women’s access to and use of opportunities, services, resources, assets, and participation in decision making? There is no serious gender equality or empowerment issues related to urban transport. 3. Could the proposed project have an adverse impact on women and/or girls or to widen gender inequality?
11.8 METHODOLOGY
Approaches to Screening Study The social assessment process generally commences with screening stage. At this stage, social analysis is made of the project area and steps are taken from the beginning so that plans / designs / alignments are finalised in such a way that to the extent possible, adverse impacts are avoided / reduced at the design stage itself to make these roads people and environment friendly. Wherever avoidance / reduction of the adverse social impact is not possible, those affected should be compensated resettled and rehabilitated properly by adopting proper mitigation measures and the living condition of the people are improved. The key steps are:
Avoiding / reducing the adverse social impacts at the design stage, especially while finalising the alignments;
Mitigating the unavoidable adverse impacts at planning, construction and implementation phase; and
Compensating the affected people and common properties at replacement costs and by adopting appropriate rehabilitation and resettlement measures.
Social Impact Assessment has been defined variously in different guidelines. For the study of this present project, the scope of work defined in the document (Term of Reference) prepared by the Chennai Corporation. Govt. of Tamilnadu. The major issues and items identified in the scope in brief are:

Consultancy Services for preparation of DPR for development of Economic Corridors, Inter Corridors, Feeder Routes and National corridors (GQ and NS-EW Corridors) to improve the efficiency of freight movement in India under Bharatmala Pariyojana (Chennai-Salem Highway)
Feasibility Report Volume – I (Main Report)
Initial Social Impact Assessment
Feedback Infra Pvt. Ltd. 11-18 National Highways Authority of India
Study of Background information on project and related policy and legal issues;
Collection of data from secondary sources;
Reconnaissance survey of the project impact zone, and
Analysis of data and Screening exercise
11.8.1 Collection of Data from Secondary Sources
Data from secondary sources were collected on following aspects:
Demographic profile of the area;
Social profile of the area;
Economic profile of the area; and
Land use pattern
Table 11-6: Type of Information and Sources
Information Source
Demography District Census Handbook, Govt. Of India
Land use District Census Handbook, Govt. Of India
Social profile of the area NATMO maps, Govt. Of India
Economic profile of the area Census Govt. of Tamilnadu
District Profile Govt. of Tamilnadu websites
11.8.2 Reconnaissance Survey of the Project Impact Zone
The study team paid visits extensively throughout the project corridor to identify, carry out a reconnaissance survey or rapid screening survey and to collect social features along the road and other primary data collected by using structured and semi-structured questionnaires. The data about land use pattern, type of construction of the structures, number of structures, trade and economic activities along the road and community and religious characteristics are recorded through the primary survey.
The consultations were carried out with both individuals and groups during the screening survey involving local people, health workers, and administrators include local leaders & PRIs.
Public consultation during the feasibility stage of this project preparation involved information dissemination i.e. informing the people about the details of the project and to invite their suggestion and comments prior to the finalization of the engineering design. The consultations were carried out with both individuals and groups during the screening survey involving local people, health workers and administrators. During consultation the issue regarding to HIV/AIDS have been discussed with truck drivers and local people like awareness about disease, medium of propagation, information, preventive measures, and use of contraceptives. The presence of infected person, line of treatment, measure precautions and presence of commercial sex worker in the area have been asked during the consultation.

Consultancy Services for preparation of DPR for development of Economic Corridors, Inter Corridors, Feeder Routes and National corridors (GQ and NS-EW Corridors) to improve the efficiency of freight movement in India under Bharatmala Pariyojana (Chennai-Salem Highway)
Feasibility Report Volume – I (Main Report)
Initial Social Impact Assessment
Feedback Infra Pvt. Ltd. 11-19 National Highways Authority of India
11.8.3 Analysis of Data and Screening Exercise
The data collected through the above steps were compiled to develop the social scenario of the project area and the sensitive components within that. The full road length and COI were put under screening. The collected data were analysed, tabulated and summarised and accordingly social features of the project road are assessed. The analysis will indicate the feasibility of the project and will help in suggesting various socially viable alignment options for engineering design and also come out with the mitigation measures to make the project socio-economically acceptable.
11.8.4 Preliminary Social Assessment & Baseline Scenario
The proposed up gradation will be mainly along the existing alignment.
A sample socio economic inventory for the entire project stretch was carried out. Table 11-7 gives the details of structures along the project road. Private structures including both residential and commercial form the bulk of the structures along the project road. There are ab1out 1171 structures on the proposed project corridor out of Residential-455, Commercial-686 and Religious-30.
Table 11-7: Total Structure belongs to the project road
S.No. Type of Structures Nos
1 Residential 455
2 Commercial 686
3 Religious 30
Total 1171
11.8.5 Impact of Land Acquisition
Brief analysis of impacts of land acquisition can be subdivided into the following subheads.
Loss of Land Main Alignment The total land to be acquired are 2791 Hectare consists of agricultural land, community land under Chennai Corporation/ Panchayats, various structures of public interest, residential structures and residential plots, public utilities and others.
Table 11-8: Land Acquisition Required
SL. No.
District Length (kms) Average Circle Rates (Rs. in
Lacs / Hectare)
Proposed ROW - 70/90m
Area (Hectare)
Cost (Rs. in Crores)
1 Kanchipuram 44 75 345 259
2 Thiruvanamalai 137 7 1229 86
3 Krishnagiri 5 9 45 4
4 Dharmapuri 43 9 298 27
5 Salem 49 25 406 102
6 Additional area at trumpet locations 232 58
Total 277 2554 535

Consultancy Services for preparation of DPR for development of Economic Corridors, Inter Corridors, Feeder Routes and National corridors (GQ and NS-EW Corridors) to improve the efficiency of freight movement in India under Bharatmala Pariyojana (Chennai-Salem Highway)
Feasibility Report Volume – I (Main Report)
Initial Social Impact Assessment
Feedback Infra Pvt. Ltd. 11-20 National Highways Authority of India
SL. No.
District Length (kms) Average Circle Rates (Rs. in
Lacs / Hectare)
Proposed ROW - 70/90m
Area (Hectare)
Cost (Rs. in Crores)
Four times of above cost as compensation to be paid to the farmers/ land owners 2140
Spur Roads
Table 11-9: Land Acquisition Required
SL. No.
Proposed ROW - 60m (Existing ROW - 18m - Approx)
Spur Road Area
(Hectare) Average Circle Rates (Rs.
in Lacs / Hectare) Cost (Rs. in Crores)
1 Kanchipuram - Chengalpet 138.16 75 104
2 Chetpet 22.84 7 2
3 Tiruvannamalai 75.52 7 5
237 111
Four times of above cost as compensation to be paid to the farmers/ land owners 442
Loss of Public Infrastructure Construction of road would entail shifting of public infrastructure. These include places structures of worships, some roads, piped water lines etc. These will be relocated at new sites as per the community’s requirement, subject to allotment of land by authorities before actual demolition begins.
Loss of Income Those losing agricultural lands will lose income opportunity. However, this will be a permanent setback, unless provided with adequate compensation amount and / or training facilities for new trades with sufficient seed capital.
11.8.6 Increase in Employment Opportunities
Commencement of road project will benefit the community through generation of direct and indirect employment within the project areas due to construction activity, minor repairs and maintenance works. The project will require a good number of unskilled workers and they can form a cooperative, which will supply labourers to contractors whenever required. Up gradation of roads and community development programs in the project plan will benefit the communities at large.
11.9 PUBLIC CONSULTATION
11.9.1 Introduction
As part of the project preparation, to ensure that the community support is obtained and the project supports the felt needs of the people; public consultations are carried out as an integral component. A continuous involvement of the stakeholders and the affected community are thus obtained. The feedback on the consultation sessions leads to substantial inputs into the project preparation – including influencing the design part. Consultation involves soliciting people’s views on proposed actions and engaging them in
Consultancy Services for preparation of DPR for development of Economic Corridors, Inter Corridors, Feeder Routes and National corridors (GQ and NS-EW Corridors) to improve the efficiency of freight movement in India under Bharatmala Pariyojana (Chennai-Salem Highway)
Feasibility Report Volume – I (Main Report)
Initial Social Impact Assessment
Feedback Infra Pvt. Ltd. 11-21 National Highways Authority of India
a dialogue. It is a two-way information flow, from project authorities to people and, from people to project authorities. While decision making authority would be retained by the project authority, interaction with people and eliciting feedback allows affected populations to influence the decision making process by raising issues that should be considered in designing, mitigation, monitoring and management plans and the analysis of alternatives. The objectives of consultation sessions, the procedure adopted and the outputs of the consultation conducted have been briefly described in the following sections.
11.9.2 Need
As part of the Environmental and social assessments of the project, the views of affected groups including NGOs and the affected groups (particularly those with potentially significant impacts) are taken into account through the public consultation process. People affected by the project are those, living and working along the corridor, and include residents, Commercial artisians workers etc.
11.9.3 Objectives
The main objective of the consultation process is to minimise negative impacts of the project and to maximise the benefits from the project to the local populace. The objectives of public consultation as part of this project are:
Promote public awareness and improve understanding of the potential impacts of proposed projects
Identify alternative sites or designs, and mitigation measures
Solicit the views of affected communities / individuals on environmental and social problems
Improve environmental and social soundness
Clarify values and trade-offs associated with the different alternatives
Identify contentious local issues which might jeopardise the implementation of the project and
Create accountability and sense of local ownership during project implementation.
11.9.4 Process of Consultation
Public consultation conducted at the screening stage shall play an important role in determining the level and extent of consultation that has to be taken up during the project preparation stage. Public consultations for this project shall be done at three levels as follows:
Local level (village level) involving villagers whose properties, land, etc are being affected by the project;
District level consultations involving various district level governmental departments and NGOs, Chennai Corporation officials; and
Institutional level consultations with Forest Department, State Pollution Control Board etc.
Public Consultation was done using various tools including, interviews with government officials and questionnaire-based information with stakeholders etc. A reconnaissance survey was carried out informally drawing people into dialogue to obtain an overview of likely impacts and concerns of the community. These informal discussion and consultations were held at several locations along the project road alignment, covering settlements close to proposed alignment, thus covering the general public & property owners on the proposed RoW.

Consultancy Services for preparation of DPR for development of Economic Corridors, Inter Corridors, Feeder Routes and National corridors (GQ and NS-EW Corridors) to improve the efficiency of freight movement in India under Bharatmala Pariyojana (Chennai-Salem Highway)
Feasibility Report Volume – I (Main Report)
Initial Social Impact Assessment
Feedback Infra Pvt. Ltd. 11-22 National Highways Authority of India
A checklist of questions was kept ready and responses were elicited from people and guidelines were issued to field assistants for the purpose. The questions were kept simple for people to comprehend and notes were made for the responses and viewpoints presented by the people.
11.9.5 Identification of issues
Based on the community consultation the key social issues identified were:
Employment opportunity during civil works
Location of labour camp and hot mix plant sites
Location of dumping sites
Health issues, such as water borne diseases, HIV & STD
Safety issues
Impact on property and land acquisition
Resettlement Options
The consultation programme has been undertaken for both Social screening process- Many people were very positive about the project and during the discussions, many benefits were identified.
Better access to the facilities
Organised market facilities
Increased customers
Less travel time
The people were insisting that proper compensation has to be offered in case of relocation and prefer to relocate in their existing neighbourhood.
The safety of school children was another popular issue raised during consultation. As the schools are often located near highways travelling at high speeds through villages will have an impact on the safety of school students. Similarly in sharp curves, accidents occur frequently.
Some of the individuals asked whether the project has the provision for more bus stops.
Many people worried, whether the work will be taken up due to political conflicts. The construction work should be taken up on urgent basis, rather than conducting surveys again and again.
11.10 MITIGATION AND ENHANCEMENT MEASURES
Most of the mitigation measures can be incorporated as good engineering practice during the design phase itself thus ensuring the mainstreaming of environmental concerns early in the project. Adherence to design drawing and specifications will reduce; to within acceptable levels, the adverse impacts during construction.
11.10.1 Suggested Mitigation Measures
The following considerations may be kept in view at the design stage:
Construction and Up gradation of approach roads to the highway
Up gradation of the existing road
Ambulance service to transport serious cases to district hospital in case of accidents
Consultancy Services for preparation of DPR for development of Economic Corridors, Inter Corridors, Feeder Routes and National corridors (GQ and NS-EW Corridors) to improve the efficiency of freight movement in India under Bharatmala Pariyojana (Chennai-Salem Highway)
Feasibility Report Volume – I (Main Report)
Initial Social Impact Assessment
Feedback Infra Pvt. Ltd. 11-23 National Highways Authority of India
11.11 POLICY, LEGAL AND ADMINISTRATIVE FRAMEWORK
Government of Tamil Nadu is currently implementing the World Bank supported Third
Tamil Nadu Urban Development program (TNUDP-III) to improve the delivery of urban
services. Improvement in the Traffic and Transportation Sector within Chennai
Metropolitan Area (CMA) is one of the Urban Investment components covered under the
above program. This component is coordinated by Chennai Metropolitan Development
Authority (CMDA) and implemented by Department of Highways (DoH), Government of
Tamil Nadu.Tamil Nadu Urban Infrastructure Financial Services Ltd. (TNUIFSL) Chennai
are the fund Managers. To implement this component (Road component only) additional
land parcels totalling about 76 hectares, of which 36 ha is private land belonging to 2000
land owners is required. In addition, another 1270 non-title holder likely is affected by
this project.
11.11.1 Broad Principles
The broad principles of the R&R are as below:
The negative impact on persons affected by the project would be avoided or minimized.
Where the negative impacts are unavoidable, the affected persons will be assisted in improving or regaining their standard of living. Vulnerable groups will be identified and assisted to improving their standard of living.
All information related to resettlement preparation and implementation will be disclosed to all concerned, and people’s participation is being ensured in planning and implementation of the project.
Before taking possession of the acquired lands and properties, compensation and R&R assistance will be made in accordance with this policy.
There would be no / or minimum adverse social, economic and environmental effects of displacement on the host communities and specific measures would be provided in the Resettlement Plan.
Broad entitlement framework of different categories of project-affected people has been assessed and is given in the entitlement matrix. Provisions will be kept in the budget for those who were not present at the time of enumeration. However, anyone moving into the project area after the cut-off date will not be entitled to assistance.
Appropriate grievance redress mechanism will be established at the district level to ensure speedy resolution of disputes.
All activities related to resettlement planning, implementation, and monitoring would ensure involvement of women. Efforts will also be made to ensure that vulnerable groups are included.
All consultations with APs will be documented. Summary results are appended to the RP. Consultations will continue during the implementation of resettlement and rehabilitation works, and
The Resettlement Plan includes a fully itemized budget and an implementation schedule linked to the civil works contract.

Consultancy Services for preparation of DPR for development of Economic Corridors, Inter Corridors, Feeder Routes and National corridors (GQ and NS-EW Corridors) to improve the efficiency of freight movement in India under Bharatmala Pariyojana (Chennai-Salem Highway)
Feasibility Report Volume – I (Main Report)
Initial Social Impact Assessment
Feedback Infra Pvt. Ltd. 11-24 National Highways Authority of India
Some of the salient features of the National Rehabilitation and Resettlement Policy, 2007 are listed below;
The benefits to be offered to the affected families include; land-for-land, to the extent
Government land would be available in the resettlement areas; preference for employment in the project to at least one person from each nuclear family subject to the availability of vacancies and suitability of the displaced person; training and capacity building for taking up suitable jobs and for self-employment; scholarships for education of the eligible persons from the affected families; preference to groups of cooperatives of the affected persons in the allotment of contracts and other economic opportunities in or around the project site; wage employment to the willing affected persons in the construction work in the project; housing benefits including houses to the landless affected families in both rural and urban areas; and other benefits.
Financial support to the affected families for construction of cattle sheds, shops, and working sheds; transportation costs, temporary and transitional accommodation, and comprehensive infrastructural facilities and amenities in the resettlement area including education, health care, drinking water, roads, electricity, sanitation, religious activities, cattle grazing, and other community resources, etc.
A special provision has been made for providing life-time monthly pension to the vulnerable persons, such as the disabled, destitute, orphans, widows, unmarried girls, abandoned women, or persons above 50 years of age (who are not provided or cannot immediately be provided with alternative livelihood).
Special provision for the STs and SCs include preference in land-for-land for STs followed by SCs; a Tribal Development Plan which will also include a program for development for alternate fuel which will also include a program for development for alternate fuel and non-timber forest produce resources, consultations with Gram Sabhas and Tribal Advisory Councils, protection of fishing rights, land free of- cost for community and religious gatherings, continuation of reservation benefits in resettlement areas, etc.
A strong grievance redressal mechanism has been prescribed, which includes standing R&R Committees at the district level, R&R Committees at the project level, and an Ombudsman duly empowered in this regard. The R&R Committees shall have representatives from the affected families including women, voluntary organizations, Panchayats, local elected representatives, etc. Provision ahs also been made for post-implementation social audits of the rehabilitation and resettlement schemes and plans.
For effective monitoring of the progress of implementation of R&R plans, provisions have been made for a National Monitoring Committee, a National Monitoring Cell, mandatory information sharing by the States and UTs with the National Monitoring Cell, and Oversight Committees in the Ministries/Departments concerned for each major project, etc.
For ensuring transparency, provision has been made for mandatory dissemination of information on displacement, rehabilitation and resettlement, with names of the displaced persons and details of the rehabilitation packages. Such information shall be placed in the public
Consultancy Services for preparation of DPR for development of Economic Corridors, Inter Corridors, Feeder Routes and National corridors (GQ and NS-EW Corridors) to improve the efficiency of freight movement in India under Bharatmala Pariyojana (Chennai-Salem Highway)
Feasibility Report Volume – I (Main Report)
Initial Social Impact Assessment
Feedback Infra Pvt. Ltd. 11-25 National Highways Authority of India
domain on the Internet as well as shared with the concerned Gram Sabhas and Panchayats, etc. by the project authorities.
A National Rehabilitation Commission shall be set up by the Central Government, which will be duly empowered to exercise independent oversight over the rehabilitation and resettlement of the affected families.
Under the new Policy, no project involving displacement of families beyond defined thresholds2 can be undertaken without a detailed Social Impact Assessment, which among other things, shall also take into account the impact that the project will have on public and community properties, assets and infrastructure; and the concerned Government shall have to specify that the ameliorative measures for addressing the said impact, may not be less than what is provided under any scheme or program of the Central or State Government in operation in the area. The SIA report shall be examined by an independent multidisciplinary expert group, which will also include social science and rehabilitation experts. Following the conditions of the SIA clearance shall be mandatory for all projects displacing people beyond the defined thresholds.
The affected communities shall be duly informed and consulted at each stage, including public hearings in the affected areas for social impact assessment, wide dissemination of the details of the survey to be conducted for R&R plan or scheme, consultations with the Gram Sabhas and public hearings in areas not having Gram Sabhas, consultations with the affected families including women, NGOs, Panchayats, and local elected representatives, among others.
The Policy also provides that land acquired for a public purpose cannot be transferred to any other purpose but a public purpose, and that too, only with prior approval of the Government. If land acquired for a public purpose remains un-utilized for the purpose for five years from the date of taking over the possession, the same shall revert to the Government concerned. When land acquired is transferred for a consideration, eighty per cent of any net unearned income so accruing to the transferor, shall be shared with the persons from whom the lands were acquired, or their heirs, in proportion to the value of the lands acquired.
The entitled persons shall have the option to take up to twenty per cent of their rehabilitation grant and compensation amount in the form of shares, if the Requiring Body is a company authorized to issue shares and debentures; with prior approval of the Government, this proportion can be as high as fifty per cent of the rehabilitation grant and compensation amount.
11.11.2 Land Acquisition Act, 1894
In India, compensation for land acquisition and resettlement assistance for project-affected people are governed by the Land Acquisition Act (1894), which has been amended from time to time.
The Act covers only legal titleholders and provides for (i) market value of the land; (ii) additional amount for trees, crops, houses or other immovable property; (iii) damage due to severing of land, residence, place of business.
Followings are the limitations of the LA Act:
The Act does not include compensation for non-titleholders;

Consultancy Services for preparation of DPR for development of Economic Corridors, Inter Corridors, Feeder Routes and National corridors (GQ and NS-EW Corridors) to improve the efficiency of freight movement in India under Bharatmala Pariyojana (Chennai-Salem Highway)
Feasibility Report Volume – I (Main Report)
Initial Social Impact Assessment
Feedback Infra Pvt. Ltd. 11-26 National Highways Authority of India
It provides compensation for acquired properties and structures only;
It does not recognize loss of income due to the acquisition of commercial establishments and agricultural land;
It does not provide economic rehabilitation to vulnerable categories.
11.11.3 Project Specific Resettlement framework
However, in this instance a project-specific resettlement framework will be prepared consistent with the existing norms and guidelines of the state government and WB policy on involuntary resettlement to cover losses identified in this project. This framework will reflect the borrowers land acquisition laws / regulations, state policies on resettlement and to some extent WB’s policy on involuntary resettlement and other social safeguard guidelines. It will stipulate eligibility and provisions for all types of losses (land, crops / trees, structures, business / employment and workdays / wages). Where land-for-land is not a feasible option, APs will be compensated at full replacement cost. Affected families compensated by the Competent Authority, according to the LA Act 1894, for lost assets, will also receive additional assistance such as shifting allowance, compensation for loss of workdays / income due to dislocation.
11.11.4 Land Acquisition- Mitigation Measures
Based on the survey conducted and information on ROW obtained so far, the land required for widening of the existing road and acquisition to provide a 60m wide ROW including bypasses for the project. Due to the ribbon development almost all throughout the area, care shall be taken to minimise land acquisition. In order to mitigate the ensuing negative impacts of the land acquisition a Resettlement and Rehabilitation (R&R) policy shall be prepared based on the Tamilnadu R&R policy. The salient features of the mitigation measures are:
Where displacement is unavoidable, those displaced will have their living standard improved.
PAPs will be compensated, at replacement cost, for assets lost. Adequate social and physical infrastructure will be provided.
PAPs and lost community would be encouraged to participate in the implementation of RAP.
An Entitlement Policy shall be worked out as part of the RAP and will deliver a comprehensive package of compensation and assistance to entitled persons, families groups suffering losses as a result of the project.
11.11.5 RESETTLEMENT FRAMEWORK PRINCIPLES AND ENTITLEMENT MATRIX
Based on the above analysis of government provisions and the policy following k e y resettlement principles, definitions and Entitlement Matrix have been adopted for the Project.
Key Resettlement Principles
(i) land acquisition, and other involuntary resettlement impacts will be avoided or minimized exploring all viable alternative sub-project designs;
(ii) where unavoidable, time-bound resettlement plans (RPs) will be prepared and APs will be assisted in improving or at least regaining their pre-

Consultancy Services for preparation of DPR for development of Economic Corridors, Inter Corridors, Feeder Routes and National corridors (GQ and NS-EW Corridors) to improve the efficiency of freight movement in India under Bharatmala Pariyojana (Chennai-Salem Highway)
Feasibility Report Volume – I (Main Report)
Initial Social Impact Assessment
Feedback Infra Pvt. Ltd. 11-27 National Highways Authority of India
program standard of living; (iii) consultation with APs on compensation, disclosure of resettlement
information to APs, and participation of APs in planning and implementing sub-projects will be ensured;
(iv) vulnerable and severely affected households will be provided special assistance;
(v) payment of compensation to APs including non-titled persons (e.g., informal dwellers/squatters, and encroachers) for acquired assets at replacement rates;
(vi) payment of compensation and resettlement assistance prior to the contractor taking physical acquisition of the land and prior to the commencement of any construction activities;
(vii) provision of income restoration and rehabilitation; (viii) Establishment of appropriate grievance redress mechanisms.
TERMS AND DEFINITIONS
The following definitions are used in the documents:
Cut-off Date: In the cases of land acquisition affecting legal titleholders, the cut-off date would be the date of issuing the publication of preliminary notification u/s 11(I) of RFCTLAR Act, 2013 & for the Non-Titleholders cutoff date would be the date of Census Survey.
Project Affected Person: Person who is affected in respect of his/her land including homestead land and structure thereon, trade and occupation due to construction of the project
Project Displaced Person: A displaced person is a person who is compelled to change his/her place of residence and/or work place or place of business, due to the project.
Projected Affected Family: Family includes a person, his or her spouse, minor children, minor brothers and minor sisters dependent on him. Provided that widows, divorcees and women deserted by families shall be considered separate families;
Explanation - An adult of either gender with or without spouse or children or dependents shall be considered as a separate family for the purpose of this Act.
Land Owner: Land owner includes any person -
Whose name is recorded as the owner of the land or building or part thereof, in the records of the authority concerned; or
Any person who is granted forest rights under the Scheduled Tribes and other Traditional Forest Dwellers (Recognition of Forest Rights) Act, 2006 or under any other law for the time being in force; or
Who is entitled to be granted Patta rights on the land under any law of the State including assigned lands; or any person who has been declared as such by an order of the court or Authority.
Marginal Farmers: Marginal farmer means a cultivator with an un-irrigated land holding up to one hectare or irrigated land holding up to one half hectare, or as may be defined by the concerned state government.
Small Farmer: Small farmer means a cultivator with an un-irrigated land holding up to two hectares or irrigated land holding up to one hectare, but more than the holding of a marginal farmer, or as may be defined by the concerned state government.

Consultancy Services for preparation of DPR for development of Economic Corridors, Inter Corridors, Feeder Routes and National corridors (GQ and NS-EW Corridors) to improve the efficiency of freight movement in India under Bharatmala Pariyojana (Chennai-Salem Highway)
Feasibility Report Volume – I (Main Report)
Initial Social Impact Assessment
Feedback Infra Pvt. Ltd. 11-28 National Highways Authority of India
Encroacher: A person who has trespassed Government/ private/community Land, adjacent to his or her land or asset to which he/she is not entitled and who derives his/her livelihood and housing there from prior to the cutoff date.
Squatter: A squatter is a person who has settled on publicly owned land for housing or livelihood without permission or who has been occupying publicly owned building without authority prior to the cutoff date.
Landless/Agriculture Labour: A person who does not hold any agriculture land and has been deriving his main income by working on the lands of others as sub-tenant or as an agriculture labour prior to the cut-off date.
Below Poverty Line: A household, whose annual income from all sources is less than the designed sum as fixed by the planning commission of India, will be considered to be below poverty line (BPL).
Vulnerable Person: The Vulnerable group may include but not be limited to the following:
Those people falling under Below Poverty line category as defined by the state government.
Member of Scheduled caste/tribe community community.
Women Headed households.
Senior citizen-person above the age of 60 years. Project Affected Persons (PAPs), any persons who have economic interests or residence within the project impact corridor and who may be adversely affected directly by the project. PAP include those losing commercial or residential structures in whole or part, those losing agricultural land or homestead land in whole or part, and those losing income sources as a result of project action. PAPs would be of two broad categories, ‘PAPs with Major Impact’ and ‘PAPs with Minor Impact’. Major Impact (Fully): those properties where the major part of the structure/land is affected and becomes untenable and the affected party is unable to live/do business in the unaffected portion of the property, OR, 10% or more portion of the property is affected. Minor Impact (Partial): all other impacts other than major impact will be treated as minor impacts, OR, those properties where a part of the structure/land is acquired and the remaining portion is intact and the affected party can continue to live/do business in the unaffected portion of the property.
Entitlement Matrix
All persons affected by the project and meeting the cut-off date requirements will be entitled to a combination of compensation packages and resettlement assistance depending on the nature of ownership rights on lost assets and scope of the impacts:
a) Compensation for the loss of land ,crops/trees at their replacement cost; b) Compensation for structures (residential/ commercial) and other immovable assets
at their Replacement cost; c) Assistance in lieu of the loss of business/ wage income and income restoration
assistance; d) Assistance for shifting and provision for the relocation site (if required), and e) Rebuilding and/ or restoration of community resources/facilities. f) Additional Support to Vulnerable Families
An Entitlement Matrix, delineated in Table 8.21 has been developed to summarize entitlements.
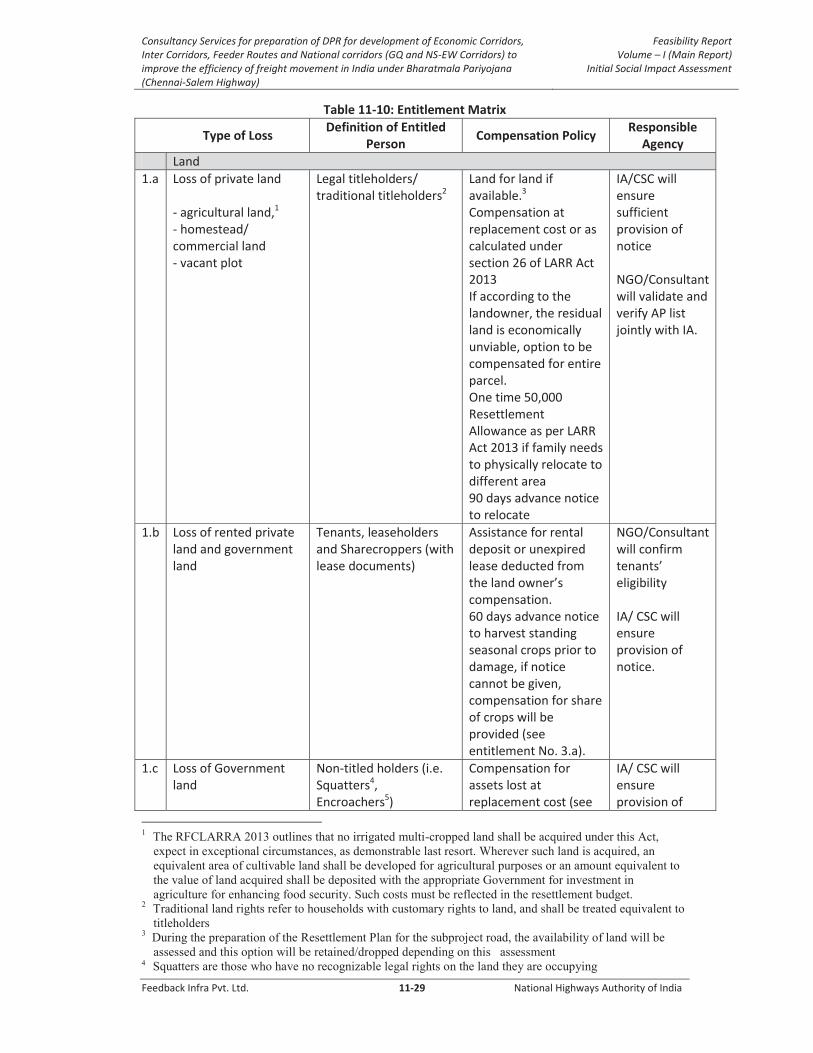
Consultancy Services for preparation of DPR for development of Economic Corridors, Inter Corridors, Feeder Routes and National corridors (GQ and NS-EW Corridors) to improve the efficiency of freight movement in India under Bharatmala Pariyojana (Chennai-Salem Highway)
Feasibility Report Volume – I (Main Report)
Initial Social Impact Assessment
Feedback Infra Pvt. Ltd. 11-29 National Highways Authority of India
Table 11-10: Entitlement Matrix
Type of Loss Definition of Entitled
Person Compensation Policy
Responsible Agency
Land
1.a Loss of private land - agricultural land,1 - homestead/ commercial land - vacant plot
Legal titleholders/ traditional titleholders2
Land for land if available.3 Compensation at replacement cost or as calculated under section 26 of LARR Act 2013 If according to the landowner, the residual land is economically unviable, option to be compensated for entire parcel. One time 50,000 Resettlement Allowance as per LARR Act 2013 if family needs to physically relocate to different area 90 days advance notice to relocate
IA/CSC will ensure sufficient provision of notice NGO/Consultant will validate and verify AP list jointly with IA.
1.b Loss of rented private land and government land
Tenants, leaseholders and Sharecroppers (with lease documents)
Assistance for rental deposit or unexpired lease deducted from the land owner’s compensation. 60 days advance notice to harvest standing seasonal crops prior to damage, if notice cannot be given, compensation for share of crops will be provided (see entitlement No. 3.a).
NGO/Consultant will confirm tenants’ eligibility IA/ CSC will ensure provision of notice.
1.c Loss of Government land
Non-titled holders (i.e. Squatters4, Encroachers5)
Compensation for assets lost at replacement cost (see
IA/ CSC will ensure provision of

Consultancy Services for preparation of DPR for development of Economic Corridors, Inter Corridors, Feeder Routes and National corridors (GQ and NS-EW Corridors) to improve the efficiency of freight movement in India under Bharatmala Pariyojana (Chennai-Salem Highway)
Feasibility Report Volume – I (Main Report)
Initial Social Impact Assessment
Feedback Infra Pvt. Ltd. 11-30 National Highways Authority of India
Type of Loss Definition of Entitled
Person Compensation Policy
Responsible Agency
EM 2.a). 90 days advance notice to shift 60 days advance notice to harvest standing seasonal crops prior to damage, if notice cannot given, compensation for share of crops will be provided (see entitlement No. 3.a).
notice. NGO/Consultant will confirm affected household’s eligibility
1.d Temporary loss of land Legal titleholders Rent at market value for the period of occupation. Restoration of land to previous or better quality Location of construction camps will be fixed by contractors in consultation with Government and local community.
Contractor negotiates amount with landowner –supervised by CSC. IA/CSC ensures compensation paid prior to take-over. Contractor responsible for site restoration.
2 Structures
2.a Loss of residential, commercial structures and other assets
Legal titleholders Encroachers and squatters
If partially affected6: Replacement cost of the affected part or assets with right to salvage materials. If remainder of the structure is unviable, the owner has the option to claim compensation for entire structure (see below). If Residential/Commercial structure fully affected: Replacement Cost of the structure If relocating outside
NGO/Consultant will confirm titleholder’s eligibility IA/ CSC will ensure provision of notice.

Consultancy Services for preparation of DPR for development of Economic Corridors, Inter Corridors, Feeder Routes and National corridors (GQ and NS-EW Corridors) to improve the efficiency of freight movement in India under Bharatmala Pariyojana (Chennai-Salem Highway)
Feasibility Report Volume – I (Main Report)
Initial Social Impact Assessment
Feedback Infra Pvt. Ltd. 11-31 National Highways Authority of India
Type of Loss Definition of Entitled
Person Compensation Policy
Responsible Agency
RoW, Resettlement Allowance of Rs. 50,000 per family as per LARR Act 2013.7 Monthly Subsistence Allowance of Rs. 3,000 for one year (total Rs. 36,000) for families having to relocate their homesteads as per LARR Act 2013.8 Shifting allowance of 10% of replacement cost of structure up to a maximum of Rs 50,000, as per the LARR Act 2013 Right to salvage materials from structure and other assets with no deductions from replacement cost. 90 day notice to vacate structure.
2.b Loss of residential/commercial structure and other assets
Tenants (without documentation) and leaseholders
Replacement cost of part/whole of structure – if latter has been constructed by the tenant/leaseholder with right to salvage material Compensation for rental deposit or unexpired lease (only for AP with legitimate lease documentation). This will be deducted from the compensation amount of the structure owner. Lump-sum equivalent to two month lease to support search of alternative housing.
NGO/Consultant will confirm tenants’ eligibility IA/ CSC will ensure provision of notice.
2.c Loss and temporary Titled and non-titled Replacement or IA/ CSC will
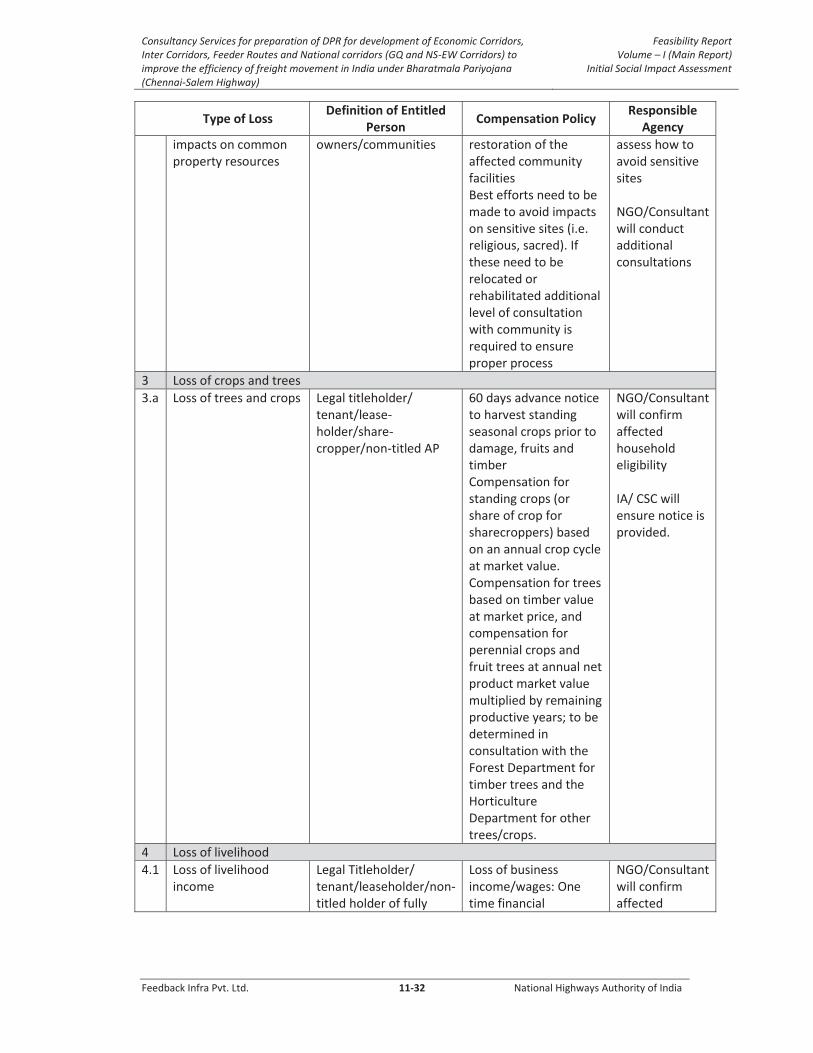
Consultancy Services for preparation of DPR for development of Economic Corridors, Inter Corridors, Feeder Routes and National corridors (GQ and NS-EW Corridors) to improve the efficiency of freight movement in India under Bharatmala Pariyojana (Chennai-Salem Highway)
Feasibility Report Volume – I (Main Report)
Initial Social Impact Assessment
Feedback Infra Pvt. Ltd. 11-32 National Highways Authority of India
Type of Loss Definition of Entitled
Person Compensation Policy
Responsible Agency
impacts on common property resources
owners/communities restoration of the affected community facilities Best efforts need to be made to avoid impacts on sensitive sites (i.e. religious, sacred). If these need to be relocated or rehabilitated additional level of consultation with community is required to ensure proper process
assess how to avoid sensitive sites NGO/Consultant will conduct additional consultations
3 Loss of crops and trees
3.a Loss of trees and crops Legal titleholder/ tenant/lease-holder/share-cropper/non-titled AP
60 days advance notice to harvest standing seasonal crops prior to damage, fruits and timber Compensation for standing crops (or share of crop for sharecroppers) based on an annual crop cycle at market value. Compensation for trees based on timber value at market price, and compensation for perennial crops and fruit trees at annual net product market value multiplied by remaining productive years; to be determined in consultation with the Forest Department for timber trees and the Horticulture Department for other trees/crops.
NGO/Consultant will confirm affected household eligibility IA/ CSC will ensure notice is provided.
4 Loss of livelihood
4.1 Loss of livelihood income
Legal Titleholder/ tenant/leaseholder/non-titled holder of fully
Loss of business income/wages: One time financial
NGO/Consultant will confirm affected
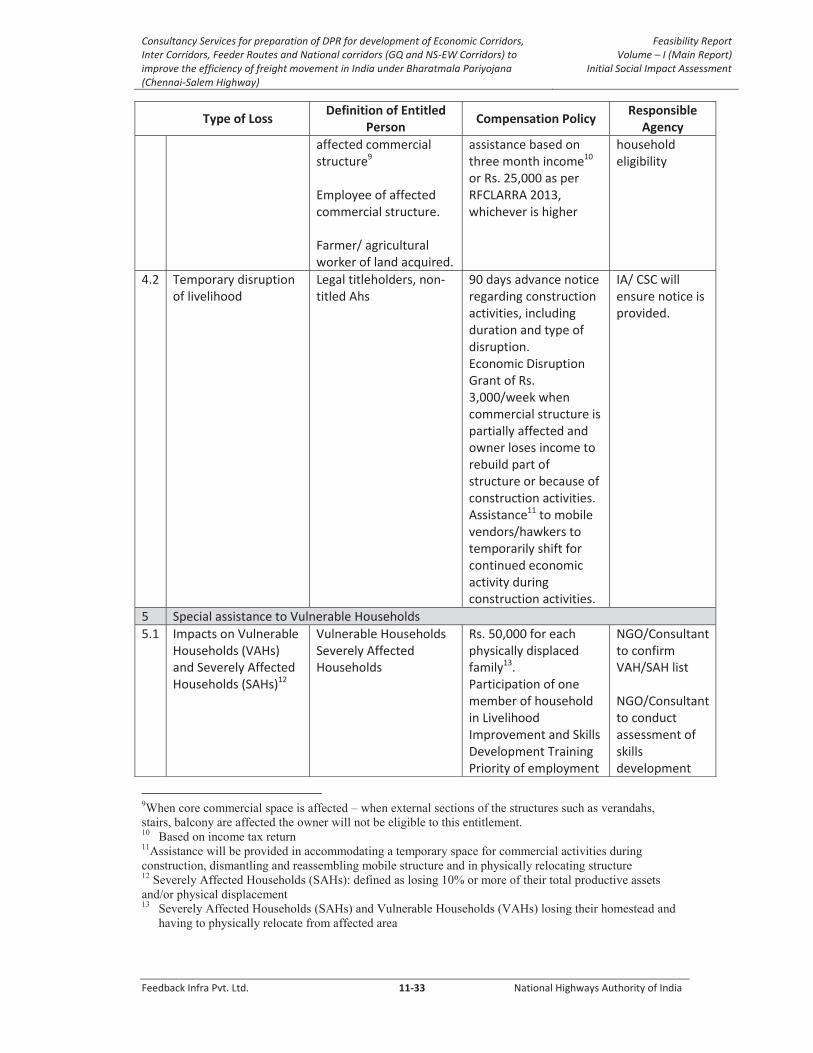
Consultancy Services for preparation of DPR for development of Economic Corridors, Inter Corridors, Feeder Routes and National corridors (GQ and NS-EW Corridors) to improve the efficiency of freight movement in India under Bharatmala Pariyojana (Chennai-Salem Highway)
Feasibility Report Volume – I (Main Report)
Initial Social Impact Assessment
Feedback Infra Pvt. Ltd. 11-33 National Highways Authority of India
Type of Loss Definition of Entitled
Person Compensation Policy
Responsible Agency
affected commercial structure9 Employee of affected commercial structure. Farmer/ agricultural worker of land acquired.
assistance based on three month income10 or Rs. 25,000 as per RFCLARRA 2013, whichever is higher
household eligibility
4.2 Temporary disruption of livelihood
Legal titleholders, non-titled Ahs
90 days advance notice regarding construction activities, including duration and type of disruption. Economic Disruption Grant of Rs. 3,000/week when commercial structure is partially affected and owner loses income to rebuild part of structure or because of construction activities. Assistance11 to mobile vendors/hawkers to temporarily shift for continued economic activity during construction activities.
IA/ CSC will ensure notice is provided.
5 Special assistance to Vulnerable Households
5.1 Impacts on Vulnerable Households (VAHs) and Severely Affected Households (SAHs)12
Vulnerable Households Severely Affected Households
Rs. 50,000 for each physically displaced family13. Participation of one member of household in Livelihood Improvement and Skills Development Training Priority of employment
NGO/Consultant to confirm VAH/SAH list NGO/Consultant to conduct assessment of skills development
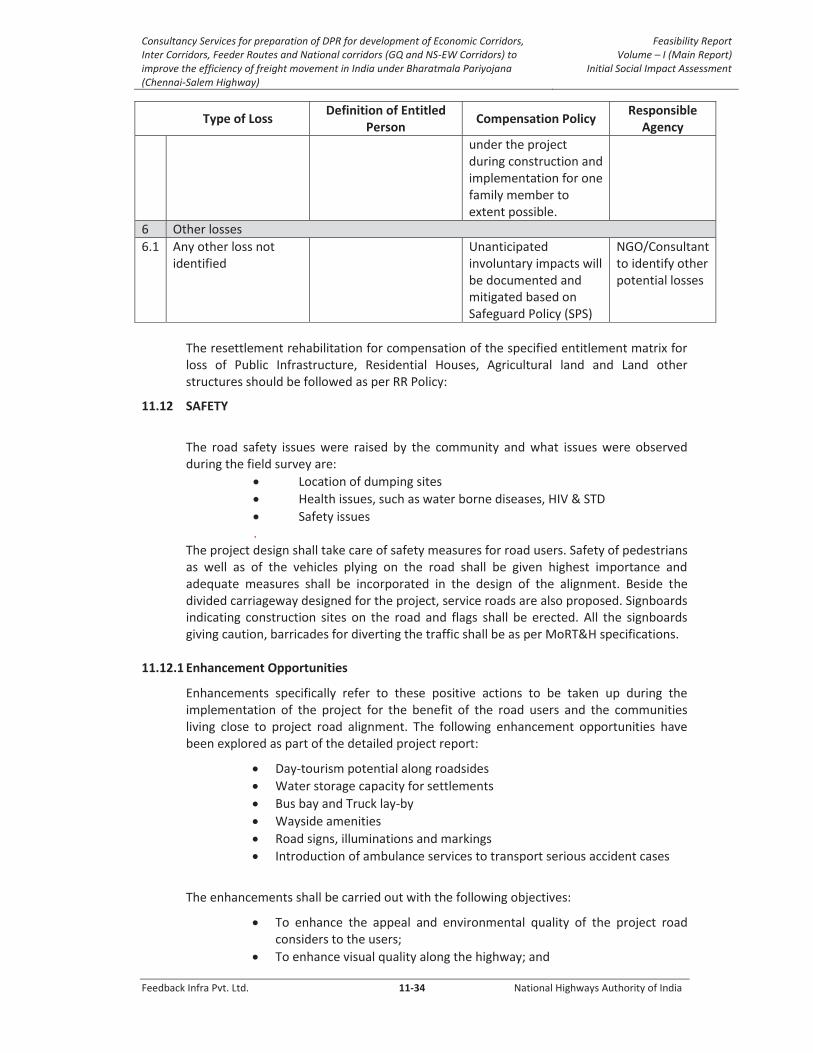
Consultancy Services for preparation of DPR for development of Economic Corridors, Inter Corridors, Feeder Routes and National corridors (GQ and NS-EW Corridors) to improve the efficiency of freight movement in India under Bharatmala Pariyojana (Chennai-Salem Highway)
Feasibility Report Volume – I (Main Report)
Initial Social Impact Assessment
Feedback Infra Pvt. Ltd. 11-34 National Highways Authority of India
Type of Loss Definition of Entitled
Person Compensation Policy
Responsible Agency
under the project during construction and implementation for one family member to extent possible.
6 Other losses
6.1 Any other loss not identified
Unanticipated involuntary impacts will be documented and mitigated based on Safeguard Policy (SPS)
NGO/Consultant to identify other potential losses
The resettlement rehabilitation for compensation of the specified entitlement matrix for loss of Public Infrastructure, Residential Houses, Agricultural land and Land other structures should be followed as per RR Policy:
11.12 SAFETY
The road safety issues were raised by the community and what issues were observed during the field survey are:
Location of dumping sites
Health issues, such as water borne diseases, HIV & STD
Safety issues .
The project design shall take care of safety measures for road users. Safety of pedestrians as well as of the vehicles plying on the road shall be given highest importance and adequate measures shall be incorporated in the design of the alignment. Beside the divided carriageway designed for the project, service roads are also proposed. Signboards indicating construction sites on the road and flags shall be erected. All the signboards giving caution, barricades for diverting the traffic shall be as per MoRT&H specifications.
11.12.1 Enhancement Opportunities
Enhancements specifically refer to these positive actions to be taken up during the implementation of the project for the benefit of the road users and the communities living close to project road alignment. The following enhancement opportunities have been explored as part of the detailed project report:
Day-tourism potential along roadsides
Water storage capacity for settlements
Bus bay and Truck lay-by
Wayside amenities
Road signs, illuminations and markings
Introduction of ambulance services to transport serious accident cases
The enhancements shall be carried out with the following objectives:
To enhance the appeal and environmental quality of the project road considers to the users;
To enhance visual quality along the highway; and
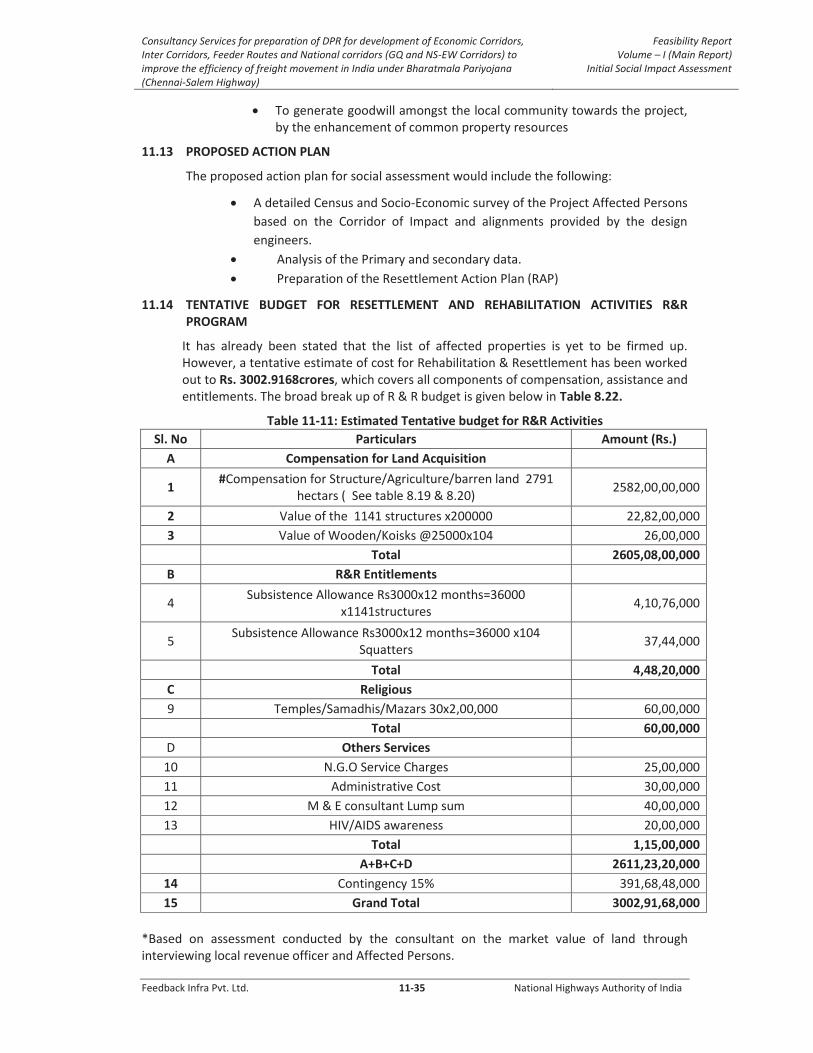
Consultancy Services for preparation of DPR for development of Economic Corridors, Inter Corridors, Feeder Routes and National corridors (GQ and NS-EW Corridors) to improve the efficiency of freight movement in India under Bharatmala Pariyojana (Chennai-Salem Highway)
Feasibility Report Volume – I (Main Report)
Initial Social Impact Assessment
Feedback Infra Pvt. Ltd. 11-35 National Highways Authority of India
To generate goodwill amongst the local community towards the project, by the enhancement of common property resources
11.13 PROPOSED ACTION PLAN
The proposed action plan for social assessment would include the following:
A detailed Census and Socio-Economic survey of the Project Affected Persons
based on the Corridor of Impact and alignments provided by the design
engineers.
Analysis of the Primary and secondary data.
Preparation of the Resettlement Action Plan (RAP)
11.14 TENTATIVE BUDGET FOR RESETTLEMENT AND REHABILITATION ACTIVITIES R&R PROGRAM
It has already been stated that the list of affected properties is yet to be firmed up. However, a tentative estimate of cost for Rehabilitation & Resettlement has been worked out to Rs. 3002.9168crores, which covers all components of compensation, assistance and entitlements. The broad break up of R & R budget is given below in Table 8.22.
Table 11-11: Estimated Tentative budget for R&R Activities
Sl. No Particulars Amount (Rs.)
A Compensation for Land Acquisition
1 #Compensation for Structure/Agriculture/barren land 2791
hectars ( See table 8.19 & 8.20) 2582,00,00,000
2 Value of the 1141 structures x200000 22,82,00,000
3 Value of Wooden/Koisks @25000x104 26,00,000
Total 2605,08,00,000
B R&R Entitlements
4 Subsistence Allowance Rs3000x12 months=36000
x1141structures 4,10,76,000
5 Subsistence Allowance Rs3000x12 months=36000 x104
Squatters 37,44,000
Total 4,48,20,000
C Religious
9 Temples/Samadhis/Mazars 30x2,00,000 60,00,000
Total 60,00,000
D Others Services
10 N.G.O Service Charges 25,00,000
11 Administrative Cost 30,00,000
12 M & E consultant Lump sum 40,00,000
13 HIV/AIDS awareness 20,00,000
Total 1,15,00,000
A+B+C+D 2611,23,20,000
14 Contingency 15% 391,68,48,000
15 Grand Total 3002,91,68,000
*Based on assessment conducted by the consultant on the market value of land through interviewing local revenue officer and Affected Persons.
Consultancy Services for preparation of DPR for development of Economic Corridors, Inter Corridors, Feeder Routes and National corridors (GQ and NS-EW Corridors) to improve the efficiency of freight movement in India under Bharatmala Pariyojana (Chennai-Salem Highway)
Feasibility Report Volume – I (Main Report)
Initial Social Impact Assessment
Feedback Infra Pvt. Ltd. 11-36 National Highways Authority of India
11.15 CONCLUSIONS
The initial social assessment report is a step towards preparation of the Social Impact Assessment and RAP. The initial assessment process as described in previous sections has primarily tried to focus on the relevant legislations, potential impacts due to the proposed project and to propose mitigation measures at different phases of the project. Based on the findings during the initial assessment study some measures have to be considered from the inception of the project, which will reduce the detrimental effects of project appreciably.
Alternative alignments such as eccentric or concentric widening, realignment / bypass etc shall be attempted in order to find a suitable alignment that would have minimum adverse impact on social aspects.
The alignment for widening would be designed considering minimum land acquisition.
The alignment widening would try to avoid schools, places of worships, public utilities and other common resources.
An amicable solution with regard to shifting of religious structures (if required) shall be explored in consultation with community leaders, religious leaders and other prominent persons in the local area.
It will be ensured that the likely affected common properties used by local people are suitably rehabilitated before the start of civil construction work and budgetary provision for the same shall be made in the project estimates.
With the above approach to design, construction and operation the project will be
socially feasible.

Consultancy Services for preparation of DPR for development of Economic Corridors, Inter Corridors, Feeder Routes and National corridors (GQ and NS-EW Corridors) to improve the efficiency of freight movement in India under Bharatmala Pariyojana (Chennai-Salem Highway)
Feasibility Report Volume – I (Main Report)
Conclusion and recommendation
Feedback Infra Pvt. Ltd. 12-1 National Highways Authority of India
12. CONCLUSION AND RECOMMENDATION
12.1 CONCLUSION AND RECOMMENDATION
The project road is one of the most important project highways in the State of Tamil Nadu, providing
connectivity commercial and tourist centres such as Chennai, Salem, Coimbatore, Erode, Karur and
Subsequently to Ooty.
The traffic on project highway is grown in many folds, thus reducing the average journey speeds. The
traffic forecast recommends for immediate development to Six/Eight lane divided carriageway from
Chennai – Salem along with four lane divided carriageway for Spur Roads.