events.joc.com · and services in urban areas drive migration to urban areas. ... – all-electric...
TRANSCRIPT
. . . . .
Port Infrastructure Identifying Areas of Greatest Need
December 6, 2016
Dr. Walter Kemmsies Managing Director, Economist and Chief Strategist
JLL Ports Airports and Global Infrastructure
Larry Nye, P. E. Sr. V. P.
Moffatt & Nichol
1

. . . . .
Port Infrastructure Identifying Areas of Greatest Need
• Focus on international container trade
• Focus mainly on East-West container traffic
2

. . . . . Drivers of Global Trade Growth
3
• From 1950 to 2013, manufactured goods trade has grown twice as fast as real GDP. Among other trends, this
is due to:
WORLD REAL GDP AND TRADE INDEXES 1950-2015E
Source: WTO, JLL
• Free Trade Agreements
• Information/Communication Technology
• Maritime and Inland Connectivity Infrastructure
• Demographic Trends
1950 – 2015 CAGR
Manufactured Goods 7.0%
Extraction Goods 3.9%
GDP 3.6%
Agricultural goods 3.6%
Japan
Korea, Taiwan
China

. . . . . International Labor Cost Comparisons in 2001
4
LOCAL MANUFACTURING WAGES CONVERTED INTO US$ AT PREVAILING EXCHANGE RATES IN 2001 AND 2014
Through most of the
several decades
until 2001 wages in
emerging market
economies were
much lower than in
developed
economies.
With younger
populations but a
lower wage base it
was necessary to
offshore production
to emerging market
economies. Latin
America benefitted
first, followed by
Asia.
$0
$10,000
$20,000
$30,000
$40,000
$50,000
$60,000
Source: Government statistics agencies,. JLL
. . . . . Ocean Shipping 101
“… the best way to move something heavy from here to there was and is to float it there.”
5
John Szarkowski, Former Director of Photography, New York Museum of Modern Art, A Maritime Album, 100 Photographs and Their Stories:

. . . . . Ocean Shipping 101
“… the best way to move something heavy from here to there was and is to float it there.”
6
John Szarkowski, Former Director of Photography, New York Museum of Modern Art, A Maritime Album, 100 Photographs and Their Stories:
“It is only recently, … and cautiously, that we have moved far from the oceans, to places like Siberia or Nebraska, and it is by no
means clear that places so far removed from the sea are viable in the long term.”

. . . . . Ocean Shipping 101
7
“…the real driving force behind globalization is the declining cost of international transport…”
Journal of Commerce
The Box That Changed the World

. . . . . Ocean Shipping 101
• Ocean Transport is, forever and always, the best way to move stuff on this planet
• Ocean transport has become so cost-efficient, it actually drives trade and thereby pressures ports and land transport infrastructure
8
Relative Container Transport Cost per TEU-MileNorth Asia - US Midwest
Ocean
Land
Relative Container Transport CostNorth Asia - US Midwest
Ocean Transport
US Port
Land Transport
6,500 miles
1,700 miles

. . . . .
People are All Over Our Country They All Need Stuff
US Population Centroid
Nebraska
320M People Each Dot = 7,500
People
By the Way, Stuff Doesn’t Really Care if Trade is Foreign or Domestic
WC Canada
PNW
N. Cal.
S. Cal.
Gulf
S. Atlantic
Mid Atlantic
N. Atlantic
St Lawrence
Our Principle Port Trade Gateways are Where They Are
We Must Have Efficient Port, Road & Rail Infrastructure
9

. . . . .
On the Ocean Side of Ports, We Only Need to be Concerned With The Last “Mile” (or so)
• Build and maintain strong breakwaters
• Dredge and maintain sufficiently deep channels and wide turning basins
• Build high bridges over critical waterways
10

. . . . .
Increasingly Urbanized, Increasingly Congested
11
PERCENTAGE OF URBAN POPULATION AND AGGLOMERATIONS BY SIZE CLASS: 1980 AND 2011
1980 2011
• Three major migration trends in the US are to the south, to the coasts and to urban areas.
• Rest of the world is urbanizing too.
• Substitution of capital for labor in rural areas and higher income offered by manufacturing
and services in urban areas drive migration to urban areas.
• Better services supply in urban areas also attracts retirees.
• In major port cities it is likely that congestion could worsen.

. . . . .
Ecommerce Gaining Share of US Retail Sales – Analogous to “push”
12
ECOMMERCE VS TOTAL RETAIL TRADE SALES
0%
1%
2%
3%
4%
5%
6%
7%
8%
9%
10%
0
200
400
600
800
1,000
1,200
1,400
19
99
20
00
20
01
20
02
20
03
20
04
20
05
20
06
20
07
20
08
20
09
20
10
20
11
20
12
20
13
20
14
20
15
20
16
Shar
e o
f To
tal
$ B
illio
ns
Ecommerce Share (right axis) E-commerce Total
Ecommerce is gaining
share of consumer
spending in many
countries, with the US
among the countries
leading the trend.
Growing concentrations of
populations in metropolitan
regions and growing
Internet subscriptions are
main driver.
As Ecommerce operations
spread to more urban
locations they will gain
share of US retail sales.
Ecommerce operations
prefer to have marine
freight delivered to many
ports so as to support their
national market
development strategies.

. . . . .
Selected On-Demand Company Fulfillment Time Estimates
13 Source: Mary Meeker @ KPCB

. . . . . US Port Capacity
• Regional throughput is pretty well balanced to regional capacity
7% 1
0%
7%
40
%
12
%
4%
15
%
5%
9%
8%
6%
41
%
14
%
6%
12
%
5%
0%
5%
10%
15%
20%
25%
30%
35%
40%
45%
Port Capacity vs Current Throughput
% of US Capacity % of US Throughput
69% 69%64%
67%
0%
10%
20%
30%
40%
50%
60%
70%
80%
West Coast East Coast Gulf Coast US Overall
Estimated Current Regional Ports Percent of Capacity
• US Port regions currently have average of about 30% latent capacity
14
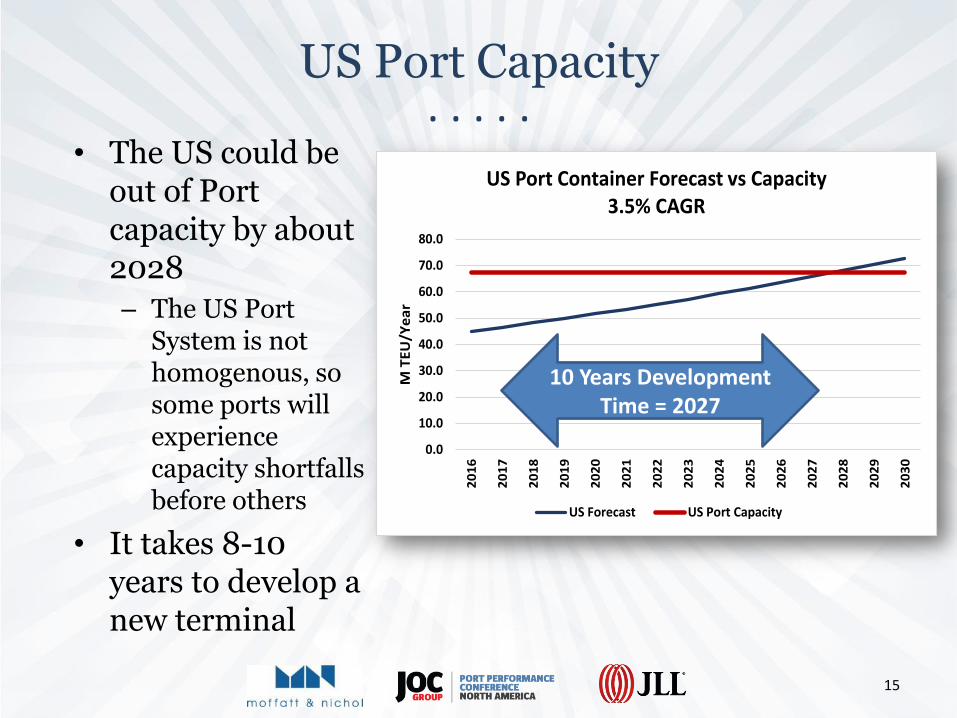
. . . . . US Port Capacity
• The US could be out of Port capacity by about 2028
– The US Port System is not homogenous, so some ports will experience capacity shortfalls before others
• It takes 8-10 years to develop a new terminal
0.0
10.0
20.0
30.0
40.0
50.0
60.0
70.0
80.0
20
16
20
17
20
18
20
19
20
20
20
21
20
22
20
23
20
24
20
25
20
26
20
27
20
28
20
29
20
30
M T
EU
/Ye
ar
US Port Container Forecast vs Capacity3.5% CAGR
US Forecast US Port Capacity
10 Years Development Time = 2027
15

. . . . . Port / Terminal Densification & Automation
16
• Can increase terminal capacity by 25-30%
– Densified storage
– Automated handling
• Can increase productivity by 25%-30%
– Vessel
– Gate
– Rail
• Can reduce traffic congestion
– Truck turn times
– Dual transactions
• Can reduce emissions by almost 100%
– All-electric container handling is possible
• Cost is significant
– Per 1M annual TEU Capacity
• Infrastructure $200-300 Million
• Equipment $200 Million
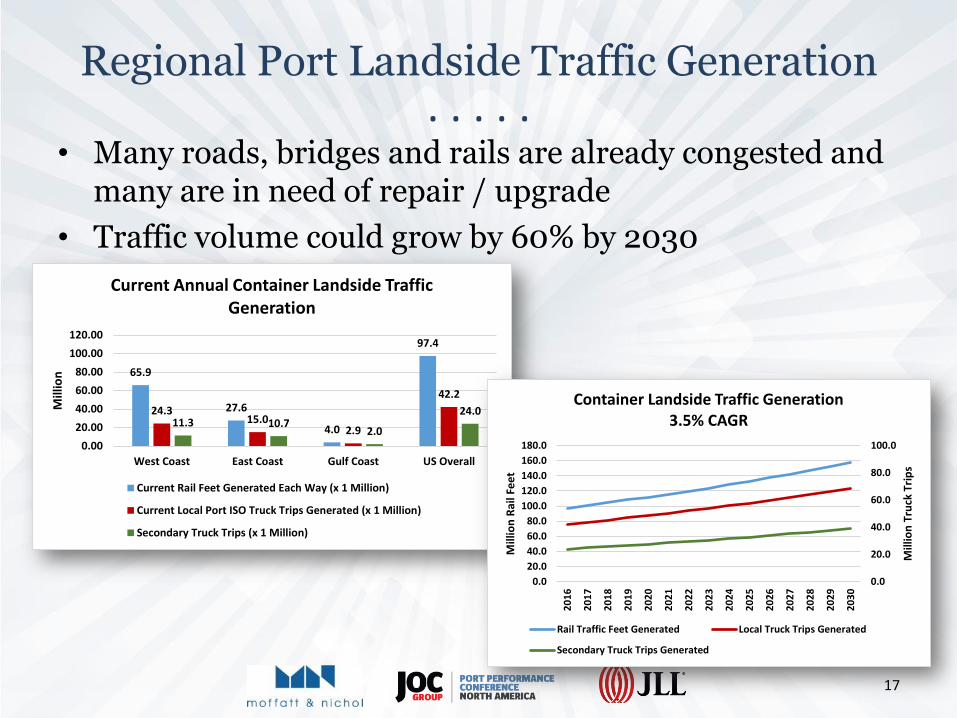
. . . . . Regional Port Landside Traffic Generation
• Many roads, bridges and rails are already congested and many are in need of repair / upgrade
• Traffic volume could grow by 60% by 2030
17
65.9
27.6
4.0
97.4
24.315.0
2.9
42.2
11.3 10.72.0
24.0
0.00
20.00
40.00
60.00
80.00
100.00
120.00
West Coast East Coast Gulf Coast US Overall
Mill
ion
Current Annual Container Landside Traffic Generation
Current Rail Feet Generated Each Way (x 1 Million)
Current Local Port ISO Truck Trips Generated (x 1 Million)
Secondary Truck Trips (x 1 Million)
0.0
20.0
40.0
60.0
80.0
100.0
0.0
20.0
40.0
60.0
80.0
100.0
120.0
140.0
160.0
180.0
20
16
20
17
20
18
20
19
20
20
20
21
20
22
20
23
20
24
20
25
20
26
20
27
20
28
20
29
20
30
Mill
ion
Tru
ck T
rip
s
Mill
ion
Rai
l Fe
et
Container Landside Traffic Generation3.5% CAGR
Rail Traffic Feet Generated Local Truck Trips Generated
Secondary Truck Trips Generated

. . . . .
Last Mile Intermodal Capacity May be Difficult to Achieve
18
PORT OF NEW YORK AND NEW JERSEY CONTAINER TERMINALS AND INLAND CONNECTIVITY INFRASTRUCTURE
ContainerTerminal
Intermodal
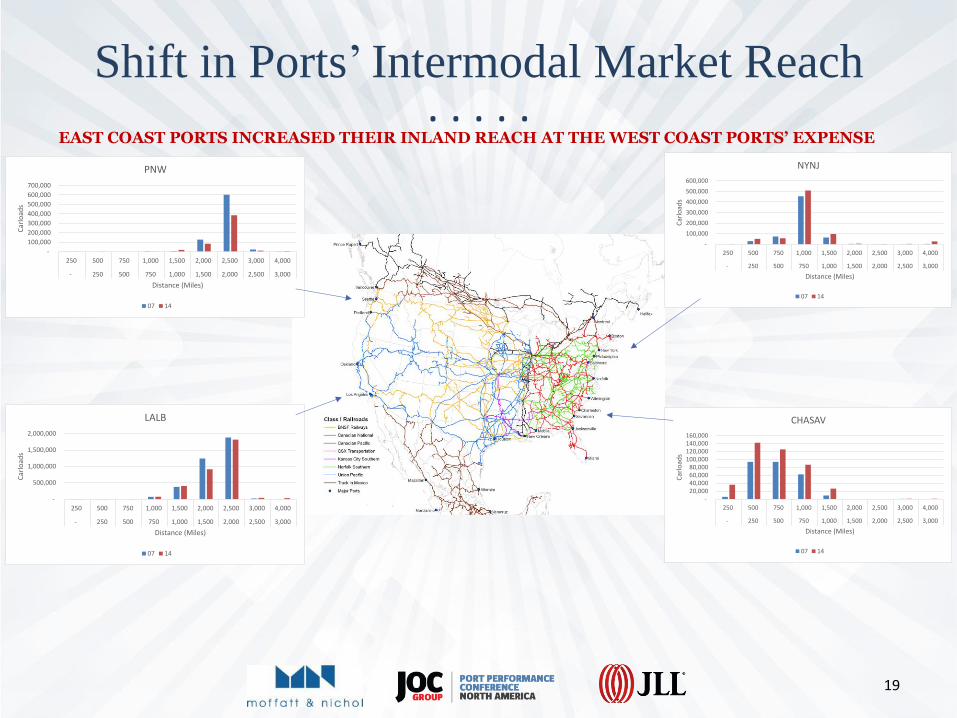
. . . . . Shift in Ports’ Intermodal Market Reach
19
EAST COAST PORTS INCREASED THEIR INLAND REACH AT THE WEST COAST PORTS’ EXPENSE
-
100,000
200,000
300,000
400,000
500,000
600,000
250 500 750 1,000 1,500 2,000 2,500 3,000 4,000
- 250 500 750 1,000 1,500 2,000 2,500 3,000
Car
load
s
Distance (Miles)
NYNJ
07 14
-20,00040,00060,00080,000
100,000120,000140,000160,000
250 500 750 1,000 1,500 2,000 2,500 3,000 4,000
- 250 500 750 1,000 1,500 2,000 2,500 3,000
Car
load
s
Distance (Miles)
CHASAV
07 14
-
500,000
1,000,000
1,500,000
2,000,000
250 500 750 1,000 1,500 2,000 2,500 3,000 4,000
- 250 500 750 1,000 1,500 2,000 2,500 3,000
Car
load
s
Distance (Miles)
LALB
07 14
-
100,000
200,000
300,000
400,000
500,000
600,000
700,000
250 500 750 1,000 1,500 2,000 2,500 3,000 4,000
- 250 500 750 1,000 1,500 2,000 2,500 3,000
Car
load
s
Distance (Miles)
PNW
07 14

. . . . . The Oceans are (Still) Large
• The Oceans are fantastic infrastructure and constraint-free highways, … a gift of our planet
• But ocean cargo speed is low and speeding up is expensive – Air 500 mph
– Land 50 mph
– Sea 20-25 mph
• Even with technology “shrinking” our planet, the oceans are still large
• If you are going to travel across the Ocean, best make it worth while
20
Trans Pacific ~6,000 NM 14 Days
6 port + 14 sail + 6 port + 14 sail = 40 days per roundtrip = 9 voyages per year per vessel = 6
vessels required for weekly service
• You need a big boat!
0.00%
20.00%
40.00%
60.00%
80.00%
100.00%
0 2 3 4 5 6 7 8 9 10 11 12 13 14 15 16 17 18 19 20 21 22 23
Pe
rce
nt
of
Po
we
r R
eq
'd
Speed (knots)
Main Engine Power Factor

. . . . . Big Ships - 18,000 TEU
21
230 positions above deck
230 positions below deck
Up to 460 Container slots per Bay ~900 moves per bay per call 30 STS crane hours per bay
Photo Courtesy POLB
235 ft tall
~190 feet above water line
1312 ft long
Need ~55 foot water depth at berth
200,000
metric tons
190 ft beam

. . . . . Big Ships - 18,000 TEU
22
Photo Courtesy POLB
• Port approach channels
– 50 - 55 feet deep
– 475 feet wide
• Turning basins
– 1,600 - 1,800 feet diameter
• Bridges
– 200 feet clear height
Photo Courtesy POLB

. . . . . Critical Terminal Infrastructure
• Berths
• Wharves, fenders, & bollards,
• Throughput capacity / stacking density
• Ship-to-shore cranes
• Yard cranes and pavement
• Truck gates
• On-terminal railyards
23

. . . . .
18,000 TEU Vessel Fenders and Bollards
24
1.18 2.65 4.71 7.
36 10.6
0
14.4
3
18.8
4
23.8
5 29.4
4 35.6
2 42.3
9 49.7
5 57.7
0 66.2
4
0.00
10.00
20.00
30.00
40.00
50.00
60.00
70.00
PSF
Wind Speed (mph)
Wind Pressure
Wind pressure at 60 mph = 10.6 psf
186,000 SF x 10.6 PSF = 1.9M Pounds Wind Pressure
Replace 50 MT Bollards with 200 MT Double Bollards Replace Single Fenders with Larger Double Fenders

. . . . .
18,000 TEU Vessel Ship to Shore Cranes & Crane Rails
25
5,000 TEU (Current wharf design
in many US Ports)
135
Containers
per bay
320
Containers
per bay
115 ft 165 ft 115 ft
215 ft
18,000 TEU
30,000 lbs / lf 55,000 – 75,000 lbs / lf

. . . . .
18,000 TEU Vessel Port Impacts by Region
• Beyond vessel size, impacts may vary by region and service
26
6,0005,000
3,000
17,000
8,000
5,000 5,000 5,000
02,0004,0006,0008,000
10,00012,00014,00016,00018,000
30.00% 25.00% 15.00% 85.00% 40.00% 25.00% 25.00% 25.00%
Canada WC NWSA Oakland LA/LB NY/NJ Norfolk CharlestonSavannah
West Coast East Coast
Co
nta
ine
r Li
fts
pe
r C
all
Percent Interchange per Call
Lifts per Call per 18K TEU Service
561,600468,000
280,800
1,591,200
748,800
468,000 468,000 468,000
0200,000400,000600,000800,000
1,000,0001,200,0001,400,0001,600,0001,800,000
30.00% 25.00% 15.00% 85.00% 40.00% 25.00% 25.00% 25.00%
Canada WC NWSA Oakland LA/LB NY/NJ Norfolk CharlestonSavannah
West Coast East Coast
TEU
/Ye
ar/S
erv
ice
Percent Interchange per Call
TEU Throughput per Year per 18K TEU Service

. . . . .
18,000 TEU Vessel Port Impacts by Region
• Productivity demand of 180 gross / 200+ net moves per hour for up to six days requires a paradigm shift in terminal operating systems
27
5.004.00
3.00
8.00
6.00 6.00 6.00 6.00
0.001.002.003.004.005.006.007.008.009.00
30.00% 25.00% 15.00% 85.00% 40.00% 25.00% 25.00% 25.00%
Canada WC NWSA Oakland LA/LB NY/NJ Norfolk Charleston Savannah
West Coast East Coast
Cra
ne
s
Percent Interchange per Call
Ship to Shore Cranes per 18K TEU Service
112
90
67
179
134 134 134 134
020406080
100120140160180200
Can
ada
WC
NW
SA
Oak
lan
d
LA/L
B
NY
/NJ
No
rfo
lk
Ch
arle
sto
n
Sava
nn
ah
West Coast East Coast
Gro
ss M
ove
s p
er
Ho
ur
18k TEU Vessel Productivity Demand

. . . . .
18,000 TEU Vessel Port Impacts by Region
28
51 62
43
20
4
10
7
78
78
7887 10
8
14
0 20
6 28
3
29
7
24
5
68
5
0100200300400500600700800
30.00% 25.00% 15.00% 85.00% 40.00% 25.00% 25.00% 25.00%
CanadaWC
NWSA Oakland LA/LB NY/NJ Norfolk Charleston Savannah
West Coast East Coast
Term
inal
Acr
es
Average Percent Interchange per Call
Terminal Acres Required per 18k TEU Service
Terminal Acres Required per Service Average Current Acres per Terminal

. . . . .
18,000 TEU Vessel Port Impacts by Region
29
024681012141618
0
1,000
2,000
3,000
4,000
5,000
6,000
7,000
Can
ada
WC
NW
SA
Oak
lan
d
LA/L
B
NY
/NJ
No
rfo
lk
Ch
arle
sto
n
Sava
nn
ah
West Coast East Coast
Ad
de
d S
tora
ge A
cre
s
Inve
nto
ry S
pik
e T
EU
18,000 TEU Initial Discharge Inventory Spike
Inventory Spike (TEU)
Additional Acres of Storage Required for Inventory Spike
230
230
No. of Bays (cranes) x TEU Discharge per Bay

. . . . .
18,000 TEU Vessel Landside Impacts by Region
• Landside traffic generation per 18k TEU Service
30
Not counting secondary truck trips
0%
10%
20%
30%
40%
50%
60%
70%
0
1,000,000
2,000,000
3,000,000
4,000,000
5,000,000
6,000,000
Can
ada
WC
NW
SA
Oak
lan
d
LA/L
B
NY
/NJ
No
rfo
lk
Ch
arle
sto
n
Sava
nn
ah
West Coast East Coast
Rai
l Pe
rce
nt
of
Thro
ugh
pu
t
Rai
l Fe
et
Annual Rail Feet Each Way per 18K TEU Service
Rail feet Each Way Percent Rail
0
200,000
400,000
600,000
800,000
1,000,000
1,200,000
Can
ada
WC
NW
SA
Oak
lan
d
LA/L
B
NY
/NJ
No
rfo
lk
Ch
arle
sto
n
Sava
nn
ah
West Coast East Coast
Loca
l Tru
ck T
rip
s
Annual Local Port Truck Trips per 18 K TEU Service

. . . . .
18,000 TEU Vessel Port Cost Impacts by Region
• Terminal upgrade cost to accommodate 18,000 TEU vessels
– $100 – $200M per berth or service
31
$0.0
$50.0
$100.0
$150.0
$200.0
$250.0
Can
ada
WC
NW
SA
Oak
lan
d
LA/L
B
NY
/NJ
No
rfo
lk
Ch
arle
sto
n
Sava
nn
ah
West Coast East Coast
20
16
US$
18,000 TEU Berth Upgrade Cost(Per Berth)
Replace STS Cranes
Replace Fenders & Bollards
Strengthen Crane Rails
Deepen Berth
Inventory Spike Storage Area
• Waterside costs vary by Port/Terminal
• Landside costs vary
– But are throughput-driven not vessel size driven

. . . . . Where Will the Money Come From?
Entity
• Government (Fed)
• Ports (State/City) – Landlord
– Operator
– Privatized
– Government/local - state tax subsidies?
• Ocean carriers & Terminal operators
• Investment banks
• Private investment funds
What They Paid For
• Breakwaters, dredging & reclamation
• Terminal infrastructure
• Terminal equipment and
technology
Traditional US Model
32

. . . . . Public Sector Debt is at a Historically High Level
33
GOVERNMENT DEBT AS A PERCENTAGE OF GDP STATE PENSION FUNDING GAP
Sources: Dept of Commerce, http://www.pewtrusts.org/en/research-and-analysis/issue-briefs/2015/07/the-state-pensions-funding-gap-challenges-persist, BEA, Federal Reserve

. . . . .
Thank You
34
Larry Nye. P. E.
Sr. V. P.
Moffatt & Nichol
Dr. Walter Kemmsies Managing Director, Economist and Chief Strategist
JLL Ports Airports and Global Infrastructure