session 8_s&d
DESCRIPTION
S&D MarketingTRANSCRIPT

DRL_DLM_Session 1 1
Distribution Channels
Session 1
Tuesday, April 18, 2023

DRL_DLM_Session 1 2
A Typical Channel of Distribution
Manufacturer/C&F
Wholesaler
Final Consumer
Retailer
Distributor
Tuesday, April 18, 2023

DRL_DLM_Session 1 3
How Much to Cover - Directly and Indirectly ?
Tuesday, April 18, 2023

DRL_DLM_Session 14 Tuesday, April 18, 2023
HUL Sales & Distribution• Almost 1 million outlets ; 4000 stockist; 9000 salespersons to take
orders from these million retail oulets.• Apart from product HUL offers its retailers a service- mix which has 6
elements.• Frequency of service to be given to a retailer (ex- once a week, twice
a week or bi-weekly).• Range of products are going to be offered to him.
– HUL has a range of 550 SKUs (Stock Keeping Units); how many of these will be offered to the retailer.
• Credit for distributor point of view (ex- 7 days, 10 days, not at all).• What investment will be made in form of paid display,
planogramming or category captaincy.• Policy for taking back expiry / damaged goods from a certain retailer.
– Not all retailers get this service, it depends on the laid out matrix.• Management attention to be given to a retailer.

DRL_DLM_Session 1 5
General Trade ChannelsFamily Grocers General Stores
Cosmetic Stores Food Stores
Paan Plus Stores Chemists
Deals mainly in grains, provisions, groceries, spices, edible oil, Vanaspati etc. Most of the merchandise from this store is weighed and sold
Deals in items of day-to-day requirements and stocking numerous products. Does not stock sacks of grains.
Sells substantial volumes of cosmetics & beauty accessories
Primarily sells more of Food Products (Branded, Unbranded and own brands)
Sells primarily tobacco products & Paan, in addition to FMCG products.
Sell ethical allopathic drugs and FMCG products, mainly Personal Care
Tuesday, April 18, 2023

DRL_DLM_Session 1 6
AC Nielsen• AC Neilson is an Independent Research Agency that does Audit
of Retail outlets across the country
• About 500 towns and 4500 villages are covered in this Audit. Wholesale is not covered. All types of channels are represented.
• The Auditor goes to the pre selected outlets – measures the SKUwise stocks at the retailer, checks the purchases since last Audit and derives offtakes during this period
• Estimation for All India measures such as market share is done based on the sample data
Tuesday, April 18, 2023

DRL_DLM_Session 1 7
Build Assortment
Step 2 - Profile Creation:Nielsen Off-takes Panel – Identified Profile of High-contributing stores for the category and under-indexed for HUL
Step 3 - Profile Mapping:Identify such Outlets in Unify Database & estimate their potential sales.
Step 1 – State/SKU Selection:Identified highest contributing states to the Category & within each state, prioritized SKUs based on Contribution
Tuesday, April 18, 2023

DRL_DLM_Session 1 8
Market ShareBrand Off Takes X 100
Market Share = %
Category Off Takes
Note : Category offtakes & Brand offtakes are as measured by Nielsen And may not exactly match with secondary sales in that month
3.69*100/17= 21.7%
E.g. in Bihar, Washing powders Category offtake in July was 17 Crores. Wheel Offtake was 3.69 Crores Value Market Share of Wheel in Bihar in July ??
Tuesday, April 18, 2023 EPYP15_SDM_session 2

DRL_DLM_Session 1 9
Market Share
Market Share ??
(200+500+200+1000) / 9000 = 21.1%
(800+3500) / 9000 = 47.8%
(1800+500+500) / 9000 = 31.1%
2000 500 1000 500 5000Dishwash Liquids Offtake in the
Shop (Rs)
200 1800 500 800 200 500 1000 500Brand offtake
(Rs) 3500
Tuesday, April 18, 2023

DRL_DLM_Session 1 10
Numeric Distribution
2000 500 1000 500 5000Dishwash Liquids Offtake in the Shop (Rs)
Numeric Distribution ??
80% 40%60%
Outlets carrying Brand A
=
Outlets carrying any Product from the Category
Numeric Distribution Of
Brand A%
Tuesday, April 18, 2023

DRL_DLM_Session 1 11
Value Weighted Distribution (VWD)Category Offtakes in outlets
Carrying Brand A X 100=
Category Offtakes in allOutlets out together
Weighted Distribution Of
Brand A%
2000 500 1000 500 5000Dishwash Liquids Offtake in the Shop (Rs)
Weighted Distribution ??
(1000+5000)/9000 = 66.7%(2000+500+1000+5000)/9000= 94.4%
(2000+500+5000)/9000 = 83.3%Tuesday, April 18, 2023

DRL_DLM_Session 1 12
Share Among Handlers (SAH)
SAH ??
Share Amongst Handlers of Brand A
=Share of Offtake in the outlets
where Brand A is present
2000 500 1000 500 5000Dishwash Liquids Offtake in the Shop (Rs)
200 1800 500 800 200 500 1000 500 3500
(200+500+200+1000)/(2000+500+1000+5000) = 22.4%
(800+3500)/(1000+5000) = 71.7%
(1800+500+500)/(2000+500+5000) = 37.3%
Tuesday, April 18, 2023

DRL_DLM_Session 1 13
Stock Turnover Ratio (STR)
Avg Sales in a month 20kg 100kg 10kg 130kg
Stocks 5 kg 50 kg 3 kg 58 kg
Total
STR = (58/130)*30= 13.4 Days
Tuesday, April 18, 2023
DRL_DLM_Session 1
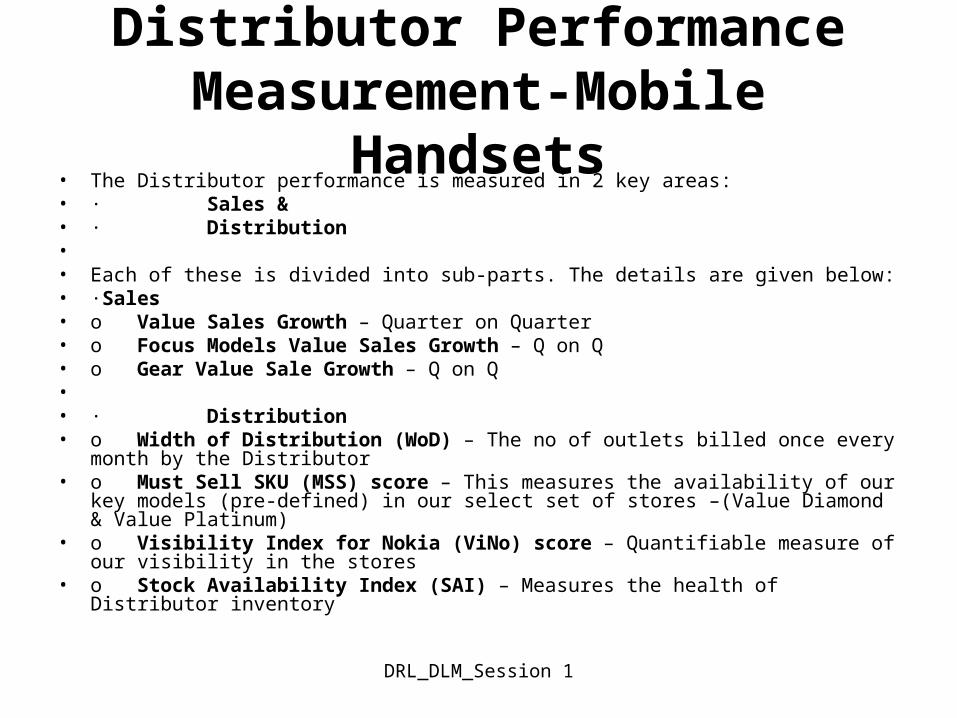
Distributor Performance Measurement-Mobile Handsets
• The Distributor performance is measured in 2 key areas:• · Sales &• · Distribution• • Each of these is divided into sub-parts. The details are given below:• ·Sales• o Value Sales Growth – Quarter on Quarter• o Focus Models Value Sales Growth – Q on Q• o Gear Value Sale Growth – Q on Q• • · Distribution• o Width of Distribution (WoD) – The no of outlets billed once every month by the
Distributor• o Must Sell SKU (MSS) score – This measures the availability of our key models
(pre-defined) in our select set of stores –(Value Diamond & Value Platinum)• o Visibility Index for Nokia (ViNo) score – Quantifiable measure of our visibility in
the stores• o Stock Availability Index (SAI) – Measures the health of Distributor inventory

DRL_DLM_Session 115
Hunter Business Group: Team TBA

DRL_DLM_Session 116
STAR OIL, 1992 - primary business of selling gasoline was facing stiff competitionTire, Battery and Accessory business was providing an unusual supportThe presence of Star Branded TBA products multiplied the gasoline sales 4 timesTBA product line was unprofitabletop management wished to discontinue the TBA product line but could not

April 18, 2023 1717
HBG formed a TBA team and made following changes:-
Reduction in no. of FSRs from 83 to 18 (16 from team TBA and 2 from Star)
Direct Mail, Telephone orders and Field Sales force was integrated to give a consistent and better communication to the dealers
It was agreed that operating costs would be halved to 17.75% of revenue within an year
Star would not receive any profit below $20 million sales. However, above that 2% of revenues were given to Star
Vendors were consolidated on value delivery and not only price delivery

DRL_DLM_Session 118
HBG estimates that the business will take a hit in 1994 due to Persian War and conversion of gasoline repair shops to convenience stores.
The total sales will be only $16 million and taking the COGS, remaining costs put a constraint on marketing and direct selling budget of $1.34 million.

DRL_DLM_Session 1MCM_Session 4_Personal Selling 19Tuesday, April 18, 2023
Strategy 1 – Freezing the fixed assets
Strategy 1
1993% of '93 revenues 1994
% of '94 revenues
Revenue 20 16 COGS 16 80 12.8 80Gross margin 4 20 3.2 20Operating Cost 3.55 17.75 2.84 17.75
Fixed Cost 1.5 42.253521 1.5 52.8169
Sales and Marketing Cost 2.05 1.34
Operating Income 0.45 2.25 0.36 2.25
DRL_DLM_Session 120
Fixed costs cannot be changed – Since the rent, misc. expenses in HQ and salaries of office personnel is constant
Since, none of the facilities is shut down, the revenues can be generated easily more by volumes and customer loyalty can be tapped more easily

DRL_DLM_Session 121
Sales expenditure is the lowest - $1.34 millionSalaries and sales force has to be cut which will have
serious demoralizing issuesThe no. of Gold a/c conversions will also go down
subsequently and this will hit the margins even moreField sales force cannot be eliminated entirely since the
Gold a/c conversion is majorly possible because of field services. Also, the effectiveness of telemarketing and direct mailing as against FSRs is questionable
Expanding telemarketing and direct marketing facility would ensue even more fixed costs and loss of face and customer loyalty if the move fails (sunk cost)

DRL_DLM_Session 122
• Strategy 2 – Keeping the Fixed costs at 40-45%
Strategy 2
1993% of '93 revenues 1994
% of '94 revenues
Revenue 20 16 COGS 16 80 12.8 80Gross margin 4 20 3.2 20Operating Cost 3.55 17.75 2.84 17.75
Fixed Cost 1.5 42.253521 1.28 8
Sales and Marketing Cost 2.05 1.56 9.75
Operating Income 0.45 2.25 0.36 2.25

DRL_DLM_Session 1MCM_Session 4_Personal Selling 23Tuesday, April 18, 2023
Fixed cost expenses go down to $1.28 million as against $1.5 million in the first strategy
The expenses on the side of TBA team will have to be cut which does not necessarily mean a reduction in the reimbursements of FSRs and their nos.

DRL_DLM_Session 124
$1.56 Million will be left for the sales and marketing which is still less than the salaries to be paid.
Sales force has to be cutThe FSRs cut back may also lead to cut
backs on other fields like direct mailing and tele marketing

DRL_DLM_Session 125
• Strategy 3 – Hybrid Approach
Strategy 3
1993% of '93 revenues 1994
% of '94 revenues
Revenue 20 16 COGS 16 80 12.8 80Gross margin 4 20 3.2 20Operating Cost 3.55 17.75 2.84 17.75
Fixed Cost 1.5 42.253521 1.2 7.5Sales and Marketing Cost 2.05 1.64 10.25
Operating Income 0.45 2.25 0.36 2.25

DRL_DLM_Session 126
Reduce sales and marketing and fixed costs by 20%. This leads to maximum allowable marketing spend of $1.64 million out of the all the three scenarios
Fixed costs are the lowest at $1.2 Million of all the three strategies
This gives them a leeway to adopt strategies to adopt the gross contribution margin to reward the FSRs instead of revenue approach
No. of Gold A/c can be increased suitably in order to maximize revenue stream and hence, the assortment of TBA products

DRL_DLM_Session 127
Terminating C & D accounts is not a good suggestion since they generate good revenues.
Tires and Batteries may be the highest contributors to revenues but very few dealers sell them.
Smaller dealers prefer to avoid them since it becomes a scenario of ‘all eggs in one basket’.

DRL_DLM_Session 128
Follow the hybrid strategy by keeping the fixed costs at 80% of original costs
Totally eliminate FSRs from B dealers. These dealers must be serviced solely by direct mailing and telemarketing only
Sales compensation structure should be changed to gross contribution margin approach which will ensure that the salesmen pay from themselves by getting higher prices from the dealers. For this brand image must be strong and the products must have a pull.
Concentrate on converting all A and AA into gold a/c. FSRs should be concentrated only on A and AA dealers. This way we
eliminate a lot of cost associated and possibly nos. also Segment D can be totally eliminated since they have the highest E/R
ratio (7.64, under perfect conditions)