session iv. airborne doppler radar industry n93 … iv. airborne doppler radar / industry n93-19603...
TRANSCRIPT

Session IV. Airborne Doppler Radar / Industry N93-19603
Acquisition and Use of Orlando, Florida and Continental Airbus Radar Flight Test Data
Mike Eide, Westinghouse Electric
Bruce Mathews, Westinghouse Electric
PRBGEDING P,_GE _;LAI'J_'_ NOT FILMED
373
https://ntrs.nasa.gov/search.jsp?R=19930010414 2018-06-05T18:08:07+00:00Z
Fourth Combined Manufacturers' and Technologists'
Airborne Wind Shear Review Meeting
April 14-16, 1992
Fort Magruder Inn, Williamsburg, Virginia
by
Mike Eide
Flight Test Pilot
Bruce Mathews
Radar Systems Engineering
Westinghouse Electric Corp.
Electronic Systems Group
Baltimore, Maryland
Abstract
Westinghouse is developing a lookdown pulse Doppler radar for production as the sensor and processor
of a forward looking hazardous windshear detection and avoidance system. A data collection prototype of
that product was ready for flight testing in Orlando to encounter low level windshear in corroboration
with the FAA-Terminal Doppler Weather Radar (TDWR). Airborne real-time processing and display of the
hazard factor were demonstrated with TDWR facilitated intercepts and penetrations of over 80 microbursts
in a three day period, including microbursts with hazard factors in excess of .16 (with 500 ft. PIREP
altitude loss) and the hazard factor display at 6 n.mi. of a visually transparent ("dry") microburst with
TDWR corroborated outflow reflectivities of +5 dBz. Range gated Doppler spectrum (I,Q,FFT) data was
recorded for subsequent development and refinement of hazard factor detection and urban clutter rejection
algorithms.
Following Orlando, the data collection radar was supplemental type certified for in revenue service
on a Continental Airlines Airbus in an automatic and non-interferring basis with its ARINC 708 radar to
allow Westinghouse to confirm its understanding of commercial aircraft installation, interface realities,
and urban airport clutter. A number of software upgrades, all of which were verified at the Receiver-
Transmitter-Processor (RTP) hardware bench with Orlando microburst data to produce desired advanced
warning hazard factor detection, included some preliminary loads with automatic (sliding window average
hazard factor) detection and annunciation recording. The current (14-A_R-92) configured software is free
from false and/or nuisance alerts (CAUTIONS, WARNINGS,etc.) for all take-off and landing approaches, under
2500 ft. altitude to weight-on-wheels, into all encountered airports, including Newark (NJ), LAX, Denver,
Houston, Cleveland, etc.
Using the Orlando data collected on hazardous microbursts, Westinghouse has developed a lookdown
pulse Doppler radar product with signal and data processing algorithms which detect realistic mlcroburst
hazards and has demonstrated those algorithms produce no false alerts (or nuisance alerts) in urban
airport ground moving vehicle (GMTI) and/or clutter environments.
374

Introduction
The Westinghouse Technical Direction is to provide a forward looking detection
and avoidance system of low level windshear based upon a pulse-Doppler lookdown radar
sensor to the commercial air transport market. The design of this system is for a
"quiet, dark cockpit" with low false alert and nuisance alert rates. To be used, its
warnings must be trusted and its hardware performance reliable.
Detection of microbursts employs an X-Band radar sensor designed to criteria
which has made Westinghouse a leader in reliable lookdown airborne radar. Specific
for this application are the demands of operating in an urban clutter environment and
its attendant moving vehicle background. Our design approach is to temper initial,
analytic designs based on experience with data from encounters with both microbursts
and airport urban clutter.
However, it is difficult to obtain simultaneously interesting/stressing
mlcrobursts and appropriate clutter. These two series of flight tests have been
respectively concerned to record radar data for microburst detection algorithm
refinement and to observe and develop clutter rejection processing into a robust
variety of urban airports with an in-revenue service aircraft reality. Signal and
data processing algorithms subjected to input data collected in flight against actual
microburst hazards verifies the detection capability of software upgrades to a radar
in revenue service and demonstrate by superposition both hazard detection and low
false alert criteria.
Overview
The Westinghouse involvement with airborne forward looking windshear detection
radar (see figure i) began in 1989. After talks with NASA LaRC, a flight test into
nearby urban airports was conducted using a modified APG-68 (F-16) radar [i]. Data
was collected along approach glideslopes using NASA "typical" waveforms. A number of
antenna lookdown angles were examined to establish a baseline on antenna sidelobe
rejection and appearance of ground moving discrete_and traffic. Airport selection
excluded stressing second time around urban clutter.
Westinghouse initiated a major development program.
Receiver/transmitter/processor (RTP) units were designed, assembled, and software
equipped to gather microburst data at the tailend of the microburst season. The
design included pre-prototype component and design techniques. RTP configuration
conformed to ARINC 708. The design included an FFT based signal processor and real
time data processor.
375

The data collection radar was delivered to the Westinghouse owned and operated
BAC-I-II at the end of August with signal processing algorithms installed. Vectored
by TDWR to areas of evolving or potential microburst activity, pilot decisions about
fly-through utilized a realtime hazard factor display. Pre-processed radar data (FFT)
was collected on over I00 microbursts over a 3 day period, including a run which
produced 500 ft. loss in altitude.
The Orlando flights served as a checkout for installing the R/T into a
Continental Airbus. Unlike Orlando, only VCR format data would be collected on the
Airbus. The radar operated in an autonoumous, non-interfering basis with the
installed ARINC 708 type antenna system. VCR format data has been collected on 682
flight (1682 flight hours from 4-SEP-91 thru 8-APR-92) for take-off and approaches
over altitudes from weight-on-wheels to 2500 ft. into a variety of urban airports
including Cleveland, Denver, Newark, L.A., San Fransisco, Houston.
The initial software configuration on the Continental Airbus included only the
signal processing algorithms as configured in the Orlando flights. These included
neither complete clutter rejection nor total hazard factor algorithms. The software
has been recently updated to include (I) refinement in the signal processing designed
to reject GMTI-clutter while not impairing windshear detection, (2) computation of a
total (vertical plus horizontal) hazard factor and (3) detection logic for total
hazard factor. Effectively, the equipment is nominally configured for false alert
scoring.
Radar and Instrumentation Design Considerations
Hazard factor accuracy may seem like an abstract and inaccessible quantity, but
first order estimates of hazard factor accuracy can be controlled in sensor design by
examining the sensitivity of the hazard factor to various measurement accuracies,
particularly the accuracy of measuring outflow radial velocity and the distance over
which the change in outflow velocities take place.
In fact, once these sensitivities are recognized, budgets for controlling the
contribution from any single source can be allocated into the design. While the
effects of sidelobe clutter, GMTI discretes, and other "clutter residue"
contributions may be analytically elusive, accuracy limits of the hardware, the
algorithmic processes, and/or waveform design may be established early in the design
process.
376
In general, there may be several contributors to the Doppler velocity accuracy
budget besides the signal-to-noise limitation, but the signal-to-noise limitation on
Doppler velocity accuracy is most fundamental to when (at what range) the radar
algorithmic processes can be expected to produce good velocity maps which produce
good hazard factor maps. Minimal outflow reflectivities (and Doppler velocities)
which produce marginally accurate hazard factors can be small if larger amplitude
sidelobe/mainlobe ground moving vehicles or sidelobe discretes are inhibited from
entering the velocity map.

Imperfect accuracy in the_dimension over which the winds change will produce
errors. Over-resolving sensors like radar will cut the microburst outflow into
several pixels on a fine range grid, making the measurement of the outflow diameter
relatively accurate in comparison to non-resolving sensors (e.g. infrared).
When the microburst is well resolved in range, a series of velocity measurements
for the range pixels along an azimuth line may be used to construct an approximation
to the horizontal windshear. Least mean square type approximations will be accurate
over linear regions of shear (i.e. hazards) if the velocity measurements for each
pixel are accurate.
Limits on velocity accuracy are usually set by the Doppler filter 3 dB.
bandwidth. Non-resolving (i.e. pulse pair) Doppler sensors must resort to large
signal-to-noise ratios to maintain accurate velocity measurements. Resolving (i.e.
FFT spectrum analyzer) Doppler sensors can provide accurate Doppler velocity
measurements at low signal-to-noise ratios.
The importance of low signal-to-noise ratio velocity accuracy is that the
reflectivity of the outflow may be correspondingly less reflective, i.e. "dry".
According to NASA-LaRC, a minimally small, hazardous microburst will have the
hazard area extend over about D, = 1000 meters. Alowing some overlap by the
approximating ensemble, the least mean square type slope estimator may begin to
operate when diameter of the microburst hazard is subtended by the LMS window
(population) of n e points,
D_ - n e AR
AR - Du/n e
Substituting for the range gate _R, with (V/g) = (80/9.81) = 8.15 sec, a 10% hazard
factor accuracy on a nominal hazard factor of .105 yields [2],
8F/F = .I0 - { (8.15)/[2(I000) (.i05)]} [n e 8v/(ne-2) "5]
Re-arranging, the velocity accuracy_v_er point must be small,
8v - 2.58 (ne-2)'5/ne
For signal-to-noise limits, the velocity resolution _v contributes to defining the
velocity accuracy, 8v - _v/ (2 S/N) "5 Squaring both sides of the equation, the
relationship between Doppler resolution and signal-to-noise becomes, approximately :
(_v)2/(S/N) - 2(2.58)2(ne-2)/ne 2
Consequently, range gated FFT spectrum analyzers can furnish fine Doppler resolution
and, hence, accurate hazard factors at low S/N ratios due to minimal outflow
reflectivities.
377

Accurate hazard factor processes at low S/N must avoid larger S/N returns, e.g.
mainbeam clutter, sidelobe clutter, ground moving taffic, spurious, etc. The RTP
assembly contains a stable oscillator (STALO), Receiver, Signal Processor, Solid
State Transmitter, and Low Voltage Power Supplies. The STALO and receiver provide
stability and spurious free operation in the presence of large mainbeam clutter. The
receiver and STALO are departures for their attention to minimun detectable velocity
and interference. The transmitter is solid state, based upon GaAs MMIC power
amplifiers. A powerful signal processor is provided. This furnishes the numerical
signal processing engine to accomplish an FFT spectrum analysis with proprietary
algorithms to reject/sort clutter and GMTI with no consequence to windshear. Such
algorithms are demanding because they must be executed at input data rates.
The signal processing effectively furnishes velocity (range x azimuth arrayed
pixel) maps of the horizontal wind fields before and along the glideslope of the
aircraft. Map data is available at a reduced rate. Data processing of these maps
furnishes total hazard factor estimates along the aircraft approach or departure
altitude profile. The final output stages of the warning system utilize a graphic
processor to transform the radar coordinate maps into PPI formatted data as well as
colour code the VCR displays. The processor design also supports high speed porting
of the I&Q input data, the FFT data, etc. for instrumenting/data collection purposes.
"The Name of the Game" (see figure 2) for low level windshear warning is to sort
windblown rain return_'_ other returns, including mainbeam urban (STAE) clutter,
sidelobe distributed clutter, sidelobe and/or mainlobe GMTI. "Conditioning" preserves
the signal integrity and minimizes spreading of mainbeam clutter through the
downconversion process to analog-to-digital (ADC) conversion. "Signal Processing"
includes those algorithms which are accomplished at the coherent processing interval
(input data rate). With FFT spectrum analysis processing, there is a whole filterbank
of Doppler candidates to describe the Doppler of the wind in a single range x azimuth
beam (velocity map) pixel. The signal processor chore must smartly reduce the data
entering the subsequent data processing stages by orders of magnitude. Pulse-pair and
spectral averaging processes are simple and less demanding largely because they
accept/include as eligible many Doppler returns which may not be windshear. "Data
Processing" means the processing of the wind velocity maps to produce a total (i.e.
both horizontal and vertical component) hazard factor map. It also may include the
detection of average hazard factor areas. These different levels of radar data become
the principal intermediate stages for observing radar performance and
recording/instrumenting/displaying data.
Prior to the Orlando flights, Westinghouse assembled and delivered the data
collection radar hardware to the software/systems integration bench. Real beam map
and supporting modes were first developed and checked out at the bench and in local
flight tests. Windshear mode development proceeded with several local flights through
August. Initial development of the windshear signal processing utilized NASA-LaRC
FORTRAN computer models of microbursts [3] and glideslope geometry, modified by
Westinghouse to include its own models of multiple time around echo (MTAE, STAE) and
distributed sidelobe clutter.
378

The objectives of the ORLANDO flights were to collect data on microbursts and to
demonstrate airborne real-time processing and hazard factor display. The Orlando
Flights were conducted with signal and data processing operating (loading the
_imeline) but with _ cursory signal proceesing enabled only. In general, the many
thresholds and adjustable processing parameters in the signal processing algorithm
were "de-sensitized" to insure that any and all Doppler reports would be passed to
the VCR map displays. The objective was to unhinderdly collect any available data on
microbursts. Real time processing of the wind blown rain return into velocity maps
and hazard factor maps would allow the pilot and test crew to penetrate the
microbursts, collect in situ (SUNDSTRAND) data, and otherwise corroborate the
airborne displayed and recorded data with TDWR.
The installation on the BAC-I-II (see figure 3) utilized a configuration in
anticipation of the Continental Airbus installation to follow. A typical ARINC 708
(i.e. retrofittable) 30 inch flat plate phased array antenna was controlled through
the sequencer. Data collection would include I&Q pulse and gated EFT radar data, INU,
and air data input to the SUNDSTRAND reactive device in addition to the VCR formatted
displays.
The BAC-I-II operated in a fashion with the air traffic controllers and TDWR
radar operators not unlike the preceeding NASA flights. Safety of flight
considerations included minimum altitude limitations and air space restrictions.
Using the voice and data link established by NASA earlier, the TDWR operators would
vector the aircraft to the vicinity of the microburst. Based on pilot observations
and TDWR radar reflectivity, Doppler, and/or hazard factor, the aircraft might
penetrate the microbursts.
The Westinghouse flights were greatly aided by the fact of the real time
airborne radar instrumentation display (see figure 4). The aircraft was directed to
the vicinity of microburst activity by the TDWR, and the pilot used the radar display
to locate a particular cell, assess the flight safety, and navigate through with
little problem. As the data collection proceeded and the radar demonstrated its
abilities to locate microbursts at long range, Westinghouse could approach general
areas of activity and pick among evolving events. The VCR display format for both the
Orlando and the Continental flight tests was constructed to the arguable convenience
of engineers, and crowded a lot of instrumentation into a small space. Range (out to
8 n.mi. in range gates of 300 m.) x Azimuth (z23") (S Scope) maps were provided for
two bars of azimuth data, one bar at a lower elevation angle than the other. Each
pixel on the screen represents a range gated angle cell of 16 colour shade coded
data.
The maps at the top of the VCR format are unscaled amplitude (i.e. S/N) . The
"bland" colour palette employs red as a large amplitude signal and blue-green as
minimal (near noise). The upper bar is on the right and the lower bar is on the left.
Below these amplitude maps are the velocity maps for the respective bars. Green
indicates zero velocity, yellow-red indicate tailwinds of increasing magnitude and
blue indicates increasing headwinds (±24 m/s or 3 m/s per colour shade) . The odd
rectangular window on the left is a B-scope lower bar horizontal hazard display. Most
379

people will find the PPI format of "total" hazard factor in the lower right corner
most assessible. Hazard factor colour quantization spanned _.2 (0.025 per shade). The
space not used by the colour coded maps allows numerical discrete data. Activity of
the signal processing numeric words provides engineers indications of proper activity
of critical stages of the process. Along the bottom are indications of azimuth and
elevation antenna position, aircraft location (lat.-long.), altitude, etc. Space was
also allocated for SUNDSTRAND reactive hazard factor display and alphabetic
annunciation.
The BAC-I-II was vectored to some 80 different microburst events by the TDWR
operators. Many of those events included multiple "isolated" cells and complex "line"
events. In all, the radar collected data on over 100 microbursts in three afternoons
of flight.
VCR tapes of the instrumented VCR format and views of the intercepts out the
windshield will be shown.
The first video begins with a full screen display of the VCR instrumentation
format. The amplitude, velocity, and hazard factor maps at the start of this run are
full of activity in progress at near and very far (8 n.mi.) ranges. The cells of
interest are being discussed by the pilot and TDWR. The airborne radar operator
begins directing the pilot's attention to a beginning event. The audio contains
conversation between the pilot and crew over the intercom and with the air traffic rf
communication including the TDWR. The video transitions to a view out the pilot's
windscreen with the instrumentation shrinking into the lower left corner of the
screen. Subsequently, only the total hazard factor PPI map (true perspective) is
shown. The visual shows little sign of outflow in the rain cell. As the penetration
evolves, the microburst developes hazard factor displays portraying many shades of
colours, including nearly .2 (top red). TDWR corroboration (post-flight de-briefing)
placed the hazard factor along the flight path at .16, and the audio includes a pilot
report of 500 ft. altitude loss for a penetration which began at an altitude under
2000 ft.
The second video segment begins as the plane (windscreen visual) emerges from a
prior run on a rain core. The plane manuvers slightly under TDWR direction,
approaching a lake. Careful visual inspection of the lake surface will reveal an
outflow. The air volume above the lake is clear. The radar display picks up indicated
outflow activity in both the upper and lower bars of its scan patterns, and the
hazard display shows a weak hazard factor at about 6 n.mi. as the aircraft turns and
steadys under radar operator/radar display direction. Post flight de-briefing with
TDWR corroborated a microburst forming with an outflow of +5 dBz. reflectivity. As
the BAC-I-II approaches, pilot comments indicate little or no visual _e-of a
reflective rain core. The final audio remarks indicate the physical encounter with
the windshear.
38O
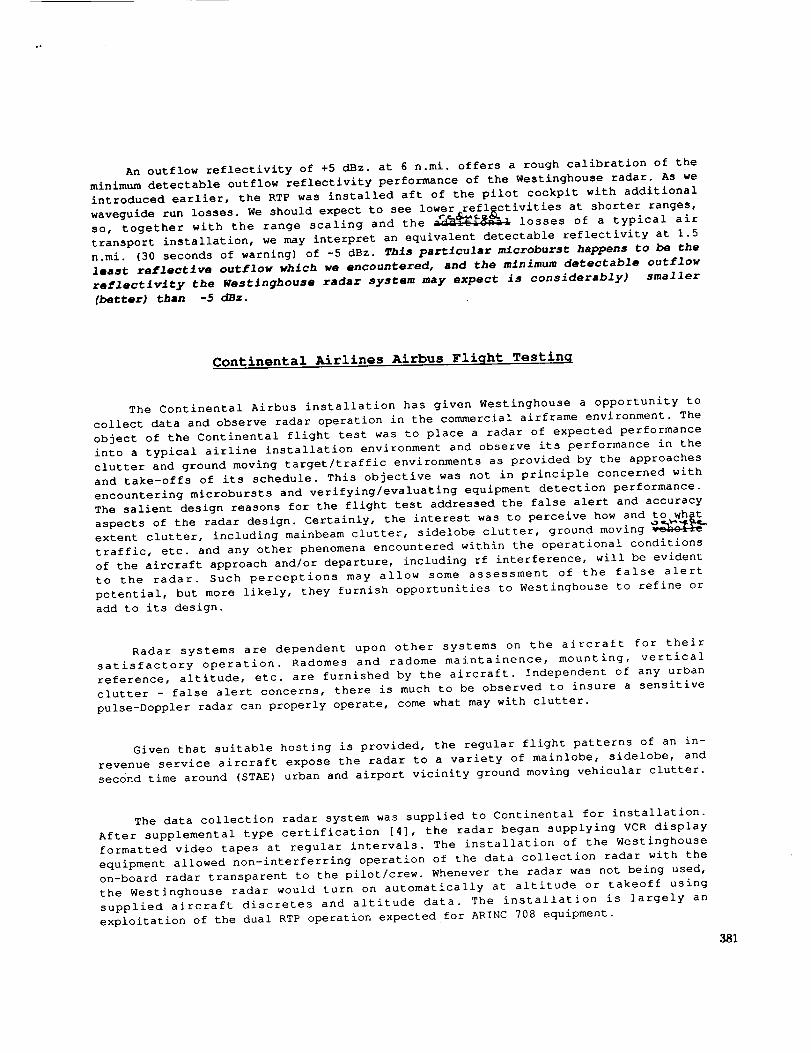
An outflow reflectivity of +5 dBz. at 6 n.mi. offers a rough calibration of the
minimum detectable outflow reflectivity performance of the Westinghouse radar. As we
introduced earlier, the RTP was installed aft of the pilot cockpit with additional
waveguide run losses. We should expect to see lower reflectivities at shorter ranges,. . _,_-g_&_ -
SO, together with the range scaling and the a__:azvna_ losses of a typical air
transport installation, we may interpret an equivalent detectable reflectivity at 1.5
n.mi. (30 seconds of warning) of -5 dBz. This particular microburst happens to be the
least reflective outflow which we encountered, and the minimum detectable outflow
reflectlvity the Westinghouse radar system may expect is considerably) smaller
(better) than -5 dBz.
Continental Airlines Airbus Fliqht Testinq
The Continental Airbus installation has given Westinghouse a opportunity to
collect data and observe radar operation in the commercial airframe environment. The
object of the Continental flight test was to place a radar of expected performance
into a typical airline installation environment and observe its performance in the
clutter and ground moving target/traffic environments as provided by the approaches
and rake-offs of its schedule. This objective was not in principle concerned with
encountering microbursts and verifying/evaluating equipment detection performance.
The salient design reasons for the flight test addressed the false alert and accuracy
aspects of the radar design. Certainly, the interest was to perceive how and to what
extent clutter, including mainbeam clutter, sidelobe clutter, ground moving _
traffic, etc. and any other phenomena encountered within the operational conditions
of the aircraft approach and/or departure, including rf interference, will be evident
to the radar. Such perceptions may allow some assessment of the false alert
potential, but more likely, they furnish opportunities to Westinghouse to refine or
add to its design.
Radar systems are dependent upon other systems on the aircraft for their
satisfactory operation. Radomes and radome maintainence, mounting, vertical
reference, altitude, etc. are furnished by the aircraft. Independent of any urban
clutter - false alert concerns, there is much to be observed to insure a sensitive
pulse-Doppler radar can properly operate, come what may with clutter.
Given that suitable hosting is provided, the regular flight patterns of an in-
revenue service aircraft expose the radar to a variety of mainlobe, sidelobe, and
second time around (STAE) urban and airport vicinity ground moving vehicular clutter.
The data collection radar system was supplied to Continental for installation.
After supplemental type certification [4], the radar began supplying VCR display
formatted video tapes at regular intervals. The installation of the Westinghouse
equipment allowed non-interferring operation of the data collection radar with the
on-board radar transparent to the pilot/crew. Whenever the radar was not being used,
the Westinghouse radar would turn on automatically at altitude or takeoff using
supplied aircraft discretes and altitude data. The installation is largely an
exploitation of the dual RTP operation expected for ARINC 708 equipment.
381

After returning to Baltimore, a different, more vivid colour palette was
introduced to highlight activity. In general, the velocities of the outflows did not
begin to approach 24 m/sec, so the velocity scale was reapportioned to _16 m/sec. The
I and Q data recorded during the BAC-I-II Orlando flights could be re-played through
the RTP to produce new VCR displays and maps. The new palette uses a black background
for zero activity. The amplitude scale indicates max (saturating) amplitudes by white
decreasing to red, yellow, blue, green. The new velocity scale uses black for zero
doppler with yellow, red as increasing magnitude tailwinds and green, blue, purple as
increasing magnitude headwinds. The hazard factor uses black as zero, with yellow,
red, magenta as increasing hazardous windshear and green to blue as increasing
performance enhancing windshear.
The Orlando flights collected a mountain of radar data on microbursts. In
general the clutter background was not worst case urban clutter, but some data was
collected in/over the Orlando airport when it was closed to air traffic by the
storms. This data allowed empirical studies of signal processing thresholds to reject
non-windshear and ensure that windshear-like returns are retained without apparent
loss. In situ data collection was limited. Air data collection was included at the
last moment and its quality/collection is under examination and is questionable. TDWR
radar data, available each day immediately after the respective flights, was used to
"calibrate" the reflectivity/sensitivity of the radar, Doppler, and horizontal hazard
processes of the data collection hardware and signal processing algorithms. Given
their often differing perspectives on the events, the airborne and ground based
radars produced excellent agreement in velocity and hazard factor and time and
physical registration.
The Continental installation was initially equipped with unmodified Orlando
signal processing algorithms. These algorithms were tailored to ensure that windshear
would not be inadvertently editted/rejected, etc. Hence, the initial installed
software configuration furnished only the simplest of mainbeam clutter processing as
a means of rejection. Subsequent software updates included total hazard factor
construction and a sliding window detection (400 m. range window with an window
average F=.I05 threshold) and optimized signal processing. All subsequent software
loads were developed in the signal processing lab using the spare RTP unit as a test
bed. The range gated in-phase and quadrature A/D data recorded during the flights for
particular (i.e. hazardous) cases was played through the unit to check the
performance of the PROMS (programmable read only memory chips) _ destined for the
Continental Airbus. Hence, the signal and data processing algorithms updating the
Continental were verified to produce hazard factors, cautions, and warning alerts in
correspondence to the corroborated Orlando microbursts. The software updates retain
detection performance during periods of urban airport approach clutter false alert
rejection algorithm observation, experimentation, and refinement.
The latest software load included parameters and thresholds for the signal
processing algorithms as determined empirically from reprocessing the Orlando flight
test data.
382

The video segment shows _sample in-revenue service landing approach for two
different software loads in side-by-side comparison into the same (Newark) airport.
Although the PPI total hazard factor display of the earlier (incomplete) software
load shows some caution and hazard factor activity (from the spurious returns
entering the velocity map from sidelobe leakage of discrete targets), it might well
be considered remarkably "clean" were it not for the other PPI display being
absolutely free of any such false cautions and/or alerts, even down to minimum
altitude (weight on wheels). This video short indicates the power of the combined
signal and data processing of the final configuration.
The map/instrumentation displays of these two runs were not, of course,
collected simultaneously. However, the results portrayed are representative of the
false alert performance to be viewed on all the landing approaches and takeoffs of
the respective configurations.
The Continental flight tests have allowed Westinghouse to observe the commercial
air transport operating and clutter environments. The equipment has performed largely
as expected. Software loads have demonstrated by superposition the power of signal
processing in rejecting sidelobe/vehicle traffic leakage while fully retaining
microbursts, i.e. the signal processing algorithms and data processing algorithms
operated satisfactory on the collected microburst data without any detection losses.
The thresholds for sidelobe/GMTI rejection were empirically determined to retain
microburst windshear by training with the Orlando microburst data. The Continental
flight test data argues that a combination of modern signal and data processing
algorithms can eliminate false alerts without compromising necessary detection
performance..
3_
Summary
I. Westinghouse has provided a new design pulse-Doppler lookdown radar for the air
transport market.
2. With the help of the FAA and TDWR and the procedures established with them during
the NASA LaRC flights, unprocessed quantitative (FFT) airborne data was collected in
Orlando on over 100 separate microbursts, including real time hazard factor maps.
3. Westinghouse demonstrated the first airborne real-time detection of microburst
windshear using airborne radar signal, data and hazard factor processing.
4. With the help of Continental Airlines, clutter data on many urban airports has
been sampled within the context of the westinghouse design.
5. Westinghouse has used the raw [I,Q,FFT) data collected in Orlando on hazardous
microbursts to verify that its subsequent software loads have retained the necessary
hazard detection performance. [False alert suppression has not been achieved at the
expense of detection performance.]
6. westinghouse has demonstrated airborne real time sidelobe/GMTI clutter rejection
and a potential for satisfactory false alert operation. [Demonstration of 100,000
flight hour false alert times takes a long time.]
References
384
I. B.Mathews, "Sabreliner Flight Test for Airborne Windshear Forward Looking
Detection and Avoidance Radar Systems", Airborne Wind Shear Detection and Warning
Systems, Third Combined Manufacturers' and Technologists' Conference, Oct. 16-18,
1990, NASA Conf. Pub. 10060, pt2, DOT/FAA/RD-91/2-II, p 715-754
2. I.Miller and J.Freund, Probability and Statistics for Engineers, Prentice Hall,
1965, p 233-235
3. C.L.Britt, User Guide for an Airborne Windshear Doppler Radar Simulation IAWDRS)
Pro_, NASA Contractor Report 182025, DOT/FAA/DS-90/7, June 1990
4. G.Tsoucalas, "Continental Airlines Certification Plan", Westinghouse Predictive
Windshear Radar Installation on Continental Airbus A300-B4 Aircraft", _EF: FAA
Project No. ANMI001-2145, (undated) 1991

Success by Empirical RefinementConcerns ! Expectations
°_ 8190
LookdownData
"1
%k,+',_-,TY
"Total" HazardDetection 2
Production
Certification
Detection With ReJecllon
"Detection"
Display
8126191
fig. 1 Overview of Approach
Low false alarm rate radar design must address mainbeam and sidelobe realities,
particularly for sensitive detection near urban airports. Westinghouse has
stressed the empirical detailed understanding of both microburst and urban airport
clutter radar return in its design approach.
The Name of the Game ... Separatethe Wind Return from Clutter
Ta rge t _, _,,,,
Extraction
Aan_+I)0_HetSCect+_n+AC..lllylelSllUflt+o.
I-Sl
BIB Amplitude
FFT _ Conditioningand
Processing
0 +3@ktl .30ktl O
DOpplerfmerl
ss
+-+- -- I++........:: ii! i.-,:_,_ Data_
Processing . ,,+11
fig. 2 the Name of the Game... Separate the Wind Return from Clutter
Clutter and ground moving vehicular traffic returns must be separated from
microburst outflow reurns. This begins with a hardware design attendant of pulse
Doppler realities and continues through digital algorithms to keep the wind blown
rain and disregard non-windblown rain-like returns.
385

BAC 1 - 1 1 Data Collection
Configuration
Cockpit Camera
Antenna
Operator
Station
Cockpit Recorder
Radar Video
Recorder
Instrumentation
Recorder
INSEngineering /HIl|t%%% - GPS
StationAircraft Data
fig. 3 BAC-I-II Installation
The BAC-I-II installation includes ports for recordin_ a variety of radar
instrumentation and aircraft data.
Lower Bar
AmplitudeUpper BarAmplitude
Lower Bar
Velocity.Upper Bar
Velocity
Horizontal Horizont a I
Hazard Hazard
GW2(_9(19C2bD3_ "
fig. 4 VCR Instrumentation Format
The VCR format allowed collection of a great quantity of data of differing types.
The discrete words included aircraft data and general processor health/activity
parameters. The velocity display covered z24 m/s in Orlando with 16 colour shades
(_16 m/s on Continental Airbus). The hazard factor map covered -0.2 _ f S +0.2

Acquisition and Use of Orlando, FL and Continental Airbus Radar Flight Test Data
Questions and Answers
Q: Roland Bowles (NASA Langley) - Do you consider the ground clutter problem, both fixed
and ground moving, solved?
A: Bruce Mathews (Westinghouse) - Yes, I do. The only thing I see remaining is a
demonstration of the hazard factor accuracy in the presence of competing clutter.
Q: Roland Bowles (NASA Langley) - On a couple of the charts I saw the words "proven
performance." On what kind of scientific basis do you claim proven performance, and would that
be admissible in your certification initiative?
A: Bruce Mathews (Westinghouse) - I am not sure what is admissible to certification. We are
engineers we are not scientist, we are not doing science. We have a great deal of faith and
understanding in the principles of radar. We believe what we see, and it correlates very well with
the TDWR. When they say they have an outflow reflectivity and velocity and we get the same
thing, that is what we expect, and we are getting it. We do have a limited amount of In Situ data
that we collected. We do not have a great deal of faith in it and there is not much we can dobecause it is limited.
Q: Roland Bowles (NASA Langley) - Do you plan to get it?
A: Bruce Mathews (Westinghouse) - We plan to get it this summer.
Q: Roland Bowles (NASA Langley) - Can you show us how your radar correlated, in your one
hundred events, with the TDWR data?
A: Bruce Mathews (Westinghouse) - I think we can show that, yes. But, I don't have a
viewgraph to show it right now.
Q: Roland Bowles (NASA Langley) - Dave Hinton talked about this yesterday, and I think
Steve Campbell will further elaborate on it. Depending on how you flew and where you were
relative to the divergent center, the TDWR could be viewed as significantly overestimating. We
went through a very careful selection criteria to pull out the microburst encounters that really
warranted detailed inspection. I would appreciate it if you could show us sometime what you
have done, maybe later in the conference.
A: Bruce Mathews (Westinghouse) - Well, we are hoping to get that data. We do not have In
Situ data, so we can't give you that kind of analysis. That is all there is to it. The data we have
from our Sundstrand is very unsatisfactory.
Q: Jim Evans (MIT) - First, I would like to make a comment on the value of In Situ data. One
of the key issues is the altitude dependence of the outflows, and where you are measuring versus
where you should be measuring. We are flying our tests up at 1000 feet or above and we think
the threat is a lot worse at lower altitudes. I think that is the first point we ought to recognize.
387

The value of In Situ is somewhat limited here because in fact you are not totally realistic as to
where you should be flying. But that leads to another question. At what altitude where you
attempting to measure in the measurements that we saw here? That is a very important issue in
terms of your overall system performance and it has important implications. You did not really
say at what altitude your antenna measures?
A: Bruce Mathews (Westinghouse) - We showed a two bar scan. We have one bar which we
call an upper bar which points up and its principle purpose is to look at the reflective core and to
make a higher altitude measurement of the outflow. As you can see in some of the displays, there
was a stronger outflow in that upper bar than in that lower bar. The lower bar looks as near to
the glide slope as a function of altitude as we dare. We tend to pick the beam up to keep the
receiver from saturating, to stay in linear operation and to avoid unwanted clutter and saturation
effects in the receiver. We picked the beam up as we come down in altitude. Now for these flight
test in Orlando that beam was probably not doing a lot because we were flying fairly level at 1000
feet. When we land into Newark we are picking the beam up as a function of altitude controlling
the beam with aircraft data. That is why the Continental Air Bus flight is important, to see how
well that algorithm works. Some of the adjustments we wave made were to pick that up a little
bit faster, because we saw a little bit more three sigma chatter in the elevation accuracy of the
antenna than we had anticipated. Summarizing, we seek to make an estimate or a statement of
the hazard factor along the glide slope that the pilot is flying. We look with two beams, one well
above the glide slope and one very near to the glide slope to make that estimate.
Q: Pete Sinclair (Colorado State University) - How was the vertical motion determined?
A: Bruce Mathews (Westinghouse) - Westinghouse determines the vertical hazard factor using
an algorithm which we would say is an extension of the NASA work that Dan Vicroy has
reported. Because we have a two elevation bar scan, we measure the outflow velocities at two
altitudes. Now, if you have two points you can draw a line between them. If you have a linear
polynomial and you integrate it like you would for a conservation of mass principle, like Dan uses
in his treatment of vertical estimation, you would get a quadratic polynomial, and that is what wedo.
Q: Pete Sinclair (Colorado State University) - Was aircraft data or radar data used in thiscalculation?
A: Bruce Mathews (Westinghouse) - It is all radar data.
Q: Pete Sinclair (Colorado State University) - At what altitude is the calculation valid?
A: Bruce Mathews (Westinghouse) - The altitude is the altitude along the glide slope, that is
what the calculation is made for. It is for every range gate along the glide slope. There is a
separate vertical hazard factor calculated for each one of those range gates.
388

Session V. Doppler Related Research
389

390