seswa regional seminar bmp selection criteria
TRANSCRIPT

Doug Beisch - PrincipalStantec
March 31, 2017
SESWA Regional SeminarBMP SELECTION CRITERIA

Goals and Objectives
• Design Goals and Objectives• Multi-Function BMPs• Innovative Approaches

Background Questions:
• How many of you are designers?
• How many of you review and approve plans?
• How many of you routinely see “LID” approaches incorporated into projects?
BMP Design Goals and Objectives
• Site Drainage• Erosion and Sediment Control• Runoff Quality Management• Receiving Channel Protection• Flood Control

Evolution of Approaches:Runoff Quality
Ignored Entirely
Sediment Control
Conventional Ponds
Volume-Focused
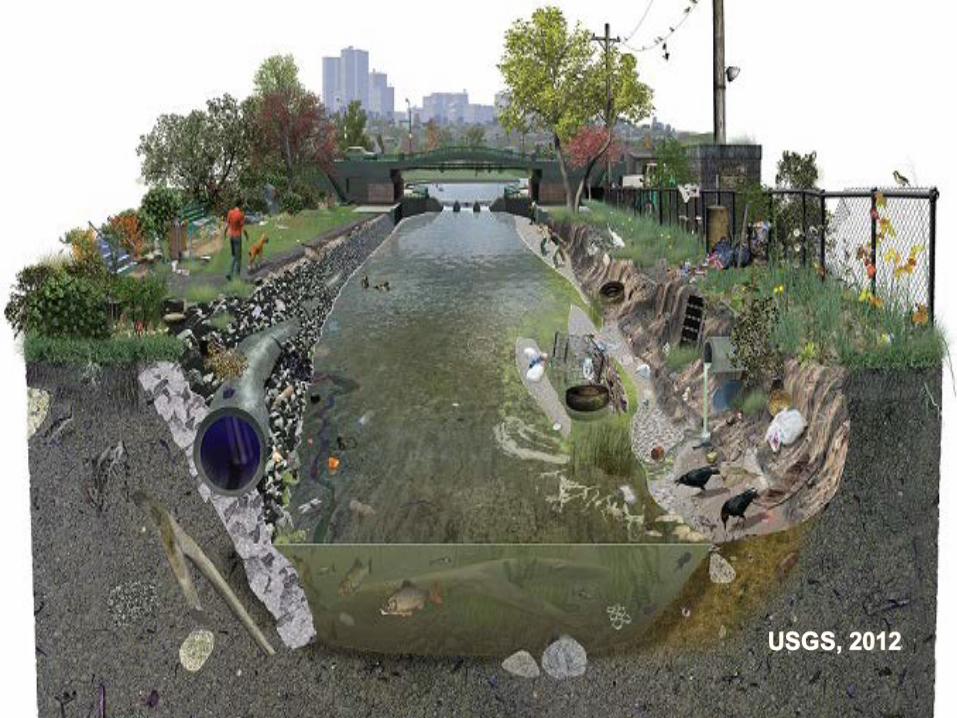
USGS, 2012

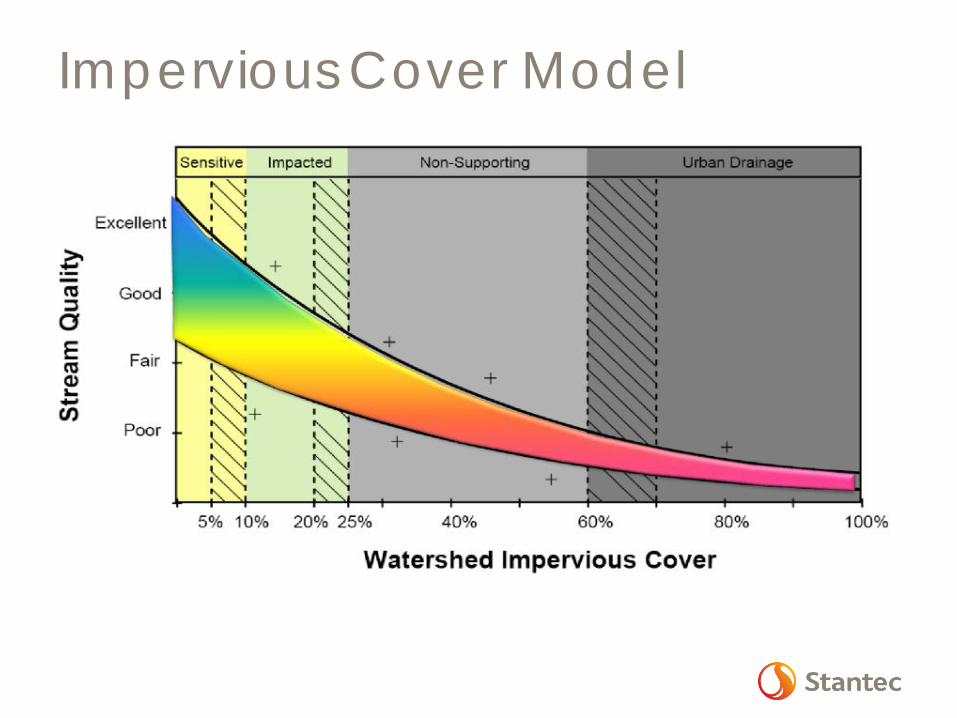
Impervious Cover Model

Managed Turf• Documented impacts from turf
management activities:• Fertilization;• Pest management;

Site Runoff Coefficients (Rv)1
Cover HSG A HSG B HSG C HSG D
Forest/Open 0.02 0.03 0.04 0.05
Managed Turf / Disturbed Soil 0.15 0.20 0.22 0.25
Impervious Cover 0.95 0.95 0.95 0.95
1 Center for Watershed Protection – Technical Memorandum: The Runoff Reduction Method; 4/18/08
Pitt et al (2005), Lichter and Lindsey (1994), Schueler (2001a, 2001b, 1987), Legg et al (1996), Pitt et al (1999), and Cappiella et al (2005)

First Step in BMP SelectionEnvironmental Site Inventory & Assessment
• Forest conservation• Suitable soils• Steep slopes• Drainage• Wetlands• Zero-order streams• Buffers• Sensitive areas • Limits of disturbance• Computed nutrient
loads & tv

Site and Subdivision Planning
• Resource Assessment• Conservation/Preservation• Resource Enhancement and
Restoration• Floodplain Protection• Maintaining Natural Drainage Patterns• Disconnecting Impervious Cover

The Starting Point - Resource Assessment• Aquatic Resources
• Stream Channel Condition Assessments• Geomorphic – Channel Stability• Hydrologic/Hydraulic Modeling• Bioassessment - Macroinvertebrates• Stream Condition Units (mitigation/impacts)• Perenniality Studies• Wetland Functional Assessments
• Terrestrial Resources• Forest Stand Delineations/Forest Cover Mapping• Buffer Assessments• Rare Plant Surveys• Inventory of existing erosional features

Permeability Slope LandPlanning
Depthto GW
Overall IMPSuitability
Suitability Screening:New Development

Conservation/Direct Runoff to Natural Areas (Resource Enhancement)
• Opportunities• Buffer
Enhancement• Reforestation/
Afforestation• Channel and
Wetland restoration/enhancement
• Soil amendments/restoration• All have measurable effects of runoff
characteristics, erosion, sed. transport

Floodplain mapping and protection
Floodplain Conveyance - relief culverts and open bottom crossings
Floodplain Enhancements –reforestation, added flood conveyance, wetland creation, reconnection, removal of obstructions
Natural Channel design –stable sediment transport
Maintain Natural Drainageways(Floodplain Management & Protection)

Water Quality - Treatment
0
0.25
0.5
0.75
1
Current Requirements New Requirements
Load
(lb/
ac/y
r)
Required Level of Treatment
Allowable Load (lb/ac/yr)
Required Treatment
0.45

Treatment Options
Pollutant Removal Practices
Minimization/ESDLID/Volume Reduction Practices

Stormwater Practices Differ Sharply in Ability to Reduce Runoff Volume
Bioretention, Infiltration, Dry Swales, Soil Amendments, disconnection, and Related Practices Reduce Runoff Volumes by 50 to 90%
Wet Ponds, ED Ponds and Constructed Wetlands and Filters Reduce Runoff Volumes by zero to 10%


Multi-Function PracticesSite
DesignRunoff
ReductionPollutant Removal
1. Rooftop Disconnection
2. Filter Strip
3. Grass Channel
4. Soil Amendments *
5. Green Roof
6. Rain Tanks & Cisterns
7. Permeable Pavement
8. Infiltration
9. Bioretention
10. Dry Swales
12. Filtering Practices
13. Constructed Wetlands
14. Wet Ponds
15. ED Ponds

Tools in the Toolbox
1. Impervious Disconnection
2. Sheetflow to Conservation Area/Filter Strip
3. Grass Channels4. Soils Compost
Amendments5. Vegetated Roofs6. Rainwater Harvesting7. Permeable Pavement
8. Infiltration9. Bioretention (including
Urban Bioretention)10.Dry Swales11.Wet Swales12.Filtering Practices13.Constructed Wetlands14.Wet Ponds15.Dry Extended
Detention Ponds

Rooftop/Impervious Area Disconnection
Simple Disconnection
Rainwater Harvesting & Cisterns;Micro-Infiltration (dry wells);Rain Gardens Urban Planter

Sheet Flow to a Vegetated Filter Stripor Conserved Open Space
Filter Strip & Open Space Design Criteria

Soil Amendments

Grass Channels
Key Design Consideration: Soils• Infiltration is greatest in HSG A soils;
• Infiltration gradually decreases in HSG B, C and D soils;
• HSG C and D soils lining the bottom of the Grass Channel can be amended to improve performance

Permeable Pavement

Bioretention
Summary of Stormwater Functions 1

3/22/2017 29
Stormwater Quantity Analysis Considering Volume

Treatment Volume & BMP Sizing
𝑇𝑇𝑇𝑇𝐵𝐵𝐵𝐵𝐵𝐵 =𝑃𝑃 × 𝑅𝑅𝑇𝑇𝑐𝑐𝑐𝑐𝑐𝑐𝑐𝑐𝑐𝑐𝑐𝑐𝑐𝑐𝑐𝑐𝑐𝑐 × 𝐴𝐴
12Where:
TvBMP = Design Treatment Volume from the contributingdrainage area to the stormwater practice (does notinclude remaining runoff from upstream practices)
P = 90th Percentile rainfall depth = 1”
Rvcomposite = Composite runoff coefficient
A = Contributing drainage area to the stormwater practice.

Design Rainfall = 90th percentile rainfall depth = 1”
Washington Reagan Airport
0
1
2
3
4
5
6
0% 10% 20% 30% 40% 50% 60% 70% 80% 90% 100%
Precipitation Event Percentile
Prec
ipita
tion
Dept
h (in
ches
)
90th Percentile rainfall depth
1” annual average: Washington Reagan Airport, Richmond Airport, Harrisonburg, Lynchburg, Bristol

Small Storm Hydrology
Volume Management focused on small storms
Focus is on minimizing increases in stream power and energy
Replicating depressionalstorage and abstraction from natural watersheds

Sizing Comparison (+ 5-10%)

Release Rate Comparison

Stream Power Comparison

Challenge
Provide quantity “credit” for distributed retention practices
Avoid Complex routing/modelingAllow designers to target volume as a
primary metric (quantity and quality)Various methods explored

3/22/2017 37

Volume Reduction: Hydrograph Modification
Objective: Account for hydrologic effect of distributed retention storage;
Simplifying Assumptions:– Assume retention is uniformly
distributed if considering multiple features or sub-areas;
– Assume negligible discharge from under-drains (if any)
3/22/2017 39
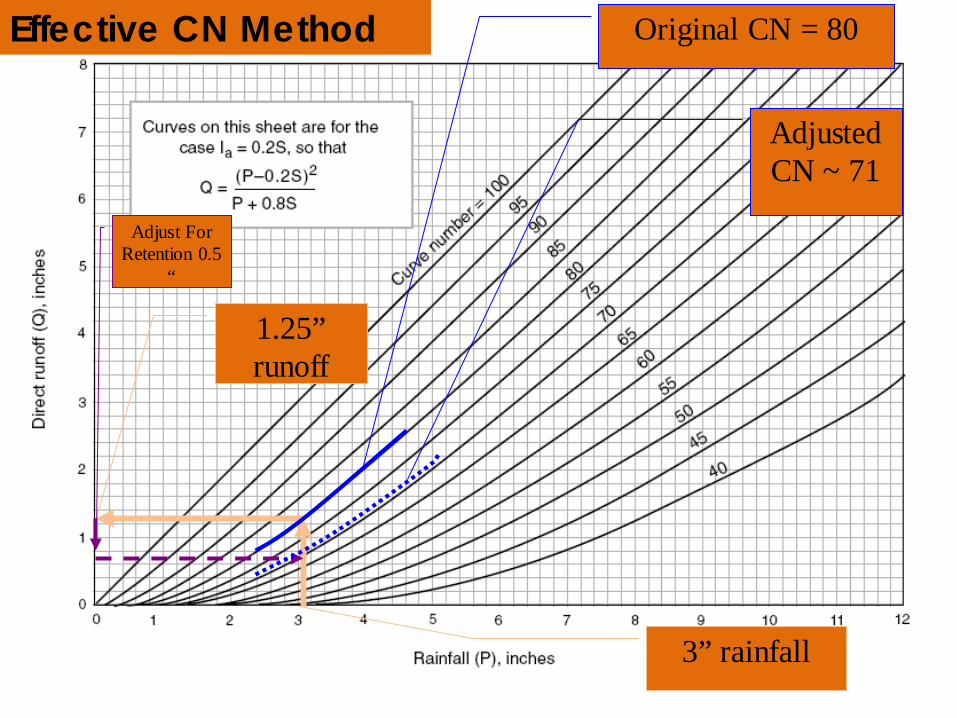
1.25” runoff
3” rainfall
Adjust For Retention 0.5
“
Adjusted CN ~ 71
Original CN = 80Effective CN Method

3/22/2017 40
Site Parameters:~39 Ac, Pre-CN=70, Post-CN=80, Lag time = 20 min(pre/post)
Design ApproachOriginal
CNAdjusted CN(1-year)
Runoff (in)
Add'l Detention Storage
Req'd (ft3) Treatment Approach
Conventional Design 80 80 1.25 73000
Treat with 2 acre wet pond
LID Practices 80 75 0.95 37000
Bioretention, Grassed Channels w/ soil amendments
Better Site Design with LID 80 73 0.85 28000
Reduce Impervious Cover, Reduce Turf Acreage + above
Pre-Development 70 N/A 0.71 N/A N/A

Recurrence Interval
1-yr 2-yr 10-yr
Total Rainfall (in) 2.6 3.5 5.6
Pre-dev CN 70 70 70
Pre-Dev Runoff (in) 0.50 1.01 2.49
Post-Dev CN 80 80 80
Runoff (in.) 0.96 1.64 3.43
Runoff Reduction Vol. (in.) 0.27 0.27 0.27
Net Runoff (w/ RRM, in) 0.69 1.37 3.16
CN Adjusted for RRM 75 76 77
% Redux In Runoff Volume 28.0% 16.4% 7.9%

Questions?
Doug Beisch - [email protected]
Special Thanks to the Center for Watershed Protection for helping to organize training materials for Stantec and the Virginia DEQ. Most figures/images sourced from Virginia DEQ training materials compiled by Stantec and CWP.