setting ccs action priorities for california’s title v 5-year plan family health outcomes project...
TRANSCRIPT
Setting CCS Action Setting CCS Action Priorities for California’s Priorities for California’s
Title V Title V 5-Year Plan5-Year Plan
Family Health Outcomes Project (FHOP)
April 28, 2005
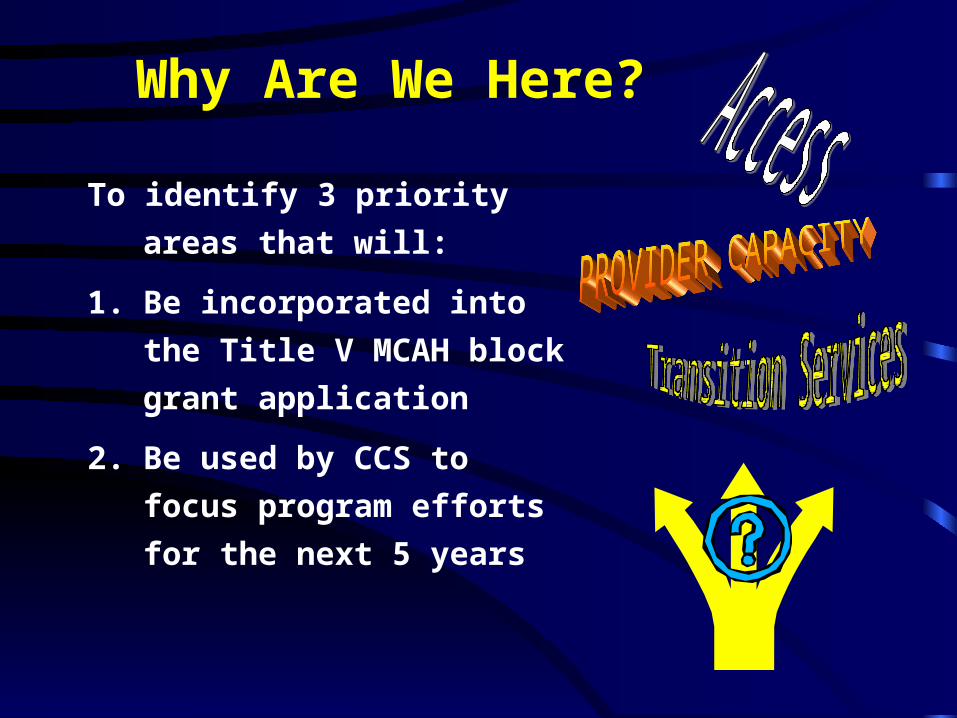
To identify 3 priority areas that
will:
1. Be incorporated into the
Title V MCAH block grant
application
2. Be used by CCS to focus
program efforts for the next
5 years
Why Are We Here?

How will we do it?
• We will follow a formal,
rational and inclusive process
• This will involve using
predefined criteria to prioritize
issue areas identified by the
stakeholders group and CCS
Review of Process to Date
Stakeholders met (1/05)
1. Reviewed objectives and process
2. Selected criteria for setting priorities
3. Weighted criteria
4. Reviewed how data will be presented
5. Met in groups to identify issues/data sources

Review of Process to Date Between meetings
1. Break-out group members reviewed summaries / gave additional input
2. Data requests / Data collection / Data review and analysis
3. Criteria rating scales developed
4. Materials sent to Stakeholders for review
5. Issue areas / objectives identified

Today’s Objectives
• Stakeholders will use criteria to prioritize among identified issues / objectives
• FHOP will facilitate identification of data development agenda
• All stakeholders will have an under-standing of and accept the prioritized areas
• Meeting will lay ground work for next steps in the planning process
• Assure that each stakeholder has equal input to final selection of priorities
• Provide a systematic, rational decision-making process that can be communicated to others
• Provide a way for stakeholders to incorporate both knowledge and values
• Provide stakeholders the same decision-making tools and information
• Assist in selecting a manageable number of priorities
Purposes of the Process Today

Today’s Prioritization ProcessApril 28, 2005
1. Review priority-setting criteria
2. Presentation of data and issue / objective list
3. Review Data and agree on final objective list
4. Review rating method
5. Rate problems
6. Tally scores to produce a group ranking
7. Discuss and confirm results
8. Brainstorm / discuss data development

Review of Criteria
• Criteria: the values or standards the group selected and will use to make decisions about priorities
• Each criterion was given a weight, for example:
1 = important
2 = more important
OR
3 = extremely important

Stakeholder Criteria
WEIGHT1. Problem has great impact on families
3(quality of life / functionality)
2. Problem is important to consumers 3
3. Problem results in great cost to 2 program and/or society (great fiscal impact)
4. Addressing the problem maximizes 2 opportunity to leverage resources / relationships
5. Addressing the problem would increase 2 equity and fairness
6. Likelihood of successful intervention 1
and political will

Criterion Scoring ScalesA numerical scale was developed for each criterion
with an explicit definition for each value. Example:
Criterion: Problem is important to consumers :
1 = Addressing the problem is not important to consumers
2 = ….some importance to consumers
3 = ….moderate Importance to consumers
4 = ….important to consumers
5 = Addressing the problem is a very high priority
for consumers

List of Objectives to Prioritize
• CCS is taking an action-oriented approach
• Issue areas were identified and translated into objectives
• Review list of objectives (in packet)

IndicatorsHow selected: • Interviews• Breakout groups• Availability of data
Most frequently mentioned: • Access to medical specialists • Coordination and communication between
providers• Family access to information

Identified CCS Issues / Objectives

Definitions• CSHCN – children who have or are at
increased risk for a chronic physical, developmental, behavioral, or emotional condition and who also require health and related services of a type or amount beyond that required by children generally
• Title V CSHCN program in CA is CCS
• CCS children - CCS enrolled children are children who have an eligible medical conditions and whose families meet financial eligibility requirements

Data Request
• Requested data from State CMS and from Los Angeles, Orange, and Sacramento counties
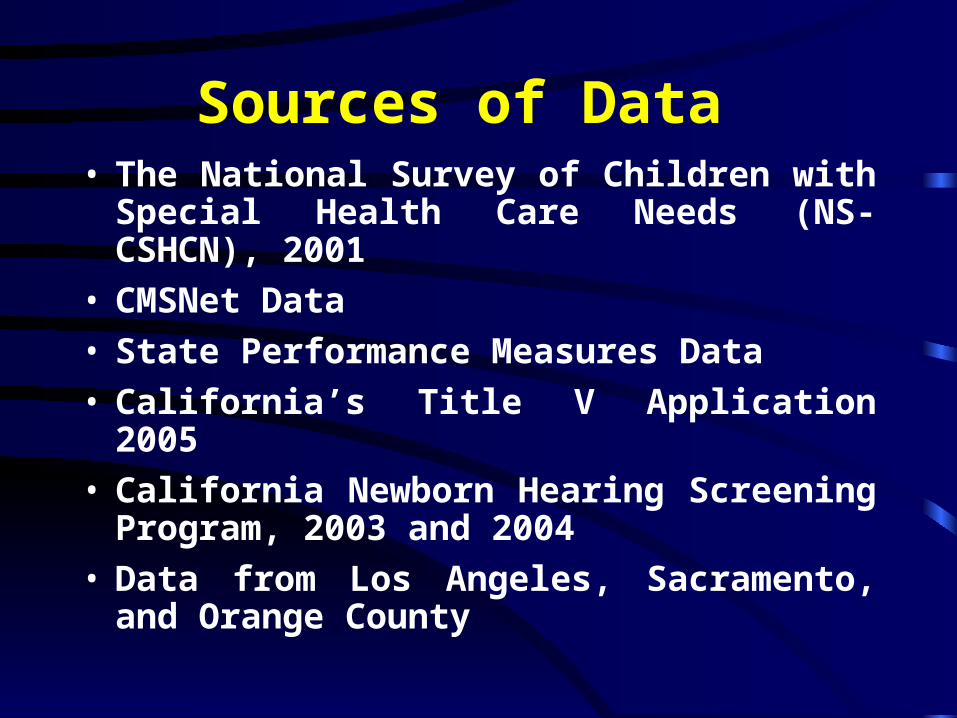
Sources of Data• The National Survey of Children with
Special Health Care Needs (NS-CSHCN), 2001
• CMSNet Data
• State Performance Measures Data
• California’s Title V Application 2005
• California Newborn Hearing Screening Program, 2003 and 2004
• Data from Los Angeles, Sacramento, and Orange County

Data Sources (cont.)• Inkelas M., Ahn P., Larson K. 2003. Experiences with
health care for California’s children with special health care needs. Los Angeles, CA: UCLA Center for Healthier Children.
• Wells, N., Doksum, T., Martin, L., Cooper, J. 2000 What Do Families Say About Health Care for Children with Special Health Care Needs in California? Your Voice Counts!! Family Survey Report to California Participants.
• Halfon N., Inkelas M., Flint R., Shoaf K., Zepeda A., Franke T. 2002. Assessment of factors influencing the adequacy of health care services to children in foster care. UCLA Center for Healthier Children, Families and Communities.

Prevalence Information• 10.3% of CA children are identified as having
special health care needs (vs. 12.8% nationally, p <.05*
• About 15% of CA’s CSHCN receive specialty care through the CCS program (approx.150,000 annually)**
• 80% of CCS children are covered by Medi-Cal**
• Most children were affected by more than one condition:– 37% had 2 or 3 conditions– More than 50% had 4 or more conditions
Source: *National Survey of CSHCN 2001, ** ** Experiences with Health Care for
California’s CSHCN, **Your Voice Counts!! Survey,
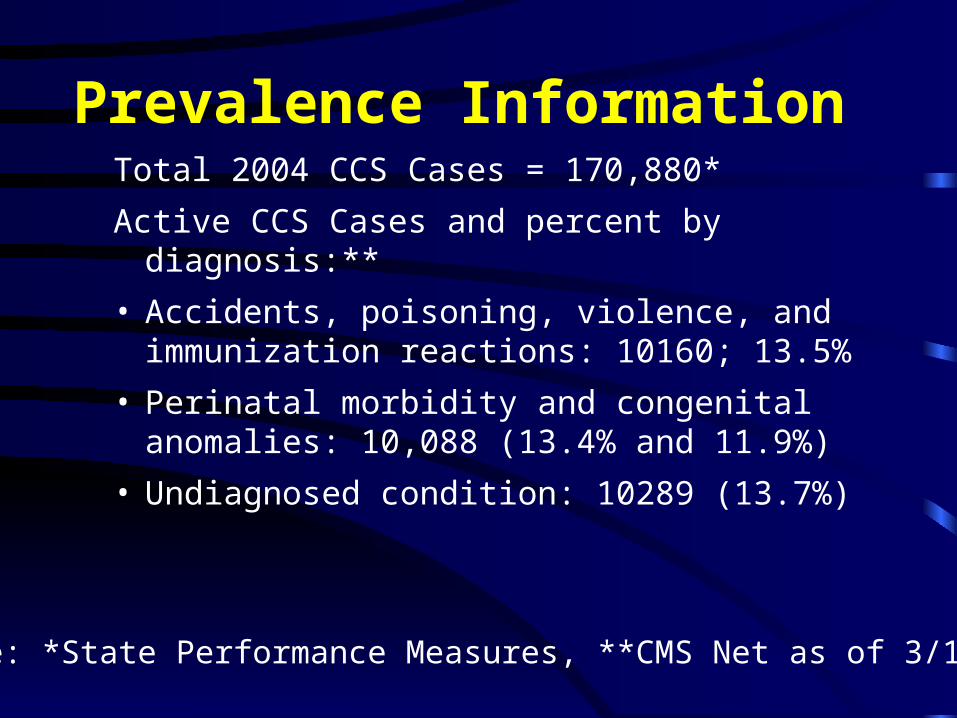
Prevalence InformationTotal 2004 CCS Cases = 170,880*
Active CCS Cases and percent by diagnosis:**
• Accidents, poisoning, violence, and immunization reactions: 10160; 13.5%
• Perinatal morbidity and congenital anomalies: 10,088 (13.4% and 11.9%)
• Undiagnosed condition: 10289 (13.7%)
Source: *State Performance Measures, **CMS Net as of 3/15/05

Prevalence Information• Compared to the nation, fewer CA
children ages 0 to 3, 4 to 7, and 8-11 are identified as CSHCN
• Significantly more of CA CSHCN are Hispanic and fewer are black or white than nationally
• The poorest children in CA (below199% FPL) are significantly less likely than the poorest children in the nation to be identified as CSHCN
Source: National Survey of CSHCN, 2001
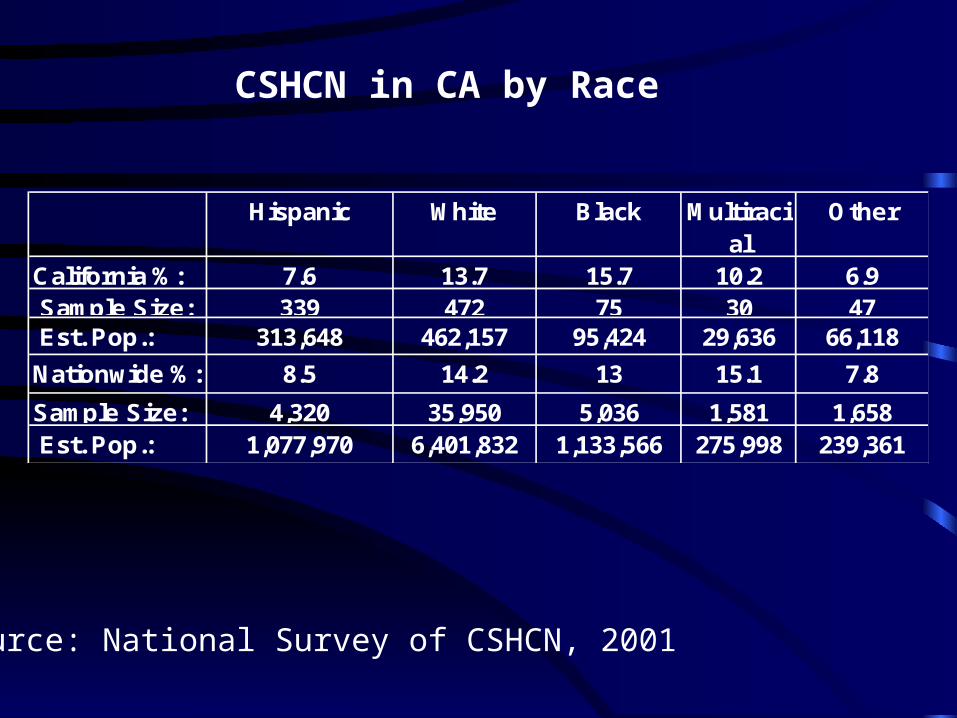
Hispanic White Black Multiracial
Other
California %: 7.6 13.7 15.7 10.2 6.9 Sample Size: 339 472 75 30 47 Est. Pop.: 313,648 462,157 95,424 29,636 66,118
Nationwide %: 8.5 14.2 13 15.1 7.8
Sample Size: 4,320 35,950 5,036 1,581 1,658 Est. Pop.: 1,077,970 6,401,832 1,133,566 275,998 239,361
CSHCN in CA by Race
Source: National Survey of CSHCN, 2001
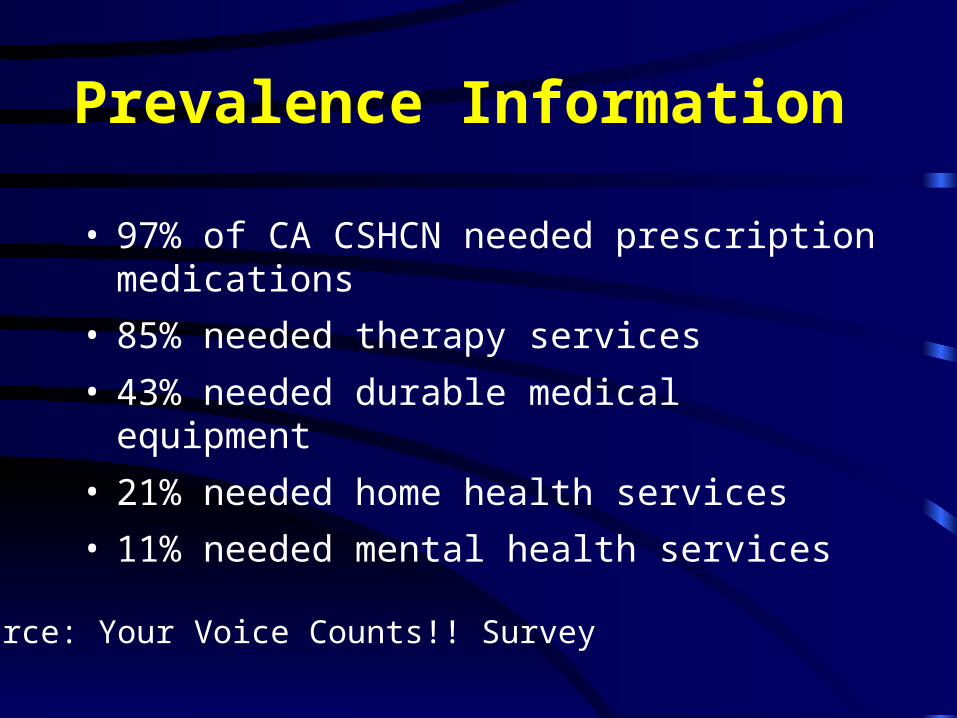
Prevalence Information
• 97% of CA CSHCN needed prescription medications
• 85% needed therapy services
• 43% needed durable medical equipment
• 21% needed home health services
• 11% needed mental health services
Source: Your Voice Counts!! Survey

Prevalence Information• 24% of CA CSHCN have their daily
activities consistently limited or affected by their condition, 40% are moderately affected, 39% are never limited by their condition
• 50% of CA CSHCN missed 0-3 days of school due to illness. 20% missed 4-6 days, 15% 7-10 days, and 16% missed 11 or more days
Source: National CSHCN Survey, 2001

Number of CCS Clients Counties Served in 2004
Medical Home
American Academy of Pediatrics definition:
Medical care that is accessible, continuous, comprehensive, family centered, coordinated, compassionate, culturally effective, and delivered or directed by a well-trained primary care or specialty physician who helps to manage and facilitate essentially all aspects of care for the child.

Medical HomeObjective: Increase number of
family-centered medical homes for CSCHN and the number/% of CCS children who have a designated medical home
• 55% of CSHCN children in CA lack a medical home; significantly more than national rate of 47.3%
• Significantly more insured CSHCN in CA lack a medical home (54.3%) compared to national rates for insured CSHCN (46.5%)
Source: National CSHCN Survey, 2001

Medical Home
• 73.5% of uninsured CSCHN in CA lack a medical home
• In CA, CSHCN without medical homes are significantly more likely to have unmet need for health care services (26.6%) than those without a medical home (15.9%)
Source: National CSHCN Survey, 2001

In CMS Net, medical home is defined as having a primary care provider.
CA Counties vary widely in their percentages of CCS children with a medical home (range 0-100%, average 61%)
• in 33% of counties, 80% had a medical home
• in 25% of counties, between 60 to 79% had a medical home
• in 23% of counties, between 40 to 59% had a medical home
• in 5% of counties, between 20 and 39% had a medical home
• in 14% of Counties have fewer than 20% had a medical home

% of CCS children with a Medical
Home
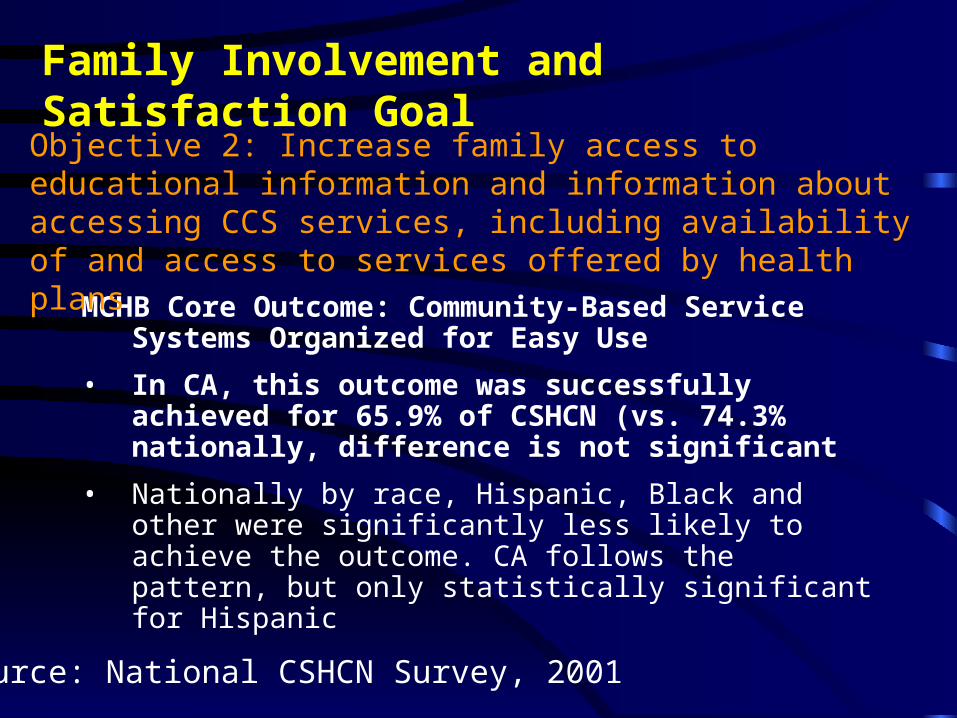
Family Involvement and Satisfaction Goal
MCHB Core Outcome: Community-Based Service Systems Organized for Easy Use
• In CA, this outcome was successfully achieved for 65.9% of CSHCN (vs. 74.3% nationally, difference is not significant
• Nationally by race, Hispanic, Black and other were significantly less likely to achieve the outcome. CA follows the pattern, but only statistically significant for Hispanic
Objective 2: Increase family access to educational information and information about accessing CCS services, including availability of and access to services offered by health plans
Source: National CSHCN Survey, 2001

• By race Nationally, Hispanic, Black and other are significantly less likely to achieve the outcome. CA follows the pattern, but SS only for Hispanic*
• Parents of CSHCN in Medi-Cal reported more difficulty navigating system of services and obtaining health care benefits for child than did parents of CSHCN in other state Medicaid programs**
• 46% of Family Voices survey respondents did not know whether their child was in a managed care plan, while 72% were in a plan with at least one feature of managed care (i.e., such as having a network of doctors or requiring a primary care physician)**
*Source: National CSHCN Survey, 2001, ** Experiences with Health Care for California’s CSHCN, *** From the “Your Voice Counts!!” Survey
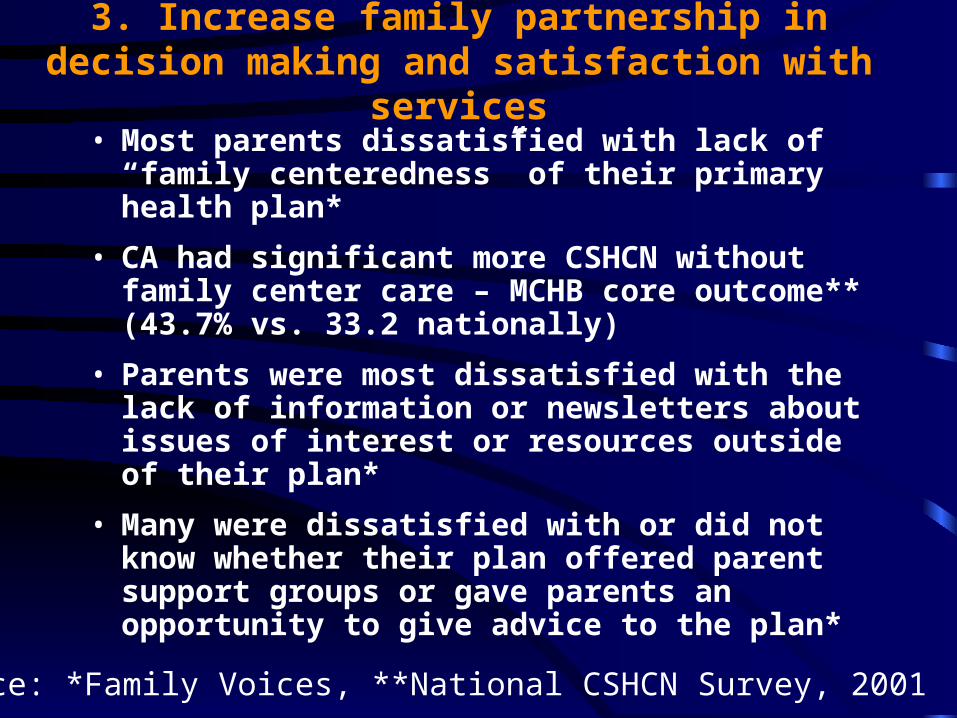
3. Increase family partnership in decision making and satisfaction with
services• Most parents dissatisfied with lack of “family
centeredness” of their primary health plan*
• CA had significant more CSHCN without family center care – MCHB core outcome** (43.7% vs. 33.2 nationally)
• Parents were most dissatisfied with the lack of information or newsletters about issues of interest or resources outside of their plan*
• Many were dissatisfied with or did not know whether their plan offered parent support groups or gave parents an opportunity to give advice to the plan*
Source: *Family Voices, **National CSHCN Survey, 2001
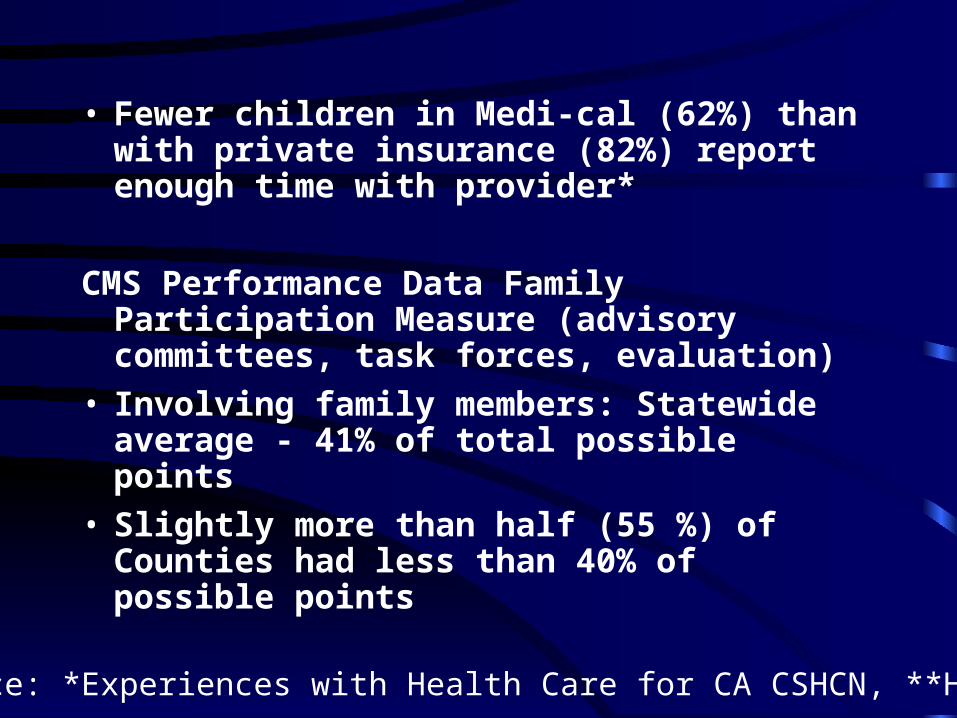
• Fewer children in Medi-cal (62%) than with private insurance (82%) report enough time with provider*
CMS Performance Data Family Participation Measure (advisory committees, task forces, evaluation)
• Involving family members: Statewide average - 41% of total possible points
• Slightly more than half (55 %) of Counties had less than 40% of possible points
Source: *Experiences with Health Care for CA CSHCN, **HRSA

Screening
• 74% of newborns in the state were born at CCS approved hospitals
• In 2003, 90.7% of newborns at CCS-approved hospitals received hearing screening at birth, and 94.3% did so in 2004
Objective 4: Increase the % of infants born in CA who receive newborn hearing screening services.

Screening Data
1999 2000 2001 2002 2003*Annual Indicator
9.80% 13.70% 21.60% 52.20% 52.20%
Annual Performance Objective
10% 10% 15% 40% 60%
Source: From Title V reports – Statewide data
• % of total newborns screened has increased every year since 1999. Title V estimated 52% were screened in 2003

Screening• Screening rates in CCS NICU certified to
participate in NHSP were 86% in 2003 and 91% in 2004.
• There were variations in rates, with Region A (Bay Area and coastal CA) reporting 88%, Region B 86% (northwestern and central CA) and Region C 98% (south eastern CA)

60.0%
80.0%
100.0%
Region A Region B Region C Region D Region E Total %Screened
2003 WBN %
2003 NICU %
2003 Total
2004 WBN %
2004 NICU %
2004 Total
Regional Hearing Screening Rates for 2003-2004

Objective 5. Expand the number of qualified providers participating in the CCS program, e.g., medical specialists, audiologists, occupational and physical therapists, and nutritionists
Insurance Coverage and Access to Care
# Approved Providers
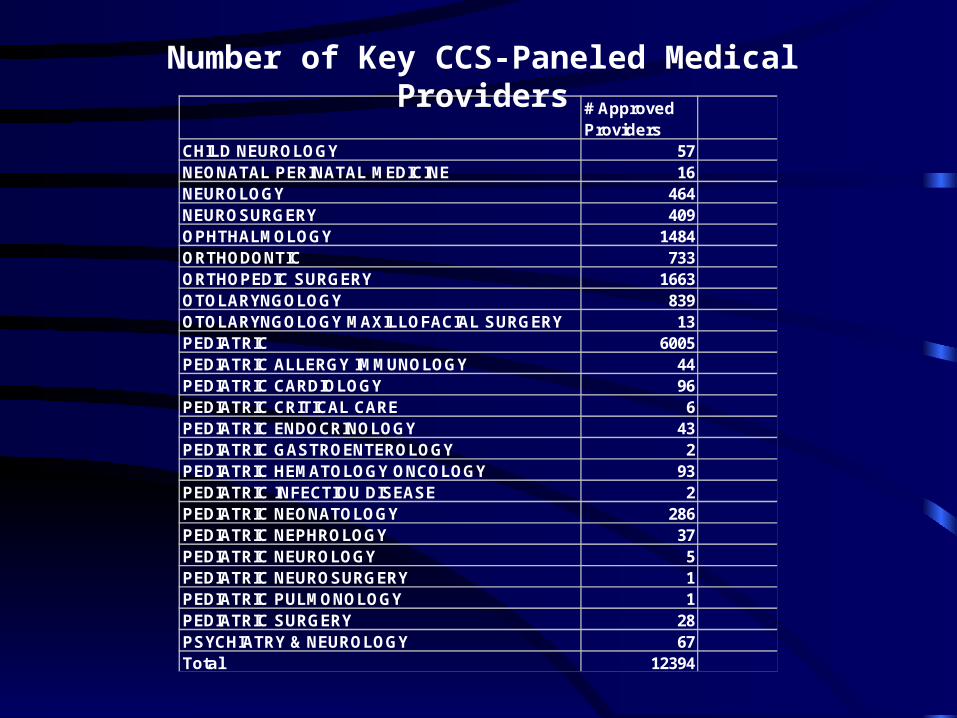
CHILD NEUROLOGY 57NEONATAL PERINATAL MEDICINE 16NEUROLOGY 464NEUROSURGERY 409OPHTHALMOLOGY 1484ORTHODONTIC 733ORTHOPEDIC SURGERY 1663OTOLARYNGOLOGY 839OTOLARYNGOLOGY MAXILLOFACIAL SURGERY 13PEDIATRIC 6005PEDIATRIC ALLERGY IMMUNOLOGY 44PEDIATRIC CARDIOLOGY 96PEDIATRIC CRITICAL CARE 6PEDIATRIC ENDOCRINOLOGY 43PEDIATRIC GASTROENTEROLOGY 2PEDIATRIC HEMATOLOGY ONCOLOGY 93PEDIATRIC INFECTIOU DISEASE 2PEDIATRIC NEONATOLOGY 286PEDIATRIC NEPHROLOGY 37PEDIATRIC NEUROLOGY 5PEDIATRIC NEUROSURGERY 1PEDIATRIC PULMONOLOGY 1PEDIATRIC SURGERY 28PSYCHIATRY & NEUROLOGY 67Total 12394
Number of Key CCS-Paneled Medical Providers

• Number of approved pediatricians per 100 CCS clients varies widely, with 0 in Sierra, 3 in Los Angeles and 15 in San Francisco
• Average of 4 pediatricians per 100 CCS children
• Uncertain which of these approved pediatricians is currently accepting CCS clients
• Problems with CCS provider list

Selected CSS-Paneled Pediatricians by CCS
Cases for 2004 in California
Sources: List of CCS-Paneled
Providers from CMS Branch; Number
of CCS Cases from 2004 County Performance Measures submitted to
CMS
Selected CCS-Paneled Pediatricians by CCS
Cases for 2004 in California
Sources: List of CCS-Paneled Providers from CMS Branch; Number
of CCS Cases from 2004 County Performance Measures submitted to
CMS

Selected CSS-Paneled Physician Specialist by CCS Cases for 2004 in
California
Sources: List of CCS-Paneled Providers from CMS Branch; Number
of CCS Cases from 2004 County Performance Measures submitted to
CMS
Legend for Specialists1 Dot = 5 Specialists (Includes: CHILD NEUROLOGY, NEONATAL PERINATAL MEDICINE, NEUROLOGY, NEUROSURGERY, OPHTHALMOLOGY, ORTHODONTIC, ORTHOPEDIC SURGERY, OTOLARYNGOLOGY, OTOLARYNGOLOGY MAXILLOFACIAL SURGERY, PEDIATRIC ALLERGY IMMUNOLOGY, PEDIATRIC CARDIOLOGY, PEDIATRIC CRITICAL CARE, PEDIATRIC ENDOCRINOLOGY, PEDIATRIC GASTROENTEROLOGY, PEDIATRIC HEMATOLOGY ONCOLOGY, PEDIATRIC INFECTIOUS, DISEASE, PEDIATRIC NEONATOLOGY, PEDIATRIC NEPHROLOGY, PEDIATRIC NEUROLOGY, PEDIATRIC NEUROSURGERY, PEDIATRIC PULMONOLOGY, PEDIATRIC SURGERY, PSYCHIATRY NEUROLOGY)
Selected CCS-Paneled Physician Specialist by CCS Cases for 2004 in
California
Sources: List of CCS-Paneled Providers from CMS Branch; Number
of CCS Cases from 2004 County Performance Measures submitted to
CMS
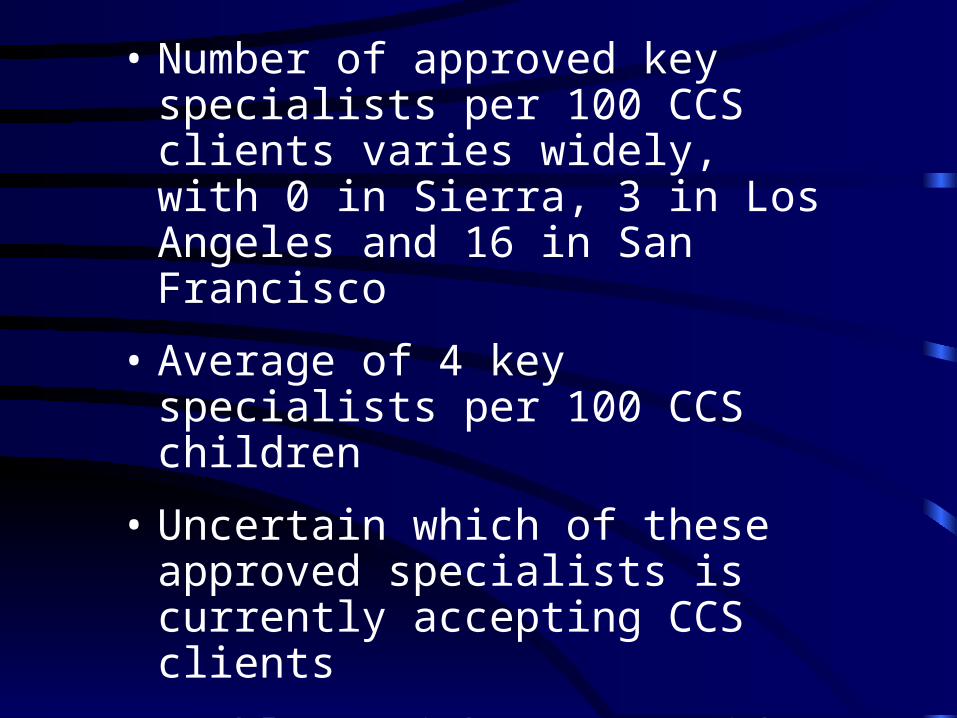
• Number of approved key specialists per 100 CCS clients varies widely, with 0 in Sierra, 3 in Los Angeles and 16 in San Francisco
• Average of 4 key specialists per 100 CCS children
• Uncertain which of these approved specialists is currently accepting CCS clients
• Problems with CCS provider list

= Regional
= Community
= Intermediate
= PICU
CCS Hospitals by County and CCS
Clients

Objective 6. Increase access of CCS children to preventive health care services (primary care, well child care, immunizations, screening) as recommended by the AAP
• Currently, CCS does not collect this data

Objective 7. Increase access to CCS services by increasing the financial eligibility limit ($40,000 limit)
Recent expansions of Medi-Cal and the Healthy Families program have improved children’s financial access to health care. However, having insurance coverage does not guarantee that CSHCN are covered for all the services that they need.
Source: *Experiences with Health Care for CA CSHCN
Private or employer-
based insurance
Medicaid, SCHIP, Title V, or other
public
Combination of public and
private insurance
Uninsured at time of
survey
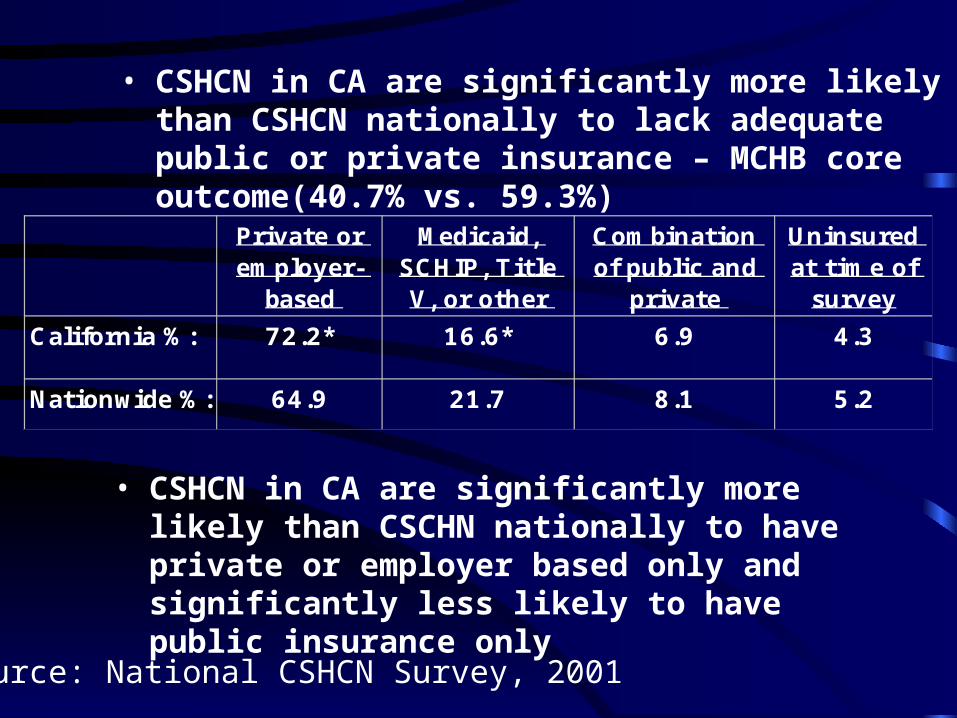
California %: 72.2* 16.6* 6.9 4.3
Nationwide %: 64.9 21.7 8.1 5.2
• CSHCN in CA are significantly more likely than CSCHN nationally to have private or employer based only and significantly less likely to have public insurance only
• CSHCN in CA are significantly more likely than CSHCN nationally to lack adequate public or private insurance – MCHB core outcome(40.7% vs. 59.3%)
Source: National CSHCN Survey, 2001

Objective 8: Increase access to services for CCS youth, 17 – 21 years
• Currently no data available

Organization of Services
• Fewer than 1/3 of local agencies report that judges review a child’s health plan when making decisions about that child’s foster care placement.
Objectives 9: Facilitate the timely referral of foster care children with CCS eligible medical conditions to CCS services
Source: UCLA Health Services Assessment for Children in Foster Care
Organization of Services
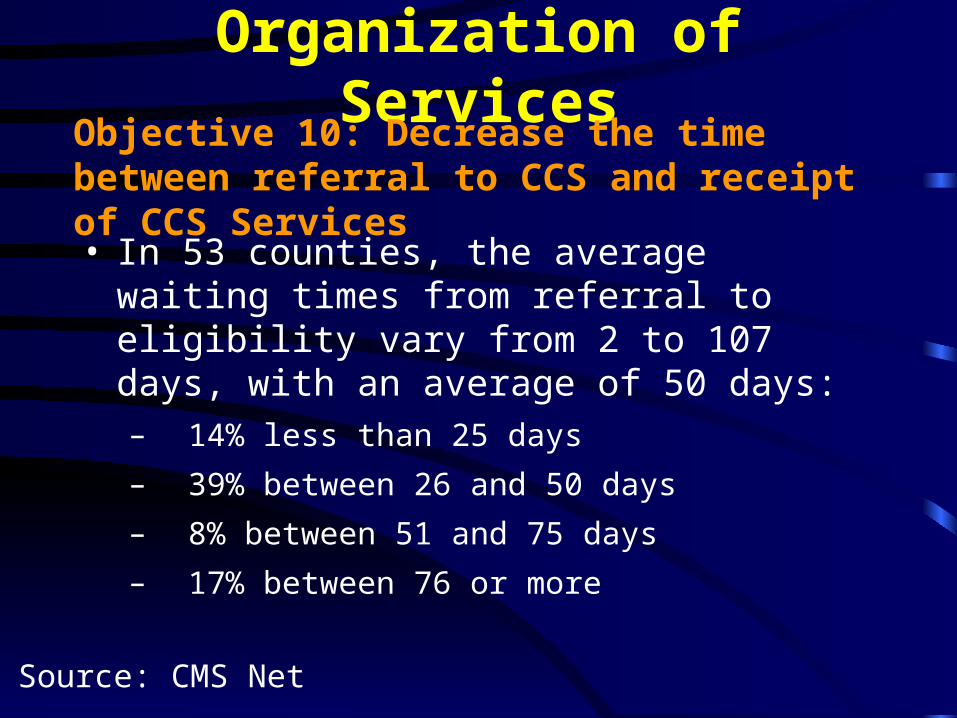
• In 53 counties, the average waiting times from referral to eligibility vary from 2 to 107 days, with an average of 50 days:– 14% less than 25 days
– 39% between 26 and 50 days
– 8% between 51 and 75 days
– 17% between 76 or more
Source: CMS Net
Objective 10: Decrease the time between referral to CCS and receipt of CCS Services

• Many ‘negative’ time periods between 1st referral and eligibility determination
• In 54 counties, the average waiting times from referral to authorization vary from 55 to 227 days, with an average of 127 days:– 26% between 55 and 98 days
– 41% between 99 and 141 days
– 24% between 142 and 184 days
– 9% between 185 and 227 days
Objective 11. Decrease the time between referral to the Medical Therapy Program and receipt of MTP services - Data not currently collected Objective 12. Improve the uniform application of CCS authorization and referral policies across the state Objective 13. Implement a system of standards of service delivery for all children with CCS medically eligible conditions regardless of payor source, including sharing of data.

Objective 14: Coordinate to develop and implement a system of timely referral between mental health and CCS systems for CCS eligible children.
• Children with CCS problems accessing mental health service
Children who are CSS enrollees and MediCal
beneficiaries are covered for specialty mental health services
under terms of specialty mental health carve-out.
• Children with mental health problems in need of CCS services
All county Mental Health Plans have MOU with a health
plan. If child is eligible for CSS services, child should have a
medical home, and mental health plan should be able to
exchange information and share care with the health plan.

Transition to Adulthood
• Over 90% of children with special health care needs now live to adulthood, but are less likely than their non-disabled peers to complete high school, attend college, or be employed.
• Health and health care are two of the major barriers to making successful transitions
Source: HRSA
Objective 15: Increase capacity of local CCS programs to develop and implement transition plans for adolescents transitioning to adult services

• Out of the CCS cases active as of 3/15/05, there were a total of 2,746 clients 20 years of age. Within 52 CA counties, the percentages of these clients with insurance range from 1 to 100%, with an average of 24% having insurance
• The transition of youth to adulthood has become a priority issue nationwide, as evidenced by the President’s 2002 “New Freedom Initiative”**
Source: *CCS Data, **HRSA

Rating the Issues / Objectives

Individuals Rate Objective Areas
Apply the criteria using the agreed upon scoring and weighting values.
Apply the criteria to the objective by:
• Determining the numeric “score” (1 to 5) for the criterion
• Multiplying the numeric score by the “weight” for that criterion, that is:
1 = Important 2 = Very important3 = Extremely important

Example of individual scoring:
Issue / Objective
CRITERIA (Weight)
(Participant 1)
TOTALGreat impact on families
(2)
Addressing would increase
equity
(3) Children
have medical home
5 x 2 = 10 2 x 3 = 6 16
Family access to
information 2 x 2 = 4 2 x 3 = 6 10

Scores are Summed to Produce a Group Ranking
Issue / Objective
PARTICIPANTSTOTA
L1 2 3 4
Medical homes
16 12 9 6 43
Family access to information
10 10 6 12 38
Family partner-ship / satisfaction
4 6 12 8 30
Universal new-born hearing screening
20 15 12 15 62

Rank Objective Areas & Confirm Agreement
Highest Score = Top Ranked Problem
From previous example:
Universal new-born hearing screening 62
Medical homes 43
Family Access to information 38
Family partnership / satisfaction 30