settlement patterns of young-of-the-year rockfish among
TRANSCRIPT

MARINE ECOLOGY PROGRESS SERIESMar Ecol Prog Ser
Vol. 448: 143–154, 2012doi: 10.3354/meps09504
Published February 23
INTRODUCTION
Estuaries rank among the most productive habitatson earth; however, they are also among the habitatsthat are most degraded by human activities (Edgar etal. 2000). In the USA, severe eutrophication withinChesapeake Bay has led to massive benthic commu-nity-wide mortalities, affecting overall productivityand potentially higher trophic levels within the bay
(Seitz et al. 2009). In the San Francisco estuary,declining pelagic fish abundances have been attrib-uted to human-induced habitat alterations, such aschanges in freshwater inputs and reduced turbidityassociated with a reduction in the sediment supplyand decline of submerged aquatic vegetation (Mac-Nally et al. 2010) and also indirectly through reducedfood availability due to exotic species invasions(Sommer et al. 2007). Estuaries are also subject to
© Inter-Research 2012 · www.int-res.com*Email: [email protected]
Settlement patterns of young-of-the-year rockfish among six Oregon estuaries experiencing
different levels of human development
Alison D. Dauble1,3,*, Scott A. Heppell1, Mattias L. Johansson2,4
1Oregon State University, Department of Fisheries and Wildlife, Corvallis, Oregon 97331, USA2Oregon State University, Coastal Oregon Marine Experiment Station, Hatfield Marine Science Center, Newport,
Oregon 97365, USA
3Present address: Oregon Department of Fish and Wildlife, Marine Resources Program, Newport, Oregon 97365, USA4Present address: Department of Biological Sciences, University of Wisconsin - Milwaukee, Milwaukee, Wisconsin 53201,
USA
ABSTRACT: In the US Pacific Northwest, rockfishes Sebastes spp. have recently become a focusfor increased management efforts; several species are currently managed under extreme conser-vation measures due to low population levels and intense fishing pressure. Rockfish recruitmentis extremely variable, and a better understanding of the factors influencing recruitment and set-tlement would assist in prioritizing management and conservation efforts. The goal of this studywas to investigate natural and anthropogenic influences on the estuarine settlement process ofrockfishes, with a focus on black rockfish S. melanops. Trap surveys conducted in 6 Oregon estu-aries indicate that young-of-the-year (YOY; Age-0) rockfish utilize multiple Oregon estuaries fromspring through late fall. As shown by late season increases in catch rates and the capture of mul-tiple Age-1 individuals, rockfishes may be present in highly developed estuaries through theirfirst winter. Genetic identification confirms that the majority of the YOY rockfish captured duringthis study were black rockfish S. melanops. Catches were higher in the more developed estuaries,suggesting that the continued development of Oregon estuaries may not adversely affect the rock-fish settlement process. This study provides strong evidence of widespread use of estuarine habi-tat by black rockfish on the Oregon coast during their first year of life, and provides additionalsupport that structure is an important component to the settlement process.
KEY WORDS: Sebastes melanops · Larval ecology · Estuarine habitat use · Anthropogenic development
Resale or republication not permitted without written consent of the publisher
Mar Ecol Prog Ser 448: 143–154, 2012
multiple forcing mechanisms from both freshwaterand marine influences, and so are particularly vul-nerable to climate change impacts (Najjar et al.2010).
Pacific Northwest estuaries have been moderatelydeveloped and exploited within the last century(Borde et al. 2003). Some have jetties and are regu-larly dredged to allow for deep draft boat traffic,while others maintain a more natural state, withlimited shoreline development (Oregon Departmentof Land Conservation and Development, DLCD1987). Despite the large number (>20) of estuariesalong the Oregon coast, the total estuarine surfacearea in the state is extremely small, as the majorityof individual estuaries are <30 km2. The few largerestuaries have been substantially altered by anthro-pogenic development activities (DLCD 1987); how-ever, the vast majority of Oregon estuaries are in amore pristine state, characterized by very little nat-ural or artificial structure (DLCD 1987), makingthem ideal platforms to explore the effect of thealteration of the estuarine environment throughanthropogenic activities.
In general, these small coastal estuaries are highlyinfluenced by the biological and physical characteris-tics of the nearshore environment (Hickey & Banas2003, Miller & Shanks 2004). The larvae and ju venilesof numerous fish species are present in Pacific North-west estuaries (Pearcy & Myers 1974, Monaco et al.1992, Miller & Shanks 2005), and specific estuarinehabitats are considered possible nursery grounds forvarious marine fishes, particularly English sole Pleu-ronectes vetulus (Brown 2006, Rooper et al. 2006) androckfishes of the genus Sebastes (Miller & Shanks2004, Gallagher & Heppell 2010).
Over 100 species of rockfish inhabit the NorthPacific Ocean (Hyde & Vetter 2007) and range fromJapan and southeast Asia to the southern tip of BajaCalifornia and the Gulf of California (Love et al.2002). Along the west coast of North America, sev-eral species of rockfish are under extreme conserva-tion measures due to low population levels (Parker etal. 2000, Love et al. 2002). The National Marine Fisheries Service has declared 7 species of rockfishoverfished within the last decade (Code of FederalRegulations 2011). A species is considered overfishedif spawning biomass is found to be less than 25% ofthe unfished biomass for groundfish, and rockfishesare considered particularly vulnerable to overex-ploitation because of their life history characteristics.
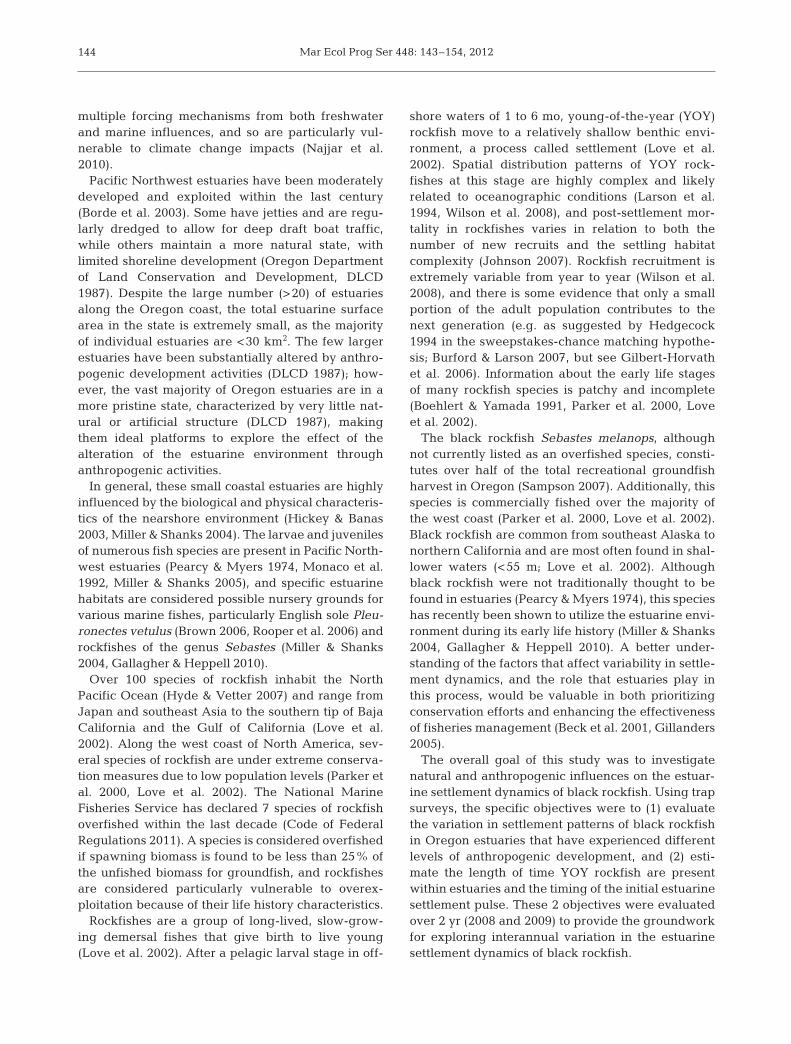
Rockfishes are a group of long-lived, slow-grow-ing demersal fishes that give birth to live young(Love et al. 2002). After a pelagic larval stage in off-
shore waters of 1 to 6 mo, young-of-the-year (YOY)rockfish move to a relatively shallow benthic envi-ronment, a process called settlement (Love et al.2002). Spatial distribution patterns of YOY rock-fishes at this stage are highly complex and likelyrelated to ocean ographic conditions (Larson et al.1994, Wilson et al. 2008), and post-settlement mor-tality in rockfishes varies in relation to both thenumber of new recruits and the settling habitatcomplexity (Johnson 2007). Rockfish recruitment isex tremely variable from year to year (Wilson et al.2008), and there is some evi dence that only a smallportion of the adult population contributes to thenext generation (e.g. as suggested by Hedgecock1994 in the sweepstakes-chance matching hypothe-sis; Burford & Larson 2007, but see Gilbert-Horvathet al. 2006). Information about the early life stagesof many rockfish species is patchy and incomplete(Boehlert & Yamada 1991, Parker et al. 2000, Loveet al. 2002).
The black rockfish Sebastes melanops, althoughnot currently listed as an overfished species, consti-tutes over half of the total recreational groundfishharvest in Oregon (Sampson 2007). Additionally, thisspecies is commercially fished over the majority ofthe west coast (Parker et al. 2000, Love et al. 2002).Black rockfish are common from southeast Alaska tonorthern California and are most often found in shal-lower waters (<55 m; Love et al. 2002). Althoughblack rockfish were not traditionally thought to befound in estuaries (Pearcy & Myers 1974), this specieshas recently been shown to utilize the estuarine envi-ronment during its early life history (Miller & Shanks2004, Gallagher & Heppell 2010). A better under-standing of the factors that affect variability in settle-ment dynamics, and the role that estuaries play inthis process, would be valuable in both prioritizingconservation efforts and enhancing the effectivenessof fisheries management (Beck et al. 2001, Gillanders2005).
The overall goal of this study was to investigatenatural and anthropogenic influences on the estuar-ine settlement dynamics of black rockfish. Using trapsurveys, the specific objectives were to (1) evaluatethe variation in settlement patterns of black rockfishin Oregon estuaries that have experienced differentlevels of anthropogenic development, and (2) esti-mate the length of time YOY rockfish are presentwithin estuaries and the timing of the initial estuarinesettlement pulse. These 2 objectives were evaluatedover 2 yr (2008 and 2009) to provide the groundworkfor exploring interannual variation in the estuarinesettlement dynamics of black rockfish.
144

Dauble et al.: Settlement of young-of-the-year rockfish in estuaries 145
MATERIALS AND METHODS
Study location
Six estuaries (2 from each of 3 development levels,as defined by the Oregon DLCD 1987) were chosenfor this study, and multiple trap surveys were con-ducted in each of the estuaries over a 2 yr period. Theestuaries selected for this study include the Nehalem,Siletz, Yaquina, Alsea, Coos, and Coquille Bays(Fig. 1). Alsea and Siletz Bays are ‘conservation’ estu-aries that lack jetties and have minimal development.Nehalem and Coquille Bays are considered ‘shallow-draft development’ estuaries that have jetties and amoderate amount of development but are notdredged regularly. Yaquina and Coos Bays are ‘deep-draft development’ estuaries that have jetties, a sub-stantial amount of shoreline development, and aredredged regularly to admit deep-draft boat traffic.
Traps were placed adjacent to existing artificialstructures (docks or pilings) or natural structures(rock). Specific trap sites were chosen based on dis-tance from the estuary mouth, accessibility, and thedepth of the water at low tide. In 5 of the estuaries(Nehalem, Yaquina, Alsea, Coos, and Coquille), 2sites were chosen, an ‘estuary mouth’ site (Site 1),located as close to the mouth of the bay as possible,and an ‘upriver’ site (Site 2). Upriver sites varied inthe distance that they were located from the mouth ofthe estuary, but an attempt was made to place themapproximately halfway up the bay to where the salt-water wedge extends during the summer (thus, thedistance from the mouth to the upriver site wasgreater in larger estuaries). The placement of theupriver traps was also dependent on the availabilityof structures near the desired location. In Siletz, only1 site was chosen because of the lack of availableupriver hard structures at low tide.
Methodology
Trapping sessions occurred approximately every 3to 4 wk, from May to November 2008 and April toOctober 2009. For each individual trapping session, 2large, square minnow traps (Mo del MT-10, AquaticEco-Systems), ap pro ximately 45 cm2 on the base and30 cm tall, were fitted with additional weights to pre-vent movement and then placed at the base of thestructure at the trapping site. Traps were set in pairsto increase the probability of catching rockfish.Depth of the traps varied with the tidal cycle andranged between approximately 1 and 7 m. The trapswere set, unbaited, for approximately 24 h to en com -pass an entire daily tidal cycle. Temperature (°C),salinity (ppt), and dissolved oxygen (mg l−1) weremeasured when each pair of traps was de ployed andretrieved, using a model YSI-85 multi-meter (YSI).Measurements were taken as close to the traps aspossible.
As each trap in the pair was set very close to theother, each trap was not considered an independentmeasurement, and so the total catch from both trapsfor each session was summed. In 2008, all fishcaught in the traps were identified to species andstandard length was measured to the nearest mil-limeter. In 2009, all fish were identified, but onlyrockfish were measured. A fin clip was taken fromthe second dorsal fin of all captured rockfish andstored in 95% non- denatured ethanol until pro-cessed for genetic identification. All live fish werereleased unharmed, and any in-trap mortalities
Fig. 1. Locations of the 6 Oregon coast estuaries where trap surveys were conducted

Mar Ecol Prog Ser 448: 143–154, 2012
were recorded. Any rockfish that died in the trapswere kept and preserved whole in ethanol for latergenetic analysis.
Species identification
All fish collected were identified visually to spe-cies, but because of the difficulty associated withidentifying YOY rockfish, the visual determinationswere confirmed by genetic analysis.
Total genomic DNA was extracted from the dorsalfin tissue using a glass fiber plate extraction protocol(Ivanova et al. 2006). Polymerase chain reaction(PCR) was used to amplify a 782 base pair fragmentof the mitochondrial DNA cytochrome b gene usingpreviously published GluRF and CB3RF primers(Rocha-Olivares et al. 1999) and standard protocols.The PCR products were cleaned using a standardExoSap procedure (USB) and were cycle sequencedusing BigDye kits (Applied Biosystems) and internalprimers CBInf2 (5’-TRA GKG TTG CAT TGT CTACTG AGA A-3’) and CBInr2 (5’-GGR CTT TAC TACGGY TCR TAC CT-3’; J. Hyde pers. comm.). Se -quencing products were cleaned using a Sepha dexfiltration protocol (Millipore) and visualized on anABI 3730XL capillary sequencer. Sequence datawere aligned and edited using Sequencher v4.7(Gene Codes) software.
Using an iterative approach, sample sequenceswere compared to a reference dataset of 374 inde-pendent haplotypes from 67 species of morphologi-cally identified adult Sebastes spp. Species includedin the reference dataset are listed in Taylor et al.(2004).
Neighbor-joining trees with nonparametric boot-strapping (1000 replicates), implemented in PAUP*v4b10 (Sinauer Associates), were used to cluster eachunknown haplotype within the reference dataset of374 known adult haplotypes. If an individual clus-tered within a monophyletic single-species cladewith a bootstrap value >70%, this was accepted aspositive identification of the individual. If an individ-ual clustered with a monophyletic clade with a boot-strap <70%, a secondary analysis was performedthat included haplotypes of the 3 nearest (in uncor-rected ‘p ’ genetic distance) species to the unknownrockfish haplotype to confirm the identification.Since many of the species in the reference databaseare defined by relatively few sequence differences,and bootstrap sampling results in the loss of somedata in each iteration, the 70% cutoff represents arealistic level of support to expect for species-level
clades based on cytochrome b data in rockfishes.Some species in the reference dataset (Sebasteswilsoni / emphaeus /variegatus / zacentrus, referredto here as the WEVZ complex, and S. melanops / fla -vidus / serranoides, referred to here as the MFS com-plex) failed to form monophyletic clades, thus indi-viduals falling within these clades were classified asbelonging to the complex rather than to a specificspecies.
Analysis
Data were maintained in Microsoft Excel™ andconverted for analysis in R (www.r-project.org) soft-ware package. The count of rockfish catches wasused for analysis. Catch per unit effort measurementswere not considered, as trap time varied littlethroughout the study (mean = 24.02 h; range = 23.96to 24.28 h).
A generalized linear model (GLM) selection proce-dure, with error distributions selected based onAkaike’s Information Criterion (AIC) scores, wasused to determine whether rockfish catches variedby estuary and/or site location (general formula:rockfish count ≈ estuary + site). Catches were alsocompared within the trap season. GLMs were uti-lized to assess changes in rockfish catches by month.Additionally, the seasonal timeframe when YOYrockfish were present was divided approximately atthe halfway point (15 July; rockfishes capturedapproximately mid-April to mid-October). GLMswere also used to compare catches between the earlyand late seasons that included all estuaries and allsites (general formula: rockfish count ≈ estuary +site + early versus late season). The 2 yr of data werecombined for these analyses, and year of capture wasevaluated as an additional explanatory variable inthe selection procedures.
Two quantitative proxies for estuary developmentlevel were created, called ‘hardened linear shoreline’and ‘mouth cross-sectional area’ (Table 1). These 2measurements were designed as integrative mea-sures to describe the amount of available structure,the size of the estuaries, the presence of jetties,dredging, and river flow rates. However, these mea-sures are not independent and were therefore usedin separate analyses.
Hardened linear shoreline (in km) was estimatedusing the ‘ruler’ measurement tool in GoogleEarth™. Linear segments of bank edge containinghardened shoreline or structure were estimated 3times per estuary, and then averaged for each estu-
146

Dauble et al.: Settlement of young-of-the-year rockfish in estuaries
ary. Measurements were made from the estuarymouth to approximately 1 km past the upriver trap-ping site for that particular estuary. For Siletz, mea-surements were made to 1 km past the single sitewithin that estuary. Mouth cross-sectional area(s)were estimated using the maximum depth publish edon National Oceanic and Atmospheric Administra-tion nautical charts (Office of Coast Survey, USDepartment of Commerce, www. charts. noaa.gov)closest to the mouth itself. The width of the mouthwas estimated using the Google Earth™ ‘ruler’ tool,and the 2 measurements were multiplied to get across sectional area (area in m2 = width × depth).These measures were constructed as proxies and arenot meant to be true representations of either hard-ened linear shoreline or mouth cross- sectionalarea(s); they are simply meant to provide a reason-able characterization of the human use of the estuary.
Logistic regressions were used to determine theeffect of these proxies on the presence of rockfish,after accounting for additional confounding factors.Another GLM selection procedure was used to assessthe effect of each of the proxies on the rockfish catch,again using AIC scores to select the most appropriateerror distribution. As rockfish were captured at multiple sites within each estuary, site location wasaccounted for in each of the models. Again, the 2 yrof data were combined for this analysis, and year wasevaluated as an additional variable.
Size comparisons between years were made usinga t-test and excluded YOY captured after 30 Septem-ber in 2008 and 3 October in 2009 in order to stan-dardize the sampling season between years. Nega -tive binomial distributions were se lec ted for allGLMs, apart from the logistic regressions, for whicha binomial distribution were used.
RESULTS
In total, 621 YOY and juvenilerockfish were captured in 2008 in103 individual trap sessions (mean ±SD = 6.7 ± 1.5 rockfish session−1), and455 were captured in 2009 in 89 indi-vidual trap sessions (4.7 ± 1.3 rock-fish session−1). In 2008, YOY rock fishwere captured in all 6 estuaries,whereas in 2009, rockfish were cap-tured in all estuaries but Siletz,despite multiple trapping efforts atthat location (Table 2). The numberof YOY or juvenile rockfish capturedduring each trap session ranged from1 to 82 (Fig. 2). Although the fin clips
taken from each YOY or juvenile rockfish served as ade facto tag, there were no recaptures of previouslyclipped rockfish during the 2 years of this study.
Genetic identification
In total, 298 fin clip samples were processed forgenetic identification: 248 samples from 2008 and50 from 2009. Fin clips were separated by estuaryand randomly sub- sampled for genetic analysis inproportion to the number of rockfish caught in eachestuary. In 2008 (Fig. 3a), 95.2% (n = 236) of the sam-ples were identified as Sebastes melanops, and in2009 (Fig. 3b), 86.0% (n = 43) were S. melanops.
Several individuals of the WEVZ complex (boot-strap: 79%) were identified in both 2008 (1.6%, n = 4)and 2009 (6.0%, n = 3). Ecological characteristicssuggest that the most likely candidate from these 4 isSe bastes emphaeus, the Puget Sound rockfish, as theother 3 species are deepwater rockfishes that aremuch rarer in shallow waters (Love et al. 2002). In2008, the WEVZ samples were collected from bothYaquina and Coquille, whereas in 2009, all WEVZfish were caught in Yaquina Bay.
In 2009, 2 samples (4.0%) of Sebastes caurinus, thecopper rockfish (bootstrap: 79%), were collectedfrom Yaquina Bay. This species has not previouslybeen reported in this estuary, although it has beenfound in Coos Bay (Miller & Shanks 2004). No copperrockfish were identified in 2008. Of the remainingsamples, 1 sample from Nehalem (2008) and 2 sam-ples from Yaquina (2009) were identified to the MFScomplex (bootstrap: 100%). S. melanops and S. fla -vidus have both been previously reported in YaquinaBay (Gallagher & Heppell 2010). S. serranoides has
147
Estuary Development Size of Jetties Channel HLS MCA classification estuary present? dredged? estimate estimate
(km2) (km) (m2)
Nehalem Shallow draft 9.34 Yes No 2.35 1100.3Siletz Conservation 4.8 No No 0.025 232.4Yaquina Deep draft 15.82 Yes Yes 8.93 3475.2Alsea Conservation 8.68 No No 1.14 1019.0Coos Deep draft 44.4 Yes Yes 6.02 8482.0Coquille Shallow draft 3.31 Yes No 3.18 898.7
Table 1. Qualitative and quantitative characteristics of each of the 6 estuaries(from north to south) from the central Oregon coast sampled during this study.Development classification is from DLCD (1987), and the size of the estuary(km2 at average high tide) is from Pearcy & Myers (1974). Average hardenedlinear shoreline (HLS, km) and mouth cross-sectional area (MCA, m2) estimateswere collected from a combination of Google EarthTM software and NOAA
navigational charts for the Oregon coast
Mar Ecol Prog Ser 448: 143–154, 2012
been reported in extremely shallow depths as YOYbut not specifically in estuaries (Love et al. 2002).
Development level
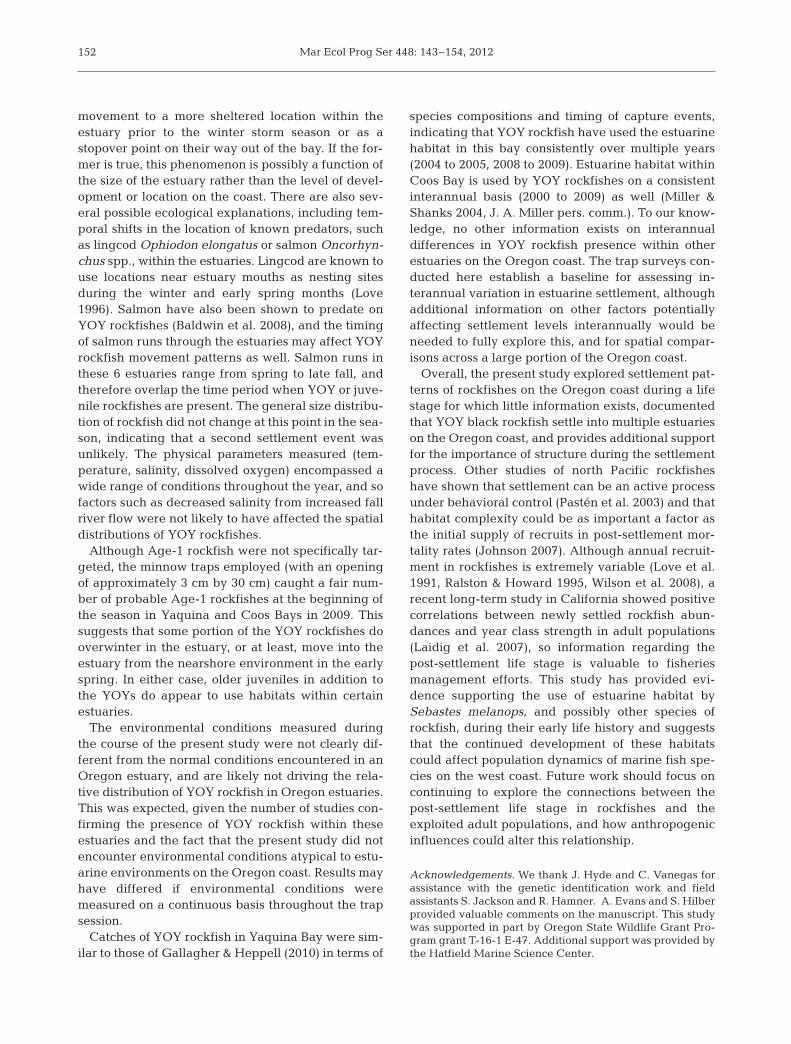
The presence of rockfish was positively associatedwith estuaries with a higher hardened linear shorelineestimate (logistic regression; p = 0.002), after account-ing for observations at different sites within those es-tuaries and with both years of data included in themodel. The odds of catching a juvenile rockfish in-creased by 20.1% for each km increase in hardenedlinear shoreline (95% CI: 17.9 to 22.3%). The addition
of site to the model did not improve themodel fit (AIC = 182 versus 183).
The presence of rockfish in the catchwas also positively associated with es-tuaries with a larger mouth cross-sec-tional area (logistic regression; p =0.001), after accounting for differentsampling locations and with both yearsof data. The odds of catching a juvenilerockfish in crea sed by 31.8% for each1 km2 increase in the mouth cross- sectional area (95% CI: 0.7 to 72.4%).Again, the addition of site to the modeldid not substantially im prove themodel fit (AIC = 179 versus 180).
Year was not determined to be a sig-nificant explanatory variable when in -vestigating the effect of the hardenedlinear shoreline estimate on rock fishcatches (p = 0.26). Rockfish catcheswere higher in estuaries with higher
hardened linear shoreline estimates (GLM; p <0.001), after accounting for catches at different sites(model selected: rockfish count ≈ hardened linearshoreline/site location, AIC = 702). A similar model(rockfish count ≈ hardened linear shoreline + site)improved the model fit (AIC = 696); however, the for-mer model was selected as a more accurate repre-sentation of the structure of the data.
Similarly, rockfish catches were also higher in estuaries with larger mouth cross-sectional areas(GLM; p < 0.001), after accounting for catches at dif-ferent sites (model selected: rockfish count ≈ mouthcross-sectional area/site location, AIC = 705). Theaddition of site to the model selection procedure did
148
Estuary Site 2008 2009No. sessions No. rockfish Capture dates No. sessions No. rockfish Capture dates
Nehalem 1 7 (42.6) 3 6 July−13 Nov 5 (20.0) 1 25 Aug2 6 (50.0) 18 6 July−18 Oct 3 (33.4) 1 1 July
Siletz 1 8 (50.0) 11 30 June−26 Aug 7 (0.0) 0 n/aYaquina 1 11 (63.6) 23 9 June−19 Nov 8 (62.5) 112 13 May−30 July
2 14 (42.9) 40 1 May−19 Nov 32 (81.3) 183 11 May−27 AugAlsea 1 5 (40.0) 3 26 Aug−25 Sept 5 (40.0) 4 9 June−25 July
2 7 (28.6) 2 9 July–26 Aug Location inundated by sand duringwinter of 2008/2009
Coos 1 6 (83.3) 41 22 June−22 Nov 5 (60.0) 17 29 May−2 Oct2 7 (100.0) 176 24 May−22 Nov 5 (100.0) 69 17 Apr−2 Oct
Coquille 1 7 (71.4) 43 24 June–22 Nov 5 (60.0) 9 29 May−3 Aug2 8 (62.5) 154 24 June–22 Nov 5 (80.0) 14 29 May−2 Oct
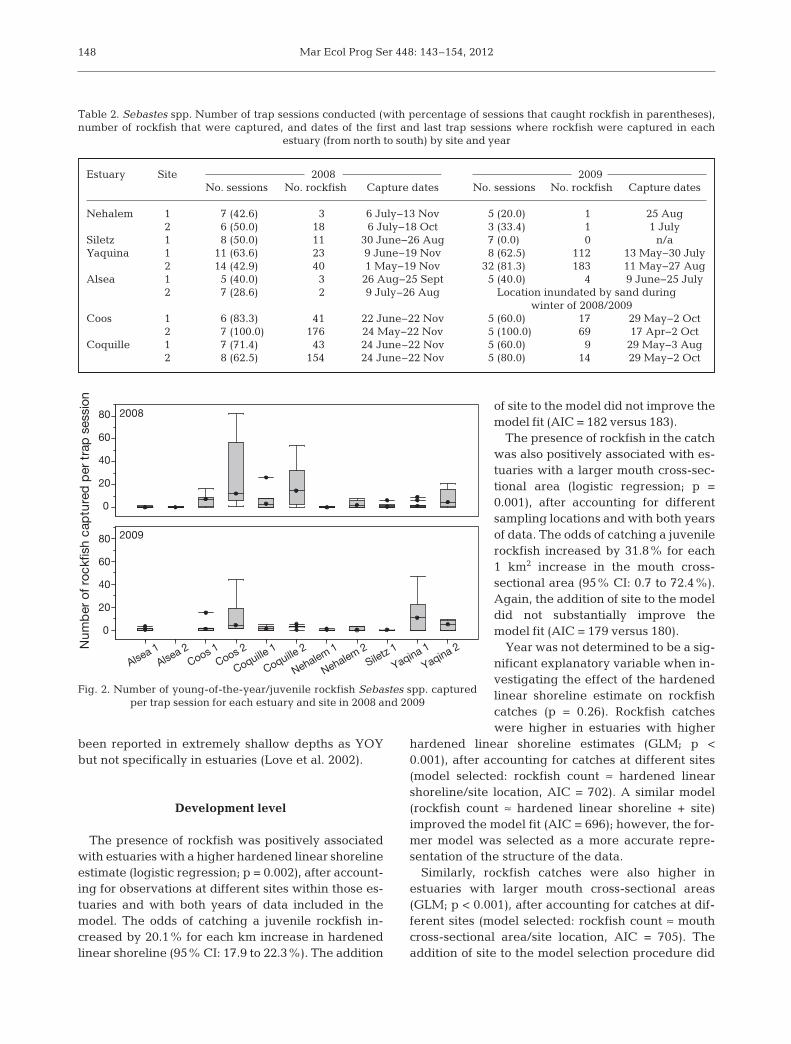
Table 2. Sebastes spp. Number of trap sessions conducted (with percentage of sessions that caught rockfish in parentheses),number of rockfish that were captured, and dates of the first and last trap sessions where rockfish were captured in each
estuary (from north to south) by site and year
2008
Alsea 1Alsea 2
Coos 1Coos 2
Coquille 1
Coquille 2
Nehalem 1
Nehalem 2Siletz 1
Yaqina 1
Yaqina 2
2009
0
20
40
60
80
0
20
40
60
80
Num
ber
of r
ockf
ish
cap
ture
d p
er t
rap
ses
sion
Fig. 2. Number of young-of-the-year/juvenile rockfish Sebastes spp. captured per trap session for each estuary and site in 2008 and 2009

Dauble et al.: Settlement of young-of-the-year rockfish in estuaries
not improve the model fit (AIC = 706); however, thenested model was selected in order to account for thecollection of data in different locations within eachestuary. Again, year was not determined to be a significant explanatory variable (model: rockfishcount ≈ year + mouth cross-sectional area/site loca-tion; p = 0.27).
Spatial comparisons
There were significant differences in the YOYrockfish catch among all estuaries (GLM; p < 0.001)and sites (GLM; p = 0.014; rockfish count ≈ estuary /site). Year was not a significant factor (p = 0.17), andthe addition of site did improve the model fit slightly(AIC = 678 versus 682). The interaction between theestuary and site effects was marginally significant(p = 0.064) but did not improve the model fit (rockfishcount ≈ estuary × site; AIC = 678), and was elimi-nated in favor of the nested version. An additive ver-sion of this model (rockfish count ≈ estuary + sitelocation) was also eliminated in favor of a slightlylower AIC value, though not significantly different(AIC = 679), and a more representative model.
Intra-seasonal comparisons
As there were differences found spatially amongsampling locations, GLMs for exploring intra-sea-sonal variation in rockfish catches were constructedto account for this. Model selection procedures forthese comparisons used the final model selected forthe spatial comparisons (rockfish count ≈ estuary/site), and year was not included as an additionalexplanatory variable.
The early and late seasons showed marginally sig-nificant differences in rockfish catches (GLM; p =0.016), after accounting for spatial variation amongthe estuaries and sites. The model selected (rockfishcount ≈ estuary / site + early versus late season; AIC =675) was significantly improved by the addition ofestuary and site (AIC = 713). However, there werealso significant differences in the rockfish catches bythe month of capture (GLM; p < 0.001), after account-ing for sampling locations (estuary and site). Thismodel (rockfish count ≈ estuary / site + month of capture) was significantly improved by the substitu-tion of month for the early versus late season variable(AIC = 668 versus 675). Taken together, this confirmsthat there was significant intra-seasonal variationin rockfish catches after accounting for spatial variation.
Size at capture comparisons
In 2008, YOY and juvenile rockfishes ranged from22 to 90 mm standard length (n = 610, mean:60.1 mm), and in 2009, rockfish length ranged from20 to 113 mm (n = 455, mean: 54.2 mm; Fig. 4). Multiple larger individuals (82 to 113 mm) werecaught in the early season (April/May) in both 2008and 2009; these were most likely Age-1 juvenilesfrom the previous year’s recruitment. After discardingthe late-season captures in 2008 and excluding theseprobable Age-1 individuals, the average size of YOYrockfishes in 2009 was found to be 5.9 mm smallerthan the 2008 average (t-test; p < 0.001, 95% CI: 4.8 to7.1 mm). Growth rates from YOY black rockfish inYaquina Bay have been measured at approximately0.5 mm d−1 (Gallagher & Heppell 2010), but whetherthe size difference detected in this study is ecologi-cally relevant is unknown. Approximate size at settle-ment in this study was consistent with other estimatesfor Sebastes me la nops (46 mm; Matarese et al. 1989).A large number of pre-settlement size YOY rockfish(n = 67 individuals ≤45 mm) were caught in 2009, butfew were captured in 2008 (n = 9).
149
S. melanops95.2% (236)
S. melanops86.0% (43)
WEVZ1.6% (4)
WEVZ6.0% (3)
MFS0.4% (1)
MFS4.0% (2)
S. caurinus 4.0% (2)
No ID2.8% (7)
a) 2008
b) 2009
Fig. 3. Proportion and sample size (n) of the genetically iden-tified young-of-the-year rockfishes Sebastes spp. in (a) 2008(n = 248) and (b) 2009 (n = 50). The WEVZ complex consistsof S. wilsoni / emphaeus / variegatus / zacentrus and theMFS complex consists of S. melanops / flavidus serranoides

Mar Ecol Prog Ser 448: 143–154, 2012
Environmental variables
Temperature (range for all sites: 8.5 to 16.9°C), sal -inity (13.8−33.6 ppt), and dissolved oxygen (5.6 to12.9 mg l−1) varied spatially according to the locationof the site within the estuaries and the depth of thetrap site, but not necessarily on a temporal basis.
DISCUSSION
In addition to continued documentation of YOYrockfish use of the Coos and Yaquina estuaries, to ourknowledge, this is the first documentation of YOYrockfish in Nehalem, Siletz, Alsea, and Coquille estuaries. YOY rockfish have been previously cap-tured in Yaquina (Schlosser & Bloeser 2006, Gal-lagher & Heppell 2010), Coos (Miller & Shanks 2004,Schlosser & Bloeser 2006), Winchester, and Tillam-ook Bays (Appy & Collson 2000) on the Oregon coast.In spite of the small amount of estuarine habitat onthe Oregon coast, the presence of YOY black rock-fish within all of these estuaries suggests that theyare an essential habitat (as demonstrated by Gal-lagher & Heppell 2010) during a black rockfish’s first,and possibly, second year. ‘Essential fish habitat,’ asdefined in the Magnuson Stevens Fishery Conserva-tion and Management Act, is considered ‘thosewaters and substrate necessary to fish for spawning,
breeding, feeding, or growth to maturity’ (NOAA Habitat Conserva-tion 2011: www. habitat. noaa. gov/ pdf/magnusonstevensact.pdf). How ever,Gallagher & Heppell (2010) only sam-pled in 1 estuary and the presentstudy confirms the presence of rock-fish in multiple other estuaries on theOregon coast.
The dominant species captured dur-ing the present study was Sebastesmelanops, which has also been re -ported as the dominant YOY rockfishspecies in intertidal pools along theOregon and northern California coasts(Studebaker & Mulligan 2008), and inshallow nearshore rocky relief areas(Miller & Shanks 2004). In compari-son, no black rockfish were capturedat deeper nearshore reefs, most likelydue to the depth (>35 m) of the reef(Gallagher & Heppell 2010). This maybe indicative of a niche separationduring this particular life stage, as
mostly YOY blue rockfish S. mystinus were capturedon those reefs (Gallagher & Heppell 2010).
The present study is the first to describe the cap-ture of WEVZ complex YOY rockfish from any estu-ary. As mentioned previously, the fish identified tothe WEVZ complex are most likely the Puget Soundrockfish, due to the shallow depth of the estuarysites. If these samples are indeed Puget Sound rock-fish, this is the first documentation of estuarine habi-tat use by this species outside of Puget Sound (Loveet al. 2002). Little is known about the pygmy Seba -stes wilsoni, harlequin S. variegatus, and sharp chinS. zacentrus rockfishes, but they are generally con-sidered to be rare in nearshore environments, such asestuaries, while the Puget Sound rockfish is commonin the Oregon nearshore ocean (Love et al. 2002).
Copper rockfish were found in small numbers andhave been previously reported in Yaquina Bay (Appy& Collson 2000, Schlosser & Bloeser 2006) but werenot found in a study where genetic methods wereused to identify species (Gallagher & Heppell 2010),possibly due to the low frequency of copper rockfishoccurrence. Copper rockfish have also been cap-tured in light traps in Coos Bay (Miller & Shanks2004), and may be present in the bay as adults(Johansson et al. 2008). The lack of copper rockfishcaptured in Coos Bay during the present study couldbe accounted for by differences in sampling fre-quency or the trap style, or because YOY copper
150
4/10 5/22 6/9 6/30 7/14 7/24 8/4 8/25 9/12 10/26
Date of capture (mo/d)
0
20
40
60
80
100
Roc
kfis
h S
L at
cap
ture
(mm
)
20082009
Fig. 4. Size distributions of young-of-the-year rockfish Sebastes spp. (standard length, SL) from all estuaries in 2008 (s) and 2009 (m)

Dauble et al.: Settlement of young-of-the-year rockfish in estuaries
rockfish were simply not present in Coos Bay duringthe timeframe of the study. Given the small numbersof copper rockfish captured during this and otherstudies, it seems likely that they are simply utilizingestuarine habitats more sporadically than black rockfish.
The increased catch rates of rockfishes within themore developed estuaries lends support to the argu-ment that structure is a vital component of the settle-ment process (Love et al. 1991, 2002, Buckley 1997)and indicates that increased development projectedfor the Oregon coast (Kline et al. 2003) would notnecessarily lead to increased YOY rockfish mortality,at least during the immediate post-settlement period.In general, structure can reduce post-settlement mor-tality by providing refuge from predation (Hixon &Beets 1989, Johnson 2007) and can affect other de -mo graphic measurements, such as individual sizeand community species assemblages (Crowder &Cooper 1982, Hixon & Beets 1989). The presence ofstructure perhaps even triggers the initiation of thesettlement process in rockfishes (Carr et al. 2003,Pastén et al. 2003). Human development within estu-aries could potentially serve as a mechanism toincrease initial post-settlement recruitment of rock-fishes, although population-level effects would bedifficult to quantify as very few links between abun-dance of post-settlement rockfishes and overall pop-ulation trends are currently established (Sakuma etal. 2006, Wilson et al. 2008). The limited amount ofstructure available in the majority of these estuariesfurther supports the importance of available habitatduring the settlement process for rockfishes.
Of course, an increase in the amount of underwaterstructure is not the only result of increased estuarinedevelopment, and as such, development cannot beconsidered directly beneficial to rockfish popula-tions. Other anthropogenic impacts such as pollution,introduction of invasive species, and loss and degra-dation of existing natural habitats within estuarieshave caused fundamental alterations to estuarinespecies compositions and habitat quality (Lotze et al.2006). With YOY rockfishes spending a greater pro-portion of the year in the more developed estuaries,as indicated by the results presented (see Tables 1& 2), increased exposure to toxins may also be a con-cern, as has been demonstrated in salmonids (Ar -koosh et al. 1998). Dependence on estuarine environ-ments has been identified as a significant risk factor,and species that use these environments at any lifestage are considered to be highly vulnerable (Roberts& Hawkins 1999). Rockfishes in general are also con-sidered to be particularly susceptible to overfishing
due to an inherent low productivity and late age atmaturity (Parker et al. 2000) and therefore may beunable to adapt quickly to detrimental conditionsthat may develop in estuaries.
The mouth cross-sectional area and hardenedlinear shoreline proxies, created for this study to de-scribe development level, could be applied to otherstudies examining human impacts on estuarine in-habitants. The estimate of each of the proxies in eachestuary was consistent with the classification schemeestablished by the DLCD (1987), and is fairly repre-sentative of the level of development. However, it isimportant to note that the proxies used here integrateseveral aspects that may be important for explainingthe differences between the catch rates in multiple es-tuaries. They do not address specific factors such asoverall size of the estuary, river flow rates, tidal ex-changes, or the types of structure available, but ratherattempt to combine these multiple factors into 1 quan-tifiable variable. As such, the im pact of each of thesefactors individually cannot be assessed using theseproxies. However, they do provide a useful startingpoint for many potential avenues of research on hu-man impacts on estuarine ecosystems and are less in-tensive compared to existing methods.
In general, differences in rockfish catch among theestuaries lend support to the concept that moredeveloped estuaries may harbor more YOY rockfish;significant differences indicated that more devel-oped estuaries had higher catches than less devel-oped estuaries. Settlement patterns suggest thatYOY rockfish are also present for a longer part of theyear (>6 mo) in the 2 most developed estuaries(Yaquina and Coos) when compared to the 2 to 3 moresidence times observed in other estuaries. Theseresults suggest that specific estuaries on the Oregoncoast may be more important to this early life historystage than others, which could have consequencesfor conservation and management planning for blackrockfish in particular. For example, indices of juve-nile abundance could be easily estimated in the estu-aries, which may provide useful information on inter-annual variability in recruitment.
As mentioned, rockfish catches in multiple estuar-ies were significantly different among sites andappeared to be driven by observed late-seasonincreases in a subset of the estuaries sampled. Theseobservations are supported by the significant intra-seasonal differences presented. There are severalpossible biological explanations; however, this late-season increase is most likely to be indicative ofmovement up or down the estuary instead of addi-tional recruitment. This pattern could possibly be
151
Mar Ecol Prog Ser 448: 143–154, 2012
movement to a more sheltered location within theestuary prior to the winter storm season or as astopover point on their way out of the bay. If the for-mer is true, this phenomenon is possibly a function ofthe size of the estuary rather than the level of devel-opment or location on the coast. There are also sev-eral possible ecological explanations, including tem-poral shifts in the location of known predators, suchas lingcod Ophiodon elongatus or salmon Onco rhyn -chus spp., within the estuaries. Lingcod are known touse locations near estuary mouths as nesting sitesduring the winter and early spring months (Love1996). Salmon have also been shown to predate onYOY rockfishes (Baldwin et al. 2008), and the timingof salmon runs through the estuaries may affect YOYrockfish movement patterns as well. Salmon runs inthese 6 estuaries range from spring to late fall, andtherefore overlap the time period when YOY or juve-nile rockfishes are present. The general size distribu-tion of rockfish did not change at this point in the sea-son, indicating that a second settlement event wasunlikely. The physical parameters measured (tem-perature, salinity, dissolved oxygen) encompassed awide range of conditions throughout the year, and sofactors such as decreased salinity from increased fallriver flow were not likely to have affected the spatialdistributions of YOY rockfishes.
Although Age-1 rockfish were not specifically tar-geted, the minnow traps employed (with an openingof approximately 3 cm by 30 cm) caught a fair num-ber of probable Age-1 rockfishes at the beginning ofthe season in Yaquina and Coos Bays in 2009. Thissuggests that some portion of the YOY rockfishes dooverwinter in the estuary, or at least, move into theestuary from the nearshore environment in the earlyspring. In either case, older juveniles in addition tothe YOYs do appear to use habitats within certainestuaries.
The environmental conditions measured duringthe course of the present study were not clearly dif-ferent from the normal conditions encountered in anOregon estuary, and are likely not driving the rela-tive distribution of YOY rockfish in Oregon estuaries.This was expected, given the number of studies con-firming the presence of YOY rockfish within theseestuaries and the fact that the present study did noten counter environmental conditions atypical to estu-arine environments on the Oregon coast. Results mayhave differed if environmental conditions were measured on a continuous basis throughout the trapsession.
Catches of YOY rockfish in Yaquina Bay were sim-ilar to those of Gallagher & Heppell (2010) in terms of
species compositions and timing of capture events,indicating that YOY rockfish have used the estuarinehabitat in this bay consistently over multiple years(2004 to 2005, 2008 to 2009). Estuarine habitat withinCoos Bay is used by YOY rockfishes on a consistentinterannual basis (2000 to 2009) as well (Miller &Shanks 2004, J. A. Miller pers. comm.). To our know -ledge, no other information exists on interannual differences in YOY rockfish presence within otherestuaries on the Oregon coast. The trap surveys con-ducted here establish a baseline for assessing in -terannual variation in estuarine settlement, althoughadditional information on other factors potentiallyaffecting settlement levels interannually would beneeded to fully explore this, and for spatial compar-isons across a large portion of the Oregon coast.
Overall, the present study explored settlement pat-terns of rockfishes on the Oregon coast during a lifestage for which little information exists, documentedthat YOY black rockfish settle into multiple estuarieson the Oregon coast, and provides additional supportfor the importance of structure during the settlementprocess. Other studies of north Pa cific rockfisheshave shown that settlement can be an active processunder behavioral control (Pastén et al. 2003) and thathabitat complexity could be as important a factor asthe initial supply of recruits in post-settlement mor-tality rates (Johnson 2007). Although annual recruit-ment in rockfishes is extre mely variable (Love et al.1991, Ralston & Howard 1995, Wilson et al. 2008), arecent long-term study in California showed positivecorrelations between newly settled rockfish abun-dances and year class strength in adult populations(Laidig et al. 2007), so information regarding thepost- settlement life stage is valuable to fisheriesmanagement efforts. This study has provided evi-dence supporting the use of estuarine habitat bySebastes melanops, and possibly other species ofrockfish, during their early life history and suggeststhat the continued development of these habitatscould affect population dynamics of marine fish spe-cies on the west coast. Future work should focus oncontinuing to explore the connections between thepost- settlement life stage in rockfishes and theexploited adult populations, and how anthropogenicinfluences could alter this relationship.
Acknowledgements. We thank J. Hyde and C. Vanegas forassistance with the genetic identification work and fieldassistants S. Jackson and R. Hamner. A. Evans and S. Hilberprovided valuable comments on the manuscript. This studywas supported in part by Oregon State Wildlife Grant Pro-gram grant T-16-1 E-47. Additional support was provided bythe Hatfield Marine Science Center.
152

Dauble et al.: Settlement of young-of-the-year rockfish in estuaries
LITERATURE CITED
Appy M, Collson PJ (2000) Oregon coastal juvenile rockfishstudy. Oregon Department of Fish and Wildlife, MarineResources Division, Newport, OR
Arkoosh MR, Casillas E, Clemons E, Kagley A, Olson R,Reno P, Stein JE (1998) The effect of pollution on fish diseases: potential impacts on salmonid populations.J Aquat Anim Health 10: 182−190
Baldwin RE, Miller TW, Brodeur RD, Jacobson KC (2008)Expanding the foraging history of juvenile Pacificsalmon: combining stomach-content and macroparasite-community analyses for studying marine diets. J FishBiol 72: 1268−1294
Beck MW, Heck KL Jr, Able KW, Childers DL and others(2001) The identification, conservation, and manage-ment of estuarine and marine nurseries for fish andinvertebrates. Bioscience 51: 633−641
Boehlert GM, Yamada J (1991) Introduction to the sympo-sium on rockfishes. Environ Biol Fishes 30: 9−13
Borde AB, Thom RM, Rumrill S, Miller LM (2003) Geospatialhabitat change analysis in Pacific Northwest coastalestuaries. Estuaries 26: 1104−1116
Brown JA (2006) Using the chemical composition of otolithsto evaluate the nursery role of estuaries for English solePleuronectes vetulus populations. Mar Ecol Prog Ser 306: 269−281
Buckley RM (1997) Substrate associated recruitment of juve-nile Sebastes in artificial reef and natural habitats inPuget Sound and the San Juan Archipelago, Washing-ton. Tech Rep RAD97-06. Washington Department ofFish and Wildlife, Olympia, WA
Burford MO, Larson RJ (2007) Genetic heterogeneity in asingle year-class from a panmictic population of adultblue rockfish (Sebastes mystinus). Mar Biol 151: 451−465
Carr MH, McGinnis MV, Forrester GE, Harding J, RaimondiPT (2003) Consequences of alternative decommissioningoptions to reef fish assemblages and implications fordecommissioning policy. MMS OCS study 2003-053.Coastal Research Center, Santa Barbara, CA
Code of Federal Regulations (2011) Title 50 - Wildlife andFisheries. Chapter VI: Fishery conservation and manage-ment, Sub-part C: West coast groundfish fisheries 660.40.National Oceanic and Atmospheric Administration, USDepartment of Commerce. Available at http: //cfr.vlex.com/source/code-federal-regulations-wildlife-fisheries-1099/toc/06.81 (accessed 13 Oct 2011)
Crowder LB, Cooper WE (1982) Habitat structural complex-ity and the interaction between bluegills and their prey.Ecology 63: 1802−1813
DLCD (Department of Land Conservation and Deve -lopment) (1987) The Oregon estuary plan book. Avail-able at www.inforain.org/oregon-estuary/ (accessed 15March 2010)
Edgar GJ, Barrett NS, Graddon DJ, Last PR (2000) The conservation significance of estuaries: a classification ofTasmanian estuaries using ecological, physical, anddemographic attributes as a case study. Biol Conserv 92: 383−397
Gallagher MB, Heppell SS (2010) Essential habitat identifi-cation for age-0 rockfish along the central Oregon coast.Mar Coast Fish 2: 60−72
Gilbert-Horvath EA, Larson RJ, Garza JC (2006) Temporalrecruitment patterns and gene flow in kelp rockfish(Sebastes atrovirens). Mol Ecol 15: 3801−3815
Gillanders BM (2005) Using elemental chemistry of fishotoliths to determine connectivity between estuarine andcoastal habitats. Estuar Coast Shelf Sci 64: 47−57
Hedgecock D (1994) Does variance in reproductive successlimit effective population sizes of marine organisms? In: Beaumont AR (ed) Genetics and evolution of aquaticorganisms. Chapman & Hall, London, p 122–134
Hickey BM, Banas NS (2003) Oceanography of the USPacific Northwest coastal ocean and estuaries with appli-cation to coastal ecology. Estuaries 26: 1010−1031
Hixon MA, Beets JP (1989) Shelter characteristics andCaribbean fish assemblages: experiments with artificialreefs. Bull Mar Sci 44: 666−680
Hyde JR, Vetter RD (2007) The origin, evolution, and diver-sification of rockfishes of the genus Sebastes (Cuvier).Mol Phylogenet Evol 44: 790−811
Ivanova NV, Dewaard JR, Hebert PD (2006) An inexpensive,automation-friendly protocol for recovering high-qualityDNA. Mol Ecol Notes 6: 998−1002
Johansson ML, Banks MA, Glunt KD, Hassel-Finnegan HM,Buonaccorsi VP (2008) Influence of habitat discontinuity,geographical distance, and oceanography on fine-scalepopulation genetic structure of copper rockfish (Sebastescaurinus). Mol Ecol 17: 3051−3061
Johnson DW (2007) Habitat complexity modifies post- settlement mortality and recruitment dynamics of amarine fish. Ecology 88: 1716−1725
Kline JD, Azuma DL, Moses A (2003) Modeling the spatiallydynamic distribution of humans in the Oregon (USA)coast range. Landsc Ecol 18: 347−361
Laidig TE, Chess JR, Howard DF (2007) Relationshipbetween abundance of juvenile rockfishes (Sebastesspp.) and environmental variables documented off thenorthern California and potential mechanisms for thecovariation. Fish Bull 105: 39−48
Larson RJ, Lenarz WH, Ralston S (1994) The distribution ofpelagic juvenile rockfish of the genus Sebastes in theupwelling region off central California. Calif CoopOcean Fish Invest Rep 35: 177−221
Lotze HK, Lenihan HS, Bourque BJ, Bradbury RH and others(2006) Depletion, degradation, and recovery potential ofestuaries and coastal seas. Science 312: 1806−1809
Love MS (1996) Probably more than you want to know aboutfishes of the Pacific coast, 2nd edn. Really Big Press,Santa Barbara, CA
Love MS, Carr MH, Haldorson LJ (1991) The ecology of substrate-associated juveniles of the genus Sebastes.Environ Biol Fishes 30: 225−243
Love MS, Yoklavich M, Thorsteinson L (2002) The rock-fishes of the northeast Pacific. University of CaliforniaPress, Berkeley, CA
MacNally R, Thomson JR, Kimmerer WJ, Feyrer F and others (2010) Analysis of pelagic species decline in theupper San Francisco estuary using multivariate auto -regressive modeling (MAR). Ecol Appl 20: 1417−1430
Matarese AC, Kendell AW, Blood DM, Vitner BM (1989)Laboratory guide to early life history stages of NortheastPacific fishes. Tech Rep NMFS 80. National Oceanic andAtmospheric Administration, Seattle, WA
Miller JA, Shanks AL (2004) Ocean–estuary coupling in theOregon upwelling region: abundance and transport ofjuvenile fish and of crab megalopae. Mar Ecol Prog Ser271: 267−279
Miller JA, Shanks AL (2005) Abundance and distribution oflarval and juvenile fish in Coos Bay, Oregon: time-series
153

Mar Ecol Prog Ser 448: 143–154, 2012154
analysis based on light-trap collections. Mar Ecol ProgSer 305: 177−191
Monaco ME, Lowery TA, Emmett RL (1992) Assemblages ofU.S. west coast estuaries based on the distribution offishes. J Biogeogr 19: 251−267
Najjar RG, Pyke CR, Adams MB, Breitburg D and others(2010) Potential climate-change impacts on the Chesa-peake Bay. Estuar Coast Shelf Sci 86: 1−20
Parker SJ, Berkeley SA, Golden JT, Gunderson DR and others (2000) Management of Pacific rockfish. Fisheries25: 22−29
Pastén GP, Katayama S, Omori M (2003) Timing of parturi-tion, planktonic duration, and settlement patterns of theblack rockfish, Sebastes inermis. Environ Biol Fishes 68: 229−239
Pearcy WG, Myers SS (1974) Larval fishes of Yaquina Bay,Oregon: a nursery ground for marine fishes. Fish Bull 72: 201−213
Ralston S, Howard DF (1995) On the development of year-class strength and cohort variability in two northern Cali -fornia rockfishes. Fish Bull 93: 710−720
Roberts CM, Hawkins JP (1999) Extinction risk at sea.Trends Ecol Evol 14: 241−246
Rocha-Olivares A, Kimbrell CA, Eitner BJ, Vetter RD (1999)Evolution of a mitochondrial cytochrome b gene se quencein the species-rich genus Sebastes (Teleostei, Scor -paenidae) and its utility in testing the monophyly of thesubgenus Sebastomus. Mol Phylogenet Evol 11: 426−440
Rooper CN, Gunderson DR, Armstrong DA (2006) Evidencefor resource partitioning and competition in nurseryestuaries by juvenile flatfish in Oregon and Washington.Fish Bull 104: 616−622
Sakuma KM, Ralston S, Wespestad VG (2006) Interannual
and spatial variation in the distribution of young-of-the-year rockfish (Sebastes spp.): expanding and coordinat-ing a survey sampling frame. Calif Coop Ocean FishInvest Rep 47: 127−139
Sampson DB (2007) The status of black rockfish offOregon and California in 2007. SAFE documents: Octo-ber 2008. Available at www.pcouncil.org/groundfish/stock-assessments/safe-documents/october-2008-safe-document/ (accessed 14 March 2010)
Schlosser S, Bloeser J (2006) The collaborative study of juvenile rockfish, cabezon, and kelp greenling habitatassociations between Morro Bay, California and New-port, Oregon. California Sea Grant & Pacific MarineConservation Council, Arcata, CA
Seitz RD, Dauer DM, Llanso RJ, Long WC (2009) Broad-scaleeffects of hypoxia on benthic community structure inChesapeake Bay, USA. J Exp Mar Biol Ecol 381: S4−S12
Sommer T, Armor C, Baxter R, Breuer R and others (2007)The collapse of pelagic fishes in the upper San Franciscoestuary. Fisheries 32: 270−277
Studebaker RS, Mulligan TJ (2008) Temporal variation andfeeding ecology of juvenile Sebastes in rocky intertidaltidepools of northern California, with emphasis onSebastes melanops Girard. J Fish Biol 72: 1393−1405
Taylor CA, Watson W, Chereskin T, Hyde J, Vetter J (2004)Retention of larval rockfishes, Sebastes, near natal habitat in the Southern California Bight, as indicated bymolecular identification methods. Calif Coop Ocean FishInvest Rep 45: 152−166
Wilson JR, Broitman BR, Caselle JE, Wendt DE (2008)Recruitment of coastal fishes and oceanographic vari-ability in central California. Estuar Coast Shelf Sci 79: 483−490
Editorial responsibility: Nicholas Tolimieri, Seattle, Washington, USA
Submitted: March 11, 2011; Accepted: November 15, 2011Proofs received from author(s): February 7, 2012