seven key metrics to improve agile performance
TRANSCRIPT

Influenced by: Jeff Sutherland & Scott Downey
Scrum Metrics
TEAM LEVEL METRICS TO GUIDE TACTICAL AND STRATEGIC DECISION MAKING
• Agile Coach, Trainer and Scrum Master
• CSP, CSM, CSPO, Innovation Games Orange Belt
• 15+ Years in management, senior level consulting, product management and engagement management
• Head of Product Management for XRM Global
• COO for a publicly held software company
• Scrum Master and Agile Coach for various companies including Accenture/AT&T, Milliman, GPC , IHG, Blinds.com etc…
Andrew Graves

What’s Ahead
Metrics:
What can we measure, why do we want to measure it and what drives the metrics?
ObjectiveTo develop and standardize a set of Easy to Capture Metrics
Help Scale agile across the enterprise
Help Scrum Masters & Coaches Evaluate and Guide Teams
Provide Insights about team performance for our business stakeholders

THE MATH AND PURPOSE OF EACH
Metrics

Metrics
• Velocity / Story Point Capacity
• Adopted Work• Found Work• Injected Work• Targeted Value Increase• Accuracy of Estimation• Reliability• Cost per Story Point
Metrics Comparable Across Teams
Team Specific Metrics

Metrics: Velocity
I, as a… Scrum Product Owner who is trying to create an accurate Roadmap for future releases
…need… a reliable metric on which to base my assumptions about the rate of the team’s progress and sprint capacity
…so that… with our Leadership, we can make well-informed tradeoffs and commitments based on the reality of our teams capabilities.
Formula: Sum of Original Estimates of All Approved Cards
1:1

Metrics: Velocity
8
8
1
8
3
5
8
PBL SBL DONE Original Commitment: 19
Total Completed: 19
3

Metrics: Adopted Work
I, as a… a Scrum Master, who is trying to coach a team toward more accurate Commitments during each Sprint Planning Meeting,
…need… a way to measure how much work the Team can do in a given Sprint, a metric that clearly shows if the Team has a tendency to under Commit and is consistently having to pull work forward from the Product Backlog before the end of the Sprint
…so that… I can encourage the Team toward higher Commitments during the Sprint Planning Meetings without the risk of pushing them to failure.
Formula: Sum of Original Estimates for Work Pulled Forward Original Commitment
1:1
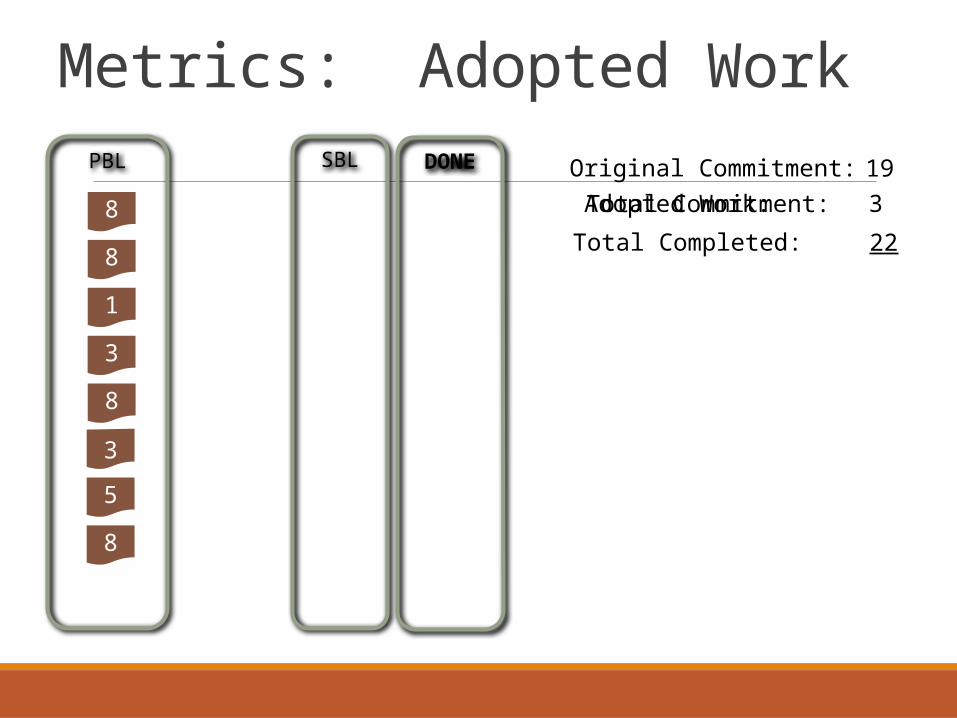
Adopted Work: 3
Metrics: Adopted Work
8
8
1
8
3
5
8
PBL SBL DONE
Total Commitment:
19
Original Commitment: 19
Total Completed: 22
3

Metrics: Found Work
I, as a… a Scrum Master, who is trying to help my Team make more accurate and reliable Commitments in Sprint Planning,
…need… a clear way to measure the likelihood of unexpected work based on a Card’s Original Estimate
…so that… I can offer advice to the Team on making achievable Commitments and provide them fair warning when they start commit to story that will probably surprise them.
Formula: Sum of Total Work Reported per Story – Original Estimate
1:1

3
Found Work: 3
Metrics: Found Work
3
1
5
2
8
13
5
8
3
PBL SBL In Prog DONE
Total Commitment:
19
Original Commitment: 19
Total Commitment: 22
Source : Jeff Sutherland & Scott Downey

Metrics: Injected Work
I, as a… a Scrum Master, who is trying to help my Team make more accurate and reliable Commitments in Sprint Planning,
…need… a clear way to measure the likelihood of unexpected work based on a historical behavior
…so that… I can help the team manage the scope for the sprint and strive for achievable commitments.
Formula: Sum of Total Story points from new stories added to sprint after sprint planning
1:1

Metrics: Targeted Value Increase
I, as a… a Scrum Product Owner who is trying to evaluate the effectiveness of the product directions I have chosen
…need… a reliable way to measure the increased value contribution of the Team sprint-over-sprint
…so that… I can compare the Team’s rate of contribution increase to see if contributions are in alignment with ROI expectations and continuous improvement is taking place.
Formula: Current Sprint’s Velocity ÷ Original Velocity
1:1
Source: Jeff Sutherland & Scott Downey

Sprint # Velocity
Original Velocity
Current Velocity
1 8
2 13
3 21 4 37
5 42
TVI: 8 ÷ 8 = 100%13 = 162.5%21 = 237.5%33 = 412.5%42 = 525%
Metrics: Targeted Value Increase
Source : Jeff Sutherland & Scott Downey

Metrics: Accuracy of Estimation
I, as a… a Scrum Product Owner who is interested in creating reliable roadmaps, including Optimistic, Likely and Pessimistic release dates for larger initiatives,
…need… a metric that tracks the margin of error on the Team’s Original Estimates
…so that… I can multiply their good-faith estimates by this factor and create more realistic date projections.
Formula: 1 – (Estimate Delta ÷ Total Commit)
1:1

= 0.2272- 0.2272 =
5
2
8
3
1
SBL In Prog DONE
Delta: 5
Metrics: Accuracy of Estimation
Original Commitment: 19
Total Commitment: 22
Estimate Delta: 5Total : 22
Actual
2
2
8
5
7
Delta
-1
+1
+3
+3
-1
1
0.7728 = 77%
Source : Jeff Sutherland & Scott Downey

Metrics: Reliability
I, as a… Scrum Master, who is concerned about the accuracy of my teams commitments
…need… a metric that informs me of the margin of error when the Team commits to a body of work
…so that… I can use this margin of error to predict reliable dates, and know when it is safe to lobby for a higher Commitment at each Planning Meeting
Formula: (Sum of Points Committed) ÷ (Sum of Points Accepted)
1:1

Chart: Reliability
Sprint 1 Sprint 2 Sprint 3 Sprint 4 Sprint 5 Sprint 6-15%
-10%
-5%
0%
5%
10%
15%
Reliability Variance
Reliability Variance

Metrics: Cost per Point
I, as a… Executive, who is concerned about the value of my teams contributions
…need… a metric that informs me of the cost of a story point …so that… I can better estimate much projects will cost and measure
the level of value a team can produce over timeFormula: (total cost of a sprint) ÷ (sum of Story Points accepted in that
sprint)
1:1

Metrics: Cost per Point
Sprint 18 Sprint 19 Sprint 20 Sprint 21 Sprint 22 Sprint 23 $-
$200.00
$400.00
$600.00
$800.00
$1,000.00
$1,200.00
$1,400.00
Cost Per Point

Metrics: Effort by Class of Service (COS)
I, as a… Stakeholder, who is concerned about the focus of my scrum teams
…need… a metric that informs me where my teams are spending their time
…so that… I can better estimate much projects and keep my team focused on the highest priority work
Formula: (Sum of Point dedicated to a COS a sprint) / (Sum of Story Points complete in that sprint)
1:1

Effort by Class of Service
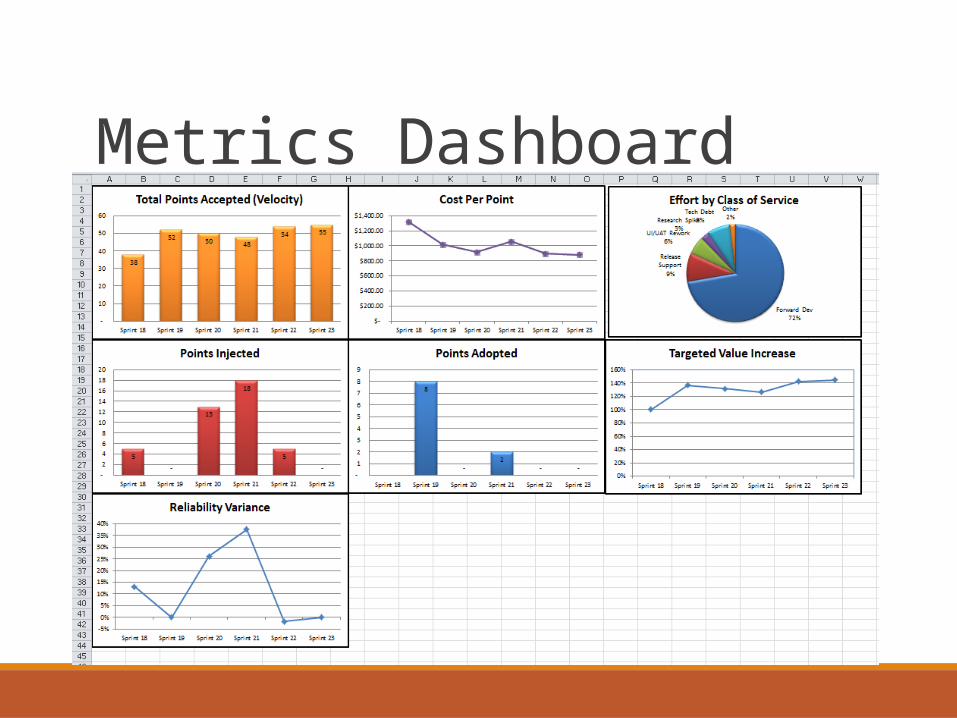
Metrics Dashboard

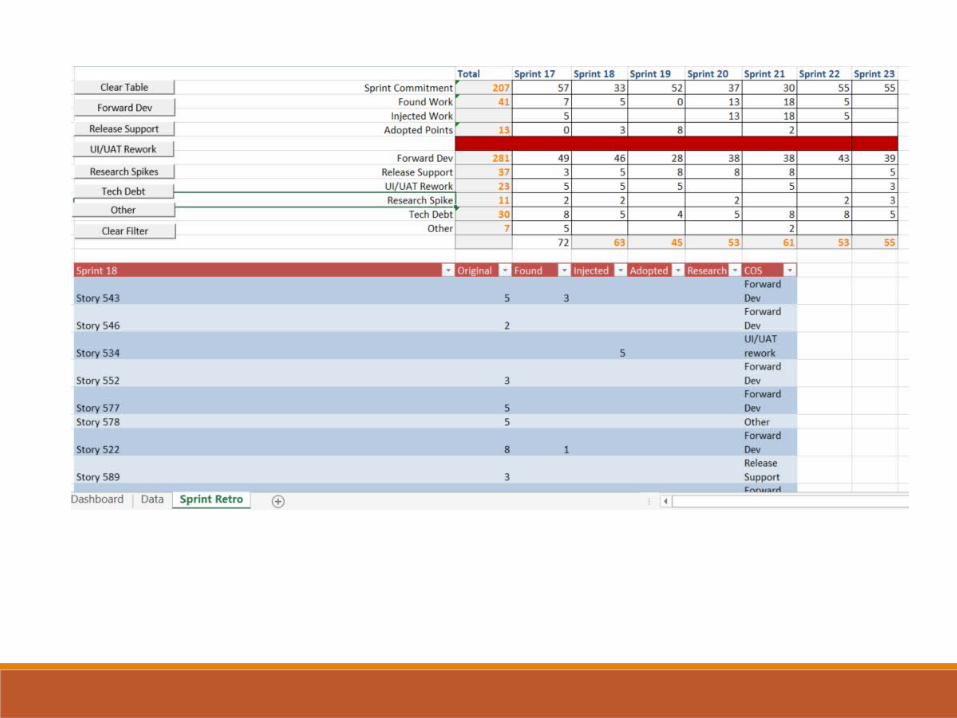
Additional Data

ITS ALL ABOUT THE RETROSPECTIVE
How do you capture the data?
Example Retro Agenda1. Opening & Set the Stage
2. Review each story for context and to capture data for metrics
3. Capture Retro Data
4. Generate Insights
5. Decide What to do
6. Close the Retrospective
MAPPING METRICS TO SMELLS
So… What can I do with these Metrics

Velocity & Cost Per Point
Sprint 18 Sprint 19 Sprint 20 Sprint 21 Sprint 22 Sprint 23 -
10 20 30 40 50 60
38
52 50 48 54 55
Total Points Accepted (Veloc-ity)
Sprint 18
Sprint 19
Sprint 20
Sprint 21
Sprint 22
Sprint 23
$-
$200.00
$400.00
$600.00
$800.00
$1,000.00
$1,200.00
$1,400.00 Cost Per Point
• Spike might indicate an overly manual deployment and CI process

Points Found
• Missed Estimates• Incomplete User Stories• Not enough time allotted for
Research and Discovery• Just In Time Sprints• Missunderstood requirements
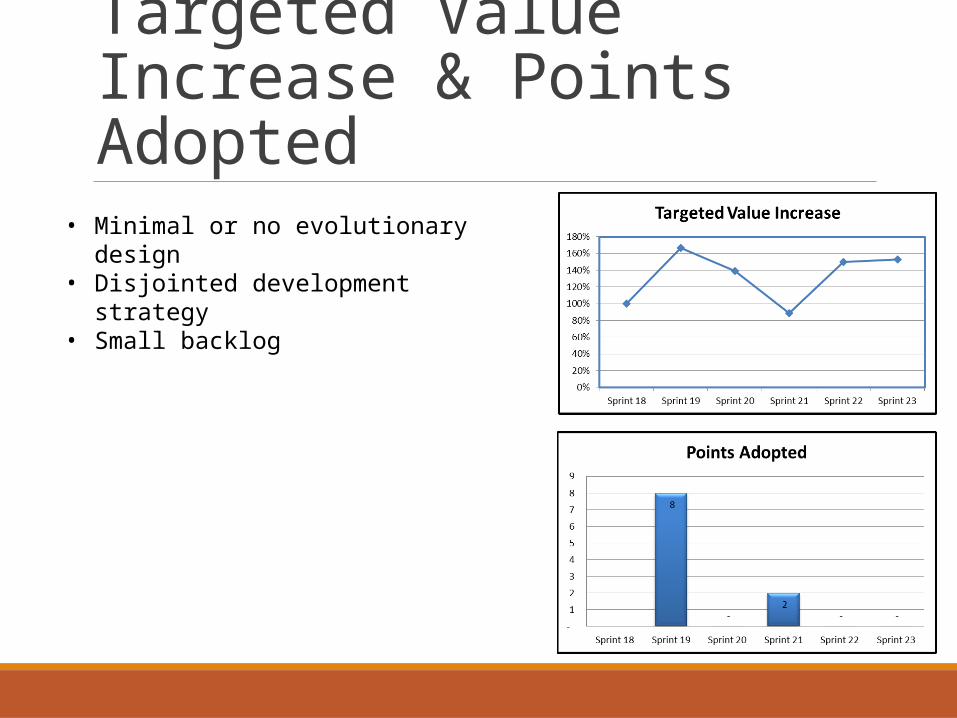
Targeted Value Increase & Points Adopted
• Minimal or no evolutionary design• Disjointed development strategy• Small backlog

Points Injected
Sprint 18 Sprint 19 Sprint 20 Sprint 21 Sprint 22 Sprint 23 - 2 4 6 8
10 12 14 16 18 20
5
-
13
18
5
-
Points Injected• Immature Scrum Organization• No Respect for Sprint Scope or
the Sprint Plan• Lack of focus

Effort by Class of Service
• Look for a good blend here• Things like UAT rework and tech
debt are good things so long as it’s a small slice
• Too much spread indicated lack of focus

Example 1

Example 2
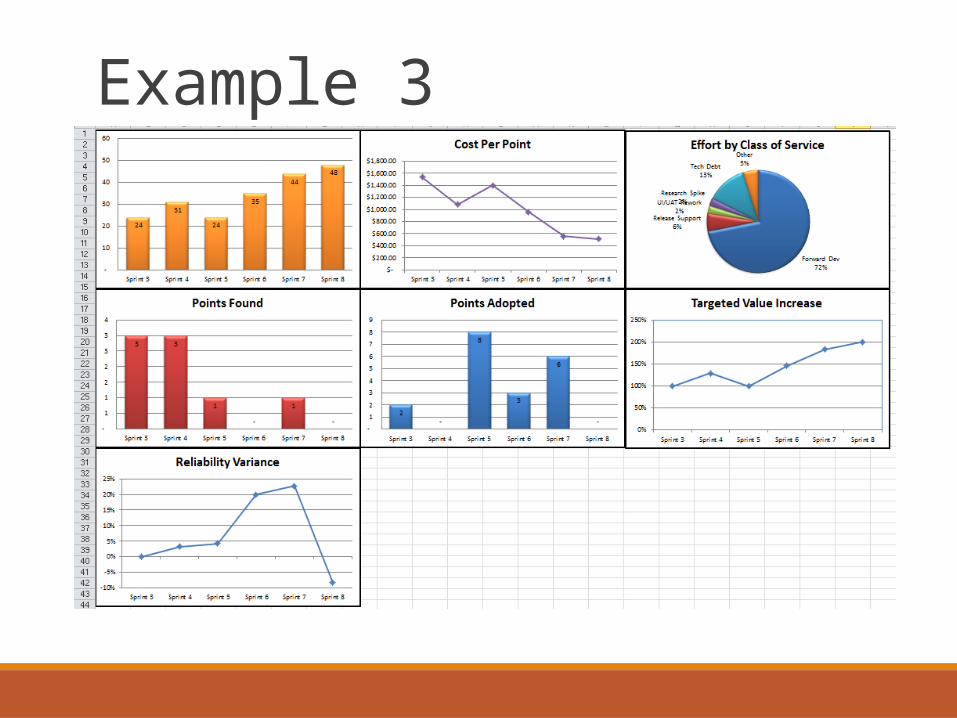
Example 3
Q & A

Contact Info:Andrew Graves [email protected]