severe housing deprivation in aotearoa/new zealand 2001-2013
TRANSCRIPT
Severe housing deprivation in Aotearoa/New Zealand
2001-2013
Kate Amore He Kainga Oranga / Housing & Health Research Programme
Department of Public Health University of Otago, Wellington
2
Keywords
Severe housing deprivation, homelessness, definition, classification, methodology, prevalence, count, unmet housing need, New Zealand
Disclaimer Access to the Census data used in this study was provided by Statistics New Zealand under conditions designed to give effect to the security and confidentiality provisions of the Statistics Act 1975. The results presented in this study are the work of the author, not Statistics NZ.
Citation Amore K. (2016). Severe housing deprivation in Aotearoa/New Zealand: 2001-2013. He Kainga Oranga/Housing & Health Research Programme, University of Otago, Wellington.
3
Key findings
The severely housing deprived or 'homeless' population has grown in size and scale over the last three censuses, at an accelerating rate. The prevalence of homelessness grew by 15 per cent between the 2006 and 2013 censuses, compared with a 9 per cent increase between 2001 and 2006.
In 2013, there were at least 41,000 homeless New Zealanders, or about one in every 100 New Zealanders.
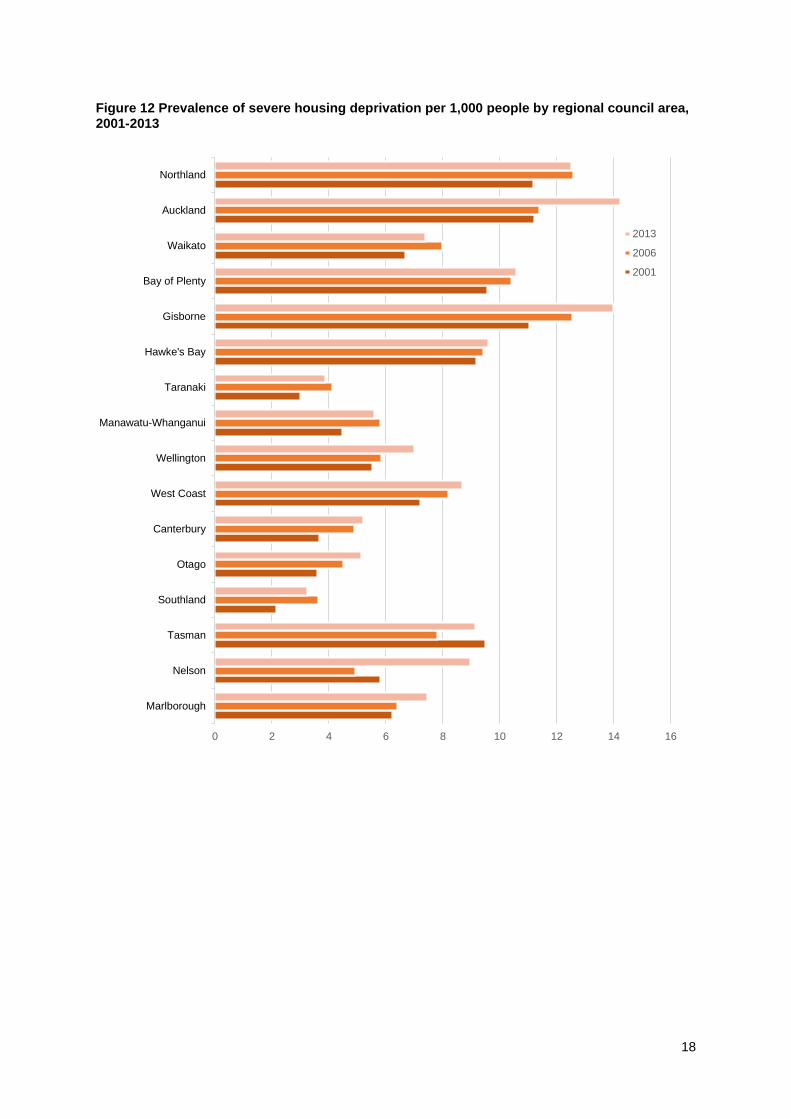
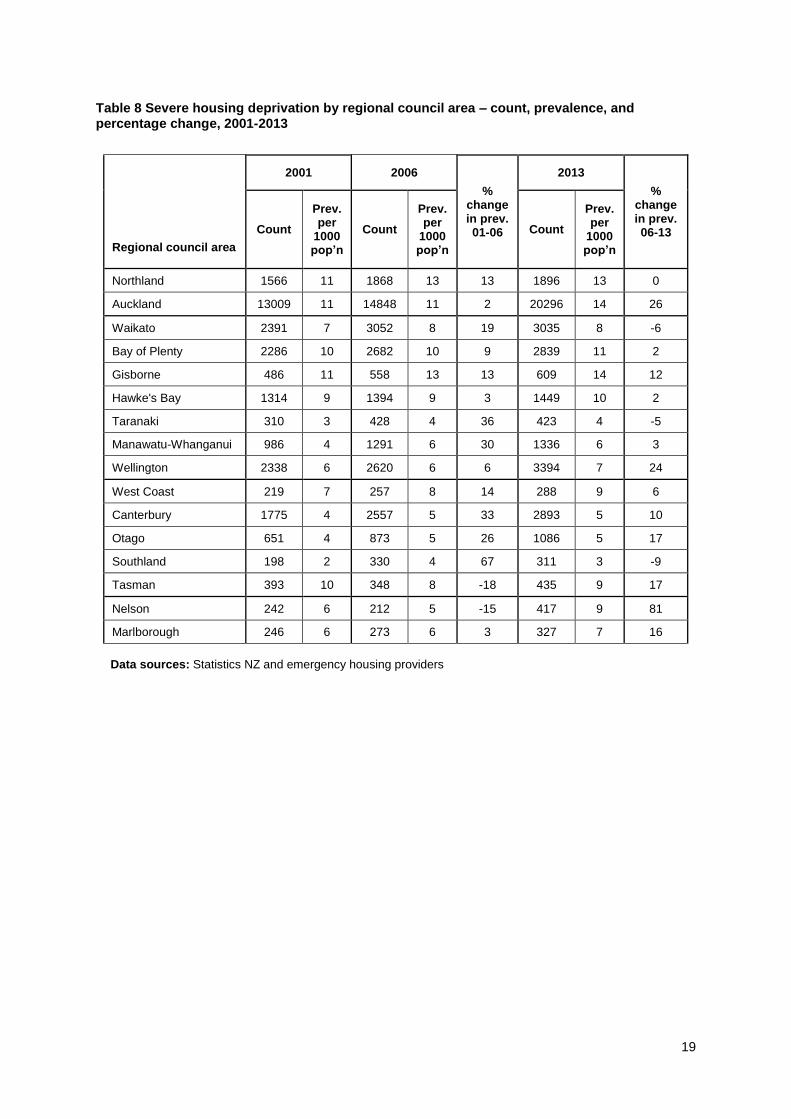
Nelson, Auckland and Wellington regions saw the largest increases in homelessness between 2006 and 2013.
Homelessness declined in Southland, Waikato, and Taranaki regions between 2006 and 2013.
More than half (52%) of homeless adults are working, studying, or both.
More than half (51%) the homeless population are younger than 25.
People identifying as Pacific, Māori, or Asian groups are over-represented in the homeless population. Pacific New Zealanders are ten times more likely to be homeless than European New Zealanders.
Migrants, especially new migrants, are at particular risk of homelessness.

4
Introduction
In 2016, the state of severe housing deprivation (or ‘homelessness’) in New Zealand has been the subject of unprecedented attention and concern. The issue is not new, but as this report shows, the accelerating prevalence of homelessness alone warrants a real policy focus, now more than ever. This report updates our original Statisphere report Severe Housing Deprivation: The problem and its measurement (Amore et al., 2013), in which we developed a definition of severe housing deprivation and produced national statistics for 2001 and 2006. This current report extends the analysis to 2013, applying the same definition, classification, and method, which are summarised in this introduction. For readers interested in the conceptual and technical basis of the methodology, I direct you to the previous report, where it is discussed in detail.
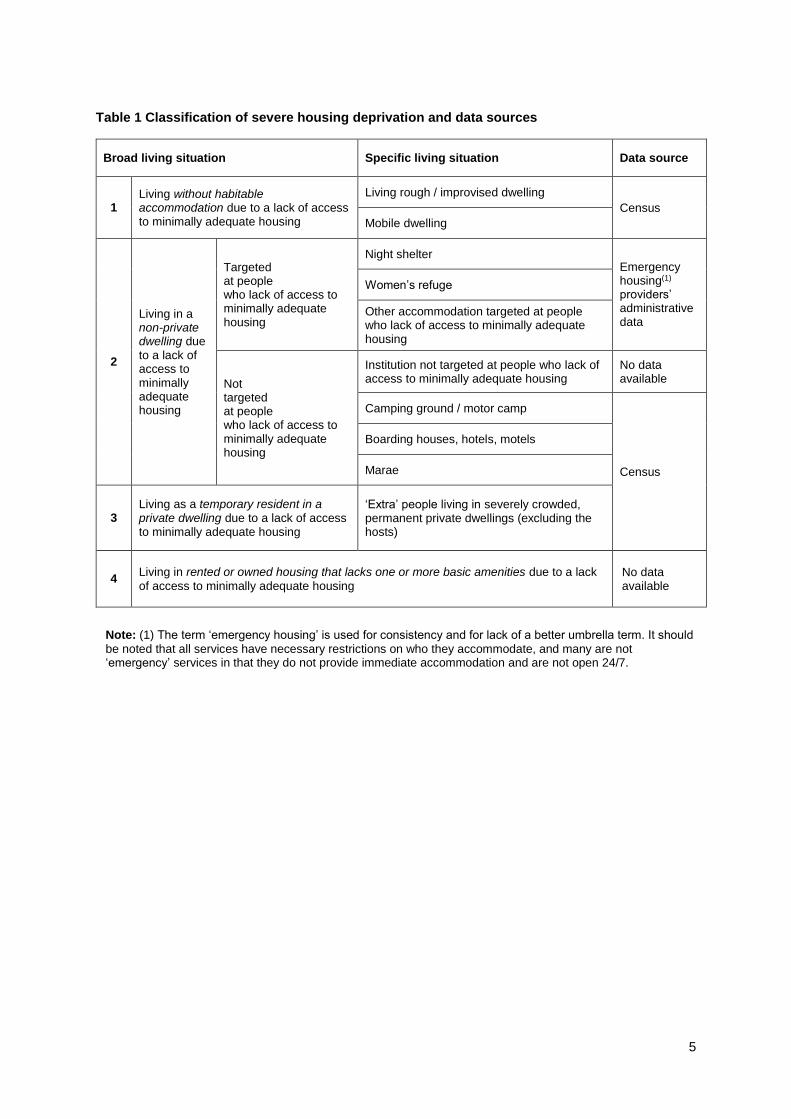
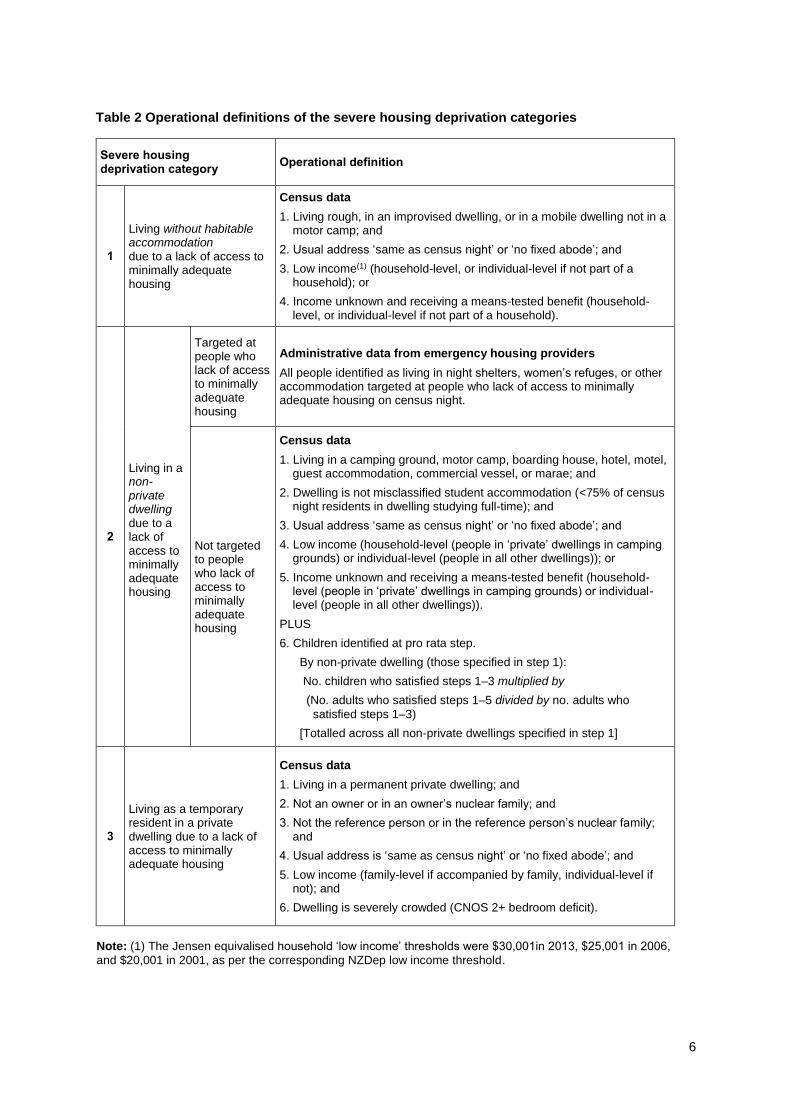
Definition and classification Severe housing deprivation refers to people living in severely inadequate housing due to a lack of access to minimally adequate housing. This means not being able to access an acceptable dwelling to rent, let alone buy. This definition is supported by international literature, and has recently been adopted in a prominent global framework for conceptualising and measuring homelessness (Busch-Geertsema, et al., 2016). It has a firm grounding in New Zealand, being based on the official New Zealand Definition of Homelessness (Statistics New Zealand, 2009) which was developed by three government agencies – Statistics New Zealand, Housing New Zealand Corporation, and Ministry of Social Development. Table 1 lists the living situations classified as severely inadequate according to this definition. These situations qualify as severely inadequate because they are lacking in two out of three core dimensions of housing adequacy: habitability; privacy and control; and security of tenure. Minimally adequate housing is a dwelling with all basic amenities, with the security of tenure of a standard tenancy. All New Zealanders should have access to such housing, notwithstanding the fact that some people have other options and the financial means to secure them. Table 1 also shows the data sources used to measure each category of severe housing deprivation, and those categories that cannot be measured because no data are currently available.
Method
As per the previous report, two data sources were used to measure severe housing deprivation in 2013: Census and administrative data from emergency accommodation providers. Table 2 summarises the method for measuring severe housing deprivation, and Figure 1 shows the algorithm for identifying severely housing deprived people in census data.
5
Table 1 Classification of severe housing deprivation and data sources
Broad living situation Specific living situation Data source
1 Living without habitable accommodation due to a lack of access to minimally adequate housing
Living rough / improvised dwelling
Census
Mobile dwelling
2
Living in a non-private dwelling due to a lack of access to minimally adequate housing
Targeted at people who lack of access to minimally adequate housing
Night shelter Emergency housing(1) providers’ administrative data
Women’s refuge
Other accommodation targeted at people who lack of access to minimally adequate housing
e. Living in other accommodation targeted at people who lack access to minimally adequate housing due to LAMAH
Not targeted at people who lack of access to minimally adequate housing
Institution not targeted at people who lack of access to minimally adequate housing
No data available
Camping ground / motor camp
Census
Boarding houses, hotels, motels
Marae
3 Living as a temporary resident in a private dwelling due to a lack of access to minimally adequate housing
‘Extra’ people living in severely crowded, permanent private dwellings (excluding the hosts)
4 Living in rented or owned housing that lacks one or more basic amenities due to a lack
of access to minimally adequate housing No data available
Note: (1) The term ‘emergency housing’ is used for consistency and for lack of a better umbrella term. It should
be noted that all services have necessary restrictions on who they accommodate, and many are not ‘emergency’ services in that they do not provide immediate accommodation and are not open 24/7.
6
Table 2 Operational definitions of the severe housing deprivation categories
Severe housing deprivation category
Operational definition
1
Living without habitable accommodation due to a lack of access to minimally adequate housing
Census data
1. Living rough, in an improvised dwelling, or in a mobile dwelling not in a motor camp; and
2. Usual address ‘same as census night’ or ‘no fixed abode’; and
3. Low income(1) (household-level, or individual-level if not part of a household); or
4. Income unknown and receiving a means-tested benefit (household-level, or individual-level if not part of a household).
2
Living in a non-private dwelling due to a lack of access to minimally adequate housing
Targeted at people who lack of access to minimally adequate housing
Administrative data from emergency housing providers
All people identified as living in night shelters, women’s refuges, or other accommodation targeted at people who lack of access to minimally adequate housing on census night.
Not targeted to people who lack of access to minimally adequate housing
Census data
1. Living in a camping ground, motor camp, boarding house, hotel, motel, guest accommodation, commercial vessel, or marae; and
2. Dwelling is not misclassified student accommodation (<75% of census night residents in dwelling studying full-time); and
3. Usual address ‘same as census night’ or ‘no fixed abode’; and
4. Low income (household-level (people in ‘private’ dwellings in camping grounds) or individual-level (people in all other dwellings)); or
5. Income unknown and receiving a means-tested benefit (household-level (people in ‘private’ dwellings in camping grounds) or individual-level (people in all other dwellings)).
PLUS
6. Children identified at pro rata step.
By non-private dwelling (those specified in step 1):
No. children who satisfied steps 1–3 multiplied by
(No. adults who satisfied steps 1–5 divided by no. adults who
satisfied steps 1–3)
[Totalled across all non-private dwellings specified in step 1]
3
Living as a temporary resident in a private dwelling due to a lack of access to minimally adequate housing
Census data
1. Living in a permanent private dwelling; and
2. Not an owner or in an owner’s nuclear family; and
3. Not the reference person or in the reference person’s nuclear family; and
4. Usual address is ‘same as census night’ or ‘no fixed abode’; and
5. Low income (family-level if accompanied by family, individual-level if not); and
6. Dwelling is severely crowded (CNOS 2+ bedroom deficit).
Note: (1) The Jensen equivalised household ‘low income’ thresholds were $30,001in 2013, $25,001 in 2006,
and $20,001 in 2001, as per the corresponding NZDep low income threshold.

7
Figure 1 Algorithm for dividing the subject population into severely housing deprived, not severely housing deprived, and housing deprivation status cannot be determined categories
Notes:
(1) The ‘living in severely inadequate housing?’ filter appears twice in the algorithm: at the beginning, to separate people not living in severely inadequate housing from everyone else; and at the end, to separate people who are living in severely inadequate housing from those whose housing deprivation status is unknown.
(2) The ‘living in a severely crowded dwelling?’ filter applies only to temporary residents of permanent private dwellings. Temporary resident is operationally defined as a person who is neither an owner nor the reference person of a dwelling, nor are they in the nuclear family of an owner or the reference person.
(3) The ‘pro rata allocation of children’ filter only applies to children (people younger than 15 years) in non-private dwellings.

8
Size and characteristics of the severely housing deprived population in New Zealand
Introduction
This chapter presents statistics about the severely housing deprived population in New Zealand for 2001, 2006, and 2013. As per the previous report, there are four important caveats about these statistics: 1. According to Statistics NZ confidentiality protocols, all numbers in the tables and figures
derived from the census have been random rounded to base three. Children in non-private dwellings identified at the pro rata filter were then added to the appropriate categories. These latter figures were not rounded because they do not represent counts of individuals, but proportions (see Table 2 for calculation). Unrounded administrative data were also added to the census figures, though not all variables were available in the administrative data. Due to rounding, percentages may not total 100 percent.
2. Counts of five or fewer people are suppressed as per Statistics NZ confidentiality protocols; this is denoted in tables as ‘s’.
3. As these statistics were largely derived from the national census, tests of significance
have not been applied.
4. The number of children identified as severely housing deprived in non-private dwellings
at the pro rata filter contributes to the size of the severely housing deprived population. However, as this number does not represent actual individuals, it does not contribute to any of the results regarding characteristics of the population. Across all three censuses, these children account for 1-2 percent of the severely housing deprived population.
The results are presented in the following sections: count and prevalence; key demographic statistics, ethnicity and identification as Māori; and geography.
9
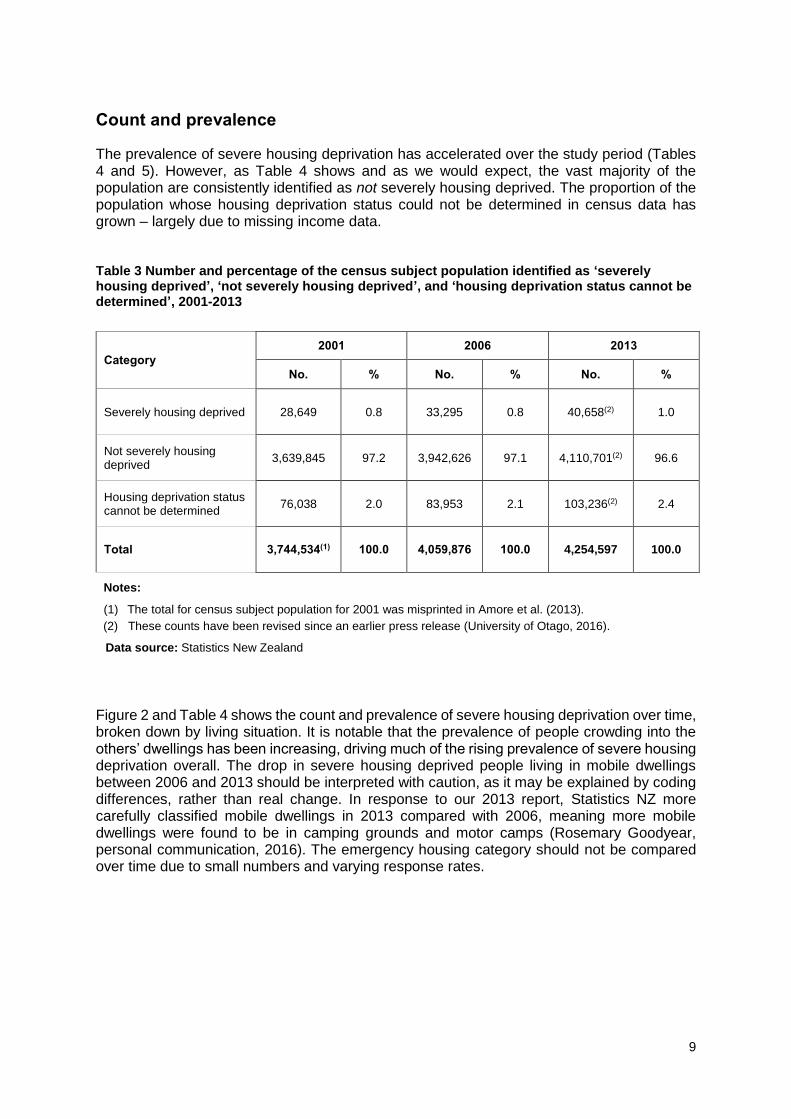
Count and prevalence
The prevalence of severe housing deprivation has accelerated over the study period (Tables 4 and 5). However, as Table 4 shows and as we would expect, the vast majority of the population are consistently identified as not severely housing deprived. The proportion of the population whose housing deprivation status could not be determined in census data has grown – largely due to missing income data. Table 3 Number and percentage of the census subject population identified as ‘severely housing deprived’, ‘not severely housing deprived’, and ‘housing deprivation status cannot be determined’, 2001-2013
Figure 2 and Table 4 shows the count and prevalence of severe housing deprivation over time, broken down by living situation. It is notable that the prevalence of people crowding into the others’ dwellings has been increasing, driving much of the rising prevalence of severe housing deprivation overall. The drop in severe housing deprived people living in mobile dwellings between 2006 and 2013 should be interpreted with caution, as it may be explained by coding differences, rather than real change. In response to our 2013 report, Statistics NZ more carefully classified mobile dwellings in 2013 compared with 2006, meaning more mobile dwellings were found to be in camping grounds and motor camps (Rosemary Goodyear, personal communication, 2016). The emergency housing category should not be compared over time due to small numbers and varying response rates.
Category
2001 2006 2013
No. % No. % No. %
Severely housing deprived 28,649 0.8 33,295 0.8 40,658(2) 1.0
Not severely housing deprived
3,639,845 97.2 3,942,626 97.1 4,110,701(2) 96.6
Housing deprivation status cannot be determined
76,038 2.0 83,953 2.1 103,236(2) 2.4
Total 3,744,534(1) 100.0 4,059,876 100.0 4,254,597 100.0
Notes:
(1) The total for census subject population for 2001 was misprinted in Amore et al. (2013).
(2) These counts have been revised since an earlier press release (University of Otago, 2016).
Data source: Statistics New Zealand

10
Figure 2 Prevalence of severe housing deprivation per 10,000 population by living situation, 2001-2013
0
10
20
30
40
50
60
70
80
90
100
2001 2006 2013
Living rough / improviseddwellings
Mobile dwellings
Emergencyaccommodation
Camping ground / motorcamp
Boarding houses, hotels,motels, etc.
Marae
Temporary resident in aseverely crowded,permanent privatedwelling
Data sources: Statistics New Zealand and emergency housing providers

11
Table 4 Severely housing deprived population by broad and specific living situation – count and prevalence, 2001-2013
Broad living situation
Specific living situation
2001 2006 2013
Count
Prev. per
10,000 pop’n
Count
Prev. per
10,000 pop’n
Count
Prev. per
10,000 pop’n
1
Living without habitable accommodation due to a
lack of access to minimally adequate housing
Living rough / improvised dwelling
660 1.8 1,464 3.6 1,413 3.3
Mobile dwelling 633 1.7 3,567 8.9(1) 2,784 6.5(1)
Subtotal 1,296 3.5 5,031 12.5 4,197 9.9
2
Living in a non-private dwelling due to a lack of access to minimally adequate housing
Emergency accomm. (NGO-run)(2)
Night shelter 47 0.1 49 0.1 26 0.1
Women’s refuge 43 0.1 260 0.6 30 0.1
Other accomm. targeted at people who LAMAH
177 0.5 342 0.8 493 1.2
Subtotal 267 0.7 651 1.7 549 1.3
Commercial accomm.
Camping ground / motor camp
2,494 6.7 1,144 2.8 1,724 4.1
Boarding houses, hotels, motels
5,486 14.7 5,089 12.6 6,127 14.4
Subtotal 7,980 21.4 6,233 15.5 7,851 18.5
Marae 92 0.2 26 0.1 43 0.1
3
Living as a temporary resident in a severely crowded, permanent private dwelling due to a lack of access to minimally adequate housing
19,284 51.6 22,005 54.6 28,563 67.1
Total 28,917 77.4 33,946 84.3 41,207(3) 97.1(3)
Notes:
(1) The drop in the mobile dwelling category may be largely attributable to a coding change – see main text.
(2) Emergency accommodation count and prevalence figures should not be compared over time because of small numbers and varying response rates.
(3) These counts have been revised since an earlier press release (University of Otago, 2016).
Data sources: Statistics New Zealand and emergency housing providers
The number of dwellings required to house the severely housing deprived population in 2013 is estimated at 15,000 to 25,900 dwellings, depending on whether every homeless person in a dwelling could be housed together (lower limit), or if every family unit would require a separate dwelling (upper limit). In 2006, this estimate was 12,900 – 21,200 dwellings, and in 2001, 11,200 – 18,900 dwellings.

Severely housing deprived population 2013: Key demographic statistics
12
Figure 3 Sex
Figure 4 Work and study Among adults
Figure 5 Migrant status Prevalence of severe housing deprivation per 100 people
Figure 6 Age
Figure 7 Ethnicity Prevalence of severe housing deprivation per 100 people
Figure 8 Years in NZ Prevalence of severe housing deprivation per 100 migrants
Female48%
Male52%
Working, studying, or both52%
Not working or studying
48%
1.4%
0.9%
Born overseas Born in New Zealand
24%
27%
17%
10%9% 8%
7%
<15 15-24 25-34 35-44 45-54 55-64 65+
0.4%
2%
4%
2%
1%
European /Other
Māori Pacific Asian MiddleEastern,
LatinAmerican,
African
6%
2%
0.8%
<1 1-4 5+

13
Table 5 Demographic characteristics of the severely housing deprived population – count, percentage, and prevalence per 1000 NZ population, 2001-2013
Characteristic
Category
2001 2006 2013
Count %
Prev. per
1000 pop’n
Count %
Prev. per
1000 pop’n
Count %
Prev. per
1000 pop’n
Sex Female 13,992 49 7 16,974 51 8 19,679 48 9
Male 14,391 51 8 16,578 49 8 21,149 52 10
Age group (years)
<15 6,966 25 8 8,437 25 10 9,596 24 11
15-24 7,548 27 15 9,008 27 16 11,076 27 19
25-34 4,465 16 8 4,881 15 9 6,737 17 13
35-44 3,004 11 5 3,370 10 5 3,887 10 7
45-54 2,208 8 5 2,633 8 5 3,529 9 6
55-64 1,901 7 6 2,546 8 6 3,276 8 7
65+ 2,236 8 5 2,578 8 5 2,695 7 4
Ethnicity(1)
European / Other(2) 11,067 40 4 11,864 36 4 13,498 34 4
Māori 10,083 36 19 11,358 35 20 12,754 32 21
Pacific 7,091 25 31 8,223 25 31 11,396 29 39
Asian 3,330 12 14 5,449 17 15 7,956 20 17
Middle Eastern, Latin American, African
n/a n/a n/a 462 1 13 597 1 13
Family status(3,4)
Sole parent with dependent child/ren
8,537 37 22 10,792 38 27 14,727 43 33
Adult alone(5) 8,970 39 11 9,759 34 12 7,763 23 11
Couple with dependent child/ren
3,528 15 3 4,293 15 3 7,070 21 5
Couple without children
1,140 5 2 2,339 8 3 2,894 8 3
Sole parent with adult child/ren(6)
357 2 4 674 2 7 1,404 4 11
Couple with adult child/ren(6)
234 1 1 411 1 2 600 2 2
Family with children of unknown dependency status
64 0.3 n/a 109 0.4 n/a 54 0.2 n/a
Relationship status(7,8)
Not partnered 13,710 73 13 15,450 70 14 20,913 73 17
Partnered 5,148 27 3 6,636 30 4 7,689 27 4
Notes:
(1) Total response ethnicity data. (2) Includes New Zealander.
(3) Individual-level variable - relates to prevalence of people in each family type.
(4) Excludes people living in non-private dwellings. (5) Not accompanied by family. (6) No dependents.
(7) Relates to adults only (people aged 15 or older). (8) Excludes people living in emergency accommodation.
Data sources: Statistics NZ and emergency accommodation providers
14
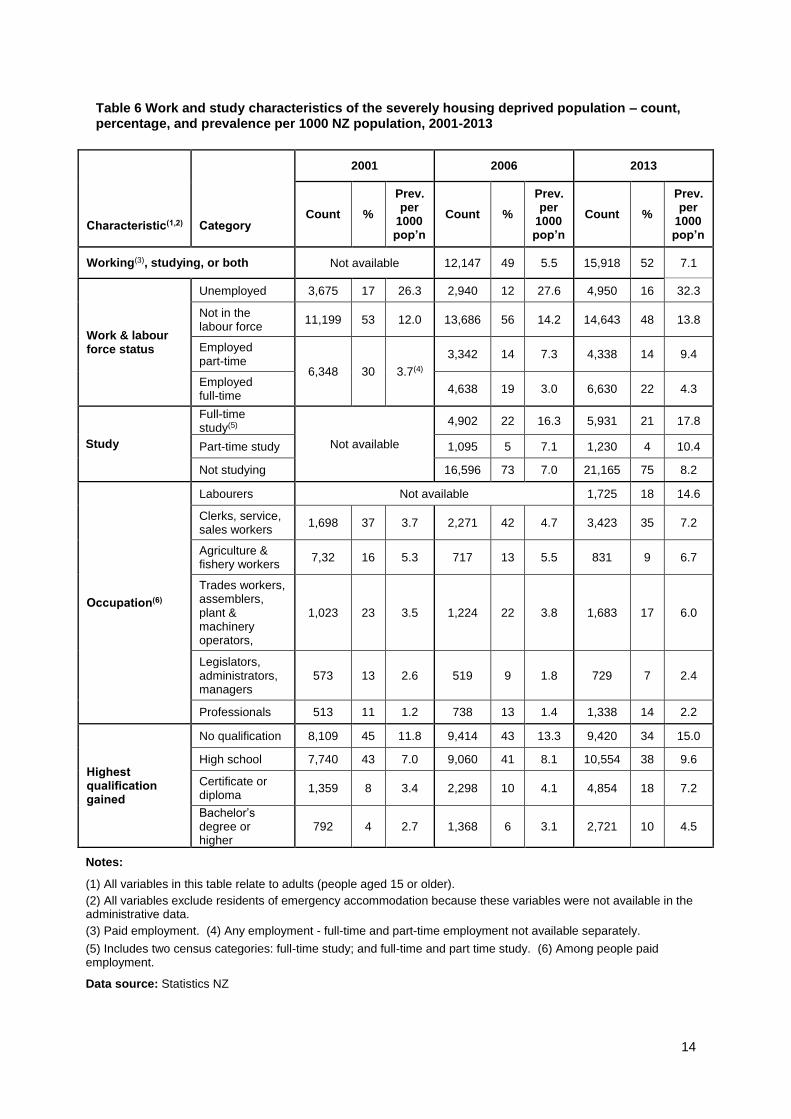
Table 6 Work and study characteristics of the severely housing deprived population – count, percentage, and prevalence per 1000 NZ population, 2001-2013
Characteristic(1,2)
Category
2001 2006 2013
Count %
Prev. per
1000 pop’n
Count %
Prev. per
1000 pop’n
Count %
Prev. per
1000 pop’n
Working(3), studying, or both Not available 12,147 49 5.5 15,918 52 7.1
Work & labour force status
Unemployed 3,675 17 26.3 2,940 12 27.6 4,950 16 32.3
Not in the labour force
11,199 53 12.0 13,686 56 14.2 14,643 48 13.8
Employed part-time
6,348 30 3.7(4)
3,342 14 7.3 4,338 14 9.4
Employed full-time
4,638 19 3.0 6,630 22 4.3
Study
Full-time study(5)
Not available
4,902 22 16.3 5,931 21 17.8
Part-time study 1,095 5 7.1 1,230 4 10.4
Not studying 16,596 73 7.0 21,165 75 8.2
Occupation(6)
Labourers Not available 1,725 18 14.6
Clerks, service, sales workers
1,698 37 3.7 2,271 42 4.7 3,423 35 7.2
Agriculture & fishery workers
7,32 16 5.3 717 13 5.5 831 9 6.7
Trades workers, assemblers, plant & machinery operators,
1,023 23 3.5 1,224 22 3.8 1,683 17 6.0
Legislators, administrators, managers
573 13 2.6 519 9 1.8 729 7 2.4
Professionals 513 11 1.2 738 13 1.4 1,338 14 2.2
Highest qualification gained
No qualification 8,109 45 11.8 9,414 43 13.3 9,420 34 15.0
High school 7,740 43 7.0 9,060 41 8.1 10,554 38 9.6
Certificate or diploma
1,359 8 3.4 2,298 10 4.1 4,854 18 7.2
Bachelor’s degree or higher
792 4 2.7 1,368 6 3.1 2,721 10 4.5
Notes:
(1) All variables in this table relate to adults (people aged 15 or older).
(2) All variables exclude residents of emergency accommodation because these variables were not available in the administrative data.
(3) Paid employment. (4) Any employment - full-time and part-time employment not available separately.
(5) Includes two census categories: full-time study; and full-time and part time study. (6) Among people paid employment.
Data source: Statistics NZ

15
Table 7 Prevalence of severe housing deprivation per 1000 people by migration and mobility, 2001-2013
Characteristic(1)
Category
2001 2006 2013
Count %
Prev. per
1000 pop’n
Count %
Prev. per
1000 pop’n
Count %
Prev. per
1000 pop’n
Place of birth Overseas 8,427 30 12 10,704 33 12 13,773 35 14
New Zealand 19,242 70 7 21,420 67 7 25,443 65 9
Place of birth among people born overseas
Pacific 3,813 45 32 3,930 37 29 4,680 34 31
Northeast Asia 1,422 17 16 3,084 29 23 2,262 16 16
Southeast Asia 831 10 18 921 9 16 1,542 11 18
South-central Asia 507 6 16 642 6 11 2,763 20 32
North Africa / Middle East
171 2 14 141 1 9 174 1 10
Americas 129 2 5 243 2 7 387 3 9
Australia 393 5 7 384 4 6 462 3 7
Sub-Saharan Africa 243 3 7 324 3 5 312 2 4
Europe 918 11 3 1,035 10 3 1,200 9 4
Years in NZ among people born overseas
<1 1,752 23 36 1,737 18 29 2,955 23 59
1–4 2,376 31 18 3,639 37 17 3,993 31 23
5+ 3,507 46 7 4,539 46 8 6,036 46 8
Years at address
<1 13,401 50 16 14,661 48 16 18,069 47 21
1–4 7,560 28 7 8,829 29 7 10,740 28 9
5+ 6,027 22 4 7,251 24 4 9,612 25 5
Note: (1) All variables exclude residents of emergency accommodation because these variables were not available in the administrative data.
Data source: Statistics New Zealand

16
Ethnicity and identification as Māori
Figure 9 Ethnic composition of the severely housing deprived population, 2001-2013
Figure 10 Iwi affiliation among Māori, severely housing deprived and total New Zealand populations, 2001-2013
40%
36%
34%
36%35%
32%
25% 25%
29%
12%
17%
20%
n/a1% 1%
2001 2006 2013
European /Other Māori Pacific Asian Middle Eastern, Latin American, African
77%
80%
84%
71%
76%
80%
2001 2006 2013
Severely housing deprived New Zealand
17
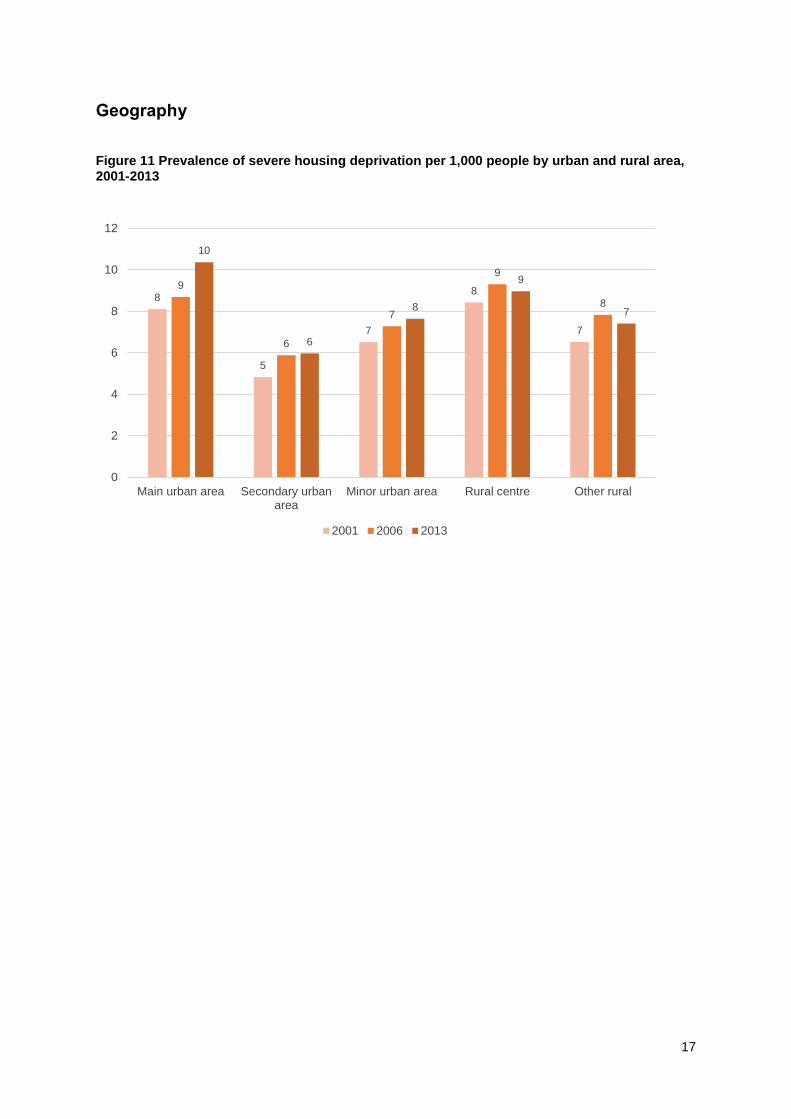
Geography
Figure 11 Prevalence of severe housing deprivation per 1,000 people by urban and rural area, 2001-2013
8
5
7
8
7
9
6
7
9
8
10
6
8
9
7
0
2
4
6
8
10
12
Main urban area Secondary urbanarea
Minor urban area Rural centre Other rural
2001 2006 2013
18
Figure 12 Prevalence of severe housing deprivation per 1,000 people by regional council area, 2001-2013
0 2 4 6 8 10 12 14 16
Marlborough
Nelson
Tasman
Southland
Otago
Canterbury
West Coast
Wellington
Manawatu-Whanganui
Taranaki
Hawke's Bay
Gisborne
Bay of Plenty
Waikato
Auckland
Northland
2013
2006
2001
19
Table 8 Severe housing deprivation by regional council area – count, prevalence, and percentage change, 2001-2013
Regional council area
2001 2006
% change in prev. 01-06
2013
% change in prev. 06-13 Count
Prev. per
1000 pop’n
Count
Prev. per
1000 pop’n
Count
Prev. per
1000 pop’n
Northland 1566 11 1868 13 13 1896 13 0
Auckland 13009 11 14848 11 2 20296 14 26
Waikato 2391 7 3052 8 19 3035 8 -6
Bay of Plenty 2286 10 2682 10 9 2839 11 2
Gisborne 486 11 558 13 13 609 14 12
Hawke's Bay 1314 9 1394 9 3 1449 10 2
Taranaki 310 3 428 4 36 423 4 -5
Manawatu-Whanganui 986 4 1291 6 30 1336 6 3
Wellington 2338 6 2620 6 6 3394 7 24
West Coast 219 7 257 8 14 288 9 6
Canterbury 1775 4 2557 5 33 2893 5 10
Otago 651 4 873 5 26 1086 5 17
Southland 198 2 330 4 67 311 3 -9
Tasman 393 10 348 8 -18 435 9 17
Nelson 242 6 212 5 -15 417 9 81
Marlborough 246 6 273 6 3 327 7 16
Data sources: Statistics NZ and emergency housing providers

20
Table 9 Severely housing deprived population by regional council area 2013 – sex, age, and ethnicity
Regional council area
Sex (%) Age (years) (%) Ethnicity (prevalence per
1,000 population)
Female Male <15 15-24
25-44
45-64
65+
Eu
rop
ea
n/
Oth
er
Ma
ori
Pa
cif
ic
As
ian
ME
LA
A
Northland 47 53 26 18 22 25 9 8 25 27 14 22
Auckland 49 51 25 29 27 13 5 5 30 45 18 12
Waikato 51 49 27 25 22 18 7 4 19 21 11 11
Bay of Plenty 48 52 27 26 23 18 7 5 24 27 30 14
Gisborne 50 50 30 27 24 17 3 6 24 20 0 170
Hawke's Bay 48 53 26 26 26 17 5 5 23 29 26 14
Taranaki 45 55 18 23 24 28 7 2 11 18 12 0
Manawatu-Whanganui 49 51 26 25 25 17 7 3 14 21 11 0
Wellington 48 52 22 31 26 15 6 4 15 29 12 12
West Coast 38 63 7 8 22 33 29 8 13 0 30 0
Canterbury 45 55 17 25 27 22 9 4 13 20 13 14
Otago 45 55 5 37 26 23 9 4 7 12 24 14
Southland 50 51 17 30 22 18 13 3 8 19 4 0
Tasman 43 58 12 14 21 37 16 8 11 38 43 0
Nelson 44 57 11 24 29 27 9 7 19 30 26 0
Marlborough 41 60 13 19 27 28 13 5 14 57 20 0
Data sources: Statistics NZ and emergency housing providers

21
Severe housing deprivation by territorial authority area
Table 10 Severe housing deprivation by territorial authority area (Far North to Palmerston North), 2001-2013
Territorial authority area
2001 2006 2013
Total severely housing deprived
Prev. per
1,000 pop’n
Total severely housing deprived
Prev. per
1,000 pop’n
Total severely housing deprived
Prev. per
1,000 pop’n
1 Far North district 882 16 951 17 1020 18
2 Whangarei district 567 8 749 10 687 9
3 Kaipara district 117 7 162 9 183 10
11 Thames-Coromandel district 225 9 279 11 264 10
12 Hauraki district 87 5 132 8 135 8
13 Waikato district 324 8 363 8 459 7
15 Matamata-Piako district 126 4 150 5 138 4
16 Hamilton city 939 8 1132 9 1313 9
17 Waipa district 111 3 171 4 153 3
18 Otorohanga district 42 5 84 9 63 7
19 South Waikato district 192 8 204 9 180 8
20 Waitomo district 81 9 126 13 108 12
21 Taupo district 195 6 301 9 207 6
22 Western Bay of Plenty district 360 9 525 12 576 13
23 Tauranga city 572 6 672 6 846 7
24 Rotorua district 603 9 609 9 714 11
25 Whakatane district 433 13 617 19 402 12
26 Kawerau district 90 13 69 10 108 17
27 Opotiki district 231 25 192 21 205 24
28 Gisborne district 486 11 558 13 609 14
29 Wairoa district 132 15 84 10 117 15
30 Hastings district 693 10 817 12 846 12
31 Napier city 414 8 406 7 435 8
32 Central Hawke's Bay district 66 5 87 7 54 4
33 New Plymouth district 208 3 293 4 282 4
34 Stratford district 24 3 54 6 39 4
35 South Taranaki district 84 3 81 3 108 4
36 Ruapehu district 114 8 143 11 123 10
37 Whanganui district 198 5 234 5 231 6
38 Rangitikei district 72 5 102 7 75 5
39 Manawatu district 96 3 186 7 111 4
40 Palmerston North city 287 4 380 5 508 6
Data sources: Statistics NZ and emergency housing providers
22
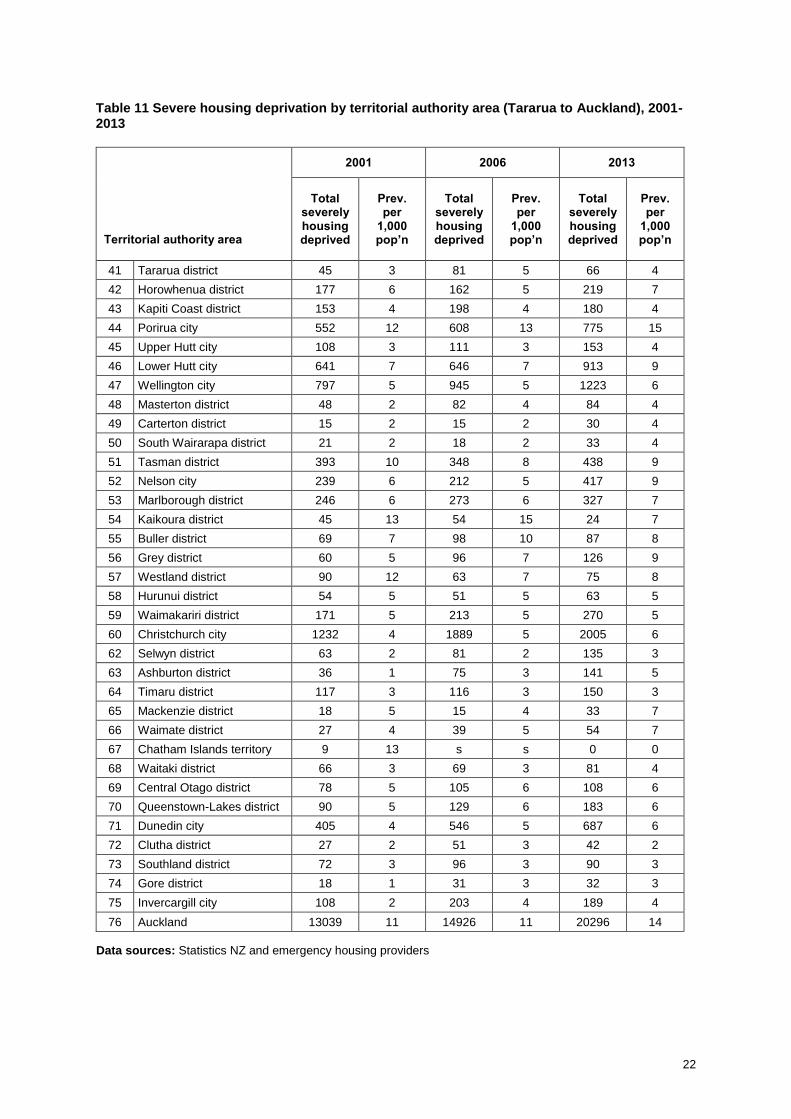
Table 11 Severe housing deprivation by territorial authority area (Tararua to Auckland), 2001-2013
Territorial authority area
2001 2006 2013
Total severely housing deprived
Prev. per
1,000 pop’n
Total severely housing deprived
Prev. per
1,000 pop’n
Total severely housing deprived
Prev. per
1,000 pop’n
41 Tararua district 45 3 81 5 66 4
42 Horowhenua district 177 6 162 5 219 7
43 Kapiti Coast district 153 4 198 4 180 4
44 Porirua city 552 12 608 13 775 15
45 Upper Hutt city 108 3 111 3 153 4
46 Lower Hutt city 641 7 646 7 913 9
47 Wellington city 797 5 945 5 1223 6
48 Masterton district 48 2 82 4 84 4
49 Carterton district 15 2 15 2 30 4
50 South Wairarapa district 21 2 18 2 33 4
51 Tasman district 393 10 348 8 438 9
52 Nelson city 239 6 212 5 417 9
53 Marlborough district 246 6 273 6 327 7
54 Kaikoura district 45 13 54 15 24 7
55 Buller district 69 7 98 10 87 8
56 Grey district 60 5 96 7 126 9
57 Westland district 90 12 63 7 75 8
58 Hurunui district 54 5 51 5 63 5
59 Waimakariri district 171 5 213 5 270 5
60 Christchurch city 1232 4 1889 5 2005 6
62 Selwyn district 63 2 81 2 135 3
63 Ashburton district 36 1 75 3 141 5
64 Timaru district 117 3 116 3 150 3
65 Mackenzie district 18 5 15 4 33 7
66 Waimate district 27 4 39 5 54 7
67 Chatham Islands territory 9 13 s s 0 0
68 Waitaki district 66 3 69 3 81 4
69 Central Otago district 78 5 105 6 108 6
70 Queenstown-Lakes district 90 5 129 6 183 6
71 Dunedin city 405 4 546 5 687 6
72 Clutha district 27 2 51 3 42 2
73 Southland district 72 3 96 3 90 3
74 Gore district 18 1 31 3 32 3
75 Invercargill city 108 2 203 4 189 4
76 Auckland 13039 11 14926 11 20296 14
Data sources: Statistics NZ and emergency housing providers

23
Table 12 Count of severe housing deprivation by living situation and territorial authority (Far North to Palmerston North), 2013
Territorial authority area
Without habitable accomm.
Non- private
accomm.
Temporary resident in a severely crowded
permanent private
dwelling
Total severely housing deprived
1 Far North district 339 126 558 1020
2 Whangarei district 183 144 360 687
3 Kaipara district 78 24 81 183
11 Thames-Coromandel district 129 60 78 264
12 Hauraki district 57 27 48 135
13 Waikato district 114 27 321 459
15 Matamata-Piako district 30 15 96 138
16 Hamilton city 60 173 1083 1313
17 Waipa district 30 45 81 153
18 Otorohanga district 24 0 30 63
19 South Waikato district 18 18 144 180
20 Waitomo district 15 9 87 108
21 Taupo district 48 30 123 207
22 Western Bay of Plenty district 216 75 285 576
23 Tauranga city 90 180 576 846
24 Rotorua district 57 102 555 714
25 Whakatane district 66 33 303 402
26 Kawerau district s 0 105 108
27 Opotiki district 72 16 108 205
28 Gisborne district 69 90 450 609
29 Wairoa district 18 15 81 117
30 Hastings district 66 135 648 846
31 Napier city 51 87 297 435
32 Central Hawke's Bay district 15 12 24 54
33 New Plymouth district 45 81 153 282
34 Stratford district s 21 15 39
35 South Taranaki district 21 12 75 108
36 Ruapehu district 27 15 78 123
37 Wanganui district 30 36 165 231
38 Rangitikei district 12 9 57 75
39 Manawatu district 24 18 69 111
40 Palmerston North city 36 208 261 508
Data sources: Statistics NZ and emergency housing providers

24
Table 13 Count of severe housing deprivation by living situation and territorial authority (Tararua to Auckland), 2013
Territorial authority area
Without habitable accomm.
Non- private
accomm.
Temporary resident in a severely crowded
permanent private
dwelling
Total severely housing deprived
41 Tararua district 24 s 33 66
42 Horowhenua district 42 18 159 219
43 Kapiti Coast district 21 60 102 180
44 Porirua city 18 109 651 775
45 Upper Hutt city 12 39 105 153
46 Lower Hutt city 42 196 672 913
47 Wellington city 33 572 618 1223
48 Masterton district 15 S 60 84
49 Carterton district 9 s 18 30
50 South Wairarapa district 12 12 12 33
51 Tasman district 237 129 69 438
52 Nelson city 45 276 99 417
53 Marlborough district 84 90 153 327
54 Kaikoura district 12 15 s 24
55 Buller district 45 33 12 87
56 Grey district 42 69 12 126
57 Westland district 24 42 9 75
58 Hurunui district 42 21 s 63
59 Waimakariri district 72 132 63 270
60 Christchurch city 168 520 1317 2005
62 Selwyn district 90 24 21 135
63 Ashburton district 24 36 81 141
64 Timaru district 24 72 57 150
65 Mackenzie district 9 21 s 33
66 Waimate district 18 30 s 54
67 Chatham Islands territory s s s s
68 Waitaki district 39 30 12 81
69 Central Otago district 33 66 9 108
70 Queenstown-Lakes district 30 96 60 183
71 Dunedin city 54 357 276 687
72 Clutha district 12 21 s 42
73 Southland district 24 39 24 90
74 Gore district s 17 15 32
75 Invercargill city 12 81 93 189
76 Auckland 771 3175 16350 20296
Data sources: Statistics NZ and emergency housing providers

25
References Amore K, Viggers H, Baker, MG, & Howden-Chapman, P (2013). Severe housing deprivation: The problem and its measurement, Official Statistics Research Series, 6. Available from www.statisphere.govt.nz. Busch-Geertsema, V, et al. (2016). "Developing a global framework for conceptualising and measuring homelessness." Habitat International 55: 124-132. Statistics New Zealand (2009). New Zealand Definition of Homelessness. Wellington: Author. Available at http://www.stats.govt.nz/browse_for_stats/people_and_communities/housing/homelessness-definition.aspx University of Otago. (2016). Homelessness accelerates between censuses [Press release]. Wellington: Author. Available from http://www.otago.ac.nz/news/news/otago613529.html