severe weather how to read a weather map unit 11 – day 2
TRANSCRIPT

Severe Weather
How to Read a Weather MapUnit 11 – Day 2

Warm and Cold Fronts
• Blue lines are cold fronts and red lines are warm fronts.
• High and Low Pressure Systems–A _________ means a center of high
pressure (usually calm, sunny weather). –A red "L" means low pressure (which can
mean storminess). Most fronts extend from low-pressure centers.
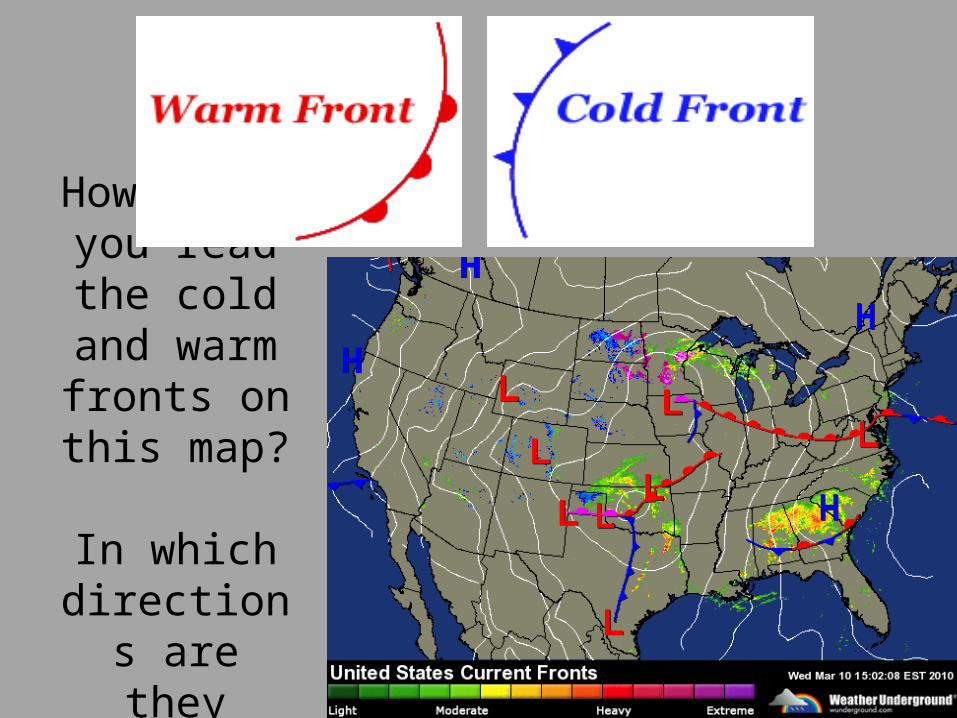
How would you read the cold
and warm fronts on this map?
In which directions are they going?

Weather Station SymbolsCloud CoverEach circle represents a weather
station. The circle at each station
isempty if skies are clear. The circle
iswhite if it’s cloudy. A line within
thecircle or a half-filled circle means"partly cloudy."
Wind and Wind Direction The little arrows attached to
each weather station point in the direction the wind is blowing
from. The more barbs at the end of
each arrow, and the longer they
are, the harder the wind is blowing.
Each long barb is 10 knots. Each
short barb is half that amount.

Weather Station Symbols Air Temperature The number to the upper left of each station is the air temperature in degrees F (for U.S. maps) or degrees C (for other countries).
Dew Point
The number to the lower left of each station is the dew point temperature in degrees F (for U.S. maps) or degrees C (for other countries). The dew point is a measure of moisture; it shows how much you'd have to cool the air to get a relative humidity of 100 percent. The higher the dew point, the
more water vapor there is for
producing rain or snow.
Weather Station Symbols
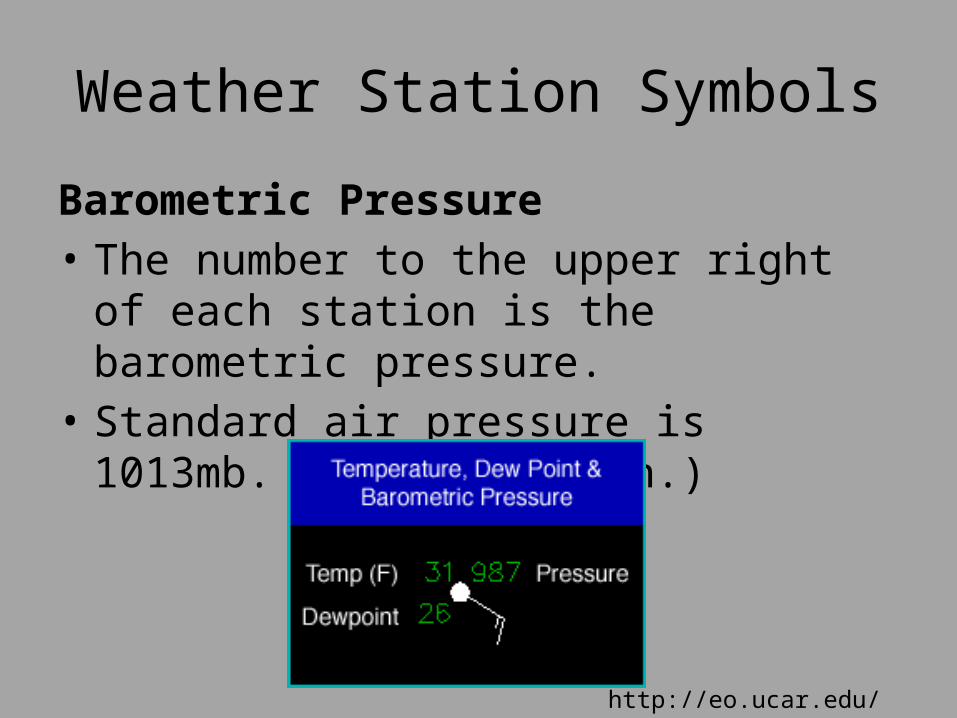
Barometric Pressure• The number to the upper right of
each station is the barometric pressure.
• Standard air pressure is 1013mb. (14.7lb/sq. in.)
http://eo.ucar.edu/webweather/