severity of expert-identified behavioural responses of...
TRANSCRIPT

Aquatic Mammals 2015, 41(4), 469-502, DOI 10.1578/AM.41.4.2015.469
Severity of Expert-Identified Behavioural Responses of Humpback Whale, Minke Whale, and
Northern Bottlenose Whale to Naval SonarLise D. Sivle,1 Petter H. Kvadsheim,2 Charlotte Curé,7 Saana Isojunno,3 Paul J. Wensveen,3 Frans-Peter A. Lam,4 Fleur Visser,5, 6 Lars Kleivane,2
Peter L. Tyack,3 Catriona M. Harris,8 and Patrick J. O. Miller3
1Institute of Marine Research (IMR), PO Box 1870, Nordnes, NO-5817, Bergen, NorwayE-mail: [email protected]
2Norwegian Defence Research Establishment (FFI), NO-3191, Horten, Norway3Sea Mammal Research Unit, Scottish Oceans Institute, University of St Andrews, St Andrews, Fife KY16 8LB, UK
4Netherlands Organisation for Applied Scientific Research (TNO), PO Box 96864, The Hague, 2509 JG, The Netherlands5Kelp Marine Research (KMR), 1624 CJ, Hoorn, The Netherlands
6Behavioural Biology Group, Leiden University, PO Box 9505, 2300 RA, Leiden, The Netherlands7Cerema, Dter Est, Acoustics Group, F-67035, Strasbourg Cedex 2, France
8Centre for Research into Ecological and Environmental Modeling, Buchanan Gardens, University of St Andrews, St Andrews, Fife, KY16 9LZ, UK
Abstract
Controlled exposure experiments using 1 to 2 kHz sonar signals were conducted with 11 humpback whales (Megaptera novaeangliae), one minke whale (Balaenoptera acutorostrata), and one northern bottlenose whale (Hyperoodon ampullatus) during three field trials from 2011 to 2013. Ship approaches without sonar transmis-sions, playbacks of killer whale vocalizations, and broadband noise were conducted as controls. Behavioural parameters such as horizontal move-ment, diving, social interactions, and vocalizations were recorded by animal-attached tags and by visual and acoustic tracking. Based on these data, two expert panels independently scored the sever-ity of behavioural changes that were judged likely to be responses to the experimental stimuli, using a severity scale ranging from no effect (0) to high potential to affect vital rates (9) if exposed repeat-edly. After scoring, consensus was reached with a third-party moderator. In humpback whales, killer whale playbacks induced more severe responses than sonar exposure, and both sonar expo-sures and killer whale playbacks induced more responses and responses of higher severity than the no-sonar ship approaches and broadband noise playbacks. The most common response during sonar exposures in all three species was avoidance of the sound source. The most severe responses to sonar (severity 8) were progressive high-speed avoidance by the minke whale and long-term area avoidance by the bottlenose whale. Other severe
responses included prolonged avoidance and ces-sation of feeding (severity 7). The minke whale and bottlenose whale started avoiding the source at a received sound pressure level (SPL) of 146 and 130 dB re 1 μPa, respectively. Humpback whales generally had less severe responses that were triggered at higher received levels. The probability of severity scores with the potential to affect vital rates increased with increasing sound exposure level (SEL ). The single experiments with minke and bottlenose whales suggest they
cum
have greater susceptibility to sonar disturbance than humpback whales, but additional studies are needed to confirm this result.
Key Words: behavioural response, naval sonar, severity scoring, controlled exposure experiment, arctic biology, humpback whale, Megaptera novaeangliae, minke whale, Balaenoptera acuto-rostrata, northern bottlenose whale, Hyperoodon ampullatus
Introduction
All marine mammals use sound to gather infor-mation about their surroundings, either through active echolocation (Au, 1993) or passive listening (Gannon et al., 2005). Sound has a fundamental role in prey and predator detection, animal commu-nication, and navigation (Richardson et al., 1995; Tyack, 2000; Simpson et al., 2005). During the last century, there has been a significant overall increase of underwater anthropogenic noise, leading to

470 Sivle et al.
increased background noise levels and more fre-quent exposure to high intensity sounds (McDonald et al., 2008). Exposure to noise might lead to direct physical injuries (Southall et al., 2007) or behav-ioural changes (e.g., Morton & Symonds, 2002; Tyack et al., 2011; DeRuiter et al., 2013; Kuningas et al., 2013; Miller et al., 2015). Among the con-tributors to increased noise levels are navies with modern active long-range sonars, typically operat-ing in the frequency range of 0.2 to 10 kHz, which is within the range of hearing sensitivity for most marine mammals (Popper & Ketten, 2008).
Potential negative effects of such sonars on marine mammals have received particular atten-tion after several atypical cetacean mass strand-ings in connection with naval sonar activity, mostly (but not exclusively) involving beaked whales (Frantzis, 1998; Balcomb & Claridge, 2001; D’Amico et al., 2009). These stranding events might be directly or indirectly caused by behavioural responses (Cox et al., 2006). Besides stranding, other negative effects on vital rates might also be induced by behavioural responses. Behavioural effects of sonar can range from subtle effects such as short changes in vocal behaviour (Miller et al., 2000; Croll et al., 2001; Fristrup et al., 2003; Alves et al., 2014) and dive patterns (Sivle et al., 2012) to more severe responses such as habitat avoidance (Tyack et al., 2011; DeRuiter et al., 2013; Miller et al., 2015), typically also associated with cessation of feeding (Miller et al., 2012; Goldbogen et al., 2013; Isojunno & Miller, 2015) and even separation from dependent off-spring (Miller et al., 2012). The specific context of the exposure event appears to alter the likelihood of responses (Goldbogen et al., 2013) and may also explain high variability in response thresh-olds (Antunes et al., 2014; Miller et al., 2015). Eventually, the behavioural context of exposed animals will probably also determine the bio-logical significance of responses (Southall et al., 2007; Ellison et al., 2012; Miller et al., 2012).
Experimental exposure of free-ranging indi-vidual animals to high intensity sounds such as naval sonar or seismic signals is one approach for providing a better understanding of the sound-level thresholds at which responses occur, the context of the reactions, and their poten-tial biological relevance on populations in the wild (Tyack et al., 2004; Tyack, 2009). Such experiments are designed to control the species and location, timing of the exposure, and target received sound levels, as well as to allow for the collection of appropriate data on natural baseline behaviour. Baseline behaviour of an individual is compared to its behaviour during sound exposure and, thus, is used to evaluate the likelihood of a behavioural response at different received levels.
This experimental approach also allows testing of various control stimuli. Indeed, comparison of responses to an approaching ship transmitting sonar vs a ship with no transmissions is used to separate the effects of sonar from the effect of the source ship itself (e.g., Miller et al., 2012). Furthermore, comparison of responses to sonar with natural anti-predator responses can help in understanding the biological significance of observed behavioural responses to anthropogenic disturbances (Frid & Dill, 2002).
Southall et al. (2007) provided a useful response severity scale for evaluating observed changes in animal behaviour in response to anthropogenic noise. Using that scale, Miller et al. (2012) scored behavioural responses collected from high-resolution tags and visual observations of long-finned pilot whales (Globicephala melas), killer whales (Orcinus orca), and sperm whales (Physeter macrocephalus) exposed to naval sonar and control signals. They identified some behav-ioural responses that were not considered in the original scale (Southall et al., 2007), and they made a slightly modified scale that still followed the original logic (Miller et al., 2012). Moreover, Miller et al. (2012) found marked differences in the severity of responses across species and signal frequency. In the present study, we have used this modified severity scale to determine the severity of expert-scored behavioural responses of one odontocete species, the northern bottlenose whale (Hyperoodon ampullatus), and two mysticete spe-cies, the humpback whale (Megaptera novaean-gliae) and the minke whale (Balaenoptera acu-torostrata), to controlled exposure of naval sonar signals, no-sonar ship approaches, and playbacks of killer whale sounds and broadband noise.
Methods
Animal Welfare ConsiderationsAll animal research activities were permitted by the Norwegian Animal Research Authority (Permit No. S-2011/38782) and were approved by the Animal Welfare Ethics Committee at the University of St Andrews and the Institutional Animal Care and Use Committee of the Woods Hole Oceanographic Institution. All of our experi-ments followed a safety plan designed to protect the welfare of the study animals as well as other animals in the area. Visual observers continuously scanned for whales throughout the exposures with a detailed plan in place to stop sonar transmissions if potentially hazardous responses occurred or if any animal came too close to the sonar source. Our experimental design further involved limited duration exposure periods, changing of subjects between experiments, and exposure of a limited

Behavioural Responses of Cetaceans to Naval Sonar 471
number of animals, reducing risk of harm to experimental subjects.
Experimental Design and ProtocolSonar exposure experiments were conducted
in the Arctic Atlantic Ocean near Bear Island and Svalbard and off Jan Mayen during 2011, 2012, and 2013 using the Norwegian Defence Research Establishment (FFI) research vessel HU Sverdrup II (“HUS”). Details of each annual cruise can be found in specific cruise reports (Kvadsheim et al., 2011, 2012, 2014). Details of the experimental procedures can be found in Kvadsheim et al. (2015) and are only summa-rized here. The protocol consisted of five phases: (1) searching, (2) tagging, (3) baseline pre-expo-sure, (4) experimental exposure, and (5) post-exposure (Kvadsheim et al., 2015). Sonar sig-nals were transmitted from HUS, whereas killer whale sounds and broadband noise playbacks were broadcasted from a small boat. The whale`s position and social and surface behaviour were recorded when the whale surfaced repeatedly at more than 2 min apart, using the procedure of Visser et al. (2014).
The position of each tagged whale was estimated in real-time by the observers and relayed to the sonar operator on the source vessel (HUS). Sonar transmissions were always initiated by a ramp-up procedure, which implied a gradual increase of source level from 152 to 214 dB re 1 μPa m. The primary goal of movements of the source vessel with respect to the subject whale was to achieve a gradual escalation of sonar received levels, but the ship’s movements during sonar transmissions were different between the three species:
• Humpback Whales – Three different experimen-tal conditions were used for humpback whales: (1) no-sonar-control approaches, (2) ramp- up sonar exposures, and (3) no-ramp-up sonar exposures, each with a 10-min duration. During the ramp-up exposures, sonar transmission was initiated at approximately 1.3-km dis-tance from the tagged animal, and the source ship approached with a speed of 4.1 m/s on a predetermined straight course to intercept the animal’s course (determined prior to the start of the exposure), while transmitting a 5-min ramp-up. Full power transmission then con-tinued for another 5 min. The no-sonar control approach and the no-ramp-up approach fol-lowed the exact same procedure, except that no sonar pulses were transmitted during no-sonar controls, and transmissions only started at full power 5 min into the session during no-ramp-up exposures. This protocol was specifically designed to partly test the efficacy of ramp up
as a mitigation procedure, as well as to assess behavioural responses to the sonar exposure.
• Minke Whale – HUS approached the whale from a distance of 8 km at 4.4 m/s, first doing a no-sonar run, followed by a sonar exposure run with a 10-min ramp-up. The animal was approached to intercept its course, which was determined prior to start of the exposure. The sonar exposure continued until 5 min after the closest point of approach (CPA), but sonar exposure never lasted longer than 60 min. This protocol was identical to that of Miller et al. (2012), which allows comparison of results.
• Northern Bottlenose Whale – This species can dive for more than 1 h (Hooker & Baird, 1999). Good tracking of these animals, there-fore, relies on acoustic tracking during deep dives in combination with visual tracking when they are at the surface. To achieve this goal, the source vessel sailed 2 km × 2 km boxes, towing an acoustic array at 100 to 200 m depth around the estimated position of the whale throughout the tracking period. During sonar exposure, the source ship started ~5 km from the posi-tion of the whale and sailed a predetermined track consisting of ¾ of a 2 km × 2 km box at 2.6 m/s while first transmitting a 20-min ramp-up, followed by 15 min of full power transmis-sions (Miller et al., 2015). During exposure, the focal whale was not inside the box but several km away from it, and, thus, the angle from the whale to the source vessel changed very little. This protocol was similar to those of Tyack et al. (2011) and DeRuiter et al. (2013) to ensure comparability with existing data on other beaked whales.
Playbacks of Killer Whale Sound and Broadband NoiseThese were only conducted with humpback whales (Curé et al., 2015). The killer whale sound playback was used as a positive control for assess-ing responses of animals to a natural threatening stimulus (i.e., predation risk), and the noise play-back was used as a negative control of the killer whale sound playback to test the animal’s reaction to any unspecific noise.
The killer whale playback stimulus was previ-ously recorded in the North Pacific using Dtags (Miller et al., 2010) and corresponded to natural sequences of vocalizations of a killer whale group attacking and feeding on prey. The stimulus thus represents “unfamiliar” mammal-eating killer whale sounds expected to be perceived as an immediate risk of predation (Deecke et al., 2002; Curé et al., 2013, 2015). The control stimulus was
472 Sivle et al.
a broadband noise playback (0.5 to 10 kHz). Both the killer whale sound and the broadband noise were of 15-min duration and had similar root mean square (rms) source levels (146 to 152 dB re 1 μPa m), corresponding to typical source levels of killer whale sounds (Miller, 2006; Curé et al., 2013) but much lower than the source level of the sonar (214 dB re 1 μPa m). Playbacks were conducted from a stationary small boat, and fur-ther details of the playback protocol are given in Curé et al. (2012, 2013, 2015).
Sonar and No-Sonar Control ExposuresThe sonar source (Socrates II, TNO, The Netherlands) deployed from the HUS during the experiments was a multipurpose towed acous-tic source developed for underwater acoustic research and previously tested as a prototype sonar system on operational Royal Netherlands Navy frigates. The transmitted signals were 1.0 to 2.0 kHz frequency-modulated hyperbolic upsweeps in the bottlenose whale experiment, and 1.3 to 2.0 kHz frequency-modulated hyper-bolic upsweeps in the humpback and minke whale experiments. The ramp-up procedure was used as part of the risk mitigation plan, and also as part of the experimental design that aimed to gradually escalate the acoustic dose. The sonar pulse repeti-tion interval for all experiments was 20 s, and the signal duration was 1 s, except during the ramp-up period of humpback whale experiments for which the signal duration was 0.5 s. Humpback whales and the minke whale were also subject to the same approach by the source vessel but without sonar transmissions (no-sonar control) to enable com-parison of potential responses to the sonar with responses to the approaching source vessel alone.
Data-Recording TagsWhales were tagged with movement-and-sound-recording Dtags (Johnson & Tyack, 2003) or Ctags (Kvadsheim et al., 2011). The Dtag was attached to the whale with suction cups using a 15-m can-tilevered carbon fibre pole or a pneumatic remote deployment system (ARTS; Kvadsheim et al., 2009) and stayed on for 16 to 18 h. The Dtags had one or two hydrophones and recorded sound with 16-bit resolution at a sampling rate of 96 kHz, and were also equipped with depth and a three-dimensional (3D) accelerometer, and magnetom-eter sensors sampled at 50 Hz. Additionally, the Dtag contained a VHF transmitter and a GPS data logger (SirTrack, F2G 134A, Fastloc 2), which recorded the horizontal location of the tagged whale.
The CTAG was used for the minke whale exper-iment because previous experiences with minke whales confirmed that suction cup attachment
was unreliable (Kvadsheim et al., 2011). The Ctag was deployed using the ARTS system and was attached to the whale by a 5-cm-long barb that penetrates the skin and anchors within the blubber. It contained a VHF-transmitter and a Star Odditime-depth recorder (Kvadsheim et al., 2011). The Ctag was released from the animal using a galvanic time release after 19 h.
Visual and Acoustic Observations and TrackingVisual searching and tracking was conducted from an elevated marine mammal observation platform on the HUS. Focal follows of the group containing the tagged whale were either made from the HUS (bottlenose whales) or from an independent small boat deployed from the HUS (humpback and minke whales). Both platforms had a digital VHF direction finder (DFHorten; LK-ARTS, Norway) used in combination with visual observers. Passive acoustic monitoring was used to locate bottlenose whales and track them during experi-ments (Kvadsheim et al., 2014), using a dedicated hydrophone array developed by TNO (von Benda-Beckmann et al., 2010). Surface behaviour of the focal group was recorded systematically from the first sighting to the end of the experiment follow-ing Visser et al. (2014).
Processing and Analysis of Movement DataFor humpback and minke whales, horizontal tracks of the tagged animals were created from the GPS data and visual track data. A dead-reckoned track (“pseudotrack”) based on the output of the tag’s orientation and acoustic sensors was produced for the tagged bottlenose whale (Miller et al., 2015)as this animal was lost for visual tracking, and the tag did not record GPS data.
The horizontal speed and direction of move-ment of the tagged whale were calculated from the horizontal locations obtained from sightings at the surface and/or by GPS logger, or from the dead-reckoned track. For sightings and GPS, speed was calculated as the total great circle dis-tance travelled over three surfacings divided by the total time between them. Directness was cal-culated by dividing distance covered by the whale during three observation points of a track segment (i.e., the distance between the first surfacing and the third surfacing) by the cumulative distance between all three points and is given as values between 0 (circular movement) and 1 (straight movement).
Acoustic recordings of tagged whale sounds were analyzed only for the bottlenose whale. There was no acoustic sensor on the Ctag, and, thus, no acoustic data were collected for the minke whale. For humpback whales, an extensive scan of the acoustic recordings on the tags revealed that they
Behavioural Responses of Cetaceans to Naval Sonar 473
made very few sounds, and we did not pursue this any further to reduce time costs. The audio record-ing of the bottlenose whale was audited to identify foraging sounds produced by the tagged whale and other nearby whales (Miller et al., 2015). Click and buzz sounds were used as acoustic cues indicating foraging activity. Audio files recorded by the Dtags were displayed as spectrograms (Blackman-Harris window; FFT length: 512) with a 15-s duration window. The start and end of each detected sound was identified and marked, and it was ascribed to the tagged whale or another whale depending upon its relative amplitude and spec-tral characteristics. Other biological sounds from the tagged or nearby whales were also annotated. Details of the method can be found in Miller et al. (2015).
For humpback whales, the acoustic record of the Dtag was used to detect lunge feeding events. Humpback lunge feeding involves engulfing a large volume of prey-rich water in the flex-ible buccal cavity and filtering out prey with the baleen. A lunge is characterized by an increase in speed followed by an abrupt drop in speed as the whale first accelerates forward and then slows down quickly after the jaw opens. The low-frequency flow noise measured on the acoustic record of the Dtag is a useful proxy for the whale’s speed through the water and was used here to identify lunge events, replicating the method of Simon et al. (2012). We developed an automatic lunge detector that identified events with noise peaks that exceed the 90th percentile (for depth > 5 m) of the flow noise (< 500 Hz) in all dives deeper than 5 m and which were followed by at least a 12 dB drop in flow noise within 5 s. This 5-s period was truncated if the whale reached the surface (depth < 0.5 m) to avoid drops in the noise when the whale surfaced to breathe.
Processing and Analysis of Received Sonar SignalsSonar signals recorded by the Dtag were extracted for detailed analysis of the sonar received levels (Miller et al., 2011; Kvadsheim et al., 2015). For each sonar pulse, we measured the broad-band maximum rms sound pressure level (SPL) over a 200-ms averaging window and the broad-band cumulative sound exposure level (SELcum) throughout the exposure session. These broad-band received levels were calculated from 1/3-octave bands between 1 to 40 kHz in which the signal exceeded the noise on the tag by 10 dB or more. The levels of some sonar pulses during the ramp-up at the start of each exposure session were below this threshold. The received level of those pulses was calculated by extrapolation using the measured level of the closest ping in time adjusted
for the known difference in source level. The acoustic sensitivity of the Dtags, determined from calibration measurements, was (mean ± SD) -185 ± 4 dB re 1 mPa−1 (N = 6 tags).
The Ctag deployed on the minke whale did not have any acoustic sensors, so the received SPLs were estimated from acoustic propagation mod-elling. The ray-trace model LYBIN (Dombestein & Gjersøe, 2012) was used to calculate acoustic propagation loss in two dimensions (range and depth) using the transmission characteristics of the Socrates source. The model was re-run with two different sound speed profiles measured in the exposure area shortly after the sonar exposure (Kvadsheim et al., 2015) and with two different source depths (source depths varied between 60 and 69 m during the exposure), and the mean value was used (average standard deviation was 3.6 dB). The depth of the tagged whale was calcu-lated from the tag’s pressure sensor, and the hori-zontal movement under water was interpolated between every surfacing, resulting in a horizontal and vertical position of the whale at the time of each sonar ping. Both the GPS position and depth of the sonar source were recorded, and, thus, the horizontal distance between the whale and the source for each ping could be estimated. Received SPLs were calculated as transmitted source level minus mean propagation loss estimated by LYBIN. The received level estimates were found to be within 5 dB of levels measured by calibrated hydrophones towed by the small boat tracking the whale (Kvadsheim et al., 2015).
Scoring Severity of Expert-Identified Behavioural ResponsesBased upon an extensive literature review on behavioural effects of sound on marine mammals, a panel of experts in marine mammal behaviour scaled documented behavioural responses accord-ing to the putative severity for the affected ani-mals (Southall et al., 2007). The scale ranged from no response (0), responses that are not likely to affect vital rates (1 to 3), responses that have the potential to affect vital rates (4 to 6), to responses that are likely to affect vital rates (7 to 9) if the exposure is of sufficient duration or repeated. The severity of a response depends upon both the type of behavioural change and the duration of the response (Southall et al., 2007)
Each experiment of the present study was rep-resented by a series of standardized data plots; a geographic track plot (GIS plot) and a time series data plot were provided for the whole tag record, with close-ups of each pre-exposure baseline and exposure periods (see Figure 1 through 3 for examples of plots for exposure period). Full sets of plots are available in Kvadsheim et al. (2015).

474 Sivle et al.
Figure 1. Plot for humpback whale (Megaptera novaeangliae) (mn12_180ab) during the time period from 30 min prior to the first exposure session (sonar 1) to 30 min after the session. Upper panels show the track of the source boat (HUS) and the whale, with the upper right panel showing a zoomed-in view around the exposure area. The colour coding on the animal and ship tracks indicates the time since the start of the exposure session, with blue and red marking the start and end, respectively. Tracks of the whale are based upon the visual tracking, and the GPS loggers on the whale are plotted, with each dot on the track representing a position fix. Mn12_180ab was tagged with two Dtags, and both GPS tracks are shown. The lower panel shows time series plots of different variables recorded. From the top: group structure variables (e.g., group size, number of individuals in the area, and individual spacing), surface display variables (e.g., observed breaches, surface lunges, rolls, flukes, and if there were birds surrounding the focal animal[s]), heading and directness (i.e., a measure of how straight the animal is swimming: 1 = straight line, 0 = circular) measured from the visual observations and GPS, speed of the animal based upon the visual track and GPS tracks, and dive profile (black) overlaid with detected feeding lunges marked as red dots. Vertical yellow lines indicate the start and end of the sonar exposure period. More plots of this animal, including the entire time series, can be found in Kvadsheim et al. (2015).

Behavioural Responses of Cetaceans to Naval Sonar 475
Figure 2. Plot for minke whale (Balaenoptera acutorostrata) (ba11_180) during the time period from 30 min prior to exposure to 30 min after sonar exposure to sonar 1. Format of figure follows Figure 1. The minke whale did not carry a GPS logger and, therefore, only the visual track is shown. Each dot on the track represents a visual position fix. The sensors on the Ctag used on the minke whale did not allow detection of lunges, so lunges are not indicated. However, skim-feeding at the surface was observed, and the timing of these are indicated in the figure. More plots of this animal, including the entire time series, can be found in Kvadsheim et al. (2015).
476 Sivle et al.
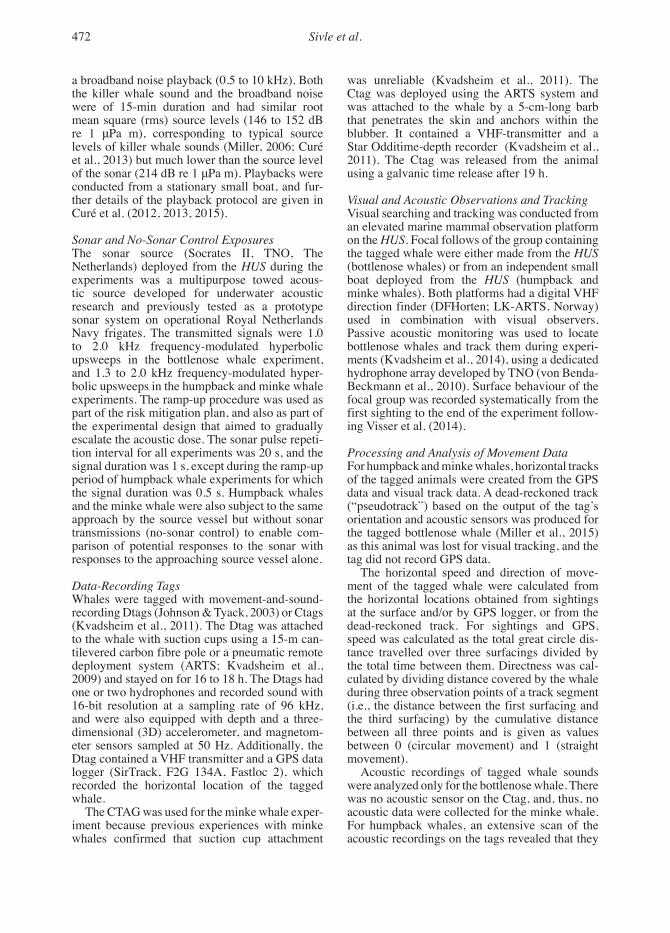
Figure 3. Plot for northern bottlenose whale (Hyperoodon ampullatus) (ha13_176). Upper panel is horizontal track. The animal was lost for visual tracking and, therefore, the track of the whale is a reconstructed dead-reckoned track (pseudotrack) based upon estimated speed, pitch, and heading recorded by the tag. The middle and lower panel show time series plots of the estimated speed based on the flow noise on the tag and the dive profile (black) with identified vocalizations indicated. The middle panel shows the entire time series, while the lower panel is a zoomed-in view of the time plots showing the time period from 30 min prior to exposure to 30 min after exposure. More plots of this animal, including the entire time series, can be found in Kvadsheim et al. (2015).

Behavioural Responses of Cetaceans to Naval Sonar 477
Based upon these plots, behavioural changes were described and scored by two independent groups of experts in accordance with the Southall et al. (2007) severity scale modified by Miller et al. (2012) (Table 1). In the present study, we made some additional modifications based upon observed behavioural changes that were not cov-ered in the existing scale, mainly changes with shorter duration (Table 1).
The severity of a behavioural response depends upon its duration, but the duration of the response will likely vary with exposure duration. Experimental exposures typically are shorter than real naval sonar operations; and to enable extrap-olation, the Southall et al. (2007) severity scale defined duration on a time scale relative to expo-sure duration. A moderate change in behaviour had duration similar to the duration of the expo-sure, and minor or brief responses were consid-ered to be progressively shorter than the exposure; whereas a prolonged response was significantly longer than the exposure, considering the behav-ioural and diving patterns of the whale species. For some response types, a long-term or extended response is also included to account for responses that are exceptionally long (i.e., longer than pro-longed) (Table 1). This logic was used in previous studies using the severity scale (Miller et al., 2012) and is also used here; however, the humpback whale exposures were very short (5 to 10 min) compared to exposures to other species. To make the results more comparable across species, for humpback whale data, a behavioural change last-ing approximately 10 min (same as duration of the exposure) to 1 h was defined as moderate, while prolonged was used for responses lasting for more than 1 h. Moreover, a brief change was defined as significantly shorter than the exposure (less than 5 min), while minor was used for changes of dura-tion between brief and moderate (5 to 10 min). Using these criteria for the humpback whale data enabled comparison with the other two species of this study as well as the three species studied by Miller et al. (2012), which were all exposed for a much longer period (30 to 60 min) than the hump-back whales.
One scoring group consisted of authors PM, SI, CC, and PW, and the second group of authors PK, FL, LS, LK, and FV. Both groups conducted an initial independent scoring that was blind to the scoring of the other group but not blind to the experimental condition. The results of the two groups were tabulated before they met with an adjudicator (author PT) to reach a consensus scoring. The judgment of whether behavioural changes were scored as responses took into con-sideration the variation in this behaviour during the pre-exposure baseline period. For example,
if a change in behaviour during exposure also happened regularly during baseline, this change would generally not be considered as a response but a coincidental change in behaviour. In some cases, this was difficult to judge; and in these cases, behavioural changes were scored as responses with low confidence. If a behavioural change during an exposure was identified but was not considered to be a response, this change was given a 0 score (no response).
The data were then inspected in detail to deter-mine the precise onset time of each behavioural change as well as its duration. For sonar expo-sures, the highest SPL received up to the onset of the behavioural change (SPL ) was used as the received level associated with the
max
scored response. We also report the received SELcum until the last ping before the response (Appendix A, Tables AI through AIII).
Statistical AnalysisStatistical analysis was only carried out for hump-back whales as the sample sizes for the minke and bottlenose whale (n = 1 for both) were too low for statistical comparison. The statistical analysis aimed to test the null hypothesis that the number and severity of scored responses were random with respect to the type of exposure (sonar – no-sonar-control – killer whale playback – broadband noise playbacks).
Generalized estimating equation (GEE) models were fitted to the data to test the null hypoth-esis while accounting for serial correlation within each individual and to obtain effect estimates averaged across individuals. GEEs are a means to estimate the parameters of a regression model with unknown correlation between outcomes. All models were fitted with the “genmod” procedure in SAS 9.3 (Littell et al., 2006).
Severity scores were expressed as two inde-pendent response variables: (1) number of scored responses (#Score) per exposure session, modelled as a Poisson variable (identity-link); and (2) maxi-mum severity score (maxScore) per exposure ses-sion, modelled as a multinomial ordinal variable (cumulative logit link). The no-sonar control was selected as the intercept within the model, and candidate explanatory variables were designed to capture differences from this baseline. Six explanatory variables (covariates) were defined present (1) or absent (0). Covariate S was set pres-ent during all sonar exposures, kwPB during killer whale sound playbacks, and no-ramp-up during sonar exposures that did not include a ramp-up period. To test for sensitization/habituation to sonar during the second sonar exposure compared to first, S2 was set present during the second sonar exposure. The effect of the killer whale playback
478 Sivle et al.
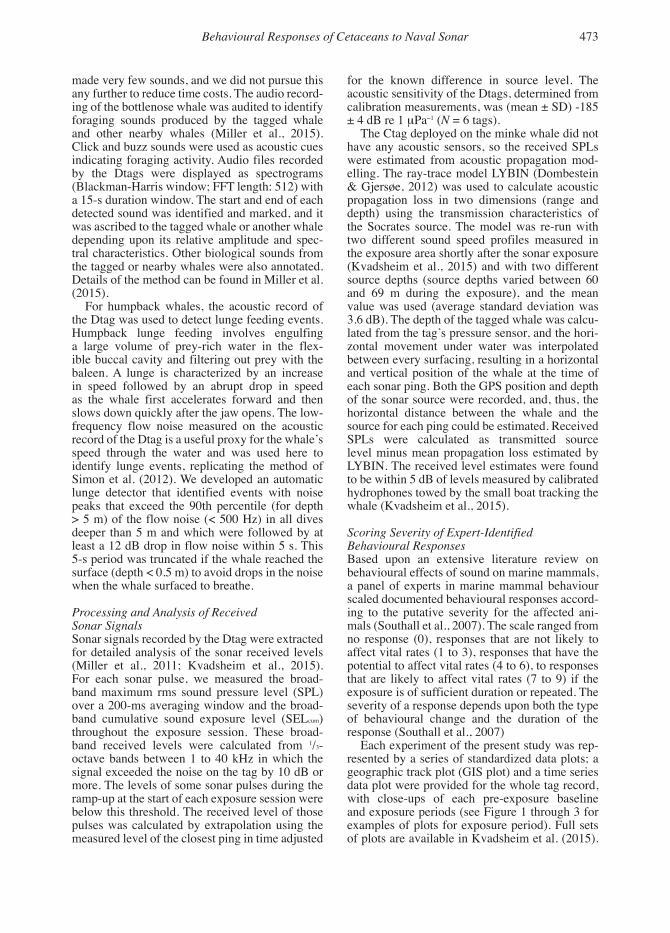
Table 1. Severity scale for scored behavioural responses used in this study. The scale is based on the original scale of Southall et al. (2007). Behavioural changes in bold are modifications made by Miller et al. (2012) and in bold italics are modifications made in the present study. Brief responses – duration significantly shorter than the exposures; Minor responses – shorter than the exposures, but longer than Brief; Moderate responses – roughly the duration of the exposure; and Prolonged responses – significantly longer than the exposures. Long-term and Extended responses are both considered to be exceptionally long duration responses (longer than Prolonged).
Score Behavioural responses
0 No observable response
1 Brief orientation response
2 • Moderate or multiple orientation responses • Brief or minor changes in respiration rates • Brief cessation/modification of vocal behaviour• Brief change in dive profile
3 • Prolonged orientation behaviour• Minor change in locomotion (speed/direction) and or dive profile but no avoidance of sound source• Minor cessation/modification of vocal behaviour• Individual alert behaviour• Moderate change of respiration rate
4 • Moderate change in locomotion (speed/direction) and or dive profile but no avoidance of sound source• Brief avoidance of sound source• Minor shift in group distribution• Moderate cessation/modification of vocal behaviour• Brief cessation of feeding
5 • Extended change in locomotion (speed/direction) and or dive profile but no avoidance of sound source• Minor avoidance of sound source• Moderate shift in group distribution• Change in inter-animal distance and/or group size• Prolonged cessation or modification of vocal behaviour• Minor cessation of feeding
6 • Moderate avoidance of sound source• Extended cessation or modification of vocal behaviour• Visible startle response• Moderate cessation of feeding• Prolonged shift in group distribution• Brief or minor separation of female and dependent offspring• Aggressive behaviour related to noise exposure• Brief cessation of reproductive behaviour• Moderate cessation of resting behaviour
7 • Prolonged cessation of feeding• Moderate separation of female and dependent offspring• Severe and or sustained avoidance of sound source• Extensive or prolonged aggressive behaviour• Clear anti-predator response• Moderate cessation of reproductive behaviour• Prolonged avoidance
8 • Obvious aversion and/or progressive sensitization• Long-term avoidance of area• Prolonged or significant separation of female and dependent offspring with disruption of acoustic reunion mechanisms• Prolonged cessation of reproductive behaviour
9 • Outright panic, flight, stampede, or attack • Avoidance related to predator detection
Behavioural Responses of Cetaceans to Naval Sonar 479
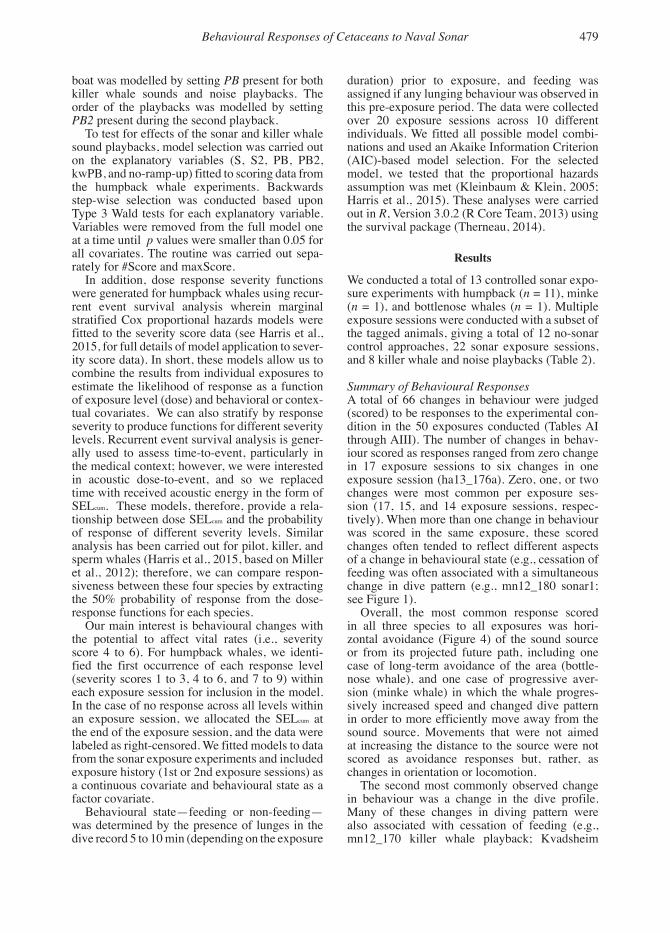
boat was modelled by setting PB present for both duration) prior to exposure, and feeding was killer whale sounds and noise playbacks. The assigned if any lunging behaviour was observed in order of the playbacks was modelled by setting this pre-exposure period. The data were collected PB2 present during the second playback. over 20 exposure sessions across 10 different
To test for effects of the sonar and killer whale individuals. We fitted all possible model combi-sound playbacks, model selection was carried out nations and used an Akaike Information Criterion on the explanatory variables (S, S2, PB, PB2, (AIC)-based model selection. For the selected kwPB, and no-ramp-up) fitted to scoring data from model, we tested that the proportional hazards the humpback whale experiments. Backwards assumption was met (Kleinbaum & Klein, 2005; step-wise selection was conducted based upon Harris et al., 2015). These analyses were carried Type 3 Wald tests for each explanatory variable. out in R, Version 3.0.2 (R Core Team, 2013) using Variables were removed from the full model one the survival package (Therneau, 2014).at a time until p values were smaller than 0.05 for all covariates. The routine was carried out sepa- Resultsrately for #Score and maxScore.
In addition, dose response severity functions We conducted a total of 13 controlled sonar expo-were generated for humpback whales using recur- sure experiments with humpback (n = 11), minke rent event survival analysis wherein marginal (n = 1), and bottlenose whales (n = 1). Multiple stratified Cox proportional hazards models were exposure sessions were conducted with a subset of fitted to the severity score data (see Harris et al., the tagged animals, giving a total of 12 no-sonar 2015, for full details of model application to sever- control approaches, 22 sonar exposure sessions, ity score data). In short, these models allow us to and 8 killer whale and noise playbacks (Table 2).combine the results from individual exposures to estimate the likelihood of response as a function Summary of Behavioural Responses of exposure level (dose) and behavioral or contex- A total of 66 changes in behaviour were judged tual covariates. We can also stratify by response (scored) to be responses to the experimental con-severity to produce functions for different severity dition in the 50 exposures conducted (Tables AI levels. Recurrent event survival analysis is gener- through AIII). The number of changes in behav-ally used to assess time-to-event, particularly in iour scored as responses ranged from zero change the medical context; however, we were interested in 17 exposure sessions to six changes in one in acoustic dose-to-event, and so we replaced exposure session (ha13_176a). Zero, one, or two time with received acoustic energy in the form of changes were most common per exposure ses-SELcum. These models, therefore, provide a rela- sion (17, 15, and 14 exposure sessions, respec-tionship between dose SEL and the probability tively). When more than one change in behaviour of response of different severity levels. Similar
cum
was scored in the same exposure, these scored analysis has been carried out for pilot, killer, and changes often tended to reflect different aspects sperm whales (Harris et al., 2015, based on Miller of a change in behavioural state (e.g., cessation of et al., 2012); therefore, we can compare respon- feeding was often associated with a simultaneous siveness between these four species by extracting change in dive pattern (e.g., mn12_180 sonar1; the 50% probability of response from the dose- see Figure 1).response functions for each species. Overall, the most common response scored
Our main interest is behavioural changes with in all three species to all exposures was hori-the potential to affect vital rates (i.e., severity zontal avoidance (Figure 4) of the sound source score 4 to 6). For humpback whales, we identi- or from its projected future path, including one fied the first occurrence of each response level case of long-term avoidance of the area (bottle-(severity scores 1 to 3, 4 to 6, and 7 to 9) within nose whale), and one case of progressive aver-each exposure session for inclusion in the model. sion (minke whale) in which the whale progres-In the case of no response across all levels within sively increased speed and changed dive pattern an exposure session, we allocated the SELcum at in order to more efficiently move away from the the end of the exposure session, and the data were sound source. Movements that were not aimed labeled as right-censored. We fitted models to data at increasing the distance to the source were not from the sonar exposure experiments and included scored as avoidance responses but, rather, as exposure history (1st or 2nd exposure sessions) as changes in orientation or locomotion. a continuous covariate and behavioural state as a factor covariate.
Behavioural state—feeding or non-feeding—was determined by the presence of lunges in the dive record 5 to 10 min (depending on the exposure
The second most commonly observed change in behaviour was a change in the dive profile. Many of these changes in diving pattern were also associated with cessation of feeding (e.g., mn12_170 killer whale playback; Kvadsheim

480 Sivle et al.
et al., 2015). Cessation of feeding was not scored for the minke whale because the identification of lunges was based on the acoustic sensor, which was lacking in the tag used in this particular trial. Changes in group distribution were less common (Table 2) and only scored for humpback whales. However, humpback and minke whales are often solitary in these waters; indeed, five of 11 hump-back whales and the minke whale were solitary for most of the period they were tracked. Changes in vocal behaviour were only scored for the bot-tlenose whale. The bottlenose whale (ha13_179a) stopped producing foraging sounds completely during sonar exposure (Figures 3 & 4). The two most severe responses scored were observed in response to sonar: long-term avoidance of a larger area (score 8) for the bottlenose whale and obvi-ous progression of the avoidance response (score 8) for the minke whale.
Severity of Scored Responses in Relation to Received Sound Pressure Level For humpback whales, changes in behaviour were scored with response thresholds over a broad range of received sound pressure levels (SPLmax)from 94 to 179 dB re 1 μPa (Table 3; Figure 5). The highest score (severity 7) corresponded to an onset level of 164 dB re 1 μPa. The majority of scores (16 of 27) were at threshold levels above 140 dB re 1 μPa.
Neither of the covariates investigated in the Cox proportional hazards model were signifi-cant at the p = 0.05 level and, therefore, a model with no covariates was fitted to produce dose-response functions across all humpback whales for responses of different severities. From the function for responses with potential to affect vital rates (severity score 4 through 6) (Figure 6), we can see that the probability of a response increased as received SELcum increased, with 50% probability at 179 dB re 1 μPa2s (CI 141 to > 185 dB re 1μPa2s, n = 20). Given that behavioral state was not a significant covariate for humpback
Table 2. List of the experiments for the three species. Tag id is the code for the tag deployment, and the number of exposures of each type is given. Details of all deployments can be found in Kvadsheim et al. (2015).
Species Year Tag idNo-sonar control Sonar kwPB
NoisePB Comments
Humpback whale (Megaptera novaeangliae)
2011 mn11_157a 1 2 1 1
2011 mn11_158ab 1 Two tags on the same animal
2011 mn11_160ab 1 2 1 1 Two tags on the same animal
2011 mn11_165def 1 2 1 1 Three tags on two different animals
2012 mn12_161ab 1 2 1 1 Two tags on the same animal
2012 mn12_164ab 1 2 1 1 Tags on two different animals
2012 mn12_170ab 1 2 1 1 Two tags on two different animals
2012 mn12_171ab 1 2 1 1 Two tags on the same animal
2012 mn12_178a 1 2
2012 mn12_179a 1 2
2012 mn12_180ab 1 2 1 1 Two tags on the same animal
Minke whale (Balaenoptera acutorostrata) 2011 ba11_180a 1 1 Ctag without
acoustic sensors
Bottlenose whale (Hyperoodon ampullatus) 2013 ha13_176a 1
Lost visual contact with animal prior to exposure

Behavioural Responses of Cetaceans to Naval Sonar 481
whales, we can only compare humpback whales averaged across all behavioral states with feeding and non-feeding killer, pilot, and sperm whales (from Harris et al., 2015). For feeding killer, pilot, and sperm whales exposed to low-frequency active sonar (LFAS), the 50% probability of response with potential to affect vital rates was 89 dB re 1 μPa2s (CI = 80 to > 180 dB re 1 μPa2s, n = 1), 142 dB re 1 μPa2s (CI = 126 to > 180 dB re 1 μPa2s, n = 1), and 133 dB re 1 μPa2s (CI = 122 to > 180 dB re 1 μPa2s, n = 4), respectively. For non-feeding killer whales, the 50% probability of response at the same severity level was 165 dB re 1 μPa2s (CI = 157 to > 180 dB re 1 μPa2s, n = 2). Non-feeding pilot whales did not reach the 50% probability of response at the maximum exposure level 179 dB re 1 μPa2s, and sperm whales were always feeding at the start of the exposure. In all comparisons, the humpback whales had a higher SELcum at the 50% response probability than the other three species,
Two of three of the scored responses for the minke whale had thresholds ≤146 dB re 1 μPa; and in the bottlenose whale, four of six responses happened at thresholds ≤ 130 dB re 1 μPa (Table 3; Tables AI-AIII). The lowest threshold in these two species was at 83 and 86 dB re 1 μPa in the minke whale and bottlenose whale, respectively, but these
responses were scored to have modest severities of only 2 and 3, respectively. The highest sever-ity scored in minke whales and bottlenose whales was severity 8 for both species, with thresholds of 158 and 130 dB re 1 μPa, respectively.
Severity of Scored Responses in Relation to Exposure TypeFor humpback whales, the scored changes in behaviour were generally more severe for the killer whale playback and sonar exposures than for the no-sonar control and noise playbacks (Table 4). Sonar exposure and killer whale sound playbacks were estimated to have 8 and 40 times the odds of a higher maximum score than the no-sonar con-trol and noise playbacks, respectively (odds ratio; Table 5). The average number of scores was esti-mated to be over 1.35 times higher during sonar exposures and 2.25 times higher during killer whale sound playbacks, compared to no-sonar control transmission for humpbacks (Table 5). Thus, signal type (kwPB and S) explained a sig-nificant amount of variation in the severity scores across exposure types, both in terms of maximum severity score and number of scores per exposure (Table B1: Type III Wald test, χ2 = 5.4 to 31.5, p < 0.021). Maximum severity and number of scores were in general higher for the first sonar exposure
Figure 4. Percentage of observed behavioural response types within each species in response to sonar. The figure includes data for six species: the three species of the current study and the three species studied by Miller et al. (2012). The sonar signals were presented to the animals in a random behavioural context. This implies that some type of responses were not available to some individuals at the time of the exposure—for example, only feeding animals can cease feeding, and only vocalizing animals can stop vocalizing. However, since real sonar exercise also starts at a random time relative to the animal’s behavioural context, this figure represents an expected distribution of response types during real sonar exercises.

482 Sivle et al.
Examples of Severity Scoring
The tables in Appendix A show the complete set of scored responses. The complete set of data plots from all scored sessions can be found in Kvadsheim et al. (2015). Three examples of data plots used as a basis for expert scoring are shown in Figures 1 to 3, one for each species. The scoring results of these experi-ments can be seen in the following examples:
Example 1. Humpback Whale (mn12_180ab), Sonar 1 – Three different behavioural responses were scored for this exposure. This experiment was conducted on a mother-calf pair, with the mother as the tagged animal. We did not manage to tag the calf, but the behaviour of the two whales at the surface was often synchronous. The data plots for this exposure are shown in Figure 1.
Severity Description
5
Minor avoidance – After a period of tortuous horizontal movement prior to the exposure, the track became more directional while the animal was moving out of the path of the ship. The avoidance response started almost immediately after the first pulse was transmitted but did not last beyond the duration of the sonar exposure.
4
Moderate change in dive profile – The animal made one deep dive to 100 m that started 2.5 min after sonar onset. A dive this deep was unusual and did not happen in the pre-exposure tag record. The animal’s dive behaviour changed after this deep dive. Normal diving resumed within 1 h after exposure. The start of the deep dive was considered to be the onset of the response.
6
Moderate cessation of feeding – The animal conducted shallow feeding dives to 10 to 40 m depth with frequent lunges almost continuously for a period of 7 h before the sonar exposure. A few minutes into the exposure, the animal made one last feeding dive with one lunge before it changed dive behaviour and stopped lunging. Some feeding resumed within 1 h. The start of the unusual deep dive that followed the dive with a lunge was taken as the onset of the response.
Example 2. Minke Whale (ba11_180a), Sonar 1 – This was the only minke whale tagged. This whale was subject to a single sonar exposure session after a no-sonar control approach. Three different behavioural responses were scored for the sonar exposure. The data plots for this exposure are shown in Figure 2.
Severity Description
2
Brief change in dive profile – The animal changed its dive pattern at sonar onset from very shallow diving (0 to 5 m) to diving into the sound channel at around 50 m depth. This started at the first sonar ping at a received SPL of 83 dB re 1 μPa. During the 30 min prior to sonar onset, the whale had been doing only shallow (< 10 m deep) dives. This behaviour could be a possible attempt to improve the localization of the sound source.
7
Prolonged avoidance – The animal increased speed and swam directly away from the sound source through-out the rest of the exposure. Opportunistic visual observations of skim feeding at the surface before the start of the sonar exposure indicated that this response might also have involved a cessation of feeding. The start of the response was taken as the time of the first sighting where the animal had increased speed and swam at a course directly away from the source at a received SPL of 146 dB re 1 μPa.
8
Obvious progressive aversion (and sensitization) – The animal continued to increase its speed as the expo-sure progressed, swimming at such a high speed that the distance to the source ship remained constant. About halfway through the exposure, the dive pattern changed to shallower diving, which may be a way to move more effectively away from the source. This shift in dive pattern is set as the onset of this response with a received SPL of 158 dB re 1 μPa.
Behavioural Responses of Cetaceans to Naval Sonar 483
compared to the second sonar exposure (Tables 3 & 4). However, covariate S2 was the last covari-ate to be dropped in the backwards step-wise model using Type III Wald tests for both number of scores and maximum score, indicating a trend in the data that the second sonar exposure elic-ited less severe and fewer responses than the first exposure, although these order effects were still not quite significant (p = 0.09 and p = 0.13 for #Score and maxScore, respectively).
Additionally, the minke whale had much higher severity responses during the sonar exposure than the no-sonar control exposure, although this could not be tested statistically.
Potential False PositivesOf all identified behavioural changes during experimental conditions, 28% were scored as severity 0 (no response). In five exposures, a change in behaviour was scored as a response but with low confidence whether this change in behaviour was a response or not (Table 3). Details of these responses are found in Table A1.
Discussion
The objectives of the present study were to iden-tify behavioural responses of cetaceans to sonar
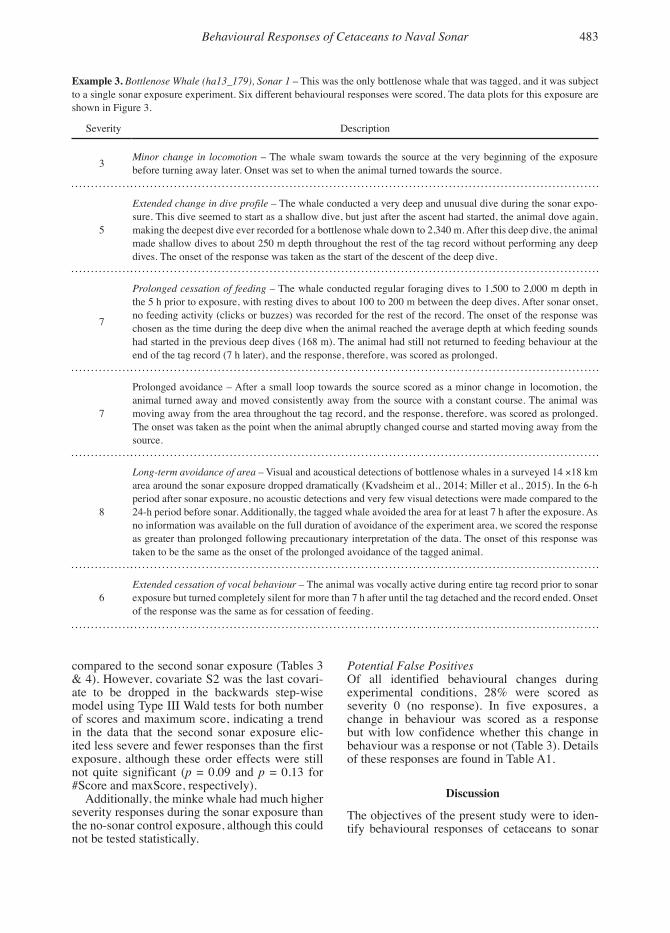
Example 3. Bottlenose Whale (ha13_179), Sonar 1 – This was the only bottlenose whale that was tagged, and it was subject to a single sonar exposure experiment. Six different behavioural responses were scored. The data plots for this exposure are shown in Figure 3.
Severity Description
3 Minor change in locomotion – The whale swam towards the source at the very beginning of the exposure before turning away later. Onset was set to when the animal turned towards the source.
5
Extended change in dive profile – The whale conducted a very deep and unusual dive during the sonar expo-sure. This dive seemed to start as a shallow dive, but just after the ascent had started, the animal dove again, making the deepest dive ever recorded for a bottlenose whale down to 2,340 m. After this deep dive, the animal made shallow dives to about 250 m depth throughout the rest of the tag record without performing any deep dives. The onset of the response was taken as the start of the descent of the deep dive.
7
Prolonged cessation of feeding – The whale conducted regular foraging dives to 1,500 to 2,000 m depth in the 5 h prior to exposure, with resting dives to about 100 to 200 m between the deep dives. After sonar onset, no feeding activity (clicks or buzzes) was recorded for the rest of the record. The onset of the response was chosen as the time during the deep dive when the animal reached the average depth at which feeding sounds had started in the previous deep dives (168 m). The animal had still not returned to feeding behaviour at the end of the tag record (7 h later), and the response, therefore, was scored as prolonged.
7
Prolonged avoidance – After a small loop towards the source scored as a minor change in locomotion, the animal turned away and moved consistently away from the source with a constant course. The animal was moving away from the area throughout the tag record, and the response, therefore, was scored as prolonged. The onset was taken as the point when the animal abruptly changed course and started moving away from the source.
8
Long-term avoidance of area – Visual and acoustical detections of bottlenose whales in a surveyed 14 ×18 km area around the sonar exposure dropped dramatically (Kvadsheim et al., 2014; Miller et al., 2015). In the 6-h period after sonar exposure, no acoustic detections and very few visual detections were made compared to the 24-h period before sonar. Additionally, the tagged whale avoided the area for at least 7 h after the exposure. As no information was available on the full duration of avoidance of the experiment area, we scored the response as greater than prolonged following precautionary interpretation of the data. The onset of this response was taken to be the same as the onset of the prolonged avoidance of the tagged animal.
6Extended cessation of vocal behaviour – The animal was vocally active during entire tag record prior to sonar exposure but turned completely silent for more than 7 h after until the tag detached and the record ended. Onset of the response was the same as for cessation of feeding.

484 Sivle et al.
Table 3. Scored responses during sonar exposure with associated maximum received sound pressure level (SPLmax) in 10 dB bins for the three study species. “1” indicates a score given during the first sonar exposure (sonar 1), while “2” indicates scores for the second sonar exposure (sonar 2) of the same animal. Scores in parentheses indicate low confidence scores.
Experiments with humpback whales
SPLmax (dB re 1 μPa)Severity
score
70-79
80-89
90-99100-109
110-119
120-129
130-139
140-149
150-159
160-169
170-179
180-189
9
8
7 -1
6 112 1 (1)12
5 1 2 1 1
4 1 1 1 1 2
3 22 22 12
2 1 1 2
1 2
Experiment with minke whale
SPLmax (dB re 1 μPa)
Severity score
70-79
80-89
90-99
100-109
110-119
120-129
130-139
140-149
150-159
160-169
170-179
180-189
9
8 1
7 1
6
5
4
3
2 1
1
Experiment with bottlenose whaleSPLmax (dB re 1 μPa)
Severity score
70-79
80-89
90-99
100-109
110-119
120-129
130-139
140-149
150-159
160-169
170-179
180-189
9
8 1
7 1 1
6 1
5 1
4
3 1
2
1
Behavioural Responses of Cetaceans to Naval Sonar 485
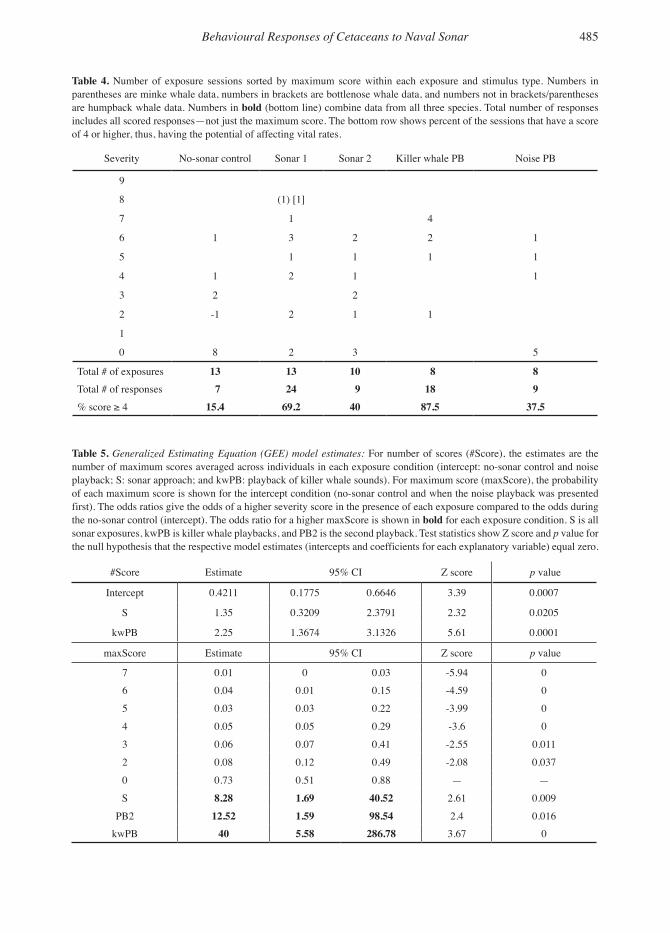
Table 4. Number of exposure sessions sorted by maximum score within each exposure and stimulus type. Numbers in parentheses are minke whale data, numbers in brackets are bottlenose whale data, and numbers not in brackets/parentheses are humpback whale data. Numbers in bold (bottom line) combine data from all three species. Total number of responses includes all scored responses—not just the maximum score. The bottom row shows percent of the sessions that have a score of 4 or higher, thus, having the potential of affecting vital rates.
Severity No-sonar control Sonar 1 Sonar 2 Killer whale PB Noise PB
9
8 (1) [1]
7 1 4
6 1 3 2 2 1
5 1 1 1 1
4 1 2 1 1
3 2 2
2 -1 2 1 1
1
0 8 2 3 5
Total # of exposures 13 13 10 8 8Total # of responses 7 24 9 18 9% score ≥ 4 15.4 69.2 40 87.5 37.5
Table 5. Generalized Estimating Equation (GEE) model estimates: For number of scores (#Score), the estimates are the number of maximum scores averaged across individuals in each exposure condition (intercept: no-sonar control and noise playback; S: sonar approach; and kwPB: playback of killer whale sounds). For maximum score (maxScore), the probability of each maximum score is shown for the intercept condition (no-sonar control and when the noise playback was presented first). The odds ratios give the odds of a higher severity score in the presence of each exposure compared to the odds during the no-sonar control (intercept). The odds ratio for a higher maxScore is shown in bold for each exposure condition. S is all sonar exposures, kwPB is killer whale playbacks, and PB2 is the second playback. Test statistics show Z score and p value for the null hypothesis that the respective model estimates (intercepts and coefficients for each explanatory variable) equal zero.
#Score Estimate 95% CI Z score p value
Intercept 0.4211 0.1775 0.6646 3.39 0.0007
S 1.35 0.3209 2.3791 2.32 0.0205
kwPB 2.25 1.3674 3.1326 5.61 0.0001
maxScore Estimate 95% CI Z score p value
7 0.01 0 0.03 -5.94 0
6 0.04 0.01 0.15 -4.59 0
5 0.03 0.03 0.22 -3.99 0
4 0.05 0.05 0.29 -3.6 0
3 0.06 0.07 0.41 -2.55 0.011
2 0.08 0.12 0.49 -2.08 0.037
0 0.73 0.51 0.88 — —
S 8.28 1.69 40.52 2.61 0.009
PB2 12.52 1.59 98.54 2.4 0.016
kwPB 40 5.58 286.78 3.67 0
486 Sivle et al.
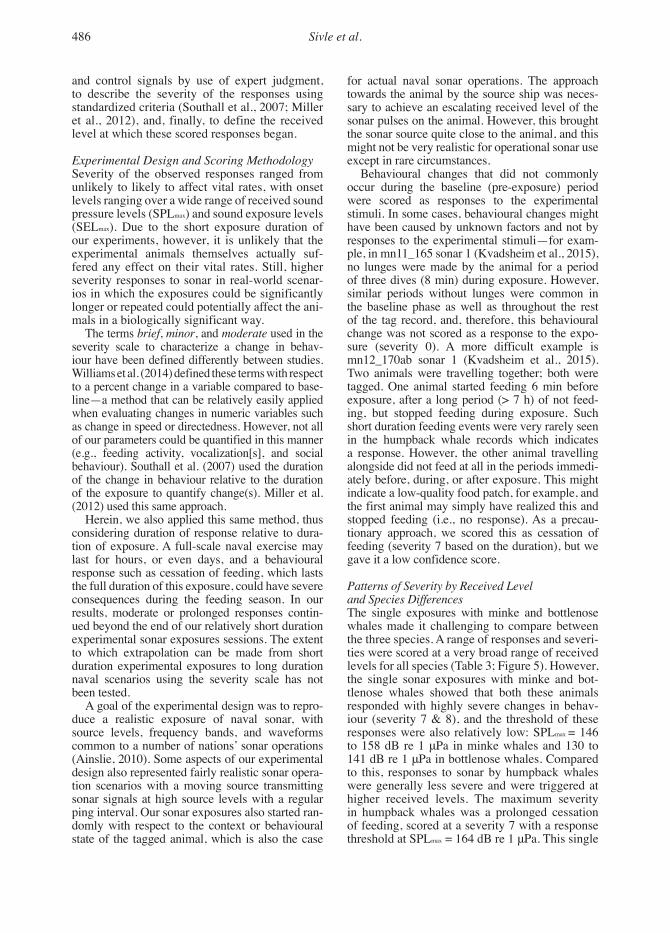
and control signals by use of expert judgment, to describe the severity of the responses using standardized criteria (Southall et al., 2007; Miller et al., 2012), and, finally, to define the received level at which these scored responses began.
Experimental Design and Scoring MethodologySeverity of the observed responses ranged from unlikely to likely to affect vital rates, with onset levels ranging over a wide range of received sound pressure levels (SPLmax) and sound exposure levels (SELmax). Due to the short exposure duration of our experiments, however, it is unlikely that the experimental animals themselves actually suf-fered any effect on their vital rates. Still, higher severity responses to sonar in real-world scenar-ios in which the exposures could be significantly longer or repeated could potentially affect the ani-mals in a biologically significant way.
The terms brief, minor, and moderate used in the severity scale to characterize a change in behav-iour have been defined differently between studies. Williams et al. (2014) defined these terms with respect to a percent change in a variable compared to base-line—a method that can be relatively easily applied when evaluating changes in numeric variables such as change in speed or directedness. However, not all of our parameters could be quantified in this manner (e.g., feeding activity, vocalization[s], and social behaviour). Southall et al. (2007) used the duration of the change in behaviour relative to the duration of the exposure to quantify change(s). Miller et al. (2012) used this same approach.
Herein, we also applied this same method, thus considering duration of response relative to dura-tion of exposure. A full-scale naval exercise may last for hours, or even days, and a behavioural response such as cessation of feeding, which lasts the full duration of this exposure, could have severe consequences during the feeding season. In our results, moderate or prolonged responses contin-ued beyond the end of our relatively short duration experimental sonar exposures sessions. The extent to which extrapolation can be made from short duration experimental exposures to long duration naval scenarios using the severity scale has not been tested.
A goal of the experimental design was to repro-duce a realistic exposure of naval sonar, with source levels, frequency bands, and waveforms common to a number of nations’ sonar operations (Ainslie, 2010). Some aspects of our experimental design also represented fairly realistic sonar opera-tion scenarios with a moving source transmitting sonar signals at high source levels with a regular ping interval. Our sonar exposures also started ran-domly with respect to the context or behavioural state of the tagged animal, which is also the case
for actual naval sonar operations. The approach towards the animal by the source ship was neces-sary to achieve an escalating received level of the sonar pulses on the animal. However, this brought the sonar source quite close to the animal, and this might not be very realistic for operational sonar use except in rare circumstances.
Behavioural changes that did not commonly occur during the baseline (pre-exposure) period were scored as responses to the experimental stimuli. In some cases, behavioural changes might have been caused by unknown factors and not by responses to the experimental stimuli—for exam-ple, in mn11_165 sonar 1 (Kvadsheim et al., 2015), no lunges were made by the animal for a period of three dives (8 min) during exposure. However, similar periods without lunges were common in the baseline phase as well as throughout the rest of the tag record, and, therefore, this behavioural change was not scored as a response to the expo-sure (severity 0). A more difficult example is mn12_170ab sonar 1 (Kvadsheim et al., 2015). Two animals were travelling together; both were tagged. One animal started feeding 6 min before exposure, after a long period (> 7 h) of not feed-ing, but stopped feeding during exposure. Such short duration feeding events were very rarely seen in the humpback whale records which indicates a response. However, the other animal travelling alongside did not feed at all in the periods immedi-ately before, during, or after exposure. This might indicate a low-quality food patch, for example, and the first animal may simply have realized this and stopped feeding (i.e., no response). As a precau-tionary approach, we scored this as cessation of feeding (severity 7 based on the duration), but we gave it a low confidence score.
Patterns of Severity by Received Level and Species Differences The single exposures with minke and bottlenose whales made it challenging to compare between the three species. A range of responses and severi-ties were scored at a very broad range of received levels for all species (Table 3; Figure 5). However, the single sonar exposures with minke and bot-tlenose whales showed that both these animals responded with highly severe changes in behav-iour (severity 7 & 8), and the threshold of these responses were also relatively low: SPLmax = 146 to 158 dB re 1 μPa in minke whales and 130 to 141 dB re 1 μPa in bottlenose whales. Compared to this, responses to sonar by humpback whales were generally less severe and were triggered at higher received levels. The maximum severity in humpback whales was a prolonged cessation of feeding, scored at a severity 7 with a response threshold at SPLmax = 164 dB re 1 μPa. This single

Behavioural Responses of Cetaceans to Naval Sonar 487
event was also a response judged to be of low con-fidence that it actually was a response to the sonar and not simply an incidental change in behav-iour (Table 3; Table AI). Thus, with the reserva-tion inherent in drawing conclusions from single experiments, our results suggest that minke and bottlenose whales are more sensitive to sonar than humpback whales. The additional observation was that the number of bottlenose whales feeding in the larger exposed area in the 6 h following the sonar transmission dropped dramatically (Miller et al., 2015). This may indicate that, at least for bottlenose whales, the observed response was not limited to just the single tagged animal.
Other studies that examined humpback whale reactions to sonar have shown weak avoidance (Maybaum, 1993) and changed singing activity (Miller et al., 2000) but with large individual vari-ation. The number of acoustic detections of minke whales was found to drop markedly during naval sonar activity (Martin et al., 2015). No other stud-ies have been conducted with bottlenose whales, but other beaked whale species have shown strong avoidance of sonar signals (Tyack et al., 2011; DeRuiter et al., 2013; Moretti et al., 2014), and both minke and beaked whales have been involved in strandings that were linked to naval sonar (Balcomb & Claridge, 2001; D’Amico et al., 2009), which is not the case for humpback whales. These studies are in accordance with the present results indicating all three species do respond to 1 to 2 kHz sonar signals and that minke
and bottlenose whales appear to be more sensitive to this disturbance than humpbacks.
Our results further imply that the severity of responses cannot be accurately predicted from the received levels alone (Table 3; Figure 5) because responses with potential to lead to changes in vital rates (> 4) were occasionally triggered at very low levels (< 100 dB re 1 μPa) (Table 3; Figure 5). This lack of correlation between severity and received levels was also noted by Miller et al. (2012), who concluded that all exposures above hearing threshold implied some risk of triggering a rela-tively severe behavioural response. Thus, other elements, such as the context in which a whale is exposed to sound, also influence its response.
We used marginal Cox proportional hazards models to produce dose-response functions for behavioral responses of different severities for the humpback whales to allow comparison with pre-vious analysis on killer, sperm, and pilot whales (Harris et al., 2015). We limited covariates consid-ered herein to those considered for other species, but neither behavioral state nor exposure order significantly contributed to the fit of the model to humpback whale data. We believe there may be other covariates that could be considered with the data on humpback whales, but that was beyond the scope of this study.
The comparison between all four species indi-cated that, on average, humpback whales respond at higher doses of accumulated sound than pilot, killer, and sperm whales, indicating humpback
Figure 5. Scored severity vs threshold of all responses in the three species of this study and the three species of Miller et al. (2012): humpback whale (◇), minke whale (∆), bottlenose whale (○), pilot whale (●), killer whale (*), and sperm whale (�).

488 Sivle et al.
whales to be less sensitive than the other three spe-cies. However, the sample size for some of these species is rather low in some cases, and, therefore, these comparisons should not be over-interpreted.
Although not statistically significant, exposure history (1st or 2nd exposure session) was close to significant (p = 0.07) for humpback whales, with a lower probability of response during the second exposure compared to the first. This indicates that there might be some habituation between the first and second sonar exposure. Differences in responsiveness to sound levels may also be due to differences in sensation levels between species; however, studies of pilot whales (Antunes et al., 2014) and killer whales (Miller et al., 2014) indi-cated no striking difference in response threshold between 1 to 2 kHz and 6 to 7 kHz sonar, despite a 30 to 50 dB difference in hearing sensitivity of killer whales (Szymanski et al., 1999; Miller et al., 2014).
For the three species in the current study, the hearing thresholds have also not been well exam-ined. No direct measurement of hearing ability has been made for any baleen whale, but biome-chanical modelling of the hearing organ of baleen whales indicates that minke whales and hump-back whales both have sensitive hearing in the 1 to 2 kHz band tested, although absolute hearing thresholds were not provided (Houser et al., 2001;
Tubelli et al., 2012; Cranford & Krysl, 2015). The hearing ability of bottlenose whales has not been measured, but beaked whale species have their greatest hearing sensitivity at around 40 kHz (Cook et al., 2006; Finneran et al., 2009), although hearing has not been tested below 5 kHz. The lack of quantitative information on hearing thresholds in the relevant frequency band for all our study species makes any attempt to explain differences in responsiveness with hearing ability (sensation level) speculative.
Overall, avoidance of the sound source was the most commonly scored response to sonar, both in the three species studied here (humpback, minke, and bottlenose whales) and in the three spe-cies studied by Miller et al. (2012) (pilot, killer, and sperm whales) (see Figure 4). Changes in dive behaviour and other changes in movement and orientation were also commonly seen in all these species. Change in vocal behaviour was the second most common type of response observed in all four odontocetes, which were all very vocal in the baseline period. Cessation of feeding was also recorded in all species except for minke whale, for which the tag did not contain sensors that could detect feeding behaviour.
Figure 6. The predicted probability of a response of severity with potential to affect vital rates (severity 4 to 6) vs received cumulative sound exposure (SELcum) (dB re 1 μPa2s) for humpback whales; the grey lines represent the 95% confidence intervals.

Behavioural Responses of Cetaceans to Naval Sonar 489
Patterns of Severity by Exposure Type in Humpback WhalesFor humpback whales, there were large differ-ences both in the number of scored responses and the maximum severity of responses scored within an exposure depending upon exposure type (e.g., sonar, no-sonar control, killer whale, or noise playback) (Table 5; Table B1). Killer whale play-backs had a higher likelihood of being assigned both a higher number of scores per exposure and scores of higher severity than sonar expo-sure (Tables 4 & 5; Table B1). Thus, humpback whales reacted less strongly to exposure to naval sonar than to the playback of a natural predator. Killer whales can potentially attack all three target species (Jefferson et al., 1991); and killer whale sounds were expected to induce a natural anti-predator response. Our intention was to conduct killer whale playback experiments with all three target species of our study, but minke whales and bottlenose whales responded so strongly to the sonar exposure, which was conducted first, that exposure to killer whale sounds was not com-pleted with those individuals.
Overall, humpback whales responded consis-tently and strongly to killer whale sound play-backs, whereas they rarely changed behaviour in response to the broadband noise playback, thus, specifically reacting to the detection of killer whale sounds (Curé et al., 2015). Killer whale sound playbacks induced horizontal avoid-ance responses away from the sound source and changes in the dive profile as well as cessation of feeding for whales that were foraging before the start of exposure. Among species that can poten-tially be preyed upon by the killer whale, hump-back whales are thought to be regular targets (Jefferson et al., 1991; McCordic et al., 2013). In the present study, responses of humpback whales to killer whale playbacks may be interpreted as typical anti-predator behaviours (Frid & Dill, 2002) wherein animals stop fitness enhancing activities such as feeding when facing a perceived risk of predation (Curé et al., 2015).
Sonar exposure was the second strongest stim-ulus causing behavioural responses in humpback whales (Tables 4 & 5). Although the statistical analysis did not fully support it, there did appear to be a trend in the data suggesting that for hump-back whales, the second sonar exposure resulted in less severe and fewer responses (Tables 3 & 4; Table B1). Consistent with the findings of the mar-ginal Cox proportional hazards model reported above, this difference in the first and second sonar exposure sessions may suggest habituation to the sonar in that the humpback whales responded less intensely to the familiar sound that had not led to acute danger when first heard.
Conclusions
Based upon detailed expert examination of data recorded during experimental exposures to sonar, we found that exposure to 1 to 2 kHz naval sonar signals changed the behaviour of whales. The descriptive approach taken in this study is useful to present the data-rich outcomes of experimen-tal exposure of sonar to cetaceans, which can be difficult to analyze statistically. Even though comparison of the three species studied here was limited to the interpretation of single exposures to sonar for minke and bottlenose whales, those two experiments indicate high sensitivity to dis-turbance from sonar sounds. The bottlenose whale examined showed behavioural responses with high severity at a relatively low response thresh-old. This is consistent with studies of other spe-cies of beaked whales. The minke whale exam-ined also showed high sensitivity, with severe responses at response thresholds lower than many other species but possibly less sensitive than beaked whales. Humpback whales generally had fewer scored responses overall, and responses were scored with lower severity; these responses were typically also triggered at higher levels than for the minke and bottlenose whales. Compared to previously published data on pilot, killer, and sperm whales, humpback whales seemed to be a less-responsive species. They also seemed to habituate to the sonar when exposed repeatedly, and they reacted less strongly to exposure to naval sonar than to the playback of vocalizations from a natural predator.
Acknowledgments
We appreciate the effort of the entire 3S field research team during data collection. Thanks to Nina Nordlund (FFI) for support in the received level analysis on minke whale and Louise Burt (CREEM) for her statistical input. The proj-ect was funded by the Norwegian Ministry of Defense, the U.S. Office of Naval Research, the Netherlands Ministry of Defense, and DGA French Ministry of Defense. PLT acknowledges the support of the MASTS (The Marine Alliance for Science and Technology for Scotland) pooling initiative in the completion of this study. MASTS is funded by the Scottish Funding Council (Grant Reference HR09011) and contributing institu-tions. Both CH and LB were financially sup-ported by the U.S. Office of Naval Research Grant N00014-12-1-0204, under the project enti-tled Multi-study Ocean acoustics Human effects Analysis (MOCHA).

490 Sivle et al.
Literature Cited
Ainslie, M. A. (2010). Principles of sonar performance modeling. Chichester, UK: Springer-Praxis. http://dx. doi.org/10.1007/978-3-540-87662-5
Alves, A., Antunes, R., Bird, A., Tyack, P., Miller, P. J. O., Lam, F-P. A., & Kvadsheim, P. H. (2014). Vocal match-ing of naval sonar signals by long-finned pilot whales (Globicephala melas). Marine Mammal Science, 30(3), 1248-1257. http://dx.doi.org/10.1111/mms.12099
Antunes, R., Kvadsheim, P. H., Lam, F-P. A., Tyack, P. L., Thomas, L., Wensveen, P. J., & Miller, P. J. O. (2014). High response thresholds for avoidance of sonar by free-ranging long-finned pilot whales (Globicephala melas). Marine Pollution Bulletin, 83(1), 165-180. http://dx.doi.org/10.1016/j.marpolbul.2014.03.056
Au, W. W. L. (1993). The sonar of dolphins. New York: Springer Verlag. http://dx.doi.org/10.1007/978-1-4612-4356-4
Balcomb III, K. C., & Claridge, D. E. (2001). A mass stranding of cetaceans caused by naval sonar in the Bahamas. Bahamas Journal of Science, 5, 2-12.
Bartón, K. (2011). MuMin: Multi-model inference. R package, Version 1. Vienna, Austria: R Foundation for Statistical Computing. Available from https://cran.r- project.org/web/packages/MuMin/index/html.
Cook, M. L. H., Varela, R. A., Goldstein, J. D., McCulloch, S. D., Bossart, G. D., Finneran, J. J., . . . Mann, D. A. (2006). Beaked whale auditory evoked potential hear-ing measurements. Journal of Comparative Physiology A – Neuroethology Sensory Neural and Behavioural Physiology, 192(5), 489-495. http://dx.doi.org/10.1007/s00359-005-0086-1
Cox, T. M., Ragen, T. J., Read, A. J., Vos, E., Baird, R. W., Balcomb, K., . . . Benner, L. (2006). Understanding the impacts of anthropogenic sound on beaked whales. Journal of Cetacean Research Management, 7(3), 177-187.
Cranford, T. W., & Krysl, P. (2015). Fin whale sound recep-tion mechanisms: Skull vibration enables low-frequency hearing. PLOS ONE, 10(1), e0122298. http://dx.doi.org/ 10.1371/journal.pone.0116222
Croll, D. A., Clark, C. W., Calambokidis, J., Ellison, W. T., & Tershy, B. R. (2001). Effect of anthropogenic low-fre-quency noise on the foraging ecology of Balaenoptera whales. Animal Conservation, 4(1), 13-27. http://dx.doi.org/10.1017/S1367943001001020
Curé, C., Antunes, R., Alves, A. C., Visser, F., Kvadsheim, P. H., & Miller, P. J. O. (2013). Responses of male sperm whales (Physeter macrocephalus) to killer whale sounds: Implications for anti-predator strategies. Scientific Reports, 3(1579). http://dx.doi.org/10.1038/srep01579
Curé, C., Antunes, R., Samarra, F., Alves, A. C., Visser, F., Kvadsheim, P. H., & Miller, P. J. O. (2012). Pilot whales attracted to killer whale sounds: Acoustically-mediated interspecific interactions in cetaceans. PLOS ONE, 7(12), e52201. http://dx.doi.org/10.1371/journal.pone.0052201
Curé, C., Sivle, L. D., Visser, F., Wensveen, P., Isojunno, S., Harris, C., . . . Miller, P. J. O. (2015). Predator sound playbacks reveal flight responses in a flight strategist baleen whale. Marine Ecology Progress Series, 526, 267-282. http://dx.doi.org/10.3354/meps11231
D’Amico, A., Gisiner, R. C., Ketten, D. R., Hammock, J. A., Johnson, C., Tyack, P. L., & Mead, J. (2009). Beaked whale strandings and naval exercises. Aquatic Mammals, 35(4), 452-472. http://dx.doi.org/10.1578/AM.35.4.2009.452
Deecke, V. B., Slater, P. J. B., & Ford, J. K. B. (2002). Selective habituation shapes acoustic predator recog-nition in harbour seals. Nature, 420(6912), 171-173. http://dx.doi.org/10.1038/nature01030
DeRuiter, S. L., Southall, B. L., Calambokidis, J., Zimmer, W. M. X., Sadykova, D., Falcone, E. A., . . . Tyack, P. L. (2013). First direct measurements of behavioural responses by Cuvier’s beaked whales to mid-frequency active sonar. Biology Letters, 9(4), 20130223. http://dx. doi.org/10.1098/rsbl.2013.0223
Dombestein, E., & Gjersøe, A. L. (2012). LYBN 6.1. user manual (FFI-rapport 2012/01463). Retrieved 25 September 2015 from http://rapporter.ffi.no/rapporter/ 2012/01463.pdf.
Ellison, W. T., Southall, B. L., Clark, C. W., & Frankel, A. S. (2012). A new context-based approach to assess marine mammal behavioural responses to anthropo-genic sounds. Conservation Biology, 26(1), 21-28. http://dx.doi.org/10.1111/j.1523-1739.2011.01803.x
Finneran, J. J., Houser, D. S., Mase-Guthrie, B., Ewing, R. Y., & Lingenfelser, R. G. (2009). Auditory evoked potentials in a stranded Gervais’ beaked whale (Mesoplodon europaeus). The Journal of the Acoustical Society of America, 126(1), 484-490. http://dx.doi.org/ 10.1121/1.3133241
Frantzis, A. (1998). Does acoustic testing strand whales? Nature, 392(6671), 29.
Frid, A., & Dill, L. (2002). Human-caused disturbance stimuli as a form of predation risk. Conservation Ecology, 6(1), 11.
Fristrup, K. M., Hatch, L. T., & Clark, C. W. (2003). Variation in humpback whale (Megaptera novaean-gliae) song length in relation to low-frequency sound broadcasts. The Journal of the Acoustical Society of America, 113(6), 3411-3424. http://dx.doi.org/10.1121/ 1.1573637
Gannon, D. P., Barros, N. B., Nowacek, D. P., Read, A. J., Waples, D. M., & Wells, R. S. (2005). Prey detection by bottlenose dolphins, Tursiops truncatus: An experi-mental test of the passive listening hypothesis. Animal Behaviour, 69, 709-720. http://dx.doi.org/10.1016/j.anbehav.2004.06.020
Goldbogen, J. A., Southall, B. L., DeRuiter, S. L., Calambokidis, J., Friedlaender, A. S., Hazen, E. L., . . . Tyack, P. L. (2013). Blue whales respond to simu-lated mid-frequency military sonar. Proceedings of the Royal Society B: Biological Sciences, 280(1765). http://dx.doi.org/10.1098/rspb.2013.0657

Behavioural Responses of Cetaceans to Naval Sonar 491
Harris, C. M., Sadykova, D., DeRuiter, S. L., Tyack, P. L., Miller, P. J. O., Kvadsheim, P. H., . . . Thomas, L. (2015). Dose response severity functions for acoustic distur-bance in cetaceans using recurrent event survival analy-sis. Ecosphere (In review).
Hooker, S. K., & Baird, R. W. (1999). Deep-diving behav-iour of the northern bottlenose whale, Hyperoodon ampullatus (Cetacea: Ziphiidae). Proceedings of the Royal Society of London B, 266, 671-676. http://dx.doi.org/10.1098/rspb.1999.0688
Houser, D. S., Helweg, D. A., & Moore, P. W. B. (2001). A bandpass filter-bank model of auditory sensitivity in the humpback whale. Aquatic Mammals, 27(2), 82-91.
Isojunno, S., & Miller, P. J. O. (2015). Sperm whale response to tag boat presence: Biologically informed hidden state models quantify lost feeding opportunities. ECOSPHERE, 6(1), Article 6.
Jefferson, T. A., Stacey, P. J., & Baird, R. W. (1991). A re-view of killer whale interactions with other marine mam-mals: Predation to coexistence Mammal Review, 21(4), 151-180. http://dx.doi.org/10.1111/j.1365-2907.1991.tb0 02 91.x
Johnson, M. P., & Tyack, P. L. (2003). A digital acoustic recording tag for measuring the response of wild marine mammals to sound. IEEE Journal of Oceanic Engineering, 28, 3-12. http://dx.doi.org/10.1109/JOE.2002.808212
Kleinbaum, D. G., & Klein, M. (2005). Survival analy-sis: A self-learning text (3rd ed.). New York: Springer Science+Business Media.
Kuningas, S., Kvadsheim, P. H., Lam, F-P. A., & Miller, P. J. O. (2013). Killer whale presence in relation to naval sonar activity and prey abundance in northern Norway. ICES Journal of Marine Science, 70(7), 1287-1293. http://dx.doi.org/10.1093/icesjms/fst127
Kvadsheim, P. H, Lam, F-P. A, Miller, P. J. O., Alves, A. C., Antunes, R., Brocconcelli, A., . . . Visser, F. (2009). Cetaceans and naval sonar – The 3S-2009 cruise report (FFI report 2009/01140). Retrieved 25 September 2015 from http://rapporter.ffi.no/rapporter/2009/01140.pdf.
Kvadsheim, P. H., Lam, F-P. A., Miller, P. J. O., Doksæter, L., Visser, F., Kleivane, L., . . . Dekeling, R. (2011). Behavioural response studies of cetaceans to naval sonar signals in Norwegian waters – 3S-2011 cruise report (FFI report 2011/01289). Retrieved 25 September 2015 from http://rapporter.ffi.no/rapporter/2011/01289.pdf.
Kvadsheim, P. H., Lam, F-P. A., Miller, P. J. O., Wensveen, P., Visser, F., Sivle, L. D., . . . Dekeling, R. (2012). Behavioural responses of cetaceans to naval sonar sig-nals in Norwegian waters – The 3S-2012 cruise report (FFI-rapport 2012/02058). Retrieved 25 September 2015 from http://rapporter.ffi.no/rapporter/2012/02058.pdf.
Kvadsheim, P. H., Lam, F-P. A., Miller P. J. O., Wensveen, P., Visser, F., Sivle, L. D., . . . Dekeling, R. (2014). Behavioural responses of cetaceans to naval sonar signals – The 3S-2013 cruise report (FFI-rapport
2014/00752). Retrieved 25 September 2015 from http:// http://rapporter.ffi.no/rapporter/2014/00752.pdf.
Kvadsheim, P. H., Sivle, L. D., Miller, P. J. O., Wensveen, P., Tyack, P., Roos, M., . . . Dekeling, R. (2015). The 3S2 experiments – Studying the behavioural effects of naval sonar on northern bottlenose whales, humpback whales and minke whales (FFI-rapport 2015/01001). (In press). Retrieved 25 September 2015 from http://rapporter.ffi.no/rapporter/2015/01001.pdf.
Littell, R., Milliken, G., Stroup, W., Wolfinger, R., & Schabenberger, O. (2006). SAS for mixed models. Cary, NC: SAS Institute Inc.
Martin, S. W., Martine, C. R., Matsuyama, B. M., & Henderson, E. E. (2015). Minke whales (Balaenoptera acutorostrata) respond to navy training. The Journal of the Acoustical Society of America, 137(2533). http://dx.doi.org/10.1121/1.4919319
Maybaum, H. L. (1993). Responses of humpback whales to sonar sounds. The Journal of the Acoustical Society of America, 94(1848). http://dx.doi.org/10.1121/1.407710
McCordic, J. A., Todd, S. K., & Stevick, P. T. (2013). Differential rates of killer whale attacks on humpback whales in the North Atlantic as determined by scarifi-cation. Journal of the Marine Biological Association of the United Kingdom, 94(6), 1311-1315. http://dx.doi.org/10.1017/S0025315413001008
McDonald, M. A., Hildebrand, J. A., Wiggins, S. M., & Ross, D. (2008). A 50 year comparison of ambient ocean noise near San Clemente Island: A bathymetrically com-plex coastal region off Southern California. The Journal of the Acoustical Society of America, 124(4), 1985-1992. http://dx.doi.org/10.1121/1.2967889
Miller, P. J. O. (2006). Diversity in sound pressure levels and estimated active space of resident killer whale vocalizations. Journal of Comparative Physiology A, 192, 449-459. http://dx.doi.org/10.1007/s00359-005-00 85-2
Miller, P. J. O., Shapiro, A. D., & Deecke, V. B. (2010). The diving behaviour of mammal eating killer whales (Orcinus orca L., 1758): Variations with ecological not physiological factors. Canadian Journal of Zoology, 88, 1103-1112. http://dx.doi.org/10.1139/Z10-080
Miller, P. J. O., Biassoni, N., Samuels, A., & Tyack, P. L. (2000). Whale songs lengthen in response to sonar. Nature, 405(6789), 903. http://dx.doi.org/10.1038/ 3501 6148
Miller, P. J. O., Antunes, R., Alves, A. C., Wensveen, P., Kvadsheim, P. H., Kleivane, L., . . . Tyack, P. (2011). The 3S experiments: Studying the behavioural effects of sonar on killer whales (Orcinus orca), sperm whales (Physeter macrocephalus), and long-finned pilot whales (Globicephala melas) in Norwegian waters (Scottish Ocean Institute Technical Report SOI-2011-001). Retrieved 25 September 2015 from http://soi.st-andrews.ac.uk/documents/424.pdf.
Miller, P. J. O., Antunes, R. N., Wensveen, P. J., Samarra, F. I. P., Alves, A. C., Tyack, P. L., . . . Thomas, L. (2014). Dose-response relationships for the onset of avoidance

492 Sivle et al.
of sonar by free-ranging killer whales. The Journal of the Acoustical Society of America, 135(2), 975-993. http://dx.doi.org10.1121/1.4861346
Miller, P. J. O., Kvadsheim, P. H., Lam, F-P. A., Tyack, P. L., Curé, C., DeRuiter, S. L., . . . Hooker, S. K. (2015). Northern bottlenose whales are highly sensitive to noise disturbance. Proceedings of the Royal Society Open Science. (In press).
Miller, P. J. O., Kvadsheim, P. H., Lam, F-P. A., Wensveen, P. J., Antunes, R., Alves, A. C., . . . Sivle, L. D. (2012). The severity of behavioural changes observed during experimental exposures of killer (Orcinus orca), long-finned pilot (Globicephala melas), and sperm (Physeter macrocephalus) whales to naval sonar. Aquatic Mammals, 38(4), 362-401. http://dx.doi.org/10.1578/AM.38.4.2012.362
Moretti, D., Thomas, L., Marques, T., Harwood, J., Dilley, A., Neales, B., . . . Morrissey, R. (2014). A risk function for behavioural disruption of Blainville’s beaked whales (Mesoplodon densirostris) from mid-frequency active sonar. PLOS ONE, 9(1). http://dx.doi.org/10.1371/jour-nal.pone.0085064
Morton, A. B., & Symonds, H. K. (2002). Displacement of Orcinus orca (L.) by high amplitude sound in British Columbia, Canada. ICES Journal of Marine Science, 59(1), 71-80. http://dx.doi.org/10.1006/jmsc.2001.1136
Popper, A. N., & Ketten, D. (2008). Underwater hearing. In A. I. Bassbaum, K. Kaneko, G. M. Shepherd, & G. Westheimer (Eds.), The senses – A comprehensive refer-ence (pp. 225-236). Oxford, UK: Elsevier Press. http://dx.doi.org/10.1016/B978-012370880-9.00020-7
R Core Team. (2013). R: A language and environment for statistical computing. Vienna, Austria: R Foundation for Statistical Computing. Retrieved 25 September 2015 from www.R-project.org.
Richardson, W. J., Greene, C. R., Jr., Malme, C. I., & Thomson, D. H. (1995). Marine mammals and noise.San Diego: Academic Press.
Simon, M., Johnson, M., & Madsen, P. T. (2012). Keeping momentum with a mouthful of water: Behaviour and kinematics of humpback whale lunge feeding. Journal of Experimental Biology, 215(21), 3786-3798. http://dx.doi.org/10.1242/jeb.071092
Simpson, S. D., Meekan, M., Montgomery, J., McCauley, R., & Jeffs, A. (2005). Homeward sound. Science, 308(5719), 221. http://dx.doi.org/10.1126/science.1107 406
Sivle, L. D., Kvadsheim, P. H., Fahlman, A., Lam, F-P. A., Tyack, P. L., & Miller, P. J. O. (2012). Changes in dive behaviour during naval sonar exposure in killer whales, long-finned pilot whales, and sperm whales. Frontiers in Physiology, 3, Article 400. http://dx.doi.org/10.3389/fphys.2012.00400
Southall, B. L., Bowles, A. E., Ellison, W. T., Finneran, J. J., Gentry, R. L., Greene, C. R., Jr., . . . Tyack, P. (2007). Marine mammal noise exposure criteria: Initial scientific
recommendations. Aquatic Mammals, 33(4), 411-521. http://dx.doi.org/10.1578/AM.33.4.2007.411
Szymanski, M. D., Bain, D. E., Kiehl, K., Pennington, S., Wong, S., & Henry, K. R. (1999). Killer whale (Orcinus orca) hearing: Auditory brainstem response and behav-ioral audiograms. The Journal of the Acoustical Society of America, 106(2), 1134-1141. http://dx.doi.org/10. 1121/1.427121
Therneau, T. (2014). A package for survival analysis in S. R package, Version 2.37-7. Retrieved 25 September 2015 from http://CRAN.R-project.org/package=survival.
Tubelli, A. A., Zosuls, A., Ketten, D. R., Yamato, M., & Mountain, D. C. (2012). A prediction of the minke whale (Balaenoptera acutorostrata) middle-ear transfer func-tion. The Journal of the Acoustical Society of America, 132(5), 3263-3272. http://dx.doi.org/10.1121/1.4756950
Tyack, P. L. (2000). Dolphins whistle a signature tune. Science, 289(5483), 1310-1311. http://dx.doi.org/10.1126/science.289.5483.1310
Tyack, P. L. (2009). Human-generated sound and marine mammals. Physics Today, 62(11), 39-44. http://dx.doi.org/10.1063/1.3265235
Tyack, P. L., Gordon, J., & Thompson, D. (2004). Controlled-exposure experiments to determine the effects of noise on marine mammals. Marine Technology Society Journal, 37, 39-51.
Tyack, P. L., Zimmer, W. M. X., Moretti, D., Southall, B. L., Claridge, D. E., Durban, J. W., . . . Boyd, I. L. (2011). Beaked whales respond to simulated and actual navy sonar. PLOS ONE, 6(3). http://dx.doi.org/10.1371/ journal.pone.0017009
Visser, F., Miller, P. J. O., Antunes, R. N., Oudejans, M. G., Mackenzie, M. L., Aoki, K., . . . Tyack, P. L. (2014). The social context of individual foraging behaviour in long-finned pilot whales (Globicephala melas). Behaviour, 151(10), 1453-1477. http://dx.doi.org/10.1163/1568539X-00003195
von Benda-Beckmann, A. M., Lam, F-P. A., Moretti, D. J., Fulkerson, K., Ainslie, M. A., van IJsselmuide, S., . . . Beerens, S. P. (2010). Detection of Blainville’s beaked whales with towed arrays, Applied Acoustics, 71, 1027-1035. http://dx.doi.org/10.1016/j.apacoust.2010.05.015
Williams, R., Erbe, C., Ashe, E., Beerman, A., & Smith, J. (2014). Severity of killer whale behavioural responses to ship noise: A dose-response study. Marine Pollution Bulletin, 79(1-2), 254-260. http://dx.doi.org/10.1016/j.apacoust.2010.05.015

Behavioural Responses of Cetaceans to Naval Sonar 493
sona
r
plot
s
( fere
nt
corr
ect
assi
gn th
e data
first
to
app
roac
hes,
ol poin
t. D
etai
led
was
det
erm
ined
) dat
a LC(
are
no-s
onar
con
tr
to a
ssig
n a
corr
espo
ndin
g th
resh
old
for m
axim
um
expo
sure
type
s ex
posu
re Ea
ch se
ssio
n m
ay h
ave
seve
ral s
core
s for
dif
whe
ther
a c
hang
e in
beh
avio
r was
a re
spon
se to
the
the
and , r
espe
ctiv
ely)
.
the
scor
e as
a lo
w c
onfid
ence
tag,
th
e nois
e PB
ID o
f a
nd
AA
ppen
dix th
e kw
PBis
id
Ex
p (m
n).
)no
vaea
nglia
e of th
e on
set o
f the
sco
red
resp
onse
was
det
erm
ined
of th
e du
ratio
n w
ith c
erta
inty
re
spon
se v
s the
to
det
erm
ine
of th
e fic
ult
dura
tion
The
, it w
as d
if).
cum sc
ored
it a
s a re
spon
se b
ut m
arke
d
(SEL
timin
g le
vel
able
1. O
ccas
iona
lly
al.
(201
5).
Meg
apte
ra
Tin
( soun
d ex
posu
re
wha
les
the
sona
r exp
osur
es, t
he e
xact
cu
mul
ativ
e w
ith th
e cr
iteria
an
d in
thes
e ca
ses,
we
caut
ious
ly
hum
pbac
k
cha
nge;
) and
m
ax
for
. For
all
(SPL
deta
ils
or a
coi
ncid
enta
l
scor
e ) s
onar
exp
osur
es, a
nd k
iller
wha
le so
und
and
broa
dban
d no
ise
play
back
s (2
Sev
erity
so
nar
able
AI.
or s
econ
d (
T 1) type
s of
cha
nges
in b
ehav
ior
leve
l so
und
pres
sure
cond
ition
rece
ived
se
verit
y sc
ore
to th
e re
spon
se in
acc
orda
nce
expe
rimen
tal
that
wer
e us
ed a
s the
bas
is fo
r the
scor
ing
can
be fo
und
in K
vads
heim
et
Tim
e of
D
urat
ion
of
chan
gepo
int
resp
onse
/ SP
Lmax
SELc
um
Exp
idSc
ore
Beh
avio
ral r
espo
nse
and
just
ifica
tion
(UTC
)ex
posu
re (m
in)
dB re
1 μ
PadB
re 1
μPa
2 s
mn1
1_15
7ano
-son
ar c
ontro
l0
No
resp
onse
– N
o ob
serv
ed c
hang
e in
beh
avio
r.
mn1
1_15
7a
sona
r 14
Brie
f avo
idan
ce –
The
ani
mal
turn
ed a
way
from
the
sour
ce b
riefly
but
retu
rned
to
norm
al sp
eed,
dire
ctne
ss, a
nd c
ours
e. T
he e
xact
tim
ing
of th
e tu
rn w
as d
eter
min
ed fr
om
the
pseu
dotra
ck.
09:2
3:27
5/10
102
97
mn1
1_15
7a
sona
r 10
No
resp
onse
– U
nusu
al d
eep
dive
with
wig
gles
but
not
con
side
red
a re
spon
se b
ecau
se
this
type
of d
ive
was
com
mon
in th
e ba
selin
e pe
riod.
mn1
1_15
7a
sona
r 20
No
resp
onse
– U
nusu
al d
eep
dive
s with
wig
gles
but
not
con
side
red
a re
spon
se b
ecau
se
this
type
of d
ive
was
com
mon
in th
e ba
selin
e pe
riod.
mn1
1_15
7a
sona
r 20
No
resp
onse
– T
here
was
a sm
all d
evia
tion
in th
e ho
rizon
tal t
rack
of t
he a
nim
al, b
ut
this
was
not
con
side
red
to b
e a
resp
onse
.
mn1
1_15
7akw
PB5
Min
or a
void
ance
of s
ound
sour
ce –
The
ani
mal
cha
nged
cou
rse
by 9
0° a
way
from
the
sour
ce b
ut re
turn
ed to
its o
rigin
al c
ours
e in
the
end
of th
e pl
ayba
ck7.
5/10
mn1
1_15
7akw
PB2
Brie
f cha
nge
in d
ive
prof
ile –
Wig
gles
in th
e di
ve in
the
mid
dle
of e
xpos
ure.
5/10
mn1
1_15
7ano
ise
PB6
Mod
erat
e av
oida
nce
of so
und
sour
ce –
The
ani
mal
turn
ed 9
0° a
way
from
the
sour
ce
and
retu
rned
to it
s orig
inal
cou
rse.
20-3
0/10
mn1
1_15
8ab
no-s
onar
con
trol
3M
inor
cha
nge
in lo
com
otio
n –
Cha
nge
in d
irect
ion
and
dire
ctne
ss, a
nd d
rop
in sp
eed,
bu
t no
avoi
danc
e re
spon
se.
6/10
mn1
1_16
0ab
no-s
onar
con
trol
3M
inor
cha
nge
in lo
com
otio
n –
The
anim
al sl
owed
dow
n du
ring
expo
sure
.4-
5/10
mn1
1_16
0ab
sona
r 10
No
resp
onse
– C
hang
e in
div
e pr
ofile
, but
sim
ilar c
hang
es a
lso
occu
rred
freq
uent
ly
durin
g ba
selin
e.
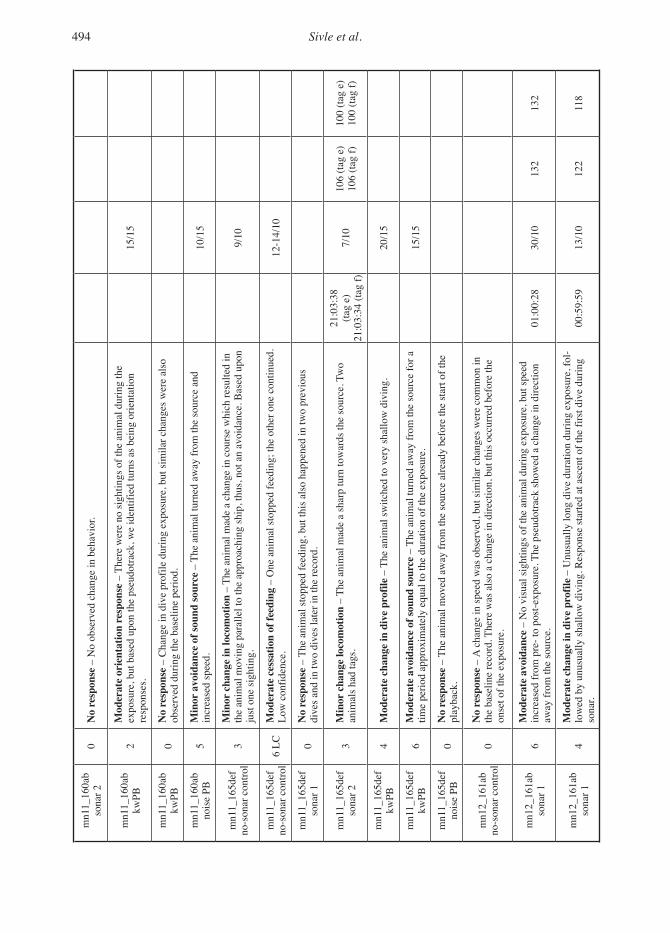
494 Sivle et al.
mn1
1_16
0ab
sona
r 20
No
resp
onse
– N
o ob
serv
ed c
hang
e in
beh
avio
r.
mn1
1_16
0ab
kwPB
2M
oder
ate
orie
ntat
ion
resp
onse
– T
here
wer
e no
sigh
tings
of t
he a
nim
al d
urin
g th
e ex
posu
re, b
ut b
ased
upo
n th
e ps
eudo
track
, we
iden
tifie
d tu
rns a
s bei
ng o
rient
atio
n re
spon
ses.
15/1
5
mn1
1_16
0ab
kwPB
0N
o re
spon
se –
Cha
nge
in d
ive
prof
ile d
urin
g ex
posu
re, b
ut si
mila
r cha
nges
wer
e al
so
obse
rved
dur
ing
the
base
line
perio
d.
mn1
1_16
0ab
nois
e PB
5M
inor
avo
idan
ce o
f sou
nd so
urce
– T
he a
nim
al tu
rned
aw
ay fr
om th
e so
urce
and
in
crea
sed
spee
d.
10/1
5
mn1
1_16
5def
no-s
onar
con
trol
3M
inor
cha
nge
in lo
com
otio
n –
The
anim
al m
ade
a ch
ange
in c
ours
e w
hich
resu
lted
in
the
anim
al m
ovin
g pa
ralle
l to
the
appr
oach
ing
ship
, thu
s, no
t an
avoi
danc
e. B
ased
upo
n ju
st o
ne si
ghtin
g.9/
10
mn1
1_16
5def
no-s
onar
con
trol
6 LC
Mod
erat
e ce
ssat
ion
of fe
edin
g –
One
ani
mal
stop
ped
feed
ing;
the
othe
r one
con
tinue
d.
Low
con
fiden
ce.
12-1
4/10
mn1
1_16
5def
so
nar 1
0N
o re
spon
se –
The
ani
mal
stop
ped
feed
ing,
but
this
als
o ha
ppen
ed in
two
prev
ious
di
ves a
nd in
two
dive
s lat
er in
the
reco
rd.
mn1
1_16
5def
so
nar 2
3M
inor
cha
nge
loco
mot
ion
– Th
e an
imal
mad
e a
shar
p tu
rn to
war
ds th
e so
urce
. Tw
o an
imal
s had
tags
.
21:0
3:38
(ta
g e)
21
:03:
34 (t
ag f)
7/10
106
(tag
e)
106
(tag
f)10
0 (ta
g e)
10
0 (ta
g f)
mn1
1_16
5def
kwPB
4M
oder
ate
chan
ge in
div
e pr
ofile
– T
he a
nim
al sw
itche
d to
ver
y sh
allo
w d
ivin
g.20
/15
mn1
1_16
5def
kwPB
6M
oder
ate
avoi
danc
e of
soun
d so
urce
– T
he a
nim
al tu
rned
aw
ay fr
om th
e so
urce
for a
tim
e pe
riod
appr
oxim
atel
y eq
ual t
o th
e du
ratio
n of
the
expo
sure
.15
/15
mn1
1_16
5def
nois
e PB
0N
o re
spon
se –
The
ani
mal
mov
ed a
way
from
the
sour
ce a
lread
y be
fore
the
star
t of t
he
play
back
.
mn1
2_16
1ab
no-s
onar
con
trol
0N
o re
spon
se –
A c
hang
e in
spee
d w
as o
bser
ved,
but
sim
ilar c
hang
es w
ere
com
mon
in
the
base
line
reco
rd. T
here
was
als
o a
chan
ge in
dire
ctio
n, b
ut th
is o
ccur
red
befo
re th
e on
set o
f the
exp
osur
e.
mn1
2_16
1ab
sona
r 16
Mod
erat
e av
oida
nce
– N
o vi
sual
sigh
tings
of t
he a
nim
al d
urin
g ex
posu
re, b
ut sp
eed
incr
ease
d fr
om p
re- t
o po
st-e
xpos
ure.
The
pse
udot
rack
show
ed a
cha
nge
in d
irect
ion
away
from
the
sour
ce.
01:0
0:28
30/1
013
213
2
mn1
2_16
1ab
sona
r 14
Mod
erat
e ch
ange
in d
ive
prof
ile –
Unu
sual
ly lo
ng d
ive
dura
tion
durin
g ex
posu
re, f
ol-
low
ed b
y un
usua
lly sh
allo
w d
ivin
g. R
espo
nse
star
ted
at a
scen
t of t
he fi
rst d
ive
durin
g so
nar.
00:5
9:59
13/1
012
211
8

Behavioural Responses of Cetaceans to Naval Sonar 495
mn1
2_16
1ab
sona
r 2
(no-
ram
p-up
)2
Brie
f cha
nge
in d
ive
prof
ile –
The
ani
mal
abo
rted
a di
ve a
t the
star
t of t
he e
xpos
ure,
bu
t the
div
es th
at fo
llow
ed a
ppea
red
norm
al.
02:2
7:59
1/5
159
156
mn1
2_16
1ab
nois
e PB
0N
o re
spon
se –
The
ani
mal
mad
e a
turn
aw
ay fr
om th
e so
urce
, but
the
pseu
dotra
ck
reve
aled
that
this
hap
pene
d be
fore
the
star
t of t
he p
layb
ack.
mn1
2_16
1ab
kwPB
7 LC
Prol
onge
d ce
ssat
ion
of fe
edin
g –
Low
con
fiden
ce b
ecau
se fe
edin
g in
bas
elin
e w
as
som
ewha
t int
erm
itten
t. Ta
g of
f 51
min
afte
r res
pons
e st
arte
d, b
ut ju
dged
pro
long
ed.
> 50
/15
mn1
2_16
1ab
kwPB
6M
oder
ate
avoi
danc
e –
The
anim
al m
ade
a sh
arp
turn
aw
ay fr
om th
e so
urce
. 45
/15
mn1
2_16
1ab
kwPB
3M
inor
cha
nge
in d
ive
prof
ile –
Lon
g ab
norm
al d
ive
at th
e st
art o
f the
pla
ybac
k.6/
15
mn1
2_16
4ano
-son
ar c
ontro
l0
No
resp
onse
– N
o ob
serv
ed c
hang
es in
beh
avio
r.
mn1
2_16
4aso
nar 1
6 LC
Prol
onge
d ch
ange
in in
ter-
anim
al d
istri
butio
n –
Gro
up sp
acin
g of
ani
mal
s in
the
area
cha
nged
. Thi
s res
pons
e w
as c
onsi
sten
t with
oth
er c
hang
es in
mov
emen
t, bu
t exa
ct
timin
g w
as d
iffic
ult t
o de
term
ine.
It m
ay h
ave
occu
rred
bef
ore
sona
r ons
et. W
e co
nsid
er
this
to b
e a
resp
onse
but
hav
e lo
w c
onfid
ence
that
it a
ctua
lly w
as in
resp
onse
to th
e so
nar.
We
cons
ider
that
the
resp
onse
star
ted
at th
e fir
st su
rfac
ing
afte
r the
star
t of t
he
expo
sure
.
00:0
1:49
100/
1014
213
8
mn1
2_16
4aso
nar 1
6M
oder
ate
avoi
danc
e –
The
anim
al c
hang
ed d
irect
ion
away
from
the
sour
ce b
ut
retu
rned
to p
revi
ous c
ours
e. T
he re
spon
se w
as c
onsi
dere
d to
star
t at t
he fi
rst s
urfa
cing
af
ter s
onar
ons
et.
01:0
1:49
20/1
014
213
8
mn1
2_16
4aso
nar 1
6M
oder
ate
cess
atio
n of
feed
ing
– Lu
ngin
g (f
orag
ing)
act
ivity
stop
ped
soon
afte
r son
ar
onse
t. Th
e re
spon
se w
as c
onsi
dere
d to
star
t dur
ing
the
first
div
e af
ter t
he so
nar o
nset
w
hen
anim
al re
ache
d th
e av
erag
e de
pth
of lu
nges
in p
revi
ous d
ives
.00
:01:
1320
/10
125
119
mn1
2_16
4aso
nar 1
5Ex
tend
ed c
hang
e in
div
e pr
ofile
– S
witc
hed
to sh
allo
w d
ivin
g du
ring
expo
sure
but
re
turn
ed to
pre
-exp
osur
e di
ve b
ehav
ior.
The
resp
onse
was
con
side
red
to st
art a
t the
be
ginn
ing
of th
e fir
st sh
allo
w d
ive
afte
r the
sona
r ons
et.
01:0
1:27
20/1
012
511
9
mn1
2_16
4aso
nar 2
(no-
ram
p-up
)0
No
resp
onse
– N
o ob
serv
ed c
hang
es in
beh
avio
r.
mn1
2_16
4aso
nar 2
(n
o-ra
mp-
up)
3M
inor
cha
nge
in lo
com
otio
n –
The
anim
al tu
rned
tow
ards
the
sour
ce a
nd c
hang
ed
dire
ctne
ss a
t son
ar o
nset
. 01
:43:
004/
517
017
0
mn1
2_16
4aso
nar 2
(no-
ram
p-up
)4
Brie
f ces
satio
n of
feed
ing
– C
essa
tion
of lu
ngin
g co
inci
ded
exac
tly w
ith th
e du
ratio
n of
the
sona
r exp
osur
e. T
he o
nset
of t
he re
spon
se w
as d
urin
g th
e fir
st d
ive
of th
e ex
po-
sure
whe
n th
e an
imal
reac
hed
the
feed
ing
dept
h of
pre
viou
s div
es; t
he e
ffect
onl
y la
sted
du
ring
that
div
e.
01:4
3:06
5/5
170
170
mn1
2_16
4bno
ise
PB0
No
resp
onse
– N
o ob
serv
ed c
hang
es in
beh
avio
r.
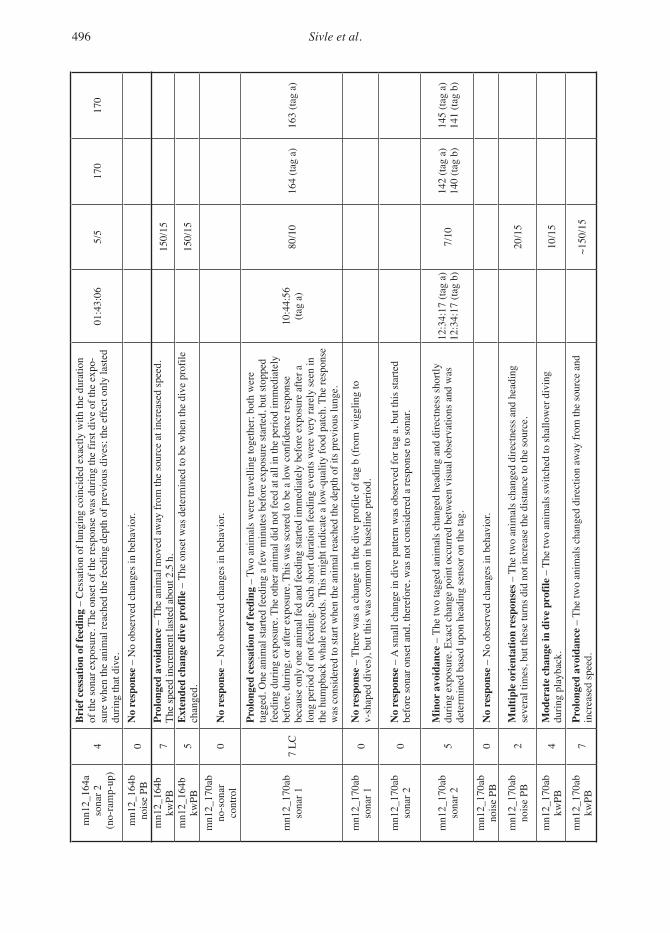
496 Sivle et al.
mn1
2_16
4aso
nar 2
(no-
ram
p-up
)4
Brie
f ces
satio
n of
feed
ing
– C
essa
tion
of lu
ngin
g co
inci
ded
exac
tly w
ith th
e du
ratio
n of
the
sona
r exp
osur
e. T
he o
nset
of t
he re
spon
se w
as d
urin
g th
e fir
st d
ive
of th
e ex
po-
sure
whe
n th
e an
imal
reac
hed
the
feed
ing
dept
h of
pre
viou
s div
es; t
he e
ffect
onl
y la
sted
du
ring
that
div
e.
01:4
3:06
5/5
170
170
mn1
2_16
4bno
ise
PB0
No
resp
onse
– N
o ob
serv
ed c
hang
es in
beh
avio
r.
mn1
2_16
4bkw
PB7
Prol
onge
d av
oida
nce
– Th
e an
imal
mov
ed a
way
from
the
sour
ce a
t inc
reas
ed sp
eed.
Th
e sp
eed
incr
emen
t las
ted
abou
t 2.5
h.
150/
15
mn1
2_16
4bkw
PB5
Exte
nded
cha
nge
dive
pro
file
– Th
e on
set w
as d
eter
min
ed to
be
whe
n th
e di
ve p
rofil
e ch
ange
d.15
0/15
mn1
2_17
0ab
no-s
onar
co
ntro
l0
No
resp
onse
– N
o ob
serv
ed c
hang
es in
beh
avio
r.
mn1
2_17
0ab
sona
r 17
LC
Prol
onge
d ce
ssat
ion
of fe
edin
g –
Two
anim
als w
ere
trave
lling
toge
ther
; bot
h w
ere
tagg
ed. O
ne a
nim
al st
arte
d fe
edin
g a
few
min
utes
bef
ore
expo
sure
star
ted,
but
stop
ped
feed
ing
durin
g ex
posu
re. T
he o
ther
ani
mal
did
not
feed
at a
ll in
the
perio
d im
med
iate
ly
befo
re, d
urin
g, o
r afte
r exp
osur
e. T
his w
as sc
ored
to b
e a
low
con
fiden
ce re
spon
se
beca
use
only
one
ani
mal
fed
and
feed
ing
starte
d im
med
iate
ly b
efor
e ex
posu
re a
fter a
lo
ng p
erio
d of
not
feed
ing.
Suc
h sh
ort d
urat
ion
feed
ing
even
ts w
ere
very
rare
ly se
en in
th
e hu
mpb
ack
wha
le re
cord
s. Th
is m
ight
indi
cate
a lo
w-q
ualit
y fo
od p
atch
. The
resp
onse
w
as c
onsid
ered
to st
art w
hen
the
anim
al re
ache
d th
e de
pth
of it
s pre
viou
s lun
ge.
10:4
4:56
(ta
g a)
80/1
016
4 (ta
g a)
163
(tag
a)
mn1
2_17
0ab
sona
r 10
No
resp
onse
– T
here
was
a c
hang
e in
the
dive
pro
file
of ta
g b
(fro
m w
iggl
ing
to
v-sh
aped
div
es),
but t
his w
as c
omm
on in
bas
elin
e pe
riod.
mn1
2_17
0ab
sona
r 20
No
resp
onse
– A
smal
l cha
nge
in d
ive
patte
rn w
as o
bser
ved
for t
ag a
, but
this
star
ted
befo
re so
nar o
nset
and
, the
refo
re, w
as n
ot c
onsi
dere
d a
resp
onse
to so
nar.
mn1
2_17
0ab
sona
r 25
Min
or a
void
ance
– T
he tw
o ta
gged
ani
mal
s cha
nged
hea
ding
and
dire
ctne
ss sh
ortly
du
ring
expo
sure
. Exa
ct c
hang
e po
int o
ccur
red
betw
een
visu
al o
bser
vatio
ns a
nd w
as
dete
rmin
ed b
ased
upo
n he
adin
g se
nsor
on
the
tag.
12:3
4:17
(tag
a)
12:3
4:17
(tag
b)
7/10
142
(tag
a)14
0 (ta
g b)
145
(tag
a)14
1 (ta
g b)
mn1
2_17
0ab
nois
e PB
0N
o re
spon
se –
No
obse
rved
cha
nges
in b
ehav
ior.
mn1
2_17
0ab
nois
e PB
2M
ultip
le o
rien
tatio
n re
spon
ses –
The
two
anim
als c
hang
ed d
irect
ness
and
hea
ding
se
vera
l tim
es, b
ut th
ese
turn
s did
not
incr
ease
the
dist
ance
to th
e so
urce
.20
/15
mn1
2_17
0ab
kwPB
4M
oder
ate
chan
ge in
div
e pr
ofile
– T
he tw
o an
imal
s sw
itche
d to
shal
low
er d
ivin
g du
ring
play
back
.10
/15
mn1
2_17
0ab
kwPB
7Pr
olon
ged
avoi
danc
e –
The
two
anim
als c
hang
ed d
irect
ion
away
from
the
sour
ce a
nd
incr
ease
d sp
eed.
~1
50/1
5
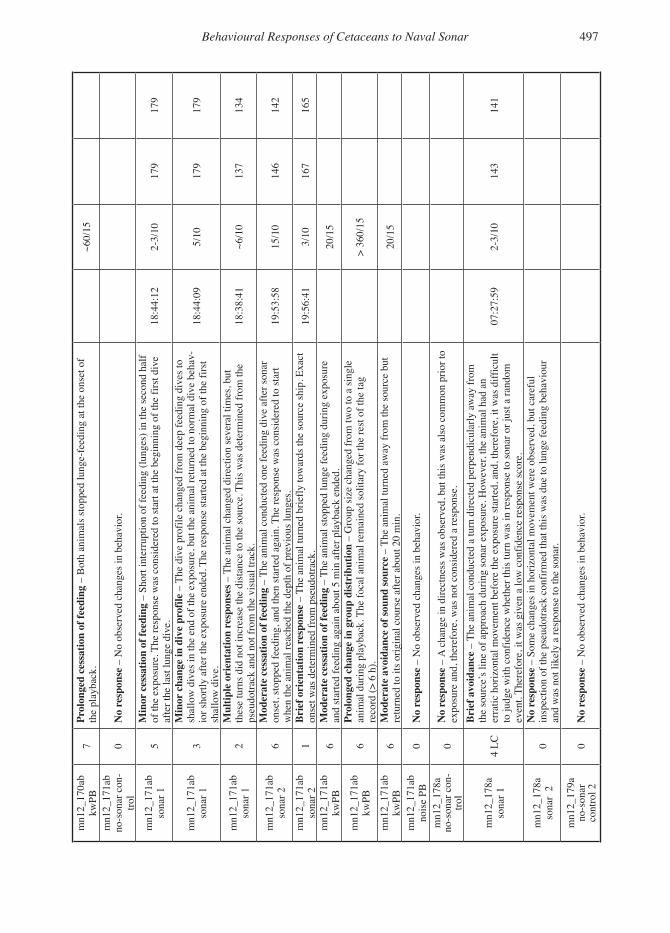
Behavioural Responses of Cetaceans to Naval Sonar 497
mn1
2_17
0ab
kwPB
7Pr
olon
ged
cess
atio
n of
feed
ing
– B
oth
anim
als s
topp
ed lu
nge-
feed
ing
at th
e on
set o
f th
e pl
ayba
ck.
~60/
15
mn1
2_17
1ab
no-s
onar
con
-tro
l0
No
resp
onse
– N
o ob
serv
ed c
hang
es in
beh
avio
r.
mn1
2_17
1ab
sona
r 15
Min
or c
essa
tion
of fe
edin
g –
Shor
t int
erru
ptio
n of
feed
ing
(lung
es) i
n th
e se
cond
hal
f of
the
expo
sure
. The
resp
onse
was
con
side
red
to st
art a
t the
beg
inni
ng o
f the
firs
t div
e af
ter t
he la
st lu
nge
dive
. 18
:44:
122-
3/10
179
179
mn1
2_17
1ab
sona
r 13
Min
or c
hang
e in
div
e pr
ofile
– T
he d
ive
prof
ile c
hang
ed fr
om d
eep
feed
ing
dive
s to
shal
low
div
es in
the
end
of th
e ex
posu
re, b
ut th
e an
imal
retu
rned
to n
orm
al d
ive
beha
v-io
r sho
rtly
afte
r the
exp
osur
e en
ded.
The
resp
onse
star
ted
at th
e be
ginn
ing
of th
e fir
st
shal
low
div
e.
18:4
4:09
5/10
179
179
mn1
2_17
1ab
sona
r 12
Mul
tiple
ori
enta
tion
resp
onse
s – T
he a
nim
al c
hang
ed d
irect
ion
seve
ral t
imes
, but
th
ese
turn
s did
not
incr
ease
the
dist
ance
to th
e so
urce
. Thi
s was
det
erm
ined
from
the
pseu
dotra
ck a
nd n
ot fr
om th
e vi
sual
trac
k.
18:3
8:41
~6/1
013
713
4
mn1
2_17
1ab
sona
r 26
Mod
erat
e ce
ssat
ion
of fe
edin
g –
The
anim
al c
ondu
cted
one
feed
ing
dive
afte
r son
ar
onse
t, st
oppe
d fe
edin
g, a
nd th
en st
arte
d ag
ain.
The
resp
onse
was
con
side
red
to st
art
whe
n th
e an
imal
reac
hed
the
dept
h of
pre
viou
s lun
ges.
19:5
3:58
15/1
014
614
2
mn1
2_17
1ab
sona
r 21
Brie
f ori
enta
tion
resp
onse
– T
he a
nim
al tu
rned
brie
fly to
war
ds th
e so
urce
ship
. Exa
ct
onse
t was
det
erm
ined
from
pse
udot
rack
.19
:56:
413/
1016
716
5
mn1
2_17
1ab
kwPB
6M
oder
ate
cess
atio
n of
feed
ing
– Th
e an
imal
stop
ped
lung
e fe
edin
g du
ring
expo
sure
an
d st
arte
d fe
edin
g ag
ain
abou
t 5 m
in a
fter p
layb
ack
ende
d.20
/15
mn1
2_17
1ab
kwPB
6Pr
olon
ged
chan
ge in
gro
up d
istri
butio
n –
Gro
up si
ze c
hang
ed fr
om tw
o to
a si
ngle
an
imal
dur
ing
play
back
. The
foca
l ani
mal
rem
aine
d so
litar
y fo
r the
rest
of t
he ta
g re
cord
(> 6
h).
> 36
0/15
mn1
2_17
1ab
kwPB
6M
oder
ate
avoi
danc
e of
soun
d so
urce
– T
he a
nim
al tu
rned
aw
ay fr
om th
e so
urce
but
re
turn
ed to
its o
rigin
al c
ours
e af
ter a
bout
20
min
.20
/15
mn1
2_17
1ab
nois
e PB
0N
o re
spon
se –
No
obse
rved
cha
nges
in b
ehav
ior.
mn1
2_17
8ano
-son
ar c
on-
trol
0N
o re
spon
se –
A c
hang
e in
dire
ctne
ss w
as o
bser
ved,
but
this
was
als
o co
mm
on p
rior t
o ex
posu
re a
nd, t
here
fore
, was
not
con
side
red
a re
spon
se.
mn1
2_17
8aso
nar 1
4 LC
Brie
f avo
idan
ce –
The
ani
mal
con
duct
ed a
turn
dire
cted
per
pend
icul
arly
aw
ay fr
om
the
sour
ce’s
line
of a
ppro
ach
durin
g so
nar e
xpos
ure.
How
ever
, the
ani
mal
had
an
erra
tic h
oriz
onta
l mov
emen
t bef
ore
the
expo
sure
star
ted,
and
, the
refo
re, i
t was
diff
icul
t to
judg
e w
ith c
onfid
ence
whe
ther
this
turn
was
in re
spon
se to
sona
r or j
ust a
rand
om
even
t. Th
eref
ore,
it w
as g
iven
a lo
w c
onfid
ence
resp
onse
scor
e.
07:2
7:59
2-3/
1014
314
1
mn1
2_17
8aso
nar
20
No
resp
onse
– S
ome
chan
ges i
n ho
rizon
tal m
ovem
ent w
ere
obse
rved
, but
car
eful
in
spec
tion
of th
e ps
eudo
track
con
firm
ed th
at th
is w
as d
ue to
lung
e fe
edin
g be
havi
our
and
was
not
like
ly a
resp
onse
to th
e so
nar.
mn1
2_17
9ano
-son
ar
cont
rol 2
0N
o re
spon
se –
No
obse
rved
cha
nges
in b
ehav
ior.
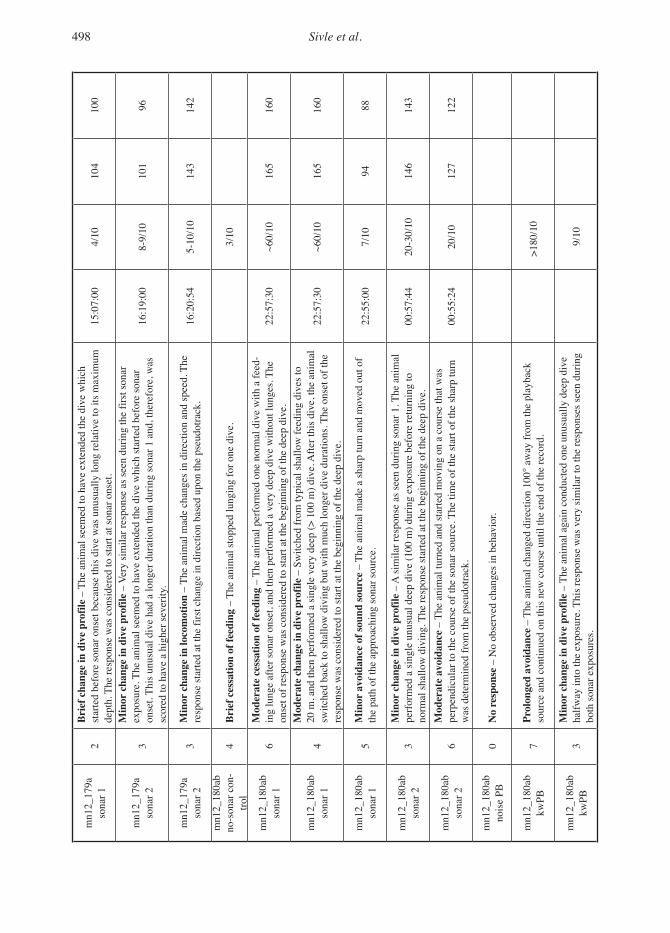
498 Sivle et al.
mn1
2_17
9aso
nar 1
2Br
ief c
hang
e in
div
e pr
ofile
– T
he a
nim
al se
emed
to h
ave
exte
nded
the
dive
whi
ch
star
ted
befo
re so
nar o
nset
bec
ause
this
div
e w
as u
nusu
ally
long
rela
tive
to it
s max
imum
de
pth.
The
resp
onse
was
con
side
red
to st
art a
t son
ar o
nset
. 15
:07:
004/
1010
410
0
mn1
2_17
9aso
nar 2
3
Min
or c
hang
e in
div
e pr
ofile
– V
ery
sim
ilar r
espo
nse
as se
en d
urin
g th
e fir
st so
nar
expo
sure
. The
ani
mal
seem
ed to
hav
e ex
tend
ed th
e di
ve w
hich
star
ted
befo
re so
nar
onse
t. Th
is u
nusu
al d
ive
had
a lo
nger
dur
atio
n th
an d
urin
g so
nar 1
and
, the
refo
re, w
as
scor
ed to
hav
e a
high
er se
verit
y.
16:1
9:00
8-9/
1010
196
mn1
2_17
9aso
nar 2
3M
inor
cha
nge
in lo
com
otio
n –
The
anim
al m
ade
chan
ges i
n di
rect
ion
and
spee
d. T
he
resp
onse
star
ted
at th
e fir
st c
hang
e in
dire
ctio
n ba
sed
upon
the
pseu
dotra
ck.
16:2
0:54
5-10
/10
143
142
mn1
2_18
0ab
no-s
onar
con
-tro
l4
Brie
f ces
satio
n of
feed
ing
– Th
e an
imal
stop
ped
lung
ing
for o
ne d
ive.
3/10
mn1
2_18
0ab
sona
r 16
Mod
erat
e ce
ssat
ion
of fe
edin
g –
The
anim
al p
erfo
rmed
one
nor
mal
div
e w
ith a
feed
-in
g lu
nge
afte
r son
ar o
nset
, and
then
per
form
ed a
ver
y de
ep d
ive
with
out l
unge
s. Th
e on
set o
f res
pons
e w
as c
onsi
dere
d to
star
t at t
he b
egin
ning
of t
he d
eep
dive
.22
:57:
30~6
0/10
165
160
mn1
2_18
0ab
sona
r 14
Mod
erat
e ch
ange
in d
ive
prof
ile –
Sw
itche
d fr
om ty
pica
l sha
llow
feed
ing
dive
s to
20 m
, and
then
per
form
ed a
sing
le v
ery
deep
(> 1
00 m
) div
e. A
fter t
his d
ive,
the
anim
al
switc
hed
back
to sh
allo
w d
ivin
g bu
t with
muc
h lo
nger
div
e du
ratio
ns. T
he o
nset
of t
he
resp
onse
was
con
side
red
to st
art a
t the
beg
inni
ng o
f the
dee
p di
ve.
22:5
7:30
~60/
1016
516
0
mn1
2_18
0ab
sona
r 15
Min
or a
void
ance
of s
ound
sour
ce –
The
ani
mal
mad
e a
shar
p tu
rn a
nd m
oved
out
of
the
path
of t
he a
ppro
achi
ng so
nar s
ourc
e.
22:5
5:00
7/10
9488
mn1
2_18
0ab
sona
r 23
Min
or c
hang
e in
div
e pr
ofile
– A
sim
ilar r
espo
nse
as se
en d
urin
g so
nar 1
. The
ani
mal
pe
rfor
med
a si
ngle
unu
sual
dee
p di
ve (1
00 m
) dur
ing
expo
sure
bef
ore
retu
rnin
g to
no
rmal
shal
low
div
ing.
The
resp
onse
star
ted
at th
e be
ginn
ing
of th
e de
ep d
ive.
00:5
7:44
20-3
0/10
146
143
mn1
2_18
0ab
sona
r 26
Mod
erat
e av
oida
nce
– Th
e an
imal
turn
ed a
nd st
arte
d m
ovin
g on
a c
ours
e th
at w
as
perp
endi
cula
r to
the
cour
se o
f the
sona
r sou
rce.
The
tim
e of
the
star
t of t
he sh
arp
turn
w
as d
eter
min
ed fr
om th
e ps
eudo
track
.00
:55:
2420
/10
127
122
mn1
2_18
0ab
nois
e PB
0N
o re
spon
se –
No
obse
rved
cha
nges
in b
ehav
ior.
mn1
2_18
0ab
kwPB
7Pr
olon
ged
avoi
danc
e –
The
anim
al c
hang
ed d
irect
ion
100°
aw
ay fr
om th
e pl
ayba
ck
sour
ce a
nd c
ontin
ued
on th
is n
ew c
ours
e un
til th
e en
d of
the
reco
rd.
>1
80/1
0
mn1
2_18
0ab
kwPB
3M
inor
cha
nge
in d
ive
prof
ile –
The
ani
mal
aga
in c
ondu
cted
one
unu
sual
ly d
eep
dive
ha
lfway
into
the
expo
sure
. Thi
s res
pons
e w
as v
ery
sim
ilar t
o th
e re
spon
ses s
een
durin
g bo
th so
nar e
xpos
ures
.
9
/10

Behavioural Responses of Cetaceans to Naval Sonar 499
. Eac
h a as
sign
to
as
the
basi
s fo
r the
r con
trol a
nd s
onar
) (ba
). Ex
p id
is th
e ID
of t
he ta
g, a
nd th
e ex
posu
re ty
pes
are
no-s
ona w
as d
eter
min
ed
resp
onse
sc
ored
th
e Th
e du
ratio
n of
the
resp
onse
vs t
he d
urat
ion
data
plo
ts th
at w
ere
used
of
onse
t th
e of
tim
e Tabl
e 1.
Det
aile
d
exac
t ) t
hres
hold
s of t
he re
spon
se.
with
the
crite
ria in
cu
m
the
(SEL
expo
sure
s, so
nar
the
ostr
ata
For a
ll soun
d ex
posu
re le
vel
Bala
enop
tera
acu
tor
. be
havi
orin
) a
nd c
umul
ativ
e ch
ange
s max
(SPL
of se
verit
y sc
ore
to th
e re
spon
se in
acc
orda
nce
sco
re d
etai
ls fo
r the
min
ke w
hale
(ty
pes
fere
nt
dif
soun
d pr
essu
re le
vel
to a
ssig
n th
e co
rrec
t a
l. (2
015)
.
for
scor
es
rece
ived
se
vera
l S
ever
ityha
ve
AII
.ab
le
T sess
ion
may
co
rres
pond
ing
max
imum
of
the
expo
sure
was
det
erm
ined
sc
orin
g ca
n be
foun
d in
Kva
dshe
im e
t
Exp
idSc
ore
Beh
avio
ral r
espo
nse
and
just
ifica
tion
Tim
e of
ch
ange
poin
t (U
TC)
Dur
atio
n of
re
spon
se /
expo
sure
(m
in)
SPLm
ax
dB re
1
μPa
SELc
um
dB re
1
μPa
2 s
ba11
_180
ano
-son
ar
cont
rol
0N
o re
spon
se –
The
ani
mal
cha
nged
hea
ding
mul
tiple
tim
es, b
ut th
is w
as a
lso
com
mon
du
ring
the
base
line
perio
d.
ba11
_180
ano
-son
ar
cont
rol
2Br
ief c
hang
e in
div
e pr
ofile
– T
he a
nim
al c
ondu
cted
an
unus
ual d
eep
dive
nea
r the
end
of
the
expo
sure
.3/
42
ba11
_180
aso
nar
2Br
ief c
hang
e in
div
e pr
ofile
–Th
e an
imal
cha
nged
its d
ive
patte
rn a
t son
ar o
nset
from
ve
ry sh
allo
w d
ivin
g (0
to 5
m) t
o di
ving
into
the
soun
d ch
anne
l at a
roun
d 50
m d
epth
. Thi
s be
havi
or c
ould
be
a po
ssib
le a
ttem
pt to
impr
ove
the
loca
lizat
ion
of th
e so
und
sour
ce.
02:2
0:00
5/70
8383
ba11
_180
aso
nar
7
Prol
onge
d av
oida
nce
– Th
e an
imal
incr
ease
d sp
eed
and
swam
dire
ctly
aw
ay fr
om th
e so
und
sour
ce th
roug
hout
the
rest
of t
he e
xpos
ure.
Opp
ortu
nist
ic v
isua
l obs
erva
tions
of s
kim
feed
-in
g at
the
surf
ace
befo
re th
e st
art o
f the
sona
r exp
osur
e in
dica
ted
that
this
resp
onse
mig
ht
also
hav
e in
volv
ed a
ces
satio
n of
feed
ing.
The
star
t of t
he re
spon
se w
as ta
ken
as th
e tim
e of
the
first
sigh
ting
at w
hich
the
anim
al h
ad in
crea
sed
spee
d an
d sw
am a
t a c
ours
e di
rect
ly
away
from
the
sour
ce.
02:2
9:15
> 18
0/70
146
155
ba11
_180
aso
nar
8
Obv
ious
ave
rsio
n an
d se
nsiti
zatio
n –
The
anim
al w
as sw
imm
ing
at v
ery
high
and
incr
eas-
ing
spee
d th
roug
hout
the
expo
sure
per
iod.
Abo
ut h
alfw
ay in
to e
xpos
ure,
it c
hang
ed it
s div
e pa
ttern
to sh
allo
wer
div
es a
nd in
crea
sed
spee
d fu
rther
, pre
sum
ably
to a
void
the
sour
ce m
ore
effic
ient
ly. T
his c
hang
e in
div
e be
havi
or w
as c
onsi
dere
d to
be
the
onse
t of t
he re
spon
se.
02:5
6:35
40/7
015
817
1
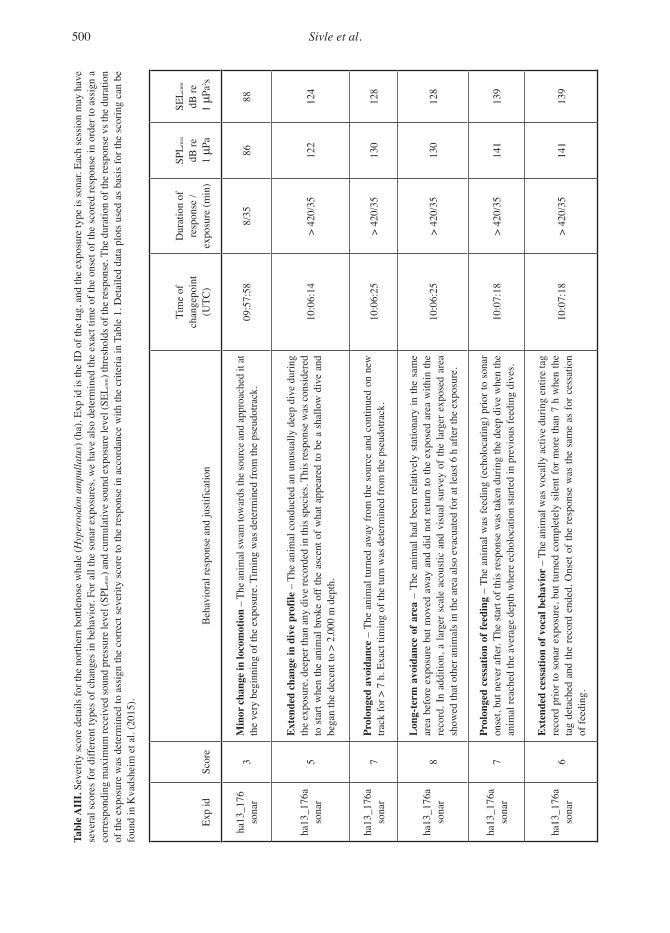
500 Sivle et al.
Exp
idSc
ore
Beh
avio
ral r
espo
nse
and
just
ifica
tion
Tim
e of
ch
ange
poin
t (U
TC)
Dur
atio
n of
re
spon
se /
expo
sure
(min
)
SPLm
ax
dB re
1
μPa
SELc
um
dB re
1
μPa
2 s
ha13
_176
so
nar
3M
inor
chan
ge in
loco
mot
ion
– Th
e an
imal
swam
tow
ards
the
sour
ce a
nd a
ppro
ache
d it
at
the
very
beg
inni
ng o
f the
exp
osur
e. T
imin
g w
as d
eter
min
ed fr
om th
e ps
eudo
track
.09
:57:
588/
3586
88
ha13
_176
a so
nar
5
Exte
nded
cha
nge
in d
ive
prof
ile –
The
ani
mal
con
duct
ed a
n un
usua
lly d
eep
dive
dur
ing
the
expo
sure
, dee
per t
han
any
dive
reco
rded
in th
is sp
ecie
s. Th
is re
spon
se w
as c
onsi
dere
d to
sta
rt w
hen
the
anim
al b
roke
off
the
asce
nt o
f wha
t app
eare
d to
be
a sh
allo
w d
ive
and
bega
n th
e de
cent
to >
2,0
00 m
dep
th.
10:0
6:14
> 42
0/35
122
124
ha13
_176
a so
nar
7Pr
olon
ged
avoi
danc
e –
The
anim
al tu
rned
aw
ay fr
om th
e so
urce
and
con
tinue
d on
new
tra
ck fo
r > 7
h. E
xact
tim
ing
of th
e tu
rn w
as d
eter
min
ed fr
om th
e ps
eudo
track
.10
:06:
25>
420/
3513
012
8
ha13
_176
a so
nar
8
Long
-term
avo
idan
ce o
f are
a –
The
anim
al h
ad b
een
rela
tivel
y st
atio
nary
in th
e sa
me
area
bef
ore
expo
sure
but
mov
ed a
way
and
did
not
retu
rn to
the
expo
sed
area
with
in th
e re
cord
. In
addi
tion,
a la
rger
sca
le a
cous
tic a
nd v
isua
l sur
vey
of th
e la
rger
exp
osed
are
a sh
owed
that
oth
er a
nim
als i
n th
e ar
ea a
lso
evac
uate
d fo
r at l
east
6 h
afte
r the
exp
osur
e.
10:0
6:25
> 42
0/35
130
128
ha13
_176
a so
nar
7Pr
olon
ged
cess
atio
n of
feed
ing
– Th
e an
imal
was
feed
ing
(ech
oloc
atin
g) p
rior t
o so
nar
onse
t, bu
t nev
er a
fter.
The
star
t of t
his r
espo
nse
was
take
n du
ring
the
deep
div
e w
hen
the
anim
al re
ache
d th
e av
erag
e de
pth
whe
re e
chol
ocat
ion
star
ted
in p
revi
ous f
eedi
ng d
ives
. 10
:07:
18>
420/
3514
113
9
ha13
_176
a so
nar
6
Exte
nded
ces
satio
n of
voc
al b
ehav
ior
– Th
e an
imal
was
voc
ally
act
ive
durin
g en
tire
tag
reco
rd p
rior t
o so
nar e
xpos
ure,
but
turn
ed c
ompl
etel
y si
lent
for m
ore
than
7 h
whe
n th
e ta
g de
tach
ed a
nd th
e re
cord
end
ed. O
nset
of t
he re
spon
se w
as th
e sa
me
as fo
r ces
satio
n of
feed
ing.
10:0
7:18
> 42
0/35
141
139
may
hav
e of
the
onse
t of t
he sc
ored
resp
onse
in o
rder
to a
ssig
n a
dura
tion
. Eac
h se
ssio
n
resp
onse
vs t
he
of th
e ta
g, a
nd th
e ex
posu
re ty
pe is
sona
r
the
of
dura
tion
The
resp
onse
. data
plo
ts u
sed
as b
asis
for t
he sc
orin
g ca
n be
time th
e th
resh
olds
of
the
exac
t
Tabl
e 1.
Det
aile
d
) (ha
). Ex
p id
is th
e ID
. F
or a
ll th
e so
nar e
xpos
ures
, we
have
als
o de
term
ined
with
the
crite
ria in
)
cum
(SEL
leve
l
oodo
n am
pulla
tus
soun
d ex
posu
re
Hyp
er
cum
ulat
ive
ls fo
r the
nor
ther
n bo
ttlen
ose
wha
le (
and
) m
ax
fere
nt ty
pes o
f cha
nges
in b
ehav
ior (S
PLso
und
pres
sure
leve
l re
ceiv
ed to a
ssig
n th
e co
rrec
t sev
erity
scor
e to
the
resp
onse
in a
ccor
danc
e
scor
e de
tai
um
Sev
erity
max
im
AII
I.ab
le
T seve
ral s
core
s for
dif
corr
espo
ndin
g of
the
expo
sure
was
det
erm
ined
fo
und
in K
vads
heim
et a
l. (2
015)
.
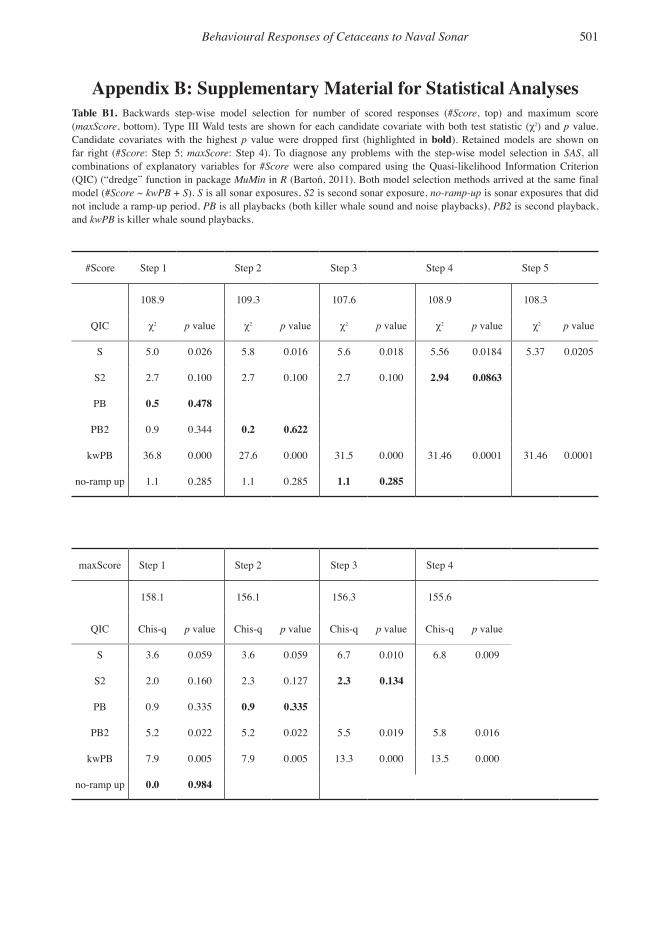
501 Behavioural Responses of Cetaceans to Naval Sonar
Appendix B: Supplementary Material for Statistical AnalysesTable B1. Backwards step-wise model selection for number of scored responses (#Score, top) and maximum score (maxScore, bottom). Type III Wald tests are shown for each candidate covariate with both test statistic (χ2) and p value. Candidate covariates with the highest p value were dropped first (highlighted in bold). Retained models are shown on far right (#Score: Step 5; maxScore: Step 4). To diagnose any problems with the step-wise model selection in SAS, all combinations of explanatory variables for #Score were also compared using the Quasi-likelihood Information Criterion (QIC) (“dredge” function in package MuMin in R (Bartoń, 2011). Both model selection methods arrived at the same final model (#Score ~ kwPB + S). S is all sonar exposures, S2 is second sonar exposure, no-ramp-up is sonar exposures that did not include a ramp-up period, PB is all playbacks (both killer whale sound and noise playbacks), PB2 is second playback, and kwPB is killer whale sound playbacks.
#Score Step 1 Step 2 Step 3 Step 4 Step 5
108.9 109.3 107.6 108.9 108.3
QIC χ2 p value χ2 p value χ2 p value χ2 p value χ2 p value
S 5.0 0.026 5.8 0.016 5.6 0.018 5.56 0.0184 5.37 0.0205
S2 2.7 0.100 2.7 0.100 2.7 0.100 2.94 0.0863
PB 0.5 0.478
PB2 0.9 0.344 0.2 0.622
kwPB 36.8 0.000 27.6 0.000 31.5 0.000 31.46 0.0001 31.46 0.0001
no-ramp up 1.1 0.285 1.1 0.285 1.1 0.285
maxScore Step 1 Step 2 Step 3 Step 4
158.1 156.1 156.3 155.6
QIC Chis-q p value Chis-q p value Chis-q p value Chis-q p value
0.009S 3.6 0.059 3.6 0.059 6.7 0.010 6.8
S2 2.0 0.160 2.3 0.127 2.3 0.134
PB 0.9 0.335 0.9 0.335
PB2 5.2 0.022 5.2 0.022 5.5 0.019 5.8 0.016
kwPB 7.9 0.005 7.9 0.005 13.3 0.000 13.5 0.000
no-ramp up 0.0 0.984
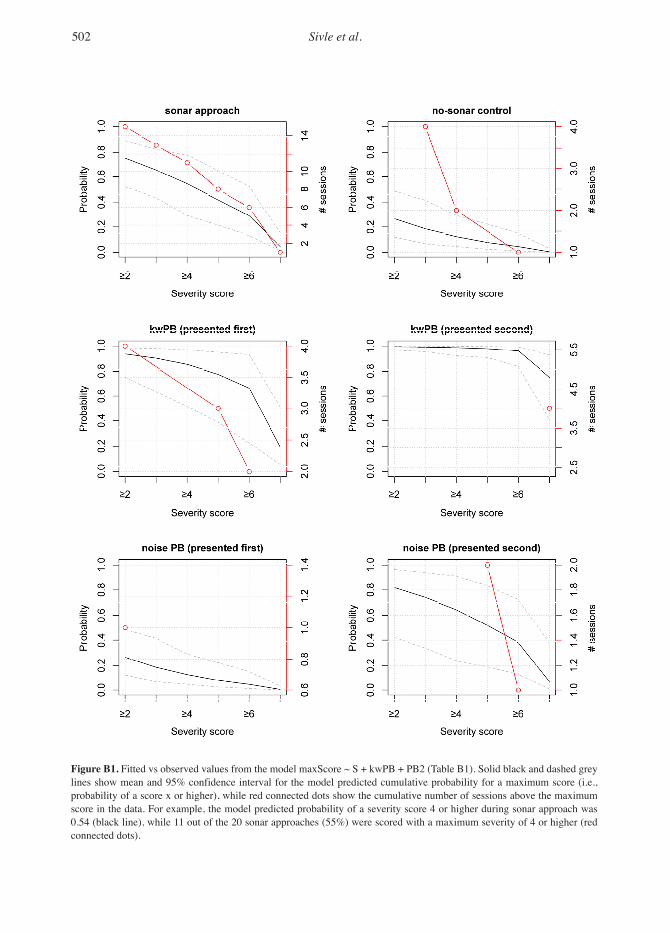
502 Sivle et al.
Figure B1. Fitted vs observed values from the model maxScore ~ S + kwPB + PB2 (Table B1). Solid black and dashed grey lines show mean and 95% confidence interval for the model predicted cumulative probability for a maximum score (i.e., probability of a score x or higher), while red connected dots show the cumulative number of sessions above the maximum score in the data. For example, the model predicted probability of a severity score 4 or higher during sonar approach was 0.54 (black line), while 11 out of the 20 sonar approaches (55%) were scored with a maximum severity of 4 or higher (red connected dots).