sewage treatment plant contamination of the …
TRANSCRIPT
SEWAGE TREATMENT PLANT CONTAMINATION OF THE ANNAPOLIS RIVER
ECONOMIC IMPLICATIONS FOR THE
SOFT-SHELL CLAM INDUSTRY
by
Christopher DeBow
Submitted in partial fulfilment of the requirements for the degree of Master of Development Economics
at
Dalhousie University Halifax, Nova Scotia
April 2013
© Copyright by Christopher DeBow, 2013
ii
DALHOUSIE UNIVERSITY DEPARTMENT OF ECONOMICS
The undersigned hereby certify that they have read and recommend to the
Faculty of Graduate Studies for acceptance a thesis entitled “Sewage
Treatment Plant Contamination of the Annapolis River: Economic Implications
for the Soft-Shell Clam Industry” by Christopher DeBow in partial fulfilment of
the requirements for the degree of Master of Development Economics.
Dated: April 24, 2013
Co-Supervisor: _________________________________
Co-Supervisor:
_________________________________
Reader: _________________________________

iii
DALHOUSIE UNIVERSITY
Date: April 24, 2013 Author:
Christopher DeBow
Title:
Sewage Treatment Plant Contamination of the Annapolis River: Economic Implications for the Soft-Shell Clam Industry
Department: Department of Economics
Degree: MDE Convocation: October Year: 2013 Permission is herewith granted to Dalhousie University to circulate and to have copied for non-commercial purposes, at its discretion, the above title upon the request of individuals or institutions. I understand that my thesis will be electronically available to the public. The author reserves other publication rights, and neither the thesis nor extensive extracts from it may be printed or otherwise reproduced without the author’s written permission. The author attests that permission has been obtained for the use of any copyrighted material appearing in the thesis (other than the brief excerpts requiring only proper acknowledgement in scholarly writing), and that all such use is clearly acknowledged.
_______________________________ Signature of Author
iv
DEDICATION
My great-grandfather was a fisherman. He made a living, supported his family, and stayed in his community because of the access he had to our province’s natural resources. He was willing to get up before dawn and spend days working in harsh conditions, knowing that the only thing that stood between him and his livelihood was his determination. Clam harvesters in the Annapolis Basin have demonstrated that same resolve for more than 400 years, yet a failure in the very basic structures and services of a modern society have disrupted their lives by restricting their access to a public good upon which their employment depends. Their numbers are small and their economics irrelevant to the broader economy, but it is to these hardworking people that I dedicate this thesis.
v
TABLE OF CONTENTS
LIST OF TABLES ...................................................................... vii
LIST OF FIGURES ...................................................................... ix
ABSTRACT……... ....................................................................... x
LIST OF ABBREVIATIONS USED ................................................. xi
ACKNOWLEDGEMENTS ........................................................... xii
CHAPTER 1. INTRODUCTION ................................................... 1 1.1 The Issue ...................................................................................................... 1 1.2 The Objective .............................................................................................. 2
CHAPTER 2. REVIEW OF THE LITERATURE ................................ 3 2.1 Small-Scale Fisheries and Rural Economies in Perspective ........................ 3 2.2 Small-Scale Fishery Closures: Their Implications and Impact ..................... 9
2.2.1 Soft-shell Clams and Escherichia Coli Contamination ..................... 10 2.2.2 Economic Impact of SSF Closures ................................................... 11
2.3 Small-Scale Renewable Resource Industries and Rural Economic Development ............................................................................................ 14
2.4 The Use of Cost-Benefit Analysis in Project Decision Making ................. 16
CHAPTER 3. METHODOLOGY ................................................. 22 3.1 Economic Benefits ..................................................................................... 22 3.2 Cost-Benefit Analysis ................................................................................ 23 3.3 Net Present Value Approach .................................................................... 23 3.4 Accounting Stance .................................................................................... 24 3.5 Data Gathering .......................................................................................... 25
3.5.1 Interviews .......................................................................................... 25 3.5.2 Secondary Research ........................................................................ 25
3.6 Assumptions .............................................................................................. 26
vi
CHAPTER 4. ECONOMIC ANALYSIS ........................................ 28 4.1 Principal Benefits ....................................................................................... 28
4.1.1 Landed Value .................................................................................... 28 4.1.2 Value Added ..................................................................................... 31
4.1.3 Total Industry Value .......................................................................... 33 4.1.4 Employment Insurance Benefits ....................................................... 34
4.1.5 Operational Cost Savings ................................................................. 38 4.1.6 Total Annual Benefits ........................................................................ 38
4.2 Other Benefits ........................................................................................... 39 4.3 Principal Costs ........................................................................................... 40 4.3 Net Present Value Analysis ....................................................................... 42
4.3.1 Annual Net Benefits (Costs) .............................................................. 42 4.3.2 Net Present Value Scenario Analysis ................................................ 43
4.3.3 NPV Analysis Summary .................................................................... 45
4.4 Net Present Value Breakeven ................................................................... 47 4.5 Sensitivity Analysis .................................................................................... 48
4.5.1 Average Annual Landed Value .......................................................... 49 4.5.2 Value-Added Margin ......................................................................... 51
4.5.3 Sewage Treatment Plant Construction Cost .................................... 54 4.5.4 Market Price ...................................................................................... 55
CHAPTER 5. DISCUSSION ...................................................... 57 5.1 Summary .................................................................................................... 57 5.2 Implications and Concluding Remarks ...................................................... 59
BIBLIOGRAPHY. ....................................................................... 62
vii
LIST OF TABLES
Table 1. US Commercial Fishery Effects Due to Closures, 1987 to 1992…………………………………………………………..11-12
Table 2. Annapolis Basin Soft-shell Clam Landed Value, 1999
to 2008………………………………………………………………30 Table 3. Annapolis Basin Soft-Shell Clam Fishery Estimated
Annual Value………………………………………………………..33 Table 4. Employment Insurance Benefit Minimum Divisor
Calculation………………………………………………………36-37 Table 5. Annapolis Basin Soft-Shell Clam Industry Estimated Annual
Benefits……………………………………………........................38 Table 6. Digby Sewage Treatment Plant Upgrade Estimated Capital
Cost………………………………………………………………….41 Table 7. Net Present Value Calculation Under 3 Scenarios…………….45 Table 8. Digby Sewage Treatment Plant Upgrade NPV
Summary……………………………………………………...........46 Table 9. Digby Sewage Treatment Plant Upgrade NPV Breakeven
Summary……………………………………….............................48 Table 10. Sensitivity Analysis - 10% Decrease in Annual Average Landed
Value……………………………………………….........................50 Table 11. Sensitivity Analysis - 25% Decrease in Annual Average Landed
Value……………………………………………….........................50 Table 12. Sensitivity Analysis - 50% Decrease in Annual Average Landed
Value……………………………………………….........................50 Table 13. Sensitivity Analysis - 10% Decrease in Value-Added
Margin………………………………………………………...........52
viii
Table 14. Sensitivity Analysis - 25% Decrease in Value-Added
Margin………………………………………………………...........52 Table 15. Sensitivity Analysis - 50% Decrease in Value-Added
Margin………………………………………………………...........53 Table 16. Sensitivity Analysis - 10% Increase in Construction
Cost…………………………………………………………............54 Table 17. Sensitivity Analysis - 25% Increase in Construction
Cost…………………………………………………………............54 Table 18. Sensitivity Analysis - 50% Increase in Construction
Cost…………………………………………………………............55

ix
LIST OF FIGURES
Figure 1. Annapolis Basin Soft-Shell Clams Landed Values, 1999 to 2008…………………………………………………………………30
x
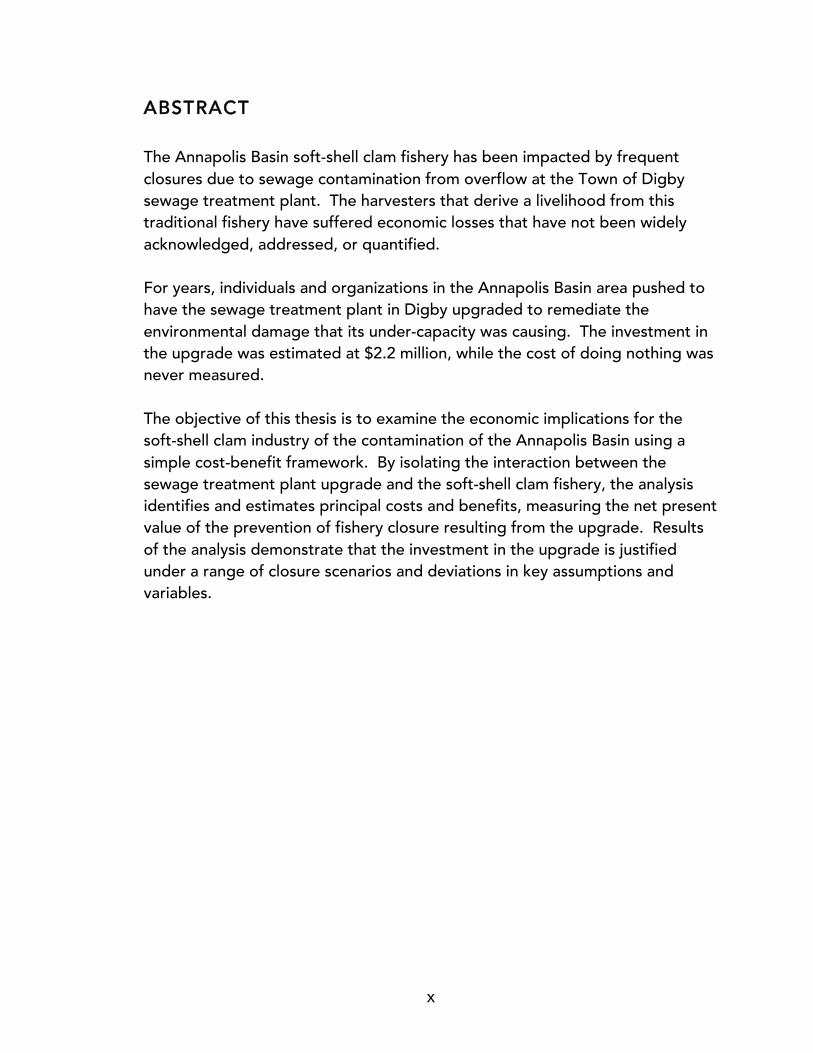
ABSTRACT
The Annapolis Basin soft-shell clam fishery has been impacted by frequent closures due to sewage contamination from overflow at the Town of Digby sewage treatment plant. The harvesters that derive a livelihood from this traditional fishery have suffered economic losses that have not been widely acknowledged, addressed, or quantified. For years, individuals and organizations in the Annapolis Basin area pushed to have the sewage treatment plant in Digby upgraded to remediate the environmental damage that its under-capacity was causing. The investment in the upgrade was estimated at $2.2 million, while the cost of doing nothing was never measured. The objective of this thesis is to examine the economic implications for the soft-shell clam industry of the contamination of the Annapolis Basin using a simple cost-benefit framework. By isolating the interaction between the sewage treatment plant upgrade and the soft-shell clam fishery, the analysis identifies and estimates principal costs and benefits, measuring the net present value of the prevention of fishery closure resulting from the upgrade. Results of the analysis demonstrate that the investment in the upgrade is justified under a range of closure scenarios and deviations in key assumptions and variables.
xi
LIST OF ABBREVIATIONS USED
STP Sewage treatment plant SSF Small-scale fishery HAB Harmful algal bloom US United States MEY Maximum economic yield CBA Cost-benefit analysis NPV Net present value TBOC Treasury Board of Canada WSOC Weighted social cost of capital ROI Return on investment AALV Average annual landed value TL Total landings AAVA Average annual value added TL Total landings NMW Net meat weight EI Employment insurance AANEIB Average annual net employment insurance benefits EIBR Employment insurance benefit rate UV Ultraviolet AOS Annual operating-cost savings AOC Annual operating cost FC Fishing closed CC Capital cost ANB Annual net benefit VAM Value-added margin
xii
ACKNOWLEDGEMENTS
I would like to thank the Dalhousie University Department of Economics for its patience and flexibility in the completion of a degree that began during the Clinton administration. I am quite grateful to have had the support and guidance of Barry Lesser, Teresa Cyrus, and Tom Pinfold. This could not have been completed without the persistence, kindness, and humour of Monique Comeau. Thanks to Gardner Pinfold Consultants for their generosity over the years. I would like to acknowledge the Clean Annapolis River Project and Steve Hawboldt whose commitment to protecting and improving the Annapolis Basin and its fisheries has been the driving force behind this work. A special thanks to my very understanding family – Patti, Mackenzie, and Ella – who have cheered, pushed, and allowed me the time to work. To my mother, Jan, and father, John, who lovingly supported me and, thankfully, rarely asked if I was finished. And finally, to my Aunt Judy, who is one of the few people who understood how difficult this process can be and always asked how it was going in just the right way.
1
CHAPTER 1. INTRODUCTION
The soft-shell clam fishery in the Annapolis Basin has represented an important
source of livelihood for generations of harvesters who have relied on it as a
sole source of income or part of a seasonal revenue diversification strategy.
This environmentally sustainable fishery has formed the foundation upon which
modern processing and marketing industries have developed in the region,
providing a broader source of employment and income beyond primary
harvesting. The leading shellfish processor and distributor employs
approximately 30 people, achieves annual revenues of between $1,000,000
and $5,000,000, and exports product to the United States, Algeria, France,
Hong Kong, and the United Kingdom (Government of Canada, n.d.).
1.1 The Issue
Despite the historic, cultural, and economic significance of the Annapolis Basin
soft-shell clam industry to the region, the fishery has been adversely impacted
by serious environmental and water quality issues resulting from the overflow
of untreated sewage into the Annapolis River from the Town of Digby sewage
treatment plant (STP). Limitations of the town’s infrastructure and under-
capacity at the plant have resulted in the discharge of untreated waste into the
Annapolis River. Elevated levels of bacteria flowing downstream have infected
2
the soft-shell clam population effectively closing the fishery for varying periods
of time since 1973 (Sullivan, 2007a). Although the town and appropriate
government departments are aware of the situation, no remediation of the
problem or upgrade to facilities has occurred to date. In 2009, approximately
$3.5 million in multi-level government funding to upgrade the facility has been
approved.
1.2 The Objective
The objective of this thesis is to assess the economic implications of sewage
contamination of the Annapolis Basin for the soft-shell clam industry.
Assessing these implications involves estimating the economic value of the
fishery to The Province of Nova Scotia and conducting a cost-benefit analysis
of investing in the upgrade.
3
CHAPTER 2. REVIEW OF THE LITERATURE
In essence, this thesis is about the importance of small-scale resource-based
industry to rural communities facing increasing pressure from a range of socio-
economic factors. The Annapolis Basin area of Nova Scotia is part of a larger
region known as the Annapolis Valley, which has faced increasingly difficult
economic and demographic conditions. Population loss, business closure, and
a high unemployment rate (Government of Canada, 2012b) have combined to
create pressure for individuals and households in terms of creating and
sustaining a livelihood. Since the mid-1800s, the soft-shell clam harvest in the
Annapolis Basin has been an example of a resource-based industry that has
provided a small number of fishers with an opportunity to diversify their
income, face these increasing pressures, and remain in the region (Sullivan,
2007a).
2.1 Small-Scale Fisheries and Rural Economies in Perspective
Small-scale fisheries (SSF) remain an important economic activity in rural coastal
communities around the globe. In both developed and developing nations,
millions rely on these traditional industries as sources of employment, income,
and nutrition (Teh, Teh, & Sumaila, 2011). This has historically been the case in
4
the soft-shell clam fishery in the Annapolis Basin, where a commercial harvest
has been in place since the mid 19th century.
“In the early years of the commercial fishery, clams were used as bait for
more valuable fish species. Diggers would sell clams for cod bait off the
Grand Banks and could make about $10 a day. At the time [c. 1850], this
was more than what most people would earn in a week.”
(Sullivan, 2007a)
From a wider rural development perspective, SSFs can play a role in
contributing to the economic well being of the community. Although SSFs like
that in the Annapolis Basin are relatively small in terms of employment and
production, their local economic impact is not insignificant. At the core of the
industry are harvesters who land shellfish using shovels and rakes. The low
level of capital required to enter the industry, coupled with the relatively low
cost of harvesting, can lead to a greater portion of revenue remaining in the
hands of producers (Johnson, 2012).
Broadly speaking, the core of small-scale shellfish fisheries is comprised of
harvesters and processors. Peripheral industry participants include equipment

5
suppliers (to both harvesting and processing), buyers, distributors,
transportation, brokers, retailers, food services, administration, insurance, legal
services, marketing, communications, and others (Salter & Marketing, 2002).
In their examination of the impact of SSFs, Bene et al. (2005) note that
communities that participate in these export oriented industries contribute to
local, regional, and national economies through the generation of foreign
exchange and tax revenue. Aside from the direct impacts derived from the
sale of product, the authors identify a range of both “upstream and
downstream” indirect impacts, as follows:
Upstream – activities that supply inputs to the harvesting operations.
• Investment in equipment and materials.
• Labour.
• Financial and administrative services.
Downstream – activities that occur post-harvest.
• Investment in processing facilities and equipment.
• Variable operating costs of processing.
• Packaging
• Transportation.
• Marketing.

6
• Financial and administrative services.
It should be noted that not all of these indirect impacts occur in the community
in which the harvesting and processing activity takes place. In the case of the
Annapolis Basin soft-shell clam fishery, the bulk of labour-related impacts occur
in proximate communities, as does much of the spending on basic equipment
and materials. Investment in equipment, packaging, as well as financial and
marketing services, most likely impact communities outside the immediate
area.
Induced impacts are defined by the authors as the “income and employment
effects from the changed levels of income and expenditure throughout the
local economy as a result of direct and indirect impacts” (Béné et al., 2005, p.
19). The authors argue that the total impact of SSF activity can represent a
major driver of economic activity in rural communities.
Shellfish aquaculture has been widely considered a powerful economic
development tool for rural communities in both the developed and developing
world. While major differences exist between shellfish aquaculture and wild
fisheries, their scale and role in the rural economy is often similar. Halwart et
al. (2003) observe the role aquaculture plays in rural development, noting that,
7
like SSFs, aquaculture provides opportunities for “own-enterprise”
employment, which can contribute to an increase in livelihood diversification
and economic security.
Perhaps the most studied aspect of SSFs and rural communities is the role they
play in poverty reduction. (2006) make the point that “[the] SSF sector plays
an important role in contributing to the livelihoods of the poorest sectors of
society in diverse ways, providing employment, fish for consumption and
financial revenues from the sale of fish.” Indeed, in many communities in both
the developed and developing world, fisheries like that in the Annapolis Basin
provide local fishers with an opportunity to diversify their often-fractional
incomes with seasonal revenue from a renewable resource. In their
examination of the sustainable livelihoods approach to poverty reduction in
SSFs, Allison and Ellis (2001) observe that participation in industries like the
Annapolis Basin soft-shell clam fishery is often an income diversification
strategy designed to mitigate the unpredictable nature of resource-based
employment rather than being an occupation of last resort, as is often
assumed. Sustainable, well-managed SSFs can contribute to poverty reduction
through four major channels (Walmsley et al., 2006):
8
1. Livelihood: SSFs provide employment and income that enable the
consumption of other goods and services;
2. Capability: SSFs can contribute to an increase in an individual’s
capacity to derive a livelihood through access to a nutritious and
plentiful protein source;
3. Vulnerability: SSFs that are protected from external shocks, such as
sewage contamination, are less likely to suffer closure or collapse
thereby reducing the vulnerability of the community to poverty. Access
to SSFs also has the potential to decrease vulnerability by increasing an
individual or community’s food security;
4. Participation: SSFs are often co-managed and monitored by local
harvesters’ organizations or other community groups, 1 thereby
increasing community capacity and helping ensure the sustainability of
the resource.
Despite much evidence to the contrary, there is a general lack of
acknowledgement in the literature of the important contribution SSFs make to
rural livelihoods and economic development (Béné, 2005). In their study of the
1 The Annapolis Basin soft-shell clam fishery is managed and monitored in part by the Digby County Clam Diggers, the CHA2 Clam Harvesters Association, and the Annapolis River Guardians.

9
socio-economic contribution of SSFs in Malaysia, Teh et al. (2011) observe that
the undervaluation of SSFs has occurred because of a combination of their
scale, geographic dispersion, and relatively insignificant contribution to the
national economy. The authors estimate that the SSF in their study was
undervalued by approximately 225%, despite the critical welfare role it played
in the region.
2.2 Small-Scale Fishery Closures: Their Implications and Impact
The central issue of this thesis is the impact that temporary closures of a SSF
have on the local economy. In this case, a series of closures has occurred
because of sewage contamination from surrounding municipalities. Shellfish
fishery closures are not uncommon in coastal communities throughout the
world. They are often closed because of contamination, invasive species, over-
fishing, and the presence of harmful algal blooms2. Closures of SSFs have
immediate and significant impacts.
2 “Algal blooms are a common occurrence in aquatic environments. A subset of these blooms poses environmental or public-health threats, and it is therefore referred to as ‘harmful algal blooms’, or HABs. Some HABs are harmful by virtue of their sheer biomass, whereas others are associated with algal blooms capable of producing toxins.” (Backer & McGillicuddy, 2006, p. 1)
10
2.2.1 Soft-shell Clams and Escherichia Coli Contamination
Soft-shell clam fishery closures in the Annapolis Basin occur because of the
presence of Escherichia coli (E-coli) bacteria in the shellfish as a result of
sewage bypass at the Digby sewage treatment plant. Soft-shell clams obtain
food by filtering seawater. Any E-coli bacteria present will accumulate in the
shellfish at a concentration of approximately 20 times that of the surrounding
water (Cabelli & Heffernan, 1970). E-coli bacteria do not kill soft-shell clams
and are eventually filtered and eliminated once the contamination is no longer
present in the surrounding water. This natural process of filtration is
increasingly relied upon by seafood companies to market marginally
contaminated shellfish through a process called depuration. In a depuration
fishery, marginally contaminated shellfish are harvested and maintained in
purified seawater until the bacteria is adequately purged (Department of
Fisheries and Oceans, 2009). While soft-shell clams are able to quickly
eliminate contamination under the controlled conditions of a depuration plant,
the uncontrolled inundation of sewage into a wild fishery poses public health
risks that result in fishery closures.
11
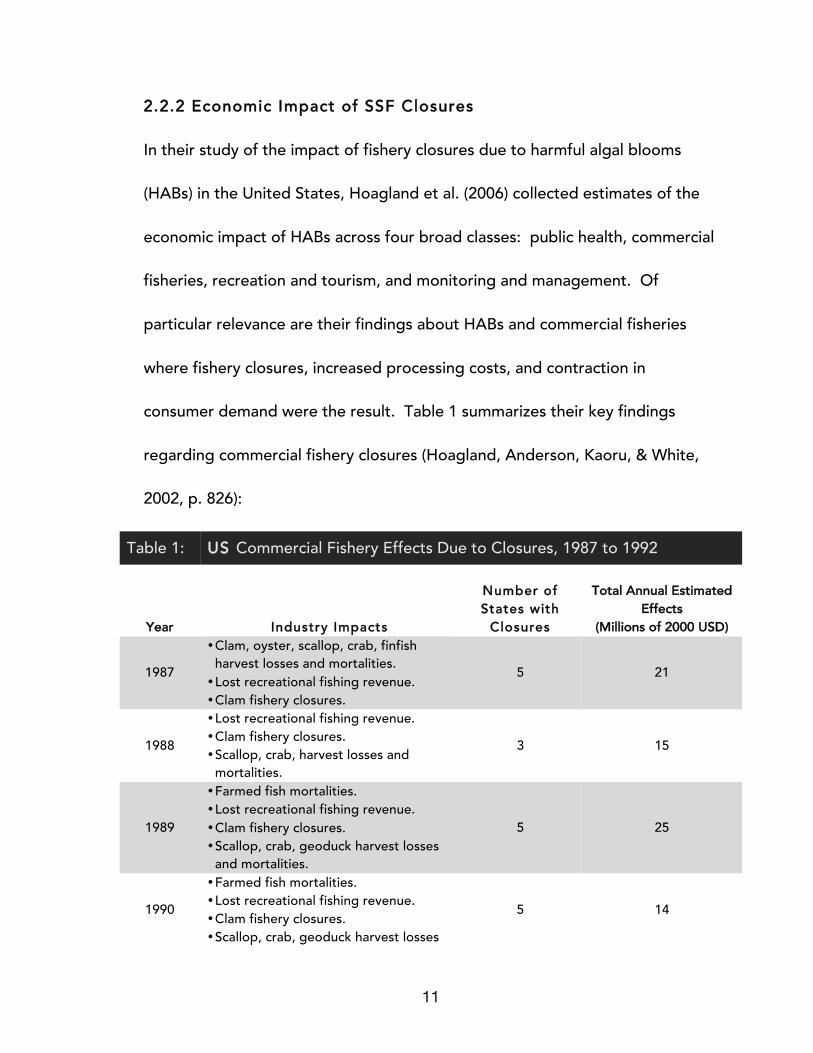
2.2.2 Economic Impact of SSF Closures
In their study of the impact of fishery closures due to harmful algal blooms
(HABs) in the United States, Hoagland et al. (2006) collected estimates of the
economic impact of HABs across four broad classes: public health, commercial
fisheries, recreation and tourism, and monitoring and management. Of
particular relevance are their findings about HABs and commercial fisheries
where fishery closures, increased processing costs, and contraction in
consumer demand were the result. Table 1 summarizes their key findings
regarding commercial fishery closures (Hoagland, Anderson, Kaoru, & White,
2002, p. 826):
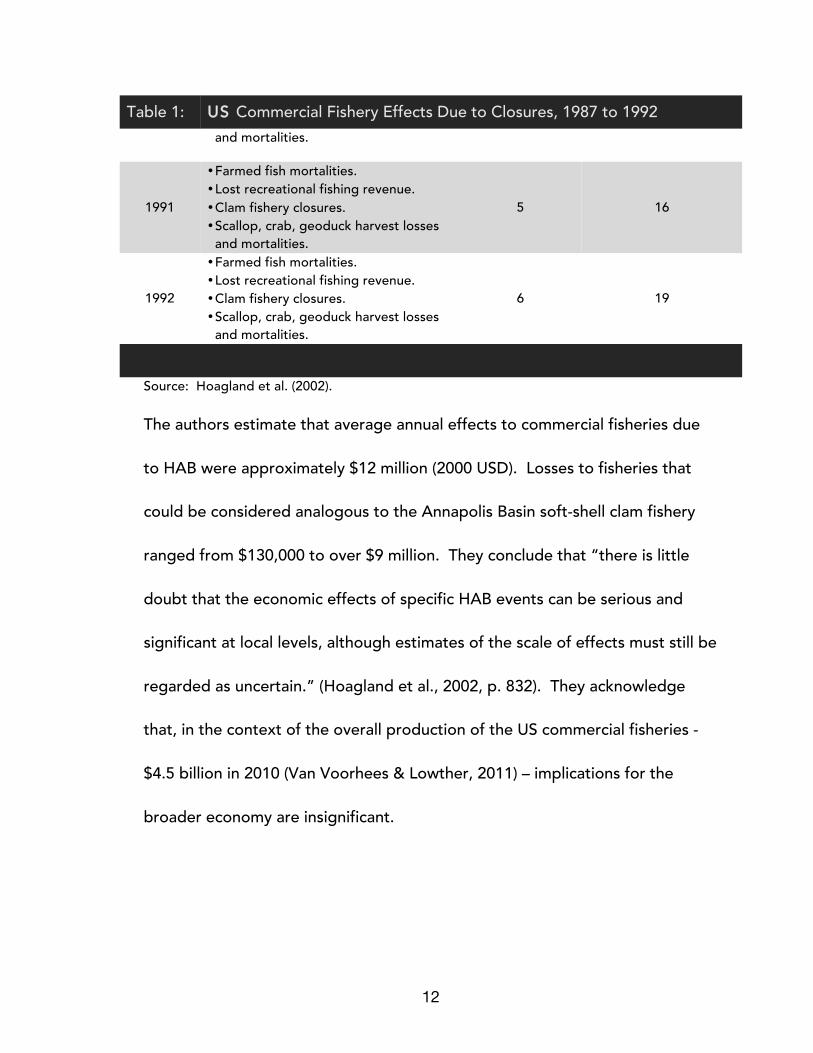
Table 1: US Commercial Fishery Effects Due to Closures, 1987 to 1992
Year Industry Impacts
Number of States with
Closures
Total Annual Estimated Effects
(Millions of 2000 USD)
1987
• Clam, oyster, scallop, crab, finfish harvest losses and mortalities. • Lost recreational fishing revenue. • Clam fishery closures.
5 21
1988
• Lost recreational fishing revenue. • Clam fishery closures. • Scallop, crab, harvest losses and
mortalities.
3 15
1989
• Farmed fish mortalities. • Lost recreational fishing revenue. • Clam fishery closures. • Scallop, crab, geoduck harvest losses
and mortalities.
5 25
1990
• Farmed fish mortalities. • Lost recreational fishing revenue. • Clam fishery closures. • Scallop, crab, geoduck harvest losses
5 14
12
Table 1: US Commercial Fishery Effects Due to Closures, 1987 to 1992 and mortalities.
1991
• Farmed fish mortalities. • Lost recreational fishing revenue. • Clam fishery closures. • Scallop, crab, geoduck harvest losses
and mortalities.
5 16
1992
• Farmed fish mortalities. • Lost recreational fishing revenue. • Clam fishery closures. • Scallop, crab, geoduck harvest losses
and mortalities.
6 19
Source: Hoagland et al. (2002).
The authors estimate that average annual effects to commercial fisheries due
to HAB were approximately $12 million (2000 USD). Losses to fisheries that
could be considered analogous to the Annapolis Basin soft-shell clam fishery
ranged from $130,000 to over $9 million. They conclude that “there is little
doubt that the economic effects of specific HAB events can be serious and
significant at local levels, although estimates of the scale of effects must still be
regarded as uncertain.” (Hoagland et al., 2002, p. 832). They acknowledge
that, in the context of the overall production of the US commercial fisheries -
$4.5 billion in 2010 (Van Voorhees & Lowther, 2011) – implications for the
broader economy are insignificant.
13
Small-scale recreational clam fisheries have also been affected by closures due
to bio-invasions, such as HABs. Although these fisheries are considered non-
commercial, their scale and operation are very much like a commercial clam
fishery. Along the Pacific coast of the United States, more than one-quarter of
all potential razor clam harvesting days were lost due to beach closures
resulting from toxic bio-invasions (Dyson & Huppert, 2010). Using expenditure
data collected through surveys of recreational fishers, Dyson and Huppert
estimated that the total reduction in user expenditure caused by a fishery
closure of two to five days in length at the study area’s four beaches was
approximately $4 million (2008 USD). 3
Although individual SSFs generate negligible economic impact on a
macroeconomic scale, economic losses that can extend into the millions can
have major implications for the livelihoods of people in rural communities that
face considerable challenge as it is.
3 The study area surveyed was comprised of four beaches with an average daily participation of approximately 3,000 recreational fishers (Dyson & Huppert, 2010).
14
2.3 Small-Scale Renewable Resource Industries and Rural Economic Development
Renewable resources play an important role in the economies of rural
communities. The sustainable use of renewable resources is critical to their
ability to serve as engines of long-term economic development to rural
communities. Sustainable use can be defined as one that sets the total annual
harvest equal to the rate of resource growth (McWhinnie, 2012). Extending
this simple statement further, the optimal stock level of any resource occurs at
the point of maximum economic yield (MEY), which incorporates the net value
of harvesting the resource. As McWhinnie points out, MEY occurs where the
gap between total revenue and total cost is greatest.
Another view of sustainable renewable resource-based economic development
includes the further condition of mitigating the effects of economic activity on
environmental quality (Barbier & Markandya, 1989). Barbier and Makandya
state that “maximizing the net benefits of economic development, subject to
maintaining the services and quality of the stock of natural resources over time,
is an essential criterion for sustainable development.” (p. 2) They further argue
that sustainable use of renewable resources requires:
15
1. utilizing renewable resources at rates less than or equal to the natural or
managed rates of regeneration;
2. generating wastes at rates less than or equal to the rates at which they
can be absorbed by the assimilative capacity of the environment;
3. optimizing the efficiency with which exhaustible resources are used,
which is determined by the rate at which renewable resources can be
substituted for exhaustibles and by technological progress. (Barbier &
Markandya, 1989)
Traditionally, fisheries and agriculture formed the foundation of the local
economy of the Annapolis Basin region. In the absence of external shocks to
the ecosystem, soft-shell clams have provided fishers with a reliable, renewable
source of income for generations (Sullivan, 2007a). In the case of soft-shell
clams, the sustainability and reliability of supply requires harvesters to leave an
adequate population of juvenile clams in the ground due, in part, to their high
mortality rate (Sullivan, 2007b). Sullivan’s survey of the Annapolis Basin
revealed a relatively low clam density and concluded that the resource has not
been harvested sustainably. Management efforts in the Annapolis Basin have
included stock assessments, water quality monitoring, and occasional
reseeding of clam beds (“Clean Annapolis River Project,” n.d.).

16
2.4 The Use of Cost-Benefit Analysis in Project Decision Making
“Cost-benefit analysis (CBA) is a decision standard that is commonly used by
policymakers to assist in determining whether a policy or project should be
implemented. CBA monetizes the effects of a policy [or project] on individuals
or groups in order to facilitate comparisons with the status quo or with other
policies. In its basic form, CBA places primary weight on economic efficiency,
but it can also be modified to account for adverse wealth distribution effects
by appropriately weighting the costs and benefits to individuals or groups.”
(Trebilcock, Yatchew, & Baziliauskas, 2007, p. 1). In the context of this thesis,
the objective of employing CBA is to measure the net provincial economic
benefits or losses that would result from an upgrade to the Town of Digby
sewage treatment plant as they relate to the Annapolis Basin soft-shell clam
industry. CBA is a widely used approach in evaluating municipal projects and
has been used in the context of sewage treatment in Nova Scotia as recently as
2000. GPIAtlantic conducted an analysis of the Halifax Regional Municipality’s
plan to build a sewage treatment plant to deal with the disposal of nearly 200
million litres of raw sewage that entered the harbor daily (Halifax Regional
Municipality, 1996). In their study, they identify a set of environmental and
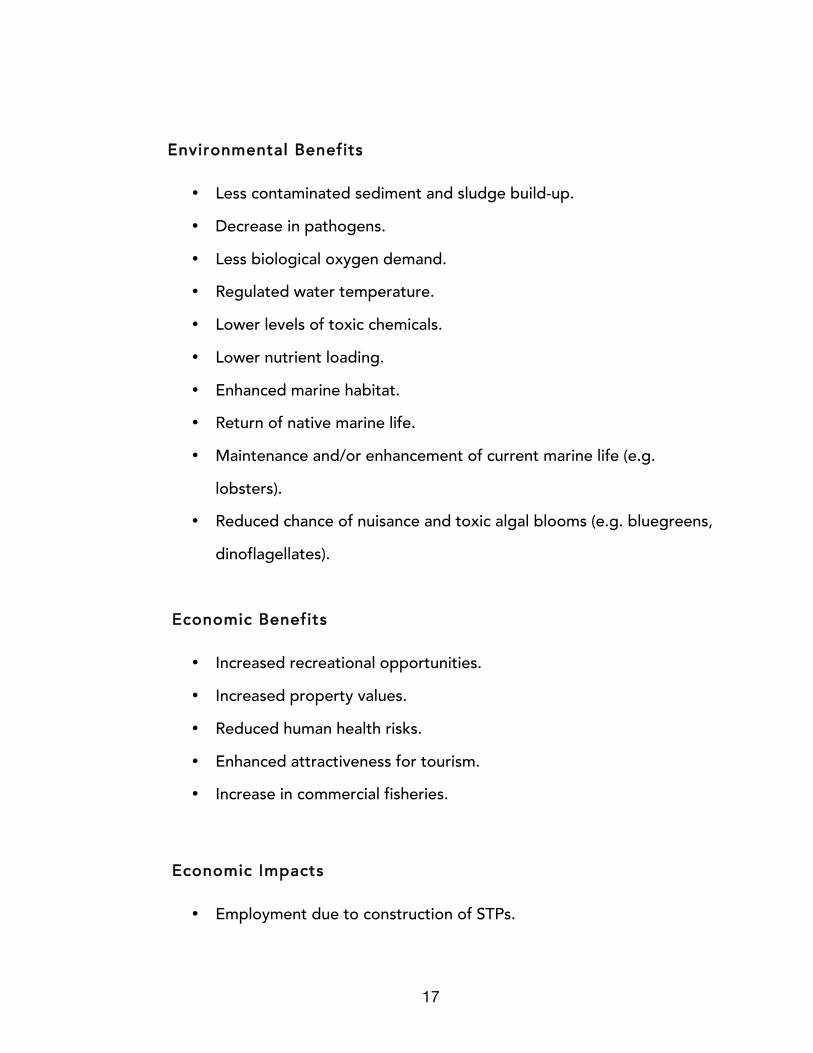
economic outcomes of investing in sewage treatment plants (Wilson, 2000):
17
Environmental Benefits
• Less contaminated sediment and sludge build-up.
• Decrease in pathogens.
• Less biological oxygen demand.
• Regulated water temperature.
• Lower levels of toxic chemicals.
• Lower nutrient loading.
• Enhanced marine habitat.
• Return of native marine life.
• Maintenance and/or enhancement of current marine life (e.g.
lobsters).
• Reduced chance of nuisance and toxic algal blooms (e.g. bluegreens,
dinoflagellates).
Economic Benefits
• Increased recreational opportunities.
• Increased property values.
• Reduced human health risks.
• Enhanced attractiveness for tourism.
• Increase in commercial fisheries.
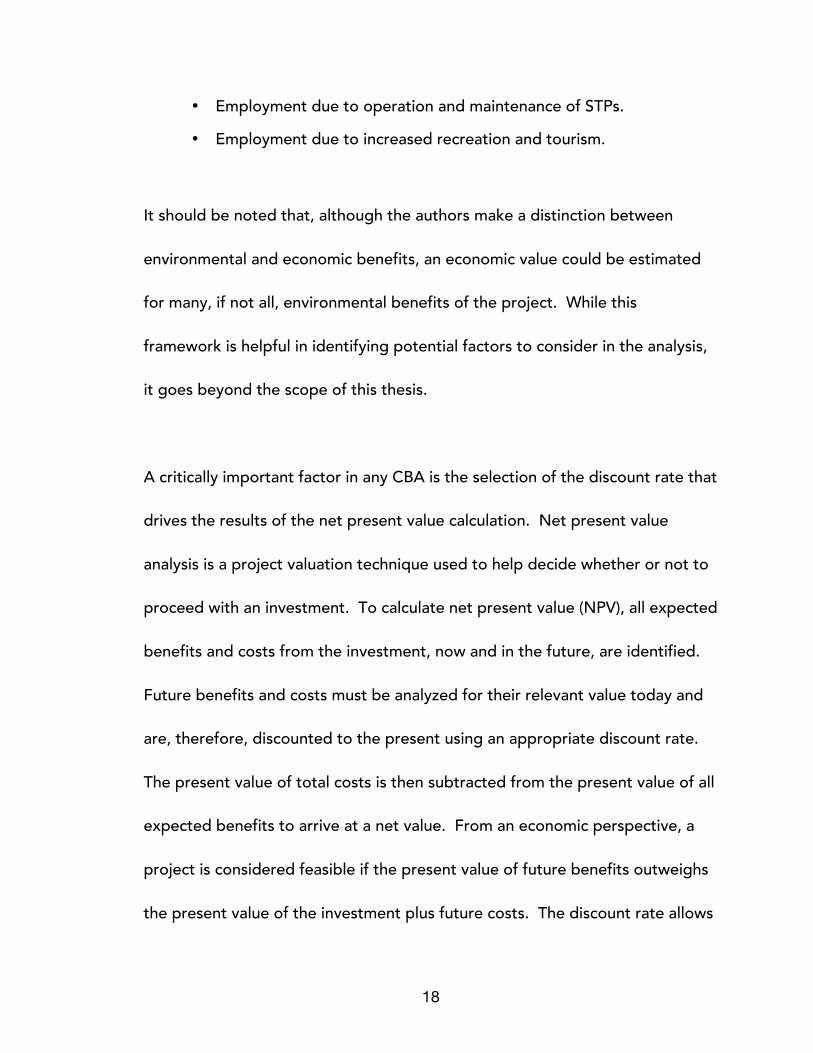
Economic Impacts
• Employment due to construction of STPs.
18
• Employment due to operation and maintenance of STPs.
• Employment due to increased recreation and tourism.
It should be noted that, although the authors make a distinction between
environmental and economic benefits, an economic value could be estimated
for many, if not all, environmental benefits of the project. While this
framework is helpful in identifying potential factors to consider in the analysis,
it goes beyond the scope of this thesis.
A critically important factor in any CBA is the selection of the discount rate that
drives the results of the net present value calculation. Net present value
analysis is a project valuation technique used to help decide whether or not to
proceed with an investment. To calculate net present value (NPV), all expected
benefits and costs from the investment, now and in the future, are identified.
Future benefits and costs must be analyzed for their relevant value today and
are, therefore, discounted to the present using an appropriate discount rate.
The present value of total costs is then subtracted from the present value of all
expected benefits to arrive at a net value. From an economic perspective, a
project is considered feasible if the present value of future benefits outweighs
the present value of the investment plus future costs. The discount rate allows

19
for the comparison of costs and benefits that occur over a period of years. It is
the “the rate at which society discounts future costs and benefits and converts
them into present values” (Boardman, Moore, & Vining, 2008, p. 3). While the
selection of a discount rate has generated much controversy in the literature, a
common practice in public investment decisions in Canada has emerged. In
evaluating federal government projects, two rates are conventionally applied
to CBA: the private and social discount rate. “The [private] discount rate will
be a weighted average of the costs of funds from the three sources outlined
above: the rate of return on postponed investment, the rate of interest (net of
tax) on domestic savings, and the marginal cost of additional foreign capital
inflows. The weights are equal to the proportion of funds sourced from
domestic private-sector investors, domestic private-sector savers, and foreign
savers” (Treasury Board of Canada Secretariat, 2007, p. 37). “The social
discount rate is defined as the minimum real rate of return that a public
investment must earn if it is to be a worthwhile undertaking. It is intended to
reflect the real rate of return foregone in the private sector when resources are
shifted to the public sector” (Burgess, 1981, p. 383). The Treasury Board of
Canada (TBOC) uses a private rate of 8% and a social rate of 3% based on the
weighted social opportunity cost of capital (WSOC) (Treasury Board of Canada
Secretariat, 2007). The WSOC is determined by computing the weighted
20
average of the economic cost of funds from the following (Jenkins & Kuo,
2007):
1. The rate of return on postponed or displaced investment.
2. The social cost of new domestic savings.
3. The marginal cost of incremental foreign capital inflows.
Recent work by Boardman et al. (2010) suggests that the 8% WSOC used in
federal CBA is too high for a number of reasons. The authors argue that the
8% rate is “not justified by the actual marginal private-sector ROI; the weights
used to compute it put too much emphasis on displaced private-sector
investment; the use of market-based proxies is problematic; and it does not
account well for intergenerational issues,” (p. 21). Spiro (2010) supports this
contention with current TBOC guidelines and argues that the social discount
rate should be reviewed annually to better reflect the volatility of global
financial markets and, therefore, the true opportunity cost of capital. He
points out that the financial crisis that began in 2008 drove interest rates to
record lows in many industrial economies and that “in the future, real rates
may rise again, if demand and supply conditions change, but for investment
21
projects undertaken in the near term, it is appropriate to use a correspondingly
low discount rate,” (p. 9).
Although the arguments these authors make are compelling, the TBOC
maintains their position on the 3% and 8% discount rates and these rates will
be applied in the cost-benefit analysis in this thesis.
22
CHAPTER 3. METHODOLOGY
This assessment involves the analysis of a range of data gathered from current
literature, stakeholder interviews, and consultation with community groups and
government departments at all levels. This thesis will summarize findings from:
1. A valuation of the economic benefits derived from the wild soft-shell
clam harvest in the Annapolis Basin.
2. A cost-benefit analysis of the proposed upgrade to the Digby STP.
3. A qualitative summary of the range of other socioeconomic implications
of the contamination of the Annapolis Basin.
3.1 Economic Benefits
For the purposes of this thesis, economic benefits derived from the wild soft-
shell clam harvest will be limited to the landed value of the fishery – that is, the
amount paid to harvesters by processors for the clams they harvest; value
added to the harvested clams through processing and packaging; the
Employment Insurance benefits claimed by clam harvesters in the off season;
and operational cost savings derived from the investment in the upgrade.
23
3.2 Cost-Benefit Analysis
The cost-benefit analysis involves estimating the costs and benefits of
upgrading the STP as they relate to the soft-shell clam industry, its
stakeholders, and The Province of Nova Scotia. The analysis is isolated to the
interaction between the plant and clam industry, whereby costs will be
expressed as those directly related to plant upgrade and operation, and
benefits will relate directly to production and value-added activity resulting
from the Annapolis Basin clam harvest.
3.3 Net Present Value Approach
The estimation of the economic implications for the soft-shell clam industry of
sewage treatment plant contamination of the Annapolis Basin will be
conducted using a net present value approach. Net present value analysis is a
project valuation technique used to help decide whether or not to proceed
with an investment. To calculate NPV, all expected benefits and costs from the
investment, now and in the future, are identified and totaled. Future benefits
and costs must be analyzed for their relevant value today and are, therefore,
discounted to the present using an appropriate discount rate. The present
value of costs is then subtracted from the present value of all expected
benefits to arrive at a net value. From an economic perspective, a project is
24
considered feasible if the present value of future benefits outweighs the
present value of the investment plus future costs.
3.4 Accounting Stance
Accounting stance refers to the spatial frame of reference in which the benefits
and costs related to the project occur. Standard practice in CBA is to set the
spatial boundaries of the analysis based on where the bulk of the impacts will
be felt (Riely & Rockland, 1988). In the case of upgrades to the Digby STP, it
could be argued that the costs and benefits are almost entirely local. Because
the project will be funded, in part, by the Province of Nova Scotia, the
accounting stance taken in the CBA is provincial and only the provincial share
of the cost is relevant to the analysis. Economic impact will therefore be
assessed by identifying costs and benefits that accrue to the province and not
beyond. In the same way, the federal portion of the total investment in the
sewage plant upgrade will be deducted in order to isolate the relevant
provincial share of the investment. Federal transfers, such as net Employment
Insurance claims, are included as they are considered benefits to the province.
If the CBA were to be conducted to assess the project’s viability from a
national perspective, the federal contribution to the cost of the project would
be included, and Employment Insurance transfers would need to be removed,
25
as their net effect would be zero. Likewise, CBA could be conducted from a
federal perspective alone, which would require excluding the provincial
contribution and treating Employment Insurance transfers as a cost.
3.5 Data Gathering
To assess the economic implications and impact of sewage bypass at the Digby
STP for the Annapolis Basin soft-shell clam industry, primary data were
gathered through consultations with key industry, community, and government
stakeholders. Secondary research was conducted through the review of
government documents, research reports, and the broader academic literature.
3.5.1 Interviews
Structured and informal interviews were conducted with individuals involved in
harvesting, processing, fisheries management, regulation and enforcement,
community organization, science and academia, as well as municipal, provincial,
and federal government. No interview form was used, as each interview was
unique in its objective, content, and data gathered.
3.5.2 Secondary Research
26
Current academic studies, government publications, and reports from
independent consultants and non-governmental organizations were used in the
review of the literature and to inform the methodology in the empirical
analysis.
3.6 Assumptions
In conducting the economic analysis, the following assumptions were made:
1. The closure of the Annapolis Basin soft-shell clam harvest has been a
direct result of sewage bypass at the Digby STP and the subsequent
bacterial contamination of harvest areas.
2. Average annual soft-shell clam landings can be achieved over the
project’s economic life.
3. All open area harvesters pay Employment Insurance premiums and
collect benefits between clam harvesting seasons.
4. All benefits and costs associated with the project will be isolated to
those that are attributable to The Province of Nova Scotia.
5. The analysis will focus on benefits and costs that will occur in The
Province of Nova Scotia with the STP upgrade but not without it. They
27
are, therefore, incremental to other economic activity that would occur
in the absence of the project.
6. Project implementation is assumed to begin in 2012. Analysis was
conducted for a 20-year period, which is the estimated economic life
cycle of the upgrade.
7. Cost-benefit analysis was conducted using both 8% and 3% discount
rates, as per the Treasury Board of Canada’s 2007 guidelines.
Cost estimates for the STP upgrade have been confirmed and are relevant as
of October 30, 2009.
28
CHAPTER 4. ECONOMIC ANALYSIS
The following analysis was conducted to determine the economic implications
to the Annapolis Basin soft-shell clam industry of the decision to invest in an
upgrade of the Digby STP. The question asked was whether the prevention of
future fishery closures as a result of the STP upgrade would result in a net
benefit or cost to the Province of Nova Scotia. This was answered by
examining the net present value of a narrow range of principal costs and
benefits associated with the upgrade and clam harvest.
4.1 Principal Benefits
The principal benefits that flow to The Province of Nova Scotia related to the
upgrade of the Digby STP and a fully-operational soft-shell clam fishery include
the landed value of the resource, value added to the resource by processors,
net employment insurance benefits earned by harvesters in the offseason, and
operational cost savings generated for two municipalities in the region.
Calculation of each of these principal benefits is described in the following.
4.1.1 Landed Value
Landed value refers to the market value transferred from processors to
harvesters through the buying of harvested whole soft-shell clams. The
29
estimation of landed value is based on the assumption that the industry can
achieve average landings experienced over the past decade. Although the
soft-shell clam harvest has been subject to significant variation in landings from
year to year, recent efforts have been made to establish more sustainable
management practices which, if implemented, could have a positive impact on
production going forward. 4 Furthermore, variability in landings has been due,
in part, to mandated beach closures resulting from STP bypass. Should this
problem be remedied, soft-shell clam landings can be assumed to regain
consistency in the coming years.
Soft-shell clam landings in the Annapolis Basin varied widely from 1999 to
2008, ranging from a low of $69,000 in 2008 to approximately $1.4 million in
2001. Chart 1 below describes this trend:
4 Clean Annapolis River Project. Personal interview. April 2009.

30
While the exact causes of these fluctuations are not known, stakeholders
describe a boom-bust cycle that has seen high, unsustainable levels of
harvesting during years of strong market prices and high demand. These high-
landing years are then followed by declining harvests and low production as
depleted clam stocks take time to recover. Annual soft-shell clam landings in
the Annapolis Basin from 1999 to 2008 are summarized in Table 2 below (Riely
& Rockland, 1988):
Table 2: Annapolis Basin Soft-Shell Clam Landed Value, 1999 to 2008
‘99 ‘00 ‘01 ‘02 ‘03 ‘04 ‘05 ‘06 ‘07 ‘08 Landed
value ($000) 252 556 1,388 938 834 1,063 475 216 130 69
$375,000
$750,000
$1,125,000
$1,500,000
1999 2000 2001 2002 2003 2004 2005 2006 2007 20081999 2000 2001 2002 2003 2004 2005 2006 2007 2008
Figure 1. Annapolis Basin Soft-Shell Clams Landed Values, 1999 to 2008
31
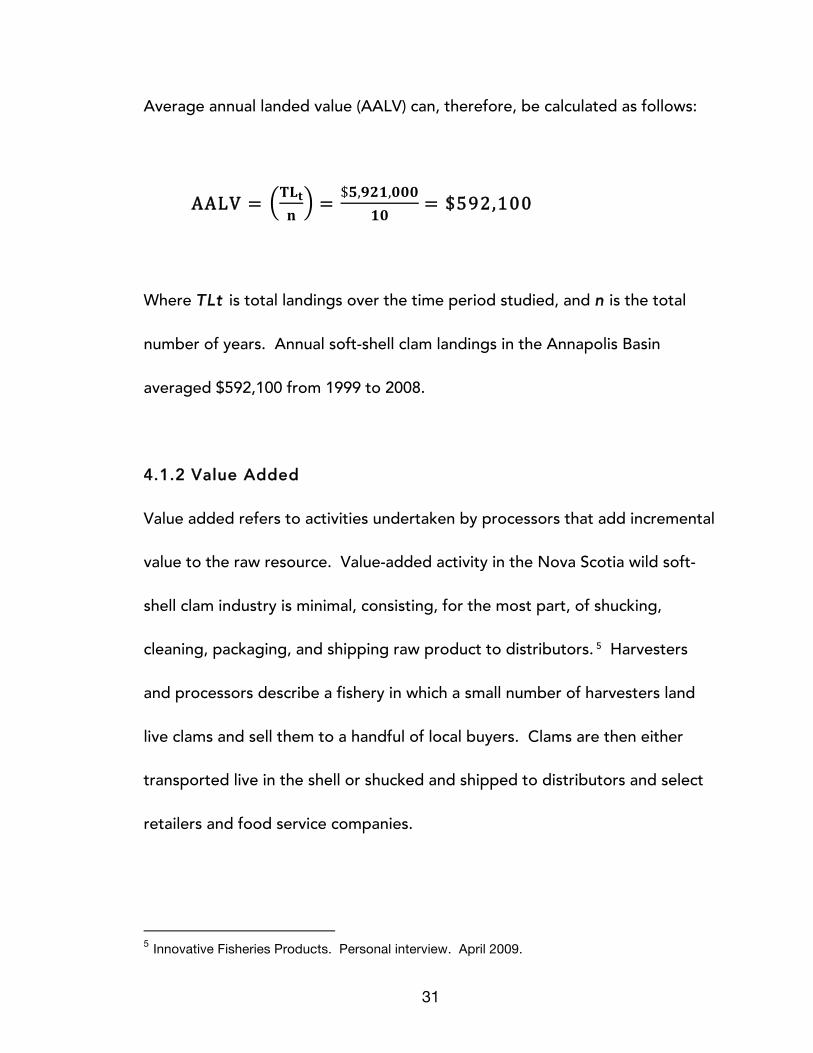
Average annual landed value (AALV) can, therefore, be calculated as follows:
AALV = 𝐓𝐋𝐭𝐧
= $𝟓,𝟗𝟐𝟏,𝟎𝟎𝟎
𝟏𝟎 = $592,100
Where TLt is total landings over the time period studied, and n is the total
number of years. Annual soft-shell clam landings in the Annapolis Basin
averaged $592,100 from 1999 to 2008.
4.1.2 Value Added
Value added refers to activities undertaken by processors that add incremental
value to the raw resource. Value-added activity in the Nova Scotia wild soft-
shell clam industry is minimal, consisting, for the most part, of shucking,
cleaning, packaging, and shipping raw product to distributors. 5 Harvesters
and processors describe a fishery in which a small number of harvesters land
live clams and sell them to a handful of local buyers. Clams are then either
transported live in the shell or shucked and shipped to distributors and select
retailers and food service companies.
5 Innovative Fisheries Products. Personal interview. April 2009.
32
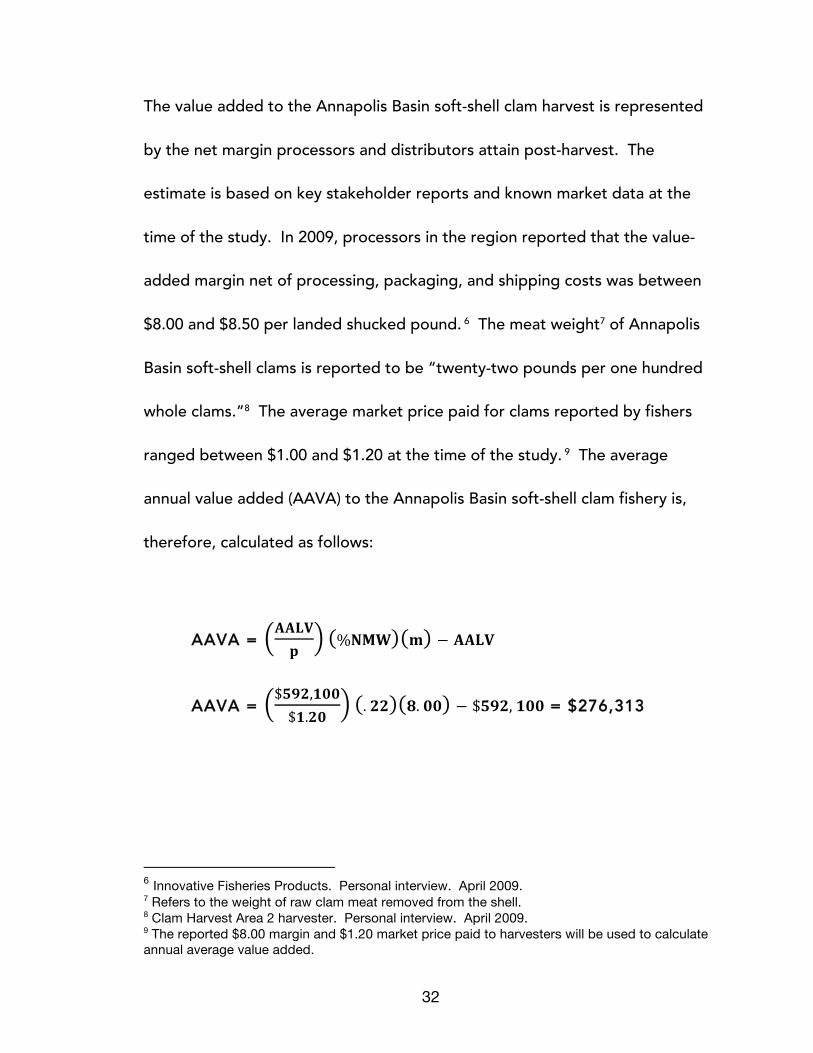
The value added to the Annapolis Basin soft-shell clam harvest is represented
by the net margin processors and distributors attain post-harvest. The
estimate is based on key stakeholder reports and known market data at the
time of the study. In 2009, processors in the region reported that the value-
added margin net of processing, packaging, and shipping costs was between
$8.00 and $8.50 per landed shucked pound. 6 The meat weight7 of Annapolis
Basin soft-shell clams is reported to be “twenty-two pounds per one hundred
whole clams.”8 The average market price paid for clams reported by fishers
ranged between $1.00 and $1.20 at the time of the study. 9 The average
annual value added (AAVA) to the Annapolis Basin soft-shell clam fishery is,
therefore, calculated as follows:
AAVA = 𝐀𝐀𝐋𝐕𝐩
%𝐍𝐌𝐖 𝐦 − 𝐀𝐀𝐋𝐕
AAVA = $𝟓𝟗𝟐,𝟏𝟎𝟎$𝟏.𝟐𝟎
. 𝟐𝟐 𝟖. 𝟎𝟎 − $𝟓𝟗𝟐, 𝟏𝟎𝟎 = $276,313
6 Innovative Fisheries Products. Personal interview. April 2009. 7 Refers to the weight of raw clam meat removed from the shell. 8 Clam Harvest Area 2 harvester. Personal interview. April 2009. 9 The reported $8.00 margin and $1.20 market price paid to harvesters will be used to calculate annual average value added.
33
Where AALV is average annual landed value, p is the market price paid to
fishers, %NMW is the percentage net meat weight upon which value is added,
and m is the net margin attained by processors (in dollars).
The average value added to the Annapolis Basin soft-shell clam fishery is
estimated at approximately $276,313 per year.
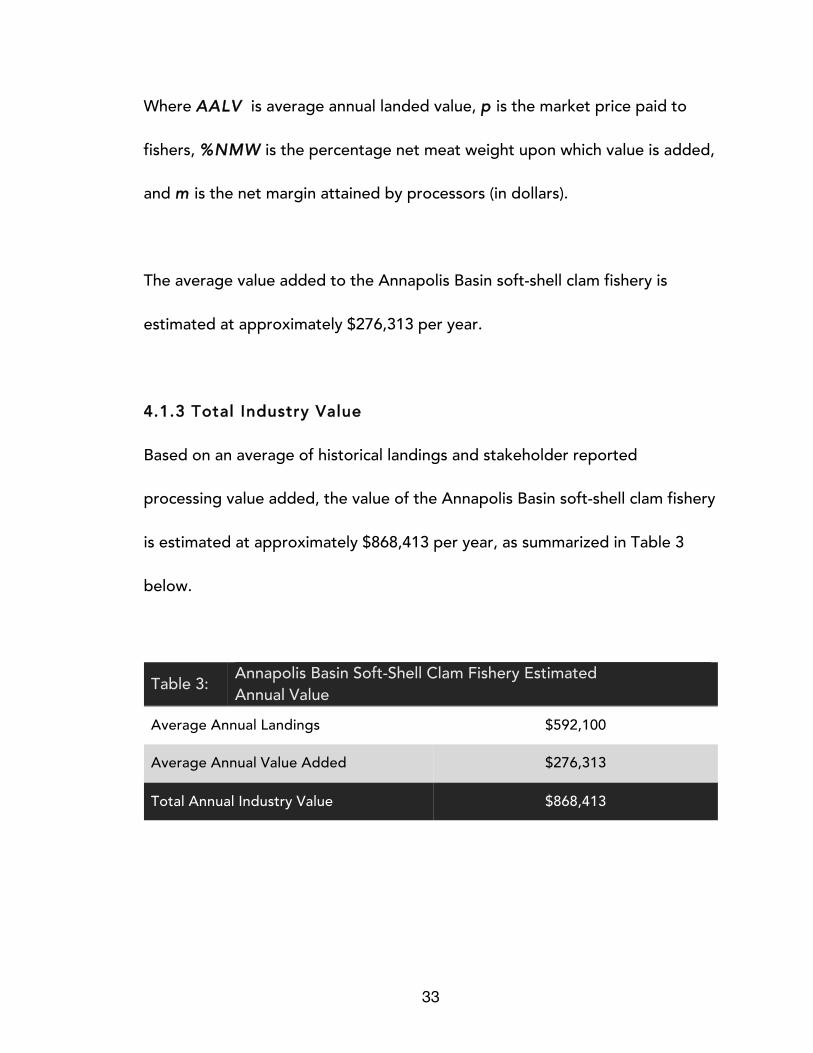
4.1.3 Total Industry Value
Based on an average of historical landings and stakeholder reported
processing value added, the value of the Annapolis Basin soft-shell clam fishery
is estimated at approximately $868,413 per year, as summarized in Table 3
below.
Table 3: Annapolis Basin Soft-Shell Clam Fishery Estimated Annual Value
Average Annual Landings $592,100
Average Annual Value Added $276,313
Total Annual Industry Value $868,413
34
It should be noted that this figure represents the value of the wild harvest only.
There is a strong and active soft-shell clam aquaculture industry in the basin for
which production data are unavailable. 10 Local stakeholders estimate
production from this fishery to be at least equal to if not greater than that of
the wild harvest. 11 Department of Fisheries and Oceans reported
approximately $400,000 in clam aquaculture production in 2007, which
supports the anecdotal estimate for that year. 12 Because the aquaculture
industry is based on the process of depuration13 and will function with or
without the upgrade, it has been excluded from the cost-benefit analysis that
follows.
4.1.4 Employment Insurance Benefits
Employment Insurance (EI) is a federal government program that provides
temporary financial assistance to Canadian workers who are temporarily or
permanently unemployed (Government of Canada, 2009). A special EI
program exists for self-employed workers in fishing industries. EI fishing
benefits are based on earnings reported from fishing activity, not hours of
10 Aquaculture production statistics by district are suppressed by the Department of Fisheries and Oceans to protect the privacy of the processors in the area. 11 Nova Scotia Department of Natural Resources staff. Personal interview. April 2009. 12 Ibid. 13 Refers to the process whereby contaminated clams are moved to seawater storage tanks for a period of time that allows contaminants to be filtered and removed.
35
work as in other EI programs. For fishers, total EI benefits are determined by
factors that include reported earnings, length of season, and the
unemployment rate in the region in which fishing occurred. Maximum weekly
EI benefits are calculated as follows:
Max Weekly EI = 𝐓𝐨𝐭𝐚𝐥 𝐑𝐞𝐩𝐨𝐫𝐭𝐞𝐝 𝐄𝐚𝐫𝐧𝐢𝐧𝐠𝐬𝐌𝐢𝐧𝐢𝐦𝐮𝐦 𝐃𝐢𝐯𝐢𝐬𝐨𝐫
x 55%
The minimum divisor is a factor applied to total reported earnings and is based
on the unemployment rate in the region in which employment was based
(Government of Canada, 2012a). EI benefits are paid net of EI premiums,
which are deducted from total pre-tax earnings.
Because the accounting stance taken in the assessment of impact is The
Province of Nova Scotia, employment insurance claims must be considered an
economic gain that results from soft-shell clam harvest activity. EI represents a
significant and important source of income for clam harvesters during closure
and off-season periods. It is assumed that harvesters’ income in the wild
fishery is gained through the sale of clams to secondary buyers or processors,
and is, therefore, equal to landed values reported. Estimated average annual
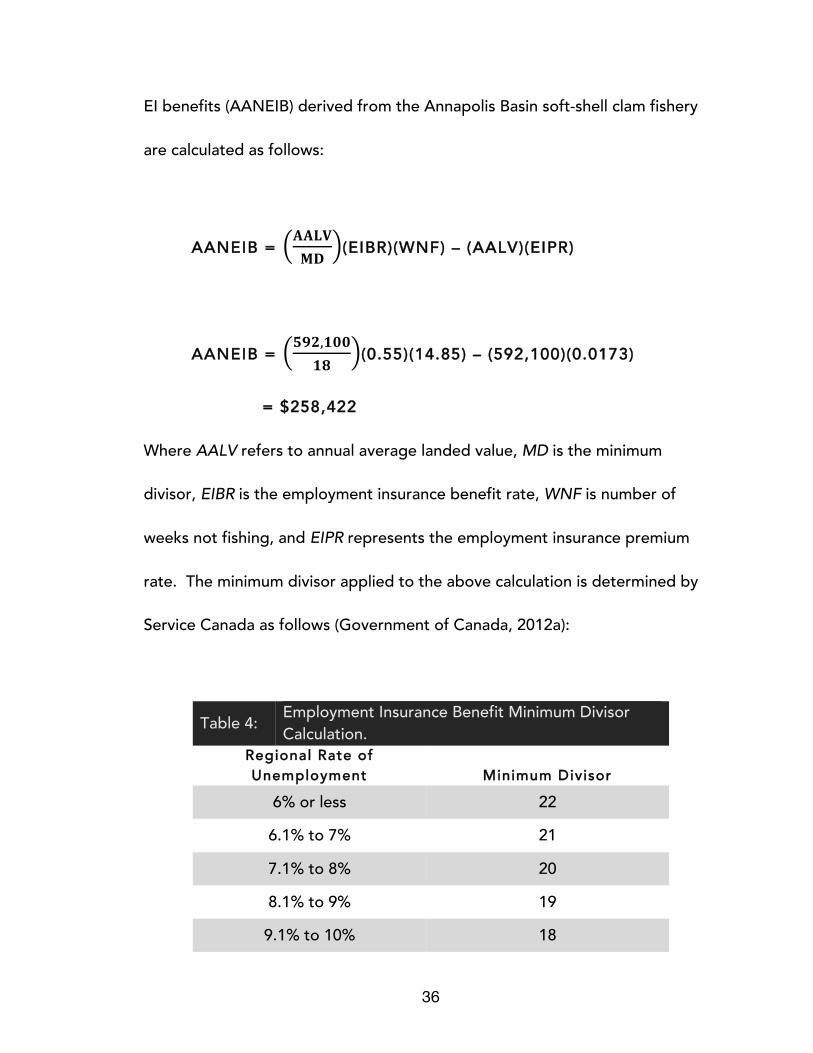
36
EI benefits (AANEIB) derived from the Annapolis Basin soft-shell clam fishery
are calculated as follows:
AANEIB = 𝐀𝐀𝐋𝐕𝐌𝐃
(EIBR)(WNF) – (AALV)(EIPR)
AANEIB = 𝟓𝟗𝟐,𝟏𝟎𝟎𝟏𝟖
(0.55)(14.85) – (592,100)(0.0173)
= $258,422
Where AALV refers to annual average landed value, MD is the minimum
divisor, EIBR is the employment insurance benefit rate, WNF is number of
weeks not fishing, and EIPR represents the employment insurance premium
rate. The minimum divisor applied to the above calculation is determined by
Service Canada as follows (Government of Canada, 2012a):
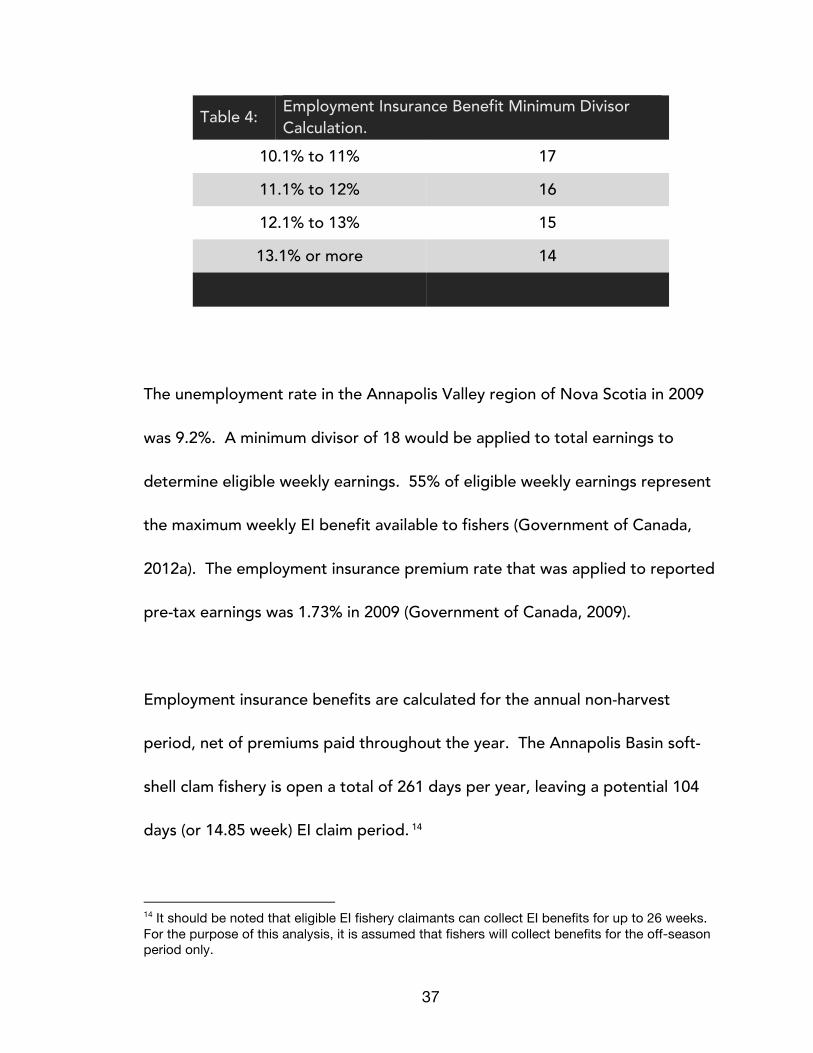
Table 4: Employment Insurance Benefit Minimum Divisor Calculation.
Regional Rate of Unemployment Minimum Divisor
6% or less 22
6.1% to 7% 21
7.1% to 8% 20
8.1% to 9% 19
9.1% to 10% 18
37
Table 4: Employment Insurance Benefit Minimum Divisor Calculation.
10.1% to 11% 17
11.1% to 12% 16
12.1% to 13% 15
13.1% or more 14
The unemployment rate in the Annapolis Valley region of Nova Scotia in 2009
was 9.2%. A minimum divisor of 18 would be applied to total earnings to
determine eligible weekly earnings. 55% of eligible weekly earnings represent
the maximum weekly EI benefit available to fishers (Government of Canada,
2012a). The employment insurance premium rate that was applied to reported
pre-tax earnings was 1.73% in 2009 (Government of Canada, 2009).
Employment insurance benefits are calculated for the annual non-harvest
period, net of premiums paid throughout the year. The Annapolis Basin soft-
shell clam fishery is open a total of 261 days per year, leaving a potential 104
days (or 14.85 week) EI claim period. 14
14 It should be noted that eligible EI fishery claimants can collect EI benefits for up to 26 weeks. For the purpose of this analysis, it is assumed that fishers will collect benefits for the off-season period only.

38
4.1.5 Operational Cost Savings
It is estimated that the proposed upgrade of the Digby STP will result in
operational efficiencies that will allow for cost sharing between Digby County
and the Town of Digby, resulting in a cost reduction (benefit) of $107,000 per
year.
4.1.6 Total Annual Benefits
The total principal benefits that flow to The Province of Nova Scotia related to
the STP upgrade and a fully-operational soft-shell clam harvest uninterrupted
by beach closures are summarized in Table 5 below:
Table 5: Annapolis Basin Soft-Shell Clam Industry Estimated Annual Benefits
Landed Value $592,100
Value Added $276,313
Net Employment Insurance Benefits $258,422
Operational Cost Savings $107,000
Total Annual Benefits $1,126,835
Total annual principal benefits resulting from the STP upgrade are estimated at
$1,126,835.
39
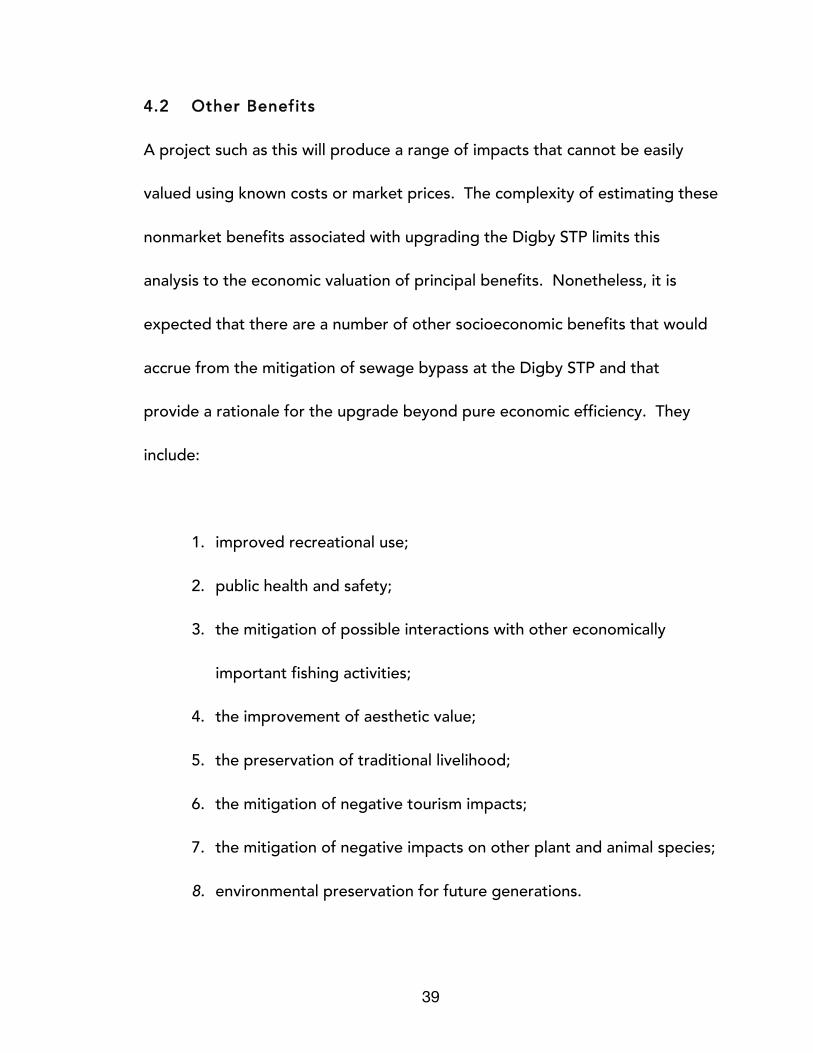
4.2 Other Benefits
A project such as this will produce a range of impacts that cannot be easily
valued using known costs or market prices. The complexity of estimating these
nonmarket benefits associated with upgrading the Digby STP limits this
analysis to the economic valuation of principal benefits. Nonetheless, it is
expected that there are a number of other socioeconomic benefits that would
accrue from the mitigation of sewage bypass at the Digby STP and that
provide a rationale for the upgrade beyond pure economic efficiency. They
include:
1. improved recreational use;
2. public health and safety;
3. the mitigation of possible interactions with other economically
important fishing activities;
4. the improvement of aesthetic value;
5. the preservation of traditional livelihood;
6. the mitigation of negative tourism impacts;
7. the mitigation of negative impacts on other plant and animal species;
8. environmental preservation for future generations.

40
Benefits such as these are commonly estimated in CBA using direct nonmarket
valuation techniques. These approaches to valuation attempt to measure the
impact of a decision or investment on the utility or welfare of individuals or
society (Committee on Assessing, Aquatic, & Related Terrestrial Ecosystems,
2004). The techniques used often involve complex survey-based research that
is beyond the scope of this thesis. Furthermore, the value of benefits listed
above would most likely be significant and would only strengthen the case that
the upgrade of the STP is justified. For these reasons, measurement of other
potential socio-economic benefits will not be conducted.
4.3 Principal Costs
The primary cost against which benefits are assessed is the investment in the
Digby STP upgrade. In assessing the cost and viability of remediating the
bypass problem at the plant, a number of upgrade options were proposed.
After examining a number of options, a decision was made by the Town of
Digby to make building and equipment upgrades to the existing plant and
develop infrastructure that would allow the town to pump raw sewage to
nearby Smith’s Cove. Under this option, the existing sewage lagoon would be
enlarged to handle increased volume pumped from the expanded treatment
plant. The engineering study commissioned by the town concluded “this

41
option showed the least cost over a wide range of financial conditions. It is
also the most reliable, as lagoon systems offer better stability of the biological
processes involved and have enough holding capacity to ride out power
interruptions” (Hiltz and Seamone Co. Ltd., 2009, p. 1). Other key upgrades
include:
• The addition of aeration and pumping capacity at the Digby STP.
• Construction of additional holding cells at Smith’s Cove.
• Improved UV disinfection of sewage discharged into the Annapolis
Basin.
The estimated capital costs for the upgrade are summarized in Table 6 below
(Committee on Assessing et al., 2004):
Table 6: Digby Sewage Treatment Plant Upgrade Estimated Capital Cost
Lagoons, Construction and Piping $1,595,000
Buildings and Equipment $1,041,000
Engineering and Contingency $527,333
Additional Cell - Land Cost $200,000
Total Capital Cost $3,363,000
Less Federal Grant ($1,120,989)
Total Cost to Province of Nova Scotia $2,242,011
42
4.3 Net Present Value Analysis
To date, sewage bypass at the Digby STP has resulted in harvest area closures
of various lengths of time. In order to assess the economic impact of upgrading
the Digby STP, a NPV analysis was conducted under three possible scenarios
that model the prevention of a fishery closure of 65 days (25%), 130 days (50%)
and 261 days (full closure) of the season. For the purposes of this thesis,
analysis will be limited to these three scenarios. It should be noted that
harvesting bans of less than 65 days have been experienced, while full closures
have not occurred. Because the relevant frame of analysis involves identifying
incremental impacts that would occur with the upgrade and not without,
benefits accrue from maintaining operation of the fishery. Because all benefit
calculations are based on the Average Annual Landed Value (AALV) estimated
in Section 4.3, the AALV component of the NPV calculation is adjusted by the
percentage closure examined under each scenario.
4.3.1 Annual Net Benefits (Costs)
NPV is determined by discounting to the present the future stream of
estimated net benefits (or cash flows). The first step in the calculation is to
determine the annual net benefits that result from the prevention of a 25%
closure of the fishery due to an investment in the STP upgrade. Annual net

43
benefits under Scenario 1 (ANB1), Scenario 2 (ANB2), and Scenario 3 (ANB3) are
calculated as follows:
ANBi = (AALV+ AAVA + AANEIB+AOS)(%FC) – AOC
Where AALV is average annual landed value, AAVA is average annual value
added, AANEIB is the average annual net employment insurance benefit, AOS
is the annual operating cost savings, %FC is the percentage of the season the
fishery is closed, and AOC refers to annual operating cost of the STP.
ANB1 = (592,100+276,313+258,422+107,000)(.25) − $148,000
= $160,459
ANB2 = (592,100+276,313+258,422+107,000)(.50) − $148,000
= $468,918
ANBs = (592,100+276,313+258,422+107,000)(1.0) − $148,000
= $1,085,835
4.3.2 Net Present Value Scenario Analysis
As noted above, the NPV of future benefits (costs) that flow from the
prevention of the closure of the fishery due to STP upgrade is determined by
44
discounting to the present the future stream of estimated net benefits (costs)
calculated in 4.3.1.
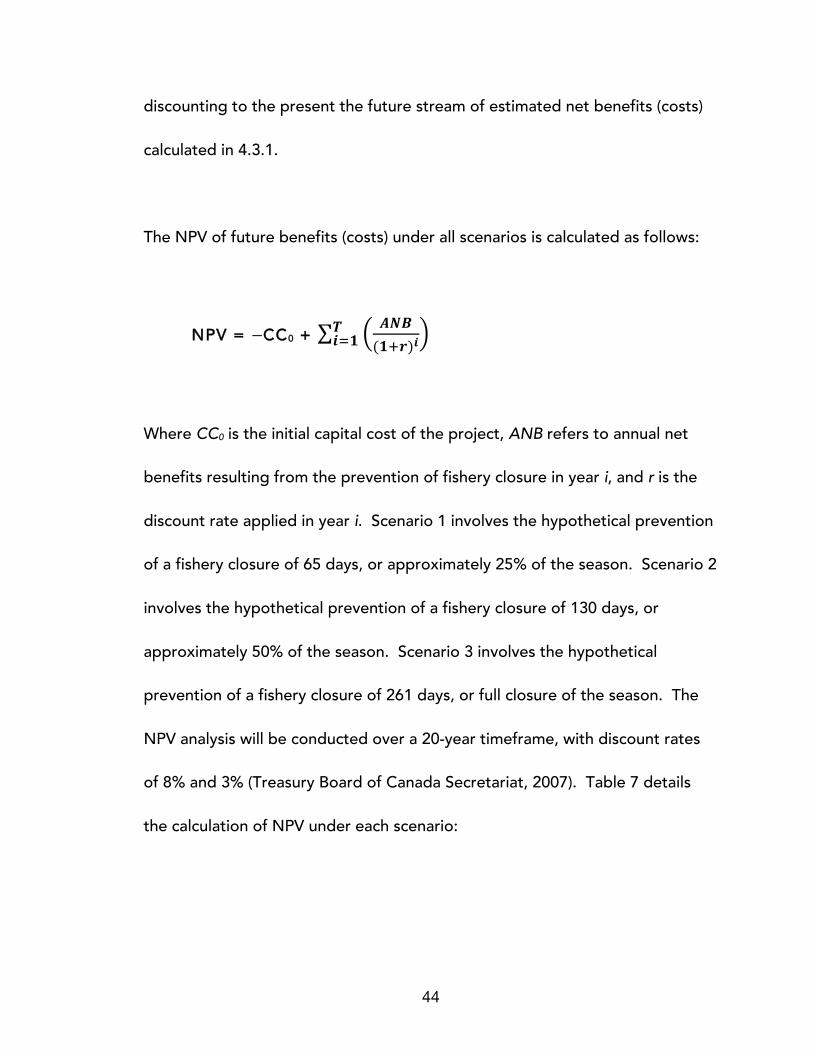
The NPV of future benefits (costs) under all scenarios is calculated as follows:
NPV = −CC0 + 𝑨𝑵𝑩(𝟏!𝒓)𝒊
𝑻𝒊!𝟏
Where CC0 is the initial capital cost of the project, ANB refers to annual net
benefits resulting from the prevention of fishery closure in year i, and r is the
discount rate applied in year i. Scenario 1 involves the hypothetical prevention
of a fishery closure of 65 days, or approximately 25% of the season. Scenario 2
involves the hypothetical prevention of a fishery closure of 130 days, or
approximately 50% of the season. Scenario 3 involves the hypothetical
prevention of a fishery closure of 261 days, or full closure of the season. The
NPV analysis will be conducted over a 20-year timeframe, with discount rates
of 8% and 3% (Treasury Board of Canada Secretariat, 2007). Table 7 details
the calculation of NPV under each scenario:
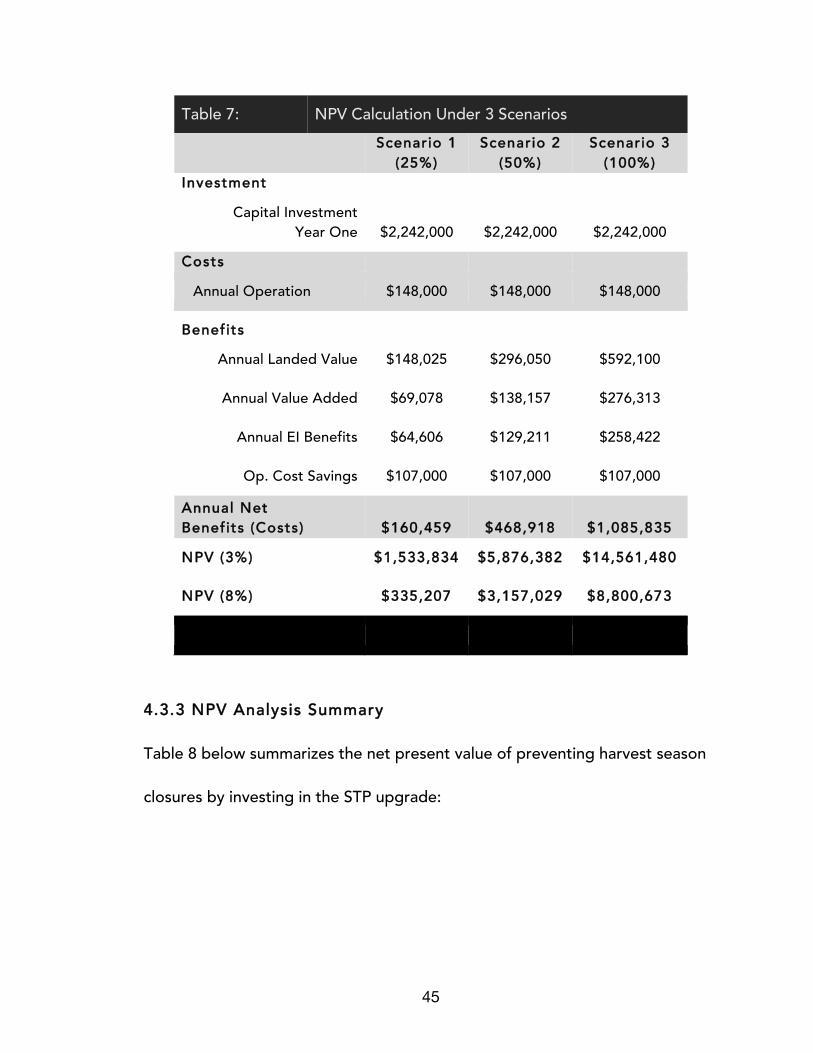
45
Table 7: NPV Calculation Under 3 Scenarios
Scenario 1 (25%)
Scenario 2 (50%)
Scenario 3 (100%)
Investment
Capital Investment Year One $2,242,000 $2,242,000 $2,242,000
Costs
Annual Operation $148,000 $148,000 $148,000
Benefits
Annual Landed Value $148,025 $296,050 $592,100
Annual Value Added $69,078 $138,157 $276,313
Annual EI Benefits $64,606 $129,211 $258,422
Op. Cost Savings $107,000 $107,000 $107,000
Annual Net Benefits (Costs) $160,459 $468,918 $1,085,835
NPV (3%) $1,533,834 $5,876,382 $14,561,480
NPV (8%) $335,207 $3,157,029 $8,800,673
4.3.3 NPV Analysis Summary
Table 8 below summarizes the net present value of preventing harvest season
closures by investing in the STP upgrade:
46
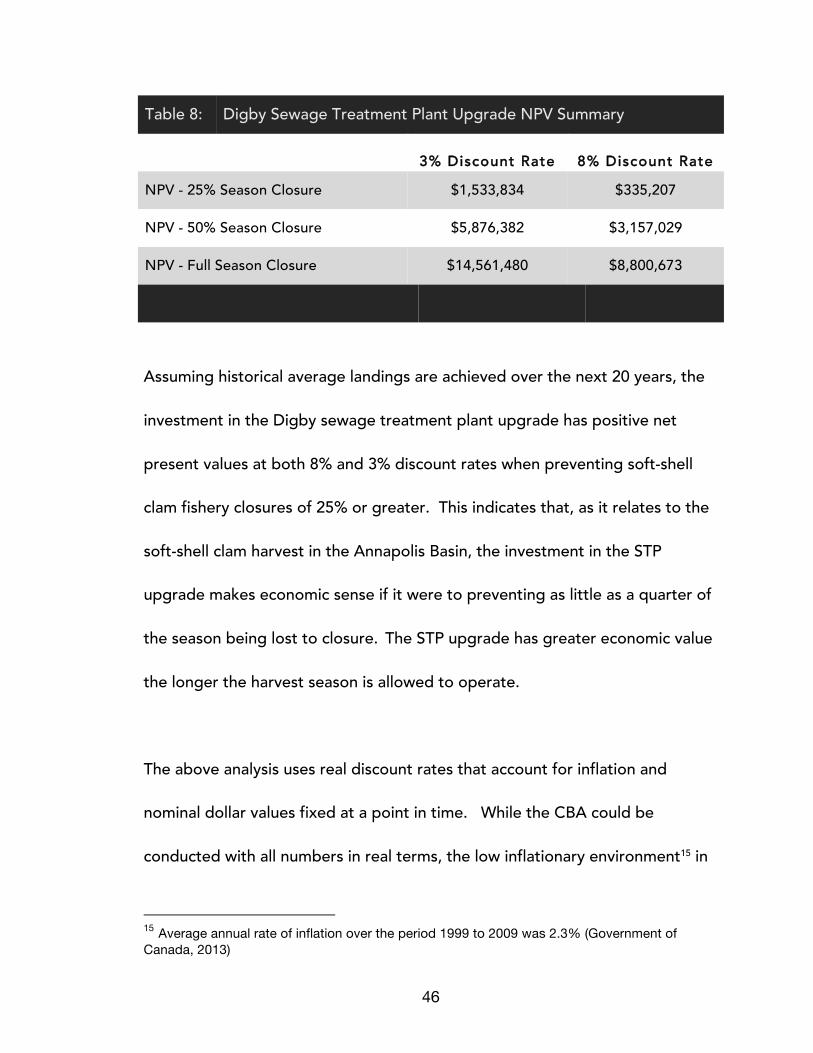
Table 8: Digby Sewage Treatment Plant Upgrade NPV Summary
3% Discount Rate 8% Discount Rate NPV - 25% Season Closure $1,533,834 $335,207
NPV - 50% Season Closure $5,876,382 $3,157,029
NPV - Full Season Closure $14,561,480 $8,800,673
Assuming historical average landings are achieved over the next 20 years, the
investment in the Digby sewage treatment plant upgrade has positive net
present values at both 8% and 3% discount rates when preventing soft-shell
clam fishery closures of 25% or greater. This indicates that, as it relates to the
soft-shell clam harvest in the Annapolis Basin, the investment in the STP
upgrade makes economic sense if it were to preventing as little as a quarter of
the season being lost to closure. The STP upgrade has greater economic value
the longer the harvest season is allowed to operate.
The above analysis uses real discount rates that account for inflation and
nominal dollar values fixed at a point in time. While the CBA could be
conducted with all numbers in real terms, the low inflationary environment15 in
15 Average annual rate of inflation over the period 1999 to 2009 was 2.3% (Government of Canada, 2013)
47
which this project was analyzed, the long-term nature of its impacts16, and
considerably positive NPV suggest that doing so would have little consequence
in the overall analysis of the project.
4.4 Net Present Value Breakeven
The NPV breakeven point, or internal rate of return, refers to the discount rate
that that must be applied to make the project’s benefits equal its costs, or
produce a NPV equal to 0. Finding the NPV breakeven point in this case
provides a way to evaluate whether the discount rates of 3% and 8% are
reasonable, given the low interest rate environment that currently exists in
Canada. The NPV breakeven rate is calculated as follows:
NPV = −CC0 + 𝑨𝑵𝑩(𝟏!𝒓)𝒊
𝑻𝒊!𝟏 = 0
Where CC0 is the initial capital cost of the project, ANB refers to annual net
benefits resulting from the prevention of fishery closure in year i, and r is the
discount rate applied in year i. To arrive at NPV = 0, values must be assumed
for r until the sum of the discounted net benefits is approximately equal to 0
16 Average annual rate of inflation from 2009 to 2011 was 1.8% (Government of Canada, 2013). The Bank of Canada reports inflation is expected to remain at 2% per year until 2021 (Bank of Canada, n.d.).
48
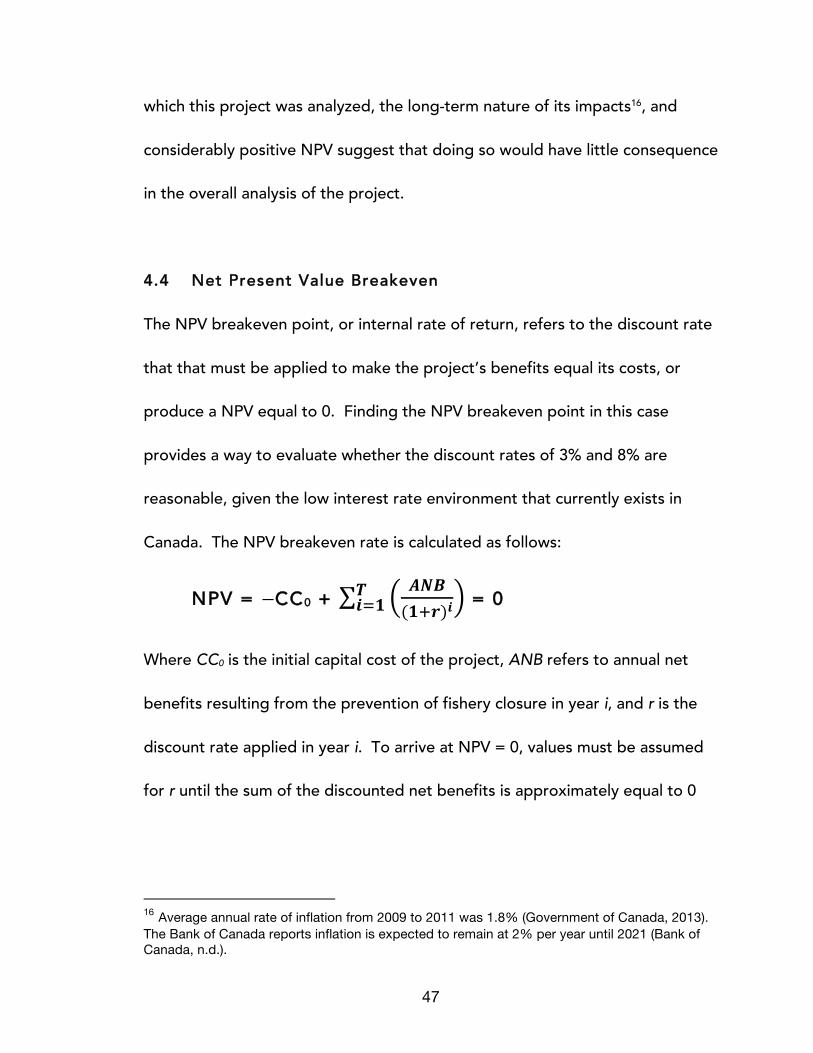
(Zerbe & Dively, 1994). The results for the Digby STP are summarized in Table
9 below:
Table 9: Digby Sewage Treatment Plant Upgrade NPV Breakeven Summary
Breakeven Rate NPV - 25% Season Closure 10.02%
NPV - 50% Season Closure 29.48%
NPV - Full Season Closure 93.01%
The above analysis demonstrates that, under full and 50% season closure
scenarios, the discount rate necessary to take the NPV to zero is so high as to
be unrealistic. Under a 25% closure scenario, a breakeven discount of 10.02%
is required to return an NPV of zero. While this rate is not that much greater
than the upper bound of 8% in the NPV analysis above, it too is unrealistic
given the low interest rate environment we are currently facing.
4.5 Sensitivity Analysis
Testing the robustness of the NPV analysis against a range of potential
changes in variables is an important part of this study. Because the results of
49
the analysis above indicate positive NPV values at both 3% and 8% under all
closure scenarios, the sensitivity analysis will test downside risk only (i.e.
downward pressure on prices and increases in cost). Sensitivity analysis was
conducted in order to test the impact of potential changes in key variables on
the results of this analysis. Key variables tested include:
1. Average annual landed value (AALV).
2. Value added margin.
3. Treatment plant construction cost.
4. Market price.
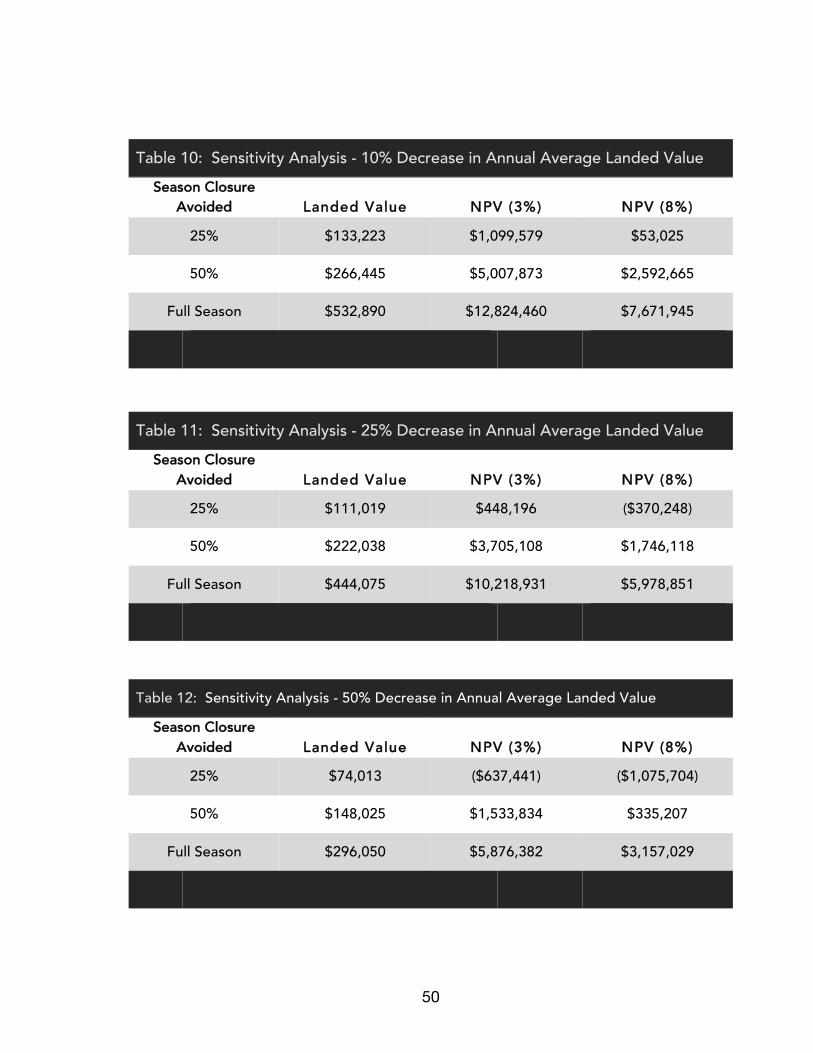
4.5.1 Average Annual Landed Value
Landed value is a function of both quantity harvested and market price paid to
harvesters by processors. Changes in either of these factors would drive
fluctuations in landed value. Decreases in average annual landed value of 5%,
10%, and 25% were tested. The results are summarized in Tables 10 to 12
below.
50
Table 10: Sensitivity Analysis - 10% Decrease in Annual Average Landed Value Season Closure
Avoided Landed Value NPV (3%) NPV (8%) 25% $133,223 $1,099,579 $53,025
50% $266,445 $5,007,873 $2,592,665
Full Season $532,890 $12,824,460 $7,671,945
Table 11: Sensitivity Analysis - 25% Decrease in Annual Average Landed Value Season Closure
Avoided Landed Value NPV (3%) NPV (8%) 25% $111,019 $448,196 ($370,248)
50% $222,038 $3,705,108 $1,746,118
Full Season $444,075 $10,218,931 $5,978,851
Table 12: Sensitivity Analysis - 50% Decrease in Annual Average Landed Value
Season Closure Avoided Landed Value NPV (3%) NPV (8%)
25% $74,013 ($637,441) ($1,075,704)
50% $148,025 $1,533,834 $335,207
Full Season $296,050 $5,876,382 $3,157,029
51
The above sensitivity analysis shows clearly that the NPV of the treatment plant
upgrade remains positive under most closure scenarios and percentage
decreases in landings tested. The NPV of the project turns negative under
25% closure scenarios with a 25% decrease in landings using an 8% discount
rate, as well as with a 50% decrease in landings using both 3% and 8% discount
rates. The likelihood of 25% or 50% declines in landed value sustained over
the life of the project is minimal.
4.5.2 Value-Added Margin
Margins in the Nova Scotia seafood-processing sector are vulnerable to a
range of supply- and demand-side pressures, including availability of raw
material, fluctuations in foreign exchange rates for exports, labour and other
input costs, and consumer demand for seafood products. A report produced
for the Nova Scotia Department of Fisheries and Aquaculture stated that
seafood processing value-added margins in Nova Scotia had been declining
from 2002 to 2007 (Gardner Pinfold Consultants & Rogers Consulting, 2007).
The authors explain that “margins are squeezed on both the cost and revenue
sides of the market. Higher raw material costs and rising operating costs are
driving production costs up. Revenues have declined mainly because of the
decline in the value of the U.S. dollar (30 - 35%), but also because of increased
52
competitive pressures from low cost producers and greater market strength of
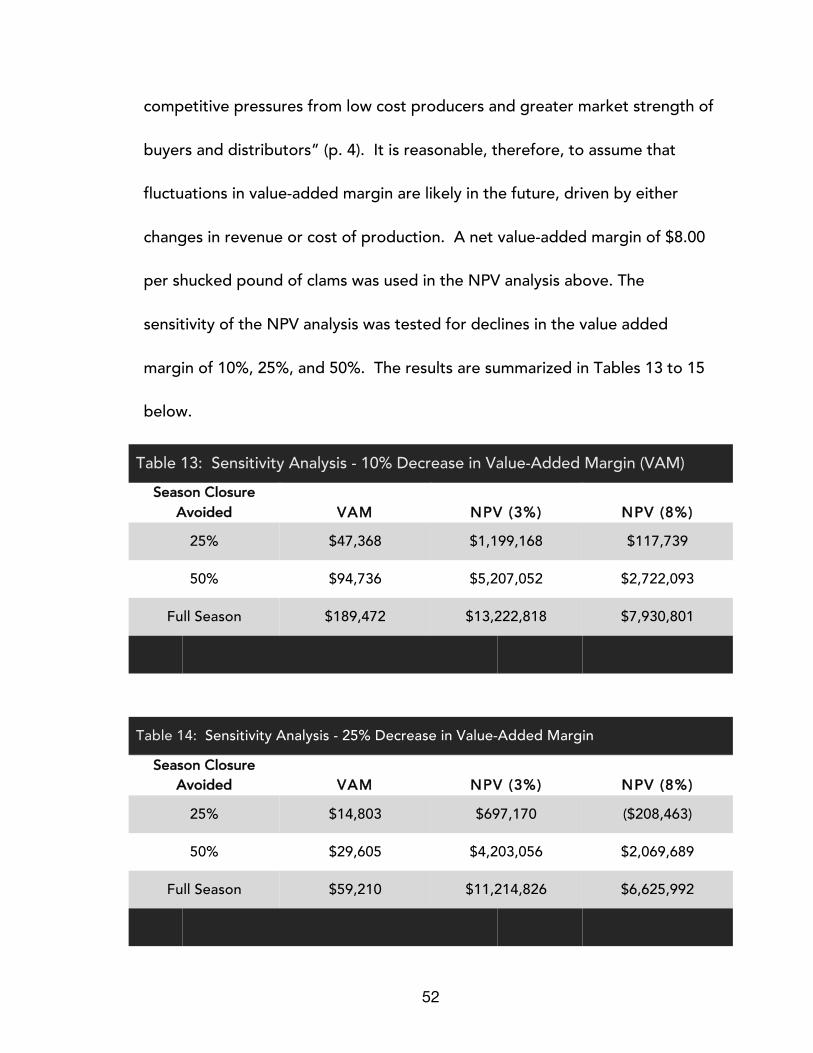
buyers and distributors” (p. 4). It is reasonable, therefore, to assume that
fluctuations in value-added margin are likely in the future, driven by either
changes in revenue or cost of production. A net value-added margin of $8.00
per shucked pound of clams was used in the NPV analysis above. The
sensitivity of the NPV analysis was tested for declines in the value added
margin of 10%, 25%, and 50%. The results are summarized in Tables 13 to 15
below.
Table 13: Sensitivity Analysis - 10% Decrease in Value-Added Margin (VAM) Season Closure
Avoided VAM NPV (3%) NPV (8%) 25% $47,368 $1,199,168 $117,739
50% $94,736 $5,207,052 $2,722,093
Full Season $189,472 $13,222,818 $7,930,801
Table 14: Sensitivity Analysis - 25% Decrease in Value-Added Margin
Season Closure Avoided VAM NPV (3%) NPV (8%)
25% $14,803 $697,170 ($208,463)
50% $29,605 $4,203,056 $2,069,689
Full Season $59,210 $11,214,826 $6,625,992
53
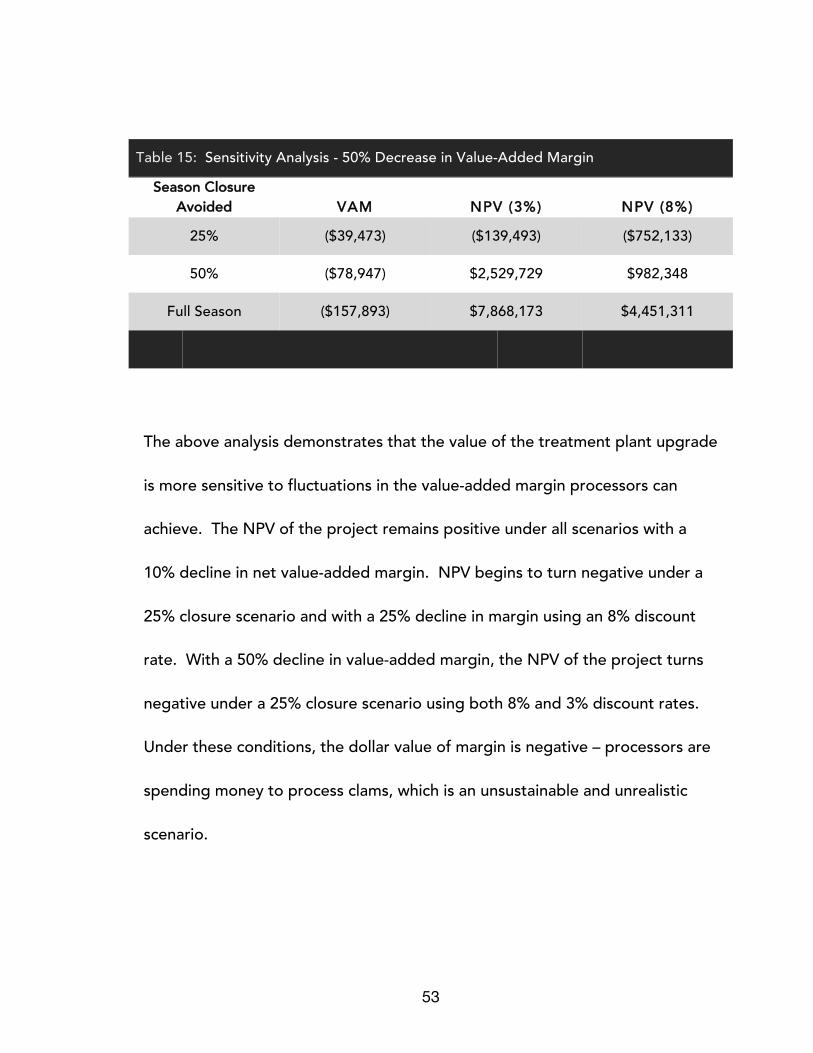
Table 15: Sensitivity Analysis - 50% Decrease in Value-Added Margin
Season Closure Avoided VAM NPV (3%) NPV (8%)
25% ($39,473) ($139,493) ($752,133)
50% ($78,947) $2,529,729 $982,348
Full Season ($157,893) $7,868,173 $4,451,311
The above analysis demonstrates that the value of the treatment plant upgrade
is more sensitive to fluctuations in the value-added margin processors can
achieve. The NPV of the project remains positive under all scenarios with a
10% decline in net value-added margin. NPV begins to turn negative under a
25% closure scenario and with a 25% decline in margin using an 8% discount
rate. With a 50% decline in value-added margin, the NPV of the project turns
negative under a 25% closure scenario using both 8% and 3% discount rates.
Under these conditions, the dollar value of margin is negative – processors are
spending money to process clams, which is an unsustainable and unrealistic
scenario.
54
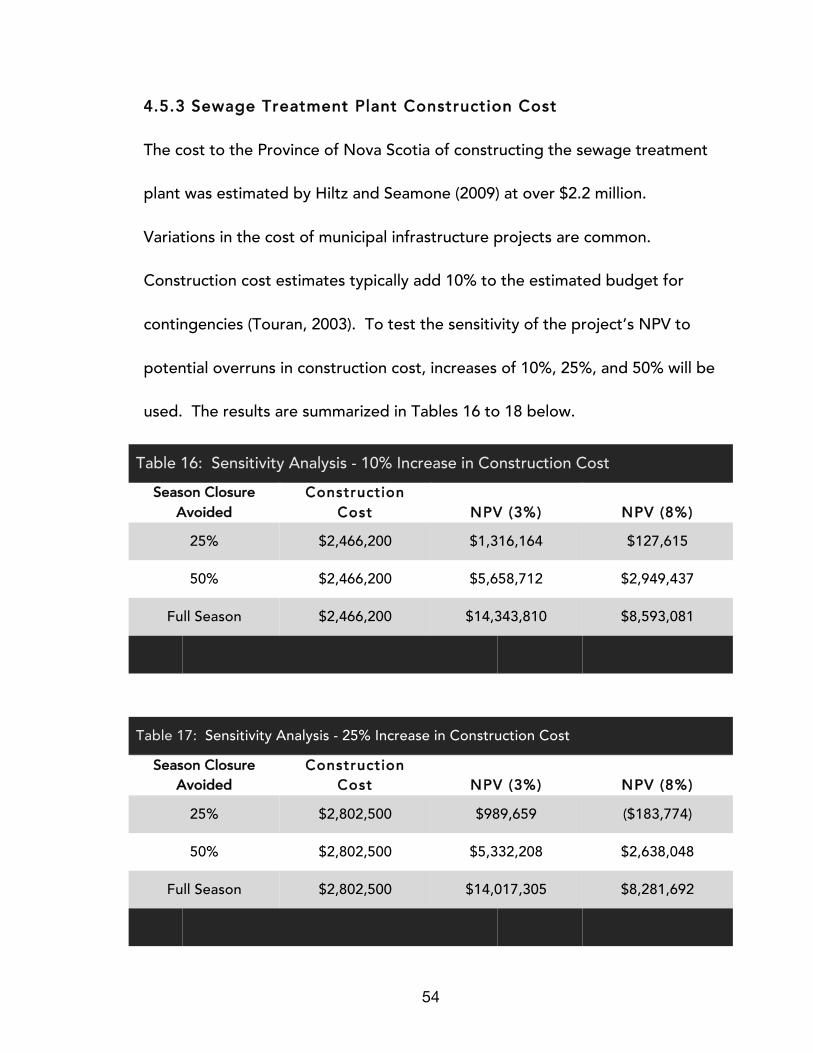
4.5.3 Sewage Treatment Plant Construction Cost
The cost to the Province of Nova Scotia of constructing the sewage treatment
plant was estimated by Hiltz and Seamone (2009) at over $2.2 million.
Variations in the cost of municipal infrastructure projects are common.
Construction cost estimates typically add 10% to the estimated budget for
contingencies (Touran, 2003). To test the sensitivity of the project’s NPV to
potential overruns in construction cost, increases of 10%, 25%, and 50% will be
used. The results are summarized in Tables 16 to 18 below.
Table 16: Sensitivity Analysis - 10% Increase in Construction Cost Season Closure
Avoided Construction
Cost NPV (3%) NPV (8%) 25% $2,466,200 $1,316,164 $127,615
50% $2,466,200 $5,658,712 $2,949,437
Full Season $2,466,200 $14,343,810 $8,593,081
Table 17: Sensitivity Analysis - 25% Increase in Construction Cost
Season Closure Avoided
Construction Cost NPV (3%) NPV (8%)
25% $2,802,500 $989,659 ($183,774)
50% $2,802,500 $5,332,208 $2,638,048
Full Season $2,802,500 $14,017,305 $8,281,692
55
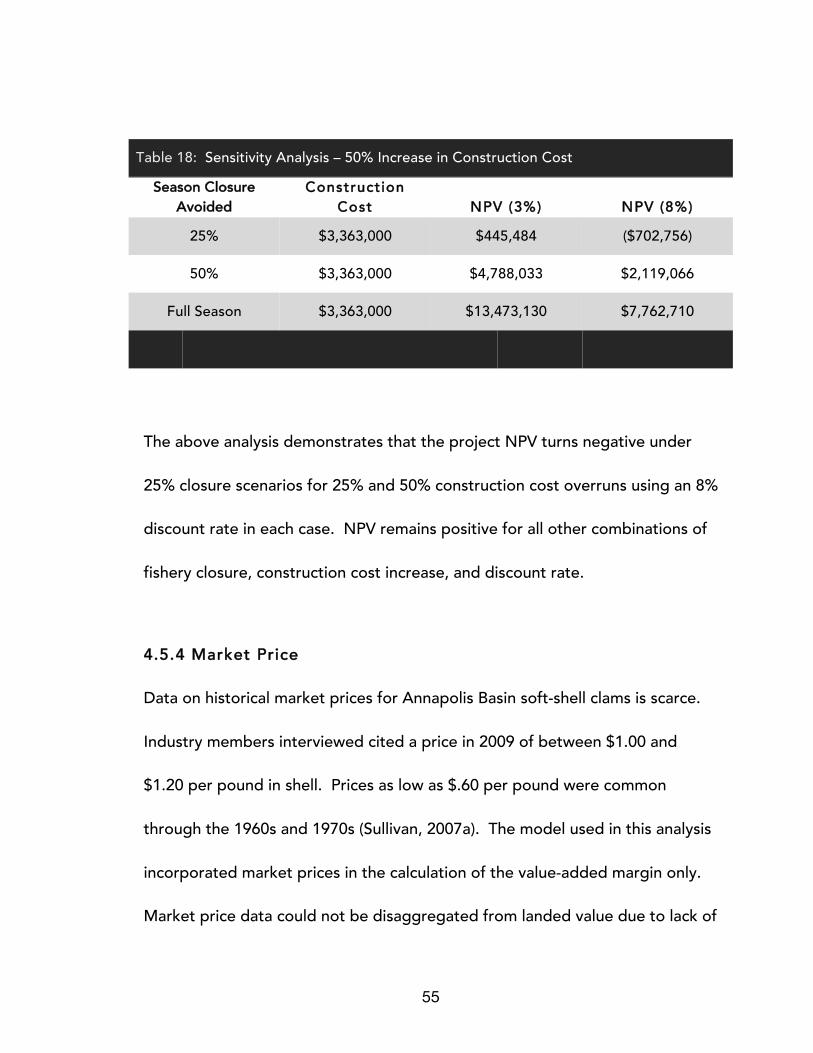
Table 18: Sensitivity Analysis – 50% Increase in Construction Cost
Season Closure Avoided
Construction Cost NPV (3%) NPV (8%)
25% $3,363,000 $445,484 ($702,756)
50% $3,363,000 $4,788,033 $2,119,066
Full Season $3,363,000 $13,473,130 $7,762,710
The above analysis demonstrates that the project NPV turns negative under
25% closure scenarios for 25% and 50% construction cost overruns using an 8%
discount rate in each case. NPV remains positive for all other combinations of
fishery closure, construction cost increase, and discount rate.
4.5.4 Market Price
Data on historical market prices for Annapolis Basin soft-shell clams is scarce.
Industry members interviewed cited a price in 2009 of between $1.00 and
$1.20 per pound in shell. Prices as low as $.60 per pound were common
through the 1960s and 1970s (Sullivan, 2007a). The model used in this analysis
incorporated market prices in the calculation of the value-added margin only.
Market price data could not be disaggregated from landed value due to lack of
56
information on quantity harvested over time. While market price could be
varied in the calculation of added value, it would not be reflected in landed
value. Testing the sensitivity of the project’s NPV, given the limitations of the
data available, was not possible.
57
CHAPTER 5. DISCUSSION
5.1 Summary
The untreated sewage that flows into the Annapolis Basin has had an impact on
the marine environment and the lives of fishers who derive a livelihood from
the harvesting of soft-shell clams. In this case, remediation is simple: invest
$2.2 million in an upgrade of the STP in the Town of Digby. Doing so would
increase the town’s capacity to handle sewage, end the cycle of fishery
closures, and ensure ongoing access to this sustainable, local, SSF. The
question this thesis posed was whether this investment could be justified.
A review of the literature on SSFs demonstrated the important role these
resource-based industries play in rural economies. Whether full-time or
seasonal, SSFs have represented critical poverty reduction strategies that
provide income diversification and increased community capacity. Closures
due to external shocks, such as sewage contamination, have had significant
economic implications for fisheries and communities all over the world.
The economic implications for communities that harvest soft-shell clams from
the Annapolis Basin have not been well examined to date. The goal of the
economic analysis in this thesis was to measure the net effect of investing in
58
the STP upgrade. The method used was CBA, which measured the NPV of the
principal benefits and costs associated with the upgrade as they related to the
soft-shell clam industry in the Annapolis Basin. Principal benefits included the
landed value of soft-shell clams, any value added to the clams by processors,
employment insurance benefits that flowed to harvesters in the offseason, and
operational cost savings resulting from the upgrade; principal costs included
the investment in the upgrade plus annual operating costs; principal benefits.
CBA was conducted under three scenarios that estimated the NPV of an
upgrade that prevented fishery closures of 25%, 50%, and 100% of the
harvesting season.
The analysis demonstrated that the investment in the upgrade is justified under
all three scenarios, and at both 3% and 8% discount rates, returning NPVs
ranging from $335,207 to $14,561,480. Sensitivity analysis was conducted to
test the impact of potential changes in landed value, value-added margin, STP
construction cost, and market price. This analysis demonstrated that the
justification for investing in the upgrade is sensitive to negative changes in the
VAM that processors derive from the fishery, as well as decreases in AALV.
The NPV of the project turns negative under the 25% closure scenario at an 8%
discount rate with declines in either AALV or VAM. A 50% decline in AALV or

59
VAM or result in negative NPVs under 25% closure using both 3% and 8%
discount rates. The project is least sensitive to 25% and 50% increases in
construction costs and returns a negative NPV under the 25% closure scenario
using an 8% discount rate.
Although the investment in the STP upgrade is sensitive to changes in benefit
and cost variables, it is well justified by the positive NPV returned under almost
all scenarios. Had the indirect and non-market benefits been included in the
analysis, the justification for the investment would have been strengthened.
5.2 Implications and Concluding Remarks
Sewage contamination of the basin from the Digby sewage treatment plant has
had a significant negative impact on the wild harvest of soft-shell clams
through open area beach closures. Assuming historical annual average
landings can be achieved going forward, the soft-shell clam industry in the
Annapolis Basin will remain a significant generator of direct economic activity
with an annual contribution of close to $1 million from the wild harvest alone.
There is strong economic rationale for the $2.2 million investment in the STP
upgrade under all closure-prevention scenarios. Beyond economic efficiency,
there is a wide range of socioeconomic benefits that will be derived from
60
upgrading the STP, eliminating sewage contamination, and ensuring the full
operation of the soft-shell clam fishery. Small-scale fisheries are a critically
important element of the economic fabric of rural Nova Scotia. As
communities outside the Halifax Regional Municipality continue to depopulate,
income diversification and sustainable resource-based enterprise will play
essential roles in the lives of those who remain.
The analysis upon which this thesis is based is admittedly simple. CBA is a
useful tool in examining how various elements of an economic relationship
interact. It is far from comprehensive and fails to account for many of the not-
easily-quantified values that communities place on resources and traditional
industries. “In theory, it cannot comprehend important but priceless values,
cannot escape the assumption that everything is for sale and can be traded off
against everything else, and cannot accurately reflect the central role of
uncertainty and the need for precaution in practice.” (Ackerman, F., 2008, pp.
29–30).
Isolating the analysis to the link between the STP and soft-shell clam fishery
provided a microscopic view into how a small-scale rural industry can be
impacted by external factors and the failure to mitigate municipal engineering
61
failures. Many other variables could have been included in the analysis, but
would have most likely only served to strengthen the argument for the
investment in the STP upgrade.
It should be acknowledged that the story of the Annapolis Basin soft-shell clam
fishery is much richer and more complex than has been accounted for in this
thesis. Issues of history, tradition, sustainable fisheries management,
organizational capacity, government resource policy, and rural economic
development remain largely invisible when looking through the microscope of
CBA. Yet it is these complexities and nuances that define the communities
around the Annapolis Basin and that add potency to the argument for an
investment in better infrastructure. Regardless of what the numbers say; no
matter how small an industry may be, preventable contamination of our
province’s natural resources and the destruction of rural livelihoods demands
attention.
62
BIBLIOGRAPHY
Ackerman, F. (2008). Critique of Cost-Benefit Analysis, and Alternative Approaches to Decision-Making. England: Global Development and Environment Institute. Retrieved from http://www.ase.tufts.edu/gdae/Pubs/rp/Ack_UK_CBAcritique.pdf
Allison, E. H., & Ellis, F. (2001). The livelihoods approach and management of
small-scale fisheries. Marine Policy, 25(5), 377–388. doi:10.1016/S0308-597X(01)00023-9
Backer, L., & McGillicuddy, D. (2006). Harmful algal blooms. Oceanography,
19(2), 94. Bank of Canada. (n.d.). Bank of Canada. Retrieved April 23, 2013, from
http://www.bankofcanada.ca Barbier, E. B., & Markandya, A. (1989). The conditions for achieving
environmentally sustainable development. London Environmental Economics Centre. Retrieved from http://www.mekonginfo.org/assets/midocs/0002776-environment-the-conditions-for-achieving-environmentally-sustainable-development.pdf
Béné, C. (2005). Small-Scale Fisheries: Assessing Their Contribution to Rural
Livelihoods in Developing Countries (1008). Food and Agriculture Association of the United Nations.
Béné, C., Macfadyen, G., & Allison, E. H. (2005). Increasing the Contribution of
Small-Scale Fisheries to Poverty Alleviation and Food Security.pdf. Rome: Food and Agriculture Association of the United Nations. Retrieved from https://www.cbd.int/doc/books/2009/B-03165.pdf
Boardman, A. E., Moore, M. A., & Vining, A. R. (2008). Social discount rates for
canada. In John Deutsch Institute Conference: Discount Rates for the Evaluation of Public Private Partnerships. Retrieved from http://jdi-legacy.econ.queensu.ca/Files/Conferences/PPPpapers/Moore%20conference%20paper.pdf
Boardman, A. E., Moore, M. A., & Vining, A. R. (2010). The social discount rate
for Canada based on future growth in consumption. Canadian Public Policy, 36(3), 325–343.
Burgess, D. F. (1981). The Social Discount Rate for Canada: Theory and
Evidence. Canadian Public Policy, 7(3), 383–394.
63
Cabelli, V. J., & Heffernan, W. P. (1970). Elimination of bacteria by the soft shell clam, Mya arenaria. Journal of the Fisheries Board of Canada, 27(9), 1579–1587.
Clean Annapolis River Project. (n.d.). Retrieved September 16, 2012, from
http://www.annapolisriver.ca/projects_clam.php Committee on Assessing, Aquatic, V. the the S. of, & Related Terrestrial
Ecosystems, N. R. C. (2004). Valuing Ecosystem Services: Toward Better Environmental Decision-Making. The National Academies Press. Retrieved from http://www.nap.edu/openbook.php?record_id=11139
Department of Fisheries and Oceans. (2009, May 4). Fisheries and Oceans
Canada | Pacific Region | Science and Research | Invertebrates| Depuration Fishery. Retrieved December 6, 2012, from http://www.pac.dfo-mpo.gc.ca/science/species-especes/shellfish-coquillages/clam-palourde/depuration-eng.htm
Dyson, K., & Huppert, D. D. (2010). Regional economic impacts of razor clam
beach closures due to harmful algal blooms (HABs) on the Pacific coast of Washington. Harmful Algae, 9(3), 264–271. doi:10.1016/j.hal.2009.11.003
Gardner Pinfold Consultants, & Rogers Consulting. (2007). Nova Scotia Seafood
Processing Sector: State of the Industry and Competitiveness Assessment. Halifax: Nova Scotia Department of Fisheries and Aquaculture. Retrieved from http://www.gov.ns.ca/fish/marketing/reports/seafoodreport.pdf
Government of Canada. (2009). Employment Insurance (report). Retrieved from
http://www.hrsdc.gc.ca/eng/employment/ei/index.shtml Government of Canada. (2012a, February 26). Employment Insurance Benefits
for Fishers. service,form,sound,guide. Retrieved October 27, 2012, from http://www.servicecanada.gc.ca/eng/ei/types/fishing.shtml#Where
Government of Canada. (2012b, February 27). Labour Market Monitor -
Annapolis Valley - February 2012. report, statistics, fact sheet. Retrieved September 23, 2012, from http://www.hrsdc.gc.ca/eng/workplaceskills/labour_market_information/monitors/ns/ns-lmm-av-201202.shtml
64
Government of Canada. (2013, January 25). Consumer Price Index, historical summary (1993 to 2012). Retrieved April 23, 2013, from http://www.statcan.gc.ca/tables-tableaux/sum-som/l01/cst01/econ46a-eng.htm
Government of Canada, I. C. (n.d.). Canadian Company Capabilities - Home.
home page; dataset; home page; contact information; directory; first page. Retrieved March 15, 2013, from http://www.ic.gc.ca/app/ccc/srch/nvgt.do?sbPrtl=&prtl=1&estblmntNo=123456104482&profile=cmpltPrfl&profileId=501&app=sold&lang=eng
Halifax Regional Municipality. (1996). Halifax Harbour Solutions Symposium:
Background. In Chronology and Summary of Pollution Control. Presented at the Halifax Harbour Solutions Symposium, Halifax Harbour Solutions. Retrieved from http://www.halifax.ca/harboursol/documents/sympback_001.pdf
Halwart, M., Funge-Smith, S., & Moehl, J. (2003). The role of aquaculture in rural
development. Review of the State of World Aquaculture, FAO, Rome, 47–58.
Hiltz and Seamone Co. Ltd. (2009). Town of Digby Sewage Treatment Plant
Report. Digby. Hoagland, P., Anderson, D., Kaoru, Y., & White, A. (2002). The economic effects
of harmful algal blooms in the United States: Estimates, assessment issues, and information needs. Estuaries and Coasts, 25(4), 819–837. doi:10.1007/BF02804908
Hoagland, P., & Scatasta, S. (2006). The economic effects of harmful algal
blooms. Ecology of harmful algae, 391–402. Jenkins, G., & Kuo, C. Y. (2007). The economic opportunity cost of capital for
canada—An empirical update. Queen’s Economics Department working paper, (1133). Retrieved from http://www.queensjdiexec.org/publications/qed_dp_1.pdf
Johnson, J. (2012). FAO Fisheries & Aquaculture - Small-scale & artisanal
fisheries. Topics Fact Sheets. Retrieved September 23, 2012, from http://www.fao.org/fishery/topic/14753/en
McWhinnie, S. (2012). Renewable Resource Economics. Australian Economic
Review, 45(2), 246–254. doi:10.1111/j.1467-8462.2012.00678.x
65
Riely, P. L., & Rockland, D. B. (1988). Evaluation of liming operations through benefit-cost analysis. Water, Air, & Soil Pollution, 41(1), 293–328.
Salter, B., & Marketing, D. (2002). Shellfish Industry Economic Impact Analysis.
Victoria, BC. Prepared for: Vancouver Island Economic Developers Association. Retrieved from http://www.investcomoxvalley.com/businessresources/documents/VIEDAInbound-Aquaculture-ImpactAnalysisFinalJan03.pdf
Spiro, P. (2010). The Social Discount Rate for Provincial Government Investment
Projects. In D. F. Burgess & G. P. Jenkins (Eds.), Discount Rates for the Evaluation of Public Private Partnerships (pp. 299–314). McGill-Queen’s University Press.
Sullivan, D. (2007a). Digging Into the Past: Clam Harvesting in the Annapolis
Basin. Prepared For Bay of Fundy Marine Resource Centre as part of the Coastal Community University Research Alliance Project: 35 pp. Retrieved from http://annapolisriver.ca/downloads/Digging_Into_the_Past_2007.pdf
Sullivan, D. (2007b). A Population Survey and Resource Valuation of Soft-Shell
Clams in the Annapolis Basin, NS. Annapolis Royal: Clean Annapolis River Project. Retrieved from http://www.annapolisriver.ca/downloads/clam_population_2007.pdf
Teh, L. S. L., Teh, L. C. L., & Sumaila, U. R. (2011). Quantifying the overlooked
socio-economic contribution of small-scale fisheries in Sabah, Malaysia. Fisheries Research, 110(3), 450–458. doi:10.1016/j.fishres.2011.06.001
Touran, A. (2003). Calculation of contingency in construction projects. IEEE
Transactions on Engineering Management, 50(2), 135–140. doi:10.1109/TEM.2003.810824
Treasury Board of Canada Secretariat. (2007). Canadian Cost-Benefit Analysis
Guide: Regulatory Proposals. Government of Canada. Retrieved from http://www.tbs-sct.gc.ca/ri-qr/documents/gl-ld/analys/analys-eng.pdf
Trebilcock, M., Yatchew, A., & Baziliauskas, A. (2007). Overview of Cost-Benefit
Analysis and its Applications in Public Policy Decisions. CRA International. Retrieved from http://www.ieso.ca/imoweb/pubs/mear/CRA_Overview-of-Cost-Benefit-Analysis.pdf
66
Van Voorhees, D., & Lowther, A. (2011). Fisheries of the United States 2010. Government Printing Office. Retrieved from http://books.google.com/books?hl=en&lr=&id=tpvJ2mtfaeQC&oi=fnd&pg=PR4&dq=%22and%22+%22notes+at+end+of%22+%22Commercial%22+%22DOMESTIC+LANDINGS,+BY+SPECIES,+2009+AND+2010+(1)+-%22+%22-%22+%22and%22+%22or%22+%22trout+or%22+%22Commercial%22+%22DOMESTIC+LANDINGS,+BY+SPECIES,+2009+AND+2010+(1)+-%22+&ots=tCflqYgOWM&sig=1jnIEz_2SO7GHB0m0Wpvv4Ba6FI
Walmsley, S., Purvis, J., & Ninnes, C. (2006). The role of small-scale fisheries
management in the poverty reduction strategies in the Western Indian Ocean region. Ocean & Coastal Management, 49(11), 812–833. doi:10.1016/j.ocecoaman.2006.08.006
Wilson, S. (2000). The Costs and Benefits of Sewage Treatment and Source
Control for Halifax Harbour. Halifax. Retrieved from http://www.halifax.ca/harboursol/documents/gpi_report_001.pdf
Zerbe, R. O., & Dively, D. (1994). Benefit-cost analysis in theory and practice.
HarperCollins College Publishers. Retrieved from http://books.google.ca/books?id=XuPtAAAAMAAJ