seylan bank plc · as at 31.12.2019 seylan bank plc market dicipline - minimum disclosure...
TRANSCRIPT
As at 31.12.2019
SEYLAN BANK PLC
MARKET DICIPLINE -
MINIMUM DISCLOSURE REQUIREMENTS
UNDER PILLAR III
as per Direction 01. of 2016

Regulatory Capital (LKR'000) 2019 2018
Common Equity Tier 1 Capital 43,051,519 33,486,749
Tier 1 Capital 43,051,519 33,486,749
Total Capital 56,704,009 43,682,547
Regulatory Capital Ratios (%)Common Equity Tier 1 Capital Ratio 7.000% 6.375% 11.27% 10.20%
Tier 1 Capital Ratio 8.500% 7.875% 11.27% 10.20%
Total Capital Ratio 12.500% 11.875% 14.84% 13.30%
Leverage Ratio 3.00% 3.00% 8.17% 7.20%
Net Stable Funding Ratio 100.00% 90.00% 109.11% 110.00%
Regulatory Liquidity
Statutory Liquid AssetsDomestic Banking Unit ( LKR 000 ) 90,379,939 80,722,525
Off-Shore Banking Unit ( USD 000 ) 29,493 31,468
Statutory Liquid Assets RatioDomestic Banking Unit 20% 20% 21.40% 21.44%
Off-Shore Banking Unit 20% 20% 21.81% 22.08%
Liquidity Coverage Ratio - Rupee 100% 90% 169.60 128.76
Liquidity Coverage Ratio - All Currency 100% 90% 116.01 92.15
Template 1
ItemPrevious Reporting
Period 31.12.2018
Key Regulatory Ratios - Capital and Liquidity
Reporting Period
31.12.2019Minimum Requirement
Reporting Period
31.12.2019
Previous Reporting
Period
31.12.2018
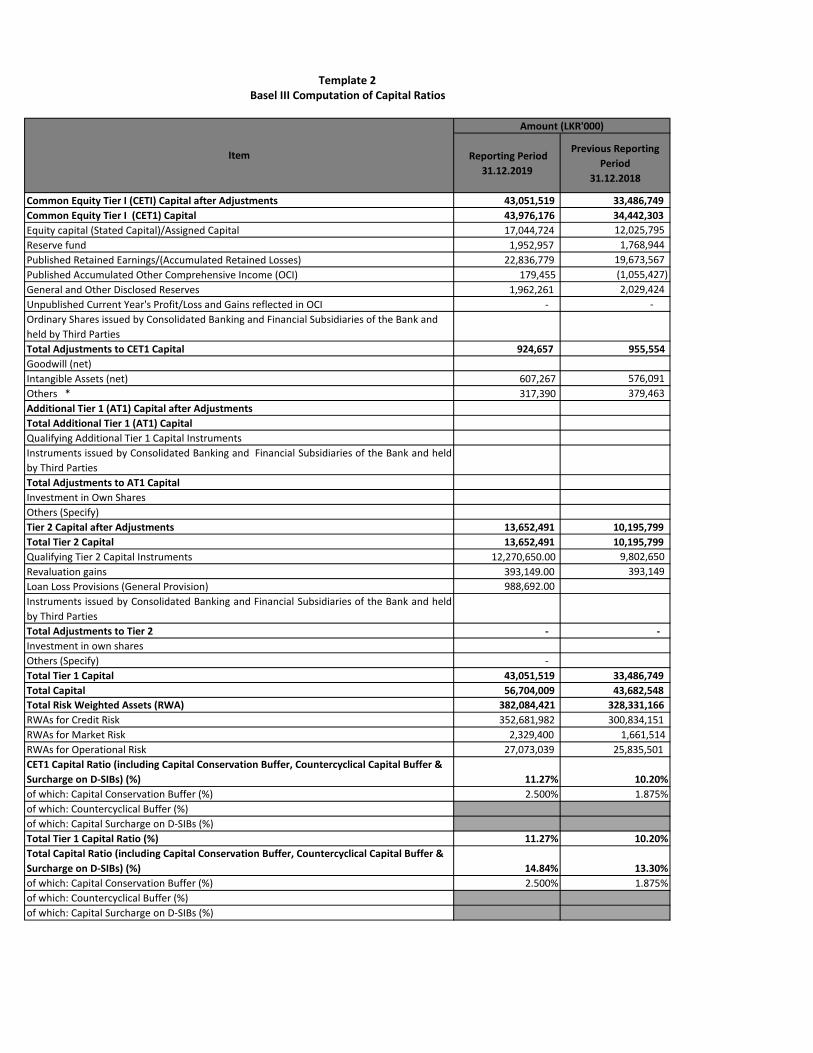
Common Equity Tier I (CETI) Capital after Adjustments 43,051,519 33,486,749
Common Equity Tier I (CET1) Capital 43,976,176 34,442,303
Equity capital (Stated Capital)/Assigned Capital 17,044,724 12,025,795
Reserve fund 1,952,957 1,768,944
Published Retained Earnings/(Accumulated Retained Losses) 22,836,779 19,673,567
Published Accumulated Other Comprehensive Income (OCI) 179,455 (1,055,427)
General and Other Disclosed Reserves 1,962,261 2,029,424
Unpublished Current Year's Profit/Loss and Gains reflected in OCI - -
Ordinary Shares issued by Consolidated Banking and Financial Subsidiaries of the Bank and
held by Third Parties
Total Adjustments to CET1 Capital 924,657 955,554
Goodwill (net)
Intangible Assets (net) 607,267 576,091
Others * 317,390 379,463
Additional Tier 1 (AT1) Capital after Adjustments
Total Additional Tier 1 (AT1) Capital
Qualifying Additional Tier 1 Capital Instruments
Instruments issued by Consolidated Banking and Financial Subsidiaries of the Bank and held
by Third Parties
Total Adjustments to AT1 Capital
Investment in Own Shares
Others (Specify)
Tier 2 Capital after Adjustments 13,652,491 10,195,799
Total Tier 2 Capital 13,652,491 10,195,799
Qualifying Tier 2 Capital Instruments 12,270,650.00 9,802,650
Revaluation gains 393,149.00 393,149
Loan Loss Provisions (General Provision) 988,692.00
Instruments issued by Consolidated Banking and Financial Subsidiaries of the Bank and held
by Third Parties
Total Adjustments to Tier 2 - -
Investment in own shares
Others (Specify) -
Total Tier 1 Capital 43,051,519 33,486,749
Total Capital 56,704,009 43,682,548
Total Risk Weighted Assets (RWA) 382,084,421 328,331,166
RWAs for Credit Risk 352,681,982 300,834,151
RWAs for Market Risk 2,329,400 1,661,514
RWAs for Operational Risk 27,073,039 25,835,501
CET1 Capital Ratio (including Capital Conservation Buffer, Countercyclical Capital Buffer &
Surcharge on D-SIBs) (%) 11.27% 10.20%
of which: Capital Conservation Buffer (%) 2.500% 1.875%
of which: Countercyclical Buffer (%)
of which: Capital Surcharge on D-SIBs (%)
Total Tier 1 Capital Ratio (%) 11.27% 10.20%
Total Capital Ratio (including Capital Conservation Buffer, Countercyclical Capital Buffer &
Surcharge on D-SIBs) (%) 14.84% 13.30%
of which: Capital Conservation Buffer (%) 2.500% 1.875%
of which: Countercyclical Buffer (%)
of which: Capital Surcharge on D-SIBs (%)
Template 2Basel III Computation of Capital Ratios
Item
Amount (LKR'000)
Reporting Period
31.12.2019
Previous Reporting Period
31.12.2018
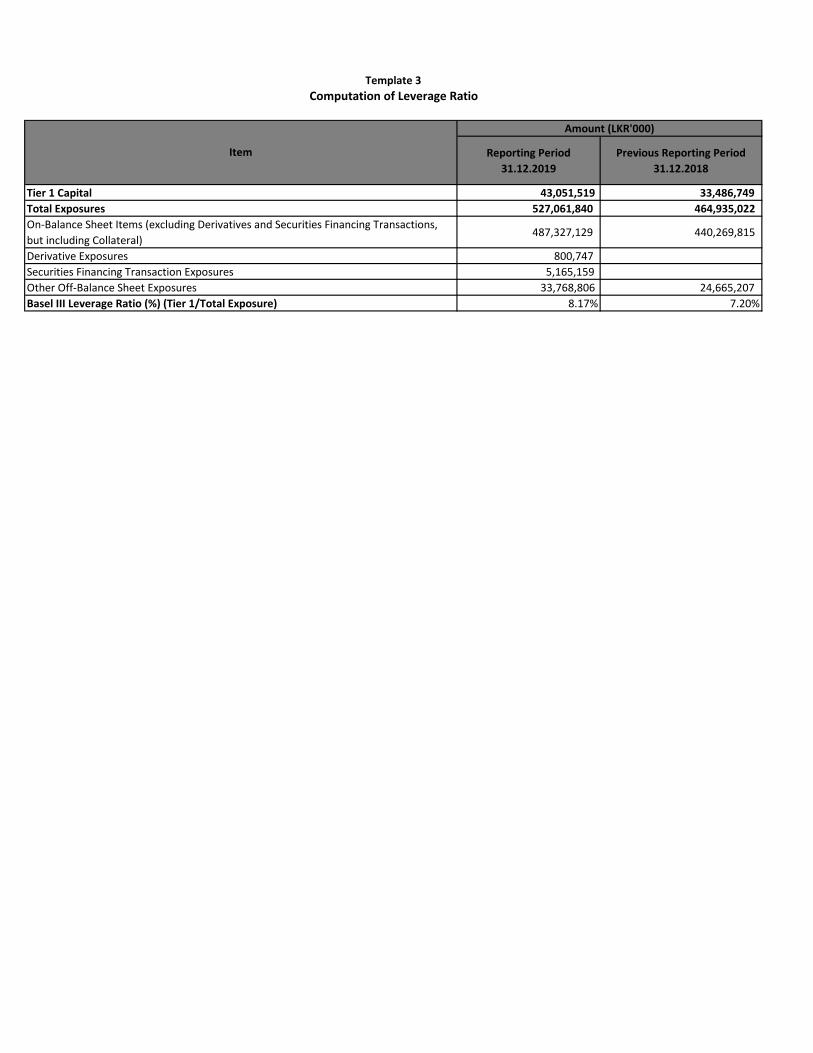
Tier 1 Capital 43,051,519 33,486,749
Total Exposures 527,061,840 464,935,022
On-Balance Sheet Items (excluding Derivatives and Securities Financing Transactions,
but including Collateral) 487,327,129 440,269,815
Derivative Exposures 800,747
Securities Financing Transaction Exposures 5,165,159
Other Off-Balance Sheet Exposures 33,768,806 24,665,207
Basel III Leverage Ratio (%) (Tier 1/Total Exposure) 8.17% 7.20%
Computation of Leverage Ratio
Item
Amount (LKR'000)
Template 3
Total Un-
weighted ValueFactor (%) Total Weighted Value
Total Un-
weighted ValueFactor (%) Total Weighted Value
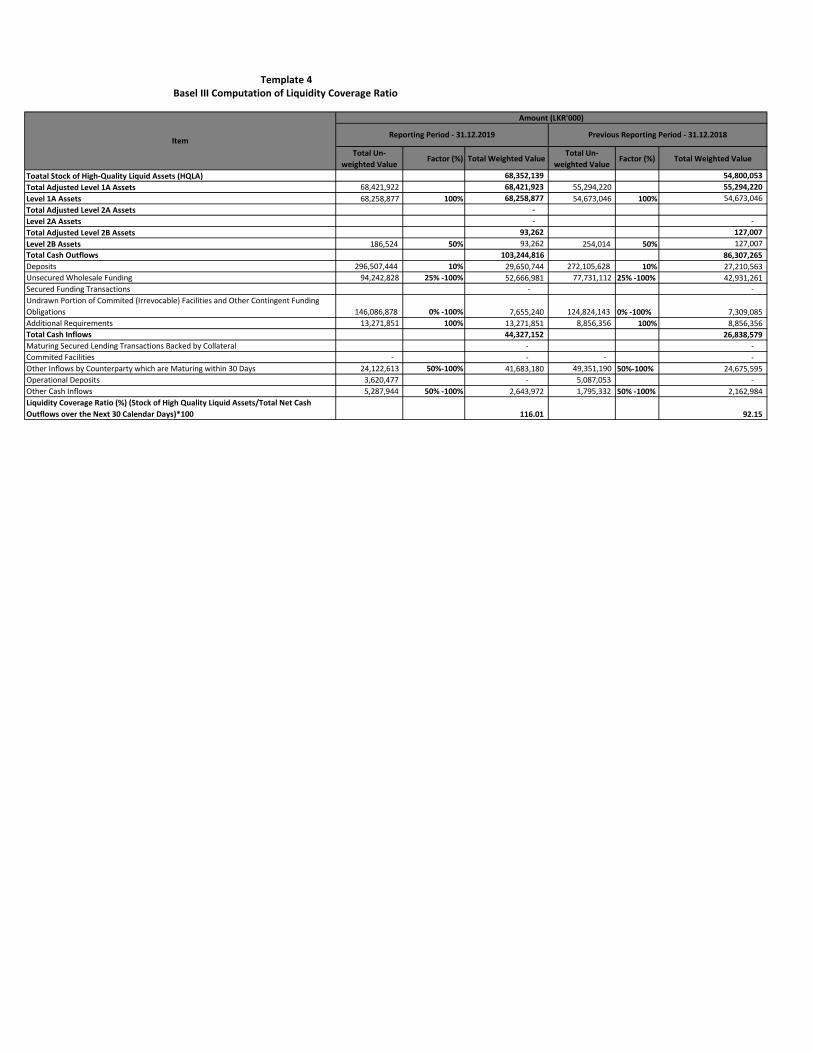
Toatal Stock of High-Quality Liquid Assets (HQLA) 68,352,139 54,800,053
Total Adjusted Level 1A Assets 68,421,922 68,421,923 55,294,220 55,294,220
Level 1A Assets 68,258,877 100% 68,258,877 54,673,046 100% 54,673,046
Total Adjusted Level 2A Assets -
Level 2A Assets - -
Total Adjusted Level 2B Assets 93,262 127,007
Level 2B Assets 186,524 50% 93,262 254,014 50% 127,007
Total Cash Outflows 103,244,816 86,307,265
Deposits 296,507,444 10% 29,650,744 272,105,628 10% 27,210,563
Unsecured Wholesale Funding 94,242,828 25% -100% 52,666,981 77,731,112 25% -100% 42,931,261
Secured Funding Transactions - -
Undrawn Portion of Commited (Irrevocable) Facilities and Other Contingent Funding
Obligations 146,086,878 0% -100% 7,655,240 124,824,143 0% -100% 7,309,085
Additional Requirements 13,271,851 100% 13,271,851 8,856,356 100% 8,856,356
Total Cash Inflows 44,327,152 26,838,579
Maturing Secured Lending Transactions Backed by Collateral - -
Commited Facilities - - - -
Other Inflows by Counterparty which are Maturing within 30 Days 24,122,613 50%-100% 41,683,180 49,351,190 50%-100% 24,675,595
Operational Deposits 3,620,477 - 5,087,053 -
Other Cash Inflows 5,287,944 50% -100% 2,643,972 1,795,332 50% -100% 2,162,984
Liquidity Coverage Ratio (%) (Stock of High Quality Liquid Assets/Total Net Cash
Outflows over the Next 30 Calendar Days)*100 116.01 92.15
Template 4Basel III Computation of Liquidity Coverage Ratio
Item
Amount (LKR'000)
Reporting Period - 31.12.2019 Previous Reporting Period - 31.12.2018
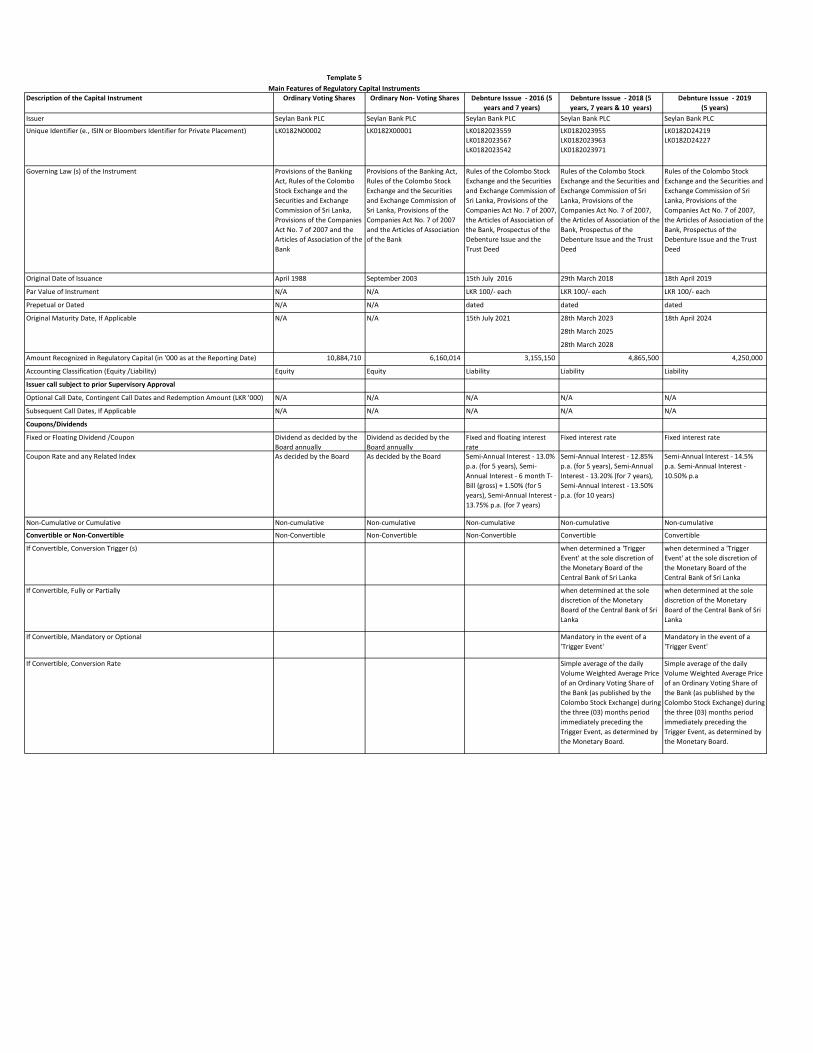
Description of the Capital Instrument Ordinary Voting Shares Ordinary Non- Voting Shares Debnture Isssue - 2016 (5
years and 7 years)
Debnture Isssue - 2018 (5
years, 7 years & 10 years)
Debnture Isssue - 2019
(5 years)
Issuer Seylan Bank PLC Seylan Bank PLC Seylan Bank PLC Seylan Bank PLC Seylan Bank PLC
Unique Identifier (e., ISIN or Bloombers Identifier for Private Placement) LK0182N00002 LK0182X00001 LK0182023559 LK0182023955 LK0182D24219
LK0182023567 LK0182023963 LK0182D24227
LK0182023542 LK0182023971
Governing Law (s) of the Instrument Provisions of the Banking
Act, Rules of the Colombo
Stock Exchange and the
Securities and Exchange
Commission of Sri Lanka,
Provisions of the Companies
Act No. 7 of 2007 and the
Articles of Association of the
Bank
Provisions of the Banking Act,
Rules of the Colombo Stock
Exchange and the Securities
and Exchange Commission of
Sri Lanka, Provisions of the
Companies Act No. 7 of 2007
and the Articles of Association
of the Bank
Rules of the Colombo Stock
Exchange and the Securities
and Exchange Commission of
Sri Lanka, Provisions of the
Companies Act No. 7 of 2007,
the Articles of Association of
the Bank, Prospectus of the
Debenture Issue and the
Trust Deed
Rules of the Colombo Stock
Exchange and the Securities and
Exchange Commission of Sri
Lanka, Provisions of the
Companies Act No. 7 of 2007,
the Articles of Association of the
Bank, Prospectus of the
Debenture Issue and the Trust
Deed
Rules of the Colombo Stock
Exchange and the Securities and
Exchange Commission of Sri
Lanka, Provisions of the
Companies Act No. 7 of 2007,
the Articles of Association of the
Bank, Prospectus of the
Debenture Issue and the Trust
Deed
Original Date of Issuance April 1988 September 2003 15th July 2016 29th March 2018 18th April 2019
Par Value of Instrument N/A N/A LKR 100/- each LKR 100/- each LKR 100/- each
Prepetual or Dated N/A N/A dated dated dated
28th March 2023
28th March 2025
28th March 2028
Amount Recognized in Regulatory Capital (in '000 as at the Reporting Date) 10,884,710 6,160,014 3,155,150 4,865,500 4,250,000
Accounting Classification (Equity /Liability) Equity Equity Liability Liability Liability
Issuer call subject to prior Supervisory Approval
Optional Call Date, Contingent Call Dates and Redemption Amount (LKR '000) N/A N/A N/A N/A N/A
Subsequent Call Dates, If Applicable N/A N/A N/A N/A N/A
Coupons/Dividends
Fixed or Floating Dividend /Coupon Dividend as decided by the
Board annually
Dividend as decided by the
Board annually
Fixed and floating interest
rate
Fixed interest rate Fixed interest rate
Coupon Rate and any Related Index As decided by the Board As decided by the Board Semi-Annual Interest - 13.0%
p.a. (for 5 years), Semi-
Annual Interest - 6 month T-
Bill (gross) + 1.50% (for 5
years), Semi-Annual Interest -
13.75% p.a. (for 7 years)
Semi-Annual Interest - 12.85%
p.a. (for 5 years), Semi-Annual
Interest - 13.20% (for 7 years),
Semi-Annual Interest - 13.50%
p.a. (for 10 years)
Semi-Annual Interest - 14.5%
p.a. Semi-Annual Interest -
10.50% p.a
Non-Cumulative or Cumulative Non-cumulative Non-cumulative Non-cumulative Non-cumulative Non-cumulative
Convertible or Non-Convertible Non-Convertible Non-Convertible Non-Convertible Convertible Convertible
If Convertible, Conversion Trigger (s) when determined a 'Trigger
Event' at the sole discretion of
the Monetary Board of the
Central Bank of Sri Lanka
when determined a 'Trigger
Event' at the sole discretion of
the Monetary Board of the
Central Bank of Sri Lanka
If Convertible, Fully or Partially when determined at the sole
discretion of the Monetary
Board of the Central Bank of Sri
Lanka
when determined at the sole
discretion of the Monetary
Board of the Central Bank of Sri
Lanka
If Convertible, Mandatory or Optional Mandatory in the event of a
'Trigger Event'
Mandatory in the event of a
'Trigger Event'
If Convertible, Conversion Rate Simple average of the daily
Volume Weighted Average Price
of an Ordinary Voting Share of
the Bank (as published by the
Colombo Stock Exchange) during
the three (03) months period
immediately preceding the
Trigger Event, as determined by
the Monetary Board.
Simple average of the daily
Volume Weighted Average Price
of an Ordinary Voting Share of
the Bank (as published by the
Colombo Stock Exchange) during
the three (03) months period
immediately preceding the
Trigger Event, as determined by
the Monetary Board.
18th April 2024
Template 5
Main Features of Regulatory Capital Instruments
15th July 2021 Original Maturity Date, If Applicable N/A N/A
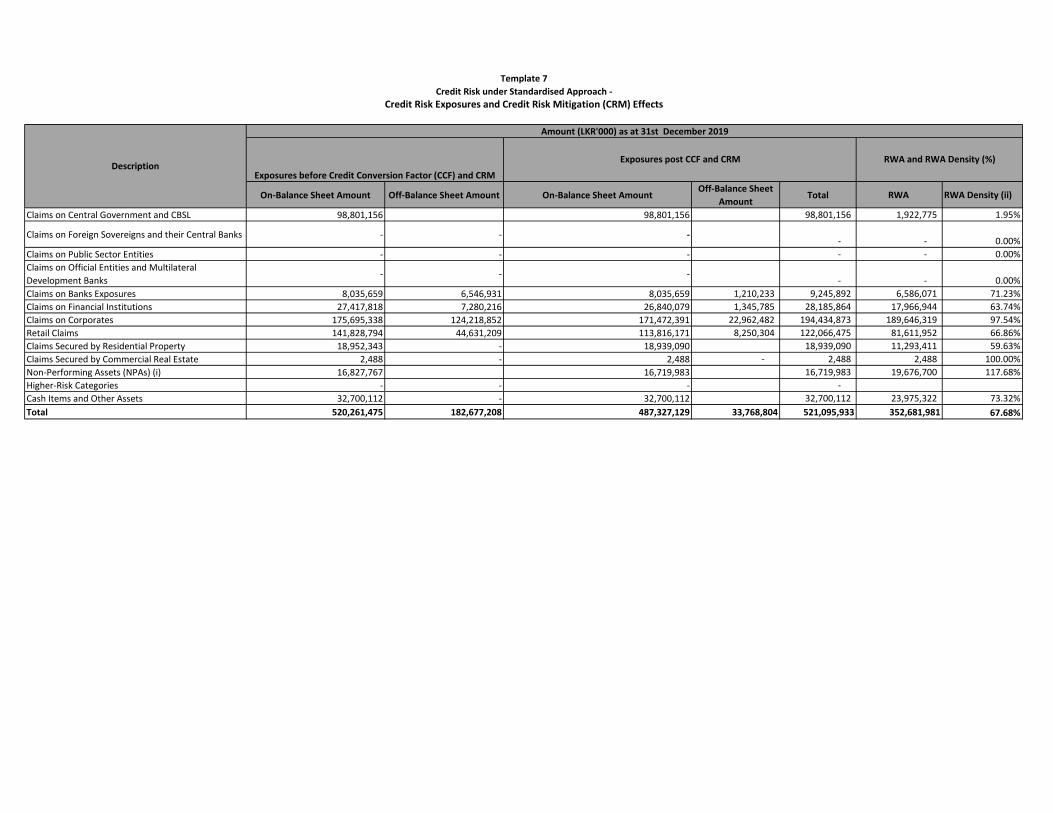
On-Balance Sheet Amount Off-Balance Sheet Amount On-Balance Sheet AmountOff-Balance Sheet
Amount Total RWA RWA Density (ii)
Claims on Central Government and CBSL 98,801,156 98,801,156 98,801,156 1,922,775 1.95%
Claims on Foreign Sovereigns and their Central Banks - - - - - 0.00%
Claims on Public Sector Entities - - - - - 0.00%
Claims on Official Entities and Multilateral
Development Banks - - -
- - 0.00%
Claims on Banks Exposures 8,035,659 6,546,931 8,035,659 1,210,233 9,245,892 6,586,071 71.23%
Claims on Financial Institutions 27,417,818 7,280,216 26,840,079 1,345,785 28,185,864 17,966,944 63.74%
Claims on Corporates 175,695,338 124,218,852 171,472,391 22,962,482 194,434,873 189,646,319 97.54%
Retail Claims 141,828,794 44,631,209 113,816,171 8,250,304 122,066,475 81,611,952 66.86%
Claims Secured by Residential Property 18,952,343 - 18,939,090 18,939,090 11,293,411 59.63%
Claims Secured by Commercial Real Estate 2,488 - 2,488 - 2,488 2,488 100.00%
Non-Performing Assets (NPAs) (i) 16,827,767 16,719,983 16,719,983 19,676,700 117.68%
Higher-Risk Categories - - - -
Cash Items and Other Assets 32,700,112 - 32,700,112 32,700,112 23,975,322 73.32%
Total 520,261,475 182,677,208 487,327,129 33,768,804 521,095,933 352,681,981 67.68%
Template 7
Credit Risk under Standardised Approach -
Credit Risk Exposures and Credit Risk Mitigation (CRM) Effects
Description
Amount (LKR'000) as at 31st December 2019
Exposures before Credit Conversion Factor (CCF) and CRM
Exposures post CCF and CRM RWA and RWA Density (%)

Description
Risk WeightTotal Credit
Exposures Amount
Asset ClassesClaims on Central Government and CBSL 89,187,279 9,613,877 98,801,156
Claims on Foreign Sovereigns and their Central Banks -
Claims on Public Sector Entities -
Claims on Official Entities and Multilateral Development Banks-
Claims on Banks Exposures 816,300 4,013,562 4,416,030 9,245,892
Claims on Financial Institutions - 20,437,839 7,748,025 28,185,864
Claims on Corporates - 9,718,031 184,575,920 140,923 194,434,873
Retail Claims 33,712,980 62,387,077 13,756,245 109,856,302
Claims Secured by Gold 8,022,118 4,188,055 - 12,210,173
Claims Secured by Residential Property 15,291,358 3,647,732 18,939,090
Claims Secured by Commercial Real Estate 2,488 2,488
Non-Performing Assets (NPAs) (i) 681,179 9,444,191 6,594,613 16,719,983
Higher-Risk Categories -
Cash Items and Other Assets 8,423,935 376,069 23,900,108 32,700,112
Total 105,633,332 14,994,301 50,141,969 33,712,980 62,387,077 247,490,739 6,735,536 - 521,095,933
Template 8
Credit Risk under Standardised Approach: Exposures by Asset Classes and Risk Weights
>150%
Amount (LKR'000) as at 31st December 2019 (Post CCF& CRM)
0% 20% 50% 75% 100% 150%60%
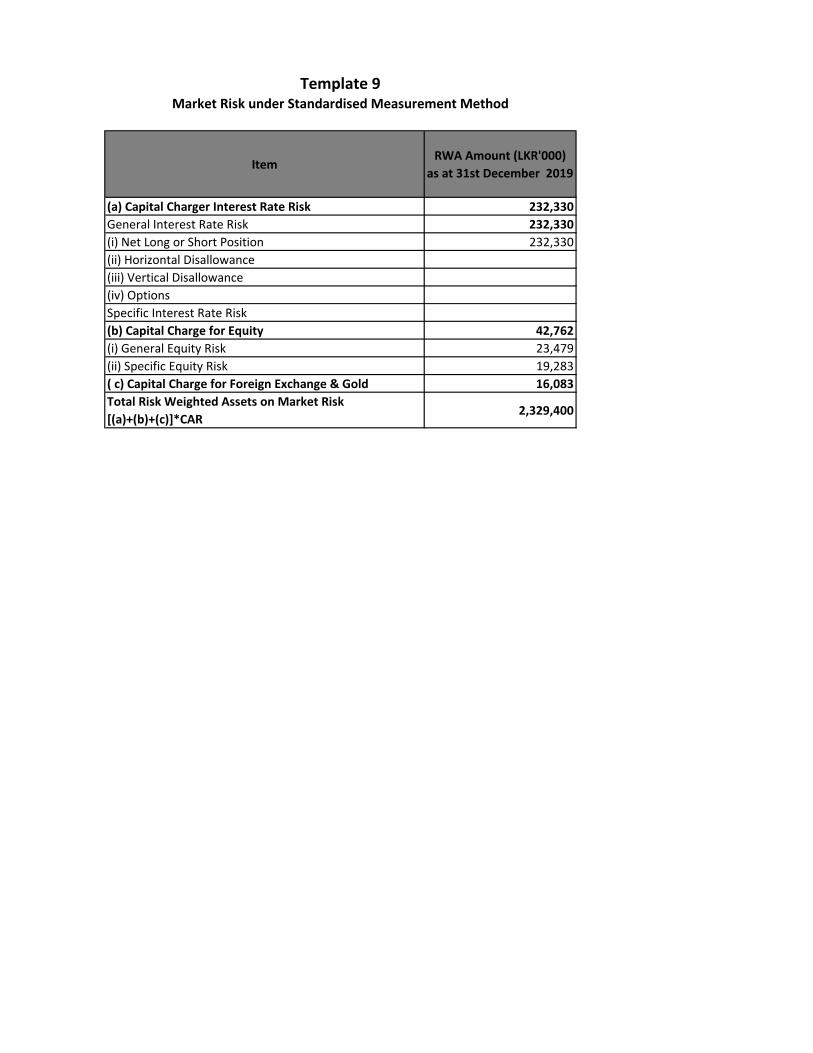
ItemRWA Amount (LKR'000)
as at 31st December 2019
(a) Capital Charger Interest Rate Risk 232,330
General Interest Rate Risk 232,330
(i) Net Long or Short Position 232,330
(ii) Horizontal Disallowance
(iii) Vertical Disallowance
(iv) Options
Specific Interest Rate Risk
(b) Capital Charge for Equity 42,762
(i) General Equity Risk 23,479
(ii) Specific Equity Risk 19,283
( c) Capital Charge for Foreign Exchange & Gold 16,083
Total Risk Weighted Assets on Market Risk
[(a)+(b)+(c)]*CAR2,329,400
Template 9Market Risk under Standardised Measurement Method
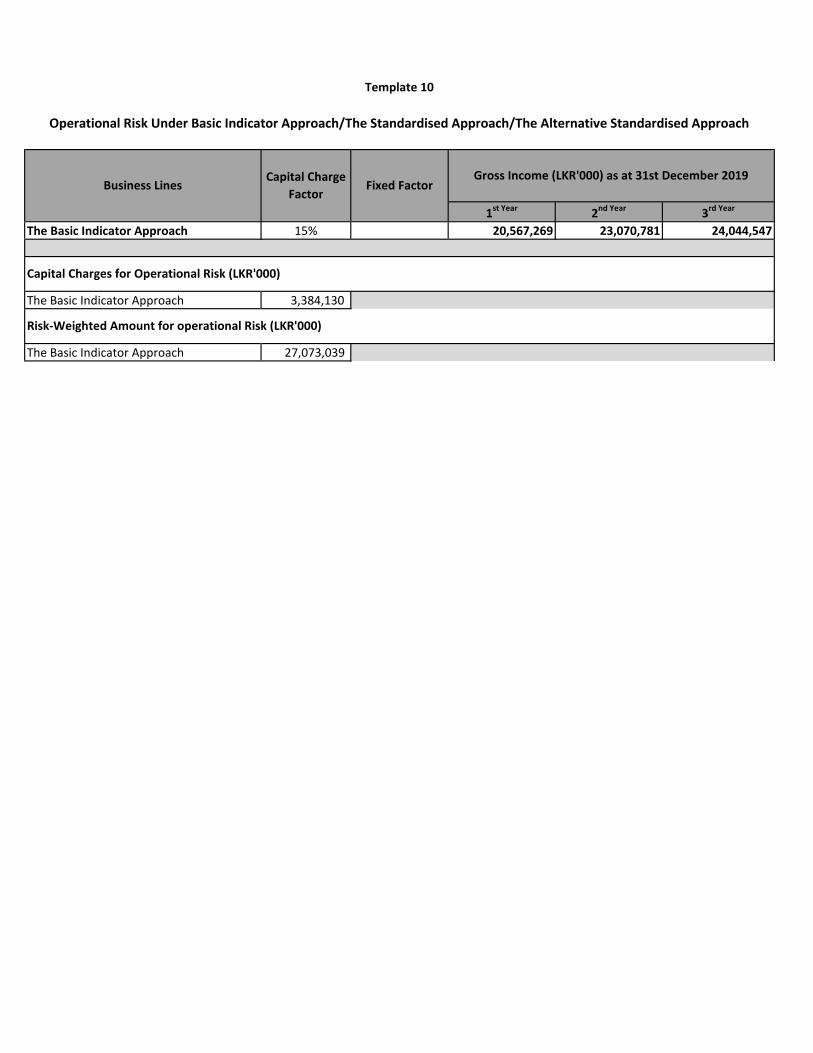
1st Year 2nd Year 3rd Year
The Basic Indicator Approach 15% 20,567,269 23,070,781 24,044,547
The Basic Indicator Approach 3,384,130
The Basic Indicator Approach 27,073,039
Risk-Weighted Amount for operational Risk (LKR'000)
Template 10
Gross Income (LKR'000) as at 31st December 2019
Operational Risk Under Basic Indicator Approach/The Standardised Approach/The Alternative Standardised Approach
Business Lines Fixed Factor Capital Charge
Factor
Capital Charges for Operational Risk (LKR'000)
a b c d e
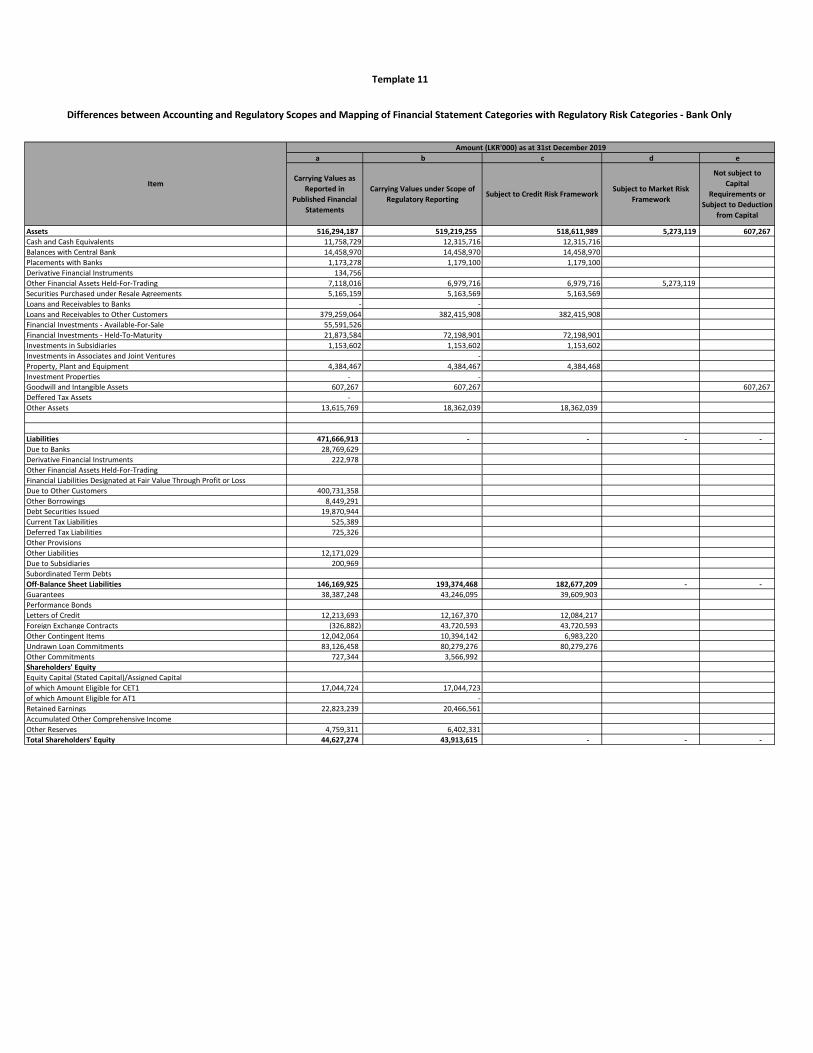
Assets 516,294,187 519,219,255 518,611,989 5,273,119 607,267
Cash and Cash Equivalents 11,758,729 12,315,716 12,315,716
Balances with Central Bank 14,458,970 14,458,970 14,458,970
Placements with Banks 1,173,278 1,179,100 1,179,100
Derivative Financial Instruments 134,756
Other Financial Assets Held-For-Trading 7,118,016 6,979,716 6,979,716 5,273,119
Securities Purchased under Resale Agreements 5,165,159 5,163,569 5,163,569
Loans and Receivables to Banks - -
Loans and Receivables to Other Customers 379,259,064 382,415,908 382,415,908
Financial Investments - Available-For-Sale 55,591,526
Financial Investments - Held-To-Maturity 21,873,584 72,198,901 72,198,901
Investments in Subsidiaries 1,153,602 1,153,602 1,153,602
Investments in Associates and Joint Ventures -
Property, Plant and Equipment 4,384,467 4,384,467 4,384,468
Investment Properties - -
Goodwill and Intangible Assets 607,267 607,267 607,267
Deffered Tax Assets -
Other Assets 13,615,769 18,362,039 18,362,039
Liabilities 471,666,913 - - - -
Due to Banks 28,769,629
Derivative Financial Instruments 222,978
Other Financial Assets Held-For-Trading
Financial Liabilities Designated at Fair Value Through Profit or Loss
Due to Other Customers 400,731,358
Other Borrowings 8,449,291
Debt Securities Issued 19,870,944
Current Tax Liabilities 525,389
Deferred Tax Liabilities 725,326
Other Provisions
Other Liabilities 12,171,029
Due to Subsidiaries 200,969
Subordinated Term Debts
Off-Balance Sheet Liabilities 146,169,925 193,374,468 182,677,209 - -
Guarantees 38,387,248 43,246,095 39,609,903
Performance Bonds
Letters of Credit 12,213,693 12,167,370 12,084,217
Foreign Exchange Contracts (326,882) 43,720,593 43,720,593
Other Contingent Items 12,042,064 10,394,142 6,983,220
Undrawn Loan Commitments 83,126,458 80,279,276 80,279,276
Other Commitments 727,344 3,566,992
Shareholders' Equity
Equity Capital (Stated Capital)/Assigned Capital
of which Amount Eligible for CET1 17,044,724 17,044,723
of which Amount Eligible for AT1 -
Retained Earnings 22,823,239 20,466,561
Accumulated Other Comprehensive Income
Other Reserves 4,759,311 6,402,331
Total Shareholders' Equity 44,627,274 43,913,615 - - -
Differences between Accounting and Regulatory Scopes and Mapping of Financial Statement Categories with Regulatory Risk Categories - Bank Only
Item
Template 11
Amount (LKR'000) as at 31st December 2019
Carrying Values as
Reported in
Published Financial
Statements
Carrying Values under Scope of
Regulatory ReportingSubject to Credit Risk Framework
Subject to Market Risk
Framework
Not subject to
Capital
Requirements or
Subject to Deduction
from Capital
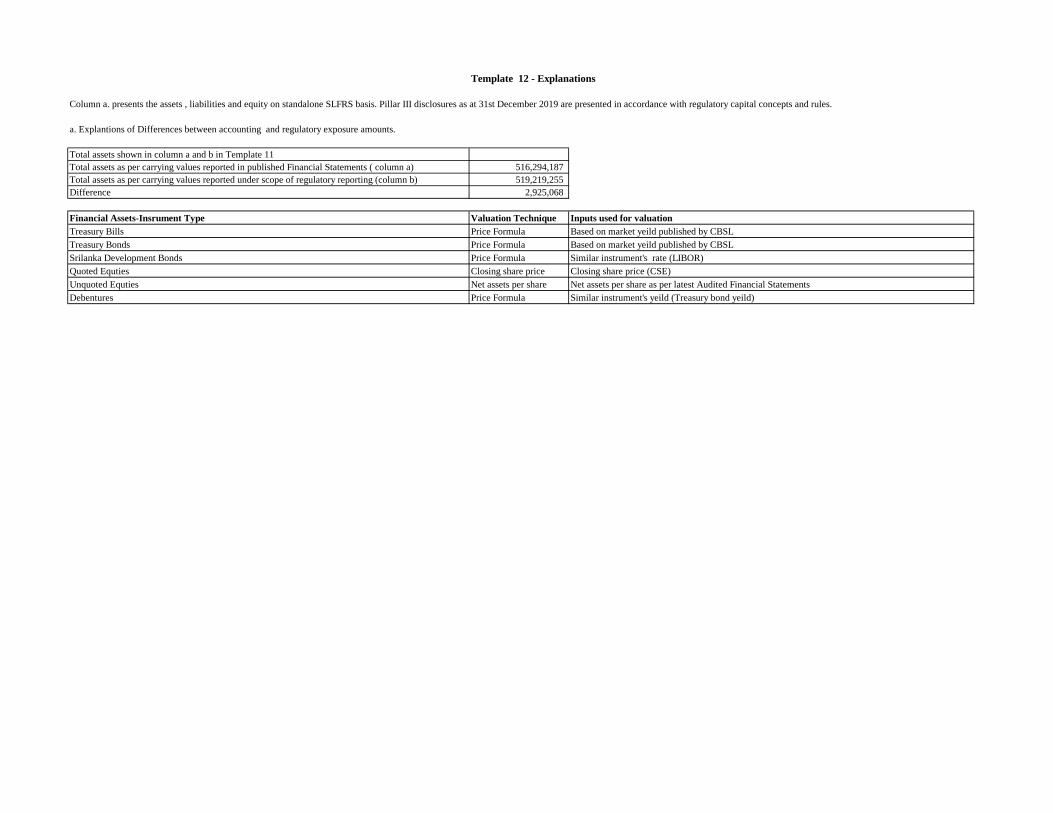
Template 12 - Explanations
Column a. presents the assets , liabilities and equity on standalone SLFRS basis. Pillar III disclosures as at 31st December 2019 are presented in accordance with regulatory capital concepts and rules.
a. Explantions of Differences between accounting and regulatory exposure amounts.
Total assets shown in column a and b in Template 11
Total assets as per carrying values reported in published Financial Statements ( column a) 516,294,187
Total assets as per carrying values reported under scope of regulatory reporting (column b) 519,219,255
Difference 2,925,068
Financial Assets-Insrument Type Valuation Technique Inputs used for valuation
Treasury Bills Price Formula Based on market yeild published by CBSL
Treasury Bonds Price Formula Based on market yeild published by CBSL
Srilanka Development Bonds Price Formula Similar instrument's rate (LIBOR)
Quoted Equties Closing share price Closing share price (CSE)
Unquoted Equties Net assets per share Net assets per share as per latest Audited Financial Statements
Debentures Price Formula Similar instrument's yeild (Treasury bond yeild)