sfd promotion initiative - susana.org
TRANSCRIPT
SFD Promotion Initiative
Kumasi
Ghana
Status Final Report
This SFD Report was created through field based research by WEDC as part of the SFD Promotion Initiative.
Date of production: 27/10/2015
Last update: 16/11/2015

SFD Report Kumasi, Ghana , 2015 Produced by: Claire Furlong ©Copyright All SFD Promotion Initiative materials are freely available following the open-source concept for capacity development and non-profit use, so long as proper acknowledgement of the source is made when used. Users should always give credit in citations to the original author, source and copyright holder.
This Executive Summary and SFD Report are available from:
www.sfd.susana.org

Last Update:16/11/2015 I
Kumasi Ghana
Produced by: WEDC
KMA Executive Summary
1. The Diagram
2. Diagram information
The excreta flow diagram (SFD) was created through field based research. Collaborating partners: Waste Management Department of Kumasi Metropolitan Assembly (KMA) Status: Final: Approved by collaborators Date of production: 27/10/2015
3. General city information
Kumasi is the second largest city in Ghana and lies in the Ashanti Region in the south of the country (Adarkwa, 2011). Due to its location it is a national and international transport hub and a trading centre for several commodities (Adarkwa, 2011). The city covers approximately 254km2.
The boundary used for the SFD was the old political border this includes Asawase sub-metropolitan area, which is no longer a part of the city. This was due to a lack of disaggregated data, as this separation occurred relatively recently.
The city has two rainy seasons; the main one from March to July and a shorter rainy season from
September to November (Adarkwa, 2011), during which localised flooding occurs (Owusu-Ansah, 2015). There are three major natural drainage routes; the Sisa-Oda, Offin and Owabbi river systems (CEDAR 1999).
The current population of Kumasi is approximately 2.7 million and annual growth rate is 5.5% (City Population, 2015, World Bank, 2008). A high proportion of the population is acknowledged to have a low income (KMA, 2006), but the proportion is unknown.
4. Service delivery context
Sanitation in Ghana refers to a wider context than human excreta management. It covers solid waste management, storm water drainage, the cleaning of streets and public areas, food hygiene, and the disposal of dead animals and people (MLGRD, 2010). A major challenge for all stakeholders is that excreta management is only a small part of sanitation policy, legislation, regulations, plans and budgets, therefore is usually hidden in the wider sanitation agenda.
National policies for excreta management in Ghana are forward thinking and go beyond containment as

Last Update:16/11/2015 II
Kumasi Ghana
Produced by: WEDC
KMA Executive Summary
they consider all wastes as a resource (MLGRD, 2010). This is not currently translated into regulation and legislation. Regulations, legislations and targets focus on achieving access to containment, as they were developed in the MDG era. National laws are translated into local bylaws, but it is acknowledged locally and nationally that they are not enforced. Public toilet provision is overlooked in the targets and legislation as their focus is on compound or private toilets.
National legislative powers are devolved to local governments, which means KMA has legislative powers in all matters, including excreta management. KMA also has a role as both a service provider and regulator, so they are largely a self-regulating authority.
Ghana’s sanitation sector has a well-established institutional set-up and clear lines of responsibility, but there is a lack of institutional ownership of monitoring, enforcement, registration and licensing of services. Although plans and policies in the sector do include monitoring and evaluation, there is little evidence that this occurs. When it does, the data is not made publically available, but held by local agencies, making it difficult to obtain both national and local data. KMA collects and collates data across the sanitation service chain in Kumasi including the number of vacuum tanker deliveries and details on the public toilets that are operated in the city. This data is only available from local agencies.
Excreta management plans in Ghana are currently being updated, as they were developed to run alongside the MDGs. National plans have been translated into local plans (KMA, 2008), but these focus predominately on provision of containment facilities.
Public sector involvement in sanitation is championed by national and local government. In Kumasi the private sector is involved in all aspects of the sanitation service chain, which has led to improvements in services e.g. the quality of public toilets.
Low income areas (LIAs) in Kumasi are not well defined not geographically. Measures are in place to ensure the urban poor have access to services, including the control of fees for the use of public toilets and special LIA programs focusing on the construction of compound toilets.
The population in Kumasi is growing at a faster pace than the budget allocated for waste management services (KMA, 2013; KMA 2014) or the expansion of services. It is predicted that this will cause slippages in the percentage of people served by sanitation facilities. If services did keep up with the increased demand, the capacity for septage treatment will need to be significantly increased.
5. Service outcomes
Kumasi has a diverse sanitation technology landscape and novel sanitation systems are currently being introduced, such as the Clean Team toilets, Biofil toilets and Duraplast septic tanks. Kumasi also has the only septage treatment plant in Ghana. The private sector has been involved in the sanitation sector in Kumasi for over 20 years.
A high percentage of the population in Kumasi is reliant on public toilets (39%, GSS, 2013). KMA regulate these facilities, which means they are designed appropriately, emptied by vacuum tankers and the septage is delivered to the septage treatment plant. A majority of the public toilet facilities are flushing toilets, with septic tanks connected to soakaways (23%). Other technologies used include aqua privies, Enviroloos and KVIPS. The quality of facilities is currently improving due to private sector involvement and the phasing out of dry technologies by KMA.
The number of open defecators is relatively small (3%, GSS 2013), with the remaining population having private toilets (57%, GSS 2013). Due to the high percentage of people living in compound housing (75%, Amoako & Korboe, 2011) this implies that most of these private systems are actually shared, although no official data is available to confirm this.
The technology definitions given in the national census focus on the user interface or external features i.e. the presence of a vent pipe or if the toilet is flushed by water. This gives little indication of how the containment or technology interfaces with the environment. Many terms are used interchangeably by stakeholders in Kumasi to describe the same technology. Therefore in-depth discussion was required with stakeholders to reach agreed definition of technologies that could be mapped onto the SFD.
Last Update:16/11/2015 III
Kumasi Ghana
Produced by: WEDC
KMA Executive Summary
A majority of the private systems are flushing systems (WCs, 36%). Of these, 24% are connected to septic tanks with soakaways, emptied by vacuum tankers and the septage taken to the septage treatment plant. The second most common containment is sealed tanks with no outlets (12%) i.e. septic tanks installed without a soakaway. The septage from these systems goes to the septage treatment plant via vacuum tankers. Basic pit latrines are only used by 11% of the population which are manually emptied, abandoned or emptied by vacuum tanker. The percentages which fell into each category were negotiated with the stakeholders.
The main kind of improved pit latrine used in Kumasi is the Kumasi VIP latrine (7%, GSS 2013). Discussion with owners indicates that they are predominately emptied by manual labourers. The material emptied is dry compost which is disposed of in the local environment, in a way that is considered to be safely managed.
A small proportion of the population are connected to decentralised sewer systems (4%). These localised sewer networks are connected to six sewage treatment plants, which are mainly pond systems.
Motorised emptying of facilitates has a long history of private sector involvement and there are currently 37 companies working in this field. They are highly organised through a trade association, but not overtly regulated by KMA. It is estimated that 95% of the waste they collect is taken to Dompoase septage treatment plant. Manual empting is very clandestine in Kumasi, although it is acknowledged that it occurs. Very little information is available about the practice of manual emptiers.
The septage and sewage treatment plants are deemed to be partially treating the waste. This acknowledges that there is a visual improvement in the effluent quality, although no effluent quality data is currently available. A lack of maintenance and monitoring at all sites results from insufficient capacity and budget. The maximum capacity of the septage treatment plant was exceeded up to 134 days during the first six months of 2015 (depending on average tanker volume and design capacity). Even when a more optimistic estimation is taken into account, the capacity of the septage treatment plant will be reached by 2020, which will significantly impact the treatment process.
A possible further contributor to excreta flow in Kumasi is school sanitation facilities. 35% of the population is estimated to be of school age (GSS, 2013) and there are 1,457 schools in Kumasi. The SFD does not include data from schools, as major assumptions are required to confirm the use of these facilities.
There is deemed to be a low risk to contamination of ground water from sanitation, due to the high usage of public toilets, and private septic and sealed tanks, which are well regulated. Plus a majority of the population gain their drinking water from piped supplies (66%, GSS 2013).
6. Overview of stakeholders
KMA’s Waste Management Department is responsible for building and maintaining sanitation facilities at a public and school level, and service provision in Kumasi. KMA owns a majority of the public toilets and sewage treatment plants, the septage treatment and several vacuum tankers. The private sector is heavily involved through the management of these assets and in the provision of mechanical empting. Environmental health standards are enforced by sub-metropolitan Public Health Officers in collaboration with the regional Environmental Protection Agency with guidance from KMA’s Environmental Health and Management Department. Compliance to sanitation regulations falls under the remit of KMA’s Waste Management Department together with the regional Environmental Protection Agency. There are many associations active in the sanitation sector in Kumasi such as landlords association, tenants associations, Kumasi Sanitation Awareness Association and the Vacuum Tanker Operators Association. Water and Sanitation for the Urban Poor is the main NGO working in Kumasi.
At a national level the Environmental Health and Sanitation Directorate is responsible for coordinating all sanitation activities. This directorate is in the Ministry of Local Government and Rural Development who are responsible for sanitation promotion. The Ministry of Education and the Ministry of Health are responsible for school sanitation. Whereas the Ministry of Water Resources, Works and Housing is responsible for setting all water polices, through their Water Directorate.

Last Update:16/11/2015 IV
Kumasi Ghana
Produced by: WEDC
KMA Executive Summary
7. Credibility of data
The SFD is based on the data from the 2010 census, triangulated through interviews and observations, and negotiated with key stakeholders. Data for other service outcomes came predominately from unpublished data held by local agencies, triangulated by field-based observation and key informant interviews.
The service delivery context has been developed through a literature review and reviewing nationally important policies and plans available in the public domain. KMA documentation has been obtained from local agencies, with results triangulated through key informant interview and observations.
8. Process of development
One limitation of developing this study is using census data from 2010 to generate the SFD. Another is that the study excludes the peri-urban settlements outside the boundary of KMA.
Little is documented on the sanitation realities in LIAs, due to these areas being poorly defined. There was a lack of primary data collected from service users and providers in LIAs. It is felt that school sanitation could be a significant contributor to the excreta landscape, but more research is required to include this component.
The fate of infiltrate from soakaways and pit latrines has been disregarded in the SFD. It was deemed to have little, if any adverse impact on health or the local environment (through ground water pollution). Therefore it is considered to be safely managed. The SFD represents only the flows of wastewater and faecal sludge through the sanitation service chain.
9. References
Adarkwa K. K. 2011. The role of Kumasi in National Development – Kumasi as a Central Place. Chapter 2, Future of the Tree: Towards growth and development of Kumasi. University Printing Press, KNUST, Ghana, 2010.
City Population. 2015. http://www.citypopulation.de/Ghana-Cities.html?cityid=2327 Last accessed 5/8/15
CEDAR (1999) Inception report: Peri-urban natural resources management at the watershed level, Kumasi. http://www.gg.rhul.ac.uk/kumasi/Inception/inception.html
GSS. 2013. 2010 Population and housing census. Regional analytical report. Ashanti Region
KMA.2006. http://www.kma.ghanadistricts.gov.gh/?arrow=atd&_=6&sa=5492 last accessed 08/05/15
KMA. 2008. District Environmental Sanitation Strategic Action Plan (DESSAP)
KMA. 2013. The composite budget of the Kumasi Metropolitan Assembly for the 2013 fiscal year.
KMA. 2014. The composite budget of the Kumasi Metropolitan Assembly for the 2013 fiscal year.
MLGRD. 2010. National environmental sanitation strategy and action plan (NESSAP): Materials in transition.
Owusu-Ansah, J. K. 2015. The influences of land use and sanitation infrastructure on flooding in Kumasi Ghana. GeoJournal. DOI: 10.1007/s10708-015-9636-4
WorldBank. 2008. Africa Region Working Paper Series Number 10. Development of the cities of Ghana. Challenges, Priorities and Tools.
SFD Kumasi, Ghana, 2015 Produced by: WEDC, Claire Furlong KMA, Antony Mensah © Copyright All SFD Promotion Initiative materials are freely available following the open-source concept for capacity development and non-profit use, so long as proper acknowledgement of the source is made when used. Users should always give credit in citations to the original author, source and copyright holder. This Executive Summary and the SFD Report are available from: www.sfd.susana.org

Last Update:16/11/2015 V
Kumasi Ghana
Produced by: WEDC
KMA Full Report
Table of Content Table of Content ...................................................................................................................................... V
List of tables .......................................................................................................................................... VII
List of figures ......................................................................................................................................... VII
Abbreviations ....................................................................................................................................... VIII
1 City context .......................................................................................................................................... 1
1.1 Location ....................................................................................................................................... 1
1.2 Climate ......................................................................................................................................... 1
1.3 Geography ................................................................................................................................... 2
1.4 Economics .................................................................................................................................... 2
1.5 Population .................................................................................................................................... 2
2 Service delivery context description & analysis .................................................................................... 3
2.1 Policy, legislation and regulations ................................................................................................ 3
2.1.1 National policy ............................................................................................................... 3
2.1.2 National Laws and regulations ....................................................................................... 4
2.1.3 Local bylaws ................................................................................................................... 4
2.1.4 Institutional roles ........................................................................................................... 5
2.1.5 Service provision ............................................................................................................ 6
2.1.6 Service standards ........................................................................................................... 7
2.2 Planning ....................................................................................................................................... 8
2.2.1 Service targets ............................................................................................................... 8
2.2.2 Investments ................................................................................................................... 9
2.3 Reducing inequity ...................................................................................................................... 10
2.3.1 Current choice of services for the urban poor ............................................................. 10
2.3.2 Plans and measures to reduce inequity ....................................................................... 11
2.4 Outputs ...................................................................................................................................... 12
2.4.1 Capacity to meet service needs, demands and targets ............................................... 12
2.4.2 Monitoring and reporting access to services ............................................................... 12
2.5 Expansion ................................................................................................................................... 12
2.5.1 Stimulating demand for services ................................................................................. 12
2.5.2 Strengthening service provider roles ........................................................................... 12
3 Service Outcomes ............................................................................................................................... 13
3.1 Offsite technologies ................................................................................................................... 13
3.2 Onsite technologies ................................................................................................................... 14
3.2.1 Water closet (WC) ....................................................................................................... 14
3.2.2 Pit latrines .................................................................................................................... 15

Last Update:16/11/2015 VI
Kumasi Ghana
Produced by: WEDC
KMA Full Report
3.2.3 Improved latrines ........................................................................................................ 15
3.2.4 Aqua privy .................................................................................................................... 16
3.2.5 Enviroloos .................................................................................................................... 17
3.2.6 Bucket latrines ............................................................................................................. 17
3.2.7 The Clean Team Toilets ................................................................................................ 18
3.2.8 Duraplast septic tanks ................................................................................................. 19
3.2.9 Biofil ............................................................................................................................. 19
3.3 Usage ......................................................................................................................................... 19
3.4 Categories of origin .................................................................................................................... 20
3.4.1 Households .................................................................................................................. 20
3.4.2 Shared or communal toilets ........................................................................................ 20
3.4.3 Public toilets ................................................................................................................ 20
3.4.4 Institutional toilets ....................................................................................................... 21
Prisons ......................................................................................................................... 21
Military bases............................................................................................................... 21
Educational Institutions ............................................................................................... 21
Hospitals ...................................................................................................................... 23
Restaurants and hotels ................................................................................................ 23
3.5 Motorised Emptying .................................................................................................................. 23
3.6 Manual Emptying ....................................................................................................................... 24
3.7 Treatment, end-use and disposal .............................................................................................. 24
3.8 Drinking water supplies in the city ............................................................................................. 27
3.8.1 Ground water pollution assumptions .......................................................................... 28
4 SFD Matrix .......................................................................................................................................... 28
4.1 Levels of uncertainty .................................................................................................................. 28
5 Stakeholder Engagement ................................................................................................................... 30
5.1 Key informant interviews ........................................................................................................... 31
5.2 Focus group discussions............................................................................................................. 32
5.3 Observation of service providers ............................................................................................... 32
6 Prospects for uptake and use of this study......................................................................................... 33
Acknowledgements ............................................................................................................................... 34
References ............................................................................................................................................. 34
Appendix 1: Stakeholder identification ................................................................................................. 37
Appendix 2: Tracking of engagement .................................................................................................... 38
Appendix 3: Stakeholders meeting ........................................................................................................ 39
Appendix 4: Final SFD for Kumasi .......................................................................................................... 41

Last Update:16/11/2015 VII
Kumasi Ghana
Produced by: WEDC
KMA Full Report
List of tables Table 1: Roles and responsibilities in the water and sanitation sector in Ghana .................................... 6 Table 2: National and local sanitation strategies and targets .................................................................. 9 Table 3: Details of the sewage treatment plants in Kumasi .................................................................. 14 Table 4: Usage levels for different sanitation types in Kumasi .............................................................. 20 Table 5: The breakdown of different sanitation technologies used in public toilets ............................. 21 Table 6: Number of public and private schools in Kumasi (KMA, 2015o) .............................................. 22 Table 7: Vacuum tanker criteria and fees charged (KMA, 2015c) ......................................................... 23 Table 8: Data from Section 3 used to generate the SFD ........................................................................ 29 Table 9: Data used to generate the SFD ................................................................................................ 30 Table 10: Details of unstructured interviews......................................................................................... 32 Table 11: Observation of service providers ........................................................................................... 33
List of figures Figure 1: Kumasi sub-metropolitan areas (Maoulidi, 2010) .................................................................... 1 Figure 2: A sketch map showing pockets of poverty in Kumasi (KMA, 2015a) ........................................ 3 Figure 3: Two sewage treatments plants visited ................................................................................... 13 Figure 4: Public septic tank facility, Ayeduase Market, Oforikrom ........................................................ 15 Figure 5: Kumasi VIP Latrines ................................................................................................................ 16 Figure 6: A public aqua privy facility, Bomoso, Oforikrom..................................................................... 17 Figure 7: Public Enviroloo facilities Angola, Oforikrom .......................................................................... 17 Figure 8: Clean Team service chain, Sawaba ......................................................................................... 19 Figure 9:The types of sanitation systems used in public schools in 2015 (KMA, 2015o) ...................... 22 Figure 10: Motorised emptying in Kumasi ............................................................................................. 24 Figure 11: Dompoase Septage Treatment Plant .................................................................................... 25 Figure 12: The number of vacuum tankers discharging at Dompoase Septage treatment plant over six months in 2015, compared to the maximum number of tankers that can be accommodated under four different scenarios ......................................................................................................................... 27 Figure 13: Stakeholder involvement in the the sanitation service chain in Kumasi (KMA, 2015d) ....... 31

Last Update:16/11/2015 VIII
Kumasi Ghana
Produced by: WEDC
KMA Full Report
Abbreviations BOT Build Operate Transfer DEHO District Environmental Health Officer DESSAP District Environment Sanitation Strategy and Action Plan DIMES District Monitoring and Evaluation System EHO Environmental Health Officer EPA Environmental Protection Agency ESP Environmental Sanitation Policy FGS Focus Group Discussion GDP Gross Domestic Product GoG Government of Ghana GSGDA Ghana Shared Growth and Development Agenda GSS Ghana Statistical Service ISIO Incremental Service Improvement Option KATH Komoto Anokye Teaching Hospital KMA Kumasi Municipal Assembly KNUST Kwame Nkrumah University of Science and Technology KVIP Kumasi Ventilated Improved Latrine LIA Low Income Area M&E Monitoring and Evaluation MDG Millennium Development Goal MLGRD Ministry of Local Government and Rural Development M&E Monitoring and Evaluation MoE Ministry of Education MoH Ministry of Health MoFEP Ministry of Finance and Economic Planning MoWRWH Ministry of Water Resources, Works and Housing NDPC National Development Planning Commission NESSAP National Environmental Sanitation Strategy and Action Plan NGO Non-Governmental Organisation PPP Public Private Partnership SESIP Strategic Environmental Sanitation Investment Plan SFD Excreta Flow Diagram SNV Netherlands Development Organisation VIP Ventilated Improved Latrine VTO Vacuum Tanker Operator UNDP United Nations Development Programme US$ United States Dollars WC Water Closet WMD Waste Management Department WSMP Water and Sanitation Monitoring Platform WSP Water and Sanitation Program of the World Bank WSUP Water and Sanitation for the Urban Poor
Last Update:16/11/2015 1
Kumasi Ghana
Produced by: WEDC
KMA Full Report
1 City context
1.1 Location
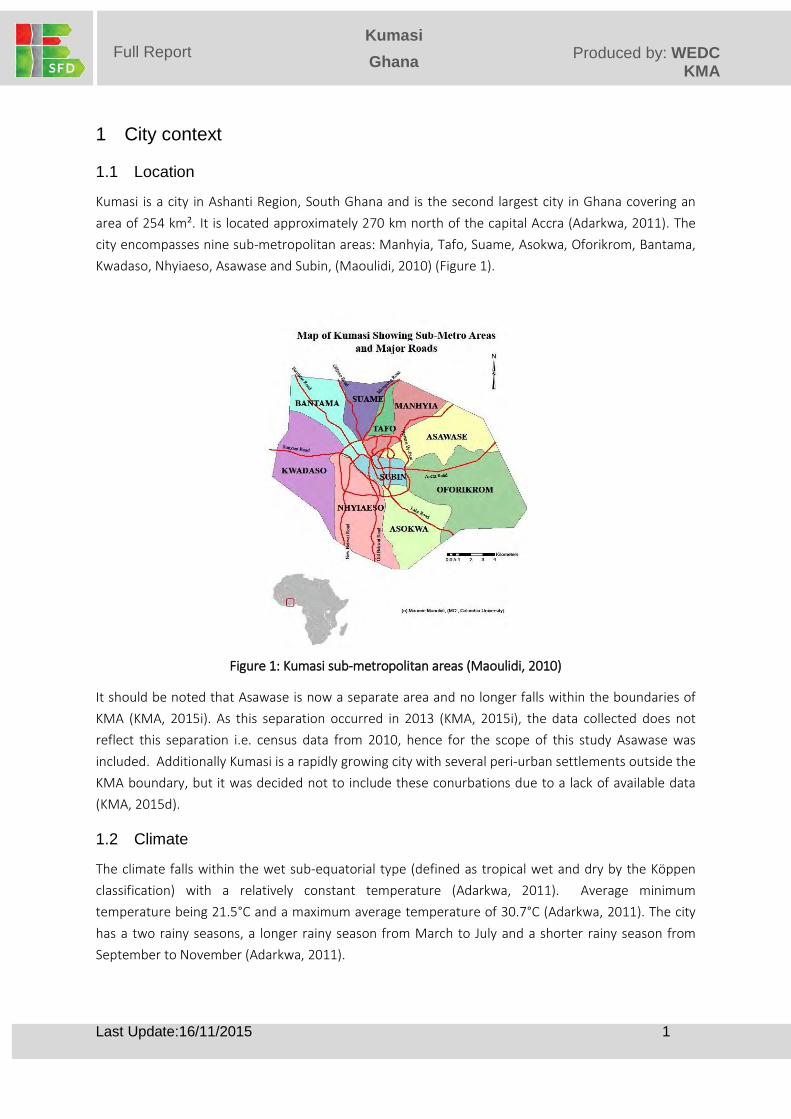
Kumasi is a city in Ashanti Region, South Ghana and is the second largest city in Ghana covering an area of 254 km². It is located approximately 270 km north of the capital Accra (Adarkwa, 2011). The city encompasses nine sub-metropolitan areas: Manhyia, Tafo, Suame, Asokwa, Oforikrom, Bantama, Kwadaso, Nhyiaeso, Asawase and Subin, (Maoulidi, 2010) (Figure 1).
Figure 1: Kumasi sub-metropolitan areas (Maoulidi, 2010)
It should be noted that Asawase is now a separate area and no longer falls within the boundaries of KMA (KMA, 2015i). As this separation occurred in 2013 (KMA, 2015i), the data collected does not reflect this separation i.e. census data from 2010, hence for the scope of this study Asawase was included. Additionally Kumasi is a rapidly growing city with several peri-urban settlements outside the KMA boundary, but it was decided not to include these conurbations due to a lack of available data (KMA, 2015d).
1.2 Climate
The climate falls within the wet sub-equatorial type (defined as tropical wet and dry by the Köppen classification) with a relatively constant temperature (Adarkwa, 2011). Average minimum temperature being 21.5°C and a maximum average temperature of 30.7°C (Adarkwa, 2011). The city has a two rainy seasons, a longer rainy season from March to July and a shorter rainy season from September to November (Adarkwa, 2011).

Last Update:16/11/2015 2
Kumasi Ghana
Produced by: WEDC
KMA Full Report
1.3 Geography
The topography of Kumasi is undulating, ranging from 215.8m to 274.6 m above sea level (Owusu-Ansah, 2015). Much of the city drains south to the Sisa-Oda river system, but the northwestern part of the city drains west to the Offin and Owaabi river systems (from which the water supply is extracted Section 3.8) (CEDAR 1999). Flooding events within the city are common during the rainy seasons and flash flooding is common in November and January due to the hard baked soils (Owusu-Ansah, 2015).
The geology is made up of predominately two rock formations, Lower Birimian metasediments (mainly phyllites and metagreywackes) which cover 45% of Kumasi’s land area and the associated granitic complex (granites, granodiorites, pegmatitic dykes and quartz veins), above these are superficial deposits of gravels, sands, silts and clays (UNDP/World Bank, 1990). The predominate soil types are gravelly and earthy, laterite and lateritic hardpans in the uplands, while in the valleys there are scattered deposits of sand and clay (UNDP/World Bank, 1990). Stabilised ground water levels vary widely from 1.5 m to > 12 meters depending on distance to floodplain and altitude (UNDP/World Bank, 1990). A few locations in Tafo, Asawase, Suame, Oforikrom and Nayhiaeso sub-metros (Figure 1) were identified as having high water tables of <2 m (UNDP/World Bank, 1990), while it is conservatively estimated that 60% of the population live in areas where the ground water table is <5m (22 housing settlements out of 32) (UNDP/World Bank, 1990) .
1.4 Economics
Due to Kumasi’s location it is a principal transport hub for movements around Ghana and beyond. It is also a major trade route for landlocked countries in the region such as Niger, Burkina Faso, Togo and Mali (Adarkwa, 2011). Due to this there are a large number of people in transit in the city, but it was estimated that they amount to < 1% of the city’s resident population. It has a role as a central trading centre for several commodities in the country (Adarkwa, 2011), and Kejetia Market (Kumasi Central Market) is the largest market in West Africa.
There are several manufacturing industries in the city including beverage and wood processing industries located in the Asorkwa-Ahinsan-Kaase industrial areas (Adarkwa, 2011). Several hundred small scale engineering industries are located in Suame (Figure 1) and there is significant agricultural activity within the city (Adarkwa, 2011). Many people are also employed by the surrounding mining industries which are located outside the city (WSUP, 2014b).
1.5 Population
The 2010 Census results show that the population of Kumasi was 2,035,064 (GSS, 2013). Using the annual population growth rate of 5.5% (City Population, 2015; World Bank, 2008), the calculated current population for Kumasi is 2,659,747. It is worth noting that internal and external migration is a contributing factor to the high population growth rate in Kumasi, presently over a third (34%) of the population are migrants (GSS, 2013).
Poverty levels are perceived to be high throughout the metropolis (KMA, 2006). Although many communities have mixed socioeconomic status, there are a few communities which are thought to be
Last Update:16/11/2015 3
Kumasi Ghana
Produced by: WEDC
KMA Full Report
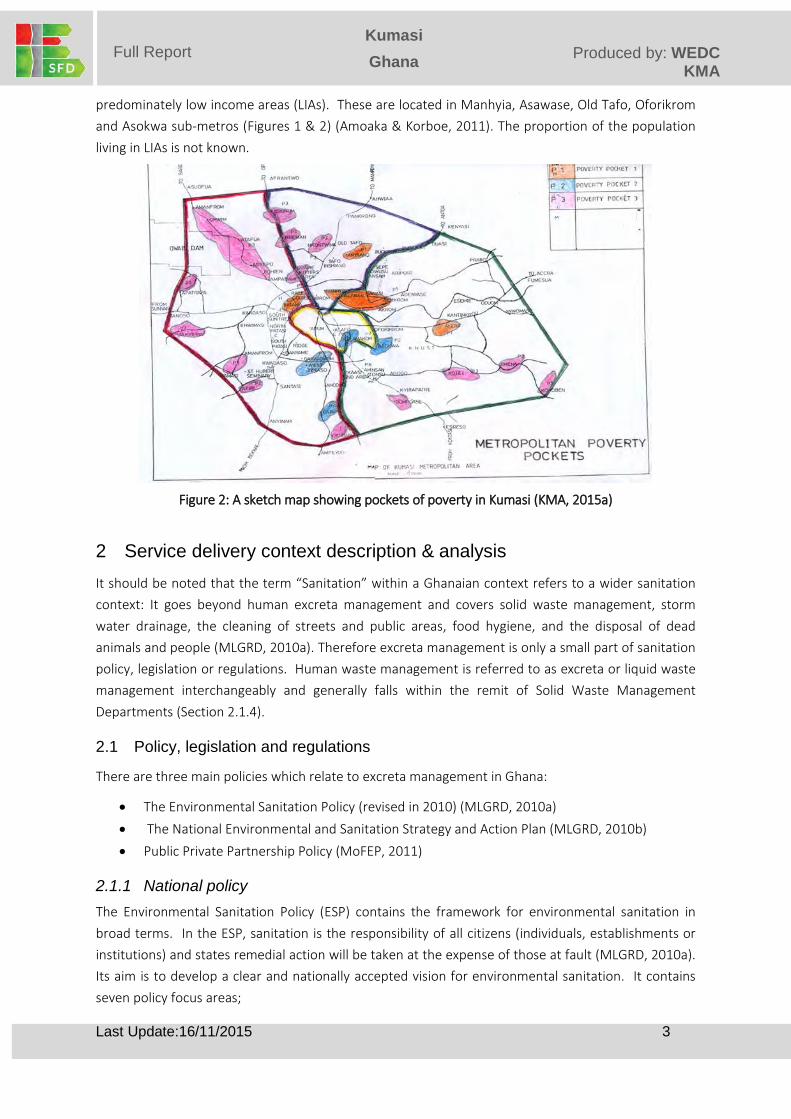
predominately low income areas (LIAs). These are located in Manhyia, Asawase, Old Tafo, Oforikrom and Asokwa sub-metros (Figures 1 & 2) (Amoaka & Korboe, 2011). The proportion of the population living in LIAs is not known.
Figure 2: A sketch map showing pockets of poverty in Kumasi (KMA, 2015a)
2 Service delivery context description & analysis It should be noted that the term “Sanitation” within a Ghanaian context refers to a wider sanitation context: It goes beyond human excreta management and covers solid waste management, storm water drainage, the cleaning of streets and public areas, food hygiene, and the disposal of dead animals and people (MLGRD, 2010a). Therefore excreta management is only a small part of sanitation policy, legislation or regulations. Human waste management is referred to as excreta or liquid waste management interchangeably and generally falls within the remit of Solid Waste Management Departments (Section 2.1.4).
2.1 Policy, legislation and regulations
There are three main policies which relate to excreta management in Ghana:
• The Environmental Sanitation Policy (revised in 2010) (MLGRD, 2010a) • The National Environmental and Sanitation Strategy and Action Plan (MLGRD, 2010b) • Public Private Partnership Policy (MoFEP, 2011)
2.1.1 National policy The Environmental Sanitation Policy (ESP) contains the framework for environmental sanitation in broad terms. In the ESP, sanitation is the responsibility of all citizens (individuals, establishments or institutions) and states remedial action will be taken at the expense of those at fault (MLGRD, 2010a). Its aim is to develop a clear and nationally accepted vision for environmental sanitation. It contains seven policy focus areas;

Last Update:16/11/2015 4
Kumasi Ghana
Produced by: WEDC
KMA Full Report
1. Capacity development 2. Information, education and communication 3. Legislation and regulation 4. Levels of service 5. Sustainable management and corporate responsibility 6. Research and development 7. Monitoring and evaluation (WSUP, 2014b).
The ESP provides the framework for establishing a monitoring and evaluation system, but this has yet to be implemented (Section 2.2.1).
The goal of the National Environmental Sanitation Strategy and Action Plan (NESSAP) is to change the perception of both solid and liquid waste into a resource focused approach and is seen as a natural progression of the ESP (MLGRD, 2010b; WSUP, 2014). NESSAP reviews the current situation and defines national objectives and strategies which include:
• Banning defecation and urination in places other than toilets and urinals • Banning the use of bucket latrines by 2010 • Promoting the use of domestic toilets • Providing adequate and modern public toilets and urinals for transitory populations • Monitoring all activities with the potential for pollution • Enforcing bylaws (MLGRD, 2010b)
Public Private Partnership Policy has been produced by the Ministry of Finance and Economic Planning (MoFEP ) and covers all aspects of public private partnerships (PPPs) in the public sector including sanitation (MoFEP, 2011), the details of this policy can be found in Section 2.1.5.
2.1.2 National Laws and regulations Ghana has a number of regulations and bylaws to regulate excreta management. The 1992 Constitution devolved legislative powers to local governments, such as KMA (WSUP, 2014b). The Local Government Act (462) mandates that the sub-metros manage and operate public toilets, set public toilet fees, construct and maintain sewerage systems, and manage the removal and treatment of faecal sludge. Under the Environmental Protection Agency Act (1994), the EPA is responsible for the provision of solid waste management framework and guidelines in the sanitation sector, which includes the management of faecal sludge (WSUP, 2014b).
2.1.3 Local bylaws Due to the devolution of legislative powers a number of KMA bylaws cover excreta management these include:
• Sanitation Bylaw 5 (1,2,3 and 4, 2015 ) provisions for faecal disposal at the compound level is required and refers to the banning of bucket toilets/latrines
• Nuisance Bylaw 4 (1) makes it an offence if sanitation facilities cause a nuisance via bad maintenance and accumulated excreta

Last Update:16/11/2015 5
Kumasi Ghana
Produced by: WEDC
KMA Full Report
• House Owner and Occupier Bylaw 7 (1, 2013) makes it an offence to construct a house without a toilet or latrine, it also prohibits households from emptying sanitation systems in an inappropriate way and disposing of their contents into drains (WSUP, 2014c)
It can be seen that most of the KMA bylaws concern the containment stage of the sanitation service chain. These bylaws are not strictly enforced as even with Bylaw 5 and 7 in place there is still a low number of household facilities and the population is highly reliant on public toilets (Section 3.3).
2.1.4 Institutional roles It is widely acknowledged that Ghana’s sanitation sector has a well-established institutional set up and clear lines of responsibility. At a national level the Ministry of Water Resources, Works and Housing (MoWRWH) is responsible for setting the water polices in the country and water resource management. Within the MoWRWH the Water Directorate oversees sector policy formation and review, monitoring and evaluation of activities of agencies and coordination of activates of donors (WSP, 2011). The Ministry of Local Government and Rural Development (MLGRD) is responsible for policies and programs for the efficient administration of local government structures such as KMA. Within MLGRD the Environmental Health and Sanitation Directorate is responsible for coordinating activities of all sector institutions involved in the sanitation sector (WSP, 2011). The Ministry of Education (MoE) is responsible for school sanitation and jointly responsible with the Ministry of Health (MoH) for sanitation and hygiene education. The Ministry of Environment, Science and Technology ensures that sector activities are consistent with environmental policies and objectives (WSP, 2011).
At a regional level the Metropolitan Assembly (i.e. KMA) is responsible for delivering sanitation using the private sector for infrastructure delivery or management, and for developing the District Water and Sanitation Plan (WSP, 2011). The District Water and Sanitation Team, comprising of members from the Works, Health and Planning Departments are responsible for implementing the Districts Water and Sanitation Plan (WSP, 2011). District Environmental Health Officers (DEHOs) educate communities on sanitation and hygiene, and enforce regulations regarding the construction, use and management of public, institutional and household facilities (WSP, 2011). More details of the institutions and their roles can be found in Table 1.

Last Update:16/11/2015 6
Kumasi Ghana
Produced by: WEDC
KMA Full Report
Table 1: Roles and responsibilities in the water and sanitation sector in Ghana (Adapted from WSUP, 2014b)
Institution Role Responsibility
MLGRD Oversight responsibility -Coordination and formulation of policy including M&E
-Development of technical guidelines -Promulgation of national legislation
-Mobilisation of funds
MoFEP Financial relations -Fund mobilisation
-Direction on PPP
Regional Coordination Council
Coordination, monitoring, evaluation and advisory services
-Compliance to standards and guidelines
Waste Management Dept. KMA
Ensure the provision of services -Provision of sanitation services
-Compliance with regulations
Environmental Health & Management Dept. KMA
Ensure environmental health standards
-Public health monitoring
-Sanitation education -Implemented through EHOs in collaboration with the EPA
Metropolitan & Works Dept. KMA
Provision of infrastructure -Provision of infrastructure
Sub Metropolitan Assemblies
Public health monitoring and facility development
-Sanitation education -Inspection and monitoring of facilities
-Implemented through local agents such as EHOs
EPA – Regional office in Kumasi
Enforcement of environmental regulations
- Ensure the environmental regulations are met
The Environmental Monitoring Section of the Environmental Protection and Standards Enforcement Unit (located in the Environmental Health and Management Department in KMA) in collaboration with the EPA is responsible for monitoring and enforcing environmental standards and regulations set by the EPA and other regulatory agencies. This includes the monitoring of the environmental impact of the Assembly’s own sanitation services such as septage treatment and public toilets; hence they are a semi self-regulating authority.
Additionally a directory of Ghana’s water and sanitation sector is available, which identifies all key stakeholders and their roles and responsibilities including bilateral organisations and NGOs. This has not been updated since 2010 (WSMP, 2010). Even with the above in place there is no well-defined institutional responsibility for monitoring, enforcement, registration and licensing of operators (KMA, 2015i, WSP, 2011).
2.1.5 Service provision The NESSAP sets the national sanitation agenda, including the agenda for excreta management (MLGRD, 2010b). This includes a framework for funding the strategies proposed. These financial plans for improving service provision were further developed in the Strategic Environmental
Last Update:16/11/2015 7
Kumasi Ghana
Produced by: WEDC
KMA Full Report
Sanitation Investment Plan (SESIP) which intends to provide a sustainable financing plan for implementing the NESSAP (MLGRD, 2010b).
The Government of Ghana (GoG) states that the majority of excreta management services should be provided by the private sector, with Assemblies maintaining an in-house capacity to provide at least 20% of the services directly (MLGRD, 2010a). Through the ESP, provision is made for private sector involvement in desludging of all facilities, construction and management of public toilets (MLGRD, 2010a). This is reiterated in the subsequent national and local plans and policies. The Ghana Shared Growth and Development Agenda (GSGDA) 2010-2014 contains sections on private investment in Ghana, which is pursued through the Private Sector Development Strategy in GSGDA (NDPC, 2010), NESSAP (MLGRD, 2010b) and SESIP (MLGRD, 2011). Private sector involvement is mainly through PPPs and in Kumasi sections on PPPs have been included in the District Environmental Sanitation Action Plan (KMA, 2008) and Medium Term Development Plan (KMA, 2015a).
The Public Private Partnership Policy creates a structure to encourage the development of PPPs for infrastructure and services, including those required for excreta management. It harmonizes the policy guidelines and creates a PPP framework which can be followed. It states that all PPPs are to be governed in accordance with clear objectives and output requirements, accountability and transparency. It establishes six guiding principles for PPPs within Ghana which are: value for money, transfer of risk to the private party, ensuring end users ability to pay, promotion of local companies and technologies, safeguarding the public and conforming to national laws (MoFEP, 2011).
In Ghana there is a framework to enable and guide investment from the public and private sector. Although many of these frameworks include provision for M&E, reports are either not readily available or do not exist, so it is unclear if these frameworks or M&E activities are being implemented.
2.1.6 Service standards Nationally, monitoring is poorer in urban sanitation than in other sectors (WSP, 2011). This was meant to be addressed by the Water and Sanitation Monitoring Platform (WSMP), which was set-up to assemble, analyse, repackage and disseminate all relevant water and sanitation data (WSP, 2011). This platform seems to be obsolete as the latest data on the website is from 2010. Even after WSMP was established there was no agreement on sector indicators or harmonisation of definitions (WSMP, 2009; WSP, 2011). Information on urban sanitation at a city level is difficult to access; this includes basic data on coverage, functionality and investment. Although sector wide annual reports are supposed to be available, these could not be found. Therefore consolidated reporting of outputs are missing and data can only be obtained at agency level. A framework for M&E in the sector is highlighted in NESSAP (MLGRD, 2010b), but there is no evidence that this has been implemented.
Presently there is no credible provider-based data for access and coverage in the sanitation sector, so Ghana Statistical Service (GSS) data has to be used. There is no systematic monitoring of the number and quality of facilities at households or equity within this sector (WSP, 2011). As noted in Section
Last Update:16/11/2015 8
Kumasi Ghana
Produced by: WEDC
KMA Full Report
2.1.4 there is a lack of institutional ownership of monitoring and evaluation in Ghana, which means these data is lacking from reports (KMA, 2015i).
Records are kept by KMA from different parts of the sanitation service chain i.e. fees are collected from those connected to sewers and the number of tankers entering the septage treatment plant are recorded etc. (KMA, 2015c,f). These records are not in the public domain and there is limited analysis of the data collected (e.g. KMA, 2014c, m-n).
As noted in 2011 by WSP there is a lack of M&E in the sanitation sector, which Ghana has tried to address by multiple action plans, but this has not been resolved, possibly due to a the noted lack of budget and capacity (MLGRD, 2011; NDPC, 2010). When monitoring occurs there is a lack of evaluation and transparency as data can only be accessed via local agencies.
2.2 Planning
Nationally the main plans relating to excreta management are the: GSGDA 2010-2013 (NDPC, 2010) and NESSAP (MLGRD, 2010b). These are then translated into local plans, such as the Medium Term Development Plan for Kumasi (KMA, 2015a) and District Environmental Sanitation Strategic Action Plan 2008 to 2015 (DESSAP) (KMA 2008). It should be noted that 2015 is a transition period as the plans were designed to be implemented with the MDGs, so new local plans are currently being formulated.
2.2.1 Service targets The goal of the ESP is for 90% of Ghanaians to have access to acceptable domestic sanitation and for 10% to have access to hygienic public latrines by 2020. (MLGRD, 2010a). An incremental approach is being applied and NESSAP calls for 75% household coverage by 2015 (MLGRD, 2010b). Furthermore this approach has been applied to improvements in the sanitation technologies as nationally they are using Incremental Service Improvement Options (ISIOs). Within this there is a push for implementing simplified sewerage (MLGRD, 2010b). A National Annual Progress Report for GSGDA produced in 2013 noted that those with access to improved sanitation increased from 13% to 14% from 2012-2013, which fell short of the 28% target for 2013 (NDCP, 2014).
In Table 2 strategies and targets in these plan and how have been adopted into the local context by KMA can be seen. Most of the local targets focus on containment. This is a reflection of the development agenda when they were authored, which was dominated by the MDGs. Local targets therefore do not reflect the evolved sanitation service chain in Kumasi i.e. the number of vacuum tankers and the presence of a septage treatment site.

Last Update:16/11/2015 9
Kumasi Ghana
Produced by: WEDC
KMA Full Report
Table 2: National and local sanitation strategies and targets
Authority GoG KMA
Year 2010-2013 N/A 2008-2015
Plan GSGDA NESSAP DESSAP
Stra
tegi
es a
nd T
arge
ts
Promotion of low cost domestic latrines
Household toilet coverage of 75% by 2015
2,910 facilities for basic schools in rural, small and large towns and low income urban areas
Build 2,000 household latrines
Construct 20 public toilets
Rehabilitate 30 public toilets
Improve treatment of wastewater
ISIOs
Disposal sites to be operational by 2012
Promote the use of simplified sewerage
ISIOs promoting simplified sewerage
Improve the state and management of urban sewage systems
Rehabilitation of sewage systems KMA to purchase 2 vacuum tankers
Enforce bylaws Enforcement of current laws Enforcement of sanitation bylaws
Strengthen PPP Private sector involvement in public latrines and treatment processes, all desludging provided by private sector, training of private artisans
Promote cost effective and innovative technologies
ISIOs
Develop and M&E system for sanitation
Implement the Sanitation and Water for all Ghana Compact
2.2.2 Investments Ghana’s eThekwini commitment was to spend at least 0.5% of its GDP on sanitation and hygiene, but in 2012 only 0.0002% of GDP was spent on urban sanitation (WaterAid, 2012). National spending on urban sanitation averaged US$ 7 million per year from 2008 to 2010, but this decreased in 2011, due to delays in projects and budget cuts (WaterAid, 2012).
The GSGDA calls for sustainable, predictable and adequate financing for sanitation (NDPC, 2010). The total cost of implementing NESSAP from 2011 to 2015 is estimated to be US$ 941,186,491. Approximately 18% of this budget is allocated to excreta management, while a majority of the budget is dedicated to solid waste management (MLGRD, 2011). This budget is provided by local government (58%), the users (21%), the private sector (13%) and the GoG (8%) (MLGRD, 2011). It is acknowledged that there is a finance gap of 65%, which is the responsibility of the GoG to fill. This is expected to be

Last Update:16/11/2015 10
Kumasi Ghana
Produced by: WEDC
KMA Full Report
financed via the Consolidated Fund, development partners, international direct funding, increasing the District Assemblies Common Fund, ring fencing funds for sanitation, and sourcing funds from sectors which benefit from sanitation (MLGRD, 2011).
The budget is to be spent in the following ways: ensuring private sector involvement under the management of the public sector (7%), implementing pro-poor improvements (31%), ensuring wastewater treatment facilities meet standards (5%), ensuring adequate systems for wastewater treatment and reuse (3%), ensuring accessible facilities are available (<1%), and seed funds for revolving loan home sanitation promotion (targeting the urban poor) (53%) (MLGRD, 2011).
Additionally through NESSAP the GoG are committed to establish Special Sanitation Funds for the five biggest cities which includes Kumasi, and a National Sanitation Investment Fund (MLGRD, 2010b). These funds are only now just being set up, so have not been available for use (SNV, 2015). Historically the GoG has been reluctant to release the funds promised to this sector (WaterAid, 2012, WSP, 2011). It is believed that this is the first sanitation investment plan that disaggregates excreta management, so previous budgets cannot be explored.
2.3 Reducing inequity
In Kumasi the urban poor are ill-defined and not readily identified by institutions; this is possibly due to the extent of mixed housing in most areas, although pockets of poverty have been identified (Section 1.5).
2.3.1 Current choice of services for the urban poor In Kumasi the urban poor are heavily reliant on public toilets (Section 3.3) and different types of
sanitation technology are being used (Section 3.4.3). A majority of the public toilets (54%) are now operated by the public sector under either build operate transfer (BOT), rehabilitate operate transfer or build operate own agreements (KMA, 2015n). The charge for using a public latrine ranges from 0.2 to 0.5 Cedes depending on technology type, the requirement for paper and if the user is a child (KMA, 2015e).The charges are set by KMA on a yearly basis and KMA collects a 15% surcharge on all public toilets (WSUP, 2014b). Public toilets are opened from 5 am to 10 pm (KMA, 2015e), but there are queues at peak periods (5.30-6.30 am) (WSUP, 2014b). Many of the private operators are also vacuum tanker operators (VTOs) (KMA, 2015e) and cost of emptying can be seen in Table 7. Once emptied the waste is taken to Dompoase septage treatment plant (Section 3.7).
The Clean Team (www.cleanteamtoilets.com) also serve the urban poor in Kumasi using a modernised version of bucket toilets/latrines. Although now outlawed, bucket latrines have been historically used since the colonial period in Kumasi (Amoako & Korboe, 2011). A description of the Clean Team technology can be found in Section 3.2.7. The household cost of this system and service is 35 Cedes per month and there are approximately 1,000 households using the system although user numbers fluctuate as the hardware is removed if payment is not made (Clean Team 2015a-b).

Last Update:16/11/2015 11
Kumasi Ghana
Produced by: WEDC
KMA Full Report
Presently KMA and the GoG are promoting the building and use of compound toilets. This has developed into KMAs “Toilets in Every Compound Scheme” which is being supported by WSUP. This scheme is targeting the urban poor and introducing two relatively novel technologies; prefabricated plastic septic tanks produced by Duraplast Ghana (Section 3.2.8) and the Biofil (Section 3.2.9). These technologies are listed with seven traditional technologies that households can choose to purchase using a financing scheme (KMA, 2014b).
As a majority of the urban poor are renting they have little influence on the sanitation facilities in their compound. The GoG and KMA’s push for compound sanitation through the Toilets in Every Compound Program may increase household sanitation, but tenants’ access to the facilities may be limited. This situation has been seen in a recent study of compound sanitation in Kumasi (Mazeau et al., 2014). Presently a majority use public toilets, which seem affordable and the quality of the facilities are improving due to private sector involvement. Restricted opening hours do however limit access. The Clean Team toilet seems to be affordable and acceptable to many, but it is yet to be seen if their business model is scalable and can standalone without its current subsidy. What is of interest is that a majority of the Clean Team users have switched from using public toilets (Clean Team, 2015b).
It could be concluded that the urban poor’s present needs are partially met by a combination of public toilets and the Clean Team’s toilets, which both seem to be affordable, appropriate and safe, but capacity needs to be increased due to the rapidly growing population.
2.3.2 Plans and measures to reduce inequity There are measures in place in the legislature to ensure services reach the urban poor i.e. the control of the public toilet pricing by local government. There is also legislation in place to ensure the affordability of private sector services and to safeguard vulnerable groups (MoFEP, 2011).
Within NESSAP, excreta management sections state that LAs need to ensure services meet the needs of specific target groups including the poor. This developed into an initiative to improve 2,9100 school sanitation facilities in LIAs across the country (MLGRD, 2010b) and led to 31% of the excreta management budget in SESIP being used for a pro-poor school sanitation programme (MLGRD, 2011).
KMA has a five year program to increase the access to compound toilets for 100,000 residents in LIAs (under the Toilet in Every Compound Program) has its origins in NESSAP and DESSAP and has just started to be implemented. This five year strategy is being supported by WSUP and the Department for International Development (United Kingdom) (Mazeau et al, 2014). KMA, supported by WSUP also has a program to improve school sanitation in LIAs. Under an ongoing program they have built three and rehabilitated four toilet blocks, providing sanitation facilities to > 7, 500 pupils in LIAs (WSUP, 2015c).

Last Update:16/11/2015 12
Kumasi Ghana
Produced by: WEDC
KMA Full Report
2.4 Outputs
2.4.1 Capacity to meet service needs, demands and targets As mentioned in Section 1.5 Kumasi has an annual population growth rate of 5.5% (City Population, 2015; World Bank, 2008). KMA’s waste management budget increased by 3% from 2013 to 2014 (KMA, 2013, 2014a). Furthermore there were 347 public toilets in Kumasi in 2010 (Maoulidi, 2010) which increased to 359 in 2015 (KMA, 2015n). It seems unlikely that KMA will be able to meet the demands of its growing population. A decrease in coverage has already been seen in certain areas, due to the rapidly increasing population i.e. the percentage of the population with access to sanitation via sewers has decreased from 8% (GSS, 2013) to 4% (Section 3.1). In reality this increase in population will increase the reliance on public toilets, which will require more frequent emptying. From interviews with VTOs (motorised emptiers) they had on average two to three customers per day, while their maximum capacity is between five to eight customers per day (KMA, 2015g). An increase in emptying frequency has already been recorded as it was found that public toilets are presently desludged once or twice a month by vacuum tanker (KMA, 2015e), compared to once every six weeks in 2010 (Maoulidi, 2010). This increases the volume of faecal sludge going to the septage treatment plant. If the capacity of the septage treatment plant is assumed to be 450m3 (Section 3.7) depending on mean volume of tankers discharging at the site (6.5m3 or 7.5 m3) the capacity of the present system will be reached by either 2017 and 2020. It is also probable that this growing population will lead to an increase in open defecation due to a lack sanitation facilities, unless more public toilet are built and bylaws are enforced on the provision of compound sanitation.
2.4.2 Monitoring and reporting access to services As stated before there is limited monitoring of programs and facilities in Kumasi. Where data is collected (such as the septage treatment plant Section 3.7) the information is held by local agencies and is not publically available. Currently the only monitoring and reporting on access to service is via the census, the most recent one being undertaken in 2010.
2.5 Expansion
2.5.1 Stimulating demand for services Software aspects are built into local programs. In the compound sanitation strategy uses marketing approaches to stimulate demand (KMA 2014b). In the national budget for sanitation, the public sector budget is predominately for capacity building (WSP, 2011).
2.5.2 Strengthening service provider roles The GoG is providing a legislature to strengthen the role of service providers and to encourage private investment in the sector. Additionally NESSAP and SESIP provide a framework and budget for strengthening service providers which is then translated locally into the DESSAP and city level programs. The current programs in Kumasi includes the Toilet in Every Compound program (WSUP, 2014c; KMA, 2014b) which strengthens the sanitation markets This also applies to the Clean Team and School Sanitation programs. WSUP are working with VTOs (motorised emptiers) building capacity and aiding them to form and strengthen their professional association (WSUP, 2014a). KMA are

Last Update:16/11/2015 13
Kumasi Ghana
Produced by: WEDC
KMA Full Report
strengthening capacity in the public toilet sector by the development of an award program for the best public toilets at sub-metro and city level (KMA, 2015e).
3 Service Outcomes Kumasi has a diverse sanitation technology landscape which includes onsite and offsite sanitation, with a well-developed collection system and the only septage treatment plant in the country.
3.1 Offsite technologies
The GSS shows that 8% of Kumasi’s population is connected to sewers (GSS, 2013) which are decentralised separate sewerage systems. Approximately 102,000 people are served by these systems (Table 3). As the population has rapidly grown and these sewer networks have not been expanded, the percentage of the current population served by these systems has decreased to 4%. Only 80% of the sewage by this population goes to sewage treatment plants that are functioning (Table 3). No data was available on the volume of sewage going to each plant, as a majority of them are gravity fed. Therefore an assessment of whether they are functioning within their design capacity could not be made. It is known that the network and connections have not increased since they were built (KMA, 2015f), but the number of users per connection could have potentially increased. No current records of the effluent quality could be obtained, as they are not currently being monitored due to a lack of capacity and budget. Four of the sewage treatment plants were visited and observations were made of their functionality (Figure 3). It was concluded that these systems were partially treating the waste, as the effluent and influent were visibly different.
Maturation pond at Asafo Sewage Treatment Plant
Photo credit: Claire Furlong
Sludge drying bed at KNUST Sewage Treatment
Photo credit: Claire Furlong Figure 3: Two sewage treatments plants visited

Last Update:16/11/2015 14
Kumasi Ghana
Produced by: WEDC
KMA Full Report
Table 3: Details of the sewage treatment plants in Kumasi
Sewage Treatment Plant
Sub Metro Served
Types of connections
Population served
Ownership and management
Technology Functioning
Asafo Subin Households, 4 schools, public toilets, Polytechnic, Golden
Tulip hotel1
50,0003 Owned by KMA
operated by Environmental
Engineering Ltd 1
Pond system1 Yes
1
Ahinsan Housing Estate
Asokwa Households
only1
6,5003 Owned by KMA operated by Environmental
Engineering Ltd1
Pond system1 Partially3
Chirapatre Housing Estate
Asokwa Households
only1
6,0003 Owned by KMA operated by Environmental
Engineering Ltd1
Pond system1 Yes
1
4BN army barracks
Subin The barracks only including living quarters.
About 2,5003
Owned and operated by the Army3
Pond system No3
Komoto Anokye teaching hospital (KATH)
Subin The hospital only including living quarters.
About 12,0003
Owned and operated by KATH3
Pond system No2
KNUST (University)
Oforikrom The older part of the campus including housing for students and staff
25,0003 Owned and operated by KNUST
Trickling filter Yes3
1 visits and interviews (KMA, 2015f, KNUST, 2015b), 2 Maoulidi, 2010, 3data supplied by KMA
3.2 Onsite technologies
There is a highly diverse onsite sanitation technology landscape in Kumasi. It should be noted that there are differences in how different institutions define specific technologies, but the following definitions were finalised after discussion with stakeholders (KMA, 2015e, k-l). The technologies are also discussed in relation to how they are related to the categories used to generate the SFD.
3.2.1 Water closet (WC) Within the context of the census a WC is used to mean a flushing (pour-flush or automatic flush) toilet with a waterseal, but no reference is made to the sanitation technology that it discharges to. In the

Last Update:16/11/2015 15
Kumasi Ghana
Produced by: WEDC
KMA Full Report
Kumasi context the waste is transported via a pipe to a tank outside of the facility, if it is not connected to a sewer (KMA, 2015e; WSUP 2015a). This tank is referred to as a septic tank in Kumasi an example can be seen in Figure 4. Most tanks have vents and it is thought that these tanks have varying number of chambers (normally >2). It was noted that the chamber numbers directly correlate to the number of lids on the tank (KMA, 2015e). This technology is used for both private (Table 4), public (Table 5) and institutional toilets (i.e. schools, Figure 9). The design of private septic tanks is left to the household or artisans who construct them. The design of public and institutional septic tanks is controlled by KMA and generally incorporates a soakaway, which is under the final chamber of the tank (Figure 4).
In terms of the SFD it is assume that all public toilet septic tanks are septic tanks with soakaways. For private septic tanks it is estimated that two thirds are septic tanks (containing chambers) with soakaways while one third are sealed tanks without soakaways. The latter is considered to be a sealed tank with no outlet in the SFD. It is estimated that a majority of these systems are emptied by VTOs and the faecal sludge is delivered to the septage treatment plant.
Photo credit: Claire Furlong
Photo credit: Claire Furlong
Figure 4: Public septic tank facility, Ayeduase Market, Oforikrom
3.2.2 Pit latrines Pit (or basic) latrines are used at an institutional (i.e. schools, Figure 9) and private level (Table 4). In Kumasi they are normally unlined pits with a well-engineered superstructure at household level, due to mainly being found in middle class households (KMA, 2015j-k). If there is high usage and emptying is required in less than two years they can be emptied by VTOs (motorised emptying) as the faecal sludge is relatively fluid (KMA, 2015j). If they require emptying beyond every two years, then they are manually emptied, using labourers to dig out the drier thicker sludge (KMA, 2015j). In terms of the SFD this technology is classified as unlined and abandoned pits. This, together with the fate of the faecal sludge generated, was agreed upon with stakeholders (Table 9).
3.2.3 Improved latrines The GSS classifies an improved latrine as one with only a vent pipe (GSS, 2015), including the Kumasi ventilated improved pit (KVIP) latrine (Figure 5). The KVIP is the only type of improved latrine installed as public or institutional toilets and it is the most common improved latrine installed in homes (due to

Last Update:16/11/2015 16
Kumasi Ghana
Produced by: WEDC
KMA Full Report
KMA programs). The designs and how it functions in private and institutional contexts differs (KMA, 2015i-l) and therefore it is considered to be two different technologies in terms of the SFD.
• At the household level a KVIP is a twin semi-lined pit system. One pit is used, while the other is resting. When the second pit becomes full the first pit is emptied. It takes over two years for the pit to fill (KMA, 2015j). Once emptying is required the material in the pit is like dry compost, this is then dug out manually and disposed of in the local environment or used in gardens (KMA, 2015j). Under the SFD this is considered to be an abandoned pit which is adequately covered in soil, as the contents are disposed of in the local environment, but deemed as being safe (Tables 8 and 9).
• KVIPs used in public and institutional toilets are sealed tanks with an air pipe. They are emptied by VTOs (motorised emptiers) and the faecal sludge is then taken to the septage treatment plant. In terms of the SFD they are classified as sealed tanks with no outlets that are emptied.
It should be noted that in Kumasi some basic pit latrines have vent pipes (KMA, 2015j), so may have been misclassified in the census
Inside a private KVIP in Asokwa
Photo credit: Claire Furlong
Outside a private KVIP in Bantama
Photo credit: Claire Furlong Figure 5: Kumasi VIP Latrines
3.2.4 Aqua privy The terms aqua privy, septic tank and bomba latrines are used interchangeably in Kumasi (Figure 6). The waste enters a sealed tank directly below the user interface via a chute or pipe which extends below the level of the effluent, which produces a seal (KMA, 2015e). They are not flushing toilets. Presently most of the chutes are missing, so no seal is present. These systems are emptied by VTOs and the sludge is taken to the septage treatment plant. This technology is only used at a public (Table 5) and institutional level in Kumasi (KMA, 2015e). In terms of the SFD these systems are considered to be sealed tanks that are emptied (Tables 8 and 9).

Last Update:16/11/2015 17
Kumasi Ghana
Produced by: WEDC
KMA Full Report
Photo credit: Claire Furlong
Photo credit: Claire Furlong
Figure 6: A public aqua privy facility, Bomoso, Oforikrom
3.2.5 Enviroloos These technologies have been installed in schools (Figure 7) and public toilets (Table 5) only. Enviroloos are dry toilets with a sealed tank and an aeration system via a fan and vent pipe designed to aid the drying of the faecal material (Figure 8, KMA, 2015e). Due to high levels of usage the material in these sealed tanks is usually fluid (KMA, 2015e). They are emptied by VTOs (motorised emptiers) and the waste is taken to the septage treatment plant (KMA, 2015e,h). For the SFD these systems are classified as sealed tanks with no outlets that are emptied.
Photo credit: Claire Furlong
Photo credit: Claire Furlong
Figure 7: Public Enviroloo facilities Angola, Oforikrom
3.2.6 Bucket latrines Buckets latrines/toilets are basically vessels that are emptied daily. These were introduced in Kumasi in the colonial period when collection was organised via the local government (Amoako & Korboe,

Last Update:16/11/2015 18
Kumasi Ghana
Produced by: WEDC
KMA Full Report
2011). This practice has been outlawed in Ghana since 2010. From the census data it would appear that this system is being used by < 1% of the population, hence this technology is not included in the SFD.
3.2.7 The Clean Team Toilets These are moulded plastic toilet units which contain a barrel, which people use inside their house or rooms, as seen in Figure 8. The used barrels are hygienically exchanged three times a week at a cost of 35 Cedes per month (Clean Team, 2015a,b). There are two types of technologies (dry and wet), but both have urine diversion and the users need to dispose of the urine (Clean Team, 2015b). In the wet system the barrels contain 5 litres of a “blue chemical” and in the dry toilet the barrel contains 2 kg of saw dust. A majority of the households served (90%) are using the wet systems (Clean Team, 2015b). The full barrels are transported via motorised tricycle or truck to the septage treatment plant, where the barrels are emptied, cleaned and prepared for reuse (Clean Team, 2015b). The waste from the wet systems goes into a twelve chamber septic tank and then into the septage treatment system (KMA, 2015c). The dry waste is composted, but currently there is no demand for the product (Clean Team, 2015b).These systems have probably gained wide acceptance as logistically it is very similar to the bucket latrine system which until recently was widely used in Kumasi. There are currently 1,008 households using this system and with an average household size of four people (Section 3.4.1) this equates to 4,032 users (Clean Team, 2015b). As the percentage of the population using this technology is < 1% it is not included in the SFD.

Last Update:16/11/2015 19
Kumasi Ghana
Produced by: WEDC
KMA Full Report
Clean Team Toilet
Photo credit: Claire Furlong
Clean Team collection service Photo credit: Claire Furlong
Figure 8: Clean Team service chain, Sawaba
3.2.8 Duraplast septic tanks This is a plastic moulded septic tank produced by Duraplast in Ghana (www.duraplastghana.com). These have been introduced as a technology option under KMA’s compound and school sanitation programs (KMA, 2014b), but currently are not commonly used in Kumasi. Therefore they are not included in the SFD.
3.2.9 Biofil Biofil is a Ghanaian technology which uses macro-organisms such as worms and insects to break down faecal waste. It can be used dry or wet and is linked to a leach field or infiltration trench (www.biofilcom.org). Again this option has been introduced under the compound and school sanitation program (KMA, 2014b) and is not commonly used in Kumasi, so it is not included in the SFD.
3.3 Usage
The usage levels for the technologies explained in the previous sections can be seen in Table 4, together with the definition of the technologies from the census. With respect to WCs it can be assumed that 4% are connected to sewerage systems (Section 3.1) therefore 36% are connected to
sealed and septic tanks (Section 3.2.1). No technologies are specified for public toilets in the census,
but this is discussed in Section 3.4.3. The data used to generate the SFD is the census data from 2010 as it is the most recent, so was deemed to reflect the current situation more accurately.

Last Update:16/11/2015 20
Kumasi Ghana
Produced by: WEDC
KMA Full Report
Table 4: Usage levels for different sanitation types in Kumasi
Type of sanitation system
KMA, 2008
(%)
Census, 2010
(%)
Definition for Census
Private WC 33
40 WC is a system flushed by water
Private pit latrine 10 11
Private improved latrine
Not included 7 A latrine which includes a vent pipe
Bucket latrine 12 <1 Pan or bucket which is removed for the disposal of waste
Public toilet 38 39 A public toilet is where members of the household use a communal or public facility
Other Not included <1 Any other technology which is not covered in the above criteria
No facilities 6 3 People are practicing open defecation
Sources of data Mazeau et al., 2014 GSS, 2013 GSS, 2015
3.4 Categories of origin
3.4.1 Households According to the census the average household size in Kumasi was four people (GSS, 2013), using the current estimated population of the city (Section 1.5) this would mean that there approximately 665,000 households in Kumasi.
3.4.2 Shared or communal toilets Since 75% of Kumasi’s population live in compound houses (multi-occupancy houses) (Amoako & Korboe, 2011), it can be assumed that a majority of the population that use private sanitation (58%, Table 4) are using a shared or communal facilities. No data is available on the number users sharing each private facility.
3.4.3 Public toilets Kumasi has a long history of using public toilets, they have been implemented since the 1930s (WSUP, 2014b). The high usage in current times (39%, GSS, 2013) is thought to be due to: their historical use, the banning of bucket latrines, the high proportion of the population that rent (53%, GSS, 2013), lack of incentives or enforcement for landlords to provide compound toilets, and the reliance on local government on the revenue generated (WSUP, 2014b).
There are 359 functioning public toilet facilities, housing 5,792 toilet cubicles in the ten sub-metros (WSUP, 2015a). This data is supported by a more recent survey which found 359 functioning public toilets in the nine current sub-metros (excluding Asawase) (KMA, 2015n). This is a slight increase from the 347 that Maoulidi reported in 2010. The breakdown of the type of technologies is given in Table 5. It can be seen that overtime there has been an increase in the number of facilities have WCs and a decrease the number of facilities using non flushing technologies. This is due to KMA phasing out the

Last Update:16/11/2015 21
Kumasi Ghana
Produced by: WEDC
KMA Full Report
use of dry technologies in public toilets (KMA, 2015i; WSUP, 2014). The data that was used to generate the SFD can also be seen in Table 5. In this estimate it is assumed that the population is spread proportionally across the sanitation technologies listed.
Table 5: The breakdown of different sanitation technologies used in public toilets
Technology Aqua Privy
(%)
WC1
(%)
Basic latrine
(%)
KVIP latrines
(%)
EnviroLoo
(%)
Unknown/
Other
(%) Study
KMA, 2008 48 34 N/A 9 8 1
Maoulidi, 2010 51 25 1 16 7 N/A
WSUP, 2015a 48 39 1 6 6 N/A
KMA, 2015n2 20 49 <1 14 3 12
Data used for SFD3
23 57 <1 16 3 N/A
1WC is defined in Section 3.2.1, 2Excludign data from Asawase, 3Scaled proportionally to include 12% of unknown
3.4.4 Institutional toilets There were 1,075 institutional toilets in Kumasi in 2008 (KMA, 2008), which include toilets that are in educational institutions, prisons etc. A majority of institutional toilets are WC (63%), followed by KVIP (17%) and ventilated latrines (10%). Further details are discussed in the sections below.
Prisons Kumasi central prison holds approximately 2,000 inmates (Omgghana.com, 2013). From the WSUP survey of public toilets it is known that there are 46 WCs, 14 aqua privies and 7 KVIPs in the prison run under a BOT agreement (WSUP, 2015a). They also have their own vacuum tankers which are emptied at the septage treatment site (KMA, 2014c, 2015m). As prisoners are counted in the census as being in Kumasi the data from these systems is incorporated into the SFD.
Military bases Kumasi is the headquarters of the Northern Command of the Ghana Armed Forces the 4th Infantry Battalion that are housed in Complex and Uaddara Barracks (Adarkwa, 2011). These are served by the 4BN sewage treatment plant (Section 3.1). People living in the barracks are included in the census therefore included in the data used to generate the SFD.
Educational Institutions Kumasi is an educational hub, the Millennium Cities Initiative reported that there was 649 public pre-primary, primary and junior high schools, two public universities, one medical school and a polytechnic in the city (Millennium Cities Initiative, 2015). There were also about 1,500 private educational institutions (Millennium Cities Initiative, 2015).
Kwame Nkrumah University of Science and Technology (KNUST) has an enrolment of 23,591 students (KNUST, 2015a) and its own sewage treatment plant, as does Komoto Anokye teaching hospital (KATH) (Section 3.1). Kumasi Polytechnic is connected to the Asafo simplified sewerage system (KMA,

Last Update:16/11/2015 22
Kumasi Ghana
Produced by: WEDC
KMA Full Report
2015f). It is thought the other tertiary institutions have WCs. These tertiary institutions are partially accounted for in the SFD due to staff and students living onsite. Students and staff living in Kumasi would be included, due to their inclusion in the census data.
As data on the number of schools in Kumasi is outdated and little was known about the sanitation situation a phone survey was commissioned (KMA, 2015o). It was found that there are 1,457 private and public schools in Kumasi (Table 6). A total of 645 schools were contacted by phone, 200 public and 445 private schools (KMA, 2015o). It was found that 84% of private schools have WCs and 6% have no facilities. Only 64% of public schools have toilets facilities, the breakdown of the technologies used can be seen in Figure 9.
Table 6: Number of public and private schools in Kumasi (KMA, 2015o)
Public Private Preschool 157 Primary 203 6701 Junior high school 186 187 Senior high school 21 33 Total 567 890 1in the public school system all primary and preschools are combined.
Figure 9:The types of sanitation systems used in public schools in 2015 (KMA, 2015o)
There is a huge school aged population in Kumasi (which is taken to be 3 to 18 years) accounting for 35% of the population (GSS, 2013). It is assumed that pupils defecate either before or after school, therefore the SFD is not adjusted to account for this flow. If this assumption is correct, but if the school excreta flow was included each pupil would be counted twice in the SFD, once at home and once at school. To include the flow of excreta from schools a better knowledge of the use of school and home sanitation facilities is required, so usage could be split between locations. It is noted that this is potentially a huge excreta flow, if the facilities are used for defecation by a high percentage of pupils.

Last Update:16/11/2015 23
Kumasi Ghana
Produced by: WEDC
KMA Full Report
Hospitals There are eight hospitals in Kumasi (Millennium Cities Initiative, 2015), the largest being Komoto Anokye teaching hospital (KATH) which has over 1,000 beds (Adarkwa, 2011) and its own sewage treatment plant (Section 3.1). The others are reliant on tank based systems such as aqua privies and septic tanks which are emptied by VTOs. The faecal sludge is then taken to the septage treatment plant. Although those seeking treatment in hospitals may come from outside the city boundary, they would represent < 1% of the current population, hence no adjustment in the SFD was made.
Restaurants and hotels The number of hotels in Kumasi is estimated to range from 30 (KMA, 2006) to over 100 (Briggs, 2014). It is thought that half of the tourists who visit Ghana visit Kumasi (KMA, 2006) and most current data for external tourist is 931,000 (World Bank, 2010). It is estimated that on average these tourists spend 3 days in Kumasi, which equates to <1% to the population annually. So no adjustment was made to the SFD. It should be noted that a majority of hotels and restaurants have septic tanks, which are emptied by VTOs
3.5 Motorised Emptying
It has been estimated that close to 90% of the residents of Kumasi have utilized the services of vacuum tankers (motorized emptying) either indirectly thorough public toilets or directly by households having their homes or compounds toilets emptied (WSUP, 2014a). Examples of motorised emptying in Kumasi can be seen in Figure 10. VTOs are registered with KMA and 42 companies and institutions have vacuum tankers (KMA 2014c, m). The vacuum tankers have a standard customer fee depending on their volume, which is set by KMA (Table 7). They are then charged a standard tipping fee at the septage treatment plant depending on tanker volume (Table 7). As there is a good system and management of the VTOs it is estimated that 95% of the waste collected is delivered to the septage treatment plant.
Table 7: Vacuum tanker criteria and fees charged (KMA, 2015c)
Criteria Volume (m3) Customer fee (Cedes) Tipping fee (Cedes)
Small <5 200 10
Medium 5-6 225 15
Large >6 250 20

Last Update:16/11/2015 24
Kumasi Ghana
Produced by: WEDC
KMA Full Report
Empting a private septic tank in Nhyiaeso
Photo credit: Claire Furlong
Empting a public septic tank in Bantama Photo credit: Claire Furlong
Figure 10: Motorised emptying in Kumasi
3.6 Manual Emptying
Manual emptying in Kumasi is very clandestine, although it is acknowledged that it exists (KMA, 2015d). As only a limited number of the population rely on basic latrines (Table 4), it is therefore possible that there are only a few manual emptiers in Kumasi. Additionally latrine owners can use vacuum tankers for emptying their systems, which as the advantage of not damaging the superstructure (this is known to occur during manual emptying) (KMA, 2015j). From discussion with KVIP users it is known that they use general labourers rather than specialised manual emptiers to empty their latrines, but the waste emptied is then either disposed of or reused in the local environment (KMA, 2015j).
3.7 Treatment, end-use and disposal
All of Kumasi’s septage should be received at Dompoase septage treatment plant (Figure 11), which was built in 2004 (Mensah, 2006; KMA, 2015l). It also receives leachate from the neighbouring landfill and industrial liquid waste (KMA, 2015c). Documentation on the design of the system shows the design capacity to be 300 m3 for sludge and 308 m3 for leachate (KMA, 2015l), although it is thought that this was increased to 450m3 for sludge in the final construction (KMA, 2015l).

Last Update:16/11/2015 25
Kumasi Ghana
Produced by: WEDC
KMA Full Report
Photo credit: Claire Furlong
Figure 11: Dompoase Septage Treatment Plant
The system comprises of six anaerobic ponds in two parallel streams of three each that connect to one facultative pond, which is followed by two maturation (aerobic) ponds. The first pond of each stream receives septage alternatively to facilitate desludging (KMA, 2015c).The system is currently short circuiting as the containment of one of the anaerobic ponds is breached. The effluent from this pond is discharging into the storm water system and then enters an adjacent stream without treatment (KMA, 2015c). The reason for this is the lack of budget for operation and management of the facility (KMA, 2015c). Desludging has only occurred once since the septage treatment was built (KMA, 2015c). The final destination of the effluent is the Ofin River (KMA, 2015c). The effluent quality from the ponds is not currently monitored due a lack of technical staff (KMA, 2015c). The effluent does not conform to local or national standards, but it was acknowledged that the waste is being partially treated and receives more treatment than septage in other cities in Ghana (KMA, 2015c).
The plant opens from 6 am to 6 pm, 7 days a week including public holidays (KMA, 2015c). The weighbridge at the site has not been functioning for two years, so there are only estimates for the amount of septage and liquid waste entering the site. From the records at the septage site it could be seen vacuum tankers made 18,609 trips in 2014 (KMA, 2014c). This equates to 51 tankers per day delivering approximately 331 m3 of septage (assuming tankers are full of septage) to Dompoase septage treatment plant, which is above the documented capacity of the plant, but below the capacity which the plant is believed to have.

Last Update:16/11/2015 26
Kumasi Ghana
Produced by: WEDC
KMA Full Report
From questioning vacuum tanker drivers when leaving the septage treatment plant over a two and a half day period, it was found that nearly all of the waste being deposited was septage (only one tanker out of 152 trucks was depositing industrial liquid waste). As the VTOs mentioned during the stakeholders meeting, they also collect liquid waste from beyond KMA’s boundary, but it was found that 80% of waste deposited is from within KMA’s boundary (KMA, 2015h). From the breakdown of the origins of the septage generated (in KMA’s boundary) it was found that 5% comes from institutional toilets, 38% from public toilets and 57% from household toilets (n=120) (KMA, 2015h). Interestingly all of the liquid waste collected from household toilets comes from flushing (wet) systems (i.e. septic tanks) and none comes from dry systems, bit approximately 40% of the faecal sludge from public toilets comes from dry systems. This suggests that a majority of the dry household toilets (used by 18% of the population) are emptied manually, which is supported by interviews with the users of KVIPs in Kumasi (KMA, 2015j). It is assumed that 9% of household dry systems are emptied manually in the SFD (Tables 8 and 9).
During two full days of monitoring, a total of 59 and 71 vacuum tankers entered each day. It was acknowledged by the vacuum tanker drivers that this was a quiet time of the year, but this is above the 2014 daily mean of 51 tankers and above the current daily mean for 2015 of 48 tankers (KMA, 2014c, 2015h,m). When the size of the tankers was assessed, using the sizing categories of 6m3, 9m3, or 11m3, just over half of the tankers were 6m3 or below, whereas 31% were classified as 9m3 and 14% as 11 m3. Using these estimations the mean size of the tanker is above 7.5 m3, higher than the official mean tanker size of 6.5 m3. This has significant impact on the potential loading of the treatment system. This is modelled in Figure 12, which uses data from the first six months of 2015. It can be seen that the maximum capacity of the system is exceeded on three days when the official mean tanker volume (6.5m3) is used (Scenario 1), but when a higher mean tanker volume is used the maximum capacity is exceeded 30 days out of 180 days (Scenario 2). When the lower septage treatment capacity is considered (300m3/day) and the official tanker volume used (6.5m3) the capacity of the septage treatment system is exceeded over half of the time (Scenario 3).

Last Update:16/11/2015 27
Kumasi Ghana
Produced by: WEDC
KMA Full Report
Figure 12: The number of vacuum tankers discharging at Dompoase Septage treatment plant over six
months in 2015, compared to the maximum number of tankers that can be accommodated under four different scenarios
It can be seen that the septage treatment plant is operating at close to, or above its current capacity. While there is no effluent monitoring and the system is short circuiting, but as some treatment occurs, it is assumed septage treatment plant was partially treating waste for the purpose of the SFD (Table 8).
It should also be noted that the Clean Team have explored the use of product derived from human excreta and found that currently there is no local market for these products (Clean Team, 2015b). Additionally the wastewater and sludge from the septage and sewage treatment plants visited (KMA, 2015c,f; KNUST, 2015b) were not being utilised by local farmers. The septage treatment plant has a plan to introduce fish to their aerobic ponds and start fish farming (KMA, 2015c), this is unofficially happening at one of the sewage treatment plants (KMA, 2015f).
3.8 Drinking water supplies in the city
The piped water supply for the city is obtained from surface water such as the Offin and Owabi Rivers (Maoulidi, 2010). There are two water intake points one at Owabi (10 km from the city) and the other at Barekese (19 km from the city) (KMA, 2006; Maoulidi, 2010). The abstracted water is treated at the Owabi and Barekese Water Treatment Plants (KMA, 2006; Maoulidi, 2010). Over two thirds of the city’s population use piped water for their main drinking water source (GSS, 2013).

Last Update:16/11/2015 28
Kumasi Ghana
Produced by: WEDC
KMA Full Report
3.8.1 Ground water pollution assumptions From the data presented in Section 1.3, a conservative estimate is that the stabilized water table is <5 meters. Less than 25% of sanitation is either <10 meters from, or uphill of ground water sources. This is due to the high usage of public toilets (Section 3.4.3), whose construction is well regulated by KMA. Furthermore few ground water sources are used for drinking water in Kumasi (Section 3.8). It is estimated that up to 1-25% of drinking water is produced from ground water, as 66% of the population gain their drinking water from a piped supply, which originates from surface water (Section 3.8). Using these data a low ground water pollution risk was generated by the SFD matrix.
4 SFD Matrix The data from Section 3 has been collated in Table 8. Assumption made were negotiated and agreed upon with stakeholders (KMA, 2015k). The data from Table 8 was then transposed into Table 9, which was used to generate the SFD found in the Executive Summary and Appendix 4. The SFD includes only technologies that are used by >1% of the population and flows that are >1% of the total. The flows at all stages of the sanitation service chain are rounded so the total at each stage is 100%.
The assumption which is not explained in Tables 8 and 9 is the use of 95% throughout for emptying rates. This is used to acknowledge that in real life nothing is 100%, as discussed and agreed by stakeholders (KMA, 2015k). This figure was also used for the delivery to treatment. As the effluent from the sewage (Section 3.1) and septage treatment plants were both deemed to be partially treated, the percentage of treatment (Table 8) was negotiated with the primary stakeholders in this process (KMA, 2015k).
Additionally the tool has the ability to take into account the flow of infiltrate from soakaways and pit latrines, but as this stream was deemed to be safely managed it has been disregarded. This was done to more accurately reflect the sanitation service chain in terms of faecal sludge movement. It was felt that the inclusion of the infiltrate would detract from this.
4.1 Levels of uncertainty
The main uncertainty in the data is the reliance on census data for technology types used to generate the SFD. This is because the city is rapidly developing and the census data was from 2010 (GSS, 2013). Little is documented on the sanitation realities in LIAs, due to these areas being poorly defined. There was a lack of primary data collected from service users and providers in these areas.

Last Update:16/11/2015 29
Kumasi Ghana
Produced by: WEDC
KMA Full Report
Table 8: Data from Section 3 used to generate the SFD
GSS data % Further breakdown
% How defined SFD % Emptied
% Going to treatment
% Treated
Notes
No facilities
3 3 Open defecation - - -
Private WC
40 Sewered 4 Decentralised foul sewer – separate sewer
- 95 50 Explained in Section 3.1
Septic tank 24 Septic Tank outlet to soakaway
95 95 50 Household septic tanks with soakways
12 Sealed tank with no outlet no overflow
95 95 50 Household septic tanks without soakaways
Private pit latrine
11 Basic latrine
5 Unlined pit with no outlet no overflow
95 60 50 3% emptied and going to treatment 2% released into the environment
6 Abandoned and covered in soil
- - - 1% abandoned safely 5% emptied by manual labourers and disposed of safely
Improved pit latrine
7 Improved pit latrine
2 Lined pit with semi permeable walls open bottom with no outlet no overflow
95 50 50 1% are emptied by vacuum trucks and taken to treatment 1% released into the environment
5 Abandoned and covered in soil
- - 1% abandoned safely 4% emptied by manual labourers and disposed of safely
Public toilets
39 Aqua privy 9 Sealed tank with no outlet no overflow
95 95 50
Septic tanks
23 Septic tank outlet to soakaway
95 95 50
Basic latrine
<1 N/A to low - - -
KVIP 6 Sealed tank with no outlet no overflow
95 95 50
Enviroloo 1 Sealed tank with no outlet no overflow
95 95 50

Last Update:16/11/2015 30
Kumasi Ghana
Produced by: WEDC
KMA Full Report
Table 9: Data used to generate the SFD
SFD category % % Emptied % Going to Treatment
% Treated Notes
Open defecation 3 - - - Decentralised foul sewer – separate sewer
4 - 95 50
Septic Tank outlet to ground
47 95 95 50 24% private 23% public
Sealed tank with no outlet no overflow
28 95 95 50 12% private septic tanks 9% public aqua privies 6% KVIP 1% Enviroloos
Lined pit with semi permeable walls open bottom with no outlet no overflow
5 95 50 50 Household basic pit latrines: 3% emptied and going to treatment 2% released into the environment
Unlined pit with no outlet no overflow
2 50 50 50 1% emptied and going to treatment 1% released into the environment
Abandoned and covered in soil
11 - - - 1% abandoned safely 5% emptied by manual labourers and disposed of safely 1% abandoned safely 4% emptied by manual labourers and disposed of safely
5 Stakeholder Engagement Permission to undertake this research was gained from the Mayor of Kumasi. On arrival an initial meeting was held with the Waste Management Department of KMA who are the primary stakeholders and collaborative partners in this project (KMA, 2015b). This meeting was attended by the Head of the Waste Management Department, their deputy, the Head of Sanitation and the Research & Development Manager (KMA, 2015b). This led to the planning of a stakeholder engagement meeting; held in the second week of the field trip (KMA, 2015d). This was arranged through KMA and the participant list and a photo of the group can be found in Appendix 3. During this meeting the concept of SFDs was explained as was the type of data required. The stakeholders then plotted the activities they and others in Kumasi were involved in, onto the sanitation service chain (Figure 13). This was then used to agree collectively on a plan to collect the data. At the end of the field work phase an exit meeting was held with two main stakeholders the Waste Management Department at KMA and WSUP (KMA, 2015k). In this meeting the research gaps were highlighted, the research findings were discussed, and the draft SFD was explained and negotiated (KMA, 2015k). This was highly valuable initiated the process of finalising the SFD.

Last Update:16/11/2015 31
Kumasi Ghana
Produced by: WEDC
KMA Full Report
Figure 13: Stakeholder involvement in the the sanitation service chain in Kumasi (KMA, 2015d)
5.1 Key informant interviews
Unstructured key informant interviews held are listed in Table 10, showing the topics covered. Most were undertaken in conjunction with unstructured observations. The value of using unstructured interviews meant that secondary data and changes in the current situation could be checked and observations triangulated. The interviews also opened up dialogue with stakeholders for further secondary data collection, such as the release of internal data and reports. An example of the value of interviews was in understanding how dry technologies are emptied, this was done through interviews with high level stakeholders (KMA, 2015b), then cross-checked with user interviews (KMA, 2015j), unstructured observations (KMA, 2015g) and informal discussions with vacuum tanker drivers (KMA, 2015h).
Stakeholder Details Kumasi Municipal Assembly Local Government KNUST University KNUST STP University sewage treatment plantJSO Septage treatment plant operators Environmental Engineers Ltd Sewage treatment plant operator Vacuum Truck Operators Trade Association JSE/GAPOWater and Sanitation for the Urban Poor NGOSUB METROS Local Government Public Health Office Local Government Clean Team Private Operator The Community UsersEnvironmental Protection Agency Government Schools UsersInstitutions UsersKATH - hospital with STP Users to technology management
Emptying Transport Treatment Reuse & DisposalContainment

Last Update:16/11/2015 32
Kumasi Ghana
Produced by: WEDC
KMA Full Report
Table 10: Details of unstructured interviews
Key informants Role Topics covered
Mr Antony Mensah
Head of Waste Management at KMA
General information on KMA, the planning and design parameters of the septage treatment plant, sanitation policy, programs etc.
Mr John Donkor
Head of Sanitation at KMA
General information on KMA, sanitation legislation, school sanitation, public toilets, technology types and definitions.
Ps Michael Morrison Nyarko
Manager of the septage treatment plant
Details on the operation and processes at the septage treatment plant and VTO
Ms Asantewa Gyamfi
Other Clean Team staff
Technical Manager of the Clean Team
Clean Team technology and business model
Mr Samwel Adjei Program Manager WSUP Current situation in Kumasi and present programs they are involved in (WSUP,, 2015b)
Mr Abu Suleyman
Plant manager for Environmental Engineering Ltd
Working of Asafo, Ahinsan and Chirapane sewage treatment plants
Clean Team customers (n=11)
Users of Clean Team technology
Household size, type of technology and what they swapped from
Vacuum truck drivers (n=3)
Emptiers Technology type normally emptied, type of customers i.e, number of trips made today, max number of trips, busy periods of the year, typical customer base etc.
Vacuum truck customers (n=3)
Users and vacuum truck customers
Number of toilets, types of technology, frequency of emptying, if they use the same company, etc.
Public toilet managers (n=11) and local public health workers (n=3)
Operators Discussion and clarification on the definition on technology types, how emptied and frequency of emptying
Dry toilet users (n=5) Users Number of toilets, number of users, when built, when emptied, how emptied etc.
5.2 Focus group discussions
Focus group discussions (FGDs) were not undertaken due to the difficulty in organising them. The major constraint was time as the researcher was only in the city for four weeks. Most user groups and associations meet once a month and at the weekend. Additional observations with unstructured interviews were undertaken.
5.3 Observation of service providers
Observations of service providers were undertaken at several points along the sanitation service chain, these are described in Table 11. The observational data was used to cross-check primary data collected through interviews and secondary data. An example of this was defining the technologies used in public toilets. Data from KMA (KMA, 2015n) and WSUP (WSUP, 2015a) were cross-checked through observations and interviews (KMA, 2015e), these data were then used to classify the technologies in the SFD (KMA, 2015k).

Last Update:16/11/2015 33
Kumasi Ghana
Produced by: WEDC
KMA Full Report
Table 11: Observation of service providers
Activity Details
Clean Team Shadowing in Sawaba
Shadowed a payment collector with staff from the Clean Team – Interviewed users and made observations of the community, which included a school
Visits to septage treatment plant in Dompoase
Visited the septage treatment plant at the landfill in Dompoase and the Clean Team facility. Combined with an interview with staff.
Visits to Asafo, Ahinsan and Chiraptre decentralised sewage treatment plant
Visited sewage treatment plant at the landfill in Dompoase. Observed the treatment plants. Combined with interviews on site and visit to the management kiosk at Asafo
Public toilet visits in Oforikorm sub-metro
Visited 10 public toilets in Oforikorm with local public health officers. Observation of technology types, cost and states of facilities. Combined with interviews with sub-metro public health workers and public toilet managers.
Shadowing of vacuum tankers drivers.
Shadowing of three vacuum trucks from Dompoase to their customer, observations made on the types of systems emptied and how they were emptied. Combined with interviews with vacuum truck and interviews with customers.
Visits to users in Atonsu Old Town and S-line
Observations on the technology type and state the facilities, combined with interview with users.
Vacuum tanker survey at Dompoase septage treatment plant
Over two and a half days every vacuum truck driver a survey was undertaken to find out the following information: company, sub-metro where they collected the waste, volume of tanker, type of effluent, type of location they collected the waste at, whether the toilets were wet or dry and the type of sanitation technology.
The main advantage of collecting primary data was in getting a better understanding of how technology terms are used in Kumasi and what is meant by different stakeholder by the terms used. This enabled the systems to be classified more accurately in the SFD, it is doubtful that this would have occurred without interviews with public health workers (KMA, 2015e), direct observations (KMA, 2015e, j) and on-going dialogue with staff at KMA (KMA, 2015i-k).
6 Prospects for uptake and use of this study Kumasi Metropolitan Assembly’s Waste Management Department believe this is a useful document and process which will be used in the following ways:
• Provides a current baseline of sanitation situation in Kumasi • Inform specific and city wide strategic sanitation intervention planning • Inspiring academic research at undergraduate and post-graduate levels • Source of information for research institutions and consultants • Aid with the development of lectures
Last Update:16/11/2015 34
Kumasi Ghana
Produced by: WEDC
KMA Full Report
Acknowledgements
This report was compiled as a part of the SFD Promotion Initiative project funded by the Bill and Melinda Gates Foundation. The field-research was undertaken in collaboration with the Waste Management Department of Kumasi Metropolitan Assembly. We would like to thank all the people that contributed to this project especially those who were interviewed (Table 10) or helped and partook in activities (Table 11).
References Adarkwa K. K. 2011. The role of Kumasi in National Development – Kumasi as a Central Place. Chapter 2, Future of the Tree: Towards growth and development of Kumasi. University Printing Press, KNUST, Ghana.
Amoako C. & Korboe D. 2011. Historical development, population growth and present structure in Kumasi, Chapter 3, Future of the Tree: Towards growth and development of Kumasi. University Printing Press, KNUST, Ghana.
Briggs P. 2013. Ghana: the Bradt travel Guide. 6th Edition. Published by Bradt Travel Guides Ltd, UK
City Population. 2015. http://www.citypopulation.de/Ghana-Cities.html?cityid=2327 Last accessed 5/8/15
CEDAR (1999) Inception report: Peri-urban natural resources management at the watershed level, Kumasi. http://www.gg.rhul.ac.uk/kumasi/Inception/inception.html
Clean Team. 2015a. Personal communication. 10/6/15
Clean Team. 2015b. Interviews and shadowing. 6/8/15
GSS. 2013. 2010 Population and housing census. Regional analytical report. Ashanti Region
GSS. 2015. Personal communication. 7/8/15
KMA. 2006. http://www.kma.ghanadistricts.gov.gh/?arrow=atd&_=6&sa=5492 last accessed 08/05/15
KMA. 2008. District Environmental Sanitation Strategic Action Plan (DESSAP)
KMA. 2013. The composite budget of the Kumasi Metropolitan Assembly for the 2013 fiscal year.
KMA. 2014a. The composite budget of the Kumasi Metropolitan Assembly for the 2013 fiscal year.
KMA. 2014b. Toilets in every compound: Final Strategy
KMA. 2014c. Yearly and monthly records from Dompoase septage treatment plant. Unpublished
KMA. 2015a. Medium Term Development Plan 2014-2017
KMA. 2015b. Initial meeting with Waste Management Department. 4/8/15
KMA 2015c. Interview with Ps Michael Morrison Nyarko and visit to Dompoase septage treatment plant. 10/8/15
KMA. 2015d. Stakeholders meeting organised by the Waste Management Department. 12/8/2015
KMA. 2015e. Public toilet visits and interviews. 18/8/15
KMA. 2015f. Visit to sewage treatment plants and interview with Mr Abu Suleyman (Environmental Engineering Ltd) 19/8/15

Last Update:16/11/2015 35
Kumasi Ghana
Produced by: WEDC
KMA Full Report
KMA. 2015g. VTO shadowing, interviews with VTO drivers and customers with Mr Charles Mensah.
20/8/15 & 25/8/15
KMA. 2015h. VTO survey at Dompoase. 21-22/8/15 & 24/8/15
KMA. 2015i. Interview with Mr Donker. 24/8/15
KMA. 2015j. Visits and interviews with dry sanitation users with Mr Charles Mensah. 24/8/15
KMA. 2015k. Exit meeting with KMA Waste Management Department and WSUP. 28/8/15
KMA. 2015l. Interview with Mr Antony Mensah. 28/8/15
KMA. 2015m. Monthly and daily records from Dompoase septage treatment plant. Unpublished
KMA. 2015n. Data from a survey on public toilets. Unpublished
KMA. 2015o. Phone survey of sanitation in schools commissioned for this study. Unpublished
KNUST. 2015a. https://www.google.com.gh/search?q=KNUST&sourceid=ie7&rls=com.microsoft:en-GB:IE-Address&ie=&oe=&gws_rd=cr&ei=-efSVZr5EsGBU-nehcAC#q=KNUST+enrollment last accessed 18/8/15
KNUST. 2015b. Visit to sewage treatment plant. 27/8/15
Maoulidi, M. 2010. A water and sanitation needs assessment for Kumasi, Ghana. MCI Social Sector Working Paper Series No16/2010. Earth Institute. Columbia University, USA.
Mensah A (2006) Faecal sludge management in Kumasi: perspective as seen by the Municipality. First International Symposium / Workshop on Faecal Sludge Management (FSM) Policy. Dakar, Senegal, 9-12 May 2006.
Mazeau. A. P., Wellington N., Drabble S., Asante F., Awantugo D. 2014. Bringing toilets back to Kumasi’s compound houses: Landlord and tenant behaviors and Motivators. 37th WEDC International Conference, Hanoi, Vietnam.
Millennium Cities Initiative. 2015. http://mci.ei.columbia.edu/millennium-cities/kumasi-ghana/kumasi-maps-and-population-data/ last accessed 5/8/2015
MLGRD. 2010a. National Environmental Sanitation Policy (ESP): Revised 2010.
MLGRD. 2010b. National environmental sanitation strategy and action plan (NESSAP): Materials in transition.
MLGRD. 2011. Strategic environmental sanitation investment plan (SESIP): Achieving minimum service options by 2015.
MoFEP.2011. National Policy on Public and Private Partnership.
NDPC. 2005. Growth and poverty reduction strategy (GPRS II) 2006-2009.
NDPC. 2010. Medium-term national development policy framework: Ghana shared growth and development agenda (GSGDA), 2010-2013.
NDPC. 2014. The implementation of the Ghana shared growth and development Agenda (GSGDA), 2010-2013: Annual progress report 2013.
Omgghana.2013. http://omgghana.com/prisoners-sleep-in-turns-at-kumasi-central-prison/ last accessed 25/9/15

Last Update:16/11/2015 36
Kumasi Ghana
Produced by: WEDC
KMA Full Report
Owusu-Ansah, J. K. 2015. The influences of land use and sanitation infrastructure on flooding in Kumasi Ghana. GeoJournal. DOI: 10.1007/s10708-015-9636-4
SNV. 2015. http://www.snvworld.org/en/countries/ghana/news/eu6-million-wash-fund-for-ghana last accessed 23/9/15
UNDP/World Bank. 1990. Kumasi sanitation project: Technical review: Final report.
WaterAid. 2012. Case study: Financing of water and hygiene sector in Ghana.
WorldBank. 2008. Africa Region Working Paper Series Number 10. Development of the cities of Ghana. Challenges, Priorities and Tools.
WorldBank 2010. http://data.worldbank.org/indicator/ST.INT.ARVL last accessed 25/9/15
WSMP. 2009. Briefing note: The data puzzle in Ghana’s water and sanitation sector.
WSMP. 2010. Directory of Ghana’s water and sanitation sector.
WSMP. 2011. http://www.wsmp.org/ last accessed 2/10/15
WSP. 2011 Water supply and sanitation in Ghana. Turning finance into service for 2015 and beyond. Report
WSUP. 2014a. TOR – Supporting Improved Service Delivery by Vacuum Tanker Operators in Kumasi, Ghana. Unpublished
WSUP. 2014b. Assessing PPP options to improve the provision of public toilets in Kumasi. Baseline market study. Unpublished
WSUP. 2014c. Toilets in every compound: Final strategy WSUP. 2015a. Unpublished data from a survey of public toilets in Kumasi. Unpublished
WSUP. 2015b. Interview and visit to WSP office. 7/8/15
WSUP. 2015c. Personal communication on school sanitation programme. 25/9/15

Last Update:16/11/2015 37
Kumasi Ghana
Produced by: WEDC
KMA Full Report
Appendix 1: Stakeholder identification
Nam
e of
org
anis
atio
nN
ame
of c
onta
ct p
erso
nPo
siti
onSo
urce
of
cont
act
Infl
uenc
e (h
igh/
med
ium
/low
)In
tere
st
(hig
h/m
ediu
m/l
ow)
Bant
ama
Sub
Met
roM
r Erie
Abo
gogl
e M
ansa
hM
r Ant
hony
Men
sah
Hig
h M
ediu
m
Clea
n Te
amM
s Yan
kiek
e St
omp
Inte
rnAs
ante
wa
Gya
mfi
Low
Med
ium
Cl
ean
Team
M
s Asa
ntew
a G
yam
fiH
ead
of C
lean
Tea
m
KN
UST
Low
Hig
h Cl
ean
Team
M
r Kof
i As
ante
wa
Gya
mfi
Low
Med
ium
Cl
ean
Team
Ab
igai
l Aru
naM
r Ant
hony
Men
sah
Med
ium
H
igh
Clea
n Te
am
Ian
Park
sM
r Ant
hony
Men
sah
Med
ium
H
igh
Envi
rom
enta
l Eng
inee
ring
Ltd
Mr A
bu S
uley
man
Sew
age
Trea
tmen
t Pla
nt O
pera
tor
Mr A
ntho
ny M
ensa
hM
ediu
m
Med
ium
En
viro
men
tal E
ngin
eerin
g Lt
d M
r Kof
i Tho
mps
on
Sew
age
Trea
tmen
t Pla
nt O
pera
tor
Mr A
ntho
ny M
ensa
hM
ediu
m
Med
ium
J.
Stan
ley
Osu
su &
Co
Mr A
nton
y Ad
ukpo
Land
fill O
pera
tor
Mr A
ntho
ny M
ensa
hM
ediu
m
Low
KMA
Mr C
harle
s Men
sah
Com
mun
ity O
ffic
er
Mr A
ntho
ny M
ensa
hH
igh
Med
ium
KM
A EH
OH
.O. A
mab
nwe
Mr A
ntho
ny M
ensa
hH
igh
Med
ium
KM
A EH
OE.
D. S
anch
eM
r Ant
hony
Men
sah
Hig
h M
ediu
m
KNU
STD
r Kw
aben
a B
Nya
rko
KNU
STSa
m W
EDC
Med
ium
M
ediu
m
KNU
STM
r Ofo
shue
ne Jo
shu
RA K
NU
ST
Dr K
wab
ena
B N
yark
oLo
wM
ediu
m
KNU
STD
r S O
duro
Kw
arte
ng
Lect
urer
/Res
earc
her W
aste
wat
erM
r Ant
hony
Men
sah
Med
ium
M
ediu
m
Kum
asi S
anita
tion
Asso
icai
ton
Kofi
budn
Mr A
ntho
ny M
ensa
hH
igh
Med
ium
Ku
mas
i San
itatio
n Aw
aren
ess A
ssoi
catio
n M
rs R
osem
ary
Nin
kaab
sN
/AM
r Ant
hony
Men
sah
Med
ium
H
igh
Kum
asi S
anita
tion
Awar
enes
s Ass
oica
tion
Mr O
rwsu
Tak
yiN
/AM
r Ant
hony
Men
sah
Med
ium
H
igh
May
or o
f KM
AH
on. K
ojo
Bons
uM
ayor
of K
umas
i M
r Ant
hony
Men
sah
Hig
h U
nkno
wn
Ofo
rikor
m su
b-m
etro
M
rs U
nis C
runc
hie
Hea
d of
Tow
n Co
unci
l Ofo
rikro
mM
r Joh
n D
onko
rH
igh
Med
ium
O
forik
orm
sub-
met
ro
Did
not
get
thei
r nam
e Pu
blic
Hea
lth O
ffic
ers
Mr J
ohn
Don
kor
Hig
h M
ediu
m
Ofo
rikor
m su
b-m
etro
D
id n
ot g
et th
eir n
ame
Publ
ic H
ealth
Off
icer
sM
r Joh
n D
onko
rH
igh
Med
ium
O
forik
orm
sub-
met
ro
Did
not
get
thei
r nam
e Sa
nita
tion
Off
icer
M
r Joh
n D
onko
rH
igh
Med
ium
Su
bin
Sub
Met
roM
r Opo
len
Abdi
nM
r Ant
hony
Men
sah
Hig
h M
ediu
m
Vacu
um T
ruck
Ope
rato
rs A
ssoi
catio
n M
r Mic
hael
Asa
moa
hVT
OA
and
owne
r OP'
SKI
Mr A
ntho
ny M
ensa
hH
igh
Med
ium
Va
cuum
Tru
ck O
pera
tors
Ass
oica
tion
Mr K
ojo
Asar
neVT
OA
and
owne
r of E
urop
al S
anM
r Ant
hony
Men
sah
Hig
h M
ediu
m
Vacu
um T
ruck
Ope
rato
rs A
ssoi
catio
n M
r Akw
asi A
fran
e VT
OA
and
owne
r of A
fran
e Sa
nita
tion
Mr A
ntho
ny M
ensa
hH
igh
Med
ium
W
MD
/KM
AM
r Ant
hony
Men
sah
Hea
d of
WM
D in
KM
ARe
becc
a W
EDC
Hig
h H
igh
WM
D/K
MA
Augu
stin
aH
ead
of R
esea
rch
Med
Med
ium
W
MD
/KM
APr
ospe
r Kot
oko
Dep
ty D
irect
or
Med
Med
ium
W
MD
/KM
AO
ssei
Asib
bey
Uns
ure
Mr A
ntho
ny M
ensa
hM
ediu
m
Med
ium
W
MD
/KM
AM
s Dor
is Ey
amfi
Mr A
ntho
ny M
ensa
hM
ediu
m
Med
ium
W
MD
/KM
AM
r Joe
seph
Cha
rles M
ensa
lM
r Ant
hony
Men
sah
Med
ium
M
ediu
m
WM
D/K
MA
Mr J
ohn
Don
kor
Hea
d of
San
itatio
n H
igh
Hig
h W
MD
/KM
A Ps
Mic
hael
Mor
rison
Nya
rko
Land
fill M
ange
rM
r Ant
hony
Men
sah
Hig
h H
igh
WSU
PM
r Geo
rges
Mik
hael
Re
becc
a W
EDC
Hig
h M
ediu
m
WSU
P- K
umas
i M
r Ebe
nize
r Ast
ugah
Mr G
eorg
es M
ikha
el
Med
ium
H
igh
WSU
P- K
umas
i M
r Fra
nk R
omeo
Ket
tey
Mr G
eorg
es M
ikha
el
Med
ium
H
igh
WSU
P- K
umas
i M
r Sam
wel
Adj
eiPr
ojec
t Fac
ilita
tor -
Pub
lic T
oile
ts
Mr G
eorg
es M
ikha
el
Med
ium
H
igh
Zoom
lian
VTO
+ p
ublic
toile
tsAr
thur
Rea
gah
Zoom
M
r Ant
hony
Men
sah
Hig
h M
ediu
m
Zoom
lian
VTO
+ p
ublic
toile
tsKo
fi Se
lgye
rZo
om
Mr A
ntho
ny M
ensa
hH
igh
Med
ium

Last Update:16/11/2015 38
Kumasi Ghana
Produced by: WEDC
KMA Full Report
Appendix 2: Tracking of engagement Co
mm
ent:
List
sta
keho
lder
that
was
dire
ctly
eng
aged
in th
e st
udy.
Fo
r des
k-ba
sed
asse
ssm
ent t
hrou
gh E
mai
l or P
hone
. For
fiel
d-ba
sed
asse
ssm
et th
roug
h th
e co
rresp
ondi
ng d
ata
colle
ctio
n m
etho
dDa
te o
f Eng
agem
ent
Purp
ose
of E
ngag
emen
tM
axim
um 1
00 w
ord
sum
mar
y of
out
com
es
Mr G
eorg
es M
ikha
el (G
M)
04/0
5/20
15In
trodu
ctio
n of
Cla
ire
Intro
duct
ory
emai
lM
r Ant
hony
Men
sah
(AM
)04
/05/
2015
Intro
duct
ion
of C
laire
In
trodu
ctor
y em
ail
GM a
nd A
M13
/03/
2015
Intro
to m
etho
dCl
aire
sen
t int
rodu
ctio
n em
ail a
bout
met
hod
and
data
col
lect
ion,
ask
ing
for a
dat
e an
d tim
e fo
r an
initi
al p
hone
cal
l An
thon
y M
ensa
h 13
/05/
2015
Repl
ied
to e
mai
lSe
t a d
ate
for f
irst c
all f
irst w
eek
in Ju
ne
Anth
ony
Men
sah
03/0
6/20
15Fo
r int
rodu
ctor
y ca
llDa
te s
et 5
th Ju
ne
Anth
ony
Men
sah
05/0
6/20
15In
trodu
ctor
y ca
llIn
trodu
ced
proj
ect a
nd ty
pes
of a
ctiv
ates
, ask
ed a
bout
gai
ning
per
mis
sion
and
by-
in
sugg
este
d se
ndin
g a
lette
r to
May
or o
f Kum
asi
Sam
WED
C05
/06/
2015
Mee
ting
with
Sam
WED
C ab
out
KNUS
TM
et S
am to
dis
cuss
his
trip
last
wee
k to
Kum
asi a
nd to
ask
for i
ntro
duct
ions
to K
NUST
, Cl
ean
Team
and
WSU
P in
Kum
asi
Anth
ony
Men
sah
09/0
6/20
15Em
ail c
onfir
m le
tter d
etai
lsCo
nfirm
ed w
hat n
eede
d to
be
in th
e le
tter
Dr N
yark
o KN
UST
09/0
6/20
15Em
aile
d in
trodu
ctio
n ab
out
proj
ect
Repl
ied
on 1
0/6/
15 w
ith in
trodu
ctio
n to
Cle
an T
eam
and
say
ing
I cou
ld s
tay
at K
NUST
w
hen
I do
my
field
wor
k
Ms
Gyam
fi10
/06/
2015
Emai
led
to in
trodu
ctio
n an
d as
ked
abou
t fie
ld w
ork
inte
rvie
w Re
plie
d on
12/
6/15
say
ing
happ
y to
be
inte
rvie
wed
and
hap
py fo
r me
to s
hado
w a
te
am m
embe
r, se
nt in
fo o
n us
er n
umbe
rsHo
n. K
ojo
Bons
u11
/06/
2015
Gain
per
mis
sion
for f
ield
wor
kEm
ail s
ent t
o KM
A w
ith le
tter a
nd c
allin
g ca
rd fo
r the
May
or
Dr N
yark
o KN
UST
10/0
7/20
15Ac
com
mod
atio
n KN
UST
Emai
led
abou
t Acc
omm
odat
ion
Anth
ony
Men
sah
16/0
7/20
15Vi
sa le
tter
Have
vis
a le
tter f
rom
the
May
orAn
thon
y M
enah
24/0
7/20
15Dr
aft o
utlin
e of
wor
kSe
nt ro
ught
out
line
of w
ork
Geor
ges
Mik
hael
24/0
7/20
15Re
becc
a em
ails
abo
ut K
uam
asi
Geor
ges
Mik
hael
24/0
7/20
15In
trodu
cion
to W
SUP
Kum
asi
Intro
duct
ion
to E
bene
zer A
stug
ah, F
rank
Rom
eo, S
amw
el A
djei
Eben
zer e
t al
28/0
7/20
15In
trodu
ctio
n of
pro
ject
Se
nt th
e on
e pa
ger a
nd a
sk fo
r pho
ne n
umbe
r so
coul
d ha
ve a
mee
ting
Anth
ony
Mes
ah M
eetin
g at
KM
A04
/08/
2015
Intro
duct
ion
of p
roje
ct
Two
hour
mee
ting
at K
MA
to d
iscu
ss p
roje
ct a
nd h
ow th
ey c
an h
elp
Ms
Asan
tew
a Gy
amfi
06/0
8/20
15Sh
adow
ing
clea
n te
am
Half
day
shad
owin
g m
oney
col
lect
ors
in S
awab
a - I
nter
view
s us
ers
and
clea
n te
am
Mr S
amw
el A
djei
07/0
8/20
15In
trodu
ctor
y vi
sit
Disc
usse
d pu
blic
toile
t, co
mpo
und
toile
t and
sch
ool s
anita
tion
prog
ram
s se
ndin
g da
ta
Ps M
icha
el M
orris
on N
yark
o10
/08/
2015
Visi
t dom
poas
e ST
PKI
I - S
TP, v
isit
and
prov
ided
me
with
dat
a fo
r tru
ck m
ovem
ents
St
akeh
olde
r mee
ting
12/0
8/20
15St
akeh
olde
rs m
eetin
g Di
scus
ssed
sco
pe o
f pro
ject
, act
iviti
es, i
dent
ified
peo
ple
to h
elp
etc…
Ms
Unis
Cru
nchi
(Lea
der S
ub-M
etro
)18
/08/
2015
Visi
t pub
lic to
ilets
in O
forik
rom
Visi
ted
10 p
ublic
toile
ts w
ith s
ub m
etro
PHO
- ob
serv
atio
ns a
nd in
terv
iew
sM
r Abu
Sul
eym
an19
/08/
2015
Visi
ted
STP
Visi
ted
2 ST
P an
d KI
I with
Mr A
bu S
uley
man
John
Don
kor
20/0
8/20
15Sh
adow
ing
VTO
can
celle
d In
form
al in
terv
iew
and
fact
che
ckin
g Ps
Mic
hael
Mor
rison
Nya
rko
20/0
8/20
15Vi
sit d
ompo
ase
STP
To o
rgan
ise
shad
owin
g VT
O a
nd tr
uck
coun
ting
Ps M
icha
el M
orris
on N
yark
o21
/08/
2015
Truc
k co
untin
g st
arte
d -
John
Don
kor +
Ant
hony
Men
sah
22/0
8/20
15Pl
anni
ng w
ork
and
final
mee
ting
Visi
t KM
A to
dis
cuss
and
pla
n fin
al w
ork
Char
les
Men
sah
23/0
8/20
15VT
O s
hado
win
g Sh
adow
ed tw
o VT
Os
Char
les
Men
sah
24/0
8/20
15In
terv
iew
hou
seho
lds
Anth
ony
Men
sah
09/0
9/20
15Ne
gotia
ting
draf
ts
Nego
tiatin
g dr
afts
and
fact
che
ckin
g un
til th
e re
port
was
com
plet
ed

Last Update:16/11/2015 39
Kumasi Ghana
Produced by: WEDC
KMA Full Report
Appendix 3: Stakeholders meeting
Photo of participant list (Photo credit: Claire Furlong)
Photo of stakeholder meeting participants (Photo credit: Claire Furlong)

Last Update:16/11/2015 40
Kumasi Ghana
Produced by: WEDC
KMA Full Report
Photo of the mapping of stakeholders on the sanitation service chain (Photo credit: Claire Furlong)
Photo of the work plan produced during the stakeholder workshop (Photo credit: Claire Furlong)

Last Update:16/11/2015 41
Kumasi Ghana
Produced by: WEDC
KMA Full Report
Appendix 4: Final SFD for Kumasi