sgs 2020 full year results presentation
TRANSCRIPT

2020 full year results presentation
SGS GROUP RESULTS

Disclaimer
Certain matters discussed in this presentation may constitute forward-looking statements that are neither historical facts nor guarantees of future performance. Because these statements involve risks and uncertainties that are beyond control or estimation of SGS, there are important factors that could cause actual results to differ materially from those expressed or implied by these forward-looking statements. These statements speak only as of the date of this document. Except as required by any applicable law or regulation, SGS expressly disclaims any obligation to release publicly any updates or revisions to any forward-looking statements contained herein to reflect any change in SGS Group’s expectations with regard thereto or any change in events or conditions on which any such statements are based.
2 © SGS SA 2021 all rights reserved.Full year results presentation 28 January 2021
A STRONG OPERATIONAL PERFORMANCE IN 2020
HIGHLIGHTS FINANCIAL REVIEW BUSINESS REVIEW OUTLOOK Q&A APPENDIX
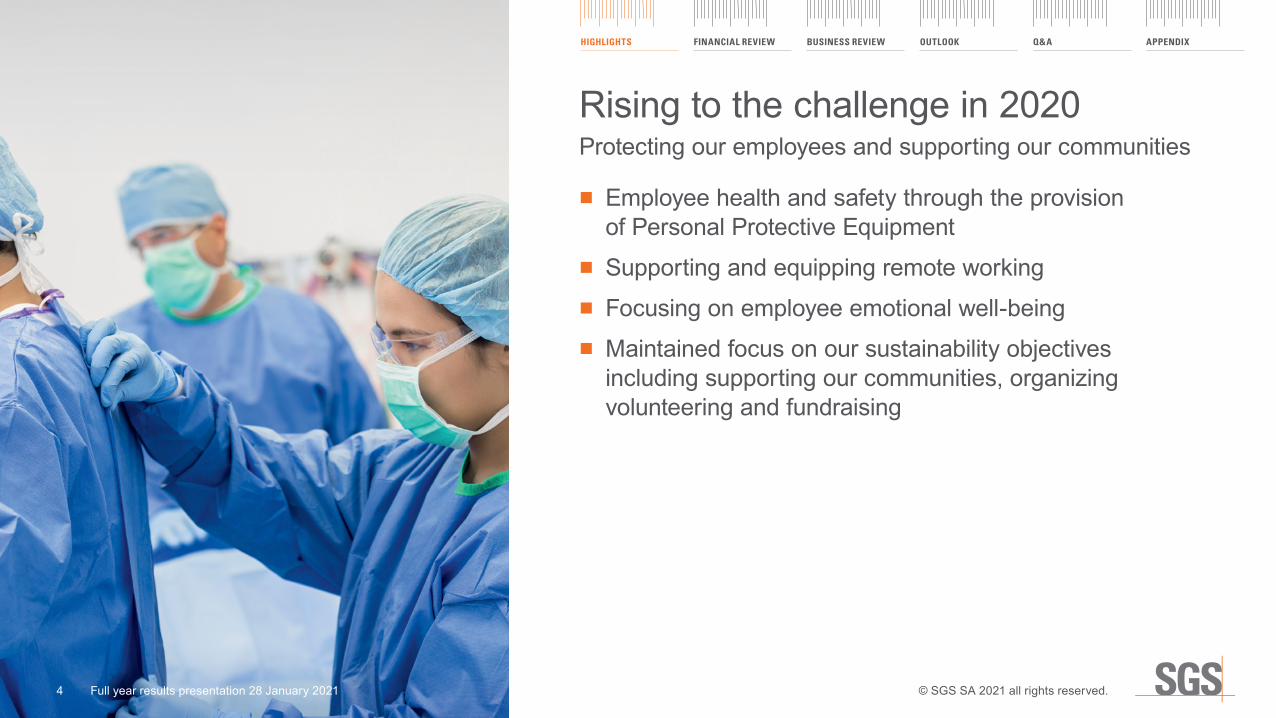
■ Employee health and safety through the provision of Personal Protective Equipment
■ Supporting and equipping remote working ■ Focusing on employee emotional well-being ■ Maintained focus on our sustainability objectives including supporting our communities, organizing volunteering and fundraising
Rising to the challenge in 2020Protecting our employees and supporting our communities
HIGHLIGHTS FINANCIAL REVIEW BUSINESS REVIEW OUTLOOK Q&A APPENDIX
© SGS SA 2021 all rights reserved.Full year results presentation 28 January 20214

Resilient adjusted operating income performance2020 highlights
FREE CASH FLOW*
CHF 758 MIO 2020 | 758
2019 | 673
12.6% (8.7pp)3
ADJUSTED OPERATING INCOME*
CHF 900 MIO 2020 | 900
20191 | 978
(8.0%)1
PROFIT FOR THE PERIOD
CHF 505 MIO2020 | 505
2019 | 702
(28.1%)
RETURN ON INVESTED CAPITAL2,*
16.5%2020 | 16.5
2019 | 25.2
REVENUE
CHF 5.6 BN 2020 | 5.6
20191| 6.1
(8.8%)1 (6.5%) ORGANIC*
PROPOSED DIVIDEND
CHF 80 2020 | 80
2019 | 80
1. Constant currency (CCY)* – 2. 2020 ROIC at 20.9% when adjusted from SYNLAB Analytics & Services (A&S) acquisition completed on 31 December 2020 – 3. Percentage points* Alternative Performance Measures (APM), refer to the "2020 Full Year APM document"
20.9
5 Full year results presentation 28 January 2021
HIGHLIGHTS FINANCIAL REVIEW BUSINESS REVIEW OUTLOOK Q&A APPENDIX
© SGS SA 2021 all rights reserved.
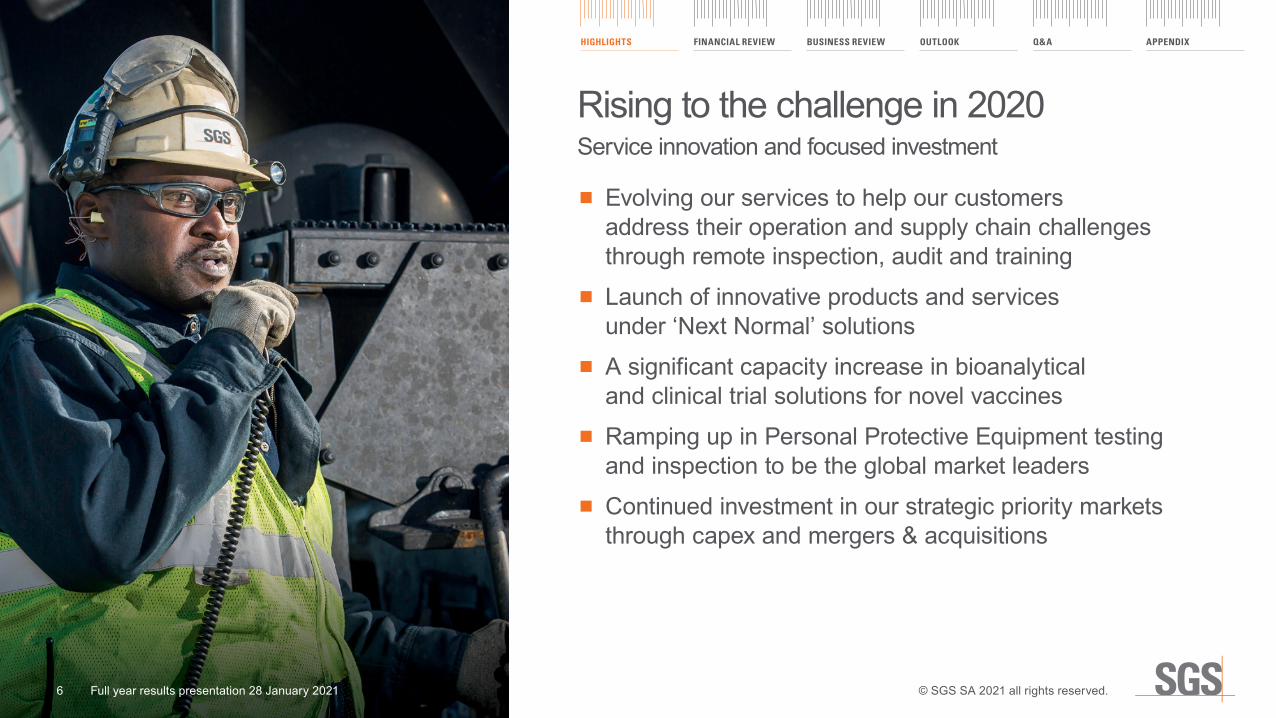
■ Evolving our services to help our customers address their operation and supply chain challenges through remote inspection, audit and training
■ Launch of innovative products and services under ‘Next Normal’ solutions
■ A significant capacity increase in bioanalytical and clinical trial solutions for novel vaccines
■ Ramping up in Personal Protective Equipment testing and inspection to be the global market leaders
■ Continued investment in our strategic priority markets through capex and mergers & acquisitions
Rising to the challenge in 2020Service innovation and focused investment
HIGHLIGHTS FINANCIAL REVIEW BUSINESS REVIEW OUTLOOK Q&A APPENDIX
© SGS SA 2021 all rights reserved.6 Full year results presentation 28 January 2021
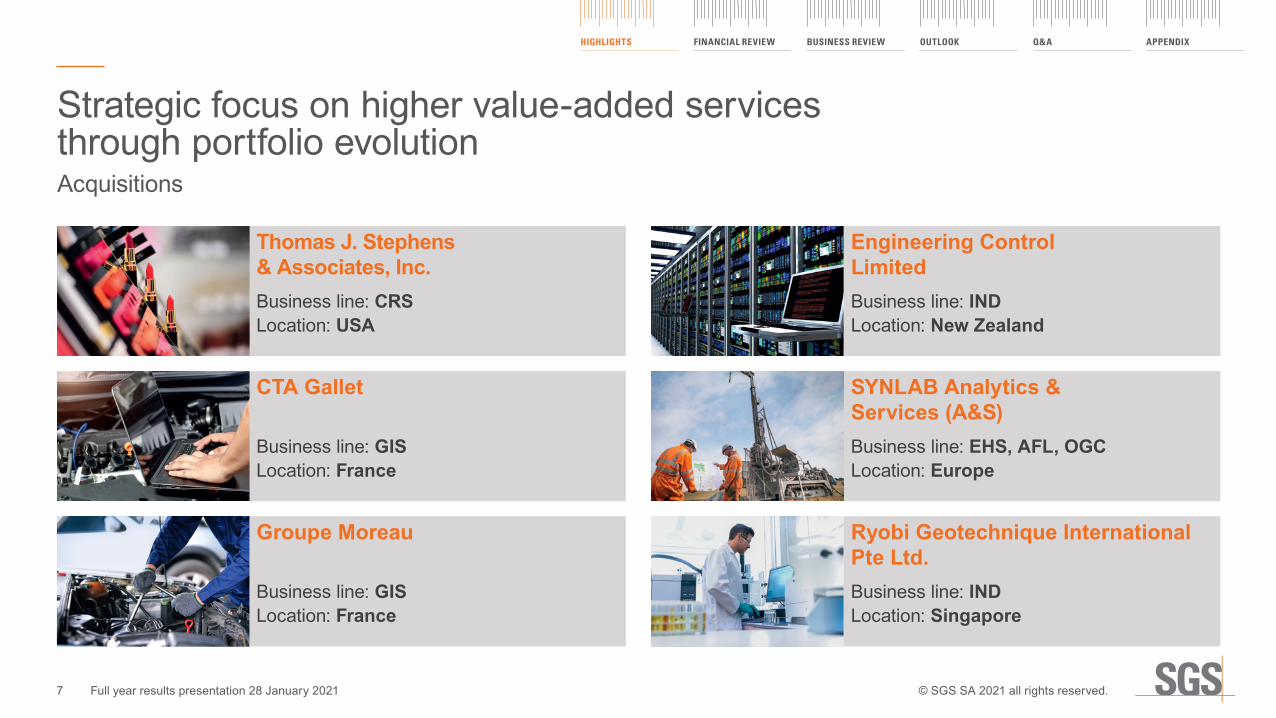
Strategic focus on higher value-added services through portfolio evolutionAcquisitions
Thomas J. Stephens & Associates, Inc.Business line: CRSLocation: USA
Engineering Control LimitedBusiness line: INDLocation: New Zealand
CTA Gallet
Business line: GISLocation: France
SYNLAB Analytics & Services (A&S)Business line: EHS, AFL, OGCLocation: Europe
Groupe Moreau
Business line: GISLocation: France
Ryobi Geotechnique International Pte Ltd. Business line: INDLocation: Singapore
7 Full year results presentation 28 January 2021
HIGHLIGHTS FINANCIAL REVIEW BUSINESS REVIEW OUTLOOK Q&A APPENDIX
© SGS SA 2021 all rights reserved.

Strategic focus on higher value-added services through portfolio evolutionSubsequent acquisitions and announcements
Analytical & Development Services
Business line: AFLLocation: United Kingdom
Pest management and fumigation operationsBusiness line: AFLLocation: The Netherlands and Belgium
The lab facilities of International Service Laboratory from Novartis(Announcement of acquisition)Business line: AFLLocation: Ireland
Disposals
8 Full year results presentation 28 January 2021
HIGHLIGHTS FINANCIAL REVIEW BUSINESS REVIEW OUTLOOK Q&A APPENDIX
© SGS SA 2021 all rights reserved.

OUR PORTFOLIO DEMONSTRATED RESILIENCE IN 2020
HIGHLIGHTS FINANCIAL REVIEW BUSINESS REVIEW OUTLOOK Q&A APPENDIX
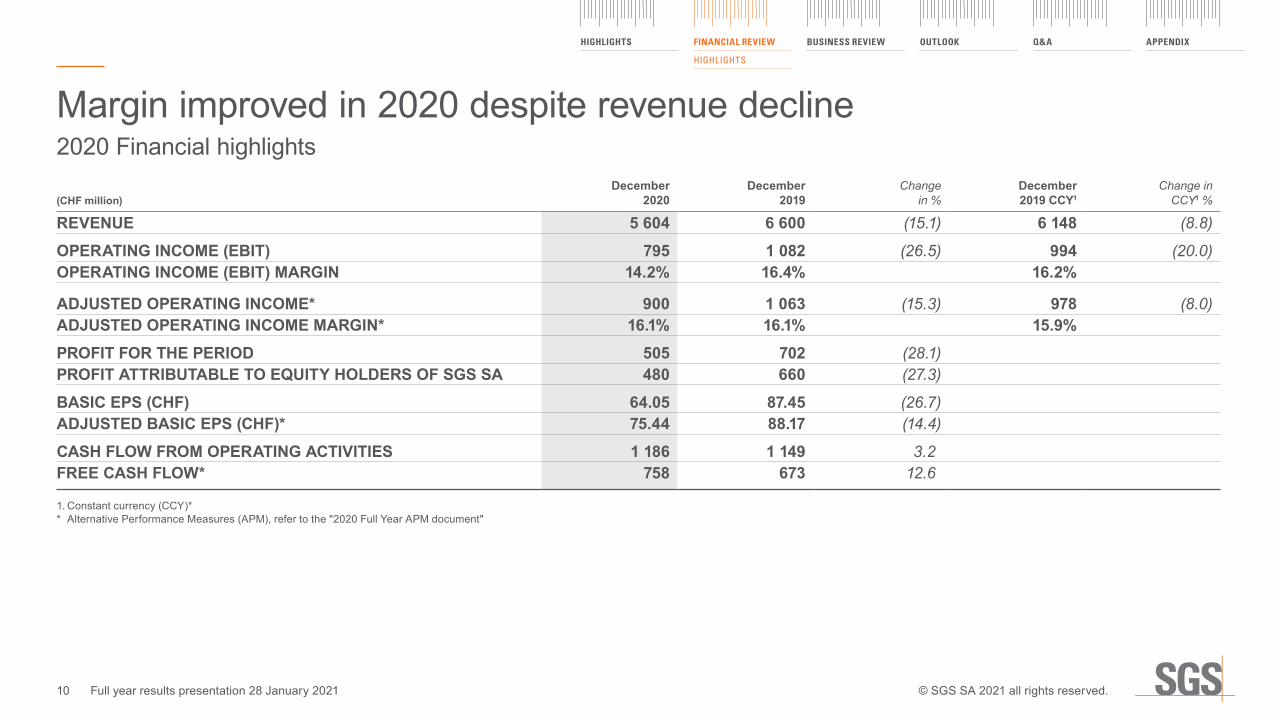
Margin improved in 2020 despite revenue decline2020 Financial highlights
(CHF million)December
2020December
2019Change
in %December 2019 CCY1
Change in CCY1 %
REVENUE 5 604 6 600 (15.1) 6 148 (8.8)
OPERATING INCOME (EBIT) 795 1 082 (26.5) 994 (20.0)OPERATING INCOME (EBIT) MARGIN 14.2% 16.4% 16.2%
ADJUSTED OPERATING INCOME* 900 1 063 (15.3) 978 (8.0)ADJUSTED OPERATING INCOME MARGIN* 16.1% 16.1% 15.9%PROFIT FOR THE PERIOD 505 702 (28.1)PROFIT ATTRIBUTABLE TO EQUITY HOLDERS OF SGS SA 480 660 (27.3)
BASIC EPS (CHF) 64.05 87.45 (26.7)ADJUSTED BASIC EPS (CHF)* 75.44 88.17 (14.4)
CASH FLOW FROM OPERATING ACTIVITIES 1 186 1 149 3.2FREE CASH FLOW* 758 673 12.6
1. Constant currency (CCY)** Alternative Performance Measures (APM), refer to the "2020 Full Year APM document"
HIGHLIGHTS FINANCIAL REVIEW
HIGHLIGHTS
BUSINESS REVIEW
OUTLOOK Q&A APPENDIX
10 Full year results presentation 28 January 2021 © SGS SA 2021 all rights reserved.

Resilient organic revenue growth2020 Revenue composition
Revenue December 2019
Organic Disposals Currency impact
6 600
45
(401)
(188)(452)
5 604
(3.0%) (6.3%) (15.1%) (6.5%) 0.7%
Constant currency* (8.8%)
Revenue December 2020
Acquisitions
(CHF million)
1. Constant currency (CCY)** Alternative Performance Measures (APM), refer to the "2020 Full Year APM document"
11 Full year results presentation 28 January 2021
HIGHLIGHTS FINANCIAL REVIEW
REVENUE
BUSINESS REVIEW
OUTLOOK Q&A APPENDIX
© SGS SA 2021 all rights reserved.

CRS and AFL delivered organic growth
1. Constant currency (CCY)** Alternative Performance Measures (APM), refer to the "2020 Full Year APM document"
0.3%
(6.5%)
(6.9%)
1.0%
(12.0%)
(7.7%)
0.1%(1.5%)
0.7%(3.0%)
(15.2%)
1.3%
3.9%
1.4%
0.9%(12.4%)
0.2%(13.4%)
(9.0%)
Growth1
2020
(1.1%)
(6.9%)
(22.9%)
2.3%
(8.1%)
(15.2%)
(7.6%)
(11.5%)
(8.8%)
Organic Acquisitions Disposals
2020 Revenue growth by business
(2.0%)
AFL
MIN
OGC
CRS
CBE
IND
EHS
GIS
Total Group
12 Full year results presentation 28 January 2021
HIGHLIGHTS FINANCIAL REVIEW
REVENUE
BUSINESS REVIEW
OUTLOOK Q&A APPENDIX
© SGS SA 2021 all rights reserved.

Regional growth impacted by variable lockdown measures
Organic Acquisitions Disposals
(7.9%)
(6.5%)
(0.7%)
0.3%(0.6%)
0.7%(3.0%)
2.5%(12.2%) (12.0%)
0.0%
(8.2%)
(21.7%)
(0.7%)
(8.8%)
Growth1
20202020 Revenue growth1 by region
1. Constant currency (CCY)** Alternative Performance Measures (APM), refer to the "2020 Full Year APM document"
44.8%
19.7%
35.5%
EUROPE/AFRICA/MIDDLE EAST
AMERICAS
ASIA/PACIFIC
Total Group
13 Full year results presentation 28 January 2021
HIGHLIGHTS FINANCIAL REVIEW
REVENUE
BUSINESS REVIEW
OUTLOOK Q&A APPENDIX
© SGS SA 2021 all rights reserved.

Salaries and wages 2019
Efficient workforce management
Currency impact
Restructuring 2019
20191,2 Active portfolio management
Structural cost optimization program
Remaining organic
20202 Restructuring 20203
Salaries and wages 2020
3 357
2 797
(230)(63) 3 064
2 753 44
(6.9%) (1.9%) 1.3% (16.7%) (9.3%)
1. Constant currency (CCY)* – 2. Excluding restructuring costs3. Including a one-off restructuring cost of CHF 15 million related to the single-window contract with the Government of Ghana – 4. In percentage of revenue* Alternative Performance Measures (APM), refer to the "2020 Full Year APM document"
(10.2%)
(CHF million)
49.8%4
49.1%4
14 Full year results presentation 28 January 2021
HIGHLIGHTS FINANCIAL REVIEW
REVENUE
BUSINESS REVIEW
OUTLOOK Q&A APPENDIX
© SGS SA 2021 all rights reserved.

Dec. 2019
FTE
Acqui. Dispos./ Restr.
2.7% (1.9%)
Cost optimiz.
(0.5%)
Remaining organic
(1.4%)
Dec. 2020
(1.0%)
92 661(488)
2 536 (1 757)
(1 254)91 698
Decrease: (963) (1.0%)
Dec. 2019
Eur./Afr./Mid. East
Americas Asia/Pacific
Dec. 2020
94 494(3 985)
(1 596)
185 89 098
FTE
REVENUE
(4.2%)
(8.2%)
(18.2%)
(21.7%)
0.5%
(0.7%)
(5.7%)
(8.8%)
Decrease: (5 396) (5.7%)
Average headcount decreased by 6% FTE1 End of period FTE1 Average by region
1. Full-Time Equivalent (FTE) Employees 1. Full-Time Equivalent (FTE) Employees
15 Full year results presentation 28 January 2021
HIGHLIGHTS FINANCIAL REVIEW
REVENUE
BUSINESS REVIEW
OUTLOOK Q&A APPENDIX
© SGS SA 2021 all rights reserved.

2020 Adjusted operating income* (CHF million)
Adj. Op. inc. December 2019
Organic Acquisitions Disposals Currency impact
Adj. op. inc. December 2020
1 0631
(65)(14) (85)
900
(1.4%) (7.3%) (15.3%) (6.7%) 0.1%
Constant currency* (8.0%)
Strong organic adjusted operating income performance
16.1%
16.1%
1. Constant currency (CCY)** Alternative Performance Measures (APM), refer to the "2020 Full Year APM document"
HIGHLIGHTS FINANCIAL REVIEW
ADJUSTED OPERATING INCOME
BUSINESS REVIEW
OUTLOOK Q&A APPENDIX
16 Full year results presentation 28 January 2021 © SGS SA 2021 all rights reserved.

(CHF million)December
2020December
2019
OPERATING INCOME 795 1 082 Amortization and impairment of acquired intangibles 31 36
Restructuring costs 84 89 Goodwill impairment 37 21 Gain on business disposals (63) (268) Transaction and integration costs 16 19 Other non-recurring items1 – 84 ADJUSTED OPERATING INCOME 900 1 063 1. 2019 included mainly tax provisions of CHF 33 million, impairment of fixed and intangible assets of CHF 24
million and the remeasurement of the defined benefit obligation of the Swiss pension fund of CHF 10 million* Alternative Performance Measures (APM), refer to the "2020 Full Year APM document"
■ In 2020, the termination of the single-window contract with the Government of Ghana and the vehicle inspection contract with the Government of Uganda accounted for half of the restructuring costs, while 2019 was impacted by the structural cost optimization program
■ Gain on business disposals is related to the sale of pest management and fumigation operations in 2020 compared to the disposal of Petroleum Services Corporation (PSC) in prior period
■ 2020 transaction costs mainly relate to the acquisition of SYNLAB Analytics & Services (A&S), while 2019 was mainly linked to the disposal of PSC
Adjusted operating income2020 Adjusted operating income* bridge
HIGHLIGHTS FINANCIAL REVIEW
ADJUSTED OPERATING INCOME
BUSINESS REVIEW
OUTLOOK Q&A APPENDIX
17 Full year results presentation 28 January 2021 © SGS SA 2021 all rights reserved.
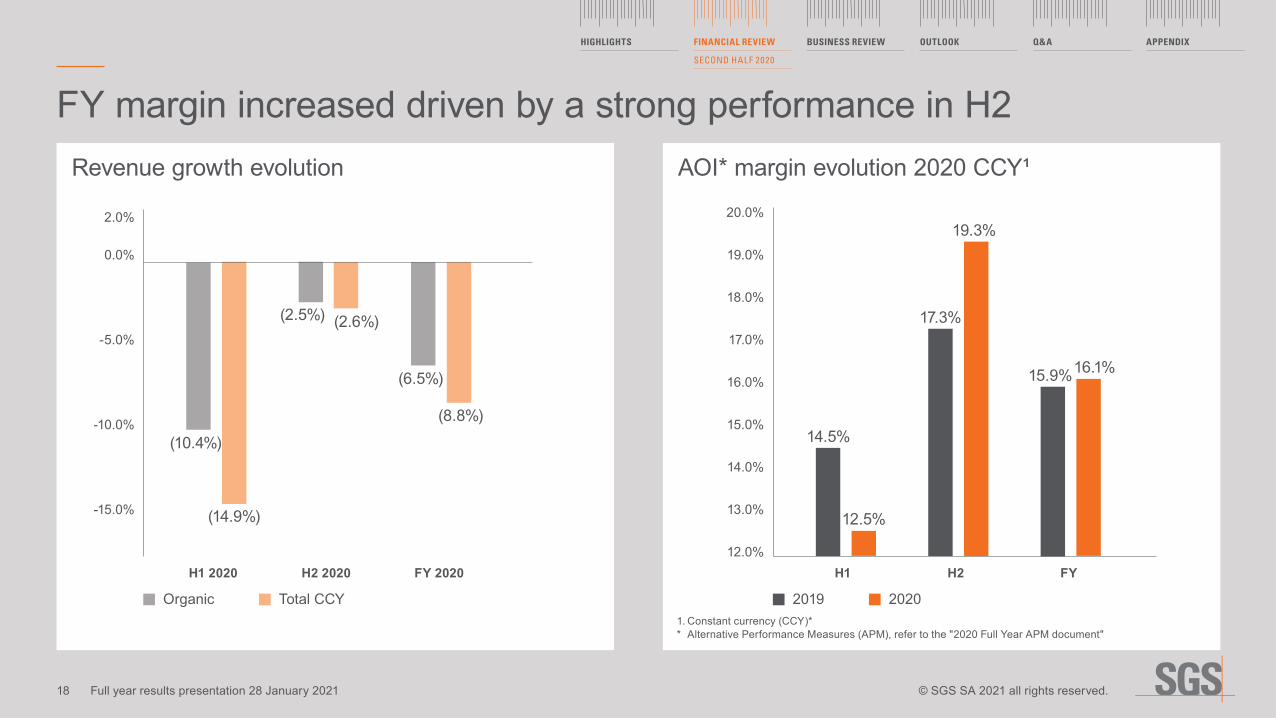
Revenue growth evolution AOI* margin evolution 2020 CCY¹
FY margin increased driven by a strong performance in H2
1. Constant currency (CCY)* * Alternative Performance Measures (APM), refer to the "2020 Full Year APM document"
(10.4%)
(14.9%)
(2.5%) (2.6%)
(6.5%)
(8.8%)14.5%
12.5%
17.3%
19.3%
15.9%16.1%
0.0%
-5.0%
-10.0%
-15.0%
H1 2020 H2 2020 FY 2020
Organic Total CCY
20.0%
19.0%
18.0%
17.0%
16.0%
15.0%
14.0%
13.0%
12.0%H1 H2 FY
2019 2020
2.0%
HIGHLIGHTS FINANCIAL REVIEW
SECOND HALF 2020
BUSINESS REVIEW
OUTLOOK Q&A APPENDIX
18 Full year results presentation 28 January 2021 © SGS SA 2021 all rights reserved.
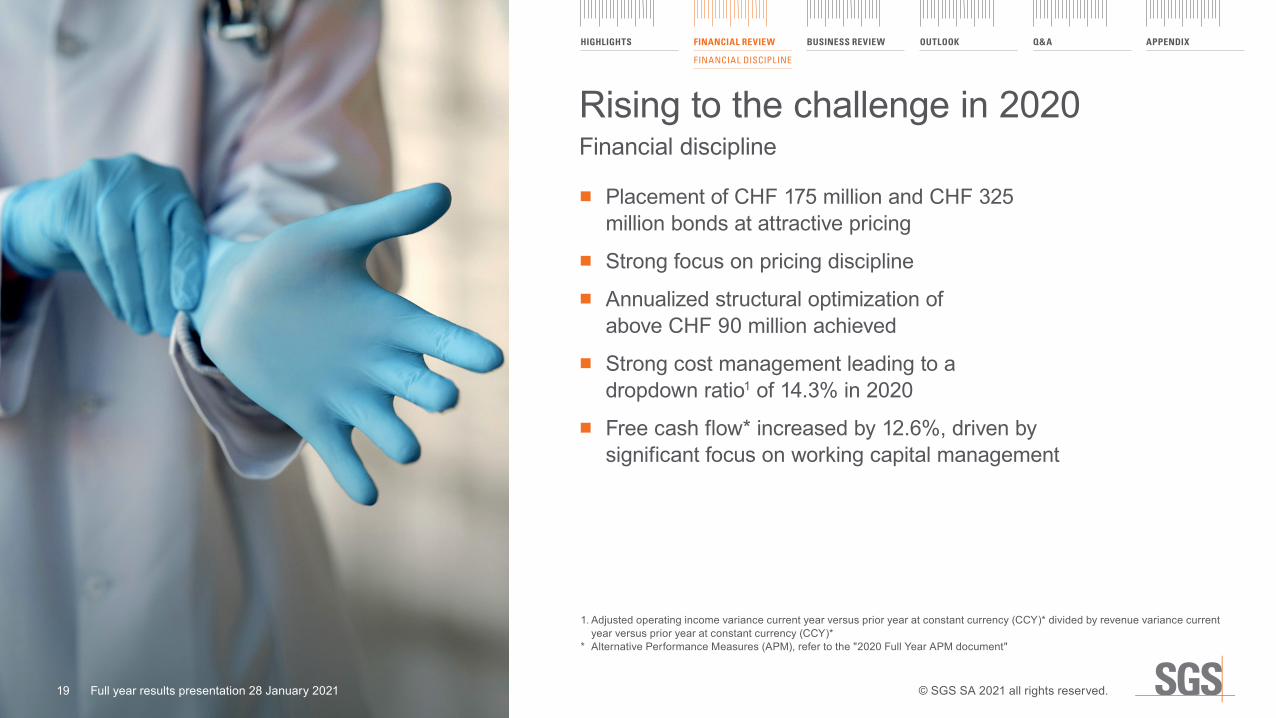
■ Placement of CHF 175 million and CHF 325 million bonds at attractive pricing
■ Strong focus on pricing discipline ■ Annualized structural optimization of
above CHF 90 million achieved ■ Strong cost management leading to a
dropdown ratio1 of 14.3% in 2020 ■ Free cash flow* increased by 12.6%, driven by
significant focus on working capital management
Rising to the challenge in 2020Financial discipline
1. Adjusted operating income variance current year versus prior year at constant currency (CCY)* divided by revenue variance current year versus prior year at constant currency (CCY)*
* Alternative Performance Measures (APM), refer to the "2020 Full Year APM document"
© SGS SA 2021 all rights reserved.
HIGHLIGHTS FINANCIAL REVIEW
FINANCIAL DISCIPLINE
BUSINESS REVIEW
OUTLOOK Q&A APPENDIX
19 Full year results presentation 28 January 2021
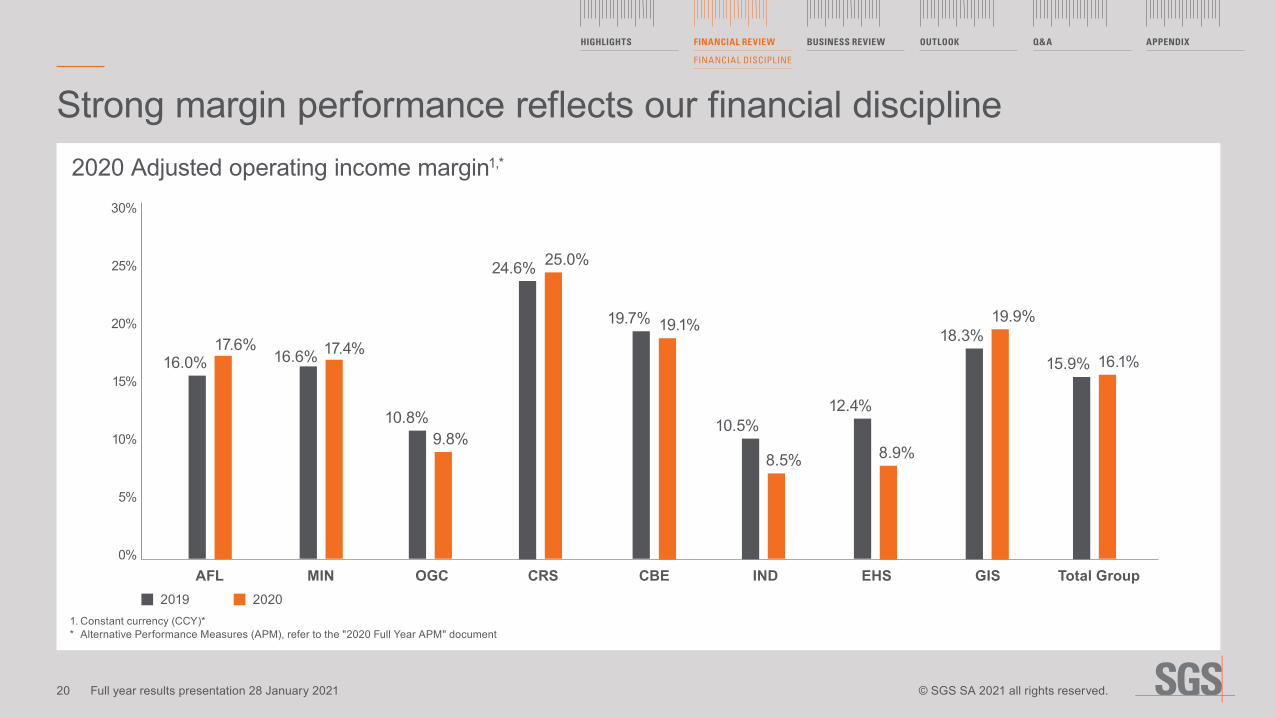
Strong margin performance reflects our financial discipline
1. Constant currency (CCY)** Alternative Performance Measures (APM), refer to the "2020 Full Year APM" document
16.0%17.6%
16.6% 17.4%
10.8%9.8%
24.6% 25.0%
19.7% 19.1%
10.5%
8.5%
12.4%
8.9%
18.3%19.9%
15.9% 16.1%
2020 Adjusted operating income margin1,*
30%
25%
20%
15%
10%
5%
0%AFL MIN OGC CRS CBE IND EHS GIS Total Group
2019 2020
20 Full year results presentation 28 January 2021 © SGS SA 2021 all rights reserved.
HIGHLIGHTS FINANCIAL REVIEW
FINANCIAL DISCIPLINE
BUSINESS REVIEW
OUTLOOK Q&A APPENDIX
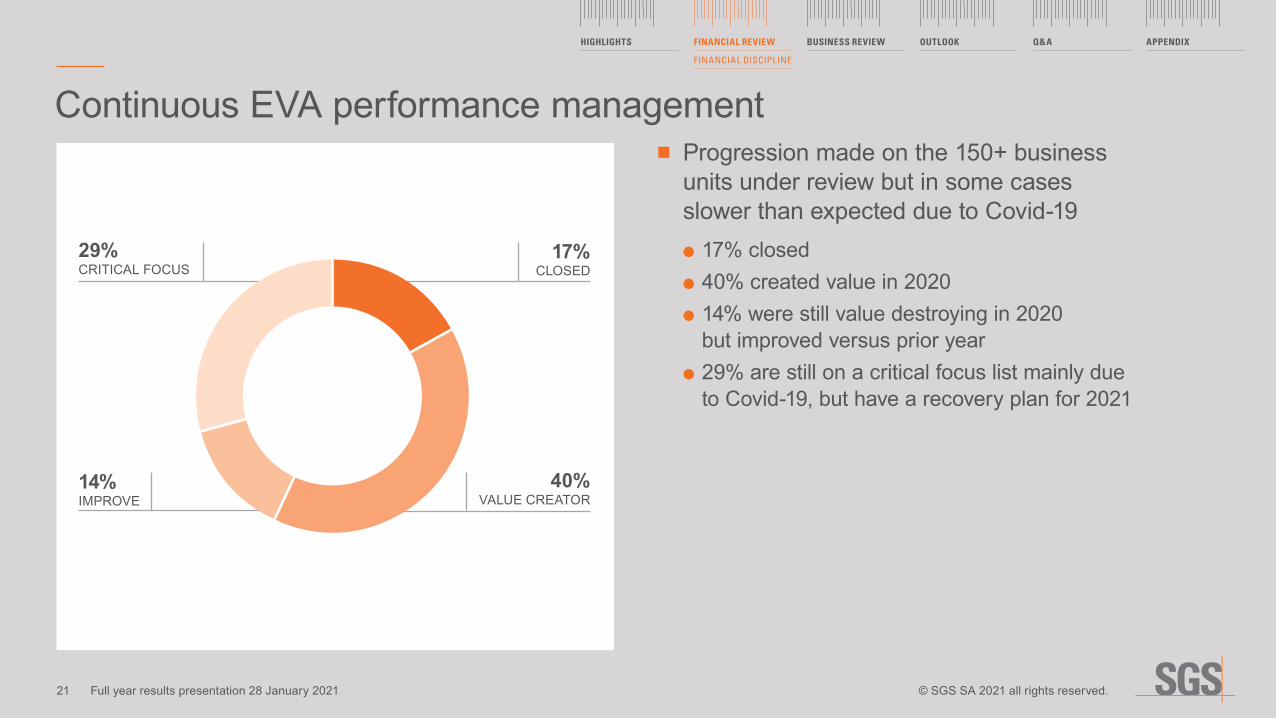
Continuous EVA performance management ■ Progression made on the 150+ business units under review but in some cases slower than expected due to Covid-19●● 17% closed●● 40% created value in 2020●● 14% were still value destroying in 2020 but improved versus prior year
●● 29% are still on a critical focus list mainly due to Covid-19, but have a recovery plan for 2021
17%CLOSED
40%VALUE CREATOR
29%CRITICAL FOCUS
14%IMPROVE
21 Full year results presentation 28 January 2021 © SGS SA 2021 all rights reserved.
HIGHLIGHTS FINANCIAL REVIEW
FINANCIAL DISCIPLINE
BUSINESS REVIEW
OUTLOOK Q&A APPENDIX

2020 Consolidated balance sheet
* Alternative Performance Measures (APM), refer to the "2020 Full Year APM" document
Assets
(CHF million)December
2020December
2019
Property, plant and equipment 872 926Right-of-use assets 590 611Goodwill 1 651 1 281Other intangible assets 333 187Investments in joint ventures, associates and other companies 34 35Deferred tax assets 161 174Other non-current assets 154 149NON-CURRENT ASSETS 3 795 3 363
Inventories 57 45Unbilled revenues and work in progress 160 195Trade receivables 856 953Other receivables and prepayments 188 219Current tax assets 77 77Marketable securities 9 9Cash and cash equivalents 1 766 1 466CURRENT ASSETS 3 113 2 964TOTAL 6 908 6 327
NET DEBT* (1 478) (762)
Equity and liabilities
(CHF million)December
2020December
2019
Equity holder of SGS SA 1 060 1 514Non-controlling interests 74 81EQUITY 1 134 1 595Loans and other financial liabilities 2 390 2 199Lease liabilities 470 490Deferred tax liabilities 53 23Defined benefit obligations 136 151Provisions 88 91NON-CURRENT LIABILITIES 3 137 2 954Loans and other financial liabilities 863 38Lease liabilities 151 154Trade and other payables 658 638Provisions 85 74Current tax liabilities 140 145Contract liabilities 189 155Other creditors and accruals 551 574CURRENT LIABILITIES 2 637 1 778TOTAL 6 908 6 327
HIGHLIGHTS FINANCIAL REVIEW
BALANCE SHEET
BUSINESS REVIEW
OUTLOOK Q&A APPENDIX
22 Full year results presentation 28 January 2021 © SGS SA 2021 all rights reserved.

Strong cash flow generation
(CHF million)December
2020December
2019
PROFIT FOR THE PERIOD 505 702 Non-cash and non-operating items 748 756 Decrease/(increase) in working capital 186 (3)Taxes paid (253) (306)CASH FLOW FROM OPERATING ACTIVITIES 1 186 1 149 Net purchase of fixed assets (246) (279)Acquisition of businesses (492) (169)Proceeds from sales of businesses 71 333 Decrease in marketable securities and other 12 15 CASH FLOW USED BY INVESTING ACTIVITIES (655) (100)Dividends paid to equity holders of SGS SA (598) (589)Dividends paid to non-controlling interests (37) (43)Transaction with non-controlling interests (1) (12)Cash paid on treasury shares (208) (23)Proceeds/(payment) of corporate bonds 499 (375)Interest paid (63) (87)Payment of lease liabilities (161) (174)Proceeds from borrowings 542 –Payment of borrowings (154) –CASH FLOW USED BY FINANCING ACTIVITIES (181) (1 303)Currency translation (50) (23)INCREASE/(DECREASE) IN CASH AND CASH EQUIVALENTS 300 (277)
* Alternative Performance Measures (APM), refer to the "2020 Full Year APM" document
2020 Condensed cash flow
(CHF million)December
2020December
2019
CASH FLOW FROM OPERATING ACTIVITIES 1 186 1 149 Purchase of property, plant and equipment and other intangible assets (259) (290)
Disposal of property, plant and equipment and other intangible assets 13 11
Operating lease outflows (182) (197)FREE CASH FLOW* 758 673
HIGHLIGHTS FINANCIAL REVIEW
CASH FLOW
BUSINESS REVIEW
OUTLOOK Q&A APPENDIX
23 Full year results presentation 28 January 2021 © SGS SA 2021 all rights reserved.
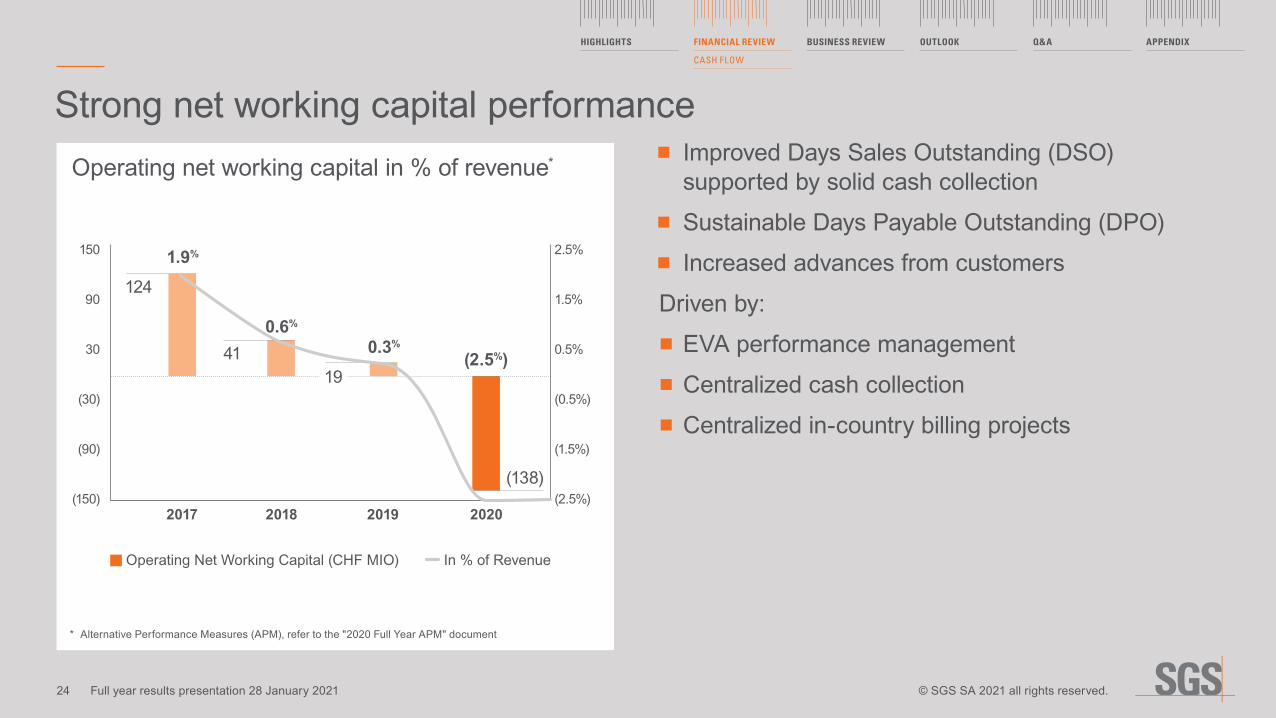
Strong net working capital performance ■ Improved Days Sales Outstanding (DSO) supported by solid cash collection
■ Sustainable Days Payable Outstanding (DPO) ■ Increased advances from customers
Driven by: ■ EVA performance management ■ Centralized cash collection ■ Centralized in-country billing projects
* Alternative Performance Measures (APM), refer to the "2020 Full Year APM" document
Operating Net Working Capital (CHF MIO) In % of Revenue
1.9%
0.6%
0.3%
(2.5%)
124
4119
(138)
Operating net working capital in % of revenue*
150
90
30
(30)
(90)
(150)
2.5%
1.5%
0.5%
(0.5%)
(1.5%)
(2.5%) 2017 2018 2019 2020
HIGHLIGHTS FINANCIAL REVIEW
CASH FLOW
BUSINESS REVIEW
OUTLOOK Q&A APPENDIX
24 Full year results presentation 28 January 2021 © SGS SA 2021 all rights reserved.

Continued investment in strategic priority areasCapex in % of revenue
Capital Expenditure (Capex) In % of Revenue
302 304 290
259
4.8%
4.5% 4.4% 4.6%
Capital expenditure by business
32%CRS
5%GIS
15%AFL
12%IND
16%OGC
11%MIN
8%EHS
1%CBE
400
350
300
250
200
150
100
50
0
5%
4%
3%
2%
1%
0%2017 2018 2019 2020
CHF 259 MIO
(CHF million)
HIGHLIGHTS FINANCIAL REVIEW
CASH FLOW
BUSINESS REVIEW
OUTLOOK Q&A APPENDIX
25 Full year results presentation 28 January 2021 © SGS SA 2021 all rights reserved.
1. Constant currency (CCY)* 2. 2020 ROIC at 20.9% when adjusted from SYNLAB Analytics & Services (A&S) acquisition completed on 31 December 2020* Alternative Performance Measures (APM), refer to the "2020 Full Year APM" document
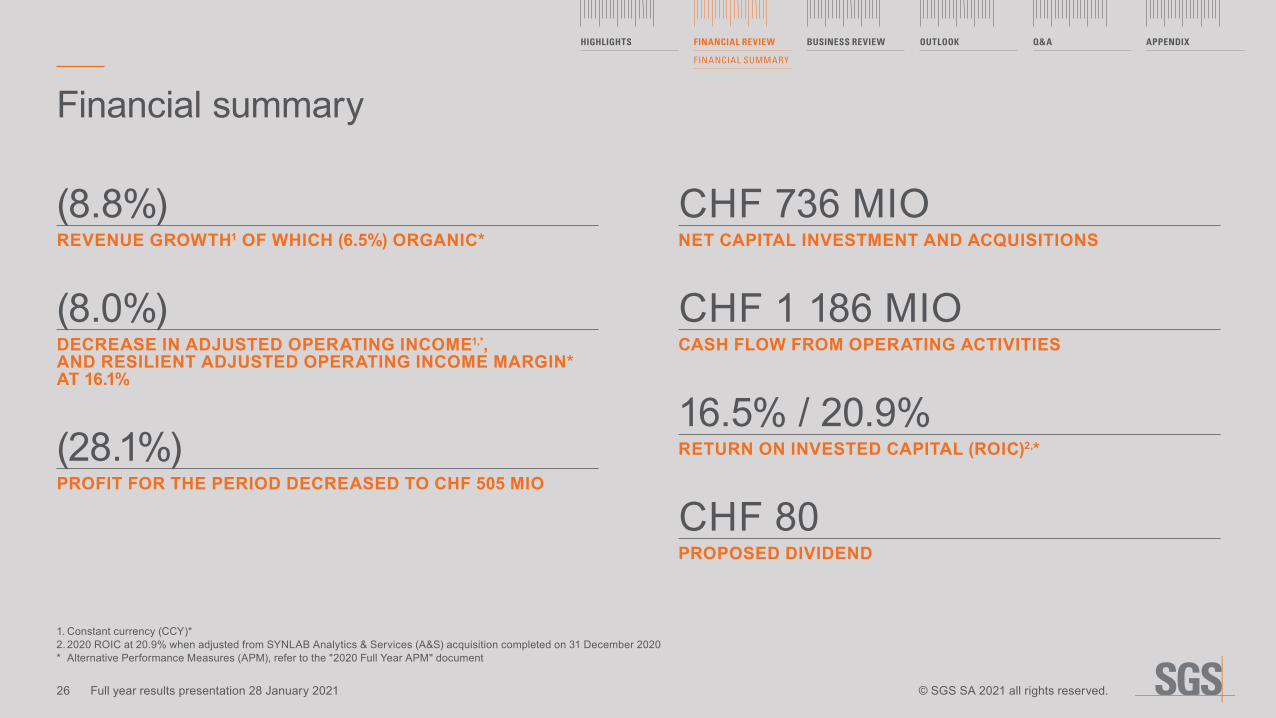
(8.8%)REVENUE GROWTH1 OF WHICH (6.5%) ORGANIC*
(8.0%)DECREASE IN ADJUSTED OPERATING INCOME1,*, AND RESILIENT ADJUSTED OPERATING INCOME MARGIN* AT 16.1%
(28.1%)PROFIT FOR THE PERIOD DECREASED TO CHF 505 MIO
CHF 736 MIONET CAPITAL INVESTMENT AND ACQUISITIONS
CHF 1 186 MIOCASH FLOW FROM OPERATING ACTIVITIES
16.5% / 20.9%RETURN ON INVESTED CAPITAL (ROIC)2,*
CHF 80PROPOSED DIVIDEND
Financial summary
HIGHLIGHTS FINANCIAL REVIEW
FINANCIAL SUMMARY
BUSINESS REVIEW
OUTLOOK Q&A APPENDIX
26 Full year results presentation 28 January 2021 © SGS SA 2021 all rights reserved.
BUSINESS REVIEW
HIGHLIGHTS FINANCIAL REVIEW BUSINESS REVIEW OUTLOOK Q&A APPENDIX

Overview ■ Organic revenue increased by 0.3% ■ Food declined as testing and audit volumes were impacted by lockdown measures
■ Life lab growth was above the divisional growth, despite clinical research and bioanalysis being impacted by the lockdown
■ Trade delivered good organic growth ■ Profitability improvement driven by disciplined cost focus and structural cost optimization
Outlook ■ Continued recovery of activities expected following the second wave of restrictions
■ Enhanced sales focus across the business units to drive growth
■ Life growth supported by vaccine opportunities ■ An ongoing recovery of audit activities expected in Food
■ Trade to remain strong ■ Solid inorganic pipeline
Structural growth drivers increasingly relevantAgriculture, Food and Life (AFL)
(CHF million)December
2020December
2019Change
in %December 2019 CCY1
Change in CCY1 %
REVENUE 996 1 074 (7.3) 1 007 (1.1)ADJUSTED OPERATING INCOME* 175 172 1.7 161 8.7 MARGIN %* 17.6 16.0 16.0
1. Constant currency (CCY)** Alternative Performance Measures (APM), refer to the "2020 Full Year APM document"
28
HIGHLIGHTS FINANCIAL REVIEW BUSINESS REVIEW OUTLOOK Q&A APPENDIX
Full year results presentation 28 January 2021 © SGS SA 2021 all rights reserved.
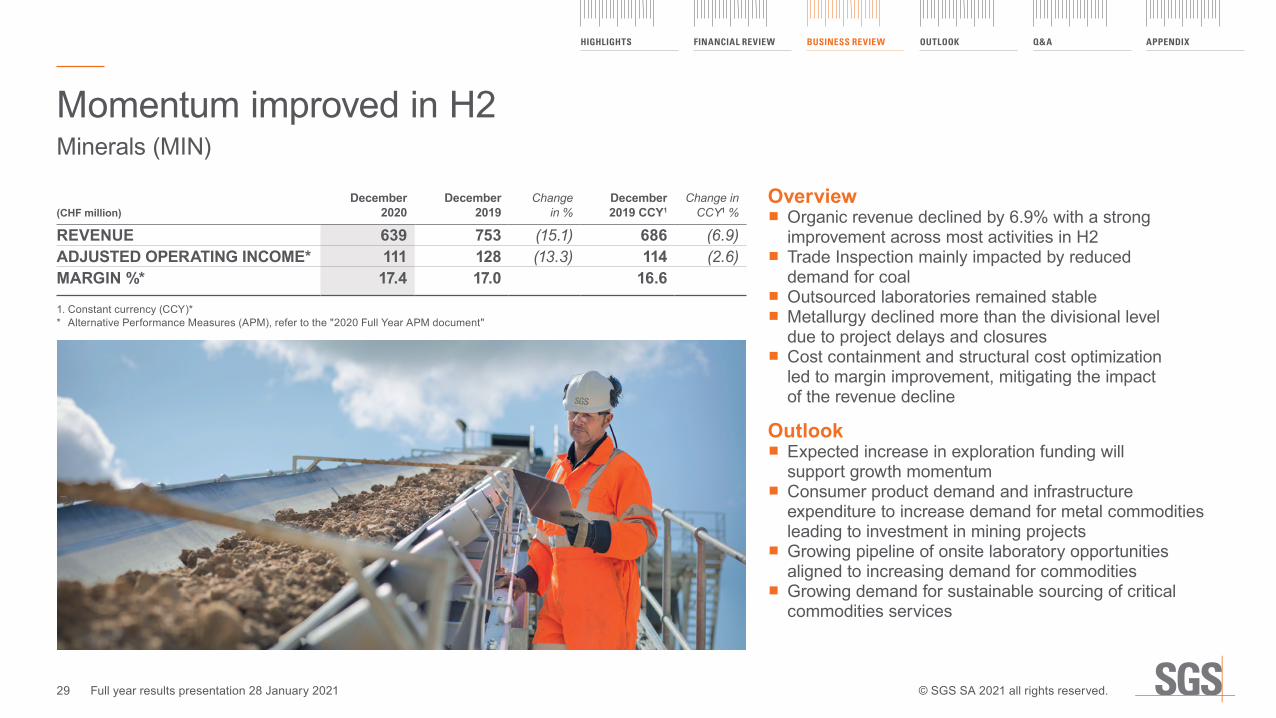
Overview ■ Organic revenue declined by 6.9% with a strong improvement across most activities in H2
■ Trade Inspection mainly impacted by reduced demand for coal
■ Outsourced laboratories remained stable ■ Metallurgy declined more than the divisional level due to project delays and closures
■ Cost containment and structural cost optimization led to margin improvement, mitigating the impact of the revenue decline
Outlook ■ Expected increase in exploration funding will support growth momentum
■ Consumer product demand and infrastructure expenditure to increase demand for metal commodities leading to investment in mining projects
■ Growing pipeline of onsite laboratory opportunities aligned to increasing demand for commodities
■ Growing demand for sustainable sourcing of critical commodities services
Momentum improved in H2Minerals (MIN)
(CHF million)December
2020December
2019Change
in %December 2019 CCY1
Change in CCY1 %
REVENUE 639 753 (15.1) 686 (6.9)ADJUSTED OPERATING INCOME* 111 128 (13.3) 114 (2.6)MARGIN %* 17.4 17.0 16.6
1. Constant currency (CCY)** Alternative Performance Measures (APM), refer to the "2020 Full Year APM document"
29
HIGHLIGHTS FINANCIAL REVIEW BUSINESS REVIEW OUTLOOK Q&A APPENDIX
Full year results presentation 28 January 2021 © SGS SA 2021 all rights reserved.

Overview ■ Revenue declined following the disposal of Plant and Terminal Operations (PSC) in June 2019
■ Market share gains provided some offset in a difficult market
■ Trade declined due to reduced end-demand ■ Lower sample volumes due to weaker economic activity in NIRT and Oil Condition Monitoring (OCM)
■ Upstream impacted by a low oil price, project deferrals and site access restrictions
Outlook ■ The recovery of the Oil & Gas industry to follow a sustained increase in confidence in the underlying market
■ Trade and NIRT should recover in line with an improvement in economic activity
■ A recovery in Upstream will lag the normalization of the oil price
■ Growth expected in OCM from new contract wins
A challenging marketOil, Gas and Chemicals (OGC)
(CHF million)December
2020December
2019Change
in %December 2019 CCY1
Change in CCY1 %
REVENUE 776 1 075 (27.8) 1 006 (22.9)ADJUSTED OPERATING INCOME* 76 120 (36.7) 109 (30.3)MARGIN %* 9.8 11.2 10.8
1. Constant currency (CCY)** Alternative Performance Measures (APM), refer to the "2020 Full Year APM document"
30
HIGHLIGHTS FINANCIAL REVIEW BUSINESS REVIEW OUTLOOK Q&A APPENDIX
Full year results presentation 28 January 2021 © SGS SA 2021 all rights reserved.
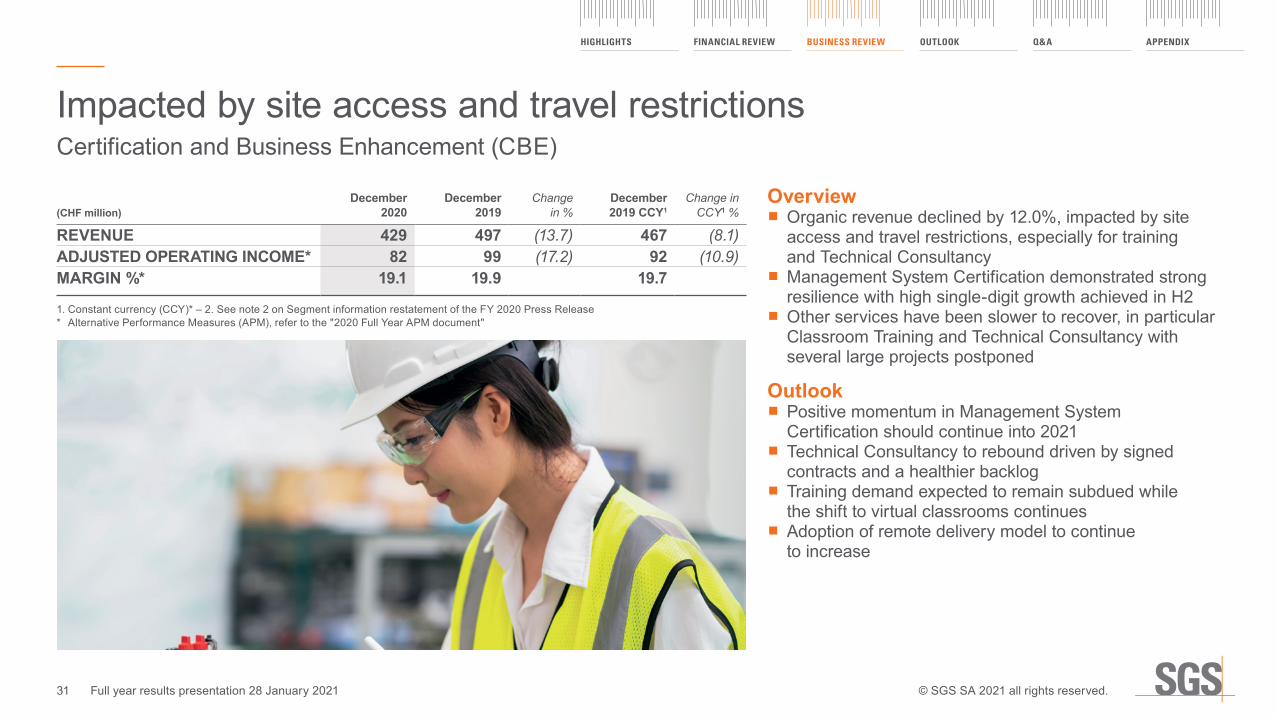
Overview ■ Organic revenue declined by 12.0%, impacted by site access and travel restrictions, especially for training and Technical Consultancy
■ Management System Certification demonstrated strong resilience with high single-digit growth achieved in H2
■ Other services have been slower to recover, in particular Classroom Training and Technical Consultancy with several large projects postponed
Outlook ■ Positive momentum in Management System Certification should continue into 2021
■ Technical Consultancy to rebound driven by signed contracts and a healthier backlog
■ Training demand expected to remain subdued while the shift to virtual classrooms continues
■ Adoption of remote delivery model to continue to increase
Impacted by site access and travel restrictionsCertification and Business Enhancement (CBE)
(CHF million)December
2020December
2019Change
in %December 2019 CCY1
Change in CCY1 %
REVENUE 429 497 (13.7) 467 (8.1)ADJUSTED OPERATING INCOME* 82 99 (17.2) 92 (10.9)MARGIN %* 19.1 19.9 19.7
1. Constant currency (CCY)* – 2. See note 2 on Segment information restatement of the FY 2020 Press Release* Alternative Performance Measures (APM), refer to the "2020 Full Year APM document"
31
HIGHLIGHTS FINANCIAL REVIEW BUSINESS REVIEW OUTLOOK Q&A APPENDIX
Full year results presentation 28 January 2021 © SGS SA 2021 all rights reserved.

Overview ■ Organic revenue declined by 13.4%, while the drop through into adjusted operating income was limited, particularly in H2
■ Oil & Gas was impacted by decreased capex spend and project delays, while Transportation, particularly Aeronautics, was also challenging
■ North East Asia was resilient throughout the year with high single-digit growth in H2
■ Power & Utilities was broadly stable with significant progress in the strategic focus areas of Renewables and Nuclear, and Manufacturing grew strongly in H2
■ Proactive cost measures supported by the growth in Asia drove a strong H2 margin performance
Outlook ■ Power & Utilities and high-end Manufacturing markets will continue to grow
■ Double-digit growth expected from new initiatives including Industrial Safety, Rail, Calibration
■ Partial recovery in Oil & Gas as postponed opex projects resume
■ Infrastructure is expected to recover in Latin America, Asia and Africa
Oil & Gas end-market under pressureIndustrial (IND)
(CHF million)December
2020December
2019Change
in %December 2019 CCY1
Change in CCY1 %
REVENUE 847 1 091 (22.4) 999 (15.2)ADJUSTED OPERATING INCOME* 72 116 (37.9) 105 (31.4)MARGIN %* 8.5 10.6 10.5
1. Constant currency (CCY)** Alternative Performance Measures (APM), refer to the "2020 Full Year APM document"
32
HIGHLIGHTS FINANCIAL REVIEW BUSINESS REVIEW OUTLOOK Q&A APPENDIX
Full year results presentation 28 January 2021 © SGS SA 2021 all rights reserved.
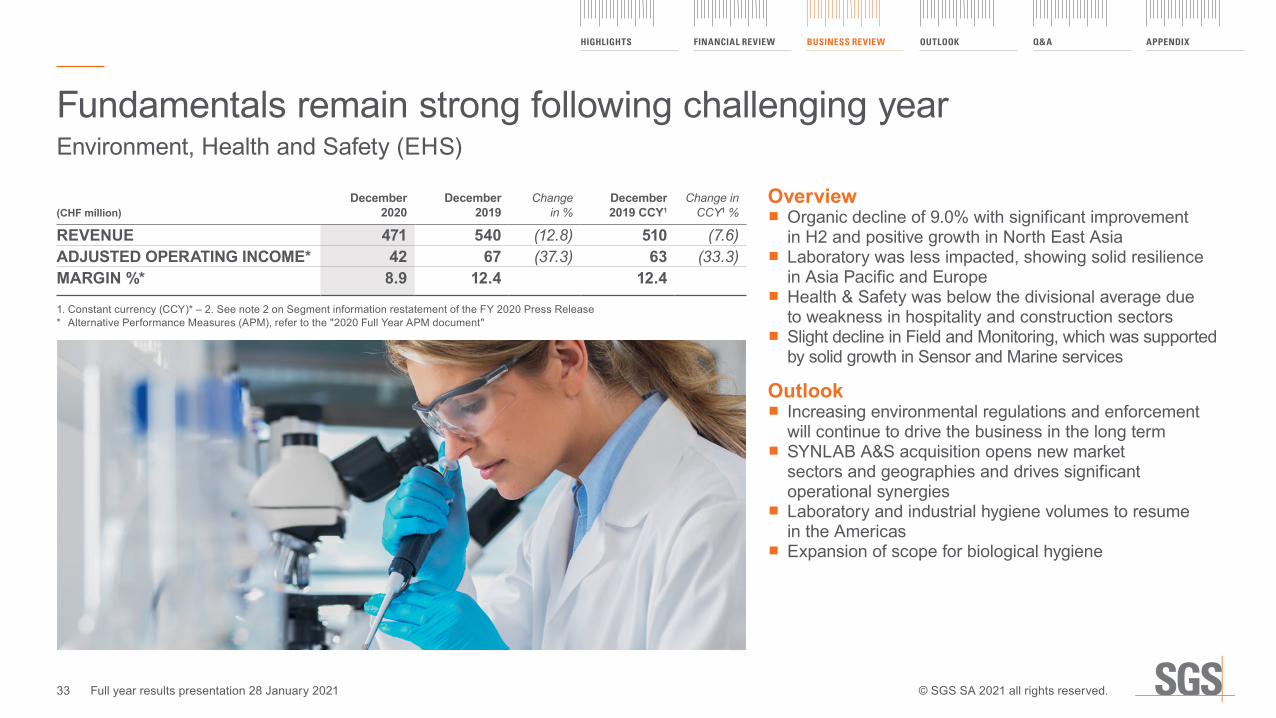
Overview ■ Organic decline of 9.0% with significant improvement in H2 and positive growth in North East Asia
■ Laboratory was less impacted, showing solid resilience in Asia Pacific and Europe
■ Health & Safety was below the divisional average due to weakness in hospitality and construction sectors
■ Slight decline in Field and Monitoring, which was supported by solid growth in Sensor and Marine services
Outlook ■ Increasing environmental regulations and enforcement will continue to drive the business in the long term
■ SYNLAB A&S acquisition opens new market sectors and geographies and drives significant operational synergies
■ Laboratory and industrial hygiene volumes to resume in the Americas
■ Expansion of scope for biological hygiene
Fundamentals remain strong following challenging yearEnvironment, Health and Safety (EHS)
(CHF million)December
2020December
2019Change
in %December 2019 CCY1
Change in CCY1 %
REVENUE 471 540 (12.8) 510 (7.6)ADJUSTED OPERATING INCOME* 42 67 (37.3) 63 (33.3)MARGIN %* 8.9 12.4 12.4
1. Constant currency (CCY)* – 2. See note 2 on Segment information restatement of the FY 2020 Press Release* Alternative Performance Measures (APM), refer to the "2020 Full Year APM document"
33
HIGHLIGHTS FINANCIAL REVIEW BUSINESS REVIEW OUTLOOK Q&A APPENDIX
Full year results presentation 28 January 2021 © SGS SA 2021 all rights reserved.
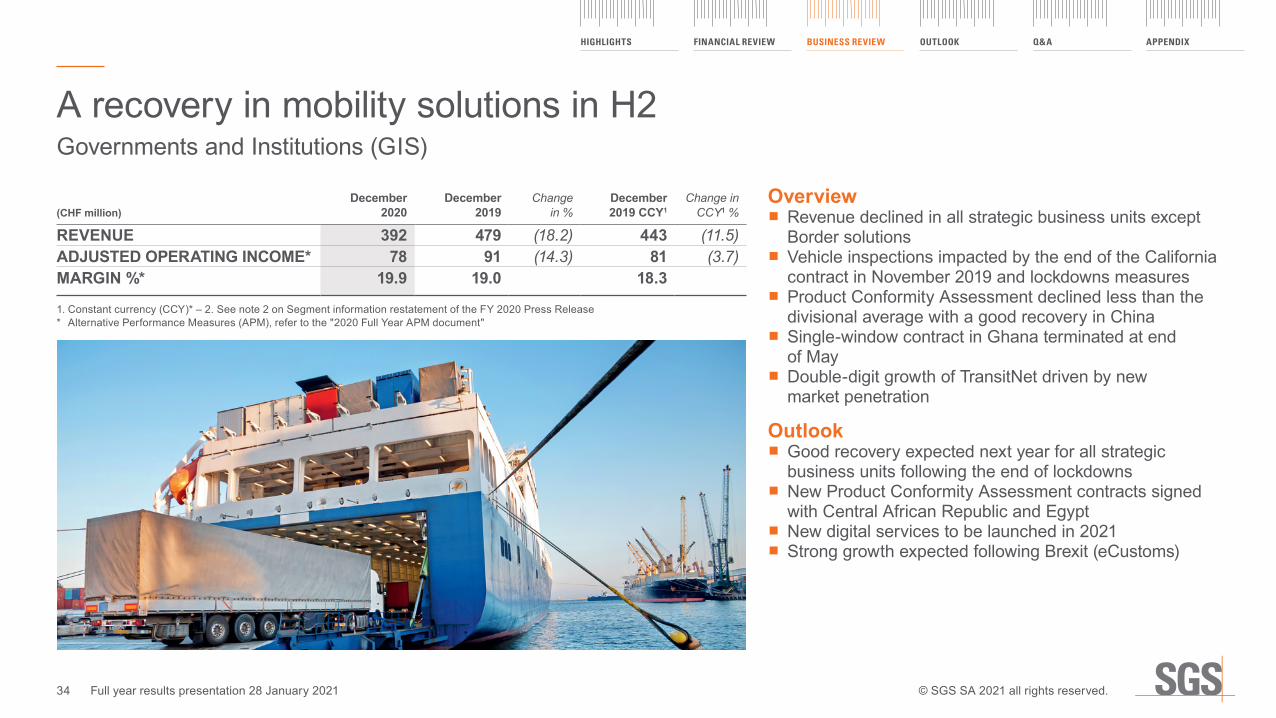
Overview ■ Revenue declined in all strategic business units except Border solutions
■ Vehicle inspections impacted by the end of the California contract in November 2019 and lockdowns measures
■ Product Conformity Assessment declined less than the divisional average with a good recovery in China
■ Single-window contract in Ghana terminated at end of May
■ Double-digit growth of TransitNet driven by new market penetration
Outlook ■ Good recovery expected next year for all strategic business units following the end of lockdowns
■ New Product Conformity Assessment contracts signed with Central African Republic and Egypt
■ New digital services to be launched in 2021 ■ Strong growth expected following Brexit (eCustoms)
A recovery in mobility solutions in H2Governments and Institutions (GIS)
(CHF million)December
2020December
2019Change
in %December 2019 CCY1
Change in CCY1 %
REVENUE 392 479 (18.2) 443 (11.5)ADJUSTED OPERATING INCOME* 78 91 (14.3) 81 (3.7)MARGIN %* 19.9 19.0 18.3
1. Constant currency (CCY)* – 2. See note 2 on Segment information restatement of the FY 2020 Press Release* Alternative Performance Measures (APM), refer to the "2020 Full Year APM document"
34
HIGHLIGHTS FINANCIAL REVIEW BUSINESS REVIEW OUTLOOK Q&A APPENDIX
Full year results presentation 28 January 2021 © SGS SA 2021 all rights reserved.

Overview ■ Moderate organic growth as all strategic business units recovered strongly in H2 and Softlines benefited from PPE testing and certification
■ Electrical & Electronics growth was slightly below divisional average. Strong growth in safety testing, wireless and functional safety offset difficult market conditions in Automotive testing
■ Strong growth in Softlines was driven by PPE testing and certification despite difficult underlying trading conditions
■ Toys and juvenile decreased while hardgoods remained stable
■ Margin increased driven by strong PPE demand in North East Asia
Outlook ■ Accelerated investment in connectivity related markets ■ Increased market share through new Retail and eCommerce solutions
■ Continued focus on innovation and digitalization to develop new services, drive efficiencies and improve performance
A very strong performance Consumer and Retail (CRS)
(CHF million)December
2020December
2019Change
in %December 2019 CCY1
Change in CCY1 %
REVENUE 1 054 1 091 (3.4) 1 030 2.3 ADJUSTED OPERATING INCOME* 264 270 (2.2) 253 4.3 MARGIN %* 25.0 24.7 24.6
1. Constant currency (CCY)* – 2. See note 2 on Segment information restatement of the FY 2020 Press Release* Alternative Performance Measures (APM), refer to the "2020 Full Year APM document"
35
HIGHLIGHTS FINANCIAL REVIEW BUSINESS REVIEW OUTLOOK Q&A APPENDIX
Full year results presentation 28 January 2021 © SGS SA 2021 all rights reserved.

SGS’ STRATEGIC EVOLUTION
HIGHLIGHTS FINANCIAL REVIEW BUSINESS REVIEW OUTLOOK Q&A APPENDIX
The next stage of SGS’ strategic evolution
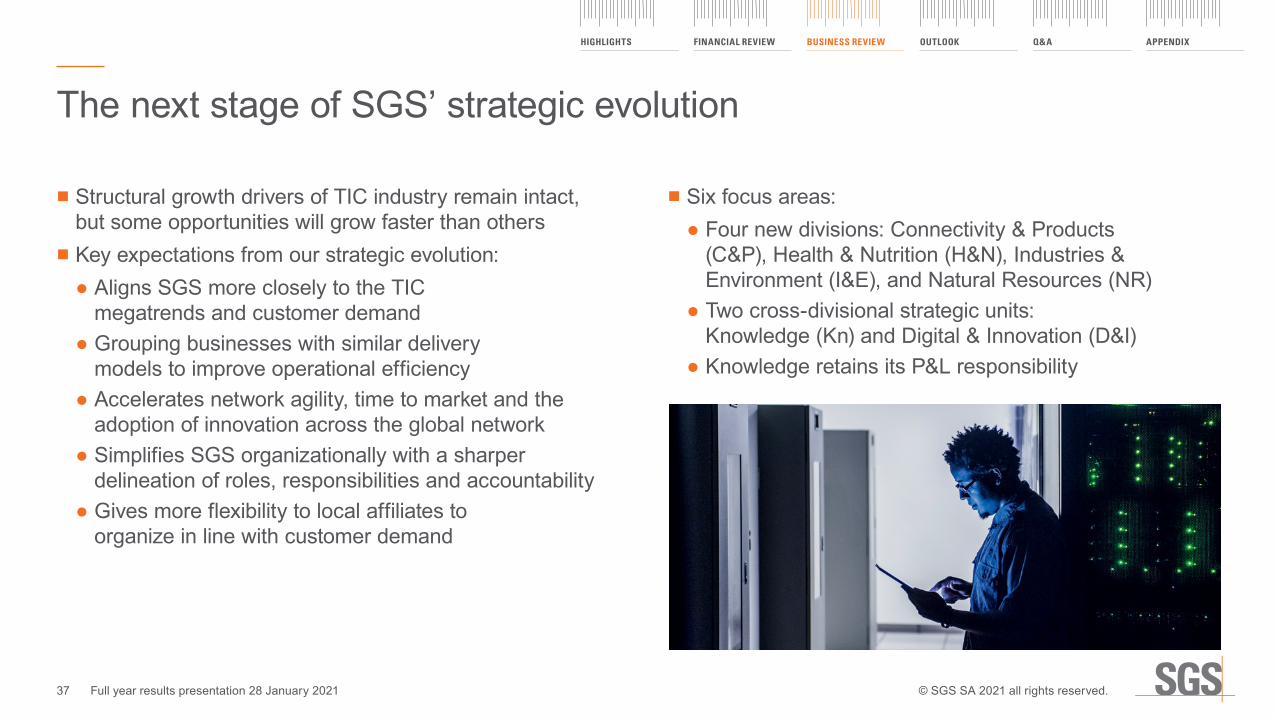
■ Structural growth drivers of TIC industry remain intact, but some opportunities will grow faster than others
■ Key expectations from our strategic evolution: ● Aligns SGS more closely to the TIC megatrends and customer demand
● Grouping businesses with similar delivery models to improve operational efficiency
● Accelerates network agility, time to market and the adoption of innovation across the global network
● Simplifies SGS organizationally with a sharper delineation of roles, responsibilities and accountability
● Gives more flexibility to local affiliates to organize in line with customer demand
■ Six focus areas: ● Four new divisions: Connectivity & Products (C&P), Health & Nutrition (H&N), Industries & Environment (I&E), and Natural Resources (NR)
● Two cross-divisional strategic units: Knowledge (Kn) and Digital & Innovation (D&I)
● Knowledge retains its P&L responsibility
37
HIGHLIGHTS FINANCIAL REVIEW BUSINESS REVIEW OUTLOOK Q&A APPENDIX
Full year results presentation 28 January 2021 © SGS SA 2021 all rights reserved.

Simplifying the divisional structureConnectivity & Products
Health & Nutrition
Natural Resources
Industries & Environment
Knowledge
Agriculture, Food and Life
Consumer and Retail
Environment, Health and SafetyGovernments and Institutions
Industrial
Minerals
Oil, Gas and Chemicals
Certification and Business Enhancement
Health ScienceCrop ScienceFoodTrade & InspectionCosmetics & HygieneSoftlinesHardlinesElectrical and ElectronicEnvironmental and Industrial Hygiene Testing Government MandatesGovernments and Institutions ServicesIndustrial and Public Health and SafetyTechnical Assessment and AdvisoryField Services and InspectionSpecial ServicesTrade & InspectionLaboratory TestingOn-site LaboratoriesTrade & InspectionLaboratory TestingMarket IntelligenceCertificationCustomized AuditsTrainingTechnical Consulting
* This is a high level representation of our divisional structure and is not comprehensive
38
HIGHLIGHTS FINANCIAL REVIEW BUSINESS REVIEW OUTLOOK Q&A APPENDIX
Full year results presentation 28 January 2021 © SGS SA 2021 all rights reserved.
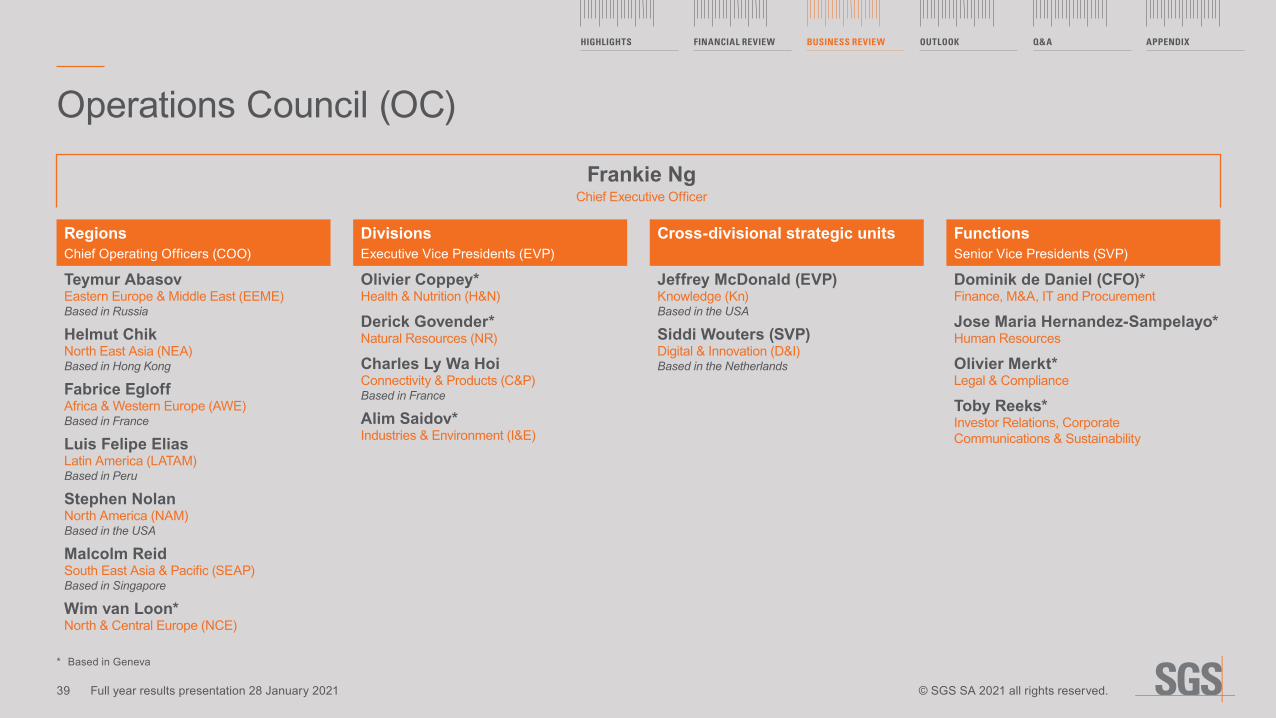
Operations Council (OC)
DivisionsExecutive Vice Presidents (EVP)
Cross-divisional strategic units FunctionsSenior Vice Presidents (SVP)
RegionsChief Operating Officers (COO)
Teymur AbasovEastern Europe & Middle East (EEME)Based in Russia
Helmut ChikNorth East Asia (NEA)Based in Hong Kong
Fabrice EgloffAfrica & Western Europe (AWE)Based in France
Luis Felipe EliasLatin America (LATAM)Based in Peru
Stephen NolanNorth America (NAM)Based in the USA
Malcolm ReidSouth East Asia & Pacific (SEAP)Based in Singapore
Wim van Loon*North & Central Europe (NCE)
Olivier Coppey*Health & Nutrition (H&N)
Derick Govender*Natural Resources (NR)
Charles Ly Wa HoiConnectivity & Products (C&P)Based in France
Alim Saidov*Industries & Environment (I&E)
Jeffrey McDonald (EVP)Knowledge (Kn)Based in the USA
Siddi Wouters (SVP)Digital & Innovation (D&I)Based in the Netherlands
Dominik de Daniel (CFO)*Finance, M&A, IT and Procurement
Jose Maria Hernandez-Sampelayo* Human Resources
Olivier Merkt* Legal & Compliance
Toby Reeks* Investor Relations, Corporate Communications & Sustainability
Frankie NgChief Executive Officer
* Based in Geneva
39
HIGHLIGHTS FINANCIAL REVIEW BUSINESS REVIEW OUTLOOK Q&A APPENDIX
Full year results presentation 28 January 2021 © SGS SA 2021 all rights reserved.

OUTLOOK
HIGHLIGHTS FINANCIAL REVIEW BUSINESS REVIEW OUTLOOK Q&A APPENDIX
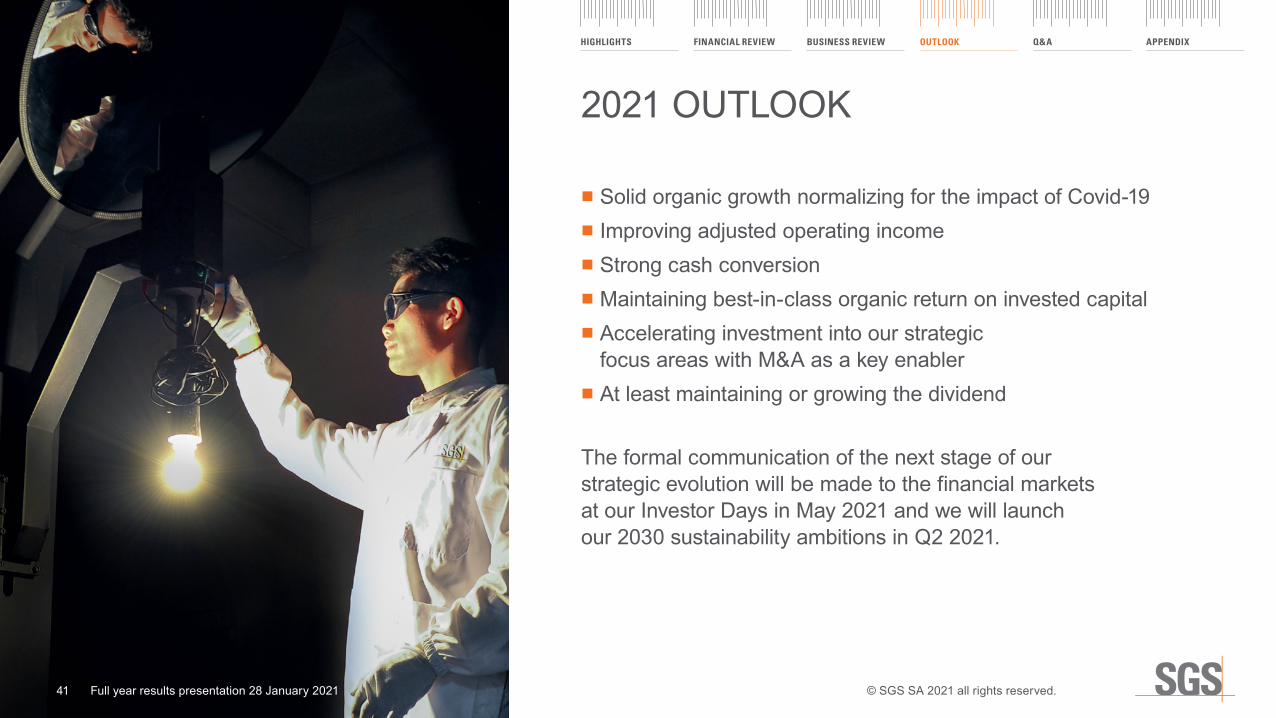
■ Solid organic growth normalizing for the impact of Covid-19 ■ Improving adjusted operating income ■ Strong cash conversion ■ Maintaining best-in-class organic return on invested capital ■ Accelerating investment into our strategic focus areas with M&A as a key enabler
■ At least maintaining or growing the dividend
The formal communication of the next stage of our strategic evolution will be made to the financial markets at our Investor Days in May 2021 and we will launch our 2030 sustainability ambitions in Q2 2021.
2021 OUTLOOK
HIGHLIGHTS FINANCIAL REVIEW BUSINESS REVIEW OUTLOOK Q&A APPENDIX
© SGS SA 2021 all rights reserved.41 Full year results presentation 28 January 2021

Q&A
HIGHLIGHTS FINANCIAL REVIEW BUSINESS REVIEW OUTLOOK Q&A APPENDIX

TO REGISTER FOR QUESTIONS PRESS * AND 1 ON YOUR TELEPHONE
HIGHLIGHTS FINANCIAL REVIEW BUSINESS REVIEW OUTLOOK Q&A APPENDIX

APPENDIX
HIGHLIGHTS FINANCIAL REVIEW BUSINESS REVIEW OUTLOOK Q&A APPENDIX
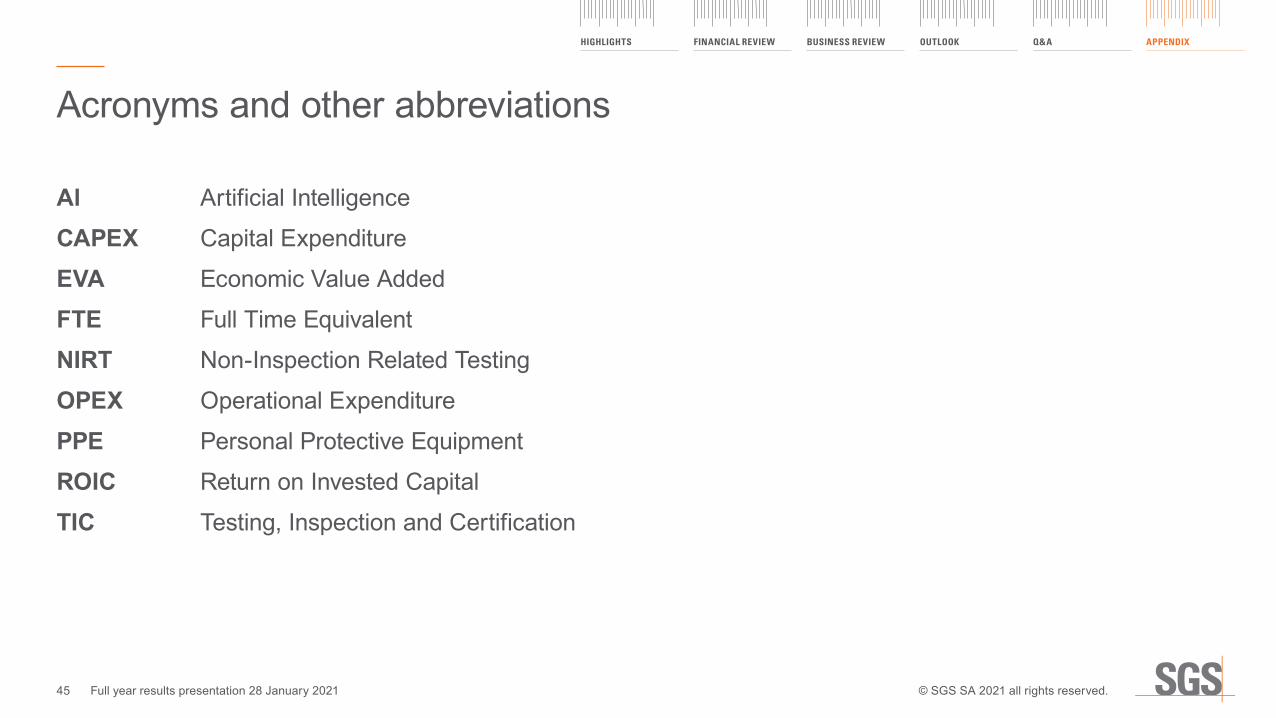
Al Artificial IntelligenceCAPEX Capital ExpenditureEVA Economic Value AddedFTE Full Time Equivalent NIRT Non-Inspection Related TestingOPEX Operational ExpenditurePPE Personal Protective EquipmentROIC Return on Invested CapitalTIC Testing, Inspection and Certification
Acronyms and other abbreviations
45
HIGHLIGHTS FINANCIAL REVIEW BUSINESS REVIEW OUTLOOK Q&A APPENDIX
Full year results presentation 28 January 2021 © SGS SA 2021 all rights reserved.

Long-term shareholder value creation
REVENUE CHF BN2020 | 5.6
2019 | 6.6
2018 | 6.7
2017 | 6.3
2016 | 6.0
RETURN ON INVESTED CAPITAL1,* %2020 | 16.5
2019 | 25.2
2018 | 24.2
2017 | 21.3
2016 | 19.3
ADJUSTED OPERATING INCOME* CHF MIO 2020 | 900
2019 | 1 063
2018 | 1 050
2017 | 969
2016 | 919
PAYOUT RATIO* %2020 | 125
2019 | 92
2018 | 92
2017 | 91
2016 | 98
FREE CASH FLOW CHF MIO
2020 | 758
2019 | 673
2018 | 796
2017 | 706
2016 | 738
NET PROFIT CHF MIO 2020 | 505
2019 | 702
2018 | 690
2017 | 664
2016 | 586
1. 2020 ROIC at 20.9% when adjusted from SYNLAB Analytics & Services (A&S) acquisition completed on 31 December 2020* Alternative Performance Measures (APM), refer to the "2020 Full Year APM document"
20.9
46
HIGHLIGHTS FINANCIAL REVIEW BUSINESS REVIEW OUTLOOK Q&A APPENDIX
Full year results presentation 28 January 2021 © SGS SA 2021 all rights reserved.

(CHF million)
Revenue H2 2019
Organic Acquisitions Disposals Currency impact
Revenue H2 2020
3 25911
(78)(12) (226)
2 954
(0.4%) (6.8%) (9.4%) (2.6%) 0.4%
Constant currency* (2.6%)
A resilient performance in H2H2 2020 revenue composition
1. Constant currency (CCY)** Alternative Performance Measures (APM), refer to the "2020 Full Year APM document"
47
HIGHLIGHTS FINANCIAL REVIEW BUSINESS REVIEW OUTLOOK Q&A APPENDIX
Full year results presentation 28 January 2021 © SGS SA 2021 all rights reserved.
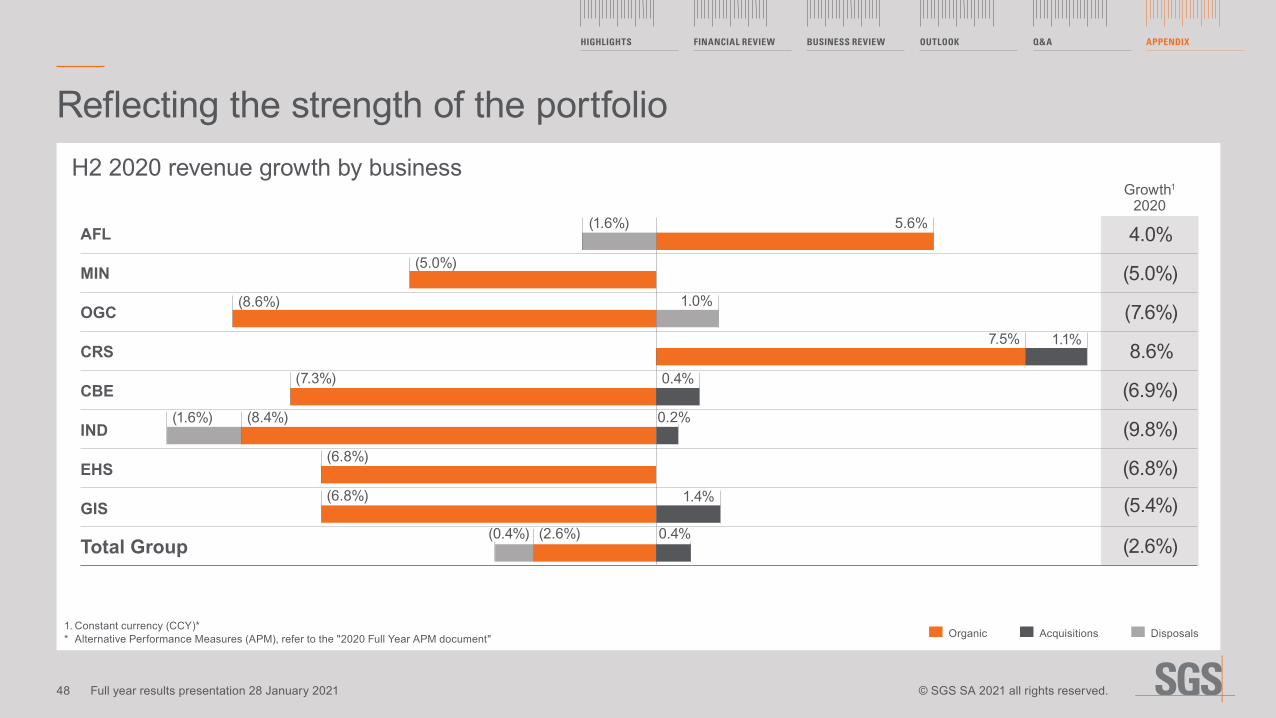
(5.0%)
(8.6%)
(0.4%)
(1.6%)
1.0%
4.0%
(5.0%)
(7.6%)
8.6%
(6.9%)
(9.8%)
(6.8%)
(5.4%)
(2.6%)
5.6%
7.5%
(8.4%)
(6.8%)
(7.3%)
(6.8%)
0.2%
0.4%
0.0%
1.4%
(2.6%) 0.4%
1.1%
Reflecting the strength of the portfolio
(1.6%)
H2 2020 revenue growth by business
AFL
MIN
OGC
CRS
CBE
IND
EHS
GIS
Total Group
1. Constant currency (CCY)** Alternative Performance Measures (APM), refer to the "2020 Full Year APM document" Organic Acquisitions Disposals
Growth1
2020
48
HIGHLIGHTS FINANCIAL REVIEW BUSINESS REVIEW OUTLOOK Q&A APPENDIX
Full year results presentation 28 January 2021 © SGS SA 2021 all rights reserved.
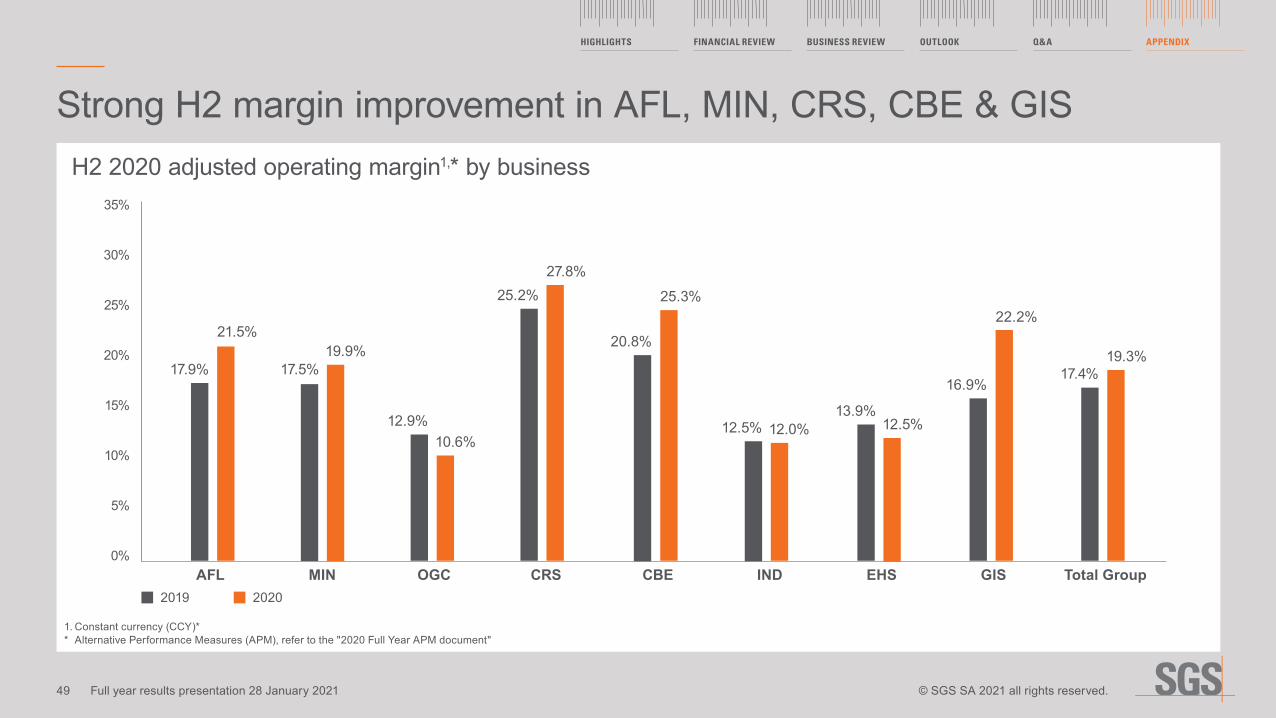
Strong H2 margin improvement in AFL, MIN, CRS, CBE & GIS
1. Constant currency (CCY)** Alternative Performance Measures (APM), refer to the "2020 Full Year APM document"
17.9% %
21.5% %
17.5%19.9% %
12.9%10.6% %
25.2% %27.8% %
20.8% %
25.3% %
12.5% 12.0% %13.9% %
16.9%
22.2% %
17.4%19.3% %
35%
30%
25%
20%
15%
10%
5%
0%AFL MIN OGC CRS CBE IND EHS GIS Total Group
2019 2020
H2 2020 adjusted operating margin1,* by business
12.5% %
49
HIGHLIGHTS FINANCIAL REVIEW BUSINESS REVIEW OUTLOOK Q&A APPENDIX
Full year results presentation 28 January 2021 © SGS SA 2021 all rights reserved.

Adjusted operating income margin improvement in H2 2020H2 2020 financial highlights
(CHF million)H2
2020H2
2019Change
in %H2
2019 CCY1Change in
CCY1 %
REVENUE 2 954 3 259 (9.4) 3 033 (2.6)OPERATING INCOME (EBIT) 493 446 10.5 400 23.3OPERATING INCOME (EBIT) MARGIN 16.7% 13.7% 13.2%ADJUSTED OPERATING INCOME* 570 574 (0.7) 527 8.2ADJUSTED OPERATING INCOME MARGIN* 19.3% 17.6% 17.4%PROFIT FOR THE PERIOD 328 303 8.3PROFIT ATTRIBUTABLE TO EQUITY HOLDERS OF SGS SA 309 283 9.2
1. Constant currency (CCY)** Alternative Performance Measures (APM), refer to the "2020 Full Year APM document"
50
HIGHLIGHTS FINANCIAL REVIEW BUSINESS REVIEW OUTLOOK Q&A APPENDIX
Full year results presentation 28 January 2021 © SGS SA 2021 all rights reserved.
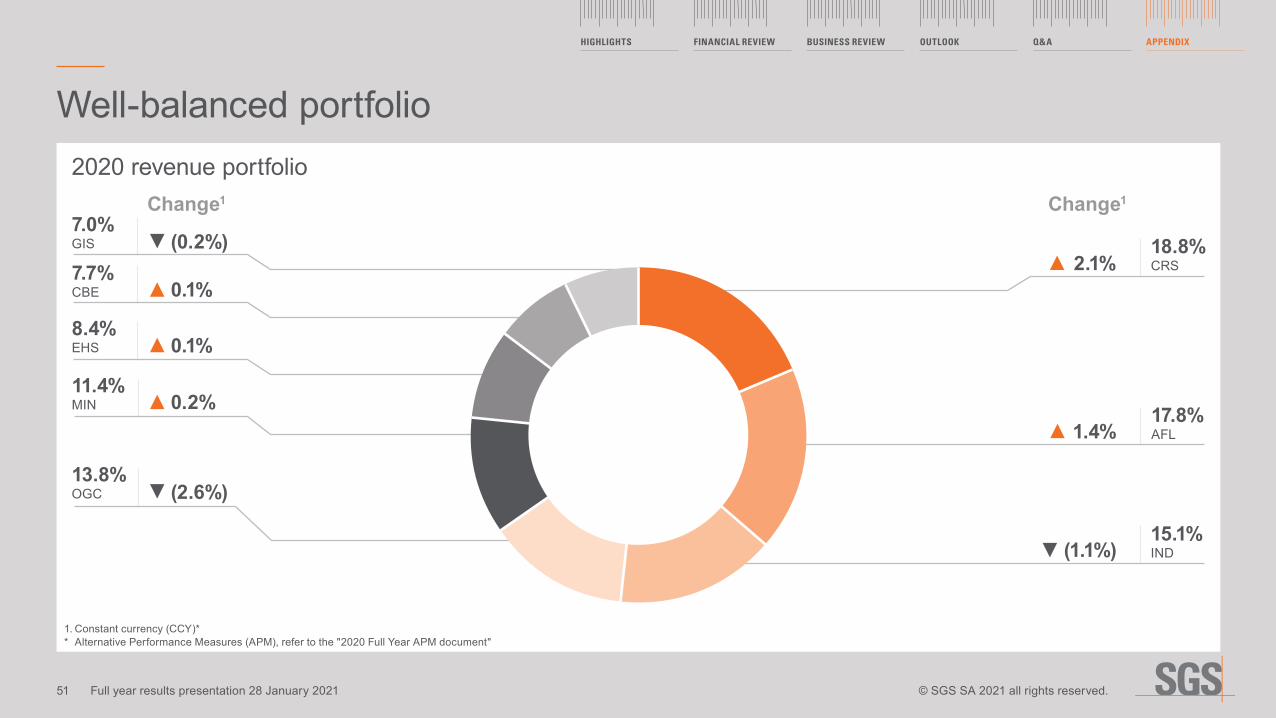
1. Constant currency (CCY)** Alternative Performance Measures (APM), refer to the "2020 Full Year APM document"
2020 revenue portfolio
Well-balanced portfolio
11.4%MIN 17.8%
AFL
18.8%CRS
13.8%OGC
15.1%IND
7.0%GIS
8.4%EHS
7.7%CBE
(0.2%)
Change1
0.1%
0.1%
0.2%
2.1%
Change1
1.4%
(1.1%)
(2.6%)
51
HIGHLIGHTS FINANCIAL REVIEW BUSINESS REVIEW OUTLOOK Q&A APPENDIX
Full year results presentation 28 January 2021 © SGS SA 2021 all rights reserved.

2020 adjusted operating income* portfolio
1. Constant currency (CCY)** Alternative Performance Measures (APM), refer to the "2020 Full Year APM" document
Well-balanced portfolio
12.3%MIN
19.4%AFL
29.3%CRS
8.4%OGC
8.0%IND
8.7%GIS
4.7%EHS
9.2%CBE
(1.7%)Change1
(2.7%)
(2.7%)
(0.2%)
3.4%
Change1
2.9%0.4%
0.6%
52
HIGHLIGHTS FINANCIAL REVIEW BUSINESS REVIEW OUTLOOK Q&A APPENDIX
Full year results presentation 28 January 2021 © SGS SA 2021 all rights reserved.
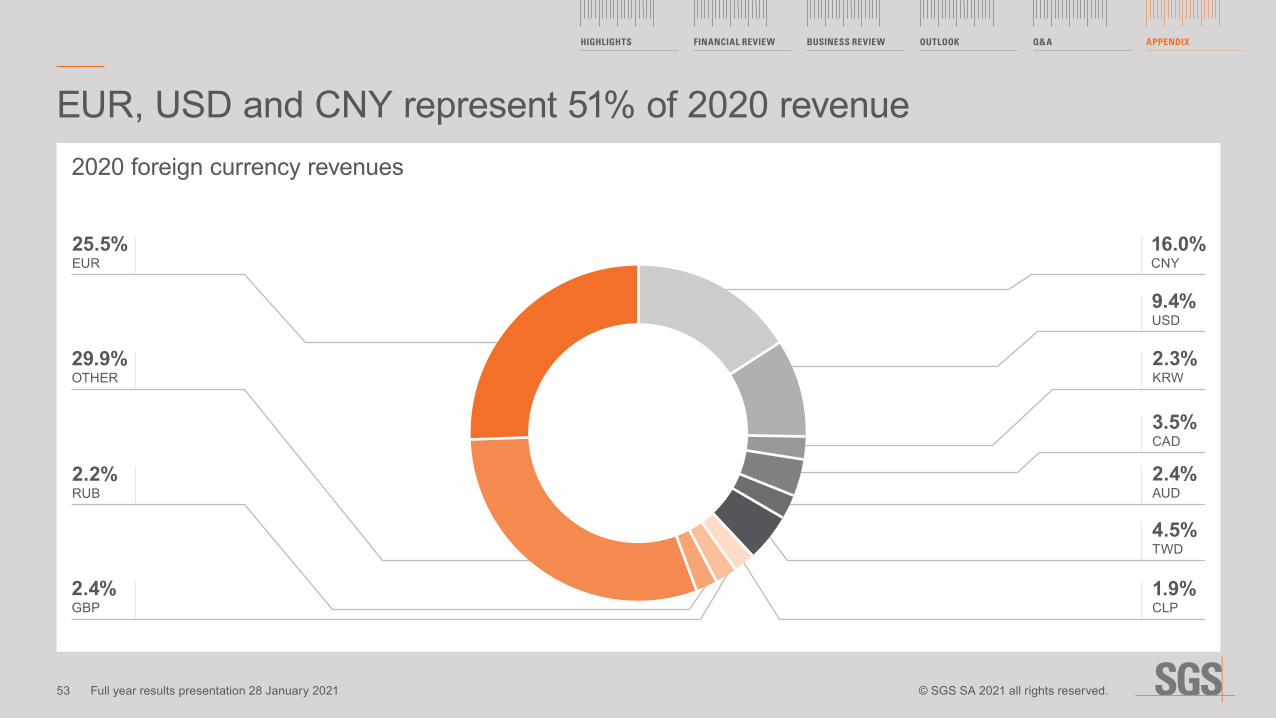
EUR, USD and CNY represent 51% of 2020 revenue2020 foreign currency revenues
25.5%EUR
29.9%OTHER
2.2%RUB
2.4%GBP
16.0%CNY
2.3%KRW
3.5%CAD
1.9%CLP
9.4%USD
2.4%AUD
4.5%TWD
53
HIGHLIGHTS FINANCIAL REVIEW BUSINESS REVIEW OUTLOOK Q&A APPENDIX
Full year results presentation 28 January 2021 © SGS SA 2021 all rights reserved.

Currencies' depreciation against CHF in 2020Foreign currency average rate change 2020 versus 2019 rate
(3.8%)(5.5%)
(0.9%)
(6.5%) (6.3%) (5.1%)(6.7%)
(14.8%)(16.3%)
(5.5%)
1.0704 0.1360 0.9392 0.0319 0.7005 0.6475 1.2047 0.0008 0.0131 0.00121.1129 0.1440 0.9938 0.0322 0.7489 0.6911 1.2688 0.0009 0.0154 0.0014 (3.8%) (5.5%) (5.5%) (0.9%) (6.5%) (6.3%) (5.1%) (6.7%) (14.8%) (16.3%)
5%
0%
(5%)
(10%)
(15%)
(20%)
EUR CNY USD TWD CAD AUD GBP KRW RUB CLP 2020
2019
Change
54
HIGHLIGHTS FINANCIAL REVIEW BUSINESS REVIEW OUTLOOK Q&A APPENDIX
Full year results presentation 28 January 2021 © SGS SA 2021 all rights reserved.

Investor relations information and events dates
SGS SA CORPORATE OFFICE 1 place des Alpes P.O. Box 2152 CH – 1211 Geneva 1 t +41 (0)22 739 91 11 f +41 (0)22 739 98 86 e [email protected]
INVESTOR RELATIONSToby Reeks SGS SA 1 place des Alpes P.O. Box 2152 CH – 1211 Geneva 1 t +41 (0)22 739 99 87 m +41 (0)79 641 83 02
MEDIA RELATIONSDaniel Rufenacht SGS SA 1 place des Alpes P.O. Box 2152 CH – 1211 Geneva 1 t +41 (0)22 739 94 01 m +41 (0)78 656 94 59
STOCK EXCHANGE TRADINGSIX Swiss Exchange
COMMON STOCK SYMBOLSBloomberg: Registered Share: SGSN.SW Reuters: Registered Share: SGSN.S Telekurs: Registered Share: SGSN ISIN: Registered Share: CH0002497458 Swiss security number: 249745
STOCK EXCHANGE LISTINGSIX Swiss Exchange, SGSN
INVESTOR DAYS Thursday and Friday 27 – 28 May 2021
2021 HALF YEAR RESULTSMonday, 19 July 2021
ANNUAL GENERAL MEETING OF SHAREHOLDERSTuesday, 23 March 2021 Geneva, Switzerland
55
HIGHLIGHTS FINANCIAL REVIEW BUSINESS REVIEW OUTLOOK Q&A APPENDIX
Full year results presentation 28 January 2021 © SGS SA 2021 all rights reserved.

www.sgs.com
THANK YOU
SGS is a registered trademark of SGS Société Générale de Surveillance SA