shadowstats bullet edition number ten freight, …
TRANSCRIPT

Copyright 2019 Shadow Government Statistics, Walter J. Williams, www.shadowstats.com 1
SHADOWSTATS BULLET EDITION NUMBER TEN
May 22, 2019
____________
FREIGHT, PRODUCTION, RETAIL, CONSTRUCTION, CONSUMER OPTIMISM
Economic Downturn Continued into Second-Quarter 2019;
Faltering April Freight Volume Presaged Declines in Production and Retail Sales
April Manufacturing Turned Negative Year-to-Year for First Time Since 2015,
When Freight Volume Also Turned Negative, Signaling the Onset of an
Unofficial Double-Dip Recession in Production and Manufacturing
Production and Manufacturing Suffered Heavy Downside Revisions
Along With Unexpected Sharp Declines in April Activity
April Single-Unit Building Permits Signaled an Unexpected Deepening Downturn
April Existing-Home Sales Declined Month-to-Month and Year-to Year
Fourth-Quarter 2018 and First-Quarter 2019 Quarterly Contractions in
Real Retail Sales Held in Place, Along With an Unexpected, Sharp April Decline
Shutdown-Disrupted Retail Sales Data Remain of Suspect Quality
Latest Round of Economic Data Implied Downside Revisions to
First-Quarter 2019 GDP, With an Intensifying Second-Quarter Downturn
Surging Consumer Optimism Tends to Mirror the Tone of the Popular Press
Market Sentiment Should Continue Shifting Towards Renewed Fed Easing
____________
Shadow Government Statistics — Bullet Edition No. 10 — May 22, 2019
Copyright 2019 Shadow Government Statistics, Walter J. Williams, www.shadowstats.com 2
____________________
Note to Subscribers: Special Commentary No. 983-B of April 22nd provided extended coverage of the
ShadowStats’ broad outlook for the U.S. economy and financial markets, with the current economic
circumstance updated in Bullet Edition No. 7, No. 8, No. 9 and today’s missive. The forecast of a formal
new recession has not changed materially, and the major points in No. 983-B remain intact. “Advance”
first-quarter GDP reporting of 3.2% was overstated meaningfully against underlying economic reality,
likely due to government-shutdown distortions and disruptions to headline economic data. Discussed in
the Overview, unusually large and sharp downside revisions to first-quarter GDP are a fair bet, given
major significant revisions just seen with April Industrial Production, and as likely will follow with
pending annual benchmark revisions to Retail Sales and other series. The potential remains in play for an
outright quarterly contraction in the GDP, in revision, as will be assessed more fully in the context of
pending series revisions and hard reporting in the weeks ahead.
The ShadowStats general outlook has not changed, specifically including a deepening U.S. economic
downturn, mounting downside pressures on the U.S. dollar and stock market, and upside pressures
on gold and silver prices in the weeks and months ahead.
Your comments and suggestions are invited; always happy to discuss what is happening.
Best Wishes — John Williams (707) 763-5786, [email protected]
____________________
ShadowStats Commentaries, Bullet Editions, Watches and Daily Updates:
The Daily Update posts regularly on the ShadowStats home page (www.ShadowStats.com),
covering major economic releases as published by the issuing authorities, usually within two-to-
three hours of the headline publication. Unusual market circumstances, as well as the pending
ShadowStats publishing schedule also are covered.
The Bullet Edition publishes multiple times per month, as dictated by economic and financial-
market developments. Simply put, the Bullet Edition conveys brief communications and
analyses on topics of particular near-term significance.
o Today’s Bullet Edition reviews major economic releases of the last week and implications
for the near-term broad economic outlook.
Regular Commentaries should publish about once per month, providing a broader, more
comprehensive overview of unfolding conditions and likely developments, occasionally in the
context of a Special Commentary.
o Special Commentary No. 983-B posted April 22nd.
o Commentary No. 984 is planned to follow the May 30th First-Quarter 2019 GDP revision.
Hyperinflation and Consumer Liquidity Watches should update once per month, with alternating
updates roughly every other week. Consumer Liquidity Watch No. 6 should post May 28th.
All Current and Earlier Commentaries and other writings (back to 2004) are available in the
Archives Section, left-hand column of the ShadowStats Home Page (www.ShadowStats.com).
____________________

Shadow Government Statistics — Bullet Edition No. 10 — May 22, 2019
Copyright 2019 Shadow Government Statistics, Walter J. Williams, www.shadowstats.com 3
____________________
Contents – Bullet Edition No. 10
Overview: The Economy Keeps Turning Down 5 Key Data Disappointed Market Expectations 5 Consumer Sectors of Production and Housing Took Particularly Heavy Hits 5 The Consumer Directly Supports 72% of GDP 5 “Booming” GDP Will Prove Short Lived Without Consumer Support 5 Some Downside Revision to 1q2019 GDP Is Likely With the May 30th Second Estimate 5 FOMC Will Have to Reconsider an Easing in the Near Future 5 Freight Index and Capacity Utilization Signal Unfolding Recession 7
Graph 1: CASS Freight Index, Monthly Level and 12-Month Trailing Average Change (2000 to April 2019) ........................ 8
Graph 2: CASS Freight Index, Monthly Year-to-Year Percent Change (2000 to April 2019) .................................................. 8
Graph 3: Industrial Production – Manufacturing (January 2000 to April 2019) ..................................................................... 9
Graph 4: Manufacturing, Year-to-Year Percent Change Since (January 2000 to April 2019) ................................................. 9
Graph 5: Annual Benchmark Revisions to the Dominant Manufacturing Sector of Industrial Production ............................ 11
Graph 6: Utilization of Total U.S. Industrial Production and Manufacturing Capacity (NBER Recessions) ......................... 11
Graph 7: Utilization of Total U.S. Industrial Production and Manufacturing Capacity (Alternate Recessions) .................... 12
Graph 8: CASS Freight Index, Monthly, January 2000 to April 2019 (Alternate Recessions) ................................................ 12
Industrial and Consumer Activity Are In Sharp Decline 13
Table 1: Industrial Production by Major Sector ..................................................................................................................... 14
Graph 9: Index of Industrial Production, Full Historical Series, January 1919 to April 2019............................................... 15
Graph 10: Industrial Production, Full Historical Series, Year-to-Year Percent Change 1920 to Date ................................. 15
Graph 11: Manufacturing Sector, Full Historical Series, January 1919 to April 2019 .......................................................... 16
Graph 12: Manufacturing Sector, Full Historical Series, Year-to-Year Percent Change 1920 to Date ................................. 16
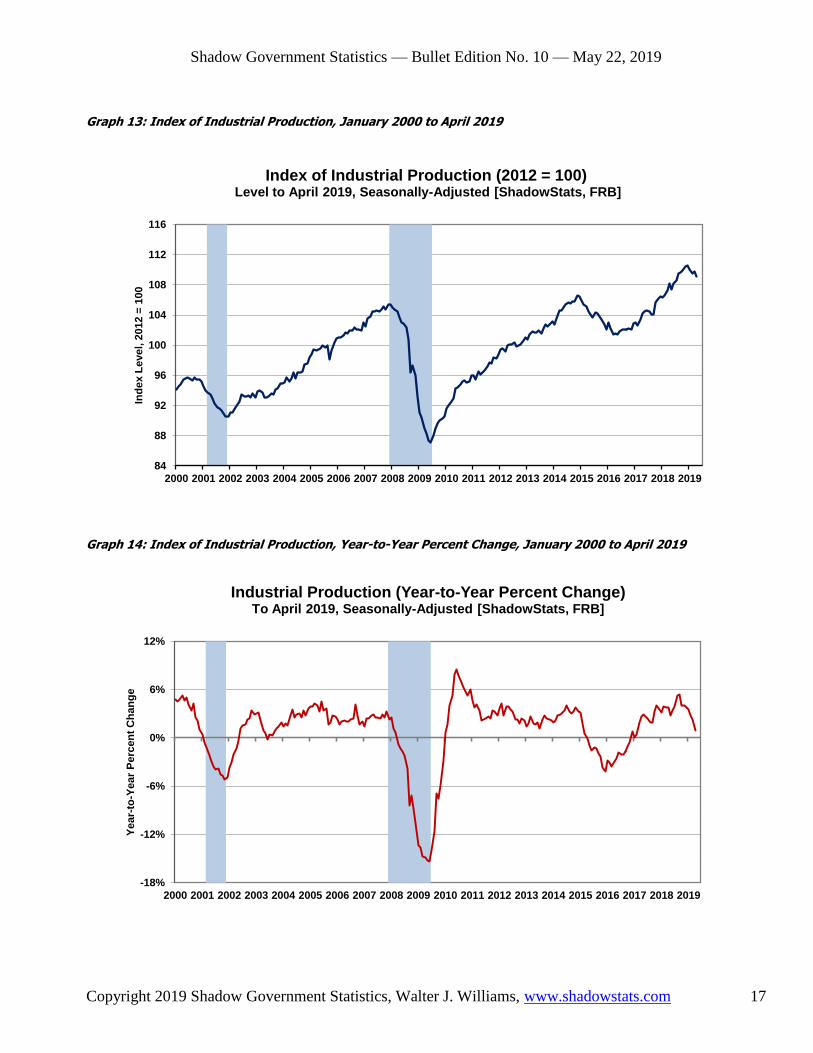
Graph 13: Index of Industrial Production, January 2000 to April 2019 ................................................................................. 17
Graph 14: Index of Industrial Production, Year-to-Year Percent Change, January 2000 to April 2019................................ 17
Graph 15: Industrial Production, Manufacturing Sector, January 2000 to April 2019 .......................................................... 18
Graph 16: Manufacturing Sector, Year-to-Year Percent Change, January 2000 to April 2019 ............................................. 18
Graph 17: Manufacturing, Consumer Goods Production, January 2000 to April 2019 ......................................................... 19
Graph 18: Consumer Goods Production, Year-to-Year Percent Change, January 2000 to April 2019 ................................. 19
Graph 19: Industrial Production, Mining Sector, January 2000 to April 2019 ...................................................................... 20
Graph 20: Mining Sector, Year-to-Year Percent Change, January 2000 to April 2019 ......................................................... 20
Graph 21: Industrial Production, Utilities Sector, January 2000 to April 2019 ..................................................................... 21
Graph 22: Utilities Sector, Year-to-Year Percent Change, January 2000 to April 2019 ........................................................ 21
Shadow Government Statistics — Bullet Edition No. 10 — May 22, 2019
Copyright 2019 Shadow Government Statistics, Walter J. Williams, www.shadowstats.com 4
April 2019 Nominal and Real Retail Sales Declined, Despite Positive Expectations 22 Real Quarterly Retail Sales Contractions Held in Place for 4q2018 and 1q2019 22 Pattern Not Seen Since Depths of the Great Recession 22
Graph 23: Real Retail Sales (1947 to April 2019) ................................................................................................................... 23
Graph 24: Real Retail Sales , Year-to-Year Change (1948 to April 2019) .............................................................................. 23
Graph 25: Real Retail Sales Level, Deflated by Headline CPI-U (2000 to April 2019) ......................................................... 24
Graph 26: Real Retail Sales, Year-to-Year Change (January 2000 to April 2019)................................................................. 24
Existing-Home Sales Notched Lower, Continuing in Broad Annual Downtrend 25
Graph 27: Existing-Home Sales, Monthly Level to April 2019 ............................................................................................... 25
Graph 28: Existing-Home Sales, Six-Month Moving Average Level to April 2019 ................................................................. 26
Single-Unit Housing Construction in a Downtrend Not Seen Since the Great Recession 26
Graph 29: Housing Starts, Annual Unit Rate by Month, 1946 to April 2019 .......................................................................... 28
Graph 30: Housing Starts, Smoothed 6-Month Moving Average Annual Rate, 1946 to April 2019 ....................................... 28
Graph 31: Housing Starts, January 2000 to April 2019 .......................................................................................................... 29
Graph 32: Housing Starts, Year-to-Year Percent Change, January 2000 to April 2019 ........................................................ 29
Graph 33: Housing Starts, Six-Month Smoothed Average, January 2000 to April 2019 ........................................................ 30
Graph 34: Housing Starts, Six-Month Smoothed Average, Year-to-Year Percent Change ..................................................... 30
Graph 35: Real Value of Private Residential Construction Put in Place (2000 to March 2019) ............................................ 31
Graph 36: Year-to-Year Change in Real Residential Construction Spending (2000 to March 2019)..................................... 31
Graph 37: Single-Unit Building Permits versus Housing Starts, January 2000 to April 2019 ............................................... 32
Graph 38: Single-Unit Building Permits vs. Housing Starts, Yr-to-Yr Percent Change, January 2000 to April 2019 ........... 32
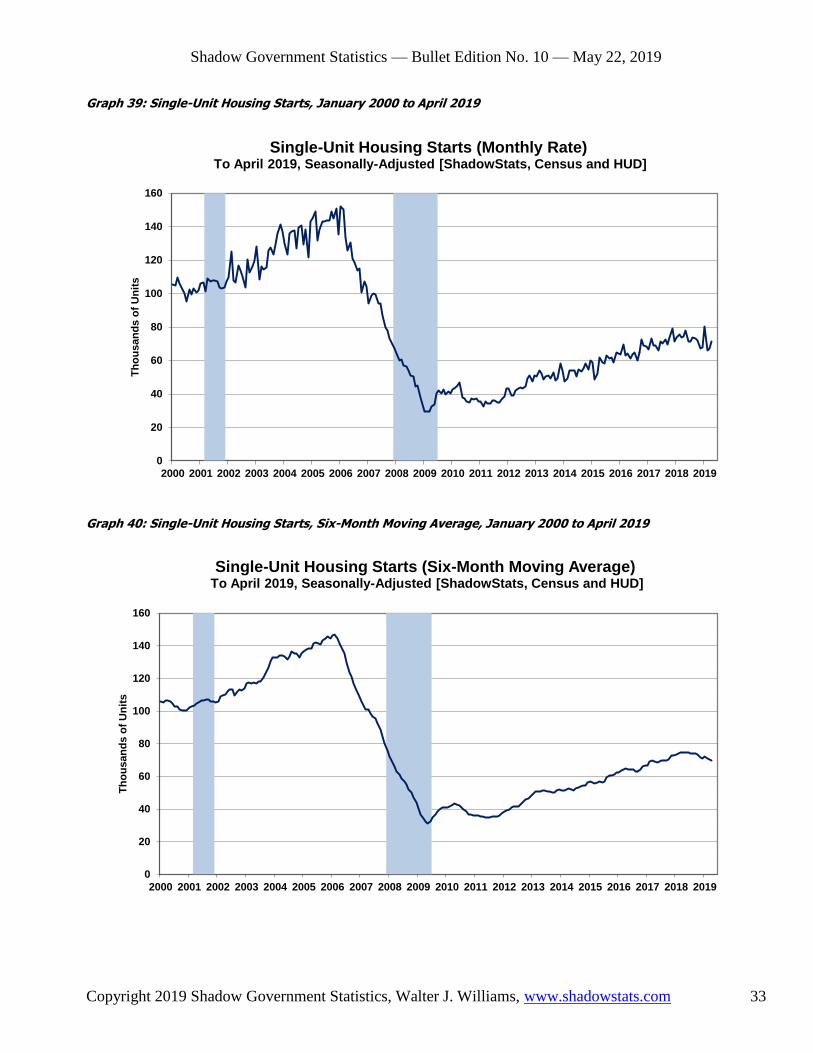
Graph 39: Single-Unit Housing Starts, January 2000 to April 2019 ...................................................................................... 33
Graph 40: Single-Unit Housing Starts, Six-Month Moving Average, January 2000 to April 2019 ........................................ 33
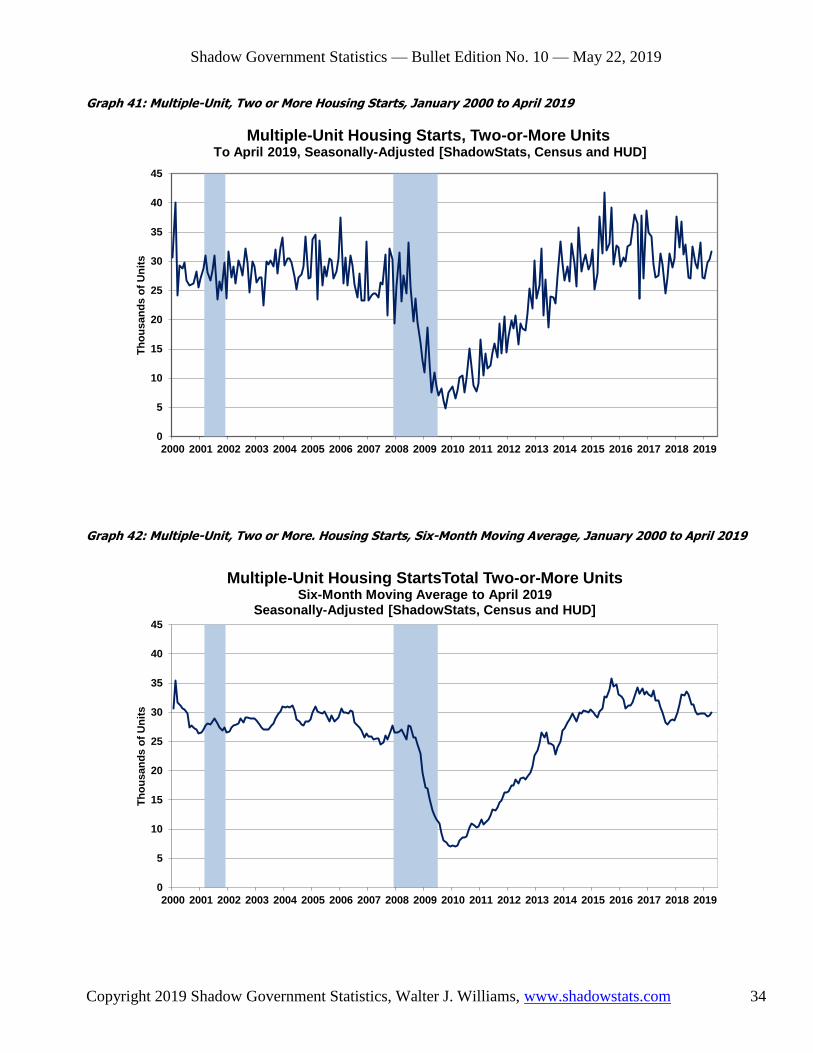
Graph 41: Multiple-Unit, Two or More Housing Starts, January 2000 to April 2019 ............................................................ 34
Graph 42: Multiple-Unit, Two or More. Housing Starts, Six-Month Moving Average, January 2000 to April 2019 ............. 34
Graph 43: Monthly Housing Starts by Segment, January 2000 to April 2019 ........................................................................ 35
Graph 44: Six-Month Smoothed Monthly Housing Starts by Segment, January 2000 to April 2019 ...................................... 35
Graph 45: Monthly Building Permits, January 2000 to April 2019 ........................................................................................ 36
Graph 46: Smoothed Monthly Building Permits, January 2000 to April 2019 ....................................................................... 36
Consumer Surveying Showed Booming Optimism 37 Often a Lagging Indicator of Stock Market and Economic Activity 37 The Major Series Tend to Mimic the Tone of the Popular Press 37
Graph 47: Consumer Confidence (January 2000 to April 2019) ............................................................................................ 38
Graph 48: Consumer Sentiment (January 2000 to Early-May 2019) ...................................................................................... 38
____________________

Shadow Government Statistics — Bullet Edition No. 10 — May 22, 2019
Copyright 2019 Shadow Government Statistics, Walter J. Williams, www.shadowstats.com 5
Overview: The Economy Keeps Turning Down
Key Data Disappointed Market Expectations
Consumer Sectors of Production and Housing Took Particularly Heavy Hits
The Consumer Directly Supports 72% of GDP
“Booming” GDP Will Prove Short Lived Without Consumer Support
Some Downside Revision to 1q2019 GDP Is Likely With the May 30th Second Estimate
FOMC Will Have to Reconsider an Easing in the Near Future
April 2019 Industrial Production, Retail Sales and New Residential Construction All Showed
Deteriorating Consumer Activity Continuing Into Second-Quarter 2019. Against flat-to-positive
consensus expectations for April Production and Manufacturing, both series declined in the month by
0.5% (-0.5%), on top of downside revisions to earlier months. First-quarter 2019 quarterly contractions
deepened in revision, with second-quarter activity starting on even deeper, negative trends for both series.
Discussed in the Industrial Production section, April Manufacturing turned negative year-to-year for the
first time since March 2015, with the headline series still shy of recovering its December 2007 pre-
recession peak by 4.9% (-4.9%), continuing its record string of 136 consecutive months of economic non-
expansion (a circumstance never seen previously in the 100-plus years of Manufacturing reporting, see
Graph 11). A major factor in recent downside revisions and intensified rates of decline in these series is
Manufacturing of Consumer Goods.
Retail Sales. Against expectations of a small positive gain in nominal April 2019 Retail Sales, nominal
sales fell in the month by 0.2% (-0.2%), including a 1.1% (-1.1%) drop in Automobile Sales. Net of
inflation, real April Retail Sales declined by 0.5% (-0.5%), with both fourth-quarter 2018 and first-quarter
2019 activity holding in their deepening, back-to-back real quarterly contractions (although April declined
versus March, it was higher than the first-quarter 2019 average, a potential uptrend going into second-
quarter activity). Discussed in the Retail Sales section, an unusual shift seen in monthly retail sales
revision activity raises questions as to the reporting-quality of the late-fourth-quarter 2018, and the bulk of
first-quarter 2019 government shutdown impacted Retail Sales surveying and reporting. The Annual
Retail Sales Benchmarking on June 25th (priot to the June 27th Third-Estimate of First-Quarter 2018
GDP, and one month before the July 26th Annual GDP Benchmarking) may well prove key to getting
more-realistic headline GDP numbers.

Shadow Government Statistics — Bullet Edition No. 10 — May 22, 2019
Copyright 2019 Shadow Government Statistics, Walter J. Williams, www.shadowstats.com 6
New Residential Construction. Against expectations of a sharp jump in April Housing Starts, Housing
Starts jumped in the context of their usual nonsense volatility and statistically meaningless gyrations.
Yet, there was one series that was statistically meaningful, Single-Unit Building Permits, mentioned by
Grant Noble in one of his recent letters. I have done some new analysis on that series in the later New
Residential Construction Spending section. The Single-Unit count (Permits or Starts) usually accounts
for roughly two-thirds of the aggregate total count (Multiple-Unit counts are wildly unstable in terms of
volatility and revisions). Single-Unit Permits is statistically more stable than the Starts series, less revised
and often significant in its initial reporting. It also has a 98% coincident (theoretically leading)
correlation with its Housing Starts counterpart, once that latter series stabilizes after three-to-four months
of revisions. Discussed and plotted later (Graphs 37 and 38), April 2019 Single-Unit Building Permits
declined for the fifth straight month, down monthly by 4.2% (-4.2%), down year-to-year by 9.4% (-9.4%).
Quarterly patterns have shown rapidly deepening quarter-to-quarter contractions from fourth-quarter
2018, to first-quarter 2019 and to early-trend second-quarter 2019.
Surveys of the Consumer Outlook. Discussed in the Consumer Surveying section, Consumer Sentiment
just jumped to a fifteen year high, with Consumer Confidence off peak, but also elevated in terms of
recent history. While that might seem incongruous in an environment of faltering economic activity, that
happens frequently, where Sentiment and Confidence often reflect the tone of the popular press.
May 30th Second Estimate of First-Quarter 2019 GDP Likely Will See Some Downside Revision;
Bigger Revisions Loom on June 27th and July 26th; FOMC Easing Remains Likely by September.
Shy of any startling negative revisions to April New Orders for Durable Goods reporting on May 24th,
most of the numbers affecting the second estimate of, first revision to First-Quarter 2019 GDP are in
place. The second estimate of first-quarter GDP likely will revise somewhat lower in the context of the
new Industrial Production numbers, and other data, including new estimates of the Services Sector. Yet,
as discussed in Bullet Edition No. 7, No. 8 and No. 9, and confirmed by April 2019 Industrial Production
revisions, there remains a missing component tied to weaker consumer activity. That has a fair shot of
surfacing in the Retail Sales benchmarking (see the earlier Retail Sales paragraph), or it could show up in
a much larger inventory buildup. In the latter case, there would be a downside revision to second-quarter
“Final Sales” (GDP net of Inventory Change).
Nonetheless, a recession is in play. That is an increasingly uncomfortable circumstance for the Federal
Reserve’s Federal Open Market Committee (FOMC), which likely should be easing, possibly with
renewed Quantitative Easing, by September 2019, despite current Fed protestations to the contrary. The
weakening economic numbers should intensify market expectations for same, increasingly hit the U.S.
stock market, the U.S. Dollar and boost gold and silver prices. As headline economic activity weakens
sharply, meaningful downtrends in the stocks and the dollar should become dominant, along with rallying
precious metals prices, as flight capital (domestic and foreign) increasingly seeks higher rates and safety
outside the dollar and U.S. assets.

Shadow Government Statistics — Bullet Edition No. 10 — May 22, 2019
Copyright 2019 Shadow Government Statistics, Walter J. Williams, www.shadowstats.com 7
Freight Index and Capacity Utilization Signal Unfolding Recession
The April 2019 CASS Freight Index™ Fell Year-to-Year at a Deepening Pace, and Its 12-Month
Moving Average Declined Month-to-Month—Both for the Fifth Straight Month, Signaling
Continued Economic Contraction into Second-Quarter 2019. An independent, reliable private
indicator of real-world economic activity and shifting business patterns, unadjusted annual growth in the
April 2019 Cass Freight Index™ declined year-to-year for the fifth straight month, down at a deepening
annual pace of 3.24% (-3.24%). Unadjusted year-to-year change is one approach to neutralize seasonality
effects on this unadjusted series. The smoothed 12-month-moving average for the Index, also used to
neutralize seasonality here, declined for the fifth month, too, having peaked in November 2018. Cass
published the April details on May 14th, and we thank them for their permission to plot and use the data.
Declining/slowing freight activity has not been seen like this since first-quarter 2015, the onset of an
unofficial recession for broad economic series such as Industrial Production, Manufacturing and New
Orders for Durable Goods. In tandem with those production-related series, and a large number of other
indicators, as reviewed in Special Commentary No. 983-B and updated here, the Freight Index did signal
slowing fourth-quarter 2018 economic activity, a downturn in first-quarter 2019 activity and an indication
of continuing downturn into second-quarter 2019. Those patterns foreshadowed and were consistent with
the “unexpected” monthly declines in April 2019 Industrial Production, Manufacturing and Retail Sales.
Graphs 1 and 2 are the standard ShadowStats graphs of the level of monthly activity and year-to-year
change published by ShadowStats. Where the monthly data are not seasonally adjusted, Graph 1 of the
unadjusted monthly activity and a 12-month trailing average of same are plotted together, the raw data
along with the 12-month moving average. Again, that latter graph should eliminate any seasonality
patterns. In like manner, Graph 2 plots year-to-year change in the unadjusted series, also eliminating
seasonality issues.
For comparison, consider Graphs 3 and 4, which plot the seasonally adjusted levels of and year-to-year
change in the dominant the Manufacturing Sector of Industrial Production. Of some note, April 2019
Manufacturing turned negative year-to-year. The last time that series turned negative was in March 2015,
the same month the CASS series turned negative, although the current downturn for the CASS series was
in December 2018.
[Graphs 1 to 4 begin on the next page.]

Shadow Government Statistics — Bullet Edition No. 10 — May 22, 2019
Copyright 2019 Shadow Government Statistics, Walter J. Williams, www.shadowstats.com 8
Graph 1: CASS Freight Index, Monthly Level and 12-Month Trailing Average Change (2000 to April 2019)
Graph 2: CASS Freight Index, Monthly Year-to-Year Percent Change (2000 to April 2019)
0
1
2
3
4
5
6
7
8
9
10
70
75
80
85
90
95
100
105
110
115
120
125
2000 2001 2002 2003 2004 2005 2006 2007 2008 2009 2010 2011 2012 2013 2014 2015 2016 2017 2018 2019
Ind
ex L
evel,
Jan
ua
ry 2
000 =
100
Cass Freight Index™ (Jan 2000 = 100) To April 2019, Not Seasonally Adjusted
[ShadowStats, Cass Information Systems, Inc.]
Official NBER-Defined Recession
Monthly Level, Not Seasonally Adjusted
12-Month Trailing Average
0
1
2
3
4
5
6
7
8
9
10
-30%
-25%
-20%
-15%
-10%
-5%
0%
5%
10%
15%
20%
25%
2000 2001 2002 2003 2004 2005 2006 2007 2008 2009 2010 2011 2012 2013 2014 2015 2016 2017 2018 2019
Year-
to-Y
ear
Ch
an
ge
Cass Freight Index™ (Year-to-Year Percent Change) Monthly to April 2019, Not Seasonally Adjusted [ShadowStats, Cass Information Systems, Inc.]

Shadow Government Statistics — Bullet Edition No. 10 — May 22, 2019
Copyright 2019 Shadow Government Statistics, Walter J. Williams, www.shadowstats.com 9
Graph 3: Industrial Production – Manufacturing (January 2000 to April 2019) [Same as Graph 15]
Graph 4: Manufacturing, Year-to-Year Percent Change Since (January 2000 to April 2019) [Same as Graph 16]
0
1
2
3
4
5
6
7
8
9
10
84
88
92
96
100
104
108
112
2000 2001 2002 2003 2004 2005 2006 2007 2008 2009 2010 2011 2012 2013 2014 2015 2016 2017 2018 2019
Ind
ex L
evel,
2012 =
100
Industrial Production - Manufacturing (SIC) (2012 = 100)
Level to April 2019, Seasonally-Adjusted [ShadowStats, FRB]
0
1
2
3
4
5
6
7
8
9
10
-20%
-16%
-12%
-8%
-4%
0%
4%
8%
12%
2000 2001 2002 2003 2004 2005 2006 2007 2008 2009 2010 2011 2012 2013 2014 2015 2016 2017 2018 2019
Year-
to-Y
ear
Perc
en
t C
ha
ng
e
Industrial Production - Manufacturing (Yr-to-Yr Percent Change) To April 2019, Seasonally-Adjusted [ShadowStats, FRB]

Shadow Government Statistics — Bullet Edition No. 10 — May 22, 2019
Copyright 2019 Shadow Government Statistics, Walter J. Williams, www.shadowstats.com 10
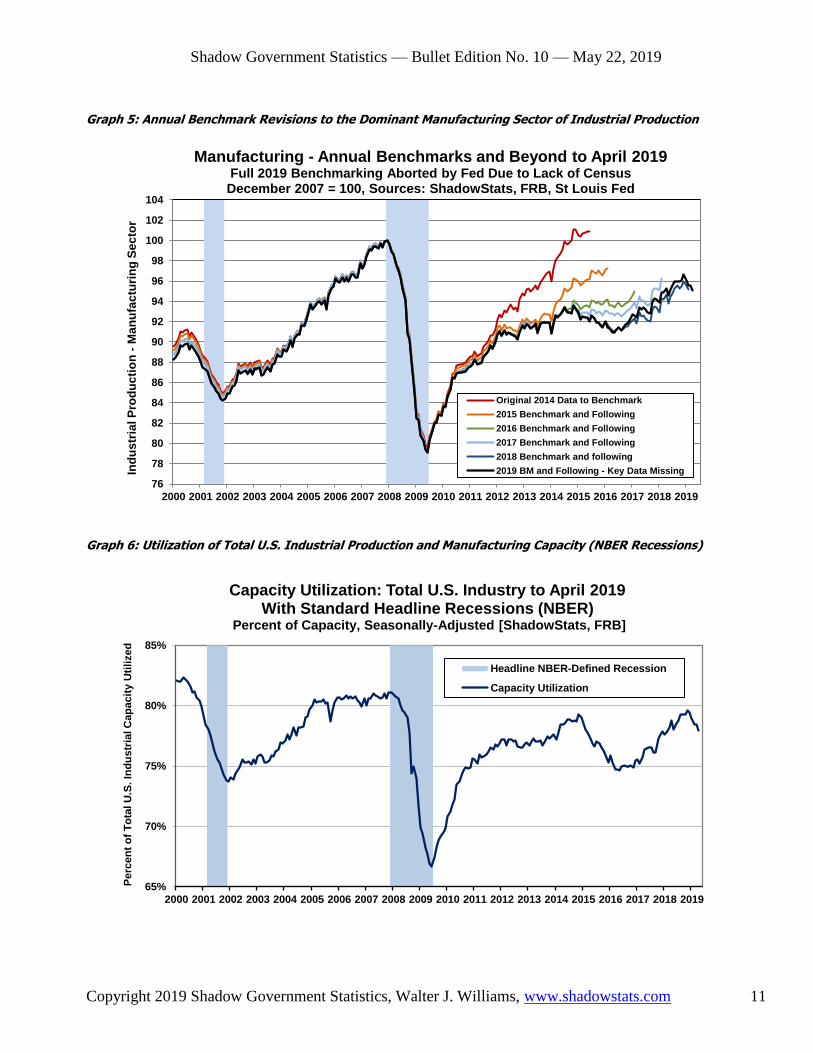
Alternate Business Cycle: April 2019 Freight Activity Is Signaling a New Recession Along with Series
Such as Production, Manufacturing and Capacity Utilization. Discussed most recently in, and updating
No. 983-B, considering Graphs 1 and 3, there appears to be a missing recession the historical record. The
missing formal recession began in first-quarter 2015, tied to the dominant Industrial Production and
Manufacturing sectors of the economy. It remains ShadowStats contention, that the missing recession
was not recognized, due largely to the late reporting of same only in the 2017, and particularly the 2018
benchmark revisions to those series, as shown explicitly in Graph 5 of the Manufacturing Benchmarkings
and Graph 6 of Capacity Utilization .
Consider that preceding Graph 1 here has been smoothed with a 12-month moving average to neutralize
the seasonality of the not-seasonally-adjusted Freight Series, while the Utilization /Production Series
(Graph 6) is seasonally adjusted on a monthly basis. Accordingly, the smoothed Freight Series would be
expected to lag the path of the Production/Capacity Series a bit, and it does.
Of interest here is that the pattern of Freight activity largely matches that of the Production-related
Capacity Series, although Freight and Production were separately surveyed, by different entities, and the
Freight Series did not go through the recent corrective benchmark revisions that were applied to the
Production Series.
Graphs 6 and 7 plot the current headline detail of Capacity Utilization through April 2019, with Graph 6
reflecting the shaded bars of headline formal recessions, as defined by the defining authority, the National
Bureau of Economic Research (NBER). Graph 7 reflects those headline recessions, along with what
ShadowStats suggests is a more accurate rendition of the 2014 to 2016 period, plus what appears to be
unfolding in the current circumstance, as discussed in Bullet Edition No. 4. Graphs 1 and 8 of the CASS
Freight IndexTM
show the same patterns.
Sharp Downturns in Capacity Utilization Usually Signal the Onset of a Recession. Where sharp
downturns in Manufacturing Utilization historically usually mark onsets of formal recessions, such would
support the concept of a renewed “headline” recession, a double-dip downturn that began at the end of
2014, as indicated by the Industrial Production series. That remains ShadowStats’ estimate of the timing
of a likely “headline” double-dip recession, which formally began at the end of 2007, bottomed in 2009,
peaked in late in 2014 and then bottomed anew in 2016, although—again— nothing confirming that
showed up in the 2018 comprehensive GDP benchmarking. Contrary to consensus hype of fully
recovered and expanding U.S. economic activity, again, as seen in the Manufacturing Sector, much of the
headline U.S. economy never has recovered fully from the 2007 downturn. Separately, current headline
detail is showing what likely is unfolding as a new downturn in economic activity. April 2019 Capacity
Utilization declined to a fourteen-month low of 77.9%, on top of downwardly revised history, down from
78.5% [previously 78.8%] in March, and down from an unrevised November 2018 peak 79.6%, which
likely will be designated as the pre-recession peak.
[Graphs 5 to 8 begin on the next page.]
Shadow Government Statistics — Bullet Edition No. 10 — May 22, 2019
Copyright 2019 Shadow Government Statistics, Walter J. Williams, www.shadowstats.com 11
Graph 5: Annual Benchmark Revisions to the Dominant Manufacturing Sector of Industrial Production
Graph 6: Utilization of Total U.S. Industrial Production and Manufacturing Capacity (NBER Recessions)
0
1
2
3
4
5
6
7
8
9
10
76
78
80
82
84
86
88
90
92
94
96
98
100
102
104
2000 2001 2002 2003 2004 2005 2006 2007 2008 2009 2010 2011 2012 2013 2014 2015 2016 2017 2018 2019
Ind
us
tria
l P
rod
uc
tio
n -
Ma
nu
fac
turi
ng
Se
cto
r
Manufacturing - Annual Benchmarks and Beyond to April 2019 Full 2019 Benchmarking Aborted by Fed Due to Lack of Census December 2007 = 100, Sources: ShadowStats, FRB, St Louis Fed
Original 2014 Data to Benchmark
2015 Benchmark and Following
2016 Benchmark and Following
2017 Benchmark and Following
2018 Benchmark and following
2019 BM and Following - Key Data Missing
0
1
2
3
4
5
6
7
8
9
10
65%
70%
75%
80%
85%
2000 2001 2002 2003 2004 2005 2006 2007 2008 2009 2010 2011 2012 2013 2014 2015 2016 2017 2018 2019
Perc
en
t o
f T
ota
l U
.S. In
du
str
ial C
ap
acit
y U
tili
zed
Capacity Utilization: Total U.S. Industry to April 2019 With Standard Headline Recessions (NBER)
Percent of Capacity, Seasonally-Adjusted [ShadowStats, FRB]
Headline NBER-Defined Recession
Capacity Utilization

Shadow Government Statistics — Bullet Edition No. 10 — May 22, 2019
Copyright 2019 Shadow Government Statistics, Walter J. Williams, www.shadowstats.com 12
Graph 7: Utilization of Total U.S. Industrial Production and Manufacturing Capacity (Alternate Recessions)
Graph 8: CASS Freight Index, Monthly, January 2000 to April 2019 (Alternate Recessions)
0
1
2
3
4
5
6
7
8
9
10
65%
70%
75%
80%
85%
2000 2001 2002 2003 2004 2005 2006 2007 2008 2009 2010 2011 2012 2013 2014 2015 2016 2017 2018 2019
Perc
en
t o
f T
ota
l U
.S. In
du
str
ial C
ap
acit
y U
tili
zed
Capacity Utilization: Total U.S. Industry to April 2019 With An Alternate Recession Definition
Percent of Capacity, Seasonally-Adjusted [ShadowStats, FRB]
Alternate Definition and Prospective Recession
Capacity Utilization
0
1
2
3
4
5
6
7
8
9
10
70
75
80
85
90
95
100
105
110
115
120
125
2000 2001 2002 2003 2004 2005 2006 2007 2008 2009 2010 2011 2012 2013 2014 2015 2016 2017 2018 2019
Ind
ex L
evel,
Jan
ua
ry 2
000 =
100
Cass Freight Index™ (Jan 2000 = 100) To April 2019, Not Seasonally Adjusted
[ShadowStats, Cass Information Systems, Inc.]
Alternate Definition and Prospective Recession
Monthly Level, Not Seasonally Adjusted
12-Month Trailing Average

Shadow Government Statistics — Bullet Edition No. 10 — May 22, 2019
Copyright 2019 Shadow Government Statistics, Walter J. Williams, www.shadowstats.com 13
Industrial and Consumer Activity Are In Sharp Decline
Contracting First-Quarter 2019 Production Deepened Meaningfully in Revision, With Second-
Quarter 2019 In Intensifying Downtrend; Manufacturing Turned Negative Year-to-Year for First
Time Since 2015. April 2019 Industrial Production and Manufacturing both dropped an unexpected
0.5% (-0.5%) in the month, on top of major downside revisions to first-quarter activity, as reported May
15th, by the Federal Reserve Board. April 2019 Manufacturing declined year-to-year for the first time
since early 2015, as signaled by, and consistent with the CASS Freight Index™, as previously discussed.
In like manner, although boosted by Oil Production in the Mining Sector, annual growth in aggregate
Production slowed to its weakest level since early 2017.
Consistent with the ShadowStats forecast for an unfolding new recession, beginning with a quarterly
contraction in first-quarter 2019 GDP (currently at 3.2%, but subject to sharp downside revisions), first-
quarter 2019 Industrial Production declined at a revised annualized pace of 1.9% (-1.9%), previously by
0.3% (-0.3%), on top of a downwardly revised fourth-quarter 2018 gain of 3.9% (previously 4.0%). Early
trend for second-quarter 2019 was a drop of 2.2% (-2.2%). Year-to-year, growth in Production slowed
from 4.0% in fourth-quarter 2018, to a revised 2.9% [previously 3.3%] in first-quarter 2019, to an early-
trend 1.2% in second-quarter 2019. In the dominant (75% of Production) Manufacturing Sector, fourth-
quarter 2018 annualized growth revised to 1.6% [previously 1.7%], plunged to a revised quarterly decline
of 2.1% (-2.1%) [previously 1.1% (-1.1%)] in first-quarter 2019, with an early-trend quarterly decline of
2.7% (-2.7%) and annual gain of just 0.1% in second-quarter 2019.
The unfolding 2019 recession was triggered by excessive Federal Reserve tightening, which has
constrained consumer liquidity and consumption. Weakness in the dominant personal consumption sector
of the economy usually spreads quickly throughout the system. Consumer Goods Production contracted
at a revised annualized 4.7% (-4.7%) [previously 3.8% (-3.8%)] in first-quarter 2019, versus a fourth-
quarter 2018 revised gain of 2.5% (previously 2.3%), with an early-trend second-quarter 2019 contracting
at an annualized 3.3% (-3.3%) with year-to-year change on track for a second-quarter 2019 annual decline
of 1.2% (-1.2%), following a drop of 0.3% (-0.3%) in first-quarter 2019 and annual gain of 1.5% in
fourth-quarter 2018. On the plus side, the Mining Sector gained at a slower, revised annualized pace of
2.6% [previously 4.4%] in first-quarter 2019, on early track for a second-quarter 2019 gain of 4.2%.
Again, however, the aggregate Production series showed a deepening quarterly decline.
Monthly details by sector follow in Table 1, which has been supplemented here with monthly detail on
theConsumer Goods Subsector of Manufacturing. Graphs 9 to 12 plot the full 100-plus year history of
Industrial Production and its dominant Manufacturing, with Graphs 13 to 17 showing those same series,
plus Consumer Goods Manufacturing for the period 2000 to date.
Shadow Government Statistics — Bullet Edition No. 10 — May 22, 2019
Copyright 2019 Shadow Government Statistics, Walter J. Williams, www.shadowstats.com 14
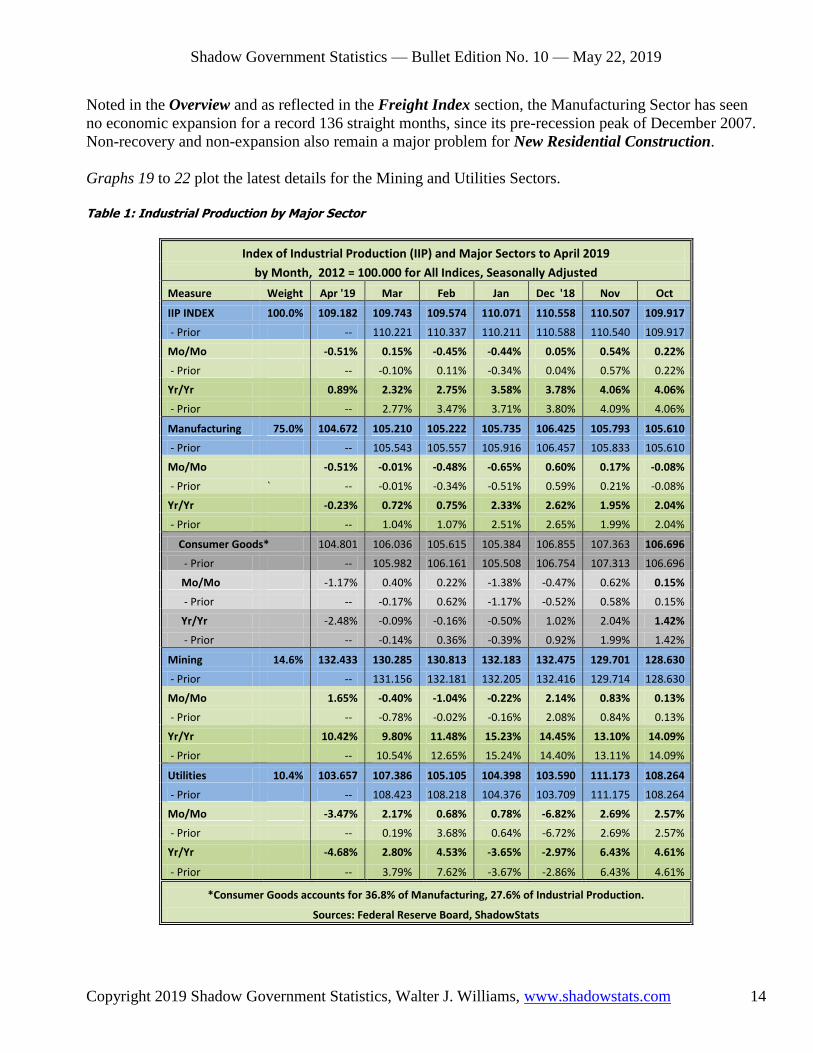
Noted in the Overview and as reflected in the Freight Index section, the Manufacturing Sector has seen
no economic expansion for a record 136 straight months, since its pre-recession peak of December 2007.
Non-recovery and non-expansion also remain a major problem for New Residential Construction.
Graphs 19 to 22 plot the latest details for the Mining and Utilities Sectors.
Table 1: Industrial Production by Major Sector
Index of Industrial Production (IIP) and Major Sectors to April 2019
by Month, 2012 = 100.000 for All Indices, Seasonally Adjusted
Measure Weight Apr '19 Mar Feb Jan Dec '18 Nov Oct
IIP INDEX 100.0% 109.182 109.743 109.574 110.071 110.558 110.507 109.917
- Prior -- 110.221 110.337 110.211 110.588 110.540 109.917
Mo/Mo -0.51% 0.15% -0.45% -0.44% 0.05% 0.54% 0.22%
- Prior -- -0.10% 0.11% -0.34% 0.04% 0.57% 0.22%
Yr/Yr 0.89% 2.32% 2.75% 3.58% 3.78% 4.06% 4.06%
- Prior -- 2.77% 3.47% 3.71% 3.80% 4.09% 4.06%
Manufacturing 75.0% 104.672 105.210 105.222 105.735 106.425 105.793 105.610
- Prior -- 105.543 105.557 105.916 106.457 105.833 105.610
Mo/Mo -0.51% -0.01% -0.48% -0.65% 0.60% 0.17% -0.08%
- Prior ` -- -0.01% -0.34% -0.51% 0.59% 0.21% -0.08%
Yr/Yr -0.23% 0.72% 0.75% 2.33% 2.62% 1.95% 2.04%
- Prior -- 1.04% 1.07% 2.51% 2.65% 1.99% 2.04%
Consumer Goods* 104.801 106.036 105.615 105.384 106.855 107.363 106.696
- Prior -- 105.982 106.161 105.508 106.754 107.313 106.696
Mo/Mo -1.17% 0.40% 0.22% -1.38% -0.47% 0.62% 0.15%
- Prior -- -0.17% 0.62% -1.17% -0.52% 0.58% 0.15%
Yr/Yr -2.48% -0.09% -0.16% -0.50% 1.02% 2.04% 1.42%
- Prior -- -0.14% 0.36% -0.39% 0.92% 1.99% 1.42%
Mining 14.6% 132.433 130.285 130.813 132.183 132.475 129.701 128.630
- Prior -- 131.156 132.181 132.205 132.416 129.714 128.630
Mo/Mo 1.65% -0.40% -1.04% -0.22% 2.14% 0.83% 0.13%
- Prior -- -0.78% -0.02% -0.16% 2.08% 0.84% 0.13%
Yr/Yr 10.42% 9.80% 11.48% 15.23% 14.45% 13.10% 14.09%
- Prior -- 10.54% 12.65% 15.24% 14.40% 13.11% 14.09%
Utilities 10.4% 103.657 107.386 105.105 104.398 103.590 111.173 108.264
- Prior -- 108.423 108.218 104.376 103.709 111.175 108.264
Mo/Mo -3.47% 2.17% 0.68% 0.78% -6.82% 2.69% 2.57%
- Prior -- 0.19% 3.68% 0.64% -6.72% 2.69% 2.57%
Yr/Yr -4.68% 2.80% 4.53% -3.65% -2.97% 6.43% 4.61%
- Prior -- 3.79% 7.62% -3.67% -2.86% 6.43% 4.61%
*Consumer Goods accounts for 36.8% of Manufacturing, 27.6% of Industrial Production.
Sources: Federal Reserve Board, ShadowStats

Shadow Government Statistics — Bullet Edition No. 10 — May 22, 2019
Copyright 2019 Shadow Government Statistics, Walter J. Williams, www.shadowstats.com 15
Graph 9: Index of Industrial Production, Full Historical Series, January 1919 to April 2019
Graph 10: Industrial Production, Full Historical Series, Year-to-Year Percent Change 1920 to Date
0
1
2
3
4
5
6
7
8
9
10
0
20
40
60
80
100
120
1915 1920 1925 1930 1935 1940 1945 1950 1955 1960 1965 1970 1975 1980 1985 1990 1995 2000 2005 2010 2015 2020
Ind
ex L
evel,
2012 =
100
Index of Industrial Production (2012 = 100)
100-Plus Years of Industrial Production Jan 1919 to Apr 2019 Seasonally-Adjusted [ShadowStats, Federal Reserve Board]
0
1
2
3
4
5
6
7
8
9
10
-40%
-30%
-20%
-10%
0%
10%
20%
30%
40%
50%
60%
70%
1915 1920 1925 1930 1935 1940 1945 1950 1955 1960 1965 1970 1975 1980 1985 1990 1995 2000 2005 2010 2015 2020
Year-
to-Y
ear
Perc
en
t C
ha
ng
e
Industrial Production (Year-to-Year Percent Change) January 1920 to April 2019, Seasonally-Adjusted [ShadowStats, FRB]

Shadow Government Statistics — Bullet Edition No. 10 — May 22, 2019
Copyright 2019 Shadow Government Statistics, Walter J. Williams, www.shadowstats.com 16
Graph 11: Manufacturing Sector, Full Historical Series, January 1919 to April 2019
Graph 12: Manufacturing Sector, Full Historical Series, Year-to-Year Percent Change 1920 to Date
0
1
2
3
4
5
6
7
8
9
10
0
20
40
60
80
100
120
1915 1920 1925 1930 1935 1940 1945 1950 1955 1960 1965 1970 1975 1980 1985 1990 1995 2000 2005 2010 2015 2020
Ind
ex L
evel,
2012 =
100
Industrial Production - Manufacturing Sector (2012 = 100) 100-Plus Years, January 1919 to April 2019
Seasonally-Adjusted [ShadowStats, Federal Reserve Board]
0
1
2
3
4
5
6
7
8
9
10
-60%
-40%
-20%
0%
20%
40%
60%
80%
1915 1920 1925 1930 1935 1940 1945 1950 1955 1960 1965 1970 1975 1980 1985 1990 1995 2000 2005 2010 2015 2020
Year-
to-Y
ear
Perc
en
t C
ha
ng
e
Manufacturing Sector (Year-to-Year Percent Change) January 1920 to April 2019, Seasonally-Adjusted [ShadowStats, FRB]
Shadow Government Statistics — Bullet Edition No. 10 — May 22, 2019
Copyright 2019 Shadow Government Statistics, Walter J. Williams, www.shadowstats.com 17
Graph 13: Index of Industrial Production, January 2000 to April 2019
Graph 14: Index of Industrial Production, Year-to-Year Percent Change, January 2000 to April 2019
0
1
2
3
4
5
6
7
8
9
10
84
88
92
96
100
104
108
112
116
2000 2001 2002 2003 2004 2005 2006 2007 2008 2009 2010 2011 2012 2013 2014 2015 2016 2017 2018 2019
Ind
ex L
evel,
2012 =
100
Index of Industrial Production (2012 = 100) Level to April 2019, Seasonally-Adjusted [ShadowStats, FRB]
0
1
2
3
4
5
6
7
8
9
10
-18%
-12%
-6%
0%
6%
12%
2000 2001 2002 2003 2004 2005 2006 2007 2008 2009 2010 2011 2012 2013 2014 2015 2016 2017 2018 2019
Year-
to-Y
ear
Perc
en
t C
ha
ng
e
Industrial Production (Year-to-Year Percent Change) To April 2019, Seasonally-Adjusted [ShadowStats, FRB]

Shadow Government Statistics — Bullet Edition No. 10 — May 22, 2019
Copyright 2019 Shadow Government Statistics, Walter J. Williams, www.shadowstats.com 18
Graph 15: Industrial Production, Manufacturing Sector, January 2000 to April 2019 [Same as Graph 3]
Graph 16: Manufacturing Sector, Year-to-Year Percent Change, January 2000 to April 2019 [Same as Graph 4]
0
1
2
3
4
5
6
7
8
9
10
84
88
92
96
100
104
108
112
2000 2001 2002 2003 2004 2005 2006 2007 2008 2009 2010 2011 2012 2013 2014 2015 2016 2017 2018 2019
Ind
ex L
evel,
2012 =
100
Industrial Production - Manufacturing (SIC) (2012 = 100)
Level to April 2019, Seasonally-Adjusted [ShadowStats, FRB]
0
1
2
3
4
5
6
7
8
9
10
-20%
-16%
-12%
-8%
-4%
0%
4%
8%
12%
2000 2001 2002 2003 2004 2005 2006 2007 2008 2009 2010 2011 2012 2013 2014 2015 2016 2017 2018 2019
Year-
to-Y
ear
Perc
en
t C
ha
ng
e
Industrial Production - Manufacturing (Yr-to-Yr Percent Change) To April 2019, Seasonally-Adjusted [ShadowStats, FRB]

Shadow Government Statistics — Bullet Edition No. 10 — May 22, 2019
Copyright 2019 Shadow Government Statistics, Walter J. Williams, www.shadowstats.com 19
Graph 17: Manufacturing, Consumer Goods Production, January 2000 to April 2019
Graph 18: Consumer Goods Production, Year-to-Year Percent Change, January 2000 to April 2019
0
1
2
3
4
5
6
7
8
9
10
96
100
104
108
112
116
2000 2001 2002 2003 2004 2005 2006 2007 2008 2009 2010 2011 2012 2013 2014 2015 2016 2017 2018 2019
Ind
ex L
evel,
2012 =
100
Production - Consumer Goods (2012 = 100) Level to April 2019, Seasonally-Adjusted [ShadowStats, FRB]
0
1
2
3
4
5
6
7
8
9
10
-12%
-10%
-8%
-6%
-4%
-2%
0%
2%
4%
6%
2000 2001 2002 2003 2004 2005 2006 2007 2008 2009 2010 2011 2012 2013 2014 2015 2016 2017 2018 2019
Year-
to-Y
ear
Perc
en
t C
han
ge
Production - Consumer Goods (Year-to-Year Percent Change) To April 2019, Seasonally-Adjusted [ShadowStats, FRB]

Shadow Government Statistics — Bullet Edition No. 10 — May 22, 2019
Copyright 2019 Shadow Government Statistics, Walter J. Williams, www.shadowstats.com 20
Graph 19: Industrial Production, Mining Sector, January 2000 to April 2019
Graph 20: Mining Sector, Year-to-Year Percent Change, January 2000 to April 2019
0
1
2
3
4
5
6
7
8
9
10
70
80
90
100
110
120
130
140
2000 2001 2002 2003 2004 2005 2006 2007 2008 2009 2010 2011 2012 2013 2014 2015 2016 2017 2018 2019
Ind
ex L
evel,
2012 =
100
Industrial Production - Mining (Including Oil & Gas) To April 2019, (2012 = 100) Seasonally-Adjusted [ShadowStats, FRB]
0
1
2
3
4
5
6
7
8
9
10
-16%
-12%
-8%
-4%
0%
4%
8%
12%
16%
20%
2000 2001 2002 2003 2004 2005 2006 2007 2008 2009 2010 2011 2012 2013 2014 2015 2016 2017 2018 2019
Year-
to-Y
ear
Perc
en
t C
ha
ng
e
Production - Mining (Year-to-Year Percent Change) To April 2019, Seasonally-Adjusted [ShadowStats, FRB]

Shadow Government Statistics — Bullet Edition No. 10 — May 22, 2019
Copyright 2019 Shadow Government Statistics, Walter J. Williams, www.shadowstats.com 21
Graph 21: Industrial Production, Utilities Sector, January 2000 to April 2019
Graph 22: Utilities Sector, Year-to-Year Percent Change, January 2000 to April 2019
0
1
2
3
4
5
6
7
8
9
10
85
90
95
100
105
110
115
2000 2001 2002 2003 2004 2005 2006 2007 2008 2009 2010 2011 2012 2013 2014 2015 2016 2017 2018 2019
Ind
ex L
evel,
2012 =
100
Industrial Production - Utilities (2012 = 100) Level to April 2019, Seasonally-Adjusted [ShadowStats, FRB]
0
1
2
3
4
5
6
7
8
9
10
-10%
-8%
-6%
-4%
-2%
0%
2%
4%
6%
8%
10%
12%
2000 2001 2002 2003 2004 2005 2006 2007 2008 2009 2010 2011 2012 2013 2014 2015 2016 2017 2018 2019
Year-
to-Y
ear
Perc
en
t C
ha
ng
e
Production - Utilities (Year-to-Year Percent Change) To April 2019, Seasonally-Adjusted [ShadowStats, FRB]
Shadow Government Statistics — Bullet Edition No. 10 — May 22, 2019
Copyright 2019 Shadow Government Statistics, Walter J. Williams, www.shadowstats.com 22
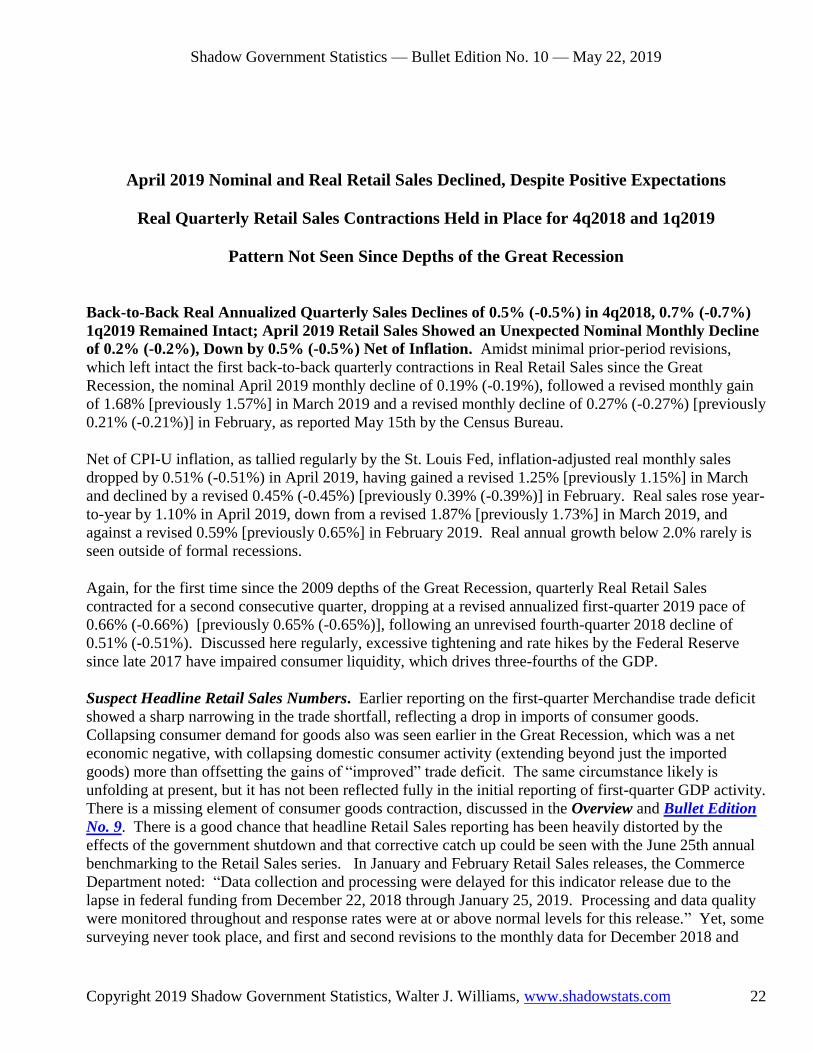
April 2019 Nominal and Real Retail Sales Declined, Despite Positive Expectations
Real Quarterly Retail Sales Contractions Held in Place for 4q2018 and 1q2019
Pattern Not Seen Since Depths of the Great Recession
Back-to-Back Real Annualized Quarterly Sales Declines of 0.5% (-0.5%) in 4q2018, 0.7% (-0.7%)
1q2019 Remained Intact; April 2019 Retail Sales Showed an Unexpected Nominal Monthly Decline
of 0.2% (-0.2%), Down by 0.5% (-0.5%) Net of Inflation. Amidst minimal prior-period revisions,
which left intact the first back-to-back quarterly contractions in Real Retail Sales since the Great
Recession, the nominal April 2019 monthly decline of 0.19% (-0.19%), followed a revised monthly gain
of 1.68% [previously 1.57%] in March 2019 and a revised monthly decline of 0.27% (-0.27%) [previously
0.21% (-0.21%)] in February, as reported May 15th by the Census Bureau.
Net of CPI-U inflation, as tallied regularly by the St. Louis Fed, inflation-adjusted real monthly sales
dropped by 0.51% (-0.51%) in April 2019, having gained a revised 1.25% [previously 1.15%] in March
and declined by a revised 0.45% (-0.45%) [previously 0.39% (-0.39%)] in February. Real sales rose year-
to-year by 1.10% in April 2019, down from a revised 1.87% [previously 1.73%] in March 2019, and
against a revised 0.59% [previously 0.65%] in February 2019. Real annual growth below 2.0% rarely is
seen outside of formal recessions.
Again, for the first time since the 2009 depths of the Great Recession, quarterly Real Retail Sales
contracted for a second consecutive quarter, dropping at a revised annualized first-quarter 2019 pace of
0.66% (-0.66%) [previously 0.65% (-0.65%)], following an unrevised fourth-quarter 2018 decline of
0.51% (-0.51%). Discussed here regularly, excessive tightening and rate hikes by the Federal Reserve
since late 2017 have impaired consumer liquidity, which drives three-fourths of the GDP.
Suspect Headline Retail Sales Numbers. Earlier reporting on the first-quarter Merchandise trade deficit
showed a sharp narrowing in the trade shortfall, reflecting a drop in imports of consumer goods.
Collapsing consumer demand for goods also was seen earlier in the Great Recession, which was a net
economic negative, with collapsing domestic consumer activity (extending beyond just the imported
goods) more than offsetting the gains of “improved” trade deficit. The same circumstance likely is
unfolding at present, but it has not been reflected fully in the initial reporting of first-quarter GDP activity.
There is a missing element of consumer goods contraction, discussed in the Overview and Bullet Edition
No. 9. There is a good chance that headline Retail Sales reporting has been heavily distorted by the
effects of the government shutdown and that corrective catch up could be seen with the June 25th annual
benchmarking to the Retail Sales series. In January and February Retail Sales releases, the Commerce
Department noted: “Data collection and processing were delayed for this indicator release due to the
lapse in federal funding from December 22, 2018 through January 25, 2019. Processing and data quality
were monitored throughout and response rates were at or above normal levels for this release.” Yet, some
surveying never took place, and first and second revisions to the monthly data for December 2018 and

Shadow Government Statistics — Bullet Edition No. 10 — May 22, 2019
Copyright 2019 Shadow Government Statistics, Walter J. Williams, www.shadowstats.com 23
January and February 2019 shifted in their regular patterns. The June 25th revisions should prove
interesting. Graphs 23 and 24 plot the full history of Retail Sales reporting, with Graphs 25 and 26
showing the period 2000 to date.
Graph 23: Real Retail Sales (1947 to April 2019)
Graph 24: Real Retail Sales , Year-to-Year Change (1948 to April 2019)
0
1
2
3
4
5
6
7
8
9
10
40
60
80
100
120
140
160
180
200
220
1945 1950 1955 1960 1965 1970 1975 1980 1985 1990 1995 2000 2005 2010 2015 2020
Bil
lio
ns
of
1982
-1984 D
oll
ars
(C
PI-
U)
Real Retail Sales (Deflated by the CPI-U) 1947 to April 2019, Seasonally-Adjusted [ShadowStats, St. Louis Fed]
Official Recession
Old Series (1947 to Date)
Current Series (1992 to Date)
0
1
2
3
4
5
6
7
8
9
10
-12%
-10%
-8%
-6%
-4%
-2%
0%
2%
4%
6%
8%
10%
12%
14%
16%
18%
20%
1945 1950 1955 1960 1965 1970 1975 1980 1985 1990 1995 2000 2005 2010 2015 2020
Year-
to-Y
ear
Perc
en
t C
ha
ng
e
Real Retail Sales Year-to-Year Percent Change 1948 to April 2019, Seasonally-Adjusted [ShadowStats, St. Louis Fed]
Official Recession
Old Series (1948 to 2001)
Current Series (1993 to Date)

Shadow Government Statistics — Bullet Edition No. 10 — May 22, 2019
Copyright 2019 Shadow Government Statistics, Walter J. Williams, www.shadowstats.com 24
Graph 25: Real Retail Sales Level, Deflated by Headline CPI-U (2000 to April 2019)
Graph 26: Real Retail Sales, Year-to-Year Change (January 2000 to April 2019)
0
1
2
3
4
5
6
7
8
9
10
150
155
160
165
170
175
180
185
190
195
200
205
210
2000 2001 2002 2003 2004 2005 2006 2007 2008 2009 2010 2011 2012 2013 2014 2015 2016 2017 2018 2019
Bil
lio
ns
of
1982
-1984 D
oll
ars
(C
PI-
U)
Real Retail Sales Level (Deflated by CPI-U) To April 2019, Seasonally-Adjusted [ShadowStats, Census, BLS]
0
1
2
3
4
5
6
7
8
9
10
-12%
-10%
-8%
-6%
-4%
-2%
0%
2%
4%
6%
8%
2000 2001 2002 2003 2004 2005 2006 2007 2008 2009 2010 2011 2012 2013 2014 2015 2016 2017 2018 2019
Ye
ar-
to-Y
ea
r P
erc
en
t C
ha
ng
e
Real Retail Sales Year-to-Year Percent Change To April 2019, Seasonally-Adjusted [ShadowStats, Census, BLS]

Shadow Government Statistics — Bullet Edition No. 10 — May 22, 2019
Copyright 2019 Shadow Government Statistics, Walter J. Williams, www.shadowstats.com 25
Existing-Home Sales Notched Lower, Continuing in Broad Annual Downtrend
Monthly Sales Declined Against Upside Expectations. April 2019 Existing-Home Sales growth
notched lower by 0.4% (-0.4%) in the month, against upside expectations in the range of 2.5% to 5.0%,
and declined year-to-year by 4.4% (-4.4%), as reported May 21st by the National Association of
Realtors (NAR). That followed an unrevised monthly decline of 4.9% (-4.9%) in March, which had
followed the monthly sales surge of 11.2% in February, the strongest monthly gain in three years. The
April 2019 annual decline of 4.4% (-4.4%) followed year-to-year drops of 5.4% (-5.4%) in March and
2.3% (-2.3%) in February.
Existing-Home Sales continued in a deepening year-to-year contraction in the trailing twelve-month
moving average of the series, where April 2019, dropped to a new low of 4.7% (-4.7%), its thirteenth
consecutive and continuously deepening annual rate of decline. April 2019 sales activity remained 28.4%
(-28.4%) shy of ever recovering its pre-recession high.
In contrast to what usually is nonsense revisions, extreme volatility and lack of any meaningful statistical
significance in headline New-Home Sales reporting out of the Census Bureau (April data will be released
on May 23rd), the NAR publishes the highest-quality indicator available of Home Sales activity.
Graph 27: Existing-Home Sales, Monthly Level to April 2019
0
0.1
0.2
0.3
0.4
0.5
0.6
0.7
0.8
0.9
1
275
325
375
425
475
525
575
625
2000 2001 2002 2003 2004 2005 2006 2007 2008 2009 2010 2011 2012 2013 2014 2015 2016 2017 2018 2019
Th
ou
san
ds
of
Un
its p
er
Mo
nth
Existing-Home Sales (Monthly Rate) Single- and Multiple-Unit Sales, Non-Annualized Monthly Level To April 2019, Seasonally-Adjusted [ShadowStats, NAR, HUD]
Original Series
NAR-Corrected Series
Average Mar '09 to Dec '11
The Mar '09 to Dec '11 average smooths out monthly volatility tied to tax-break and homebuyer-incentive periods.

Shadow Government Statistics — Bullet Edition No. 10 — May 22, 2019
Copyright 2019 Shadow Government Statistics, Walter J. Williams, www.shadowstats.com 26
Graph 28: Existing-Home Sales, Six-Month Moving Average Level to April 2019
Single-Unit Housing Construction in a Downtrend Not Seen Since the Great Recession
April 2019 New Residential Construction: Housing Starts Continued in the Longest String of
Monthly Year-to-Year Declines Since the Depths of the Great Depression. Reported by the Census
Bureau on May 16th, Housing Starts and Building Permits continued in downtrends, amidst annual
contractions and despite monthly gains. The broad picture remained strongly negative, with persistent
annual contractions in both the Housing Starts and the more stable, Building Permits series. The extreme
monthly volatility and revisions in Housing Starts series are nonsensical, almost always without statistical
significance (as in being different from zero growth with a 90% confidence interval) in the Total, Single-
and Multiple-Unit Starts categories. More-stable Building Permits showed a statistically insignificant
April monthly gain of 0.6%, but a statistically meaningful annual decline of 5.0% (-5.0%). Neither the
headline monthly gain of 5.7% nor the 2.5% (-2.5%) annual decline in Housing Starts was close to being
meaningful.
That said, Housing Starts and Building Permits both are on track for third consecutive quarters of annual
decline. Annual seasonal adjustment revisions to Housing Starts had negligible impact. As a separate
issue, neither series has recovered its pre-recession peak, with Housing Starts down by 45.7% (-45.7%)
and Building Permits still shy by 42.7% (-42.7%).
New Graph and Analysis of Single-Unit Building Permits. Discussed in the Overview, Single-Unit
Building Permits was statistically meaningful in both its monthly and annual changes (declines), with
0
0.1
0.2
0.3
0.4
0.5
0.6
0.7
0.8
0.9
1
275
325
375
425
475
525
575
625
2000 2001 2002 2003 2004 2005 2006 2007 2008 2009 2010 2011 2012 2013 2014 2015 2016 2017 2018 2019
Th
ou
san
ds
of
Un
its p
er
Mo
nth
Existing-Home Sales (Six-Month Moving Average) Single- and Multiple-Unit Sales, Non-Annualized Monthly Rate To April 2019, Seasonally-Adjusted [ShadowStats, NAR, HUD]

Shadow Government Statistics — Bullet Edition No. 10 — May 22, 2019
Copyright 2019 Shadow Government Statistics, Walter J. Williams, www.shadowstats.com 27
some new ShadowStats analysis on that series. Repeated and expanded from the earlier comments, the
Single-Unit count (Permits or Starts) usually accounts for roughly two-thirds of the aggregate total count
(Multiple-Unit counts are wildly unstable in terms of volatility and revisions). Single-Unit Permits is
statistically more stable than the Starts series, less revised and often significant in its initial reporting. It
also has a 98% coincident (theoretically leading) correlation with its Housing Starts counterpart, once that
latter series stabilizes after three-to-four months of revisions.
Single-Unit Building Permits are plotted in Graphs 37 and 38 (along with Single-Unit Housing Starts for
comparison), with Single-Unit Starts also plotted in their usual Graphs 39 and 40. Single-Unit Building
Permits declined for the fifth straight month, down monthly by 4.2% (-4.2%), down year-to-year by 9.4%
(-9.4%). Quarterly patterns have shown rapidly deepening quarter-to-quarter and annual contractions
from fourth-quarter 2018, to first-quarter 2019 and into an early-trend second-quarter 2019. Annualized
quarterly contractions deepened from 4.6% (-4.6%) in fourth-quarter 2018, to a drop of 10.6% (-10.6%) in
first-quarter 2019, and to an early-trend 16.3% (-16.3%) in second-quarter 2019. Year-to-year quarterly
contractions deepened from 2.7% (-2.7%) in fourth-quarter 2018, to 5.9% (-5.9%) in first-quarter 2019, to
an early-trend 8.3% (-8.3%) in second-quarter 2019.
Regular and Related Graphs Follow. Graphs 29 and 30 show the regular monthly and six-month
smoothed plots of the historical Housing Starts series, post-World War II. Housing Starts not only
remain shy of recovering from their pre-Great Recession peak, they also have not recovered the peaks of
any other post World War II recession.
Graphs 31 to 34 show the series 2000 to date, with Graphs 35 an 36 showing related plots of real Private
Residential Construction spending. Beyond, the previously discussed Graphs 37 to 40, Graphs 41 and 42
plot details of Multiple Unit (two-or-more) Starts, with Graphs 43 and 44 showing the break out of Starts
by segment and Graphs 45 and 46 plotting aggregate Building Permits.
[Graphs 29 to 46 begin on the next page.]

Shadow Government Statistics — Bullet Edition No. 10 — May 22, 2019
Copyright 2019 Shadow Government Statistics, Walter J. Williams, www.shadowstats.com 28
Graph 29: Housing Starts, Annual Unit Rate by Month, 1946 to April 2019
Graph 30: Housing Starts, Smoothed 6-Month Moving Average Annual Rate, 1946 to April 2019
0
1
2
3
4
5
6
7
8
9
10
0.0
0.2
0.4
0.6
0.8
1.0
1.2
1.4
1.6
1.8
2.0
2.2
2.4
2.6
1945 1950 1955 1960 1965 1970 1975 1980 1985 1990 1995 2000 2005 2010 2015 2020
Mil
lio
ns
of
Un
its
Housing Starts (Annual Rate by Month) 1946 to April 2019, Seasonally-Adjusted [ShadowStats, Census and HUD]
Official Recession
Nonfarm Housing Starts (1946-1969)
Housing Starts (1959 to Date)
0
1
2
3
4
5
6
7
8
9
10
0.0
0.2
0.4
0.6
0.8
1.0
1.2
1.4
1.6
1.8
2.0
2.2
2.4
2.6
1945 1950 1955 1960 1965 1970 1975 1980 1985 1990 1995 2000 2005 2010 2015 2020
Mil
lio
ns
of
Un
its
Housing Starts (Annual Rate by Month, 6-Month Moving Avg) 1946 to April 2019, Seasonally-Adjusted [ShadowStats, Census and HUD]
Official Recession
Nonfarm Housing Starts (1946-1969)
Housing Starts (1959 to Date)

Shadow Government Statistics — Bullet Edition No. 10 — May 22, 2019
Copyright 2019 Shadow Government Statistics, Walter J. Williams, www.shadowstats.com 29
Graph 31: Housing Starts, January 2000 to April 2019
Graph 32: Housing Starts, Year-to-Year Percent Change, January 2000 to April 2019
0
0.1
0.2
0.3
0.4
0.5
0.6
0.7
0.8
0.9
1
0.0
0.2
0.4
0.6
0.8
1.0
1.2
1.4
1.6
1.8
2.0
2.2
2.4
2000 2001 2002 2003 2004 2005 2006 2007 2008 2009 2010 2011 2012 2013 2014 2015 2016 2017 2018 2019
Mil
lio
ns
of
Un
its
Housing Starts (Annual Rate by Month) To April 2019, Seasonally-Adjusted [ShadowStats, Census and HUD]
0
0.1
0.2
0.3
0.4
0.5
0.6
0.7
0.8
0.9
1
-80%
-60%
-40%
-20%
0%
20%
40%
60%
2000 2001 2002 2003 2004 2005 2006 2007 2008 2009 2010 2011 2012 2013 2014 2015 2016 2017 2018 2019
Year-
to-Y
ear
Perc
en
t C
ha
ng
e
Housing Starts (Year-to-Year Change by Month) To April 2019, Seasonally-Adjusted [ShadowStats, Census and HUD]

Shadow Government Statistics — Bullet Edition No. 10 — May 22, 2019
Copyright 2019 Shadow Government Statistics, Walter J. Williams, www.shadowstats.com 30
Graph 33: Housing Starts, Six-Month Smoothed Average, January 2000 to April 2019
Graph 34: Housing Starts, Six-Month Smoothed Average, Year-to-Year Percent Change
0
0.1
0.2
0.3
0.4
0.5
0.6
0.7
0.8
0.9
1
0.0
0.2
0.4
0.6
0.8
1.0
1.2
1.4
1.6
1.8
2.0
2.2
2.4
2000 2001 2002 2003 2004 2005 2006 2007 2008 2009 2010 2011 2012 2013 2014 2015 2016 2017 2018 2019
An
nu
al
Sale
s R
ate
of
Mil
lio
ns o
f U
nit
s
Aggregate Housing Starts (Six-Month Moving Average) To April 2019, Seasonally-Adjusted [ShadowStats, Census and HUD]
0
0.1
0.2
0.3
0.4
0.5
0.6
0.7
0.8
0.9
1
-60%
-50%
-40%
-30%
-20%
-10%
0%
10%
20%
30%
40%
2000 2001 2002 2003 2004 2005 2006 2007 2008 2009 2010 2011 2012 2013 2014 2015 2016 2017 2018 2019
Year-
to-Y
ear
Perc
en
t C
ha
ng
e
Housing Starts (Yr-to-Yr Change, Six-Month Moving Average) To April 2019, Seasonally-Adjusted [ShadowStats, Census and HUD]

Shadow Government Statistics — Bullet Edition No. 10 — May 22, 2019
Copyright 2019 Shadow Government Statistics, Walter J. Williams, www.shadowstats.com 31
Graph 35: Real Value of Private Residential Construction Put in Place (2000 to March 2019)
Graph 36: Year-to-Year Change in Real Residential Construction Spending (2000 to March 2019)
0
0.1
0.2
0.3
0.4
0.5
0.6
0.7
0.8
0.9
1
20
40
60
80
100
120
140
160
2000 2001 2002 2003 2004 2005 2006 2007 2008 2009 2010 2011 2012 2013 2014 2015 2016 2017 2018 2019
Ind
ex L
evel,
Jan
ua
ry 2
000 =
100
Index of Value of Private Residential Construction Put in Place Inflation-Adjusted (Jan 2000 = 100)
Real Data Reflect ShadowStats Composite Construction Deflator To March 2019, Seasonally-Adjusted [ShadowStats, Census]
0
0.1
0.2
0.3
0.4
0.5
0.6
0.7
0.8
0.9
1
-50%
-40%
-30%
-20%
-10%
0%
10%
20%
30%
2000 2001 2002 2003 2004 2005 2006 2007 2008 2009 2010 2011 2012 2013 2014 2015 2016 2017 2018 2019
Year-
to-Y
ear
Perc
en
t C
ha
ng
e
Year-to-Year Percent Change to March 2019 Real Private Residential Construction
Seasonally Adjusted [ShadowStats, Census Bureau]

Shadow Government Statistics — Bullet Edition No. 10 — May 22, 2019
Copyright 2019 Shadow Government Statistics, Walter J. Williams, www.shadowstats.com 32
Graph 37: Single-Unit Building Permits versus Housing Starts, January 2000 to April 2019
Graph 38: Single-Unit Building Permits vs. Housing Starts, Yr-to-Yr Percent Change, January 2000 to April 2019
0
0.1
0.2
0.3
0.4
0.5
0.6
0.7
0.8
0.9
1
0
20
40
60
80
100
120
140
160
2000 2001 2002 2003 2004 2005 2006 2007 2008 2009 2010 2011 2012 2013 2014 2015 2016 2017 2018 2019
Th
ou
san
ds
of
Un
its
Single-Unit Building Permits vs. Housing Starts (Monthly Rate) To April 2019, Seasonally-Adjusted [ShadowStats, Census and HUD]
0
0.1
0.2
0.3
0.4
0.5
0.6
0.7
0.8
0.9
1
-60%
-40%
-20%
0%
20%
40%
60%
2000 2001 2002 2003 2004 2005 2006 2007 2008 2009 2010 2011 2012 2013 2014 2015 2016 2017 2018 2019
Year-
to-Y
ear
Perc
en
t C
ha
ng
e
Single-Unit Building Permits vs. Housing Starts Year-to-Year Percent Change, 2000 to Date
To April 2019, Seasonally-Adjusted [ShadowStats, Census and HUD]
Shadow Government Statistics — Bullet Edition No. 10 — May 22, 2019
Copyright 2019 Shadow Government Statistics, Walter J. Williams, www.shadowstats.com 33
Graph 39: Single-Unit Housing Starts, January 2000 to April 2019
Graph 40: Single-Unit Housing Starts, Six-Month Moving Average, January 2000 to April 2019
0
0.1
0.2
0.3
0.4
0.5
0.6
0.7
0.8
0.9
1
0
20
40
60
80
100
120
140
160
2000 2001 2002 2003 2004 2005 2006 2007 2008 2009 2010 2011 2012 2013 2014 2015 2016 2017 2018 2019
Th
ou
san
ds
of
Un
its
Single-Unit Housing Starts (Monthly Rate) To April 2019, Seasonally-Adjusted [ShadowStats, Census and HUD]
0
0.1
0.2
0.3
0.4
0.5
0.6
0.7
0.8
0.9
1
0
20
40
60
80
100
120
140
160
2000 2001 2002 2003 2004 2005 2006 2007 2008 2009 2010 2011 2012 2013 2014 2015 2016 2017 2018 2019
Th
ou
san
ds
of
Un
its
Single-Unit Housing Starts (Six-Month Moving Average) To April 2019, Seasonally-Adjusted [ShadowStats, Census and HUD]
Shadow Government Statistics — Bullet Edition No. 10 — May 22, 2019
Copyright 2019 Shadow Government Statistics, Walter J. Williams, www.shadowstats.com 34
Graph 41: Multiple-Unit, Two or More Housing Starts, January 2000 to April 2019
Graph 42: Multiple-Unit, Two or More. Housing Starts, Six-Month Moving Average, January 2000 to April 2019
0
0.1
0.2
0.3
0.4
0.5
0.6
0.7
0.8
0.9
1
0
5
10
15
20
25
30
35
40
45
2000 2001 2002 2003 2004 2005 2006 2007 2008 2009 2010 2011 2012 2013 2014 2015 2016 2017 2018 2019
Th
ou
san
ds
of
Un
its
Multiple-Unit Housing Starts, Two-or-More Units
To April 2019, Seasonally-Adjusted [ShadowStats, Census and HUD]
0
0.1
0.2
0.3
0.4
0.5
0.6
0.7
0.8
0.9
1
0
5
10
15
20
25
30
35
40
45
2000 2001 2002 2003 2004 2005 2006 2007 2008 2009 2010 2011 2012 2013 2014 2015 2016 2017 2018 2019
Th
ou
san
ds
of
Un
its
Multiple-Unit Housing StartsTotal Two-or-More Units Six-Month Moving Average to April 2019
Seasonally-Adjusted [ShadowStats, Census and HUD]

Shadow Government Statistics — Bullet Edition No. 10 — May 22, 2019
Copyright 2019 Shadow Government Statistics, Walter J. Williams, www.shadowstats.com 35
Graph 43: Monthly Housing Starts by Segment, January 2000 to April 2019
Graph 44: Six-Month Smoothed Monthly Housing Starts by Segment, January 2000 to April 2019
0
20
40
60
80
100
120
140
160
180
200
2000 2001 2002 2003 2004 2005 2006 2007 2008 2009 2010 2011 2012 2013 2014 2015 2016 2017 2018 2019
Th
ou
san
ds
of
Un
its
Single- and Multiple-Unit Housing Starts (Monthly Rate) To April 2019, Seasonally-Adjusted [ShadowStats, Census and HUD]
Multiple-Unit Starts
Single-Unit Starts
0
20
40
60
80
100
120
140
160
180
200
2000 2001 2002 2003 2004 2005 2006 2007 2008 2009 2010 2011 2012 2013 2014 2015 2016 2017 2018 2019
Th
ou
san
ds
of
Un
its
Single- and Multiple-Unit Starts (6-Month Moving Average) To April 2019, Seasonally-Adjusted [ShadowStats, Census and HUD]
Multiple-Unit Starts
Single-Unit Starts

Shadow Government Statistics — Bullet Edition No. 10 — May 22, 2019
Copyright 2019 Shadow Government Statistics, Walter J. Williams, www.shadowstats.com 36
Graph 45: Monthly Building Permits, January 2000 to April 2019
Graph 46: Smoothed Monthly Building Permits, January 2000 to April 2019
0
0.1
0.2
0.3
0.4
0.5
0.6
0.7
0.8
0.9
1
0.0
0.2
0.4
0.6
0.8
1.0
1.2
1.4
1.6
1.8
2.0
2.2
2.4
2000 2001 2002 2003 2004 2005 2006 2007 2008 2009 2010 2011 2012 2013 2014 2015 2016 2017 2018 2019
Mil
lio
ns
of
Un
its
Building Permits for Housing Units (Annual Rate by Month) To April 2019, Seasonally-Adjusted [ShadowStats, Census and HUD]
0.0
0.2
0.4
0.6
0.8
1.0
1.2
1.4
1.6
1.8
2.0
2.2
2.4
2000 2001 2002 2003 2004 2005 2006 2007 2008 2009 2010 2011 2012 2013 2014 2015 2016 2017 2018 2019
An
nu
al
Rate
in
Mil
lio
ns o
f U
nit
s
Building Permits for Housing Units (Six-Month Moving Average) To April 2019 Seasonally-Adjusted [ShadowStats, Census and HUD]

Shadow Government Statistics — Bullet Edition No. 10 — May 22, 2019
Copyright 2019 Shadow Government Statistics, Walter J. Williams, www.shadowstats.com 37
Consumer Surveying Showed Booming Optimism
Often a Lagging Indicator of Stock Market and Economic Activity
The Major Series Tend to Mimic the Tone of the Popular Press
April Consumer Confidence Jumped and Early-May Sentiment Hit a 15-Year High. Graphs 47 and
48 plot details of the Conference Board’s April 2019 Consumer Confidence Index® and the early-month
estimate of the University of Michigan’s May 2019 Index of Consumer Sentiment. Both show series
either at or minimally below multi-year highs. While that may seem incongruent with the economic
conditions discussed earlier, the circumstance is not so unusual.
For the Conference Board’s seasonally-adjusted Consumer-Confidence Index® (Graph 47) [unadjusted
data are not available, although the case for seasonally-adjusting confidence is a difficult one to make],
and the University of Michigan’s not-seasonally-adjusted Consumer-Sentiment Index (Graph 48), the
monthly and three-month moving averages generally remain at levels last seen in 2001. Neither series has
regained is pre-2001 recession highs. It also is worth noting that the 2001 recession largely had run its
course at the time of the September 11th terrorst attacks.
Both Confidence and Sentiment Reflect and Mimic the Tone of the Popular Press. The confidence and
sentiment surveys generally ask respondents to forecast the economy six months into the future. Where
the average survey respondent is not an economist, responses most frequently tend to reflect the tone of
the popular press. Professor David Fan, PhD, of the University of Minnesota, established such several
decades ago. By indexing the relative positive or negative nature of the tone of press coverage towards
the economy and the markets, he was able to predict the movements in the Confidence and Sentiment
surveys with high a degree of accuracy.
Moving with headline economic reporting in the press, these series often are highly volatile month-to-
month. Recent press was highly positive on the headline economic and employment news, particularly
with the recent GDP and unemployment reporting. The current surveys were taken before the recent
stock-market volatility tied to the still-developing tariff circumstances. Even so, a downturn in the
consumer outlook can unfold, despite any euphoric headlines, reflecting the current deep-seated consumer
liquidity stresses. In an environment of high-level optimism, beyond having happy feelings about the
future, consumers still need actual income, cash-in-hand or credit in order to increase their spending.
Showing the Consumer Confidence and Consumer Sentiment measures on something of a comparable
scale, a scale comparable with almost all indexed ShadowStats graphs, following Graphs 47 and 48
reflect both measures of relative consumer optimism re-indexed to January 2000 = 100 for the monthly
reading. Standardly reported, the Conference Board’s Consumer Confidence Index® is set with 1985 =
100, while the University of Michigan’s Consumer Sentiment Index is set with January 1966 = 100.
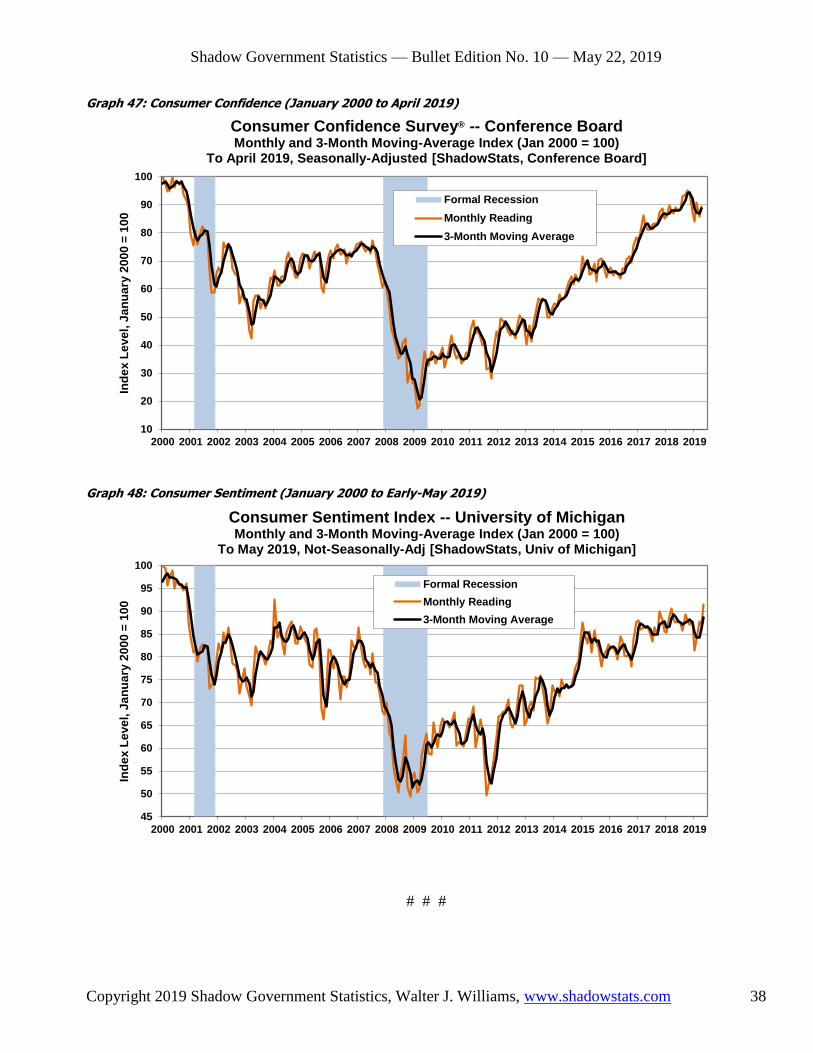
Shadow Government Statistics — Bullet Edition No. 10 — May 22, 2019
Copyright 2019 Shadow Government Statistics, Walter J. Williams, www.shadowstats.com 38
Graph 47: Consumer Confidence (January 2000 to April 2019)
Graph 48: Consumer Sentiment (January 2000 to Early-May 2019)
# # #
0
0.1
0.2
0.3
0.4
0.5
0.6
0.7
0.8
0.9
1
10
20
30
40
50
60
70
80
90
100
2000 2001 2002 2003 2004 2005 2006 2007 2008 2009 2010 2011 2012 2013 2014 2015 2016 2017 2018 2019
Ind
ex
Le
ve
l, J
an
ua
ry 2
00
0 =
10
0
Consumer Confidence Survey® -- Conference Board Monthly and 3-Month Moving-Average Index (Jan 2000 = 100)
To April 2019, Seasonally-Adjusted [ShadowStats, Conference Board]
Formal Recession
Monthly Reading
3-Month Moving Average
0
0.1
0.2
0.3
0.4
0.5
0.6
0.7
0.8
0.9
1
45
50
55
60
65
70
75
80
85
90
95
100
2000 2001 2002 2003 2004 2005 2006 2007 2008 2009 2010 2011 2012 2013 2014 2015 2016 2017 2018 2019
Ind
ex
Le
ve
l, J
an
ua
ry 2
00
0 =
10
0
Consumer Sentiment Index -- University of Michigan Monthly and 3-Month Moving-Average Index (Jan 2000 = 100)
To May 2019, Not-Seasonally-Adj [ShadowStats, Univ of Michigan]
Formal Recession
Monthly Reading
3-Month Moving Average