shahrin nasir - diva portal781452/fulltext02.pdf · 5 chapter five ..... 85 5 case study: logistics...
TRANSCRIPT

SHAHRIN NASIR Interm
odal container transport logistics to and from M
alaysian ports
TRITA-TSC-PHD 14-010ISBN 978-91-87353-62-8
KTH
2014
Intermodal container transport logistics to and from Malaysian portsEvaluation of Customer requirements and environmental e� ects
SHAHRIN NASIR
DOCTORAL THESIS IN TRANSPORT SCIENCESTOCKHOLM, SWEDEN 2014
KTH ROYAL INSTITUTE OF TECHNOLOGYSCHOOL OF ARCHITECTURE AND THE BUILT ENVIRONMENTwww.kth.se
Intermodal container transport logistics to and from Malaysian ports
- Evaluation of customer requirements and environmental effects
SHAHRIN NASIR
Doctoral Thesis in Transport Science
Stockholm 2014
Royal Institute of Technology (KTH) School of Architecture and the Built Environment TRITA-TSC-PHD 14-010 Division of Transport and Logistics ISBN 978-91-87353-62-8

2
ACKNOWLEDGEMENT Alhamdulillah, praise to Allah for giving me the strength to complete my PhD thesis.
I started working with the research in 2007. There are many wonderful people that I would like to thank for helping me complete my studies. First and foremost, I would like to thank my employer Universiti Teknologi MARA and the Ministry of Higher Education in Malaysia for giving me the scholarship to further my studies at KTH (Royal Institute of Technology) in Sweden.
I would also like to thank the following people for their untiring assistance; Dr Amin Kassim (Century Logistics), Nazri Ismail (Penang Port Sdn Bhd), Gan Leong (Ocean Logistics), Mazlina (ICT Ipoh), Faiz Hakim (North Star Logistics) and Syahrul Azam (KTMB). They gave assistance from the very beginning of my research.
My heartfelt gratitude also goes to my fellow friends whose camaraderie during my stay in Sweden has been invaluable. Special thanks go to Rumaizi, Ejant, Qory, Abg Karim, Kak Normah, Kak Hani and Pok. Their help and guidance throughout my stay in Sweden is very much appreciated.
To my fellow Malaysians in Sweden and the Malaysian Embassy in Stockholm, your kind assistance and friendship will be cherished forever.
I would also like to thank my parents Nasir Ibrahim and Azizah Ahmad for their continuous love and support. Your concern for my well-being during my stay in Sweden reflects the genuine love and sincerity of any parents towards their children. To Zahiah (Along), Azahir (Ye), Noor Imlah (Im), Adibah (Diba), Muhammad Adib (Adib) and Muhammad Nasruddin (Nas), thank you for being wonderful siblings.
To my supervisors Karl and Bolle, your assistance and the knowledge you have given me will always be in my heart. Karl, since I first made your acquaintance in 2003 in the Translink Project, you have been the most supportive supervisor I have ever come across. I appreciate the time you spent on my work and the comments you provided helped improve my work. I appreciate your concern for my family’s well-being during our stay in Sweden. The short sailing trip on your boat was one of the most memorable occasions for me and my wife. Bolle, the long hours you spent in perfecting the model have been of great help. My thoughts will always be with you.
Last but not least, my thanks go to my beloved wife Azian and my three children, Along, Angah and Fahmi. To Yan, kasih sayang mu tidak akan Abang lupakan. You have sacrifice four years of your working life to be with me in Sweden. During the roller coaster ride of completing my PhD, you have always been supportive. Your love will be cherished forever. To my sons, abah sayang kamu, moga menjadi anak yang soleh.
To the rest who are too numerous to mention, thank you all for making my PhD a success. I will always remember the rewarding process of getting my PhD in Sweden.

3
EXECUTIVE SUMMARY Malaysian ports’ container volumes are expected to increase to 36.6 million TEUs in 2020 compare to 12 million TEUs in 2005. Almost 45% of the container volumes are local containers entering the Malaysian hinterland. The hinterland container transport movements are dominated by road haulage (90%), alongside road-rail intermodal that currently handles the remaining 10%.
The aim of this research is to develop possible strategies for improving the logistics of the intermodal hinterland container transport system based on customer demand, cost-efficiency, environmental impacts and quality. Intermodal began to capture more container volumes from ports, especially Port Klang, in 1989. This was initiated by the opening of Ipoh Cargo Terminal (ICT). Other inland terminals such as Padang Besar (Perlis), Nilai Inland Port (Negeri Sembilan), Segamat Inland Port (Johore) and three other ICDs have seen a good share of intermodal movements during that time. But for the past 10 years, the intermodal share has declined.
The government is concerned with the congestion, greenhouse gas (GHG) emissions from road haulage and security issues. The Prime Minister has pledged that by the year 2020, Malaysia will reduce its CO2 emissions by 40% and it is believed that intermodal could be one of the solutions to achieve this. The need to shift from road haulage to road-rail intermodal has been mentioned in Industrial Master Plan 3 (2006) and the Logistics Road Map (2009) to alleviate these problems. Intermodal hinterland container transport is a trend in many European ports to solve road haulage problems.
The current hinterland container transport in Malaysia showed that the share of intermodal in Malaysia is still low. Most of the inland terminals in Malaysia are underutilised. Based on a customer survey, the major issues for customers to shift to intermodal is not only cost but also service quality. The lack of strategic policies and effective institutional aspects also contributes to make intermodal services less attractive.
The Port Klang-Ipoh Corridor has a huge potential to be the main intermodal corridor in Malaysia. The case study showed that this corridor has the container volume to support intermodal services. The case study indicated a cost saving of 51% compared to direct road haulage, whereby CO2 emissions would be reduced by 36%.
However, all the cost savings and reductions in CO2 emissions are not viable if there is no implementation of the most effective strategies to promote intermodal movement. The strategies include 1) introducing the Intermodal Transport Department and new policies, 2) introducing specific intermodal services, 3) setting up the green corridor concept, 4) developing a reward system for actors in intermodal transportation, 5) collaboration and coordination issues and 6) quality of service monitoring.
Implementations of these strategies is vital to enhance the intermodal share in the Malaysian environment.

4
Table of ContentsAcknowledgement .............................................................................. 2
Executive Summary ............................................................................ 3
AbbreviationS .................................................................................... 6
CHAPTER ONE ....................................................................................7
1. INTRODUCTION .......................................................................... 7
1.1 Background of the study .............................................................71.2 Problem statement .....................................................................91.3 Aim of the study ..................................................................... 101.5 Scope and limitation of the study ............................................... 101.6 Overview of chapters ............................................................. 131.7 Terminology ......................................................................... 14
CHAPTER TWO ................................................................................. 15
2. Literature review ...................................................................... 15
2.1 Logistics Quality factors for mode/carrier selection ........................ 152.2 Hinterland transport services from different ports ....................... 252.3 Transport system evaluation methods ......................................... 352.4 Conclusion .............................................................................. 42
CHAPTER THREE .............................................................................. 43
3 RESEARCH METHODOLOGY .......................................................... 43
3.1 Overview of methodology .......................................................... 433.2 Data needs ........................................................................ 453.3 Data collection methods....................................................... 473.4 Data analysis ......................................................................... 55
CHAPTER FOUR ................................................................................ 57
4 REVIEW Of THE CURRENT SYSTEM ................................................ 57
4.1 Actors in hinterland transport ................................................. 574.2 Hinterland container movements in Malaysia .......................... 634.3 Institutional framework ........................................................... 70Penang Port Commission Act 1955 ................................................... 70Port Authorities Act 1963 ................................................................ 704.4 Current hinterland transport issues as highlighted from the preliminary service provider interviews ............................................. 724.5 Customer (manufacturers) survey and interviews ....................... 734.6 Conclusion ......................................................................... 83

5
CHAPTER FIVE ................................................................................. 85
5 CASE STUDY: LOGISTICS ANALYSIS AND EVALUATION OF an ENHANCED INTERMODAL SYSTEM ...................................................... 85
5.1 Selection of intermodal corridor for the case study ........................ 855.2 Description of the intermodal traffic analysed ............................... 895.3 Container volumes at Port Klang Ipoh Corridor (PKIC) .................. 955.4 Scenario and alternatives setting ................................................ 975.5 Cost and CO2 emission analysis ............................................... 1075.6 CO2 emissions ....................................................................... 1275.7 Service quality ..................................................................... 1375.8 Discussion ............................................................................ 1425.9 Conclusion ............................................................................ 143
CHAPTER SIX ................................................................................. 144
6. STRATEGY AND IMPLEMENTATION ............................................. 144
6.1 Need for attractive intermodal logistics solutions ........................ 1446.2 Institutional changes .............................................................. 1456.3 Innovation as the key benefit .................................................. 1536.4 Conclusion ................................................................... 155
CHAPTER SEVEN ............................................................................ 156
7. Discussion and conclusion ............................................................ 156
7.1 Methodological issues ............................................................. 1567.2 New logistics findings ............................................................. 1577.3 Need for further research ...................................................... 158
References .................................................................................... 159
1. APPENDIX 1: Customers (manufacturers) Questionnaire .............. 169

6
ABBREVIATIONS
KTMB : Keretapi Tanah Melayu Berhad ICT PKIC
: Ipoh Cargo Terminal : Port Klang Ipoh Corridor
NCER : Northern Corridor Economic Region ECER : East Coast Economic Region PTP : Port of Tanjung Pelepas MOT : Ministry of Transport MITI : Ministry of Trade and International Industries ITA : Intermodal Transport Authority PoR : Port of Rotterdam POG : Port of Gothenburg TEU : Twenty-foot Equivalent Unit CO2 : Carbon Dioxide SPAD : Land Public Transport Authority GHG : Green House Gas

7
CHAPTER ONE 1. INTRODUCTION
1.1 Background of the study
Changes in freight movements occur as a result of technology and societal demand and the growth of e-business and globalization. Transport modes as a whole play an important role in the economic development of a nation. One of the main aspects that a nation has to consider is to ensure that the transport modes develop in line with the broad macro-economic objectives. Efficient intermodal points of cargo transfer such as ports, airports and inland transfer facilities have to be further developed. With the significant growth of trade in the future, an efficient freight transport system needs to be developed. The need for sustainable environmental development also leads to a demand for transport systems with less Green House Gas (GHG) emissions.
The Malaysian economy is growing at 5% per year and according to Bank Negara (the Malaysia Central Bank), annual average economic growth for the next fifteen years is expected to be 6.5%. One of the important effects of the positive economic development is the growth of international trade, of which 90% is seaborne trade. Import and export volumes of maritime cargo are therefore expected to grow significantly.
The total maritime cargo handled in 2005 was 252.6 million tonnes, of which the import volume was 46.5% and the export volume 53.5%. Port Klang, which is the main gateway to Malaysia, handled the largest volume of cargo. The cargo volume in Malaysian ports in 2005 and forecasts until 2020 are shown in Table 1.1:1.
Table1.1: 1 Import & Export VolumeYear Import Export Total
Million tonnes Million tonnes Million tonnes 2005 117.5 135.1 252.6 2010 185.3 207.3 392.6 2015 256.3 286.7 543.0 2020 354.5 396.5 751.0
Source: Ministry of Transport & Industrial Master Plan 3 (2005)
Container trade is greater than non-container trade. This is shown in Table 1.1:2 and this trend is expected to continue since Malaysia focuses more on manufactured products.

8
Table 1.1:2 Container & Non-container Trade Container Non
Container Total
Million TEUs
Million tonnes
Share%
Million tonnes
Share%
Million tonnes
Share%
2005 12 139 55 113 45 252 100 2010 18 225 57 168 43 393 100 2015 26 319 59 224 41 543 100 2020 36 441 59 310 41 751 100 Source: Ministry of Transport & IMP3
The container volume is expected to be significant in the Malaysian logistics industry. Containers moving in and out of the country are referred to as “local containers”. Transhipment containers are referred to as “containers in transit” using Malaysian ports without entering the Malaysian hinterland. With the rapid development of and investment in Port Klang and Port Tanjung Pelepas, Malaysia will be one of the main transhipment hubs in the region. Table 1.1:3 shows the local and transhipment container volumes.
Table 1.1:3 Local & Transhipment Containers
Source: Ministry of Transport &IMP3
The table shows that Malaysia’s annual container volume is expected to grow by more than 68% from 2005 to 2020. More than 40% of container shipments are expected to be local containers (import and export). As the main gateway to Malaysia, North Port in Klang handles almost 65% of the local container shipments. North Port has efficient operations but in order to have a seamless and efficient supply chain, hinterland container transportation also needs to be further developed. 90% of local shipments to the hinterland are transported by road and the remaining 10% by rail.
The immediate hinterlands of the major ports face congestion, safety and security problems. The number of accidents and container hijackings involving container trucks has been a relatively large problem for the country. Environmental issues are also becoming more important for the Malaysian government. It has encouraged a set of “freight best practices” to promote operational efficiency that contributes to CO2 reduction. However, Malaysian environmental awareness and implementation of CO2 reduction measures have been rather slow. In general, transportation emissions constitute to 18% of the total greenhouse gas (GHG) emissions. Total GHG emissions increased 4.3 times from 1990 to 2007. The government has
Local Transshipment TotalMillion TEUs Million TEUs Million TEUs
2005 4.9 7.1 12.0 2010 7.2 10.8 18.0 2015 11.0 15.4 26.4 2020 15.3 21.3 36.6

9
therefore pledged to achieve a GHG reduction of 40% by 2020.(Ministry of Environment, 2010). The effectiveness of transport planning could thus contribute towards help the nation achieve its green objectives.
The ratio of hinterland container transport by rail needs to be changed into an efficient and sustainable way to handle the expected growth of container volumes in the future. The government and industry are looking at the idea of expanding road-rail intermodal container transport as one of the main logistic solutions to reduce the congestion on roads and at ports, as compared to direct door-to-door road haulage.
The existing situation has raised concerns among official as the single track from Northport to the main Malaysian railway network is less than five km but is underutilized. Four inland terminals and three inland clearance depots are readily available along the main railway line. However, almost all of these inland terminals have a utilization rate of less than 40%. The double-track project to the border with Thailand is not expected to be completed until 2015.
At present the rail freight service is unattractive due to service issues such as the time factor, frequency and flexibility in fulfilling customer needs. Keretapi Tanah Melayu Berhad (KTMB), the sole Malaysian rail operator, operates mainly old locomotives. According to the KTMB Employees Union, when locomotives break down, almost 40% require extensive repair. Priority on railway tracks is given to passengers’ movement. An almost 70% single-track railway has had a negative impact on the capacity for road-rail intermodal services. The inflexibility of the service has also affected the customers’ trust in the services provided by KTMB. KTMB’s capacity and operational problems need to be resolved in order to make intermodal container transports logistics more attractive.
1.2 Problem statement
Container volumes are expected to increase dramatically over the next ten to fifteen years. It is therefore important to develop a logistically efficient and sustainable hinterland container transport system. Inefficiency and environmental aspects are major challenges for hinterland transport. One option might be to promote intermodal rail-road transportation, a solution that has become increasingly popular in many developed countries. There is currently a lack of knowledge of how a hinterland transport system for inland container movements in Malaysia should be developed in order to satisfy logistics demands from both customers and operators. There is therefore a need for research into developing and evaluating successful intermodal hinterland container transport as an alternative solution for sustainable freight transport for inland container movements.

10
1.3 Aim of the study
Overall aim: To develop possible strategies for improving the logistics in the intermodal hinterland container transport system based on customer demand, cost-efficiency, environmental impacts and quality. Sub-aims
a) To analyse the current hinterland container transport system, including the customers, service providers and government agencies.
b) To analyse import and export customer demands and priorities regarding hinterland container transportation
c) To evaluate and compare existing and direct road haulage based solutions with intermodal hinterland container transport in a selected corridor
d) To discuss and propose strategies for implementation of large-scale intermodal systems’ logistics in Malaysia, including government transport policies and the need for institutional changes and incentives.
1.5 Scope and limitation of the study
Malaysia consists of two mainlands: Peninsular Malaysia and part of Borneo. (Figure 1.5:1). The study was conducted in Peninsular Malaysia.
Figure 1.5:1 Location of Malaysia

11
Malaysia’s hinterland container transport operates in a merchant haulier system, which means that Malaysia practises a merchant haulier system whereby the importers or exporters are responsible for arranging delivery and pick-up of their containers. They do this either themselves or by using the services of independent freight forwarders. The merchant haulage inland transportation is performed by an inland carrier contracted by and for the account of the shipper or consignee.
The hinterland container transport system in Malaysia is illustrated in Figure 1.5.2. The system consists of three main actors: 1) customers, 2) service providers and 3) the government. The customers identified for the research are manufacturers and freight forwarding agents. The manufacturers are located in Malaysia’s industrial areas. Freight forwarding agents act on behalf of the manufacturers to arrange transport and logistics according to the manufacturers’ needs. There are tow main categories of service providers: terminal operators (port and inland terminals) and carriers (road and rail operators). The government is the regulatory body that develops and implements the laws, polices and regulations for the hinterland transport system to function. These three actors are the scope of study in analysing the hinterland transport system.
Figure 1.5:2 Actors in the hinterland transport system
The hinterland transport system focuses on container movements to and from three ports in Malaysia: Port Klang, Penang Port and Johor Port. Figure 1.5:3 shows the locations of the three ports. The ports were chosen as:
Actors in hinterland transport system to/from ports
Demand (Customers) o Manufacturers o Freight
Forwarding agents
Supply (Service providers) Carriers o Rail operator o Road Haulage o Terminal operators o Port operatoro Inland terminal
Governmento Policies o Laws o Regulations

12
a) Port Klang is the main gateway to Malaysia. Almost 65% of the local containers go through Port Klang
b) Penang Port, situated in the north-west of Peninsular Malaysia, is the main container terminal gateway for the northern region of Peninsular Malaysia.
c) Johor Port, situated in southern Peninsular Malaysia, is the main gateway for containers for this region.
Figure 1.5.3 Locations of ports for the study
Local container movements to and from ports were the main focus of this study, where local container movements refer to import and export containers through Malaysian ports to the hinterland. The research concerns only general container movements. Specific containers such as reefers or tanktainers were not part of the research. Other load unit movements such as swap bodies and semitrailers were also excluded. Road and rail were the two modes analysed in the study. As such, barge, short sea shipping and air were not included in the study.
For the environmental aspects evaluation, only CO2 emissions were used to indicate the environmental impact from the hinterland transport system.
PortKlang
Johor
Penang Port

13
In 2020, Malaysia’s CO2 emissions are expected to be generated by the following sectors: the electricity generation sector (43.45%) since coal is utilized as the main fuel for combustion, followed by the transport sector (30.25%), the industrial sector (26.26%) and finally the residential sector (0.03%) (Zaini, 2010). It shows that transport contributes a high percentage of CO2 emissions. Almost 70% of CO2 emission in the transport sector is attributable to road transport.
The study focused on land transport movements (road and rail) from ports to the hinterland.
1.6 Overview of chapters
Chapter 1 focuses on the presentation of the background, the problem statement and the aim of the study.
Chapter 2 discusses the research methodology from the logistics perspective.
Chapter 3 is the literature review. It focuses on three aspects; 1) the quality factors in choosing transport, 2) the hinterland transport review of three different ports, i.e. UK Ports, Port of Rotterdam and Port of Gothenburg, and 3) transport system evaluation methods.
Chapter 4 describes the current hinterland container transport system in Malaysia. It involves describing the service providers, customers’ (manufacturers’) mode choice and the institutional framework governing the industry. This chapter is presented based on a combination of input from fact-findings and data collection; a customer (manufacturer) survey and a preliminary service provider study and interviews.
Chapter 5 describes a case study of a selected corridor. Port Klang Ipoh Corridor (PKIC) was chosen for the case study evaluation. Cost and CO2 evaluation between intermodal and direct road haulage between these two points were analysed. Based on the result, cost and CO2 emission comparisons were conducted. Future quality factors for intermodal movement such as capacity, frequency and time in PKIC were determined.
Chapter 6 describes the intermodal logistic strategies that are to be developed and implemented to promote intermodal movement in a selected corridor. In this chapter, institutional changes in governing intermodal transport are the main strategy to promote intermodal. This chapter also describes the policy needed and ways to implement the strategy to promote intermodal transportation.
Chapter 7 contains further discussion and the conclusions from the whole study.

14
1.7 Terminology
Transport logistics refers to managing and planning container movements from the land transport perspective in Malaysia.
Hinterland: Hinterland can be defined as the effective market of a port or the geo-economic space in which it sells its services and interacts with its customers. The hinterland in this study is in Peninsular Malaysia.
Hinterland container transport: The hinterland transport in this research refers to container movement to/from ports from/to the hinterland.
Service providers: The service providers are the actors involved in providing the supply of hinterland container transportation, i.e. road haulage operators, the rail operator, inland terminal operators and port operators.
Customers: The customers are the users of the hinterland transport service. The customers in this research are the manufacturers and the freight forwarding agent.
Customers (manufacturers): Refers to manufacturers.
TEUs: Twenty-foot equivalent unit, a measure used for capacity in container transportation. 1 TEU represents the cargo capacity of a standard 20 feet intermodal container. A 40-feet container is equivalent to 2 TEUs.
Inland terminals: Refers to inland ports, inland container depots (ICD) and dry ports.
Local containers: Import and export containers through Malaysian ports to the hinterland.
Transhipment containers: “Containers in transit” using Malaysian ports without entering Malaysian hinterland.
Northern region: Consists of the states of Perak, Penang, Kedah and Perlis.
Southern region: Consists of the states of Negeri Sembilan, Melaka and Johor.
East coast region: Consists of the states of Pahang, Kelantan and Terengganu.
Central (Klang Valley): Consists of the state of Selangor, including Kuala Lumpur.
Total transit time: The total time taken by containers from when they leave the port until arrival at the customer’s premises.

15
CHAPTER TWO 2. LITERATURE REVIEW
The literature review covers three main aspects: Transport mode selection quality factors for customers as well as service providers Role of intermodal in port hinterland transport systems Transport system evaluation methods.
2.1 Logistics Quality factors for mode/carrier selection
2.1.1 General transport service quality factors
According to the Japanese term, quality equals "zero defects”. It means doing it right the first time. Crosby (1979) defines quality as conformance to requirements. Garvin (1983) looks at quality by counting the frequency of internal failures (failures observed before a product leaves the factory) and external failures (failures occurring at the installation point). Gea et al. (2006) define quality of service as satisfying the requirements and expectations of the customers regarding the following factors:
a) the service satisfies customer demands b) the service fulfils reliability and capacity requirements without failure
for a determined period of time c) the manufacturer and distributor response to service failures.
When discussing service quality, three important findings by Gronroos (1982), Lehtinen and Lehtinen (1982), Lewis and Booms (1983) Sasser etal (1978) are listed below:
a) Service quality is more difficult for the consumer to evaluate than product quality.
b) Service quality perceptions result from a comparison of consumer expectations with actual service performance.
c) Quality evaluations are not based solely on the outcome of a service; they also involve evaluation of the service process.
Parasuraman et a. (1985) indicate ten determinants of perceived service quality, shown in Table 2.1:1. Some of the determinants overlap but they reflect a framework for the quality elements of any service. Gea et al(2006) used these quality determinants in their research work.
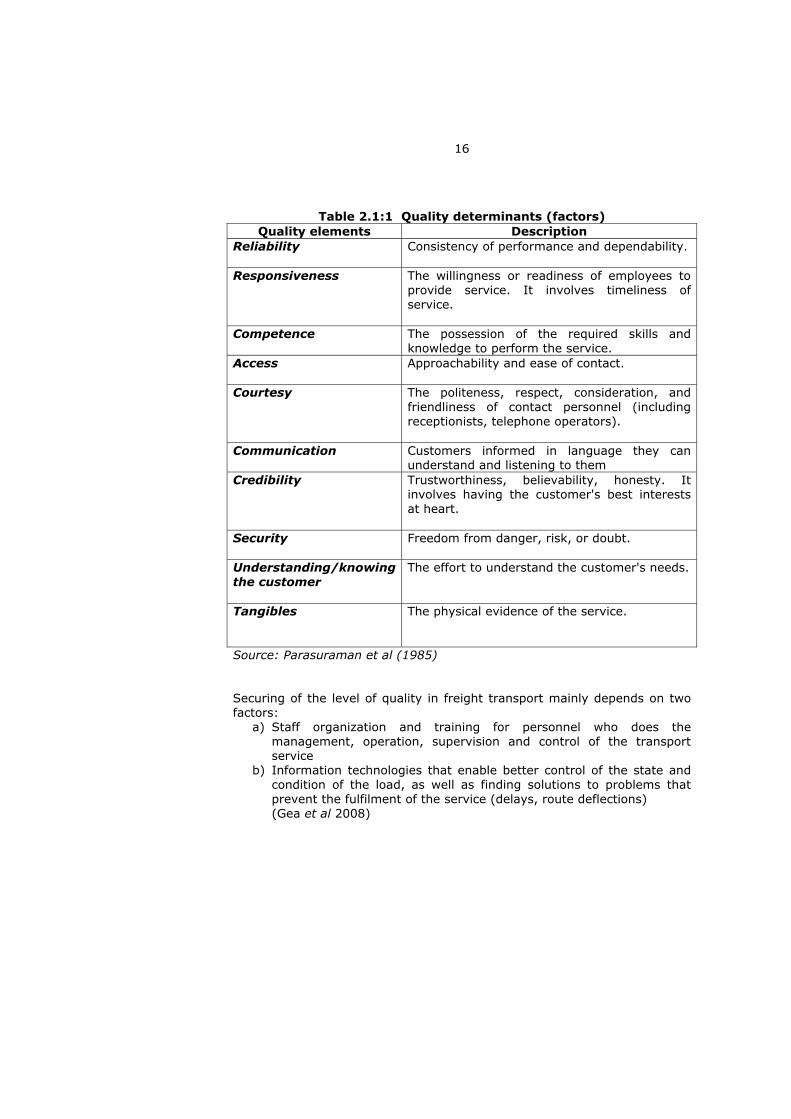
16
Table 2.1:1 Quality determinants (factors) Quality elements Description
Reliability Consistency of performance and dependability.
Responsiveness The willingness or readiness of employees to provide service. It involves timeliness of service.
Competence The possession of the required skills and knowledge to perform the service.
Access Approachability and ease of contact.
Courtesy The politeness, respect, consideration, and friendliness of contact personnel (including receptionists, telephone operators).
Communication Customers informed in language they can understand and listening to them
Credibility Trustworthiness, believability, honesty. It involves having the customer's best interests at heart.
Security Freedom from danger, risk, or doubt.
Understanding/knowing the customer
The effort to understand the customer's needs.
Tangibles The physical evidence of the service.
Source: Parasuraman et al (1985)
Securing of the level of quality in freight transport mainly depends on two factors:
a) Staff organization and training for personnel who does the management, operation, supervision and control of the transport service
b) Information technologies that enable better control of the state and condition of the load, as well as finding solutions to problems that prevent the fulfilment of the service (delays, route deflections) (Gea et al 2008)

17
2.1.2 Quality factors for selection of mode/carrier services
General shipper (customers) transport requirements
Efficiency in the freight transport industry is crucial because it would affect the customer service level of the firm that uses the service. Customer service is obtained through identification of and response to buyers’ needs and requirements with high quality product/service and delivery system at reasonable cost (La Londe 1993).
A quality transport system usually provides fast and reliable transport matching customers’ demands and enabling the firm to improve its productivity and competitive advantage. Since supply chain management has been widely applied, the value chain of a product requires an efficient mode of transport to move the goods from the point of origin to the destination (Tracey 1998). As part of the supply chain, freight transport plays a role that could affect the advantages of certain products. By having quality and efficient freight transport service, transport operators could also be able to enhance their competitive advantage in dominating the market that they are servicing. Customer requirements influence the standard of services provided by the operators.
Shippers have different service requirements regarding transport providers, ranging from specific pick-up times to equipment and communication services. The service demands are mostly related to the cost implications of the transportation service provided. The transportation service characteristics of freight shippers include transit time, reliability, accessibility, capability, and security (Coyle, et al, 1994).
OECD (2002) identified the following shipper competitive requirements for global rail freight transport services:
uninterrupted international services; ability to handle small consignments (generally less than trainload and sometimes less than wagonload, e.g. a container); frequent point-to-point services at scheduled times; guaranteed delivery times; conveniently located and easily accessible road-rail interchange, and/or door-to-door delivery by intermodal transport; specialist wagons designed to meet the needs of individual cargo flows; automatic cargo tracking and monitoring; a faster response to queries and problems; support for the development of private sidings.

18
McGinnis (1979) identified that on-time pick-up and delivery, reliability, and transit time were critical to the traffic manager. Bardi et al (1989) indicated five factors that are important for the shipper’s mode and carrier selection; transit time reliability, transportation rates, total transit time, willingness to negotiate, and financial stability. Matear and Gray (1993) identified fast response to problems, avoidance of loss or damage and on-time collection and delivery as the most important service attributes for the shippers.
Tengku Jamaluddin (1995) identified the following six service factors that shippers considered to be the most important: freight rates, cargo care and handling, knowledgeability, punctuality, transit time and service frequency. Other factors identified were fast response to problems; on-time collection and delivery, value for money and good relationship with carriers (Lu and Marlow 1999).
Based on a literature search and industry feedback on customers’ mode choice factors, Wong (2007) divided the factors into three main groups: 1) transport costs, 2) service level and 3) relationship with the carrier. These groups were used to identify the factors that influence shippers’ mode choice in southern China.
Factors for selection of transport mode/carrier
Pedersen et al (1998) have compiled the factors proposed by several authors for shipper mode/carrier selection, as presented in Table 2.1:2.

19
Table 2.1:2 Logistics factors for mode/carrier selection Factors Description
a) Timing factors
Transit time is the total time that elapses from the consignor that makes the goods available for dispatch until the carrier delivers the goods to the consignee. Coyle et al (1992) Low transit time will reduce the cost of inventory in transit and also the need to hold stock in distant market. Chrispother et al (1982) Transit time reliability and consistency: It refers to degree of variations in shipment delivery time measured against published or promised schedules. Salleh and Das (1973). It should also involve evaluation of both speed and reliability in carrier selection. Frequency is another main item under the timing factor. High-frequency transport service often increases transport cost but reduce the cost of inventory. (Bagchi et al 1987)
b) Price factors
Cost factors that affects the selection of carriers are:
Transport rate Agreement of estimated and actual costs Packing charges Carriers estimates
(Bardi 1973) In the early studies of transport mode selection, costs were the most important factors (Cook 1967) However McGinnis (1989) indicates that direct costs are no longer the most important selection criteria but rather certain service factors.
c) security/controlfactors
It concerns the safe arrivals of goods at the destination point. Bardi (1973) identifies 3 main security factors, frequency of damage, ease of claim settlement and extent of damage
d) service factors
Matear and Gray (1998) identifies service attributes are arrival time, good relationship with the carrier, fast response to problems, ability to handle special requirement and ability to perform urgent deliveries. Whyte (1993) concluded that these 3 factors ranked above the traditional criteria such as transport reliability and cost. These factors are the carrier’s ability to meet requirements at short notice, ability to understand problems and willingness to help.
Source: Pedersen et al (1998)

20
In the study on Norwegian exporters, Pedersen et al (1998) used the factors in Table 2.1:2 as the determinants for carrier selection. As can be seen, price factors were more dominant compared with the three other factors. Pedersen’s findings are listed as follows:
a) Timing factors reliability in collection and delivery time high transport frequency short transit time directness of the transport route
b) Price factors low freight rates relation between actual and estimated costs special offer/discount low parking charges
c) Security/control factor low damage /loss frequency control over delivery time ability to monitor the goods in transit knowledge of ports and harbours
d) Service factors coordination and cooperation with carrier flexibility of the carrier ability/willingness to handle urgent deliveries ability to handle special consignments
Bardi et al (1989) developed 18 factors for mode selection and divided them into four main groups as listed below: Factor 1 (Rate related)
Door to door transportation rates or costs Willingness of carrier to negotiate rate changes
Factor 2 (customer service) Transit time reliability or consistency Total door to door transit time
Factor 3 (claims handling and follow up) Claim processing Freight loss and damage Shipment tracing Pick up and delivery service Shipment expediting
Factor 4 (special equipment availability and service availability) Equipment availability Special equipment Quality of operating personnel Line haulage service Scheduling flexibility

21
From their findings, Bardi et al (1989) ranked the importance of factors for carrier selection as follows:
a) Ranking 1 : Factor 2 (Customer service) b) Ranking 2 : Factor 1 (Cost-related) c) Ranking 3 : Factor 3 (Claims handling and follow-up) d) Ranking 4 : Factor 4 (Special equipment availability and service
availability
Murphy et al (1997) and Kent & Parker (1999) ranked the specific factors used by Bardi et al (1989) as presented in Table 2.1:3.
Table 2.1:3 Ranking of mode selection factors Factor Bardi, Bagchi
andRaghunathan
(1989)
Murphy and Daley
(1997)
Kentand Parker
(1999)
Reliability 1 1 1 Equipment availability 6 2 2 Transit time 3 3 6 Pick-up and delivery 8 4 17 Financial stability 5 5 7 Operating personnel 11 6 5 Loss and damage 9 7 8 Rates 2 8 12 Service frequency 7 9 3 Scheduling flexibility 14 10 13 Expediting 10 11 9 Rate changes 4 12 4 Service changes 13 13 11 Tracing 12 14 10 Line haul services 15 15 15 Claims 16 16 18 Carrier salesmanship 17 17 14 Special equipment 18 18 16
Philips et al (1996) applied the mode selection factors proposed by McGinnis (1990) and developed six factors for mode and carrier selection. Their study looked at the different perspectives of selection between intermodal, rail and truck. The six factors are:
Factor 1 (Timeliness) Transit time Reliability of service Directness of services
Factor 2 (Availability) Availability of equipment

22
Availability at destination points Availability at origin points
Factor 3 (Suitability) Suitability of shipment size Suitability for commodity to be carries
Factor 4 (Firm contact) After sale service
Factor 5 (Restitution) Processing of loss and damage claim Amount of loss and damage
Factor 6 (Cost) Cost
Gibson et al (2002) looked at how shippers and carriers with a developed partnership ranked different factors. The shippers ranked cost as the most important factor, followed by effectiveness of services, trust, and flexibility and channel perspectives. For the carriers, trust was the most important factor, followed by effectiveness, flexibility, cost and planning.
Kent et al (2001) surveyed five different freight transport industry segments: dry van, intermodal, temperature control transport, tank transport and flatbed. Eight service attributes were used:
Reputation, quality and integrity Knowledge problem solving skills - contact personnel Quality of drivers Competitive pricing Action and follow up service complaints Billing accuracy Equipment availability Consistent, dependable transit times
Table 2.1:4 identifies the most important service factor for different industry segments:
Table 2.1:4 Most important factor in mode selection in different industry segments
Industry Most important factor Dry van Competitive pricing Temperature control Action and follow-up service complaints Tank Consistent, dependable transit times Intermodal Consistent, dependable transit times Flatbed Competitive pricing and Quality of drivers Source: (Kent 2001)

23
Philip et al (1996) ranked the perception of shippers in terms of mode selection for intermodal, rail and truck modes. Their findings are shown in Table 2.1:5.
Table 2.1:5 Shippers perception in different modes Ranking Intermodal Rail Truck
First Availability Timeliness Timeliness Second Timeliness Availability Availability Third Firm contact Restitution Firm contact Fourth Cost Suitability Suitability Fifth Restitution Firm contact Restitution Sixth Suitability Cost Cost Source: (Philip et al 1996)
Shippers’ perceptions regarding quality requirements in selecting the right carrier differ between rail and truck (Grue and Ludvigsen 2006). They rank quality factors differently between truck and rail users. The top seven factors for carrier selection by shipper are listed in Table 2.1:6.
Table 2.1:6 Top seven factors for rail and truck mode selection Truck shipment Rail shipment
Reliability of service Cost of door to door delivery Amount of loss and damage Service availability at origin pointService availability at destination point Quality of freight handling Duration of transit time from origin to destination
‘
Service availability at origin pointCost door- to door delivery Amount of loss and damage Reliability of service Processing of loss and damage Service availability at destination point Frequency of service
Source: Grue and Ludvigsen 2006
2.1.3 Conclusion
The factors for carrier/mode selection discussed in the previous sections have important implications as regards the users’ competitive business environment. The literature review shows that shippers (customers) do not always consider price to be the most important factor in choosing freight mode and operator. Freight rates have also become less important in more recent studies. Qualitative factors such as reliability, fast response to problems, equipment availability, accurate bill of lading, transport time, delivery of cargo without damage, and service frequency are as important as the price.

24
The following logistics factors used in this study are based on the review:
a) Cost factor - The cost factor for the customers includes freight rates and charges in using the service, which is one of the main determinants in carrier/mode selection. Lower cost is important in order for the firm to remain competitive with the product they are offering (differentiate between operating costs and charges).
b) Time factor – This factor includes time for and reliability of the service. The total transit time of the service would be vital for achieving competitiveness. Transit time can be reduced by increasing speed in that particular mode or by managing the movement in a more coordinated manner (Tyworth and Zeng, 1998). Reliability can be defined as the probability that a component or system will perform a required function for a given period of time when used under stated operating conditions. It is the probability of non-failure over time (Ebeling 1997). In other words, reliability can also be explained by the time differences between the expected time and the actual time taken to move the goods.
c) Safety and security - This factor includes loss and damage of goods. If any mishap occurs, the product might not be able to be available at the expected time and place. This will cause the firms monetary losses. (Branch, 1994).
d) Service factor - The service factors include frequency and flexibility of the service, willingness to negotiate rates, quality personnel and good records with customers.

25
2.2 Hinterland transport services from different ports
2.2.1 Introduction
Slack (1993) defines hinterland as the effective market of a port, or the geo-economic space in which it sells its services and interacts with its customers. Hinterland activities play a critical role in determining the success of a port. Van Klink and Van Den Berg (1998) define hinterland as the interior region served by a port. The hinterland connections, attainability of consumers, port productivity and reasonable tariffs are most frequently mentioned as important criteria by the container carriers (De Langen, 2004). Hinterland has become one of the important components in ensuring an efficient supply chain. The hinterland needs to be treated as a port logistics link within the competitive market. McCalla (1999) and Haezendonck & Notteboom (2002) both state that the significant usage of containers has increased the geographic coverage of cargo by ports.
Many ports have extended their hinterland coverage and this has intensified interport competition (Hayuth 1981) & (Star & Black 1995). Hinterland transport systems need high-capacity corridors and inland terminals. Good hinterland access is a necessity in order to attract and capture port traffic. It is therefore vital for ports to act proactively to compete in the hinterland.
Container ports have become links in global logistics chains (Robinson, 2002), shifting competition between ports to competition between transport chains that include hinterland container transport (Notteboom & Winkelmans (2001). Hinterland access is also a key success factor for European ports (Bundesamt Fur Guterverkehr, 2005). The hinterland transport connections of a port are a part of the transport chain and determine the competitive edge of the port. Ports increasingly aim to enhance the quality of their hinterland transport services (Notteboom & Winkelmans, 2004). Since the hinterland coverage has increased with containerization, intermodal systems allow containers to travel longer distances (Song, 2003 and Lacerda, 2004). This facilitates decentralization of the cargo-stowing in containers, which can now be performed at the origin of goods in factories, or through specialized services, away from areas of ports, thus expanding their hinterlands.

26
The main conditions of a suitable hinterland transport system have been identified by many authors (Robinson, 2002; Notteboom & Rodriguez, 2005; and De Langen, 2008) are:
a) the transport infrastructure needs are sufficiently well developed and efficiently used;
b) the actors involved in the transport chain need to be well coordinated and
c) the services provided by private firms, such as terminal services and barge services, need to be attractive.
Generally speaking, there are three types of hinterland transport chains, as identified by Van Der Horst and De Langen (2008). These are:
a) Barge inland waterways hinterland chain (sea – road/rail intermodal) b) Railway hinterland chain (rail-road intermodal) c) Trucking hinterland chain
The number of actors involved in a hinterland chain is an indicator of how complicated it is. Table 2.2:1 shows the actors involved in each hinterland chain for the Port of Rotterdam. Road haulage has the simplest hinterland chain compared to intermodal alternatives.
Table 2.2:1 Actors involves in each hinterland Hinterland mode Actors involved
Barge (intermodal with road)
Barge operator Container terminal operating company Terminal operator in port Forwarder Road haulage Shipper and consignee
Rail (intermodal with road)
Rail operator Railway company Rail terminal operator in hinterland Infrastructure manager Forwarder Road haulage Shipper/Consignee
Road Trucking company Forwarder Shipper/consignee
Coordination and cooperation between the actors in the hinterland chain is highly needed to ensure efficient and attractive hinterland transport (Woxenius et al, 2004).

27
Table 2.2:2 lists four categories of coordination problems identified for the Port of Rotterdam (Van der Horst and De Langen, 2008), which may be similar to other ports in the world.
Table 2.2:2 Hinterland Coordination problems General problems Barge
problemsRail problems Road
problemsLack of information exchange Hinterlandinvestment is not coordinated between actorsNon-supportive from transport companies in terms of cargo controlling when new services are being introduced Lack of planning for empty containers Lack of customs physical and administrative inspection and with inspection authorities Lack of information on container clearance
Operational issues: Long stays and small shipments Planning problems regarding sailing schedule Limited cargo exchange
Peak load terminal UnusedtracksLimitedplanning at rail terminal Limitedexchange of traction Limitedexchange of rail cargo
Peak load arrival and departurewhich cause inefficiency problem and congestion issues Lack of information about truck drivers Limitedexchange cargo and truckingcapacity
One of the main issues in the hinterland transport service is to decrease reliance on road haulage. The benefits of rail and inland waterways are as follows:
a) lower environmental strain, b) less nuisance in port city traffic, c) lower transport distance costs, faster throughput in ports, d) in most cases, less sensitive to delays caused by traffic congestion.
2.2.2 UK Ports
Container traffic has been growing rapidly in UK ports for the last 20 years. The Department for Transport (DfT) forecasts that UK container traffic will have increased by 178% by 2030. With the expected rapid growth in container throughput, UK hinterland transportation will be more critical unless effective action is taken (DfT, 2006, Focus on Ports: 2006 Edition, London)

28
The main container ports in the UK are listed below (DfT 2008) with their throughputs:
a) Felixstowe (3.1 million TEUs) b) Southampton (1.6 million TEUs) c) London (0.96 million TEUs), d) Medway (0.77 million TEUs) and e) Liverpool (0.67 million TEUs).
In 2007, three of the UK ports were among the top 20 European container ports. Felixstowe was ranked 7th, Southampton 11th and London 20th (European Commission, 2008). Container movement through UK ports is illustrated in Figure 2.1. Container movements into the UK are categorized into three sectors with their own handling actors.
Figure 2.2:1: Container movement in UK Ports
Source: DfT UK (2008)
In 2006, the modal split between road and rail at UK port was 75-25. Two main container ports, Felixstowe and Southampton, have good road network connections. However, the roads are heavily congested during peak hours. Most road haulage pick-ups occur around 8am (DfT 2008), leading to congestion inside the port. The port authority has identified the problems and come up with solutions to overcome the congestion problems (Petitt & Beresford 2007). For road haulage in general, congestion on the arterial road network is common. Without proper measures such as more investment in the road system and a comprehensive road pricing system, the congestion and environmental problems are likely to increase in the future (Asteris & Collin, 2009).

29
Hinterland container transport by rail has been growing rapidly since 1998. Its market share had increased to 24% in 2005 and is expected to continue to rise. Two main UK container ports are connected to the same 14 inland terminals. Most of these terminals only handle containers (Woodburn, 2008). Rail freight movement has shown great potential for development. The busiest corridors from the port to the hinterland have 50 trains per day in each direction. The UK has four main railway operators (Woodburn, 2007). The operators’ market shares in 2008 are listed below (Maritime statistics DfT UK 2008): a) Freightliner - 79% b) EWS - 11% c) GB Railfreight - 9% d) Fastline - 1%
However, rail freight needs to overcome a few barriers in order to remain competitive. Asteris & Collin (2009) and DfT (2008) have highlighted these problems, which are:
lack of commercial incentive to compete with road transport lack of intermodal connectivity shortage of capacity at intermodal terminals low understanding of how to make a rail service work in practice a tendency to favour passenger traffic when prioritizing traffic movement need for specialized rolling stock in order to handle larger container sizes.
2.2.3 Port of Gothenburg
The Port of Gothenburg (PoG) is located on the west coast of Sweden and is easily accessible from the North Sea and beyond. It is the gateway to Sweden and other Scandinavian countries and is the largest port in Scandinavia (PoG, 2007). Gothenburg has a very strategic location with 70% of the total Scandinavian industry and population within a radius of 500 km. PoG handles a huge portion of Sweden’s international trade and is the only port in Sweden that has direct transoceanic traffic (Vastra Götaland, 2007). PoG has the largest container terminal in Sweden, handling 65% of Sweden’s container traffic, about 900,000 TEUs (PoG, 2008).
In 2008, rail handled 40% and road 60% of PoG’s inland container movements. Rail increased its market share from 20% in 2001 to 40% in 2008. Table 2.2:3 shows the hinterland container transport modal split from 2001 until 2008.

30
Table 2.2:3 Modal split between road and rail for container traffic 2001-2008: Port of Gothenburg
Mode/ Year
2008 (%)
2007 (%)
2006 (%)
2005 (%)
2004 (%)
2003 (%)
2002 (%)
2001 (%)
Road 60 62 66 72 75 75 78 80 Rail 40 38 34 28 25 25 22 20
Source: Port of Gothenburg (2008)
Figure 2.2:2 illustrates the volume of containers that travel to/from the hinterland (Woxenius, 2008). Road was the main choice for container movement within a 50-km radius of the port. PoG has good interregional road connections; the major cities in Scandinavia such as Stockholm, Oslo and Copenhagen can be reached by road within six hours. Further road network improvements linking Gothenburg with Denmark may increase the competitiveness of road transport to move the containers (PoG 2008).
Figure 2.2:2 Port of Gothenburg hinterland volume and destination for road
Source: Woxenius (2007)

31
Rail dominated the hinterland container movement for distances over 100 km. PoG’s development and implementation of an effective rail strategy have successfully increased rail’s market share since 2001 (Woxenius & Bergqvist, 2007). In 2008, PoG was served by ten different rail operators with 24 daily shuttles compared with six daily shuttles in 2002 (PoG 2009). Each operator has its own inland terminal serving a specific region.
The introduction of RAILPORT was one of the main success factors as regards rail services. RAILPORT Scandinavia is a coherent, integrated rail shuttle system that links PoG with a large number of important consumption and production centres through RAILPORT terminals around Scandinavia.
RAILPORT terminals are full service terminals with frequent rail connections to PoG and they are located all round Scandinavia. The main attraction of using the RAILPORT concept is cost-effectiveness and service availability. These two factors give customers shorter lead-times, greater flexibility and simpler administration processes (PoG, 2008).
The development of inland container terminals (dry ports) has assisted the fast growth of rail services, helping to generate more capacity for rail transport. There are five different types of rail freight terminals in Sweden: Intermodal Freight Centres (IFC), conventional intermodal terminals, light-combi terminals, wagon-load terminals and freeloading sites. The differences between these terminals are location, services offered, traffic modes and goods handled (Rosso, 2008).
Eskilstuna dry port handles 65,000 TEUs per year. The biggest advantage, apart from improved customer service for the customers in the area, is the attractiveness of the region for the establishment of new businesses, resulting in new jobs (Rosso, 2008). Direct rail and road connections make Eskilstuna a perfect centre for logistics and distribution in the Mälar Valley (Eskisltuna Kombiterminal, 2009).
Other inland terminals that could be classified as dry ports are Stockholm-Årsta and Karlstad-Vänerterminalen. These dry ports offer a wide range of activities, including customs clearance and storage of containers. Other actors in container freight services such as forwarders, road hauliers and shipping agencies are also situated at these dry ports.
2.2.4 Port of Rotterdam
The Port of Rotterdam (PoR) in the Netherlands is located centrally in northwest Europe on the estuary of the rivers Rhine and Maas, Europe’s most important inland waterways (De Langen & Chouly, 2006). Almost 60% of distribution centres in the Netherlands are located around PoR (Hacket 2006). PoR not only serves the Netherlands but also the hinterland of Germany, Belgium, Luxembourg and France (Arjen, 1998).

32
In 2008 PoR was the largest container terminal in Europe and the 9th largest in the world with 10.74 million TEUs. Almost 73% of the throughput was shipped to the hinterland. PoR’s container throughput increased by 95% between 1995 and 2004 and is expected to increase by another 70% by 2020 (De Langen & Chouly, 2004; Municipality of Rotterdam and Port Authority Rotterdam, 2004). Effective and efficient hinterland transport connections are important for PoR to accommodate the increasing container volume.
In 2002, PoR formulated a new hinterland strategy for container traffic to be able to handle the increasing volume. The main objectives of the strategy were (De Langen & Chouly 2004):
Intensify efforts in the natural hinterland; Enlarge the hinterland through development of specific corridors; More attention to merchants (like shippers and freight forwarders); Improvements in the supply chain through information and communication technology (ICT); Focus on inland shipping and rail transport
Three main transport modes serve PoR’s hinterland; road, rail and barge (inland waterways). The mode split for hinterland container transport from 2005 until 2008 is shown in Table 2.2:4.
Table 2.2:4 Modal split for hinterland traffic: Port of Rotterdam Mode 2008 (%) 2007 (%) 2006 (%) 2005 (%) Road 57.1 58.5 58.6 60.1 Barge 30.2 30.4 30.5 30.5 Rail 12.7 11.1 10.9 9.4
Source (Port of Rotterdam 2008)
In 1995, road transport handled 62% and in 2008 57% of PoR’s hinterland container volume. Road haulage is thus the major mode for inland container. In 1997, PoR had 4,000 truck movements per day (Arjen, 1998). There is only one major road providing access to the port and this has become a serious problem for PoR. The A15 corridor is a crucial traffic artery to and from PoR. With hinterland container throughput expected to rise, congestion has become a main concern for PoR (IJsselstijn et al,2006). Many containers transported by road are also transported nation-wide. PoR has therefore taken a number of measures to improve accessibility along this corridor (PoR 2008).
Due to the port’s geographical surroundings, barge transport is one of the major and increasingly important modes to serve the PoR’s hinterland. In 1985, barge transport handled only 200,000 TEUs. In 2005, the number had increased to two million TEUs (PoR 2008) because of the port’s ability to offer cheap, reliable services. Barge transport in the PoR from Rhine traffic serves three main hinterlands (Visser et al, 2007) as described below:

33
a) 40% of the total volume serves Germany within a distance of between 200 and 900 km from PoR.
b) 35% is container barge traffic between PoR and Antwerp covering a distance varying from 125 to 180 km.
c) 25% consists of national traffic at distances ranging from 50 to 250 km with varying traffic flow.
For barge transport to remain competitive, PoR has the cooperation of barge operators who have developed a ‘barge-train service’ where goods are shipped to Germany by barge and put on trains there.
Rail service is the third mode that serves PoR’s hinterland transport. Rail container traffic is predominantly international traffic at distances ranging from 150 km (to Antwerp, Belgium) to 1,100 km (North Italy) (Visser et al, 2007). To increase rail’s efficiency and capacity, a new line known as the Betuweroute has been developed. This line covers a distance of 160 km and connects PoR with the German rail network with the capacity to handle ten freight trains per hour (Betuweroute, 2008). The objectives of this line are to obtain:
a) additional capacity for goods flows to and from Rotterdam b) a reduction of transport costs through lower out-of-pocket and time
costs. With low transport costs, greater modal split for the rail is expected.
Rail service has increased its mode share from 9.4% in 2005 to 11% in 2008. With the opening of the Betuweroute line, rail container traffic is expected to increase by up to 20% in 2035 (PoR 2008). This new line has boosted container traffic because it is a dedicated cargo railway line between PoR and its hinterland. It has created new rail opportunities and services with competitive freight tariffs and quality. Rail service centres at the port are the terminuses for container trains connecting Rotterdam with Europe. Extra capacity has been created with the opening of the Euromax Terminal at Maasvlakte 1 (PoR 2008). From an infrastructural point of view, PoR is aiming to shift the modal split in favour of rail transport, a shift which will not just benefit Rotterdam but Europe as a whole (Van der Horst & van der Lugt, 2009.)
The importance of inland waterway, rail and short sea shipping makes Rotterdam an important intermodal transport node. A key characteristic of intermodal transport is that coordination between various components of the intermodal chain is required (Bontekoning et al, 2003). PoR has targeted the modal split in 2035 for hinterland container movements for barge at 45%, rail 20% and road 35%. Even though barge will be the biggest modal split in hinterland transport, the objective is also to increase rail performance by up to 20% by 2035.
34
2.2.5 Conclusion
Hinterland transport has become the most important cost factor in the end-to-end container movements. Competition between ports is now putting more focus on the port-hinterland chain. Although road transport is still the dominant hinterland mode of transport, it is being gradually reduced as new alternative modes of transport are developed. Most ports now look for any alternative mode of hinterland transport to handle the increasing container traffic.
Container volumes at Malaysian ports are expected to increase significantly in the next 10 to15 years. The hinterland movement is also expected to rise, since 45% of the container volume moves into Malaysia. New alternative hinterland transport systems are therefore needed depending on the ports’ geography surroundings. The Port of Gothenburg has been successful with rail freight and Rotterdam is increasing its rail and inland waterways in order to expand the hinterland and cope with increasing container volumes.
Rail-road intermodal transport systems supported by existing inland terminals are an alternative that can be further developed in Malaysia. This study focuses on the actors in the hinterland transport system and analyses the requirements for such development in Malaysia. It is important to understand the views of every actor and a comprehensive approach in developing the alternatives hinterland transport must be taken for the success of this system in the Malaysian context.
Environmental concerns play an important role for the enhancement of intermodal hinterland container transports to/from European ports through reduction of the number of trucks on the road. The same benefits can be realized in Malaysia by successful implementation of intermodal hinterland transport.

35
2.3 Transport system evaluation methods
This section presents a literature review concerning methods for evaluating transport systems from various perspectives. Several approaches have been found that cover different aspects and research objectives:
a) Sustainable competitive advantage (SCA) b) Cost models c) Innovation management theory d) Service quality model (Gap analysis) e) Simulation f) Stated preference
2.3.1 Sustainable Competitive Advantage (SCA)
SCA can be considered an important tool in achieving the objectives set by a firm (Coyne, 1986). The classic definition of SCA is a competitive strategy as an integrated set of actions designed to create a sustainable advantage over competitors (Barney, 1991). Jensen (2008) describes SCA as a unique combination of properties that allows the system to provide an output with a cost-service ratio that is preferred by customers over the competitors. SCA focuses on the current competitor as well as potential future competitors (Panzr & Willig, 1982).
In order for SCA to meet its objectives, several conditions need to be fulfilled. They are:
The customers consistently perceive differences between the services offered by the firm and its competitor. The customer should perceive a valuable difference. The difference is a direct result of a capability gap. The services must be rare among the firm’s current and potential competitors. The differences must last over some period of time. The competitor should not be able to imitate the service easily. There should not be any equivalent substitutes for the services provided.
Day and Wensley (1988) state that most researchers identify two main sources of competitive advantage: unique resources (assets) and distinctive skills (capabilities). The physical structure and capabilities of the firm such as manpower could be vital factors in achieving the appropriate strategy. According to Porter (1985), important competitive positional advantages are: 1) superior customer value through differentiated goods/services and 2) relatively low cost.

36
According to Jensen (2008), a transport system needs to adopt three main SCA strategies, as previously stated by Porter (1980):
Cost advantage strategy performing most activities at a lower cost compared to the competitors Differentiation strategy describes how the seller can provide value to customers by making their product or service offering different from their competitors Focus strategy
Table 2.3:1 identifies the components of each strategy.
Table 2.3:1 Strategy elements of cost advantage, differentiation and focus strategies in transport
Cost advantage Differentiation Focus Economies of scale Economies of scope Economies of network Standardization Loading factors Resource utilization Choice of technology R&D Automation of handling traffic Experience Terminal location round trip timing Subsidies
Transport quality Transit time Frequency Reliability Goods comfort Security Controllability Flexibility Detachability Expandability
EnvironmentEmissionsOther pollutions NoiseAccidentsLand use Energy use Congestion
Marketing channels Traditional Internet
Spatial segmentation Customersegmentation Narrow product line Unique specializations
Source: Jensen (2008)

37
Zook and Allen (2001) state that achieving sustained and profitable growth was extremely difficult without at least one strong and differentiated core business on which to build. Yung-Hsiang & Chian Yu (2007) conducted a study on the relationship between core competencies and the SCA of an air cargo forwarder. SCA was used in this study in order to determine the capabilities of the air cargo forwarder in optimizing its internal capabilities for achieving SCA. The core competencies for the air cargo forwarder in SCA were key capabilities, resources and logistic services. Dupre and Gruen (2004) indicated that it was important for members of the FMCG industry to obtain SCA in order to remain competitive and to eliminate inefficiencies along the supply chain. This would be important because it would increase the revenue of the firms.
2.3.2 Cost models
McGinnis (1989) discusses four economic models that are used to evaluate modal choice: 1) The classical economic models; 2) Inventory theoretical model; 3) Trade-off models and 4) Constrained Optimization model.
A classical economic model (1) can be used to evaluate the fixed and variable costs of the mode of transport. The Inventory theoretical model (2) applies to a total logistic cost concept to analyse modal choice from a business logistics viewpoint (Baluwens et al, 2006). Explicit attention is paid to all costs in the supply chain that are affected by the choice of transport model. The model optimizes mode choice by considering trade-offs between the factors that influence mode choice such as freight rates, speed, and reliability.
The Trade-off model (3) focuses on non-transport cost differentials (NTC) that would affect shippers. The last model discussed by McGinnis is the Constrained Optimization model (4). This model optimizes the constraints identified by NTC and emphasizes selecting the right variables in order to choose the right mode of transport.
Jensen (1990) developed a cost model for combined transport for the Swedish railway system. This cost model calculates the business cost as well as the socio-economic cost. Floden (2007) developed a Heuristics Intermodal Transport Model (HIT Model) where three different costs are calculated; business economics cost, socio-economic cost and environmental effects.

38
2.3.3 Innovation Management Theory
Wiegmans et al (2005), Wiegman et al (2007) and Wiegman et al (2009) refer to innovation management theory in order to evaluate an alternative mode of transport. Several new innovation services were proposed and evaluated to determine the most suitable system for a specific service. The criteria for the development of an innovation are:
Cost of the innovation Technological compatibility Social compatibility Technological complexity Social complexity Market party participation Intermodalism
Wiegmans et al (2008) categorize innovations into: 1) Product innovations which change the product that the organisation offers; and 2) process innovation, which refers to a change in the way the product is delivered. Abernathy and Clarke (1985) grouped innovations into four categories: radical, architectural, incremental and modular. Afuah and Bahram (1995) combined the type of innovation with the impact of innovations on different actors.
Rogers (1995) distinguishes five factors that influence the chances for adoption and continued usage of an innovation: 1) relative advantage; 2) compatibility; 3) complexity; 4) opportunities to observe it in action; and 5) try-out. Nooteboom (1989) lists uncertainty, user friendliness, and risk as important aspects. Based on these factors, the framework of the potential success of transport innovation is shown in Figure 2.3. The approach focuses on the product or service characteristics and the user’s requirements. The innovation theory aims to ensure that the new systems can be accepted by the customers. In general, innovations require technological, organizational, social, cultural and/or institutional changes to make the innovation successful on the market.

39
One of the important features in innovation is to understand the adaptation of the innovation process, which consists of a number of steps (Rogers, 1995):
Awareness of the innovation’s possibilities Creation of an attitude towards the possibilities of an innovation Evaluation of the innovation’s potential Decision to adopt the innovation Test of the adoption Permanent adoption of the innovation.
The perception of potential users concerning the innovation is a good method to measure the chance of adoption and continued usage (Tidd et al,2001).
Figure 2.3:1 Success potential of transport innovations
Source: (Wiegmans 2007)

40
2.3.4 Service Quality Model (Gap Analysis)
Quality of a service would be considered a critical aspect of any transport service. Services have always been an area where quality is difficult to measure. Since the 1980s, a great many marketers have tried to develop models that can be used to evaluate a transport service focusing on customer satisfaction (Lehtinen and Lehtinen, 1982). There are a number of different "definitions" as to what is meant by service quality. Service quality can be defined as the difference between customers’ expectations of service and perceived service. If expectations are greater than performance, then perceived quality is less than satisfactory, leading to customer dissatisfaction (Parasuraman et al, 1985; Lewis and Mitchell, 1990).
Thai (2007) made a review of various service quality dimensions and concluded that service quality can be classified into six groups: (1) Resources-related quality dimension: this relates to physical resources, financial resources, condition of facilities, equipment, location, infrastructures, etc. (2) Outcome-related quality dimension: this involves the product or core services being received by the customers. (3) Process-related quality dimension: basically relates to factors of interaction between employees and customers. (4) Management-related quality dimension: this involves the selection and deployment of resources in the most efficient way so as to ensure that customers’ needs and expectations are met or exceeded. (5) Image/reputation-related quality dimension: this relates to the overall perception of customers about the service organisation. (6) Social responsibility-related quality dimension: this involves the ethical perception and operation of an organisation to behave in a socially responsible manner.
Based on the above dimensions, seven major gaps in the service quality concept were identified. The model is an extension of that developed by Parasuraman et al (1985). Three important gaps, which are more associated with the external customers, are Gap 1, Gap 5 and Gap 6; since they have a direct relationship with customers (Curry, 1999; Luk and Layton, 2002).
Gap 1: Customers’ expectations versus management perceptions: as a result of a lack of marketing research orientation, there will be inadequate upward communication and too many layers of management.
Gap 2: Management perceptions versus service specifications: as a result of inadequate commitment to service quality; a perception of unfeasibility, inadequate task standardisation and an absence of goal setting will exist.
Gap 3: Service specifications versus service delivery: as a result of role ambiguity and conflict, there will be poor employee-job fit and poor

41
technology-job fit, inappropriate supervisory control systems, a lack of perceived control and a lack of teamwork.
Gap 4: Service delivery versus external communication: as a result of inadequate horizontal communication, a propensity to over-promise will most likely occur.
Gap 5: The discrepancy between customer expectations and their perceptions of the service delivered: as a result of the influences exerted from the customer side and the shortfalls (gaps) on the part of the service provider. In this case, customer expectations are influenced by the extent of personal needs, word of mouth recommendation and past service experiences.
Gap 6: The discrepancy between customer expectations and employees’ perceptions: this may be the result of differences in the understanding of customer expectations by front-line service providers.
Gap 7: The discrepancy between employees’ perceptions and management perceptions: this is a result of the differences in the understanding of customer expectations and between managers and service providers.
2.3.5 Simulation
Simulation is the imitation of the separation of a real world or system over time (Banks 2000). Usually it is used to describe and analyse the operation and impacts of a system, asking questions about the real system, and to aid in the design of a real system. Simulation can be used to evaluate new transport systems. However, when evaluating both the competitiveness of possible transport solutions and the development of transport models, especially in intermodal transport design, complexity is often a problem. Approaches to evaluating transport solutions often require extensive and comprehensive data, which is difficult to access and collect efficiently (Bergqvist, 2008). A simulation model is closely related to mathematical models describing interacting processes influencing the new system performance. The simulation technique is used to introduce stochastic randomness in the model (Gordon 1969). When evaluating a transport system, the objectives of the evaluation need to be clearly understood. Balis A and Golias J (2002) used a simulation model to compare and evaluate existing and innovative road-rail freight transport terminals. Sanjay and Mark (2001) simulated the optimisation of facility location within a designed transportation network. Rizzoli et al (2002) developed a simulation model of the flow of intermodal terminal units (ITUs) between inland intermodal terminals. The intermodal terminals are interconnected by rail corridors.

42
2.4 Conclusion
Based on the literature review, this study will look into several inputs to conduct the research. Reviewing the current trend is the first step that needs to be conducted. The review will provide a better understanding of the intermodal container transport logistics in Malaysia. It is crucial to have in-depth information on the system since it influences container movement from Malaysian ports to its hinterland.
A customer survey will be conducted. The survey looks at the factors that influence customers’ choice of mode of transport for their container movements to and from the ports. The survey will also focus on the current usage of intermodal movement (if any) by the customers. The institutional aspect is the next issue to be discussed. Here, the agencies, policies and regulations relating to intermodal movement are reviewed. It highlights (if any) the policies that directly govern intermodal transport
The next step is the case study analysis, where one corridor is selected and an in-depth analysis made of costs and CO2 emissions. The case study determines whether the selected corridor would have enough capacity for intermodal to be one of the main transport systems. It will also look at the service quality required in order to increase intermodal’s share in the corridor. A service quality evaluation can thus be conducted to ensure that supply and demand can be matched.
The case study highlights the most cost-effectiveness and environment-friendly intermodal system for the corridor so it needs to have a new strategy to promote intermodal transport. The next step is to develop strategies and to implement those strategies.

43
CHAPTER THREE 3 RESEARCH METHODOLOGY
3.1 Overview of methodology
Figure 3.1:1: Research stages
This research consists of five stages.
1: Literature review and inventory fact-finding (Chapter 2)
2: Customer survey and service provider study
Analysis of the current system
(Chapter 4)
3. Case Study: Logistics analysis of enhanced intermodal system
Cost analysis CO2 emission analysis Discussion
(Chapter 5)
4: Intermodal logistics strategy for
implementation (Chapter 6)
5: Discussions and conclusions(Chapter 7)

44
Stage 1
Literature review and inventory fact-finding
The literature review covers three main aspects: Transport mode selection quality factors Port hinterland transport systems Methods for evaluation of any transport system.
The first part of the review highlights quality criteria and factors from the customers’ and operators’ point of view. The second part reviews three European countries, focusing on their main ports and hinterland transport services for container movement: UK, Sweden (Gothenburg Port) and the Netherlands (Port of Rotterdam). Each country/port has different approaches for handling and operating hinterland container transport. The last topic reviews different methods for evaluation of transport systems. The objective of this topic is to look for the most suitable evaluation approach to be applied in this research work.
Stage 1 also includes an inventory/fact-finding regarding Malaysian container freight volumes and port facilities. The purpose is to obtain an overview of the freight transport system’s characteristics and needs, covering the service provider, the customers and the government agencies involved in operating and regulating the industry.
Stage 2
Customer (manufacturer) survey, service providers and institutional framework study
In the second stage, three studies were conducted; 1) customer survey and 2) service provider studies and 3) institutional framework studies. The customer survey was intended to gather information on the current use of hinterland container transport services and the factors customers preferred when choosing a hinterland container transport mode. This survey was conducted on customers (manufacturers). For the service provider studies, interviews were conducted with port operators, rail operator, road haulage operators and freight forwarders to describe the current system and demand for hinterland container transport. The institutional framework study was conducted by reviewing the policy related to hinterland container transport and through interviews with government agencies that govern the hinterland container transport industry. Two expert interviews were conducted: 1) individual expert interview and 2) expert panel discussion.
The data was used to analyse the current system and determine the parameters to be set in developing strategies for the hinterland container transport services.

45
Stage 3
Case Study: System analysis and evaluation
Port Klang-Ipoh Corridor has been selected as a case study for system analysis and evaluation stage.
The quantitative evaluation will include cost estimations and CO2 emissions analysis for case study scenarios in the selected corridor. In conducting the analysis, several scenarios are created to analyse the impact of quality factors on cost efficiency in the corridor.
1) Analysis of cost and emission factors
The evaluation includes cost analysis and CO2 emission analysis from a range of intermodal service scenarios (system scenarios and transport resource input). From the findings in the case study, quality service factor evaluations are made between the intermodal and direct road haulage system in this corridor. The quantitative evaluation will include cost estimations and CO2 emissions analysis for case study scenarios in the selected corridor. In conducting the analysis, several scenarios are created to analyse the impact of quality factors on cost efficiency in the corridor.
2) Qualitative evaluation of other factors The qualitative evaluation focuses on the services developed for the hinterland transport system. The evaluation is to set the service level required by the customers based on operators’ capability.
The scenario presented is a combination of quality factor indicators such as capacity, time and frequency in order to suggest a more efficient and sustainable system that can handle the expected future growth of the container industry. The proposal consists of the descriptions of the intermodal corridors and strategies for the system to operate.
Stage 4
Strategy development and implementation
At this stage, the strategy to promote intermodal was developed. Various ways for the strategy to be implemented in the corridor are also discussed. An institutional change was the main strategy presented in this study.
Stage 5
Discussions and conclusions – need for further research
3.2 Data needs
The data needs for system development and evaluation can be divided into two categories: 1) data needs for existing system and 2) data needs for the proposed system. These are described in Table 3.2:1.
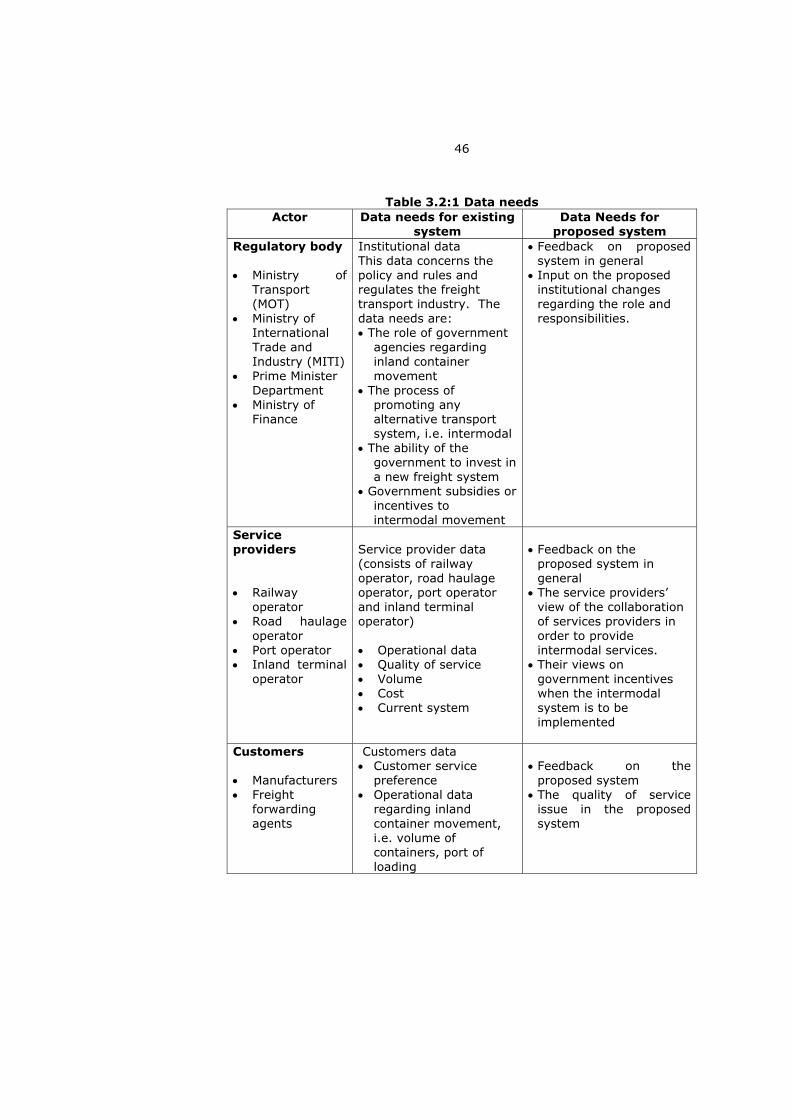
46
Table 3.2:1 Data needs Actor Data needs for existing
systemData Needs for
proposed system Regulatory body
Ministry of Transport(MOT) Ministry of International Trade and Industry (MITI) Prime Minister Department Ministry of Finance
Institutional data This data concerns the policy and rules and regulates the freight transport industry. The data needs are:
The role of government agencies regarding inland container movement
The process of promoting any alternative transport system, i.e. intermodal
The ability of the government to invest in a new freight system
Government subsidies or incentives to intermodal movement
Feedback on proposed system in general Input on the proposed institutional changes regarding the role and responsibilities.
Serviceproviders
Railway operatorRoad haulage operatorPort operator Inland terminal operator
Service provider data (consists of railway operator, road haulage operator, port operator and inland terminal operator)
Operational data Quality of service Volume CostCurrent system
Feedback on the proposed system in generalThe service providers’ view of the collaboration of services providers in order to provide intermodal services. Their views on government incentives when the intermodal system is to be implemented
Customers
Manufacturers Freight forwarding agents
Customers data Customer service preference Operational data regarding inland container movement, i.e. volume of containers, port of loading
Feedback on the proposed system The quality of service issue in the proposed system

47
3.3 Data collection methods
3.3.1 Overview
Quantitative volumes, performance levels and cost data will be needed to develop and evaluate the economic and environmental impacts of the proposed new system compared to the current system. Qualitative data regarding service quality and institutional issues will mainly be needed for the sustainable competitive advantage study.
Table 3.3:1 presents an overview of data collection in the different stages.
Table 3.3:1 Summary of data collection methods
Data collection at different stages
Methodology
Stage 1 Literature review and inventory fact-finding
Literature, website info, companies’ annual reports
Stage 2 Customer (manufacturer) survey, service providers and institutional framework study
Customers survey (manufacturers) Service providers:
Road Haulage Rail operator Port Operator Inland Terminal Operator
Government agency Current container transport system and statistics (demand volumes, modal split, regional distribution, infrastructure, handling facilities, costs)
Questionnaire followed up by interviews
Individual expert interview and expert panel discussions
Data provided by system actors, statistics providers, etc
Stage 3 Case Study: System analysis and evaluation
Cost model
CO2 emission calculations
* Data collection process is presented at section 3.3.6

48
3.3.2 Questionnaire
In Stage 2, a questionnaire survey is conducted to obtain data on customers’ current preference as regards hinterland transport. The customer survey is performed on manufacturers. This survey is intended to set a background understanding regarding the mode of transport used by customers for hinterland transport and how they rate the quality aspects of the service.
3.3.3 Interviews
In-depth interviews are used as the main instruments in stages 2, 3 and 4 related to the description of the current system, and development and evaluation of the proposed system. (Detailed descriptions can be found in section 3.3.5).
The in-depth interview is a qualitative research method that uses open-ended questions to obtain the required data from the research area. It allows the respondents to provide opinion views in their own words (Webber & Byrd, 2010). The interviewer is able to obtain a greater depth of people’s thoughts and understanding through face-to-face or person-to-person discussion. With an unstructured interview approach, it helps the researchers to push the respondents to discuss much detail on the research topic. The main goal of this instrument is to explore in depth a respondent’s point of view, experiences, feelings and perspectives.
In-depth interviews are useful when detailed information about thoughts and behaviour or greater inputs on new issues or development are needed (Boyce & Nale, 2006). It can be applied for evaluation of impacts as well as the beliefs and the attitudes of the respondents. Detailed and highly sensitive information can be gathered in order to understand the current status of the respondents. The in-depth interview is conducted on a one on one basis which will encourage the respondents to answer willingly and sincerely. Through this method the researcher would be able to add more questions and this would thus increase the quality of the data collected (Skulmoski et al, 2007) (Cuhls, 2005) and (Seskin et al, 2002).
However, despite the advantages, there are a few drawbacks to this instrument. It can be a long process since the interview, evaluation and analysis may be time-consuming. The interviewer must have a high level of training and skills. A less skilled interviewer will increase the possibility of biased information (Boyce & Nale, 2006).

49
In this study, the interviews were conducted as follows: a) The researcher conducts the interview. b) Feedback is given to the respondents to check whether the information given during the interview is accurate. c) The interview uses purposive sampling, which means the respondent is chosen accordingly to meet the research objective’s data requirement and data quality. d) The usage of audio recording during the interview in order to reduce misinterpretation of answers given by the respondents.
3.3.4 Expert panel
Expert panel interviews can be used as a method for collecting expert opinion to be used to assess the possibilities for future development (Kuussi, 1993). Four main requirements need to be fulfilled in choosing the expert panel:
a) knowledge and experience of the research issues b) capacity and willingness to contribute and participate c) sufficient time to participate d) effective communication skills (Adler & Ziglio, 1996).
The expert panel can be used as a primary analysis method or in conjunction with other tools and is a cost-effective technique that can be applied in a variety of settings to produce reliable results (Seskin et al,2002).
3.3.5 Sampling
A purposive sampling is used for the questionnaires, interviews and expert reviews in this study. Purposive sampling is the deliberate selection of specific settings, people, or events in order to collect pertinent field data that cannot be obtained from other participants (Maxwell, 1996).
The samples were from three main actors in the hinterland container transport. Table 3.3:2 summarizes the sampling groups and data collection methods used for each group at different research stages.

50
Table 3.3:2 Sampling group and data collection methods at different stages
Respondents (Stage 2) Preliminary
StudiesInterviews
(Stage 2) Customer
survey Question-
naire
(Stage 3)Expert
Review 1 Individual
expert interviews
(Stage 3) Expert
Review 2 Expertpanel
discussion
(Stage 4) Expert
Review 3
Service providers Road haulage operators Rail operator Port operators Inland terminal operators
***
****
**
****
Government agency Port Division
(Ministry of Transport) Land Division
(Ministry of Transport) Prime Minister Department Malaysian Logistics Council (Ministry of International
Trade & Industries) Royal Malaysian Customs (Ministry of Finance) Malaysia Industrial Development Authority(Ministry of International Trade & Industries)
*
*
*
*
*
*
*
*
*
*
*
Customers Manufacturers Freight Forwarding
Agent
** *
Road hauliers for the individual expert interviews came from 3 regions: central, northern and southern. For the customer (manufacturers) survey, the respondents were selected from three regions: the northern, southern and east coast region.

51
3.3.6 Data collection process
a) OverviewThe data collection process for stages 1 and 2 included the literature survey, inventory fact-finding, a customer (manufacturer) survey, a service provider study and an institutional framework study. The data was used to describe the current system and develop the preliminary new system proposal. This proposal was influenced by current and planned intermodal hinterland transport practices in Europe and current hinterland transport operations in Malaysia. It also identified the need to study hinterland container transport throughout Malaysia rather than focusing only on Port Klang.
b) Customer (manufacturers) survey The directory from the Federation of Manufacturers Malaysia was used to select respondents for this survey. The customers (manufacturers) should be located in the states of Johor, Melaka, Perak, Negeri Sembilan, Pahang or Penang. These are the main industrial areas in Malaysia. Other criteria for sampling were: - Customers with more than 50 employees. - Revenue turnover of more than RM 5 million per annum.
It was assumed that this type of customer (manufacturer) would include regular users of containerisation with medium to large annual volumes.
A questionnaire was developed consisting of a set of questions asking the customers (manufacturers) about their current business operations and evaluation of the quality mode choice factors for hinterland container transport (Appendix 1). The quality factors were selected from the literature review in Chapter 2. A test of the questionnaire was conducted with two companies to check the validity and understanding of the questions. After revision of the questionnaire, it was distributed to 100 respondents who met the chosen criteria. The questionnaires were distributed as follows: a) 40 questionnaires to the northern region, b) 40 questionnaires to the southern region and c) 20 questionnaires to the east coast region. The questionnaire was sent via email, courier or personal delivery.
Response to the questionnaire was fairly poor with a response rate of only 18%. Due to the poor response, in-depth interviews were conducted with four selected respondents representing the highest container volumes among the respondents. The results of the in-depth interview supported the findings from the questionnaire and provided more insight into the customers’ (manufacturers’) mode choice preferences.
c) Service provider and institutional framework study Interviews were conducted with three main service providers from different sectors involved in hinterland container transport:

52
a) Kontena Nasional: Head of Container Road Haulage Operation, KL Section
b) KTMB: Head of Container Service and Operation Executive for Rail Freight Division.
c) Northport Port Klang: Senior Manager in Public Relation and Senior Manager Container Operations.
d) Deputy Managing Director, Century Logistics.
The interviews were conducted at the service providers’ premises with highly qualified and experienced respondents directly involved in container movement activities. The respondents were given a general outline of the questions before the interview. Other relevant questions were brought up during the interview session. The questions were divided into four main areas: 1) operation, 2) infrastructure, 3) regulations and 4) future view of hinterland transport services. Each interview lasted between one and two hours.
The expert review was conducted with selected experts representing service providers, customers and government agencies involved in hinterland transport services. Individual expert interviews and expert panel discussions were the main research instruments used. This process provided the respondents with an accurate understanding of the proposed intermodal hinterland container transport system. The respondents raised questions and provided ideas for the researcher to further improve the proposed concept. The respondents in the interviews are listed in Table 3.3:3.

53
Table 3.3:3 Individual expert interviews Respondent Sector/Industry
1 Century Logistics Deputy Managing Director General Manager on Haulage Services
Road Haulage
2 JP Logistics (JPL) Senior Manager Land Transport Division
Road Haulage
3 LTS Logistics Senior Manager Operation
Road Haulage
4 Padang Besar Terminal Branch Manager
Road Haulage/Inland Terminal
5 Ipoh Container Terminal Acting General Manager Manager Business Development
Inland Terminal
6 Keretapi Tanah Melayu Senior Manager Business Development Freight Business Unit
Rail
7 Port of Tanjung Pelepas General Manager on Audit
Port
8 Penang Port Head of Marketing
Port
9 Noble Star Head of Corporate Affairs Managing Director
Freight Forwarding Agents
10 Second Port Logistics Managing Director
Freight Forwarding Agents
11 Bahtera Warisan Logistics Chairman
Freight Forwarding Agents
12 One Ocean Logistics Managing Director
Freight Forwarding Agents
13 Ministry of Transport (Land Division) Assistant Director
Government Agency
14 Prime Minister Department SPAD (Land Transport Authority)
Government Agency
15 Prime Minister Department Commercial Vehicle Licensing Board (CVLB) Land Public Transport Commission (SPAD)
Government Agency

54
Table 3.3:4 Expert panel discussionParticipating organisations Industry/Sector Multimodal Logistics
Deputy Managing Director Senior Manager
Road Haulage/Inland Terminal
Konsortium Logistics Berhad Senior Manager Operation Senior Executive
Road Haulage
Guper Logistics Managing Director
Road Haulage
Century Logistics Deputy Managing Director
Road Haulage
Kontena Nasional Senior Manager Operation
Road Haulage
Ministry of Transport Port Division
Government Agency
Malaysia Industrial Development Authority (MIDA)
Assistant Director
Government Agency
Royal Malaysian Customs Deputy Director Deputy Director
Government Agency
Keretapi Tanah Melayu Berhad Senior Manager Business Development Freight Business Unit
Rail
Malaysia Institute of Transport (MITRANS) Director Head of Logistics Centre
Academic (University)
The hinterland container transport concept and questions for the individual expert interviews were distributed in advance. During the interview, relevant questions were added. Fifteen individual expert interviews were conducted with various stakeholders. The interviews were conducted at the organization’s premises and the interviews lasted between one and two hours.
The expert panel discussion was conducted in a neutral environment. The preliminary new system proposal was presented as a scenario for the discussion. After the presentation, questions were put to the participants for discussion of the proposal.

55
II) Case Study
Based on the expert interview in the study, the Port Klang-Ipoh corridor (PKIC) was selected for the case study analysis. (Details can be found in Chapter 5). The analysis was conducted by comparing the intermodal transport system with the direct road haulage system. Two types of evaluation were conducted: 1) cost analysis and 2) CO2 emissions. From these two analyses, both systems were evaluated in terms of the quality aspects of the service.
Cost model
The cost for each activity in the intermodal movement and direct road haulage systems was considered. For intermodal movement, three main cost activities were used: rail transport, inland terminal and road haulage. To calculate the rail transport and road haulage cost, two cost structures were used:
Capital cost, which included investment and depreciation costs Operational cost, which included only three costs, namely driver costs, maintenance costs and energy costs
For inland terminal cost, only lifting and shunting costs were considered for cost analysis. However, detailed costs for shunting and lifting were not available so the costs presented in this research are based on estimates from the inland terminal operator.
CO2 emissions
To evaluate the CO2 emissions, only emissions from the transport modes were taken into consideration since the emissions from handling equipment at the inland terminal were not available. The indicator used to calculate CO2 emissions was compiled by the World Resource Institute (WRI) and the World Business Council for Sustainable Development (WBCSD).
3.4 Data analysis
The analysis would include both qualitative and quantitative methods. Qualitative analysis can be defined as working with data, organising it, breaking it into manageable units, synthesizing it, searching for patterns, discovering what is important and what is to be learned, and deciding what one will tell others. The analysis used for this research would be inductive analysis (Bogden and Biklen, 1982).
Inductive analysis is a form of qualitative analysis based on inductive reasoning; a researcher using inductive analysis starts with answers but forms questions throughout the research process. Inductive analysis involves discovering patterns, themes, categories and interrelationships. It begins by exploring, then confirming, guided analytical principles rather

56
than rules and ends with a creative synthesis. The strategy in inductive analysis is to allow the important analysis dimensions to emerge from the patterns found in the cases under study without presupposing in advance what the important dimension will be (Patton, 2004). One of the strategies in qualitative analysis is to organise it by theme. The themes can be pre-determined or emerge from the in-depth interview.
Quantitative analysis is applied in the study to evaluate the impact of the proposed hinterland transport system compared to the current system in terms of volumes, costs and environmental impacts. A cost model would be used to support the analysis. The environmental impact analysis would focus on GHG emissions based on fuel/energy consumption differences between the alternatives.

57
CHAPTER FOUR 4 REVIEW OF THE CURRENT SYSTEM
This chapter focuses on the current container transport system from the customers’ and transport service providers’ viewpoints in order to gain insights regarding development of intermodal services with regard to logistics. A further aim is to develop an intermodal system from a logistical point of view.
The descriptions of the current system were based on the data collected from stages 1 and 2 of the research. he discussion in this chapter includes:
The descriptions of the current system involving the service providers and the current flow of containers to and from Malaysian ports. Data from fact-finding and the preliminary service provider study was used for the descriptions. Customer (manufacturers) survey and interviews. Institutional framework governing the industry was gathered by fact-finding and through the preliminary service provider interviews. Issues raised by service providers during the preliminary service provider interviews.
4.1 Actors in hinterland transport
4.1.1 Overview
Figure 4.1:1 illustrates alternative import and export movements of containers from port to hinterland and vice versa. Most ports in Malaysia have two modes of hinterland container transport: road and rail. Road haulage, however, predominates.

58
Figure 4.1:1 Alternative transport chains in hinterland container transport
The actors in hinterland transport services are as follows:
Service provider Main responsibilities Port Handling containers from the port to the
hinterland container transport service providers
Road haulage Road delivery to customers. Either directly from port or from inland terminal.
Rail Delivering containers from port to the inland terminal
Inland terminal Transhipment, transfer from road to rail Freight forwarding agent Intermediaries for the customers. Deal with
other actors.
The hinterland container transport actors can be divided into two categories: terminal operators (ports and inland terminals) and carriers (road haulage and rail). Cargo intermediaries such as freight forwarding agents can be considered customers since they act on behalf of the manufacturers. Each service provider has its own role and responsibilities in ensuring that the hinterland container transport assignment will be carried out in a satisfactory manner.

59
4.1.2 Ports
Two Malaysian ports have established themselves among the top 20 containerized ports in the world (2009). Port Klang was ranked number 13 and Port Tanjung Pelepas (PTP) number 17. Malaysian ports have good connectivity to other interregional and international ports.
Most ports serve as multipurpose ports (except PTP and Kemaman Port). The major ports are Port Klang, Penang Port, Johor Port, Port Tanjung Pelebas (PTP), Kuantan Port and Kemaman Port. This research focuses on Port Klang, Penang Port and Johor Port. PTP is a container port and Kemaman is a petrochemical port. All the major ports are federal ports. The port authority plays the role of landlord, providing the operator with infrastructure such as land. Table 4.1:1 shows the port operators and port authorities at the ports in this study.
Table 4.1:1 Port operators, port authorities and type of operation
Port Authority Operator Type of operation
1. Port Klang Port Klang Authority
NorthportKlang Multi Terminal(Westport)
Multipurpose portMultipurpose port
2. Penang Port
Penang Port Commission
Penang Port Sdn Bhd (PPSB)
Multipurpose Port
3. Johor Port Johor Port Authority
Johor Port Berhad
Multipurpose port
3. Port TanjungPelepas
Johor Port Authority
Port of Tanjung Pelepas
Containerterminal
In 1993, the Federal government announced Port Klang as the national load centre. Almost 60% of Malaysia’s international trade goes through this port. Port Klang is managed by two operators: Northport Berhad, which operates the north port berths and Klang Multi Terminal (KMT), which operates the west port terminal. Port Klang is connected to good road networks. All four ports are also connected to the railway network. Almost 60% of Port Klang´s operations consist of containers and 40% of bulk cargo.
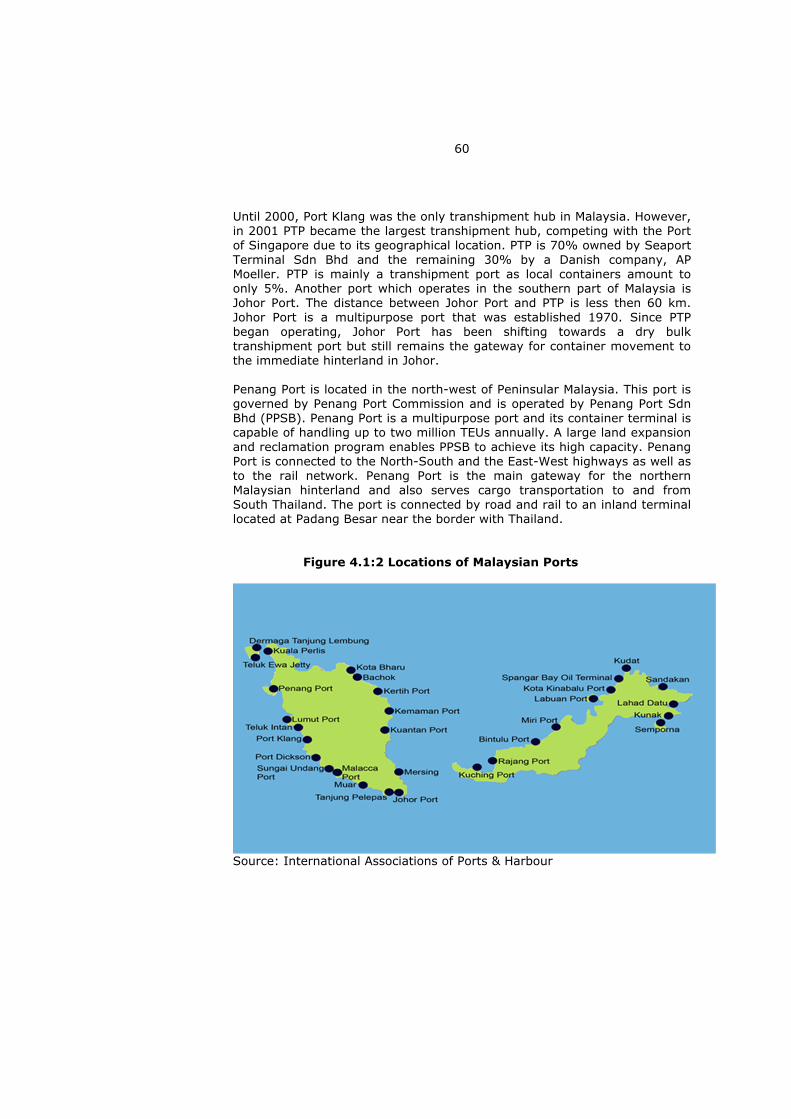
60
Until 2000, Port Klang was the only transhipment hub in Malaysia. However, in 2001 PTP became the largest transhipment hub, competing with the Port of Singapore due to its geographical location. PTP is 70% owned by Seaport Terminal Sdn Bhd and the remaining 30% by a Danish company, AP Moeller. PTP is mainly a transhipment port as local containers amount to only 5%. Another port which operates in the southern part of Malaysia is Johor Port. The distance between Johor Port and PTP is less then 60 km. Johor Port is a multipurpose port that was established 1970. Since PTP began operating, Johor Port has been shifting towards a dry bulk transhipment port but still remains the gateway for container movement to the immediate hinterland in Johor.
Penang Port is located in the north-west of Peninsular Malaysia. This port is governed by Penang Port Commission and is operated by Penang Port Sdn Bhd (PPSB). Penang Port is a multipurpose port and its container terminal is capable of handling up to two million TEUs annually. A large land expansion and reclamation program enables PPSB to achieve its high capacity. Penang Port is connected to the North-South and the East-West highways as well as to the rail network. Penang Port is the main gateway for the northern Malaysian hinterland and also serves cargo transportation to and from South Thailand. The port is connected by road and rail to an inland terminal located at Padang Besar near the border with Thailand.
Figure 4.1:2 Locations of Malaysian Ports
Source: International Associations of Ports & Harbour

61
4.1.3 Hinterland container transport by road
Road haulage is the predominant mode for hinterland container transport in Malaysia. The flexibility of road haulage has made it the most attractive mode for door-to-door hinterland transport. Good road network links between ports and the hinterland also help road haulage remain the main mode. The rapid increase in container transport creates a great demand for hinterland container transport services. Five main road haulage operators dominated the industry from the early eighties until 1999, when the government liberalised the road haulage industry. Since the liberalisation, 190 new road haulage operators of different sizes have entered the industry. There are currently more than 8,000 prime movers (tractors) and 40,000 trailers in operation. During the initial liberalization in 1999, new operators were allowed to carry only laden containers within a 30 km radius from the various ports. However, this restriction was abolished in 2000 and all new operators could operate all over Malaysia (Tengku Jamaluddin, 2004). The main reason for the liberalization was the perceived inefficiency of the road haulage industry. Customers were complaining to the government that the five main road haulage operators were not able to meet their demands at that time.
The first three years after liberalisation, the customers’ perception of satisfaction increased from 53% to 69% (NPC 2003). However, since 2005 there have been a great many complaints from the customers indicating that the industry’s efficiency was deteriorating. Most customers believe that liberalisation contributed to this deterioration (Chairman of Logistics Cluster, Prime Minister Department, 2008). Discussions are constantly held to address this issue alongside suggestions from the service providers to improve the industry and hinterland container transport.
Malaysia practises a merchant haulier system whereby customers are responsible for arranging the delivery and pick-up of their containers. They do this themselves or use the services of freight forwarding agents (MDS, 1999). A drop-trailer method of operation is generally used in the industry, whereby a container that needs to be loaded or unloaded is left mounted on its trailer at its origin or final destination. The container and trailer are often left at the customer’s premise for days. The current ratio of prime movers to trailers is 1:7. The customers have taken advantage of this and use the containers for storage. This has affected the turnaround time for the trailers, contributing to the inefficiency of the industry.
Seven years after the liberalisation, the road haulage operators started to complain that the industry was suffering from overcapacity, leading to unhealthy competition with lower quality of service. The government has therefore not issued any new licenses since 2006 (Nazrey, 2006).

62
4.1.4 Hinterland container transport by rail and inland terminal.
Container transport by rail from port to hinterland is another mode. The development of hinterland container transport by rail was supported by the opening of inland terminals in Malaysia since 1978. The term inland terminalis used here to cover inland clearance depots (ICD), dry ports and inland terminals. Table 4.1:2 lists the existing inland terminals in Malaysia.
Table 4.1:2 Inland terminals in Malaysia
Source: Ministry of Transport
With the exception of ICT and Segamat Inland Terminal, the other ICDs are owned by road haulage companies. ICD Sg Way and Prai are owned by Kontena Nasional. Nilai Inland terminal (NIP) is owned by Guper Logistics. These ICDs are used as hubs for their operations and are served 100% by road even though the terminals have rail connections. Padang Besar ICD is also owned by a road haulage company, Multimodal Logistics, a subsidiary of KTMB.
Inlandterminal
Began operating
Volume in 2009
(TEUs)
Mode of transport
Distancefrom port from port
ICD, Sg Way 1978 6,000 100% by road
22 km from Port Klang
ICD, Prai 1984 3,000 100% by road
10 km from Penang Port
Dry port (Ipoh Cargo Terminal)
1989 35,000 95% by rail 250 km from Port Klang 170 km from Penang Port
Dry port (Segamat InlandTerminal)
1998 0 0 200 km from Port Klang
Padang Besar InlandContainerDepot(Cross-border trade with Thailand)
1983 110,000 90% by rail 180 km from Penang Port
Nilai Inland terminal
1995 24,000 100% by road
100 km from Port Klang

63
Movement by rail became important in 1989 with the opening of the Ipoh Cargo Terminal (ICT), serving the northern industrial area of Malaysia known as the Kinta Valley with intermodal transportation. During its first years of operation, the terminal was able to handle up to 70,000 TEUs annually compared to 35,000 in 2009. ICT estimates that they handle 35% of the Kinta Valley containers, while the others are carried by road haulage. The short lead-times demanded by the customers are believed to be one of the main reasons for them to choose road rather than intermodal hinterland services. Since 2000, ICT only serves Port Klang. However, before 2000, there were also a few rail services from ICT to Penang Port.
Another important inland terminal with rail connectivity is Padang Besar inland container depot (ICD), which serves the Penang Port - Padang Besar corridor. Padang Besar ICD only serves the south Thailand market. For the last five years, the terminal recorded annual volumes of between 65,000 and 110,000 TEUs. Padang Besar ICD is important for the development of cross-border container movements. Almost 70% of KTMB’s daily container services relate to this corridor. Intermodal container transport by rail-road in this corridor has a 50% mode share. The Padang Besar ICD operator believes that rail’s mode share will increase by up to 70% after the completion of the double-track line from Ipoh to Padang Besar in 2013.
4.2 Hinterland container movements in Malaysia
Malaysian ports handle transhipment and local containers (import & export). Table 4.2:1 shows the container volumes between 2010 and 2011. They are divided into three categories: import, export and transhipment. Import and export containers are also known as local containers since they are entering the Malaysian hinterland.
Table 4.2:1: Container volumes at Malaysia Ports in 2010 and 2011
Export TEUs
Import TEUs
Transhipment TEUs
Export TEUs
Import Mil TEUs
Transhipment TEUs
PortKlang
1.71 mil 1.72 mil 5.4 mil 1.68 mil 1.74 mil 6.10 mil
Penang Port
498,000 510,000 69,000 570,000 560,000 75,000
JohorPort
390,000 370,000 111,000 350,000 350,000 136,000
Kuantan Port
73,000 69,000 96 67,000 61,000 650
TanjungPelepas
154,000 103,000 6.0 mil 284,000 132,000 6.9 mil
Source: Ministry of Transport
2010 2011
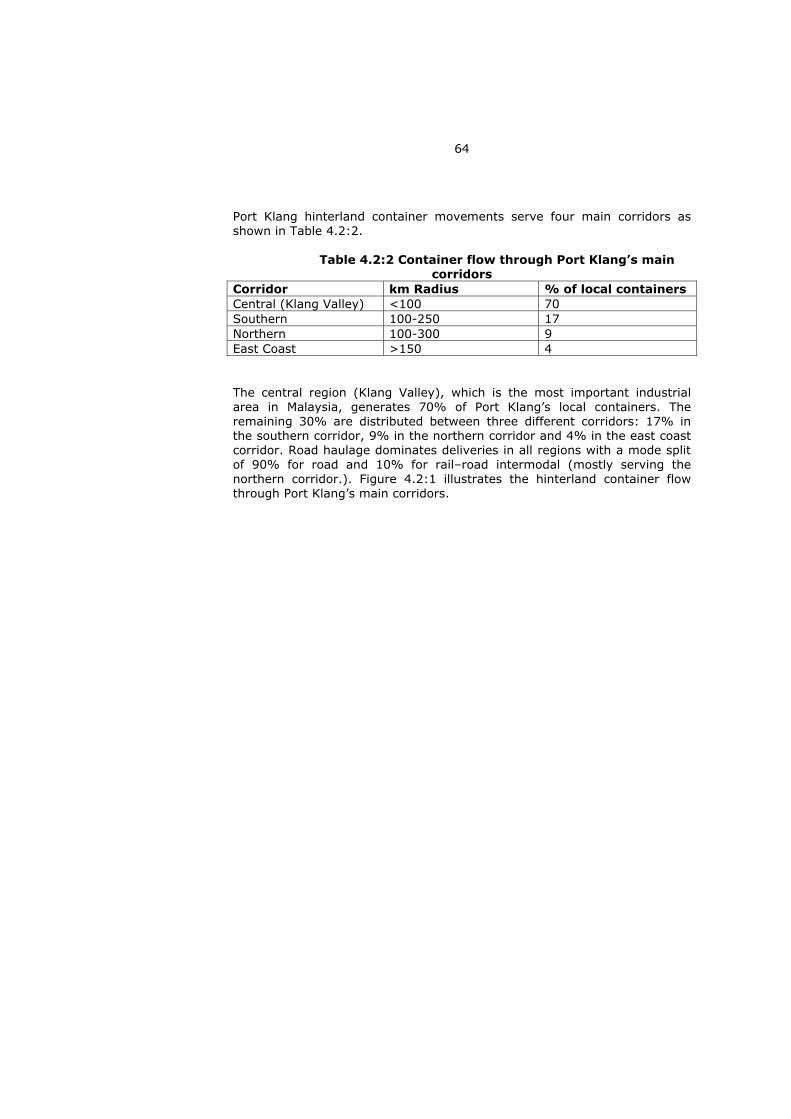
64
Port Klang hinterland container movements serve four main corridors as shown in Table 4.2:2.
Table 4.2:2 Container flow through Port Klang’s main corridors
Corridor km Radius % of local containers Central (Klang Valley) <100 70 Southern 100-250 17 Northern 100-300 9 East Coast >150 4
The central region (Klang Valley), which is the most important industrial area in Malaysia, generates 70% of Port Klang’s local containers. The remaining 30% are distributed between three different corridors: 17% in the southern corridor, 9% in the northern corridor and 4% in the east coast corridor. Road haulage dominates deliveries in all regions with a mode split of 90% for road and 10% for rail–road intermodal (mostly serving the northern corridor.). Figure 4.2:1 illustrates the hinterland container flow through Port Klang’s main corridors.

65
Figure 4.2:1 Hinterland container flow through Port Klang’s main corridors
<100kmradius
100-250 kmradius
>150km radius
100-300 km radius

66
Penang Port hinterland includes three main corridors (Figure 4.2:2): a) immediate hinterland (100 km radius) b) mid-range hinterland (100-200 km radius) c) Penang Port-South Thailand Corridor
Cross border point at Padang Besar (180 km) Cross border point at Bukit Kayu Hitam (150 km)
Figure 4.2:2 Hinterland container flow at Penang Port
*PP-ST corridor: Penang Port-South Thailand corridor
100 kmradius
PP-ST Corridor*
100-200kmradius
<250kmradius

67
Since Penang is the second-most important industrial area, almost 60% of the local container movements are to the immediate hinterland and 10% to the mid-range hinterland. All these movements are handled by road haulage. Of the remaining flow 25% goes to Penang-Padang Besar corridor and 5% to Penang Port-Bukit Kayu Hitam corridor. These two corridors serve Southern Thailand. The Penang Port-Padang Besar corridor has a mode split of 50-50 between road and rail, while Penang Port- Bukit Kayu Hitam corridor has 100% by road.
The third most important industrial area is in Johor. Johor Port is serving the hinterland at the southern region of Peninsular Malaysia, and almost 95% of its hinterland is in Johor itself. The major hinterland container transport movement is within 50 km radius, representing 75% of the total movement. The next 15% is within 150 km radius and 10% more than 200 km radius. Johor Port hinterland container transports are 100% by road even though it has a railway connection with the port. The rail movement is primarily used for operating inter terminal transfer (ITT) between Johor Port and PTP for transhipment containers, but these services have declined in the last two years. Figure 4.2:3 illustrates the hinterland container flow at Johor Port.

68
Figure 4.2:3 Hinterland container flow at Johor Port

69
Malaysian port hinterland container transport is heavily concentrated on short distance movements, i.e. within a 100-km radius. However, it can be estimated that almost 30% of the movements can be categorized as medium-distance movements (200-400 km). The hinterland container movements also indicate how the Malaysian hinterland is segmented. This is illustrated in Figure 4.2:4, which also shows the virtual borders of the hinterland between the three major ports.
Figure 4.2:4 Port locations and their virtual hinterland borders
*PP-ST corridor: Penang Port-South Thailand corridor
<100km radius
100-250km radius
>150km radius
100-300km radius
100km radius
PP-ST Corridor*
100-200km radius
<250km radius

70
4.3 Institutional framework
Institutional issues are very important for development of the transport service industry. Like most countries, Malaysia has a comprehensive legislative and regulatory framework governing both road and rail freight transport modes. The impacts on economic development and the sustainability of this framework are of great concern to the Malaysian government.
A number of laws govern the operation and services of road and rail transport. Due to the structure of the transport industry, several ministries and agencies are heavily involved with these policies and regulations, see Table 4.3:1 below.
Table 4.3:1 Agencies and ministries regulating the transport & logistics industries
Sector Acts Agency / Ministry
Road Transport ContainerhaulageConventionaltrucking
Road Transport Act 1987
CVLB Act 1987
Commercial Vehicle Licensing Board(CVLB)
Prime Minister’s DepartmentRoad Transport
Department (RTD) Ministry of Transport
Customs Agents Shipping Agents Warehousing Inland terminal
Customs Act 1967 Royal Malaysian Custom Ministry of Finance,
Freight forwarding Registrar of Business/Company
Maritime (Shipping and Port)
Penang Port Commission Act 1955
Port Authorities Act 1963
Port Department Maritime Division Ministry of Transport
Rail Railway Act 1991 Railway Department Land Division
Ministry of Transport

71
The three main ministries governing the container industry are the Ministry of Transport, the Ministry of Finance and the Prime Minister’s Department. The fragmentation of the industry has made it difficult to enforce effective logistics measures for the country. Customers and service providers in Malaysia regard this fragmentation as an obstacle to the development of the industry. The Ministry of International Trade and Industries (MITI) also considers this to be a disadvantage for the development of the logistics industry.
The main act governing the road haulage industry is the Road Transport Act of 1987 and the CVLB Act of 1987, see Table 4.3:1. The haulage sector is governed by the former Act covering the technical and safety aspect of the road transport industry. The CVLB Act of 1987 regulates the licensing of road transport operators and their management (Nazrey, 2006). The road haulage industry is thus subject to regulations from two different ministries, which causes some problems. Rail transport is governed by the Rail Transport Act of 1967, implemented by the Ministry of Transport which is responsible for rail operations. Inland terminals are governed by the Ministry of Finance under the Customs Act of 1967, and licences for terminals are granted by the local authority under the 1976 Town and Planning Act. Each mode thus has its own policy and regulations without consideration to intermodal transportation. There is no single policy or la that promotes and support intermodal transport.
However, a new Land Public Transport Authority Act 2011 (SPAD 2011) came into effect in 2011, whereby the CVLB Act of 1987 and the Railway Act of 1991 were abolished, enabling SPAD 2011 to take over their roles. Alongside this, the Land Public Transport Commission was established to govern land transport in Malaysia. SPAD governs passenger transport, freight transport and also the terminal in Malaysia. The basic roles of SPAD concern policy and planning of land public transport. It also has the power of enforcement on the industry. For example, SPAD is responsible of the commercial licensing of the industry. Thus, since 2011, SPAD has taken over the role of CVLB to govern the industry.
The current Industrial Master Plan for Malaysia (Plan3: 2006-2020) produced by MITI established the Malaysia Logistics and Supply Chain Council (MLSC) to review container industry logistics problems in a comprehensive way rather than individual transport modes. In 2007, the MLSC started to perform such tasks. The council consists of government officials, trade associations, shippers, and logistics industry actors. The MLSC has opened a new dimension in Malaysia’s logistics area and its aim is to improve efficiency of the logistics sector.

72
4.4 Current hinterland transport issues as highlighted from the preliminary service provider interviews
The various issues and challenges faced by hinterland container transport services are discussed below under three main headings: 1) efficiency issues 2) management issues and 3) cost issues.
4.4.1 Efficiency issues
Road haulage efficiency problems are of major concern and became imminent after the liberalization of the road haulage industry in 1999, which allowed too many new operators to enter the market. Self-regulatory market-driven functions were not able to control and influence the standard of operations in the industry. The resulting overcapacities led to many problems such as unhealthy competition, lack of focus on safety issues and less concern for the impact on the environment. The Logistics Road Map Study conducted by the Malaysia Logistics and Supply Chain Council (2009) (MLSC) indicated that only 70% of the trailers were fully utilised for normal operations.
According to the ICT inland terminal operator, the rail operator KTMB was able to provide the required service in the corridor even though there were still some rail service quality issues. Delays and poor reliability of the rail service have been questioned by port operators and customers. Inland terminal inefficiency also affected the usage of rail as an alternative mode for hinterland container transport.
One of the biggest challenges is to have efficient equipment for container handling in intermodal transfers. Some equipment needs major repairs, which has a negative impact on the efficiency of the inland terminal. Lack of space is another factor that affects the efficiency of the terminal. For example, ICT has no more land if they decide to expand their services. Even though the utilisation rate is only 60%, any expansion would require them to move to another location. However, this move is not supported by the current customers since it would increase pre- and post-haulage costs.
4.4.2 Management issues
In the road haulage sector, the professionalism of the staff is also of major importance. The operators focus specifically on the drivers’ performance, behaviour and acceptance of new operational ideas. There is a need for appropriate training modules to enhance and improve drivers’ performance. Another important issue is the high turnover of drivers caused by the large number of road haulage operators making it easier for drivers to find work elsewhere.

73
The ICT inland terminal also faces difficulties in marketing their services. Even though they would be able to offer customers more competitive rates, they might not be able to enjoy such benefits. This is due to the role of freight forwarding agents as intermediaries between the customers (manufacturers) and the inland terminal operators. There is a risk that the benefits offered by the operators would only give the freight forwarding agents larger profit margins.
The coordination between the road and rail in intermodal transport chains is seen as a major management problem. The sole rail operator KTMB mainly uses four logistics operators and is reluctant to use any other. Intermodal transport requires the willingness of operators involved to coordinate their activities in each corridor. The current separate road and rail acts make it difficult to integrate different actors for the implementation of intermodal solutions.
4.4.3 Cost factors
Unless the customers (manufacturers) have railway sidings at their factories, rail or intermodal transport requires additional handling at inland terminals. This leads to extra costs and time in comparison to direct road haulage from port to end customer. However, the customers (manufacturers) might overlook the higher capacity and lower link haulage costs that intermodal might offer, particularly for longer distances between customer and port.
Road haulage rates are currently low because of overcapacity, making it difficult for some of them to survive. In order to compensate the losses in the haulage business, some operators provide total logistics services and gain some revenue from the freight forwarding charges. This has become a common trend in the industry.
4.5 Customer (manufacturers) survey and interviews
The purpose of the survey was to analyse the customers’ (manufacturers’) current operations, including container volume, port of loading and transport mode used. The intention was to also analyse the factors that customers (manufacturers) currently consider most important when choosing hinterland container transportation. However, due to the poor response to the survey, four interviews were conducted to gather more information about customers’ (manufacturers’) current mode choice. The analysis in this section is based on eighteen questionnaire responses and four in-depth interviews.

74
4.5.1 Current hinterland movements
Table 4.5:1 shows the types of industries participating in the survey. Figure 4.5:1 shows the types of products that the responding companies imported and exported. Of the imports, 40% were semi-finished products, 40% raw materials and 20% finished products. For exports, 80% were finished products and 20% semi-finished products.
Table 4.5:1 List of respondents’ industries Industry No of respondents %
Agricultural product 2 11 Food and beverages 2 11 Textile 2 11 Rubber products 4 22 Household products 3 17 Building materials 1 6 Pharmaceutical, medical equipment and toiletries
2 11
Plastics products 2 11 Total 18 100
Figure 4.5:1 Types of products

75
The location, container volume and port of call for each respondent are shown in Table 4.5:2 based on the number of containers.
Table 4.5.2 Respondents’ Average Monthly Volumes (2009) Monthly Volume (2009)
Production Location Import Export Port of Call 20ft 40ft20ft40ft Import Export
Penang 8 24 4 25 Penang Port Penang PortPenang 5 14 10 30 Penang Port Penang PortPenang 15 30 16 40 Penang Port Penang PortPenang 80 100 50 80 Penang Port Penang PortTotal 108168 80 175Perak 6 12 7 16 Port Klang Port KlangPerak 5 18 9 4 Port Klang Port KlangPerak 20 15 20 10 Port Klang Port KlangPerak 5 6 15 15 Port Klang Port KlangPerak 45 40 30 25 Port Klang Port KlangTotal 81 91 81 70Melaka 4 7 4 18 Port Klang Port KlangMelaka 10 6 2 20 Port Klang Port KlangMelaka 11 4 7 4 Port Klang Port KlangTotal 25 17 13 42Johor 13 4 3 12 Port Klang & Johor Port Johor PortJohor 7 7 5 10 Johor Port Johor PortJohor 12 5 5 17 Johor Port Johor PortTotal 32 11 13 39
Pahang 6 2 11 7 Port Klang Port KlangTotal 6 2 11 7
Negeri Sembilan 15 15 5 20 Port Klang Port KlangNegeri Sembilan 7 10 6 30 Port Klang Port Klang
Total 22 25 11 50
Table 4.5:2 shows that the customers (manufacturers) use the port closest to them. Only one company listed uses a port further away. All these customers (manufacturers) chose road transport as their hinterland container transport mode.

76
Figure 4.5:2 shows the respondents’ monthly container volumes. Penang had the highest volume of containers, followed by Perak, Negeri Sembilan, Melaka, Johor and Pahang. All of the respondents stated that they used road haulage for their hinterland transportation from and to the port. All respondents from Perak are located in Kinta Valley, but none of them used rail for their hinterland container transportation.
Figure 4.5:2: Container volume by State (Region). NR: Northern region SR: Southern region ECR: East Coast region (Figure 4.5:3 shows the location and states in each region)
Of the total number of respondents 90% used agents to handle the purchase of their hinterland transport services. The decisions on the mode of transport were always made by the agents. Most of the respondents had contracts with agents in purchasing the hinterland container transport services.

77
Figure 4.5:3 shows the location and states in each region.
Figure 4.5:3 Locations in the respective regions

78
4.5.2 Factors in choosing transport mode
The respondents were asked to rank the importance of different factors in choosing hinterland container transport mode, see Figure 4.5:4.
Figure 4.5:4 Factors in choosing transport mode (cost & quality factors) (Imports)
Of the respondents, 78% stated that low cost was the most important factor and 22% stated that it was very important. High reliability of services was ranked by 83% as the most important quality factor. This was followed by low cost (78%) and high capacity (61%), respectively. 44% of the respondents ranked low damage and high flexibility as most important. Low environmental impact was considered to be important of 34% and of less or no importance by 66% of the respondents.

79
Figure 4.5:5 shows the ranking of agent/carrier related factors in choosing transport mode for import containers. There were mixed responses from respondents regarding these factors. Willingness to negotiate rates and special preferences were the two most important factors in this group with 55% and 50%, respectively. Less than 50% of respondents ranked high quality personnel and good records in services as important. In the agent/carrier related factors, none of the respondents ranked any of the factors as less important or not important.
Figure 4.5:5 Factors in choosing transport mode (agent/carrier related factors)(Imports)

80
Figure 4.5:6 shows the response regarding cost and quality factors for export container mode selection. High reliability and low cost were ranked as the most important factors with 88% and 78%, respectively. High capacity was ranked as most important by 61% of respondents. High flexibility was regarded by 50% of the respondents as most important while only 45% ranked low damage as the most important factor in hinterland container transport mode choice. Concern for the environment was low, with 56% of respondents stating environmental impact to be less important when choosing hinterland container transport mode.
Figure 4.5:6 Factors in choosing transport mode (cost & quality factors) (Exports)

81
Figure 4.5:7 illustrates the response from respondents on the agent/carrier related factors for export containers.
Figure 4.5:7 Factors in choosing transport mode (agent/carrier related factors) (Exports)
The respondents ranked willingness to negotiate and special preference services as the most important with 55% and 50% of the responses. Less than 50% indicated high quality of personnel and good records as most important.

82
Using the most important responses as an indicator to rank all the factors, a summary of the rankings is presented in Tables 4.3:3 and 4.3:4. The ranking begins with the highest percentage responses.
Table 4.5:3 Ranking of factors based on most important responses (imports)
Factors Group %High reliability Quality related factors 83 Low cost Cost related factors 78 High capacity Quality related factors 61 Willingness to negotiate service & rates
Agent/carrier related factors 55
Special preference Agent/carrier related factors 50 Low damage Quality related factors 44 High flexibility Quality related factors 44 High quality personnel Agent/carrier related factors 39 Good records Agent/carrier related factors 27 Low environment Quality related factors 0
Table 4.5:4 Ranking of factors based on most important responses (exports)
Factors Group %High reliability Quality related factors 88 Low cost Cost related factors 78 High capacity Quality related factors 61 Willingness to negotiate service & rates
Agent/carrier related factors 55
High flexibility Quality related factors 50 Special preference Agent/carrier related factors 50 Low damage Quality related factors 45 High quality personnel Agent/carrier related factors 40 Good records Agent/carrier related factors 28 Low environment Quality related factors 0
The responses from the four in-depth interviews dealt with the following four main mode choice factors.
1) Low cost was considered one of the most important factors for customers (manufacturers) to remain competitive. The total logistics cost is also affected by the changes in the inland transport cost. The ability of the agents/carriers to provide special preference services is also important. From the customers’ (manufacturers’) perspective, with these special features they are able to control the hinterland container transport cost and ensure that the cost will not increase significantly.

83
2) High reliability of service is the most important quality factor for the transport service. Customers (manufacturers) rely on the on-time delivery of their containers to ensure that their production is not interrupted. A few customers (manufacturers) use the Just-in-time (JIT) concept for their production. The basic concept of JIT requires the main inventory for the product to arrive on time at the production site. According to the customers (manufacturers), several road hauliers provide more than just delivery and pick-up of containers but sometimes additional services are provided, for example extra storage at the haulier’s yard.
3) Safety and security aspects are also of great concern for the customers (manufacturers). High safety reduces the probability of the goods being damaged during delivery to/from the port. The customers (manufacturers) appreciate very much if the drivers are well trained and drive the prime mover efficiently. This also reduces the risk of product damage. Security is another significant factor in choosing a transport service. One respondent had experienced the hijacking of a container during delivery from Port Klang to Melaka. However, the road haulage operator had installed GPS tracking on its prime mover and the hijacking attempt failed.
4) Environmental impact did not appear to be very important for the customers (manufacturers) when choosing their transport mode. They were aware of basic regulations regarding air pollution and emissions from trucks but from their perspective it should be the responsibility of the road haulage operators. Even if they followed all environmental regulations for their production, they did not adhere to the same principles when choosing a transport mode.
4.6 Conclusion
Road haulage is the main hinterland container transport mode from Malaysian ports while intermodal only managed to capture 10% of Port Klang’s local containers and 12% of Penang Port’s local containers. The two main intermodal corridors are 1) Port Klang-Ipoh corridor and 2) Penang Port-Padang Besar corridor. Other inland terminals are mainly used as hubs for the road haulage operators even though they also have rail connections.
The main concentration of container flows to the hinterland is within 100 km from the various ports. The virtual segmentation of hinterland between Malaysian ports has meant that long-distance corridors with more than 400 km from the port do not seem to be viable within Malaysia’s hinterland. However, the corridors within the 200-400 km (middle range) are other options for intermodal hinterland container transport to be introduced.

84
From the customer (manufacturer) survey and interviews, the five most important factors for hinterland container transport mode choice were: 1) high reliability of services, 2) low cost, 3) high capacity, 4) the willingness of the carrier to negotiate rates and services, and 5) safety and security. Most customers (manufacturers) considered low environmental impact to be less important in choosing hinterland container transport.
The following four factors can be considered to be the main obstacles to successful intermodal hinterland container transport: 1) road haulage, rail and inland terminal inefficiency 2) coordination problems for road-rail intermodal 3) no specific regulation and policy to promote intermodal transport, and 4) the cost factor.
Opportunities exist for intermodal hinterland container movement but significant strategies and corridors need to be chosen to ensure the success of the system. The strategies need to be able to expand the use of hinterland container transport in the existing corridors and to develop new selected corridors. In Chapter 5, the analysis of the selected corridor as a case study for this research will elaborate on the opportunities of the intermodal system in Malaysia.

85
CHAPTER FIVE 5 CASE STUDY: LOGISTICS ANALYSIS AND
EVALUATION OF AN ENHANCED INTERMODAL
SYSTEM
The evaluation includes cost analysis and CO2 emission analysis from a range of intermodal scenarios and transport input. From the findings in the case study, service quality factor evaluations are made between the intermodal and direct road haulage systems in this corridor. 1) The quantitative evaluation will include estimations of costs and a CO2 emission analysis for the case study scenarios in the selected corridor. In conducting the analysis, several scenarios are created to analyse the impact of quality factors on cost efficiency in the corridor.
The qualitative evaluation focuses on the services developed for the hinterland transport. The evaluation is to set the service level required by the customers based on the operators’ capability. The scenario presented is a combination of quality factor indicators such as capacity, time and frequency in order to suggest a more efficient and sustainable system that can handle the expected future growth of the container industry. The proposal consists of descriptions of the proposed intermodal corridors and strategies for the system to operate.
5.1 Selection of intermodal corridor for the case study
In selecting the intermodal corridors to be evaluated, expert interviews were conducted, see Chapter 3. The interviews were conducted to identify the potential corridor for the implementation of intermodal strategy. The expert interviews indicated possible corridors that could have great potential for the implementation of new services or expansion of existing intermodal usage. Five corridors with existing rail access, three of them also with existing inland terminals, were identified. One corridor needing a new rail connection was also proposed. This section briefly describes the potential corridors is presented and discussed.
a) Port Klang –Tampin-Segamat-Kluang Corridor
The main focus with regard to this corridor was on Port Klang-Tampin since the development surrounding Tampin and Melaka is expected to provide sufficient volumes for intermodal movements. There is an existing rail link from Port Klang to Tampin and it would be appropriate to develop an inland terminal transfer at this point. Melaka has several international

86
manufacturing companies such as Honda and Siemen and it is therefore believed that Melaka would have a significant volume of containers for intermodal movement. Of the respondents, 60% agreed that this corridor has the potential to be a successful intermodal corridor. The distance between Tampin and Melaka is less than 50 km, hence making an efficient inland terminal that is required to support intermodal transportation.
b) Port Klang-Mentakab-Kuantan.
For this corridor to operate intermodal transportation, a new rail link needs to be built between Mentakab and Kuantan for intermodal to be a seamless link in this corridor. The rapid development of the East Coast Economic Region (ECER) is expected to increase the demand for container transportation in this region. Pekan, which is located 60 km from Kuantan, is rapidly developing as a Malaysian automotive city. Major automotive manufacturers such as Volkswagen and Mercedes have set up operations here. Experts have indicated that the automotive industry in Pekan will increase over the next 5 to 10 years (Reference). Even though Kuantan has its own port, the focus of that port is more on petrochemical products. Almost 80% of its container flow went to Port Klang for import and export movements. Road haulage is currently the main transport mode to move containers from this region. Even though there is a huge potential for growth within this corridor, only 20% of the experts agree on the potential for intermodal movements in this corridor. According to the experts, by looking at the government’s infrastructure investment in rail, this new link would not give the country a huge return on investment.
c) Johor Port-Kluang-Segamat
Only 20% of the experts agreed on the potential development of intermodal in this corridor. Historically, the corridor has a low container volume since the main product movement in this industrial area is non-containerisedcargo. Segamat has an inland port but there has been no demand for container services over the last ten years.
d) Penang Port –Bukit Kayu Hitam
A high percentage (70%) of the expert reviewers agree that this corridor has a strong potential for successful intermodal transportation. The strong development of the industrial area in Bukit Kayu Hitam has made this corridor a potential area. It can also serve as an alternative gateway to the south Thailand market. The Northern Corridor Economic Region (NCER) is expected to spur industrial development in this area. The other gateway to south Thailand, located in Padang Besar is highly congested. Bukit Kayu

87
Hitam can serve as a new transhipment hub. However, the corridor needs a new rail connection and inland terminal for intermodal transportation to be implemented in this region.
e) Port Klang-Ipoh
The experts fully agree (100%) that this existing intermodal corridor should be the main corridor in promoting intermodal transportation. The Ipoh Cargo terminal (ICT) has been operating for more than 15 years and has the capacity to handle up 100,000 TEUs a year. In its early years of operation, the inland terminal handles 75,000 TEUs a year. Due to various factors such as quality of service issues, volumes fell by more than 50% from the optimum operating capacity. The completion of a double-track line between Port Klang and Ipoh has increased the potential for intermodal to be the main mode in this corridor.
Table 5.1.1 indicates the feedback from the experts (see section 3.3.6) regarding the proposed corridors for potential intermodal development. Figure 5.1.1 shows the location of the intermodal corridor
Table 5.1.1 Expert review feedback on the proposed corridors Corridor Yes (%) No (%)
Port Klang-Tampin (Melaka) 60 40
Port Klang-Mentakab-Kuantan 20 80
Johor-Kluang-Segamat 20 70
Port Klang-Ipoh 100 0
Penang Port-Bukit Kayu Hitam 70 30
As can be seen from table 5.1.1, the Port Klang-Ipoh Corridor (PKIC) was identified as the first to be considered the corridor for improved intermodal transport. Since its inception in 1989, this corridor has handled almost 70,000 intermodal TEUs a year. In 1995, the intermodal volume reached 100,000 TEUs, but by 2010 had dropped to 31,500 TEUs. With the development of industrial areas surrounding Ipoh, intermodal transportation could be one of the important modes of transport to operate in this corridor. Expert reviews have rated this corridor as the most significant corridor to analyse and evaluate.

88
Figure 5.1:1: Location of the intermodal corridor

89
5.2 Description of the intermodal traffic analysed
The Port Klang-Ipoh Corridor is one of the corridors that currently have intermodal transportation of containers from/to Port Klang. PKIC has an established inland terminal known as the Ipoh Cargo Terminal (ICT). ICT claims that almost 38% of container volumes within a 50 km radius from ICT went through the terminal. Since ICT’s establishment in 1989, it has had the capacity to handle up to 90,000 TEUs a year. However, in 2010 ICT only handled approximately 35,000 TEUs.
5.2.1 Transport infrastructure
The Port Klang-Ipoh Corridor is connected by a road and rail network. Federal Route l, also known as the North-South trunk road, runs through the state, linking most major towns. The North-South Highway (operated by PLUS), cuts through Perak, linking Parit Buntar in the north and Tanjung Malim in the south. The road distance between Port Klang and Ipoh is 230 km. The normal travelling time for road haulage would be approximately four to five hours. Road conditions are generally excellent and road haulage would usually have a smooth journey. However, due mainly to hilly areas, there are a few sections of the PLUS highway that would slow down road haulage movements. The Port Klang-Ipoh Corridor is also connected with a rail network. The rail distance of about 255 km would take six to seven hours to cover. However, with the completion of a double-track line in this corridor the ideal journey time should be only four hours.

90
Figure 5.2:1 North-South Highway

91
5.2.2 The Ipoh Cargo Terminal (ICT)
The Ipoh Cargo Terminal (ICT) began operations on 1 November 1989. ICT mainly serves the Kinta Valley and the surrounding areas in Perak State. As shown in Figure 5.2.3, there are several major industrial areas located in the Kinta Valley. The ICT provides all the facilities and logistics services that are available at seaports as well as a strategic inland location. Acting as an extension of the seaports, the terminal provides the following services:
c) Train services to and from Port Klang
d) Container haulage
e) Warehousing
f) Container maintenance and repair
g) Custom brokerage and clearance
h) Empty container storage
i) Port services
The Ministry of Transport approved the development of the ICT as a dry port in Ipoh as a strategic measure to extend the Klang and Penang seaports’ activities and capabilities into the hinterland, with three main objectives:
a) Promote the economic and industrial development of the state of Perak (improve the attraction and feasibility of investment)
b) Extend Port services and facilities to inland points of origin / destination
c) Promote an intermodal transport system for efficient cargo routing to seaports (enhancing the competitiveness of exports from the state).
The ICT has played an important role in assisting the movement of containers in and out of the Kinta Valley in Ipoh. The terminal spearheaded the economic development surrounding Ipoh. The Ipoh industrial area is shown in Figure 5.2:2. With a land area of 22 acres and a 30,000 m2
container yard, the ICT has played a prominent role in assisting intermodal movements in this corridor.

92
The ICT has several facilities that help to handle container transfer from rail to road. Table 5.2.1 summarizes the facilities and equipment available at the terminal.

93
Table 5.2:1: Material handling equipment at the ICT Equipment Quantity
Reach stacker 3
Forklift, 6 tonnes 1
Forklift, 4 tonnes 2
Forklift, 3 tonnes 4
Source: ICT Ipoh
Figure 5.2:2 Industrial areas in Ipoh

94
5.2.3 Types of intermodal container movement
Figure 5.2:3 illustrates the logistics activities involved in an intermodal container movement. The two most important activities are: 1) handling and 2) haulage.
The container movement in this corridor could be ideally visualised by the following diagram.
Figure 5.2:3 illustrates the movement of a laden container for export and import. Ideally, the same container used for export could be reused for import purposes. Haulage to/from Port Klang from/to Ipoh can be performed either by road or by intermodal (rail + road). Since the ideal container movement can in reality rarely be performed, the export container would come from a depot for an empty container in Port Klang or Ipoh.
In conclusion, for export movement, the empty container used by the customer could be based on these two assumptions:
a) the customer reuses an import container directly
b) the customer uses an empty container sent from a depot or one that is already available close to the customer’s premises.
The ideal container handling aspects for hinterland intermodal transport can be further divided into import and export handling:
Import container a) Container yard (port) to rail
b) Rail to container yard (inland terminal)
c) Container yard (inland terminal) to road
d) Stripping of container goods (customer’s premises)
Export container a) Stuffing of container (customer’s premises)
b) Road to container yard (inland terminal)
c) Container yard (inland terminal) to rail
d) Rail to container yard (port)

95
For haulage aspects, rail is used for movements between ports and for inland terminals road haulage is used.
Figure 5.2:3 Intermodal container flow from port to hinterland and vice versa
5.3 Container volumes at Port Klang Ipoh Corridor (PKIC)
The forecast container volume in Malaysia in the Third Industrial Master Plan report (IMP3) is 26.4 million TEUS in 2015 and 36.6 million TEUS in 2020. These figures are used to estimate the container volumes in the Port Klang-Ipoh Corridor for 2015 and 2020. Malaysian container volumes for 2015 and 2020 are shown in Table 5.3.1.
Table 5.3:1 Container volumes, Malaysia ports, 2015 & 2020 Year Local *
(million TEUs) Transhipment (million TEUs)
Total(million TEUs)
2015 11.0 15.4 26.4 2020 15.3 21.3 36.6
*containers entering the Malaysia hinterland (import & export containers)

96
In this research, the forecast container volumes in the Port Klang-Ipoh corridor for 2020 and 2030 are based on estimates, in turn based on the 2010 container volume data. In 2010, the container volume status in the Port Klang-Ipoh corridor was as follows:
Local containers in Malaysian ports 6.5 million TEUs
Port Klang container share 53% (3.45 million TEUs)
Port Klang Ipoh corridor
market share 3% of Port Klang container
share (103,350 TEUs)
Intermodal market share 30% of Port Klang Ipoh
corridor market share
(31,005 TEUs)
From the above data, the container volume and intermodal market share for 2020 and 2030 were calculated based on the following scenario:
Port Klang market share of local containers would remain at 53%. Port Klang Ipoh corridor market share was expected to increase from 3% to 4%.
The container volume surrounding Ipoh was expected to increase based on economic development in the surrounding area. Perak Invest has estimated economic growth to be between 5% and 6% a year. This would help the industry grow.
Table 5.3.2 shows the estimated annual container volume in the Port Klang-Ipoh Corridor for 2020 and 2030.
Table 5.3:2 Estimated container volume in the Port Klang Ipoh corridor for 2020 & 2030
Year
Total Malaysian local container volume (TEUs)
Port Klangshare
PortKlang
volume(TEUs)
Port Klang-Ipoh
Corridor %share
Port Klang-Ipoh volume
(TEUs)2010 6,500,000 53% 3,445,000 3.0% 103,350
2020 15,000,000 53% 7,950,000 4.0% 318,000
2030 n/a 53% 10,176,000 4.0% 407,040 Source: MOT and this study

97
Container volumes in 2015 and 2020 are expected to increase by 55% and 75% respectively compared with container volume in 2010. Figures from the volume for targeted intermodal share and direct road haulage volume are presented in Table 5.3.3.
A successful intermodal movement would require a significant container volume in order for the service to be profitable. High container volume would be one of the most critical factors to operate in an intermodal system. The Port Klang-Ipoh Corridor container volumes consist of the following composition:
a) Import container (laden): 13% Import container (empty): 37% b) Export container (laden): 44% Export container (empty): 4% c) Load factor: 70%
These volumes are critical in order to analyse and evaluate the needs of this corridor pertaining to intermodal transportation. The expert interviews have always indicated that critical mass is the most important criterion before adopting any strategy to promote intermodal transportation. With these volumes, the cost analysis, CO2 emissions and service quality in this corridor could be analysed and calculated. These criteria would be the main aspects to ensure the success of intermodal transportation.
5.4 Scenario and alternatives setting
5.4.1 Scenario setting
A high intermodal share has always been the target of any intermodal operation. The Port Klang-Ipoh Corridor has enjoyed only a 30-35% intermodal share over the last 5 years. For the purposes of this case study, a scenario setting has been established in order to look at the changes that need to be made to achieve the desired intermodal share. The scenarios are based on four different intermodal shares that could be implemented at the Port-Klang Ipoh corridor. As a result of the scenario setting, the intermodal shares for 2020 and 2030 are as shown Table 5.3.1. These scenario settings are used to make a detailed analysis of costs, CO2 emissions and service quality.
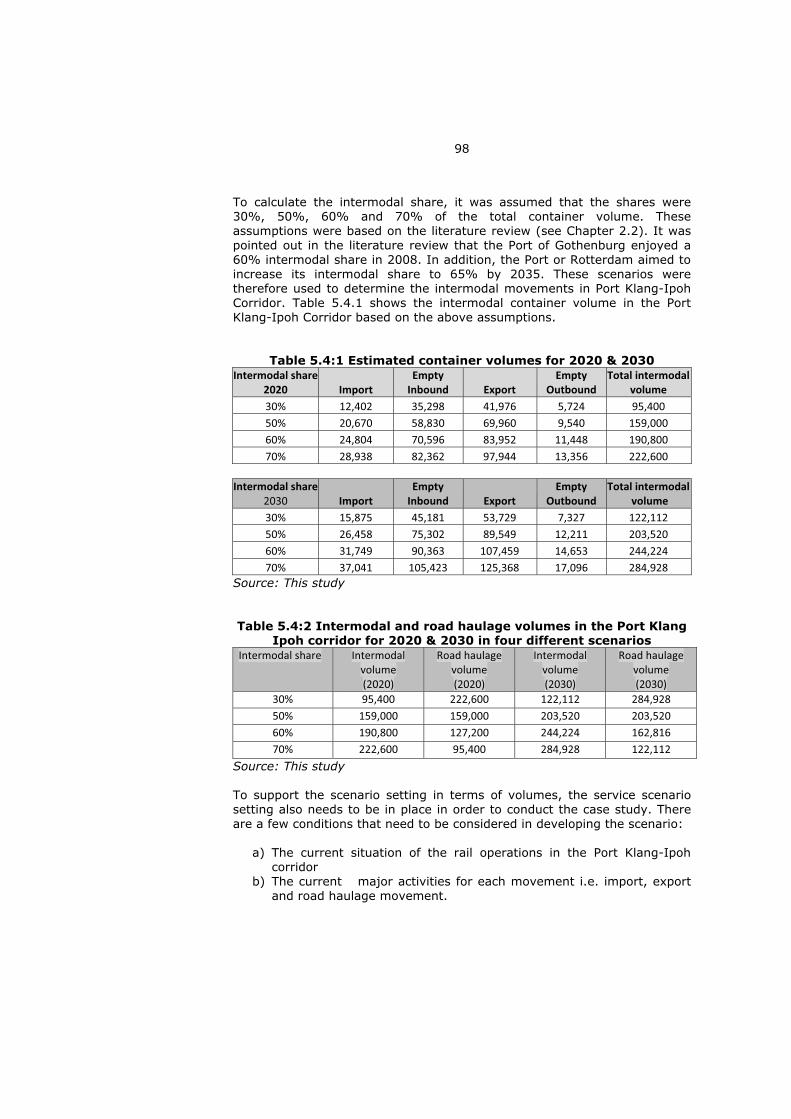
98
To calculate the intermodal share, it was assumed that the shares were 30%, 50%, 60% and 70% of the total container volume. These assumptions were based on the literature review (see Chapter 2.2). It was pointed out in the literature review that the Port of Gothenburg enjoyed a 60% intermodal share in 2008. In addition, the Port or Rotterdam aimed to increase its intermodal share to 65% by 2035. These scenarios were therefore used to determine the intermodal movements in Port Klang-Ipoh Corridor. Table 5.4.1 shows the intermodal container volume in the Port Klang-Ipoh Corridor based on the above assumptions.
Table 5.4:1 Estimated container volumes for 2020 & 2030 Intermodal share
2020 ImportEmptyInbound Export
EmptyOutbound
Total intermodalvolume
30% 12,402 35,298 41,976 5,724 95,40050% 20,670 58,830 69,960 9,540 159,00060% 24,804 70,596 83,952 11,448 190,80070% 28,938 82,362 97,944 13,356 222,600
Intermodal share2030 Import
EmptyInbound Export
EmptyOutbound
Total intermodalvolume
30% 15,875 45,181 53,729 7,327 122,11250% 26,458 75,302 89,549 12,211 203,52060% 31,749 90,363 107,459 14,653 244,22470% 37,041 105,423 125,368 17,096 284,928
Source: This study
Table 5.4:2 Intermodal and road haulage volumes in the Port Klang Ipoh corridor for 2020 & 2030 in four different scenarios
Intermodal share Intermodalvolume(2020)
Road haulagevolume(2020)
Intermodalvolume(2030)
Road haulagevolume(2030)
30% 95,400 222,600 122,112 284,92850% 159,000 159,000 203,520 203,52060% 190,800 127,200 244,224 162,81670% 222,600 95,400 284,928 122,112
Source: This study
To support the scenario setting in terms of volumes, the service scenario setting also needs to be in place in order to conduct the case study. There are a few conditions that need to be considered in developing the scenario:
a) The current situation of the rail operations in the Port Klang-Ipoh corridor
b) The current major activities for each movement i.e. import, export and road haulage movement.

99
These movements show the number of activities involved in each of the intermodal movements and road haulage movements. However, for the intermodal movement, of six major activities only three influence the time for rail transportation directly, as shown in Table 5.4.1. The road haulage movement includes 3 major activities, illustrated in Table 5.4.3

100
Inte
rmod
al im
port
m
ovem
ent
activ
ities
In
term
odal
exp
ort
mov
emen
t ac
tiviti
es
Roa
d ha
ulag
e im
port
m
ovem
ent
Roa
d ha
ulag
e ex
port
m
ovem
ent
a)Lo
adin
g of
co
ntai
ners
on
ra
ilway
w
agon
s at
Po
rt
Kla
ng*
b)Rai
l ha
ulag
e be
twee
n Po
rt
Kla
ng a
nd I
CT
(Ipo
h Car
go
Term
inal
)*
c)H
andl
ing
activ
ities
at
Ip
oh
carg
o te
rmin
al,
prim
arily
un
load
ing
of c
onta
iner
s fr
om
railw
ay
wag
ons
at
the
term
inal
*
d)Lo
adin
g of
co
ntai
ners
on
to
road
fee
der
tran
spor
t at
the
in
land
ter
min
al
e)Fe
eder
tr
ansp
ort
haul
age
betw
een
inla
nd t
erm
inal
and
cu
stom
er p
rem
ises
f)U
nloa
ding
of
co
ntai
ners
fr
om
feed
er
tran
spor
t at
cu
stom
er’s
pre
mis
es
a)Lo
adin
g of
co
ntai
ners
fr
om c
usto
mer
’s p
rem
ises
on
to f
eede
r tr
ansp
ort
b)Fe
eder
tra
nspo
rt b
etw
een
cust
omer
’s p
rem
ises
an
d in
land
ter
min
al
c)U
nloa
ding
of
co
ntai
ners
fr
om fe
eder
tr
ansp
ort
at
inla
nd t
erm
inal
d)H
andl
ing
activ
ities
at
Ipoh
ca
rgo
term
inal
, pr
imar
ily
load
ing
cont
aine
rs
from
fe
eder
tr
ansp
ort
to
the
inla
nd t
erm
inal
*
e)Rai
l ha
ulag
e fr
om t
he I
CT
to P
ort
Kla
ng*
f)U
nloa
ding
of
co
ntai
ners
fr
om
railw
ay
wag
ons
at
Port
Kla
ng.*
a)Lo
adin
g of
con
tain
ers
onto
tr
aile
r at
Por
t Kla
ng
b)Roa
d ha
ulag
e fr
om P
ort
Kla
ng t
o cu
stom
er’s
pr
emis
es
c)U
nloa
ding
of
cont
aine
rs f
rom
ro
ad h
aula
ge t
o cu
stom
er’s
pr
emis
es
a)Lo
adin
g of
con
tain
ers
onto
tr
aile
rs a
t cu
stom
er’s
pr
emis
es
b)Roa
d ha
ulag
e fr
om
cust
omer
’s p
rem
ises
to
Port
Kla
ng
c)U
nloa
ding
of
cont
aine
rs
from
roa
d ha
ulag
e at
Por
t Kla
ng
*Direc
tly in
fluen
ce t
he r
ail m
ovem
ent
in t
he c
orrido
r
Tab
le 5
.4.3
Maj
or
acti
viti
es in
inte
rmo
dal
an
d r
oad
hau
lag
e m
ove
men
t

101
Table 5.4.4 Activities and time taken for intermodal movement Activities* Hours taken
Estimated minimum (hours)
Average (hours)
Loading at Port Klang 2 4
Rail freight haulage 4 8
Unloading at Ipoh Cargo Terminal
2 4
Loading from Ipoh Cargo Terminal to feeder transport
30 minutes 1
Feeder transport haulage 30 minutes 1
Total transit time** 9 20 * Does not include time spent at the container yard ** From Port Klang to customer’s premises in Ipoh
Table 5.4.5 Activities and time taken for direct road haulage movement
Activities* Hours taken Estimated minimum
(hours) Average (hours)=
Loading at Port Klang 1 3
Road haulage to Ipoh 4 6
Total transit time** 5 9 ** From Port Klang to customer premise in Ipoh
The estimated times in Table 5.4:4 are the total transit times for import and export movement in intermodal transportation. The total transit time in this study consists of the time from Port Klang to the customer’s premises in Ipoh and vice versa. Table 5.4:5 shows the total transit time for direct road haulage from Port Klang to Ipoh.
Each of the activities requires a specific time to perform the tasks. Based on the above activities (Table 5.4.2), the total time in rail transit makes up the largest portion of the total intermodal transit time. However, only three main activities directly influence the main activities’ times in rail haulage, as shown in Table 5.4.2.

102
Table 5.4.6 Intermodal activities for import and export movement Intermodal Import movement
activitiesIntermodal Export movement
activitiesa) Loading of containers on railway
wagons at Port Klang
b) Rail haulage time between Port Klang and ICT (Ipoh Cargo Terminal)
c) Handling activities at Ipoh cargo terminal focusing on unloading of containers from railway wagons to the inland terminal
a) Handling activities at Ipoh cargo terminal focusing on loading of containers from feeder transport to the inland terminal
b) Rail haulage time from ICT to Port Klang
c) Unloading of containers from railway wagons at Port Klang.
To set the reliability standard of the intermodal service, the expected minimum and maximum hours of operation for each set of activities are established. This would assist in estimating the total transit time per train. Table 5.4:7 indicated the time based on the operator’s view. This data is based on 2010 operations.
Table 5.4:7 Activities & hours taken for intermodal handling Activities Hours taken
Minimum hours Maximum Hours Loading/unloading at port 2 4
Rail freight haulage 4 6
Unloading/loading at inland terminal
2 4
Total 8 14
The total transit hours are used to estimate the number of train sets required based on the three different train wagons. The two hours are used to estimate the capacity of rail haulage to support intermodal movements. Apart from these total transit time, the demand calculated is based on 75% load factor. Four different scenarios, with specific capacity per train, were analysed in order to determine the required number of train sets.

103
Since rail haulage takes the longest time in intermodal operations, effective and efficient time management is required. The operational data in for rail transportation 2010 are shown in Table 5.4:8
Table 5.4:8: Rail operational data in 2010 Items Indicator
Train size 35 wagons
No of trips 2
Average total train transit time 8 hours
Load factor 70%
Distance 255 km
*Total transit time: From loading at port until arrival at customer’s premises and vice versa
5.4.2 Alternatives setting
Since rail freight is the long-haul movement in the intermodal system, it is vital to understand the different types of alternative which could be implemented to operate the system. The feeder transport from ICT to the final destination remains the same for the calculations in the movement. In this scenario setting, a few fact considerations have been made. Firstly, in 2010, the rail operator in the Port Klang-Ipoh Corridor, KTMB, had the capability to handle between 60 and 80 TEUs per train. Secondly, KTMB had purchased a locomotive that could cope with 100 TEUs per train. Thirdly, a bypass from Serendah to Port Klang is expected to be completed by 2025, which will help reduce both journey time and distance between Port Klang and Ipoh.
Four different alternatives were developed to compare total costs between these services. In creating the alternatives, the planned future railway line between Port Klang and Ipoh was also taken into account. Two scenarios were simulated for each year, 2020 and 2030. Alternatives 1 and 2 are simulated for 2020, whereas alternatives 3 and 4 are for 2030. In selecting the parameter for alternative 3 and 4, it was assumed that the bypass from Serendah to Port Klang would be open. The bypass is expected to shorten the distance by 30 km. The best current handling time was used as the basis for setting the simulated handling time at the port and the ICT. The four different scenarios are illustrated in Table 5.4:9.

104
Table 5.4:9 Alternative setting information Items Alternative
1Alternative
2Alternative
3Alternative
4Train Size 30, 40 & 50 30, 40 & 50 30, 40 & 50 30, 40 & 50
No of trips per train set per day
2 3 2 3
Total train transit time
6 4 4 4
Load factor 75%, 80%, 85%, 90%
75%, 80%, 85%, 90%
75%, 80%, 85%, 90%
75%, 80%, 85%, 90%
Distance 255 km 255 km 225 km 225 km
From the other perspective, the alternatives are set based on the rail operator’s ability to operate efficient services. Therefore, only the rail freight is simulated in order to evaluate the cost and CO2 emissions. The other two components of the intermodal system, i.e. feeder transport and inland terminal handling, are assumed to be constant for cost analysis purposes. The handling time considered is the inland terminal handling time and the port handling time.
These different alternatives are used to compare current and future intermodal services in the Port Klang-Ipoh Corridor. The alternatives were developed based on current operations and on the improvement in services expected by the railway and inland terminal operators. The total transit time is reduced from seven hours to four and six respectively due the expected increase in speed and the efficiency of the inland terminal operator’s transfer activities at the terminal. Another main factor in the reduction of the total transit time is the expected completion of a rail bypass from Serendah to Port Klang (see figure 5.5.1). These alternatives are used to compare the cost per TEU with the current intermodal operation and direct road haulage operation in this corridor. This would help to determine the cost-efficiency factor when operating in the corridor.

105
Figure 5.4.1 Proposed Serendah bypass to Port Klang

106
Based on the 2010 volumes, the intermodal share compared with the forecast total volumes in the Port Klang-Ipoh Corridor in 2020 and 2030 are 13% and 10%, respectively. If the intermodal capacity does not increase, the intermodal share will decline and reduce intermodal’s competitiveness in the future. To ensure that intermodal remains one of the competitive modes in the Port Klang-Ipoh Corridor, four alternatives were used to simulate the cost and service quality requirement.
Table 5.4:10 Maximum intermodal share for 2020 and 2030 (assuming 1 train set for each alternative)
Number ofWagons
Load factor 75% Load factor 80% Load factor 85% Load Factor 90%
Alternative 1 (2020)30 9% 9% 10% 11%40 12% 13% 13% 14%50 15% 16% 17% 18%
Alternative 2 (2020)30 13% 14% 15% 16%40 18% 19% 20% 21%50 22% 24% 25% 26%
Alternative 3 (2030)30 7% 7% 8% 8%40 9% 10% 10% 11%50 11% 12% 13% 14%
Alternative 4 (2030)30 10% 11% 12% 12%40 14% 15% 16% 17%50 17% 18% 20% 21%
Source: This study
Table 5.4:10 shows the maximum intermodal share for all the respective alternatives. The intermodal shares were based on one set of train operations. In 2020, the highest intermodal share that the Port Klang-Ipoh Corridor could capture would be 26% with a load factor of 90%. For 2030, the highest intermodal share would be 21%, also with a 90% load factor. However, if the Port Klang–Ipoh corridor remains with similar capacity and operations to 2010, the intermodal share would be 13% and 10% in 2020 and 2030, respectively. It is therefore vital to assess the capacity required based on these alternative settings. The simulated capacity could then be used to calculate the cost, CO2 emission impact and service quality requirements that need to be implemented in the Port Klang-Ipoh Corridor. Determining the critical mass would be the main focus in attracting and developing the support required for intermodal transportation in the Port Klang-Ipoh Corridor.

107
“High container volume is the most important factor in promoting intermodal issue. Without volume, whatever strategies to be implemented to promote intermodal would not be a success” (Dr Amin, Deputy Managing Director, Century Logistics, 2010).
The alternative settings are used to simulate the service requirements for these alternatives to achieve the four scenarios of intermodal shares for 2020 and 2030.
5.5 Cost and CO2 emission analysis
The quantitative analysis focuses on the cost and CO2 emission analyses. These two analyses are calculated based on the scenarios and alternative settings discussed in section 5.3. These analyses are essential in order to develop the intermodal strategy in Chapter 6.
5.5.1 Cost Structure
The cost for each activity in the intermodal movement and direct road haulage system are considered. For the intermodal movement, three main cost activities are used, viz. rail transport, inland terminal cost and road haulage. To calculate the rail transport and road haulage cost, two cost structures are used. The two cost structures are:
Capital cost, which includes investment and depreciation cost. Operational cost, which only includes three costs: driver costs, maintenance costs and energy costs.
For inland terminal costs, only lifting charges are calculated.
a) Rail transport cost (RTC) structure:
RTC= TCC + TOC RC = Rail cost TCC = Total capital cost
(locomotive + wagon) TOC = Total operating cost
TCC = Capital cost + depreciation cost
TOC = maintenance cost (loco + wagon) + driver cost + energy cost (diesel cost)

108
These variables are assigned to calculate the total capital cost for rail: Cost Components RM
a) Locomotive 8 million (investment cost)
b) Wagon 150,000
The depreciations for the locomotive and wagon are calculated based on 5% per year for 15 years.
The variables for the operations cost are as follows:
Cost components Value
a) Diesel consumption (litres/train-km) 5 litres/km
b) Diesel price per litre RM 2
c) Maintenance cost per km LocomotiveWagon
RM 3,70/km RM 0,10/km
d) Driver cost RM 15/hour
e) Capacity per wagon 2 TEUs
f) Distance 255 km
The rail diesel price is slightly higher because it did not enjoy full subsidies from the government compared to road. The government subsidised about two million litres of KTMB’s diesel per year. If the amount exceeds two million litres, KTMB must pay the normal price. As an average, KTMB pays RM 2,00 per litre for its diesel.
The rail cost calculation components are shown in Figure 5.5:2.

109
Figure 5.5:1 Cost model for rail haulage
2011 11 02 Cost level 2010 OperationDiesel traction Infrastructure data
Variable Value Line haul Maximun train length (m) m 500Malaysian freight trains Max axle load (ton) tonnes 16Capital costs Max speed (km/h) km/h 90Locomotive Train dataType locomotive Diesel Line length km 255Tractive effort KW 1800 Total Km Travel per day 510Axles/locomotive number 6 Timetable time h 7,0Weight tonnes 90 Total time perday 14,0Axle load tonnes 15,0 Average speed 36Lentght meter 20 Train tare weight 598Capital cost Train length meter 510Investment cost MSEK 8 000 000 Capacity TEU 70Depritiation years 15 533 333 Average load faktor TEUs 70%Interest 5% 200 000 Number of TEU/train 49Cost/year 733 333 Number of TEU/day 98
AverageWeight/TEU tonnes 12Wagons Load weight 588Axles/wagon 4 Train gross weight average 1 186Tare weight/wagon tonnes 15 Total TEUs per day 98Max load weight/wagon tonnes 45Axle load tonnes 15 Operation cost Cost/dayNumber of TEU:s per wagon number 2 LocomotiveLength meter 14 Maintenace cost RM/km 3,7 1 887Capital cost Driver cost RM/h 15 210Investment cost MSEK 150 000 WagonsDepritiation years 15 10 000 Maintenace cost (sek/km) RM/km 0,10 1 785Interest 5% 3750 Track fees RM/traink 0,00 0Cost/year 13 750 Track fees RM/grosst 0,00 0
Sum 3882Train capital costNumber of engines reserv 15% 1 Energy consumption literNumber of wagons reserv 10% 35 liter/trainkm 2,00 1 020Capital cost/year liter/grosstonkm 0,0022 1 330Locomotives 843 333 liter/trainkm 4,6 2 350Wagons 529 375 Fuel price RM/liter 2,0 4 700Sum 1 372 708
Total operation costs 8 582Days/year in operation days 312 Total capital cost 2 200Number of trips/day 2,0 Total cost 10 782Total number of trips/year 624 Risk/profit 10% 1078Capital cost/trip 2 200 Total 11 860
Cost/trainkm 47
Cost/TEU 121
Cost model for Freight train production

110
b) Inland terminal cost (ITC)
Inland terminal cost applied for this research is the lifting cost. From the interview with the Ipoh Cargo Terminal (ICT), the lifting cost is the best estimate provided by the inland terminal operator. The inland cost per trainset is RM 5,500. This is based on the present operation with train size of 35 wagons. This cost figure was obtained from the Ipoh Cargo Terminal operator. From this estimate, the cost per TEU for every type of alternative can be calculated.
c) Feeder transport cost
Feeder transport cost (FTC) structure
FTC = TCC + TOC FTC= Feeder Transport Cost
TCC = Total capital cost (prime mover + trailer)
TOC = Total operating cost
TCC = Capital cost + depreciation cost
TOC = maintenance cost + driver cost + energy cost (diesel cost)
One important component in the calculation of the feeder transport cost is the relocation factor. This factor is to accommodate the empty leg journey movement for the road haulage.
For feeder transport’s total capital cost calculation, the variables and value assigned to this activity are as follows:
Cost Components RM
a) Prime mover 240,000 (investment cost)
b) Trailer 30,000
The depreciation cost for the prime mover and trailer are calculated based on 5% per year for 10 years.
The variables and values used for feeder transport’s operating cost are as follows:
Cost components Value
a) Diesel consumption 0.53 litre/km
b) Diesel price per litre RM 1,80
c) Maintenance cost per km for prime mover and trailer RM 0,50/km
d) Driver cost RM 7/hour
e) Capacity per trailer 2 TEUs
f) Distance 30 km radius The calculation is shown in Figure 5.5:2

111
Figure 5.5:2 Cost model for road haulage (ICT to customer)
Cost model for road haulage production (ICT to customer)2011 11 02 Cost level 2010 c) Operation data
Variable Value Infratructure dataMalaysian road haulage Max length incl trailerCapital costs RM 20 ft containerPrimemover Maximum load (tonnes) 22Type prime mover Diesel Average load (tonnes) 20Engine Maximumm3Weight tonnes 8 40 ft containerUnit max gross weight tonnes 45 Maximum load (tonnes) 25Length metres 2,5 Average load (tonnes) 22Capital cost Maximumm3Investment cost RM 240 000Depreciation years 10 24 000 Prime mover dataInterest 5% 6 000 Km travel per month km 2520Cost/year 30 000 Hours travel permonth 151cost/ month 12 2 500 Drivers working hours per month 151
No of driver per prime mover 1Trailer KMtravel per day 144Tare weight tonnes 4 Hours in service per day 7Max load weight tonnes Diesel consumption litre/km 0,53Number of TEU:s per trailer number 2 Diesel consumption per day 76Length Diesel price per litre RM/litre 1,820 ft metres 6 Maintenance cost per km 0,5040ft metres 12 Driver cost RM/hr 7Capital costInvestment cost MSEK 30 000 RMDepreciation years 10 3 000 Prime moverInterest 5% 750 Driver salary (per person) 50Cost/year 3 750 Insurance 30cost per month 12 313 Maintenance 72Capital cost per yar Diesel (energy) 137Prime mover 30 000 other costtrailer 3 750 Total 290Total 33 750 TrailerOperation MaintenanceDays/year in operation days 312 Other costDays/month in operation days 21 Total 0Number of round trips/day 4,0Total number of trips/year 1 248 Total operation cost 290Total number of trips/month 84 Total capital cost 108Km per trip 30 Sum 398Reallocation run factor 1,2 Profit/risk 10% 40Hours per trip (incl waiting time) 1,5 Total cost 438total hours per day 6Load factor 80% Cost per TEU 68total TEUS per day 6,4Capital cost/day 108 Cost/km 3,04
d) Operation cost per day
112
5.5.2 Intermodal cost (IC)
Intermodal movement consists of three main activities, i.e. rail transport, inland terminal and feeder transport to the inland terminal, and customer premises.
The cost structure for intermodal movement is:
IC = RTC + ITC + FTC
IC= Intermodal cost RTC= Rail transport cost ITC = Inland terminal cost FTC = Feeder transport cost
Since the Port Klang-Ipoh Corridor is the movement between Port Klang and customer in Ipoh, there is only one feeder transport movement for each intermodal movement since it is in Port Klang that the containers are loaded onto the rail wagons from the container yard.
5.5.3 Direct road haulage cost
Direct road haulage cost (DRHC) structure DRHC = TCC + TOC DRHC = Direct Road Haulage Cost
TCC = Total capital cost (prime mover + trailer)
TOC = Total operation cost
TCC = Capital cost + depreciation cost
TOC = maintenance cost + driver cost + energy cost + toll cost
For direct haulage total capital cost calculation, the variables and value assigned to this activity are as follows:
Cost Components RM
a) Prime mover 240,000 (investment)
b) Trailer 30,000
The depreciations cost for the prime mover and trailer are calculated based on 5% per year for 10 years.

113
Similar to the feeder transport calculation, the relocation factor is also included in the calculation. The inclusion of this factor is to accommodate the empty leg journey movement in road haulage.
The variables and values used for direct road haulage operation cost are as follows:
Cost components Value
a) Diesel consumption 0.53 litre/km
b) Diesel price per litre RM 1,50
c) Maintenance cost per km for prime mover and trailer RM 0,50/km
d) Driver cost RM 7/hour
e) Capacity per trailer 2 TEUs
f) Distance 230 km
5.5.4 Cost analysis for alternatives setting
In conducting the cost analysis, two analyses were conducted. Cost analysis by changing a single cost variable such as travel time, number of trips and load factor Comparison between the current intermodal cost, the alternative intermodal cost and direct road haulage cost.
I) Cost per TEU from rail activity.
Rail transport is the long haulage service for intermodal movement. It also represents the most significant cost for intermodal movement. In determining the total intermodal cost, the changes in railway cost would bring significant changes for the reduction of intermodal cost. By capitalising the advantages of rail transport, intermodal movement could be a great success for Malaysia. In the scenario to conduct the cost analysis for rail transport, four main components were analysed in order to determine the cost that would have the greatest impact in reducing the intermodal cost. These components are: a) train size, b) number of trips c) load factor, and d) travel time. The same volume figure is used throughout the analysis.

114
a) Train size
With 75% load factor, the cost/TEU would fall from RM 200 to RM 150 between train size 30 and train size 50, or 28% of the cost. With greater capacity, the total intermodal cost would be reduced significantly. (Figure 5.5:3)
b) Number of trips
There will be a significant cost reduction when rail transport triples its trips. A cost reduction of up to 46% can be achieved. However, if the trips are increased up to 5 or more per train set per day, the cost would stand still.
200
170152
140
0
50
100
150
200
250
0 20 40 60 80
RM
Train Size
Figure 5.5:3 Cost per TEU: Train Size
0
50
100
150
200
250
0 2 4 6 8 10 12
RM
Trips
Figure 5.5:4 Cost Per TEU: No of Trips
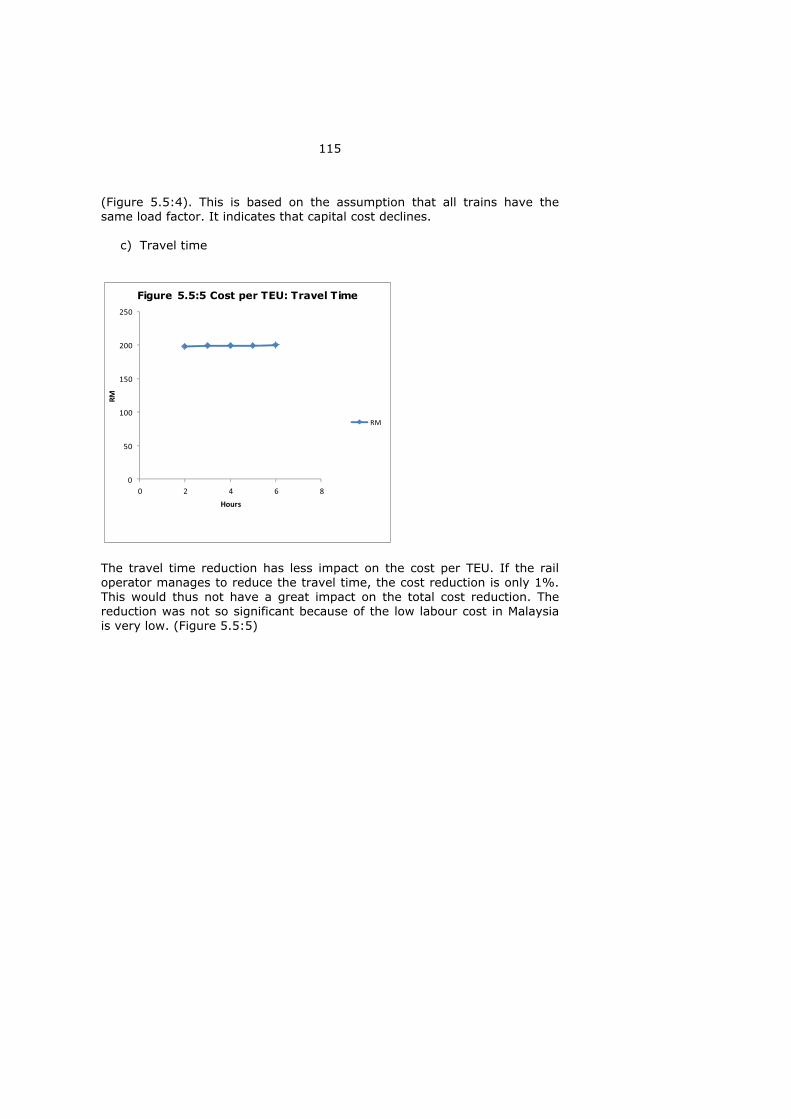
115
(Figure 5.5:4). This is based on the assumption that all trains have the same load factor. It indicates that capital cost declines.
c) Travel time
The travel time reduction has less impact on the cost per TEU. If the rail operator manages to reduce the travel time, the cost reduction is only 1%. This would thus not have a great impact on the total cost reduction. The reduction was not so significant because of the low labour cost in Malaysia is very low. (Figure 5.5:5)
0
50
100
150
200
250
0 2 4 6 8
RM
Hours
Figure 5.5:5 Cost per TEU: Travel Time
RM

116
d) Load factor
Load factor has the greatest impact in reducing rail transport cost. By increasing the load factor from 50% to 70%, the cost per TEU can be reduced by up to 27%. In the transport service, this reduction would increase intermodal’s competitive advantage for the rail transport operator to promote intermodal movement. The second largest impact is the capacity from 30 to 50 wagons, followed by the number of trips. When the trips are increased from two to 4 per day per train set, then the cost will stagnate. (Figure 5.5:6) This is based on the assumption that the train is the same size and makes the same number of trips.
Of these four variables, travel time has least impact in reducing the cost for rail transport movement. This is because of the low salary structure in Malaysia, which has no impact in terms of labour cost. Number of wagons,number of trips and load factor have a great impact in reducing the rail transport cost. However, the travel time reduction is important in order for the rail transport operator to increase the number of trips. The reduction in travel time would enable the rail operator to make more trips, which could provide a greater cost reduction per TEU for container movement.
290
244211
187168
152
0
50
100
150
200
250
300
350
0% 20% 40% 60% 80% 100%
RM
Load Factor
Figure 5.5:6 Cost Per TEU: Load Factor
RM

117
5.5.5 Comparison between the existing intermodal cost and the alternatives intermodal cost
The cost analysis was conducted based on the alternatives determined earlier in Section 5.5. The intermodal cost consists of 1) rail haulage cost, 2) inland terminal cost, and 3) feeder transport cost.
For rail haulage cost, train size, number of trips and load factor have the greatest impact on the cost reduction. The time reduction enables the rail operator to increase the number of round trips per day. Since rail haulage is the biggest cost in intermodal movement, all the alternatives were analysed based on the number of trips per set a rail operator can run per day. To perform the cost analysis, these four alternatives were analysed separately. Four different load factors, 75%, 80%, 85% and 90%, were simulated in order to analyse the intermodal cost.
Table 5.5:1: Cost/TEU comparison
Train size Load factor75%(RM)
Load factor80%(RM)
Load factor85%(RM)
Load factor90%(RM)
Existingintermodalcost, Loadfactor 70%35 wagons
(RM)
Direct roadHaulagecost(RM)
Alternative 1
387
30 309 295 282 27029740 261 250 239 231
50 233 223 214 206Alternative 2
30 294 281 269 25829740 249 238 229 221
50 222 213 205 197Alternative 3
387
30 347 283 271 26029740 251 240 230 222
50 223 214 206 198Alternative 4
30 282 270 258 24829740 239 229 220 212
50 213 204 197 190
Table 5.5:1 shows the intermodal cost simulated from four different alternatives. All these costs are then compared with the cost of existing intermodal that currently operates in the Port Klang-Ipoh Corridor and also the direct road haulage cost. In the following section, these alternatives’ costs, existing intermodal cost and direct road haulage cost are analysed in detail and compared. The cost reduction that these alternatives offer is also analysed.

118
a) Alternative 1: 2 trips per day, 6 hours rail transit time, distance 255 km (2020)
The simulated result for Alternative 1 in 2020 shows the following. By increasing the load factor from 75% to 90%, the cost/TEU could be reduced by 9%, 22% and 30% for train sizes 30, 40 and 50 respectively. This is in comparison with the existing movement with train size 35 and 70% load factor. (Figure 5.5:7)
Figure 5.5:7 Alternative 1: Cost reduction between the existing intermodal cost and the targeted load factor

119
b) Alternative 2: 3 trips, 4 hours rail time, 255 km distance (2020)
The simulated result for Alternative 2 in 2020 shows that by increasing the load factor from 75% to 90%, the cost/TEU could to be reduced by 13%, 26% and 33% for train sizes 30, 40 and 50 respectively. (Figure 5.5:8)
Figure 5.5:8 Alternative 2: Cost reduction between the existing intermodal cost and the targeted load factor
Table 5.5:2: % of cost reduction between alternatives 1 and 2 in 2020
Train sizeLoad factor
75%Load factor
80%Load factor
85%Load factor
90%30 5% 5% 5% 5%40 5% 5% 4% 4%50 5% 4% 4% 4%
Alternative 2 gives a greater cost reduction than alternative 1. The cost reduction differences between alternatives 1 and 2 for 2020 are shown in Table 5.5:2. Generally, alternative 2 gives a cost reduction of betweeen 4% and 5% for intermodal movement in 2020 since the number of trips would increase from 2 to 3, thus shortening the transit time.

120
c) Alternative 3: 2 trips per day, 4 hours rail transit time, distance 225 km (2030)
The simulated results for Alternative 3 in 2030 show that by increasing the load factor from 75% to 90%, the cost/TEU could be reduced by 12%, 25% and 33% for train sizes 30, 40 and 50 respectively. (Figure 5.5:9)
Figure 5.5:9 Alternative 3: Cost Reduction between the existing intermodal cost and the targeted load factor

121
d) Alternative 4: 3 trips per day, 4 hours rail transit time, distance 225 km
The simulated results for Alternative 4 in 2030 show that by increasing the load factor from 75% to 90%, the cost/TEU could be reduced by 16%, 29% and 36% for wagon sizes 30, 40 and 50 respectively. (Figure 5.5:10)
Figure 5.5:10 Alternative 4: Cost reduction between existing intermodal cost and the targeted load factor
Table 5.5:3 % of cost reduction between alternatives 3 and 4
Train sizeLoad factor
75%Load factor
80%Load factor
85%Load factor
90%30 5% 5% 5% 5%40 5% 5% 5% 5%50 5% 5% 5% 4%
Alternative 4 gives a greater cost reduction than alternative 3. The cost reduction differences between Alternative 3 and Alternative 4 for 2030 are shown in Table 5.5:3. Generally, Alternative 4 will give a cost reduction of between 3% and 5% for intermodal movement in 2030, due to the higher volume of containers resulting from increasing the load factor.

122
Cost-effectiveness has always been the most important criterion for any business. In this case study, with the increase in load factor from 75% to 90% and up to 3 trips a day, the intermodal cost would be reduced significantly compared with the existing intermodal operation. As shown in section 5.2, the load factor and the number of trips per train make a huge difference in terms of cost reduction. The expected container volumes in this corridor in 2020 and 2030 should be able to ensure that sufficient volumes are available to operate effective and efficeint intermodal movement in the corridor. However, more promotion and support from the relevant parties are needed for intermodal movement in the the Port Klang-Ipoh Corridor to be successful. This would enable the Port Klang-Ipoh Corridor to enjoy better cost-effeciency in intermodal movement in the corridor.
5.5.6 Comparison between the alternatives’ intermodal cost and the direct road haulage cost
Figures 5.5:11 and 5.5:12 illustrate the Alternative 1 intermodal cost compared with the direct road haulage cost. Train size 50 enjoys a cost saving of more than 40% compared to direct road haulage even with the lowest load factor of 75%.

123
Figure 5.5:11 Alternative 1: Cost per TEU comparison between intermodal and direct road haulage
Figure 5.5:12 Alternative 1: % of cost reduction between intermodal and direct road haulage

124
Figures 5.5:13 and 5.5:14 illustrate the Alternative 2 intermodal cost compared with the direct road haulage cost. Train size 50 enjoys a cost saving of between 47% and 51% compared to direct road haulage.
Figure 5.5:13 Alternative 2: Cost per TEU comparison between intermodal and direct road haulage
Figure 5.5:14 Alternative 2: % of cost reduction between intermodal and direct road haulage with various load factor

125
Figures 5.5:15 and 5.5:16 illustrate the alternative 3 intermodal cost compared with the direct road haulage cost. Train size 50 enjoys a cost saving of between 42% and 49% compared to direct road haulage.
Figure 5.5:15 Alternative 3: Cost per TEU comparison between intermodal and direct road haulage
Figure 5.5:16 Alternative 3: % of cost reduction between intermodal and direct road haulage with various load factors

126
Figures 5.5:17 and 5.5:18 illustrate the Alternative 4 intermodal cost compared with the direct road haulage cost. Train size 50 enjoys a cost saving of 45-51% compared to direct road haulage.
Figure 5.5:17 Alternative 4: Cost per TEU comparison between intermodal and direct road haulage
Figure 5.5:18 Alternative 4: % of cost reduction between intermodal and direct road haulage with various load factors

127
5.6 CO2 emissions
CO2 emissions are calculated based on the United Nations Environmental Program (UNEP) GHG emission factor indicator. UNEP uses these guidelines periodically in collaboration with WRI/WBCSD. The website www.ghgprotocol.org is used to engage the latest GHG emission indicator. This case study focuses on CO2 emissions. In the evaluation of CO2 emissions, only emissions from the transport modes were taken into consideration. CO2 emissions at ports and inland terminal were not considered in this research. The CO2 emissions of the following modes are calculated:
CO2 emissions from intermodal (rail and feeder transport) CO2 emissions from direct road haulage
In calculating CO2 emissions, several criteria need to be set in order to achieve the desired objective. These are:
Laden container: 65%; weight: 20 tonnes
Empty container: 35%; weight 3.9 tonnes
Rail distance (for alternatives 1 and 2): 255 km
Rail distance (for alternatives 3 and 4): 225 km
Feeder transport distance: 30 km
Direct road haulage: 230 km
Scenarios are used in analysing the CO2 emissions. Scenario 1 analyses the CO2 emissions based on the targeted intermodal share. Scenario 2 analyses CO2 emission based on the four different alternatives discussed in Section 5.3. At the end of this section, a comparison is made between the two scenarios to analyse the different impact each scenario has on CO2 emissions. The fact is that for the train with one locomotive, the marginal energy and CO2 for each coupled wagon will be less because there are some factors which do not change very much: the locomotive’s weight is the same and the air resistance thus does not change.

128
5.6.1 Tonnes-km calculation
To establish the percentage of CO2 emissions, the case study needs to determine the tonnes-km handled by each mode of transport. After establishing the tonnes-km, this then needs to be multiplied by the indicator from GHG Protocol. The percentage of CO2 emissions can be established using the resulting figure.
Table 5.6:1 shows the total tonnage for the targeted intermodal share for 2020 and 2030. Tables 5.6:2 through 5.6:5 show the total tonnage/km handled by each mode of transport in 2020 and 2030 for the four different alternatives. The total tonneskm is based on the intermodal share of each train size. The total tonnage for each intermodal share is then determined by applying the four different load factors. These analyses were based on the two scenarios mentioned earlier.
Table 5.6:1 Tonnes-km for targeted intermodal share in 2020 and 2030
Intermodal share
Rail(tonnes-km)
FeederTransport
(tonnes-km)Direct road haulage
(tonnes-km) 2015
30% 256,269 30,149 539,337 50% 427,115 50,249 385,241 60% 512,537 60,299 308,192 70% 597,960 70,348 231,144
2020 30% 349,457 41,113 735,459 50% 582,429 68,521 525,328 60% 698,915 82,225 420,262 70% 815,400 95,929 315,197

129
Table 5.6:2 Tonnes-km for Alternative 1, intermodal share in 2020
Trainsize
Intermodal share
Rail
(tonnes-km)
FeederTransport
(tonnes-km)
Direct roadhaulage
(tonnes-km)
Load factor 75% 30 12% 102,859 12,101 677,706 40 16% 137,146 16,135 646,781 50 20% 171,432 20,168 615,856
Load Factor 80% 30 13% 109,716 12,908 671,521 40 17% 146,289 17,210 638,535 50 21% 182,861 21,513 605,548
Load Factor 85% 30 14% 116,574 13,715 665,336 40 18% 155,432 18,286 630,288 50 23% 194,289 22,858 595,240
Load factor 90% 30 14% 123,431 14,521 659,151 40 19% 164,575 19,362 622,041 50 24% 205,718 24,202 584,931

130
Table 5.6:3 Tonnes-km for Alternative 2, intermodal share in 2020
Trainsize
Intermodal share
Rail
(tonnes-km)
Feedertransport
(tonnes-km)
Direct road haulage
(tonnes-km) Load factor 75%
30 18% 154,289 18,152 631,319 40 24% 205,718 24,202 584,931 50 30% 257,148 30,253 538,544
Load factor 80% 30 19% 164,575 19,362 622,041 40 26% 219,433 25,816 572,561 50 32% 274,291 32,270 523,081
Load factor 85% 30 20% 174,861 20,572 612,764 40 27% 233,147 27,429 560,191 50 34% 291,434 34,286 507,619
Load factor 90% 30 22% 185,146 21,782 603,486 40 29% 246,862 29,043 547,821 50 36% 308,577 36,303 492,156
Table 5.6:4 Tonnes-km for Alternative 3, intermodal share in 2030
Trainsize
Intermodal share
Rail
(tonnes-km)
Feedertransport
(tonnes-km)
Direct road haulage
(tonnes-km) Load factor 75%
30 9% 90,758 12,101 957,881 40 12% 121,011 16,135 926,956 50 15% 151,263 20,168 896,031
Load factor 80% 30 9% 96,809 12,908 951,696 40 13% 129,078 17,210 918,710 50 16% 161,348 21,513 885,723
Load factor 85% 30 10% 102,859 13,715 945,511 40 13% 137,146 18,286 910,463 50 17% 171,432 22,858 875,415
Load factor 90% 30 11% 108,910 14,521 939,326 40 14% 145,213 19,362 902,216 50 18% 181,516 24,202 865,106

131
Table 5.6:5 Tonnes-km for Alternative 4, intermodal share in 2030
Trainsize
Intermodal share
Rail
(tonnes-km)
FeederTransport
(tonnes-km)
Direct road haulage
(tonnes-km) Load factor 75%
30 13% 136,137 18,152 911,494 40 18% 181,516 24,202 865,106 50 22% 226,895 30,253 818,719
Load factor 80% 30 14% 145,213 19,362 902,216 40 19% 193,617 25,816 852,736 50 24% 242,022 32,270 803,256
Load factor 85% 30 15% 154,289 20,572 892,939 40 20% 205,718 27,429 840,366 50 25% 257,148 34,286 787,794
Load factor 90% 30 16% 163,365 21,782 883,661 40 21% 217,819 29,043 827,996 50 26% 272,274 36,303 772,331
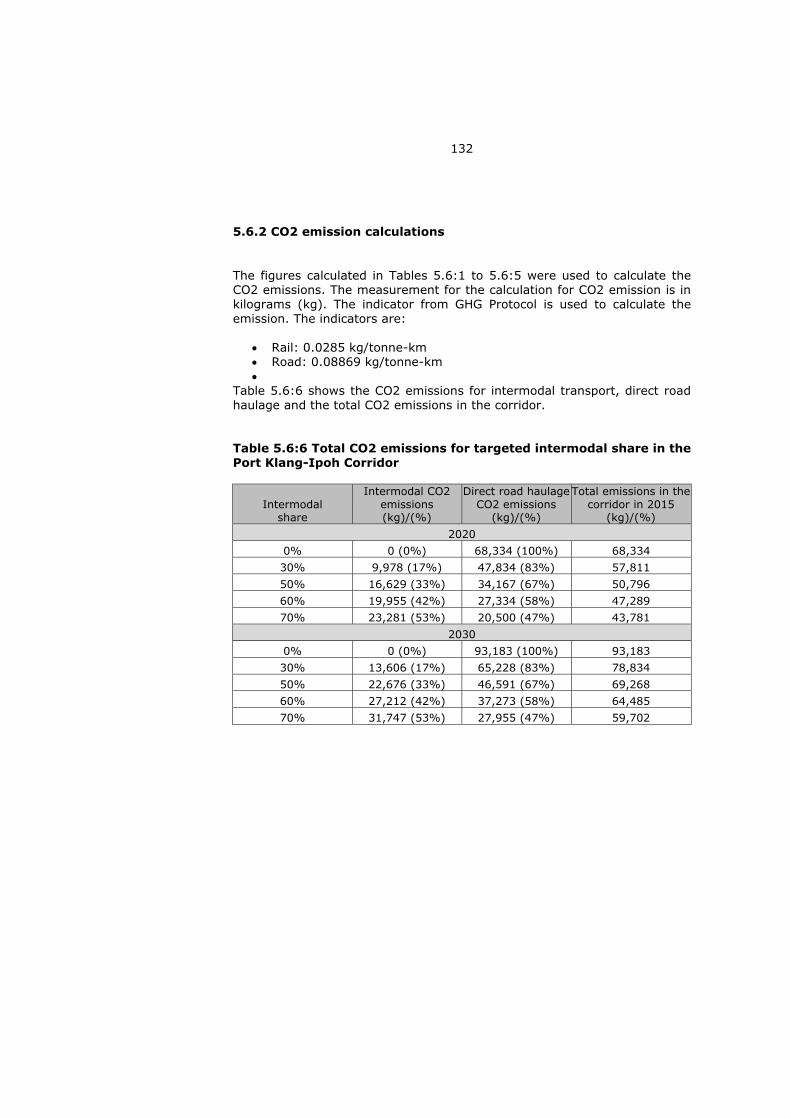
132
5.6.2 CO2 emission calculations
The figures calculated in Tables 5.6:1 to 5.6:5 were used to calculate the CO2 emissions. The measurement for the calculation for CO2 emission is in kilograms (kg). The indicator from GHG Protocol is used to calculate the emission. The indicators are:
Rail: 0.0285 kg/tonne-km Road: 0.08869 kg/tonne-km
Table 5.6:6 shows the CO2 emissions for intermodal transport, direct road haulage and the total CO2 emissions in the corridor.
Table 5.6:6 Total CO2 emissions for targeted intermodal share in the Port Klang-Ipoh Corridor
Intermodalshare
Intermodal CO2 emissions (kg)/(%)
Direct road haulageCO2 emissions
(kg)/(%)
Total emissions in thecorridor in 2015
(kg)/(%) 2020
0% 0 (0%) 68,334 (100%) 68,334 30% 9,978 (17%) 47,834 (83%) 57,811 50% 16,629 (33%) 34,167 (67%) 50,796 60% 19,955 (42%) 27,334 (58%) 47,289 70% 23,281 (53%) 20,500 (47%) 43,781
20300% 0 (0%) 93,183 (100%) 93,183 30% 13,606 (17%) 65,228 (83%) 78,834 50% 22,676 (33%) 46,591 (67%) 69,268 60% 27,212 (42%) 37,273 (58%) 64,485 70% 31,747 (53%) 27,955 (47%) 59,702

133
Table 5.6:7 Alternative 1. Comparison of C02 emissions between different load factors
Train size
Intermodalshare
Total intermodal CO2 emissions
(kg)/(%)
Total road CO2 emissions (kg)/(%)
Total emissions inthe corridor (kg)/(%)
Load factor 75% 30 12% 4,005 (6%) 60,106 (94%) 64,110 40 16% 5,340 (9%) 57,363 (91%) 62,703 50 20% 6,675 (11%) 54,620 (89%) 61,295
Load Factor 80% 30 13% 4,272 (7%) 59,557 (93%) 63,829 40 17% 5,696 (9%) 56,632 (91%) 62,327 50 21% 7,120 (12%) 53,706 (88%) 60,826
Load Factor 85% 30 14% 4,539 (14%) 59,009 (93%) 63,547 40 18% 6,052 (18%) 55,900 (90%) 61,952 50 23% 7,564 (23%) 52,792 (87) 60,356
Load factor 90% 30 14% 4,806 58,460 (92%) 63,266 40 19% 6,408 55,169 (90%) 61,576 50 24% 8,009 51,878 (87%) 59,887
Table 5.6:8 Alternative 2. Comparison of C02 emissions between different load factors
Train size
Intermodalshare
Total intermodalCO2 emissions
(kg)/(%)
Total road CO2 emissions (kg)/(%)
Total emissions in the corridor
(kg)/(%) Load factor 75%
30 18% 6,007 (10%) 55,992 (90%) 61,999 40 24% 8,009 (13%) 51,878 (87%) 59,887 50 30% 10,012 (17%) 47,763 (83%) 57,775
Load Factor 80% 30 19% 6,408 (10%) 55,169 (90%) 61,576 40 26% 8,543 (14%) 50,780 (86%) 59,324 50 32% 10,679 (19%) 46,392 (81%) 57,071
Load Factor 85% 30 20% 6,808 (11%) 54,346 (89%) 61,154 40 27% 9,077 (15%) 49,683 (85%) 58,761 50 34% 11,347 (20%) 45,021 (80%) 56,367
Load factor 90% 30 22% 7,209 (12%) 53,523 (88%) 60,732 40 29% 9,611 (17%) 48,586 (83%) 58,198 50 36% 12,014 (22%) 43,649 (78%) 55,664
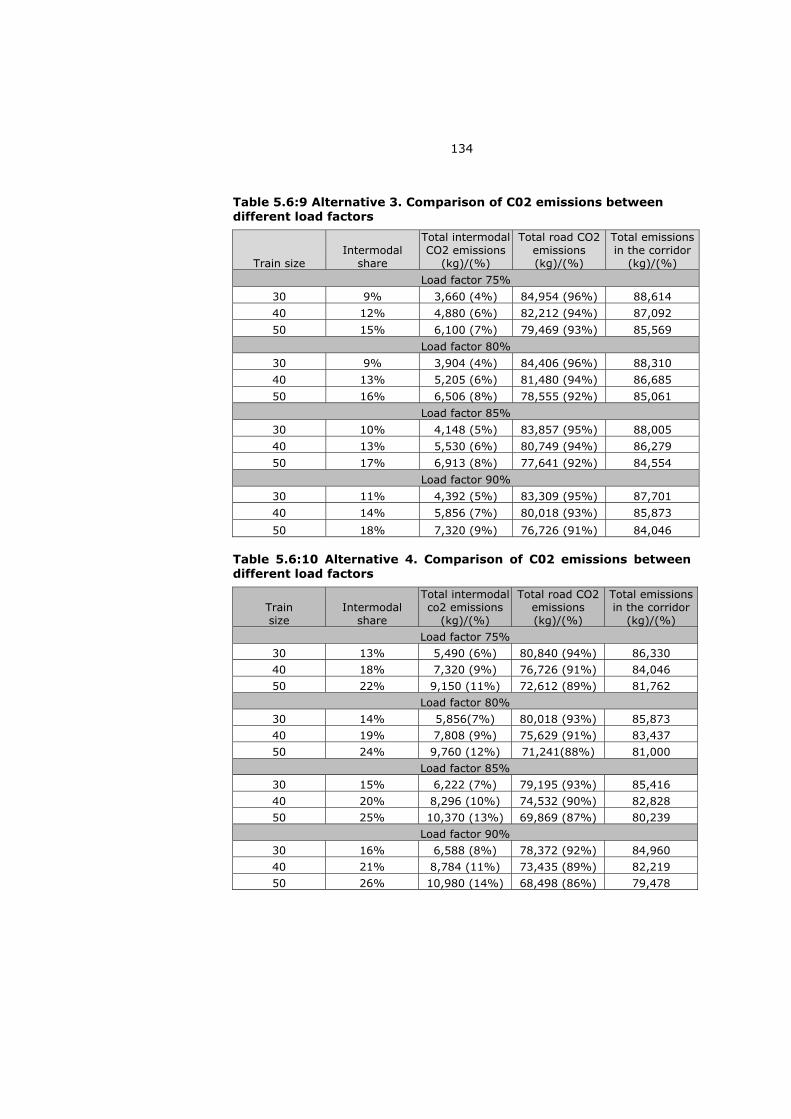
134
Table 5.6:9 Alternative 3. Comparison of C02 emissions between different load factors
Train size Intermodal
share
Total intermodalCO2 emissions
(kg)/(%)
Total road CO2 emissions (kg)/(%)
Total emissions in the corridor
(kg)/(%) Load factor 75%
30 9% 3,660 (4%) 84,954 (96%) 88,614 40 12% 4,880 (6%) 82,212 (94%) 87,092 50 15% 6,100 (7%) 79,469 (93%) 85,569
Load factor 80% 30 9% 3,904 (4%) 84,406 (96%) 88,310 40 13% 5,205 (6%) 81,480 (94%) 86,685 50 16% 6,506 (8%) 78,555 (92%) 85,061
Load factor 85% 30 10% 4,148 (5%) 83,857 (95%) 88,005 40 13% 5,530 (6%) 80,749 (94%) 86,279 50 17% 6,913 (8%) 77,641 (92%) 84,554
Load factor 90% 30 11% 4,392 (5%) 83,309 (95%) 87,701 40 14% 5,856 (7%) 80,018 (93%) 85,873 50 18% 7,320 (9%) 76,726 (91%) 84,046
Table 5.6:10 Alternative 4. Comparison of C02 emissions between different load factors
Train size
Intermodalshare
Total intermodalco2 emissions
(kg)/(%)
Total road CO2 emissions (kg)/(%)
Total emissions in the corridor
(kg)/(%) Load factor 75%
30 13% 5,490 (6%) 80,840 (94%) 86,330 40 18% 7,320 (9%) 76,726 (91%) 84,046 50 22% 9,150 (11%) 72,612 (89%) 81,762
Load factor 80% 30 14% 5,856(7%) 80,018 (93%) 85,873 40 19% 7,808 (9%) 75,629 (91%) 83,437 50 24% 9,760 (12%) 71,241(88%) 81,000
Load factor 85% 30 15% 6,222 (7%) 79,195 (93%) 85,416 40 20% 8,296 (10%) 74,532 (90%) 82,828 50 25% 10,370 (13%) 69,869 (87%) 80,239
Load factor 90% 30 16% 6,588 (8%) 78,372 (92%) 84,960 40 21% 8,784 (11%) 73,435 (89%) 82,219 50 26% 10,980 (14%) 68,498 (86%) 79,478

135
With all the data on CO2 emissions from the targeted intermodal share and all the 4 alternatives, a comparison was made of by how much CO2 emissions could be reduced based on the two situations. Table 5.6:11 summarises the percentage CO2 emissions. With 70% intermodal share, CO2 emissions could be reduced by up to 36%, whereas in 2020 by implementing Alternative 2 with a load factor of 90%, CO2 emissions could only be reduced by 19%. This corresponds to 36% of intermodal share. By implementing Alternative 4 with 90% load factor, CO2 emissions could be reduced by up to 15% with the intermodal share of 26% by 2030.
In order to obtain a maximum reduction in CO2 emissions in this corridor, the targeted intermodal shares need to be achieved.
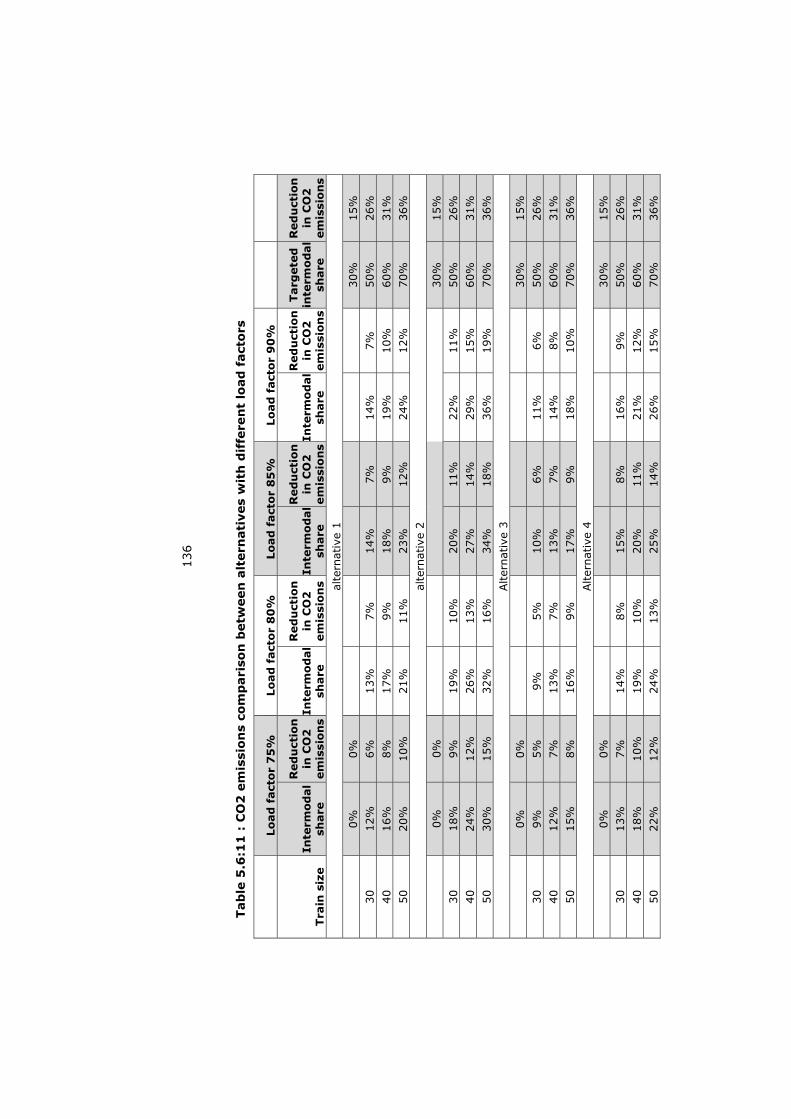
136
Tab
le 5
.6:1
1 :
CO
2 e
mis
sio
ns
com
par
iso
n b
etw
een
alt
ern
ativ
es w
ith
dif
fere
nt
load
fac
tors
Load
fac
tor
75
%
Load
fac
tor
80
%
Load
fac
tor
85
%
Load
fac
tor
90
%
Trai
n s
ize
Inte
rmod
alsh
are
Red
uct
ion
in C
O2
em
issi
ons
Inte
rmod
alsh
are
Red
uct
ion
in C
O2
em
issi
ons
Inte
rmod
alsh
are
Red
uct
ion
in C
O2
em
issi
ons
Inte
rmod
alsh
are
Red
uct
ion
in C
O2
em
issi
ons
Targ
eted
in
term
odal
shar
e
Red
uct
ion
in C
O2
em
issi
ons
alte
rnat
ive
1 0%
0%
30
%15
%30
12%
6%
13%
7%
14
%7%
14
%
7%
50%
26%
4016
%8%
17
%
9%
18%
9%
19%
10
%
60%
31%
5020
%10
%
21%
11
%
23%
12%
24
%
12%
70
%36
%al
tern
ativ
e 2
0%0%
30%
15%
3018
%9%
19
%
10%
20
%11
%
22%
11
%
50%
26%
4024
%12
%
26%
13
%
27%
14%
29
%
15%
60
%31
%50
30%
15%
32
%
16%
34
%18
%
36%
19
%
70%
36%
Alte
rnat
ive
3 0%
0%
30
%15
%30
9%5%
9%
5%
10
%6%
11
%
6%
50%
26%
4012
%7%
13
%
7%
13%
7%
14%
8%
60
%31
%50
15%
8%
16%
9%
17
%9%
18
%
10%
70
%36
%Alte
rnat
ive
4 0%
0%
30
%15
%30
13%
7%
14%
8%
15
%8%
16
%
9%
50%
26%
4018
%10
%
19%
10
%
20%
11%
21
%
12%
60
%31
%50
22%
12%
24
%
13%
25
%14
%
26%
15
%
70%
36%

137
5.7 Service quality
The service quality characteristics in the Port Klang-Ipoh Corridor are derived from the customer service survey and the literature study conducted. The two most important quality characteristics of the transport services were capacity and reliability, which determine the cost implication in operating any transport system. However, in addition to these two factors, environmental and safety issues are also critical to achieve the highest level of service quality.
Transport capacity means the volume of transport activity that can be reasonably and safely accommodated by a transport facility. To develop a successful intermodal service, one of the most important characteristics is sufficient volume. In this case study, intermodal movement capacity is closely related to the capacity of the rail haulage. If rail haulage can handle a high volume of containers, intermodal capacity will be able to increase its share in the Port Klang-Ipoh Corridor.
Estimated container volumes for 2020 and 2030 in the Port Klang-Ipoh Corridor are 318,000 TEUs and 407,040 TEUs, respectively. Based on this estimate, four different intermodal share scenarios could be applied to determine an estimated volume for intermodal movement in the corridor.
Reliability means that the transport system is able to perform the required function for a given period of time. Reliability has already been identified as one of the most important service quality characteristics that affect mode choice. It also involves service consistency and also depends on other factors such as frequency and capacity. A well-planned schedule for rail services would increase the reliability of the intermodal service.
Frequency of service is closely related to reliability. More frequent service is a key factor for intermodal services. Intermodal efficiency, however, not only depends on frequency to measure its reliability. Handling activities at inland terminals are also a major concern for customers. It is a well-known fact that apart from cost and time issues, efficiency at the inland terminal is also required. Since time factors play a critical role, the total transit time from port to inland terminal needs to be identified. This would help in measuring the reliability of the intermodal services.
Safety and security aspects are also critical in determining the service quality level of the intermodal systems. The number of accidents involving heavy vehicles could be reduced by lowering the number of road haulage companies serving the Port Klang-Ipoh Corridor. Road haulage hijackings have also become a serious concern for customers.
Environmental aspects are not the main concern of either the operators or the customers. However, the government has pledged to reduce C02 emissions by 40% by 2020. Intermodal could be one of the main contributors to help the government achieve its target.

138
5.7.1 Service quality evaluation
Service quality is one of the important criteria in developing a successful intermodal hinterland container system. Section 5.3 discussed how cost efficiency in intermodal operations might be achieved. A high container volume would enable efficient intermodal operations. In order for the high container volume to be capitalised to increase intermodal movement, intermodal service quality also needs to be efficient. In Chapter 4, the customers of hinterland container transport movement in Malaysia were identified cost, reliability and capacity as the main factors when choosing intermodal services. Concern for the environment, however, is still low among Malaysian container movement customers.
Sections 5.6 and 5.7 discussed the cost and CO2 emission impact with the implementation of the four alternatives. These sections also highlighted the cost benefit and CO2 emission reduction from achieving the targeted intermodal share. In order to achieve these targets, the intermodal system needs to be highly reliable. As mentioned in the literature review, reliability means the probability that a component or system will perform a required function for a given period of time when used under stated operating conditions. The time factor is crucial in order to obtain the desired intermodal movement.
By using the 2010 operation information, the number of trainsets required with three different sized, i.e. 30, 40 and 50, could be analysed. The analyses were also conducted with different load factors. With these different capacity analyses, the required frequency to be implemented at this PKIC could be determined. The analysis also identified the number of trainsets and round trips needed to achieve the targeted intermodal shares, i.e. 30%, 50%, 60% and 70%.
In sections 5.6 and 5.7, the cost reduction and CO2 emissions were established for each alternative for one trainset. However, the targeted intermodal share is difficult to achieve with one trainset. The targeted intermodal shares are 30%, 50%, 60% and 70%. Based on current operations, at maximum capacity this corridor would only be able to achieve an intermodal share of 30% with one trainset in service. In order to achieve the targets, the intermodal service would require higher frequency and higher capacity. To ensure that the targeted intermodal shares are achieved, the number of trainsets required in the corridor must be determined.
To evaluate the intermodal services in the Port Klang-Ipoh Corridor, Table 5.7.1 summarises the most effective impact of intermodal on this corridor. The table shows the most cost-effective and environmentally friendly system for each alternative. It analyses the cost per TEU and the CO2 emissions for each of the alternatives. The table also shows the number of

139
trainsets required for the most effective system available. For evaluation purposes, only a 90% load factor for each of the train sizes is required for each alternative. The train sizes are 30, 40 and 50. The most cost-effective system for each alternative is train size 50 with a 90% load factor.
In 2020, the container volume at Port Klang-Ipoh Corridor will be 233,200 TEUs. Alternative 2 is the most cost-effective and environmentally friendly system. The cost per TEU is RM 197 and the CO2 emission reduction for 1 trainset is 15%. However, this one trainset can only handle 50,544 TEUs per train a year. This accumulates to only 26% intermodal movement for 2020 if only one trainset operates with three trips a day. To achieve the targeted intermodal shares, the minimum number of trainsets and the number of feeder transport trips per day required are:
30% : 1 trainset and 38 feeder transport trips daily 50% : 2 trainsets and 69 feeder transport trips daily 60% : 2 trainsets and 76 feeder transport trips daily 70% : 3 trainsets and 89 feeder transport trips daily
In 2030, the container volume in the Port Klang-Ipoh Corridor is 407,040 TEUs. Alternative 4 is the most cost-effective and environmentally friendly system. The cost per TEU is RM 190 and the CO2 emission reduction is 11%. Since one trainset can only handle 50,544 TEUs a year, the intermodal share is only 21%. To achieve the targeted intermodal shares, the minimum number of trainsets and the number of feeder transport trips per day required for the target scenarios are:
30% : 1 trainset and 49 feeder transport trips daily 50% : 2 trainsets and 82 feeder transport trips daily 60% : 3 trainsets and 98 feeder transport trips daily 70% : 3 trainsets and 114 feeder transport trips daily

140
PortKlangIpoh
Corridor
Item
/Year
2010
2020
2030
TEUs
TEUs
TEUs
Totalcon
tainersinthePo
rtKlan
gan
dIpoh
Corridor
103,350
233,200
407,040
Interm
odalshareinthePo
rtKlan
gIpoh
Corridor
%30
%Vo
lume
31,005
Interm
odalsharescen
arios
2020
2030
Interm
odalshare%
TEUs
TEUs
30%
95,400
122,112
50%
159,000
203,520
60%
190,800
244,224
70%
222,600
284,928
Themostcosteffectivean
den
vironm
entalfrie
ndlysystem
2020
2030
Trainsize
Alternative1
(Loa
dfactor
90%)
Alternative2
(Loa
dfactor
90%)
Alternative3
(Loa
dfactor
90%)
Alternative4
(Loa
dfactor
90%)
RMRM
RMRM
Trainsize30
270
258
260
248
Trainsize40
231
221
222
212
Trainsize50
206
197
198
190
Directroad
haulage(RM)
387
CO2em
issionredu
ctionbasedon
the
highestintermod
alcapacitywith
1trainset
10%
15%
7%11
%
Interm
odalsharescen
arios
30%
50%
60%
70%
30%
50%
60%
70%
TEUs
95,400
159,000
190,800
222,600
122,112
203,520
244,224
284,928
CO2em
issionredu
ctionbasedon
interm
odalsharescen
arios(%)
15%
26%
31%
36%
15%
26%
31%
36%
Tab
le 5
.7:1
Ser
vice
qu
alit
y ev
alu
atio
n f
or
the
Po
rt K
lan
g-I
po
h C
orr
ido
r

141
2020
2030
Trainsize
Trainsystem
with
the
highestcap
acity
with
1trainset
Noof
trainsetsreq
uiredto
meetthe
interm
odalsharescen
arios
Alternative1
(Loa
dFactor
90%)
Noof
trainsetsreq
uiredto
meetthe
interm
odalsharescen
arios
Alternative3
(Loa
dfactor
90%)
Interm
odalsharescen
arios
%/TEU
s30
%95
,400
50%
159,000
60%
190,800
70%
222,600
30%
122,112
50%
203,520
60%
244,224
70%
284,928
Trainsize30
33,696
35
67
46
78
Trainsize40
44,928
24
45
35
56
Trainsize50
56,160
23
34
24
45
Noof
feed
ertransportrun
srequ
iredpe
rday
3864
7689
4982
98114
Trainsize
Trainsystem
with
the
highestcap
acity
with
1trainset
Noof
trainsetsreq
uiredto
meetthe
interm
odalsharescen
arios
Alternative2
(Loa
dfactor
90%)
Noof
trainsetsrequ
iredto
meetthe
interm
odalsharescen
arios
Alternative4
(Loa
dfactor
90%)
Interm
odalsharescen
arios
%/TEU
S30
%95
,400
50%
159,000
60%
190,800
70%
222,600
30%
122,112
50%
203,520
60%
244,224
70%
284,928
Trainsize30
50,544
23
44
24
56
Trainsize40
67,392
12
33
23
44
Trainsize50
84,240
12
23
12
33
Noof
feed
ertransportreq
uired
perd
ay38
6476
8949
8298
114

142
5.8 Discussion
The case study has shown that the cost and the environmental aspects of different intermodal shares and operational strategies are those that must be included in relation to the transport time, service reliability, quality and capacity. The intermodal share is the fundamental infrastructure since increasing shares enable the operations of more trains per day as one of the operational strategies. It is not certain that the reduction in cost and CO2 emissions offered in the case study will be sufficient to be the major factors for increasing the intermodal shares.
Direct road haulage remains the main competition for intermodal at PKIC. Even though the total transit time for intermodal would be higher than that of direct road haulage, greater environmental operational benefits could be gained. In 2030, if direct road haulage could be reduced by up to 30% by increasing the intermodal share from 30% to 70%, this would reduce the number of trucks between Port Klang and Ipoh from 937 to 391 a day, a reduction of almost 590. If every truck takes 15 minutes to receive clearance from the port, this reduces the queuing time in port by 8,850 minutes or almost 140 hours. Apart from reducing queuing time, it would also reduce the risk of heavy vehicles being involved in accidents and congestion between Port Klang and Ipoh.
The total transit time and the reliability of the intermodal service remain the most important quality criteria for efficient service. Every actor needs to play its role effectively. Failure to meet this requirement will disrupt the whole intermodal operation. It is important for each of the actors in the intermodal logistics to understand their roles and responsibilities to ensure the effectiveness of the intermodal services.
The intermodal system has been operating in a cost-competitive environment. However, the direct road haulage cost has been more attractive in view to the extra terminal handling activities for intermodal movement. Even though it has been proven that the intermodal cost could be lowered, the customers’ perception needs to change. To achieve this, the infrastructure and policy related to intermodal need to be in place to monitor the industry overall.
Generally, from the case study analysis, it can be stated that by increasing the number of trainsets and the load factor of each trainset, capacity can be increased and the targeted intermodal share can be achieved. To enhance the quality of service, the intermodal operator in Malaysia needs to capitalise on service performance in order to attract more cargo owners to use the services from Port Klang to Ipoh and vice versa. However, proper planning and strategies need to be in place for customers to switch from direct road haulage to intermodal movement anchored by rail.

143
5.9 Conclusion
Intermodal container transport logistics in Malaysia need to be further developed in terms of policy, infrastructure and strategies for strengthening the industry. This case study highlights the opportunities available for intermodal to be one of the important transport systems in Malaysia. These opportunities are the lower cost for movement of containers and also the reduction of CO2 emissions.
The alternatives chosen would help the Port-Klang Ipoh Corridor achieve its desired intermodal share. The case study indicates that the Port Klang-Ipoh Corridor has to develop efficient scheduling in order to optimise the number of trainsets that operates in the corridor. The intermodal system has the potential to be one of the alternative modes for the Port Klang-Ipoh Corridor container movement. CO2 emissions along the PKIC can be reduced by up to 36% if the highest capacity of intermodal movement is achieved. This would have a significant impact on environmental sustainability.
To achieve the intermodal target, a comprehensive strategy to promote intermodal and intermodal movement in the Port Klang-Ipoh Corridor. The strategy from the government and the regulator would be able to help the operators promote intermodal movement. The right policies, incentives and other possible measures need to be in place to enhance the intermodal share in the Port Klang-Ipoh Corridor. The strategy must be significant enough to ensure that the policy will be implemented to increase the intermodal share. The implementation of these strategies will also have a huge impact on other corridors where intermodal can also be the main transport system for container movement.
These issues will be further discussed in Chapter 6, together with ways to increase the intermodal share in the corridor and the strategies to optimise the advantages of intermodal to operate in a specific corridor in Malaysia.

144
CHAPTER SIX 6. STRATEGY AND IMPLEMENTATION
6.1 Need for attractive intermodal logistics solutions
In the previous chapters the following facts and issues have been identified:
A very fast growth of container volume is expected in Port Klang as well as in other Malaysian ports. Port Klang’s volume is expected to increase from 6.1 in 2011 to 7.9 million TEUs in 2020 and 10.2 million TEUs in 2030. The intermodal share of hinterland container transport to and from Port Klang has decreased considerably despite available capacity. In 2010, only 30% of the Port Klang-Ipoh volume used intermodal. In 2020, the container volume from Port Klang to Ipoh is expected to be 318,000 TEUs and in 2030 407,040 TEUs. With the increasing volume, intermodal share will continue to decrease if the service levels remain unchanged. The customers’ choice of transport mode is mainly based on cost, transport time and reliability, while environmental aspects receive very little attention.
The current situation as outlined above is likely to lead to the following development:
Increase in Greenhouse Gas (GHG) emissions contrary to government plans for a large reduction. Increase in road congestion and risk of long queues at port gates. Increase in the number of serious road traffic accidents. Negative impact on the development of the Malaysian economy.
Both international experience (Chapter 2) and the results of the customer surveys (Chapter 4) and case study for the Port Klang – Ipoh corridor (Chapter 5) show that the development of attractive intermodal systems leading to a high rate of usage can provide a solution for this situation. The following measures will need to be considered in order to achieve this solution:
A new government transport policy, including substantial subsidies and incentives to promote intermodal transport through reduction of costs to customers and service providers. Regulatory changes permitting private intermodal operators to create seamless fast and reliable door-to-door rail and road transport solutions. Investments in intermodal infrastructure including railway lines and inland terminals to enable high-capacity intermodal services to be established in suitable corridors.

145
The Port Klang-Ipoh Corridor could be the main corridor for the government to enforce radical changes in the institutional aspects of intermodal movement. These changes will speed up and enhance the development of intermodal in Malaysia.
Intermodal movement in Malaysia requires new innovation for the system to move forward and become one of the competitive alternatives in Malaysia. Such innovations may be 1) product innovations or 2) process innovations, which refer to a change in the way the product is delivered (Wiegmans et al, 2008). In the Malaysian scenario, intermodal logistics need to be structured and new ways to promote intermodal development need to be in place. Based on the findings in Chapter 4 (A review of current system) and Chapter 5 (Case Study), four factors that are indicated as obstacles to a successful intermodal system are: 1) cost issues, 2) service providers’ efficiency, 3) coordination and quality of service, and 4) a lack of specific policy on intermodal movement.
For intermodal movement to be more attractive, the effective institutional framework should be in place with accommodative policies in order to improve the quality of service and the efficiency of the service providers. From the findings in Chapters 4 and 5, the authority that governs the transport industry needs to use their platform to promote a positive attitude towards intermodal movement in Malaysia. The authority’s role would be the stepping-stone for the operators to be innovative in developing intermodal movement in Malaysia.
6.2 Institutional changes
6.2.1 Regulatory form and organisation
Malaysia’s transport industry is highly regulated and most of the regulations concern individual modes, a common practice in most parts of the world. However, intermodal freight issues have always been addressed on an ad hoc basis, thus making intermodal less attractive as an alternative transport system for the users. New regulatory and organisation practices focusing specifically on intermodal are urgently required to support intermodal movement.
Drastic and radical changes in government support need to be undertaken in order to provide a significant boost for intermodal services in Malaysia. In many developed countries, regulatory and organisational changes play a great role in promoting intermodal. Government support and interventions are crucial to enhance the intermodal movement. As the regulating authority, the government would need to play a major part in promoting intermodal and with the continuous support of the government, it would be a great opportunity for

146
the intermodal service to be able to attract customers to use the service continuously.
It is essential to establish an authority to focus on intermodal regulation, policy development and planning in Malaysia. The planning, implementation, monitoring and enforcement of the policy need to be done through a permanent structure and not on ad hoc basis. The authority needs to be supervised and led by a person competent in intermodal matters. The structure is critical for the authority to communicate with other actors who may be involved in intermodal movement development. Many modal issues are raised for the authority to handle so as to understand the points of view of competitors and intermodal, which is important for promoting intermodal. The setting up of an Intermodal Transport Department (ITD) could support intermodal transport from the institutional perspectives. The ITD can play the role of regulating intermodal movement, promoting the efficient use of infrastructure, facilitating coordination between service providers and addressing environmental issues associated with the individual transport modes.
Since the SPAD is the regulating body for land transport in Malaysia, it is suggested that the ITD could be part of the SPAD’s Freight Division (see Figure 6.1) but with the specific role of focusing on regulating and developing policy for promoting intermodal movement. The current freight division structure does not reflect the SPAD’s intermodal responsibility. Accordingly, the ITD needs to integrate all existing policies and also develop the focus policy to ensure that intermodal issues are handled by a permanent authority instead of on an ad hoc basis. These would help develop an alternative mode of choice in the future. The SPAD would also be responsible for this and with the development of such an intermodal division, there will be a stronger focus on planning and enforcement for intermodal to be able to be developed. The integration in developing intermodal policy could thereby be achieved. The ITD would need to integrate rules, operation, coordination and service standard in an intermodal service.
Furthermore, establishment of the ITD would enable continuous research and development in intermodal transport. New innovations in intermodal transport in Malaysia could be discovered by having consistent research and development activities. Innovations in new technology, concepts and practices would ensure that intermodal would be able to continue to develop positively in the future. Research and development should be one of the main sources in guiding and implementing an accurate policy for intermodal transport.

147
Figure 6.2:1The current structure of the Land Transport Authority (SPAD) with the addition of an Intermodal Transport Department under the Freight Division
Source:www.spad.gov.my
Additional Intermodal TransportDepartment (ITD) in
Freight Division

148
6.2.2 Transport policy
The government needs to plan, introduce and implement the intermodal policy. It is strongly believed that with government guidance and policies, the major hindrances for a successful intermodal movement could be avoided and overcome. It has been discussed that Malaysia’s transport system is very much regulated with the exception of the liberalisation on road container haulage industry which resulted the government stop issuing more road haulage container permits to new operators. Each actor has been confined to the rules and regulations that govern them. However, with an integrated and coordinated policy to promote intermodal, it would help intermodal to move forward and become one alternative mode for inland container transport movement in Malaysia.
Intermodal transport policy requires managing the entire chain in an integrated aspect. Integration would require a good corporation and coordination between actors. Malaysia has policies that enable the development of each mode. However, these policies have been unable to coordinate and manage all facilities in making intermodal as an alternative system. To create a successful intermodal system, specific effective policies on intermodal need to be identified in the chosen corridor. The policy guidelines should be in the form of regulation, financial and monetary aid. Therefore, the policy development should focus on two aspects: 1) rules and regulation policy and 2) incentive policies for promoting intermodal.
Specific form of regulations could help to promote intermodal movement. The introduction of a policy needs to go beyond the basic modal policy and radical change in policy implementation is essentially critical for the success of intermodal movement. The ITD may have to consider some of these policies to promote intermodal:

149
Rules and regulation policies Incentives policies increased toll charges for heavy goods vehicles in the corridor
Privileges for the intermodal movement for a specific period
Standardisation of policy with other agencies for the development of intermodal infrastructure
Increased weight limit for containers transported in the intermodal system
Priorities in terms of services for intermodal movement, can work with other authorities and operators to have a different opening window for intermodal movement
To ban other vehicles on certain days, for example Sundays or public holidays, and allow only intermodal movement in the corridor
Incentives to promote and use intermodal services
Tax incentives for feeder services from the inland terminal to customers’ premises
Initial set-up grants for intermodal infrastructure, especially for inland terminal and transhipment facilities.
Tax exemption for road haulage used in feeder services
Increased toll for heavy goods vehicles (HGV) in this corridor which might shift to the overall modal shift
To push intermodal movement forward as an alternative system, the right policies need to be in place to help promote intermodal movement. Many OECD (Organisation for Economic Co-operation and Development) and European countries have developed an initial policy for intermodal to enable it to be a competitive system for freight movement in their countries.
6.2.3 Intermodal investments in infrastructure and rolling stock
The case study in Chapter 5 highlighted the fact that intermodal volumes at the Port Klang-Ipoh Corridor would significantly increase if the rail services as the long-haul movement could be increased. However, this increase would only be possible if the inland terminal infrastructure and the rolling stock are upgraded.

150
Three trainsets are required for the intermodal share to achieve its highest possible target of 70% intermodal share along this corridor. Investment in locomotives and wagons is essential and critical for the success of the intermodal services. In addition to the rail service requirements, the Ipoh Cargo Terminal would also need to be upgraded. The capacity of the ICT is 100,000 TEUs and if based on the estimated volume, this corridor could handle 250,000 TEUs a year. Investment in equipment at the inland terminal is also required for any improvement; for example continuous investment in infrastructure and rolling stock will ensure that planning of intermodal movement can be supported.
These investments would enable the actors to enhance the quality of services for intermodal movement and will hence encourage use of the services. However, if the investments are made without looking into intermodal movement’s needs, then it will be a wasted investment.
6.2.4 Implementation strategy
The institutional changes would be able to help the government implement the right strategy for intermodal movement in Malaysia. Therefore, steps need to be taken to ensure the smooth implementation of the intermodal strategy in Malaysia. In this section, the discussion on the implementation of intermodal systems will be highlighted.
Identifying possible corridor
The Intermodal Transport Department needs to identify a potential corridor and classify it as a green corridor. According to the case study, the Port Klang-Ipoh corridor should be the most suitable corridor for the Intermodal Transport Department to begin with this. The identification of a green corridor concept would reflect support for a sustainable transport network. In this corridor, the intermodal system would contribute to a better environment. Since the transport industry is a commercial sector, the competitiveness of the development of the corridors also needs to be taken into consideration. The green corridor should have the potential to contribute to a better environment. As a result, this green corridor would reward special policy implementation and enforcement of authority and would ensure that the concept would fulfil its objectives.

151
The intermodal Transport Department can introduce a Green Corridor concept. This green corridor will uphold the policy developed for intermodal movement. At the beginning of implementation, all the policies should only be used in the identified corridor. This corridor would be regulated and services in this corridor therefore need to be monitored. The corridor could be identified for the benefit of the actors involved in intermodal to receive incentives for intermodal movement.
Developing a reward system In addition to the introduction of the Green Corridor concept, the policy implementation also needs to consider a reward system for the actors involved in intermodal movement. The main theme of the reward system is to acknowledge any actors or companies that contribute to a better environment. The reward system therefore needs to be in place as an incentive. The government would need to review the reward periodically for the sustainability of the services. The reward should be based on the profitability of the company and needs to cease once the system is managed through supply and demand.
Tax rebates on revenues for five years could be a starting policy for this type of incentive. The reward would encourage a company to promote a better environment by using the intermodal movement. The reward system would be a catalyst for the actors to move towards seamless intermodal movement. With this reform, intermodal transport would be identified as one of the alternative modes in the corridors.
In Malaysia, these special incentives could also benefit actors involved in the intermodal chain, such as customers, rail haulage operators, feeder road haulage and freight forwarders. The introduction of a reward system for these actors would promote intermodal movement. Any reward should be given based on the points collected for intermodal movement and given to the respective actors towards the end of the year. In other words, the incentive would only be enjoyed by the actors that support and implement intermodal services. However, a structured mechanism needs to be in place to monitor the reward system.
The Green Corridor concept and the reward system together with the new direction of the Intermodal Transport Department will give a new dimension to intermodal movement in Malaysia. It would be critical to have such a strategy for the intermodal service to make its presence felt in the Malaysian transport industry.

152
Implementations of the above strategy would require innovations and changes in institutional aspects. It is thus critical that these two issues be handled during the implementation of the strategy. The issues are: 1) collaboration and coordination between service providers; and 2) better monitoring of service quality standards.
1) Collaboration and coordination between service providers The service providers, i.e. the road haulage, rail and inland terminal operators should increase their collaboration and coordination in operating the intermodal system. In Chapter 4, it was pointed out that KTMB as the sole rail freight operator should use its own subsidiary as the feeder transport carrier for intermodal container movement. With the possibility of having a higher intermodal share in the Port Klang-Ipoh Corridor, KTMB would need better collaboration with other road haulage operators to provide the feeder transport services for intermodal movement. Even though KTMB has its subsidiary Multimodal Sdn. Bhd., that operates road haulage services, collaboration with other road haulage operators would increase its opportunities for more intermodal movement. KTMB relies not only on its subsidiary for feeder transport movement but also on other road haulage operators. With a specific government body to coordinate operations between the different modes intermodal would be more attractive.
The authority can create an intermodal system as a single operator providing door-to-door services. As there is no single entity in Malaysia that is able to provide such services, coordination between service providers must be made available. The right institutional role is to ensure that the service providers have the same objectives in managing the transport chain.
2) Quality issues One of the important aspects in achieving a sustainable competitive advantage in intermodal services is service quality. To achieve this advantage, the institutional aspects need to have terms and conditions to increase intermodal efficiency. The Intermodal Transport Department could develop a service level agreement between the service providers. The service level agreement indicates the service standard required by the customers.
The agreement would outline the responsibilities and performance standards that need to be followed by the service providers. The service level agreement should begin from the planning of activities at the port until the container is delivered to the customer and vice versa. Every service provider needs to agree with the service level that they need to fulfil. This agreement would be the benchmark for setting the quality criteria for intermodal movement. The

153
quality aspect must be emphasised in order to achieve a quality intermodal movement with a sustainable competitive advantage.
Based on the service level agreement, it should be possible to address the following factors efficiently:
Transit time In order to compete with the traditional door-to-door road haulage service, the intermodal system needs to have a competitive transit time. With the location of a strategic intermodal terminal, the transhipment process at the terminal must be kept at a minimum.
Frequency Each corridor would have its own frequency and with the expected increase is container volumes, frequencies could double over the next five to ten years. Based on the current volume, it is proposed that each corridor operate at least two services per day, i.e. morning and evening departures.
Security Intermodal movement would be able to increase the security level of container movement. The risk of containers being hijacked would be very low compared to direct road haulage.
Reliability The railway mode of intermodal services could enhance the reliability of the intermodal service. With the double-track system in the northern part of Malaysia and with an efficient timetable, the conflict between passenger and container movement can be minimised.
Capacity It is proposed that the railway mode carry at least 100 TEUs with a maximum of 50 wagons in each block train for direct shuttle. With even greater capacity, customers would be able to enjoy lower costs for the delivery of containers to their premises. Inland terminal operators need efficient container handling to make the intermodal service competitive.
The transit time from port to customer would be determined by which corridor the intermodal movement serves. The service level agreement needs to be monitored by the government. It will be the role of the Intermodal Transport Department to monitor and evaluate the performance of all service providers in the intermodal transport chain.
6.3 Innovation as the key benefit
The institutional aspect of innovation is expected to help intermodal progress. Strengthening the institutional aspect would help intermodal remain

154
competitive. The new institutional framework could also change the decision-making process and reform the traditional role of governing the industry into a new and effective way of decision-making related to intermodal issues. This innovation stimulates more knowledge to and for the industry and this would help promote intermodal movement. The benefits to the environment and the effective strategy implementation discussed in Section 6.2.3 may stimulate the development of new businesses with new concepts for intermodal movement. Intermodal movement as an innovative creation would enable sustainable services to be developed for the customers.
The policy innovation would reflect the new focus of the regulating body since the existing policies could not help develop and promote strategies for intermodal movement. The innovation institutional aspect leads to a better quality of service for intermodal movement. Many countries with successful intermodal movement have developed specific policies for intermodal. This has helped to strategize the intermodal movement in the country.
The new institutional structure, policy development and the strategy implementation would enable intermodal movement to innovate much further. New intermodal technologies are the key innovation that would be able to reduce the hassle of intermodal terminal handling. Developed countries came up with various new methods to increase the efficiency of intermodal movement. Innovation in system technology would enhance the perspective of intermodal movement.
With the new technology implementation for intermodal movement, efficient operation can be created for intermodal. New investment to develop intermodal facilities in the identified corridor would be beneficial to Malaysia. Even though the focus in this study is on container movement, swap-body and semi-trailer intermodal operation could also be further developed in Malaysia.
For Malaysia to further improve intermodal services in the country, changes in institutional aspects need to be initiated to mark out a clear direction for intermodal. As mentioned in the strategy implementation, creating a green corridor concept and implementing the intermodal policy can be the most essential moves to achieve success for intermodal movement. The new changes may be the impetus for the operators to continue to innovate and the customers will be able to get more competitive service from intermodal movement. These changes would hopefully lead to more competitive services from the actors. Intermodal might be able to come up with new technology and organisational structure to accommodate new changes which would benefit the industry in the future. This can attract new actors and new ideas for the industry to develop.

155
6.4 Conclusion
Intermodal movement in Malaysia shows great potential for its development. It is critical for Malaysia to make changes in the institutional aspects in order to ensure that intermodal services remain sustainable and competitive. However, the logistics of intermodal movement need to be clear so that continuous intermodal services can be developed. Reforming the institutional aspects would ensure that intermodal logistics could be in place and help promote intermodal especially in the selected corridor.
The main intermodal logistics issues that would create awareness of the importance of intermodal services are:
a) Establishing the Intermodal Transport Department b) Introducing specific intermodal services c) Setting up the green corridor concept d) Developing a reward system for actors in intermodal movement e) Collaboration and coordination issues f) Quality of service monitoring.
Setting up an intermodal transport authority might be premature at this stage, but there is a need to set up a department under the freight division to focus on intermodal planning and monitor it, whereby the authority would gain a more in-depth understanding of how to plan for intermodal movement and policy implementation in this green corridor.
Chapters 4 and 5 have indicated that container volumes in Malaysia would increase tremendously up to 2030. Alongside these volumes, the Port Klang-Ipoh corridor volume is also expected to increase. Critical mass is not a problem in this corridor; however, the right strategy implementation might be essential for the future of intermodal.
It has always been the focus of the government to use transport to reduce GHG emissions and also reduce other environment issues such as congestion and accidents. However, the government seems to have failed to execute the methods and the strategy to promote intermodal in Malaysia.
The green corridor concept and the reward system should stimulate the interest of the actors in the intermodal system. It will demonstrate the best method to handle intermodal movement in Malaysia with further collaboration and enhancement of the actors’ quality systems and thereby increase the intermodal share in the respective corridors.

156
CHAPTER SEVEN
7. DISCUSSION AND CONCLUSION 7.1 Methodological issues
Hinterland container transport in Malaysia has always been dominated by direct road haulage. With container volumes in Malaysian ports growing significantly over the last five years, the existing role of intermodal, especially road-rail intermodal, needs to be further explored by Malaysian actors in intermodal model movement. The actors’ involvement, as shown in Chapter 1: Figure 1.1:1, showed that all the actors need to ensure that they play their roles to ensure the success of the intermodal transport to and from Malaysian ports.
To understand how hinterland container transport works in Malaysia, it is important to discuss and analyse how the current system works. The focus is therefore on the setting up of the framework of the current system. Then the focus shifts to customers’ choice of hinterland container transport. Finally, an analysis is made of the policy and regulations relating to the hinterland container transport system. Since many actors are involved in the hinterland container transport system, the most suitable method would identify each actor in order to obtain the most valid result for this study.
In-depth interviews were chosen to analyse the current system. They were conducted with service providers such as the road haulage company, the railway company, and government agencies. The current method was chosen in order to obtain more in-depth information and data on how the current system works and the regulations related to the industry. Since these policies could be adapted for secondary data, the interview sessions gave a bigger picture of how the policies work.
To understand the customers’ needs, a set of questionnaires was used to capture the data; basically, the questionnaire identified the most important factors that influence customers’ choice of mode.
It was necessary to understand current practices in hinterland container transport in Malaysia. By analysing these practices, this research was able to identify the different requirements related to moving the containers to and from Malaysian ports. Failing to analyse the current situation would affect the types of strategies to be implemented in the Malaysian hinterland transport scenario. To further analyse the current system, three main components were the main sources of information:
157
1) Service providers, i.e. road haulage companies, railway operators. 2) Customers, i.e. manufacturers. 3) Government agencies governing the land transport industry.
The next step was to establish a case study in order to understand why intermodal movement needed to be promoted in Malaysia. The case study was conducted using three methods. Expert interviews were conducted in order to select the potential corridor to be analysed and evaluated. For the cost analysis, a cost model was developed and the inputs to develop the model were collected from the service providers. For road haulage, the input came from Century Logistics, the rail input was from KTMB and inland container terminal input came from the Ipoh cargo terminal. The CO2 emissions was analysed using the UNEP factor indicator for emissions. Based on the input, the service quality evaluation for the Port Klang-Ipoh Corridor was analysed and some ideas for how the case study would be evaluated were discussed.
7.2 New logistics findings
a) Transport logistics In-depth study and analysis of customer demands and transport quality priorities regarding hinterland transportation of import and export containers based on questionnaires, interviews and expert panel discussions. Development of the analytical model for analysis of intermodal and direct road haulage transportation. Application of the model for determination of optimal intermodal transport solutions and capacity for a case study corridor. Comparison (with direct road haulage) of costs and CO2 emissions for different transport volumes and intermodal shares in the studied corridor. Identification of other impacts related to reduction of direct road haulage of hinterland containers.
b) Transport policy Transport policy and institutional development requirements for intermodal transport development. Identification of what new Malaysian transport policy measures were required to achieve a substantial increase in intermodal volumes. Proposal for institutional changes and for the organization to promote intermodal development and operation. Methods of strategy implementation to promote intermodal movement in Malaysia. Strategies that focus on environmental sustainability in Malaysia. Intermodal as a way to reduce direct road haulage movement from ports to the hinterland in Malaysia.

158
The Port Klang-Ipoh Corridor container volumes are significant enough for intermodal movement to be further enhanced. The Deputy Managing Director of Century Logistics has always stated that “CRITICAL MASS IS IMPORTANT FOR INTERMODAL TO SUCCEED” (Dr Amin Kassim (2010). When the critical mass is available, then other factors that could influence the intermodal share can be highlighted.
Intermodal transport can be implemented in the selected corridor. The Port Klang-Ipoh Corridor enjoyed high intermodal movement before this because they had the right policies to stimulate intermodal growth in the corridor. The experts in the area agree that new innovative policies need to be in place to support the development of intermodal transport.
7.3 Need for further research
Impact of reduced volumes of direct road haulage on road traffic conditions and safety. Development of inland terminal operations to facilitate intermodal transportation. Impact of privatisation (single operator) or deregulation (multiple operators) of intermodal rail operations in Malaysia. Development of technology for intermodal handling in Malaysia. Green transport technology for intermodal movement. Development of swap-bodies and semi-trailers for intermodal movement in Malaysia.

159
REFERENCES Asteris, Michael and Collins, Alan(2009)' UK Container Port Investment and Competition: Impediments to the Market, Transport Reviews
Ballis Athanasios, & Golias John (2002). Comparative evaluation of existing and innovative rail–road freight transport terminals. Transportation Research Part A 36 , pp 593–611
Banomyong R (2000) Multimodal transport corridors in South East Asia. A case study approach. PhD Dissertation. Logistics & Operations Management Section, Cardiff Business School , Cardiff University 2000
Bardi, E.J. (1973), Carrier selection from one mode, Transportation Journal, Vol. 13 No. 1, pp. 23-9.
Bardi E J, Bagchi P K, and Raghunathan T S, "Motor Carrier Selection in a Deregulated Environment," Transportation Journal, 29, 1989, pp. 4-11
Banks J (2000). Introduction to simulation. In Proceeding of the 2000 Winter Simulation Conference. Ed. J.A. Joines, R.R. Barton, K. Kang and P.A Fishwick. Institute of Electrical and Electronics Engineering, Piscataway, New Jersey.
Barney Jay (1991). Firm resources and Sustained Competitive Advantage, Journal of Management Vol 17, No 1 pp 99-120
Bergqvist Rickard (2008). Evaluating road–rail intermodal transport services – a heuristic approach International Journal of Logistics: Research and Applications Vol. 11, No. 3, 179–199
Bergquist, K. and Abeysekera, J. (1996) Quality function deployment—a means for developing useable products, International Journal of Industrial Economics, 18, pp. 269–275.
Booms. Bernard H. and Man' J. Bitner (1981), Marketing Strategies and Organization Structures for Services Firms, Marketing Senkes. S. Donnelly and W. George, eds., Chicago: American Marketing, 47-51.
Bontekoning, Y, Macharis, C. and Trip, J.J. (2003) Is a new applied transportation research field emerging? – A review of intermodal rail-truck freight transport literature. Transportation Research, Part A

160
Branch AE (1994). Export practice and management, Chapman & Hall, London. Camiea. James M. and Eric Langeard (1980), "Growth Strategies of Service Firms," Strategic Management Journal. 1 (January-March), 7-22.
Carruthers, R. (1995) Changing the Maas mix. Port Development international 11 (1) 72-73.
Chan, L. and Wu, M. (2002) Quality function deployment: a literature review, European Journal of Operational Research, 143, pp. 463–497.
Chin-Shan Lu (2003). The impact of carrier service attributes on shipper–carrier partnering relationships: a shipper’s perspective. Transportation Research Part E 39 399–415. 2003
Chin-Shan Lu (2004). An Evaluation of Logistics Services' Requirements of International Distribution Centers in Taiwan. Transportation Journal, Fall pp 55-66
Coyne P Kevin (1986). Sustainable Competitive Advantage-What it is, what it isn’t. Business Horizons.
Cook P.D and Martland C (1999). Key factors in road-rail mode choice in India: Applying the logistics cost efficiency approach. Proceeding of 1999 Winter Simulation Conference.
Coyle, J., Bardi, E.J. and Langley, C.J. (1992), The Management of Business Logistics, 5th ed., West Publishing, St Paul, MN.
Day, George S. and Robin Wensley (1988). Assessing Advantage: A Framework for Diagnosing Competitive Superiority, Journal of Marketing, 52 (April), 1-20.
Danielis R.(2002), Freight transport demand and stated preference experiments, Franco Angeli, Milano
D’Este, G. and Meyrick, S. (1989), More than the bottom line: how users select a shipping service, 14th Australian Transport Research Forum, Vol. 1, Western Australian Department of Transport, Perth, pp. 65-82.
De Langen Peter (2008) Ensuring hinterland access, The role of port authorities. Research Round Table Paris. Seaport competition and hinterland connections

161
De Langen, P. and Chouly, A., (2004), Hinterland access regimes in seaports. European Journal of Transport and Infrastructure Research, 4(4), 361–380
Department For Transport (2008), Maritime Statistics: 2008 Edition (London: Department for Transport).
Department for Transport (2008). The container freight end-to-end journey: An analysis of the end-to-end journey of containerized freight through UK international gateways. Crown UK
Department For Transport, 2006, Focus on Ports: 2006 Edition (London: Department for Transport).
Ebeling, C.E. (1997) Introduction to Reliability and Maintainability Engineering. McGraw-Hill Companies Inc.
Evans, R.E and Soulhard W. R. "Motor Carriers' and Shippers' Perceptions of the Carrier Choice Decision." The Logistics and Transportation Review, Vol. 10, No. 2 (1974), pp. 145-147
Ever. P T, Harper D V and Needham (1996). “The determinants of shipper perceptions of modes.” Transportation Journal, Vol. 36, no. 2 pp13-25
Garvin, David A. (1983), Quality on the Line, Harvard Business Review. 61 (September-October), 65-73. Geerlings, H. (1998) The rise and fall of new technologies; The Maglev as technological substitution?, Transportation Planning and Technology, 21, pp. 263–286.
Gea A N, Larrode. E M and Millan. C A (2008). “Analysis about the quality in the freight transportation and direct effect in the management of a transportation organization.” Proceedings of the 16th Mini Euro Conference and 10th Meeting of Euro Working Group Transportation (EWGT), pp 353-360
Grant, D.B., Lambert, D.M., Stock, J.R. and Ellram, L.M. (2006), Fundamentals of Logistics Management: First European Edition, McGraw-Hill, Maidenhead.
Grue. B and Ludvigsen. J (2006). “Decision factors underlying transport mode choice in European freight transport.” Institute of Transport Economics, Oslo, Norway. Association for European Transport and contributors
Hackett, Ben (2006) Hinterland headaches in North Europe . The economist Port strategy November

162
Haezendonck, E., Notteboom, T. (2002) The competitive advantage of seaports. In: Huybrechts, M., Meersman, H., Van de Voorde, E., Van Hooydonk, E., Verbeke, A.,
Hamel, Gary and C.K. Prahalad (1991). "Corporate Imagination and Expeditionary Marketing," Harvard Business Review, 69, 81-92.
Hayuth, Y. (1981), ‘Containerization and the load center concept’, Economic Geography, 57:2, 160-176
Hopkins Shirley A, Strasser Sandra , Hopkins Willie E. And Foster Jerry R (1993). Service Quality Gaps In The Transportation Industry: An Empirical Investigation. Journal Of Business Logistics. Vol. 14, No. 1, 145-150 Innis D. E. and La Londe B (1994). Customer service; The key to customers’ satisfaction, customer loyalty and market share. Journal of Business Logistics Vol 15. No 1.
Jensen Arne (2008). Designing intermodal transport system: a conceptual and methodological framework. The Future of Intermodal Freight Transport: Operation, Design and Policy. Edward Elgar Publishing
Khalid, Nazrey (2005) Global Trends Affecting Port Development and Its Implication, Malaysia Institute of Maritime (MIMA)
Konings, J. W. (1996) Integrated Centres for the Transshipment, Storage, Collection and Distribution of Goods (London: Elsevier).
Kroes P. Eric & Sheldon J. Robert (1988). Stated preference methods. An introduction. Journal of Transport Economic and Policy pp 11-25
Kroes P. Eric, Sheldon J. Robert & Beswick M (1986). Stated preference microsimulation models from qualitative inputs to estimate market shares in intercity travel. Proceedings of the 1986 ESOMAR Congress, Monte Carlo
Kyle Dupre & Thomas W. Gruen (2004). The use of category management practices to obtain a sustainable competitive advantage in the fast-moving consumer-goods industry Journal of Business & Industrial Marketing, Volume 19 · Number 7 · pp. 444-459
Kent L.J, Parker R.S and Luke R.H.(2001). An empirical examination of shipper perceptions of service-selection attributes in five truckload industry segments. Transportation Journal Fall, pp 28-26

163
Lehtinen, Uolevi and Jarmo R. Lehtinen (1982), Service Quality: A Study of Quality Dimensions, unpublished working paper, Helsinki: Service Management Institute, Finland OY
Lewis, Robert C. and Bernard H. Booms (1983), The Marketing Aspects of Service Quality, in Emerging Perspectives on Services Marketing. L. Berry, G. Shostack, and G, Upah, eds., Chicago: American Marketing, 99-107.
Lieb, Bentz R and Brooks A. (2005). The use of third party logistics services by large American manufacturers: the 2004 survey. Transportation Journal Spring, pp 5-15 Lu, C.S., Marlow, P.B. (1999). Strategic groups in Taiwanese liner shipping. Maritime Policy and Management 26 (1), pp 1–26.
Matear, S. and Gray, R. (1993). Factors influencing freight service choice for shippers and freight suppliers. International Journal of Physical Distribution & Logistics Management, Vol. 23 No. 2, pp. 25-35.
Meersman, Hilde; Pauwels, Tom; Van De Voorde, Eddy and Vaneislander, Thieery (2008). The relationship between port competition and hinterland connections. In: United Nations Economic Commission for Europe (UNECE) Conference: Hinterland Connections of Seaports, 17 - 18 Sep 2008, Piraeus, Greece.
McCalla, R. J. Global change, local pain: intermodal seaport terminals and their service areas. IN: Journal of Transport Geography, v.7, p. 247-254, 1999
McGinnis, M.A. (1989), “A comparative evaluation of freight transportation choice models”, Transportation Journal, Winter, pp. 36-46.
McGinnis, M A, "The Relative Importance of Cost and Service in Freight Transportation Choice: Before and After Deregulation,'" Transportation Journal, Vol. 30, No. 1. 1990, pp. 12-19.
Morash E A and Calantone R J, "Rail Selection, Service Quality, and Innovation,"' Journal of the Transportation Research Forum. Vol. 32, No. 1, 1991, pp. 205-215.
Murphy P R, Daley J M and Hall P K (1997). “Carrier selection: Do shippers and Carriers Agree or Not?” Transportation research, Vol 33E. No 1 March pp 67-72

164
Nesathurai (2004) ,Key Players in the Logistics Chain, Malaysia Institute of Maritime (MIMA)
Notteboom, T., Winkelmans, W. (2001), ‘Structural changes in logistics: how will port authorities face the challenge ?’, Maritime Policy and Management, 28:1, 71-89
Notteboom, T. And Rodriguez, J., 2005, Port regionalization: towards a new phase in port development. Maritime Policy and Management, 32(3), 297–313.
Notteboom, T. And Winkelmans, W., 2001, Structural changes in logistics: how will port authorities face the challenge? Maritime Policy and Management, 28(1), 71–89.
OECD, 2002, “Transport Logistics shared solutions to common challenges”. rue André- Pascal, 75775 PARIS CEDEX 16 PRINTED IN FRANCE
Paixa˜ O, A. And Marlow, P., 2003, Fourth generation ports – a question of agility? International Journal of Physical Distribution and Logistics Management, 33(4), 355–376.
Pettit SJ, Beresford AKC (2007) An analysis of logistics distribution patterns from major container ports and proposed container port developments in Great Britain. LRN 2007. Hull 5-7 September
Peter .W. de Langen and Ariane Chouly (2004), Hinterland Access Regimes in Seaports EJTIR, 4, no. 4 pp. 361-380
Parasuraman A, Valarie A. ZelthamI, & Leonard L Berry (1985)A Conceptual Model of Service Quality and Its Implications for Future Research, Journal of Marketing Vol. 49 (Fall 1985), 41-50.
Porter, Michael E. (1980), Competitive Strategy. New York: The Free Press.
Pedersen, E.L. and Gray, R. (1998), The transport selection criteria of Norwegian exporters, International Journal of Physical Distribution & Logistics Management, Vol. 28 No. 2, pp. 108-20.
Raghunathan, T.S., Bagchi, P.K. and Bardi, E.J. (1988) “Motor carrier services: the US experience”, International Journal of Physical Distribution & Materials Management, Vol. 18 No. 5, pp. 3-7.

165
Robinson, R. (2002), ‘Ports as elements in value-driven chain systems: the new paradigm’, Maritime Policy and Management, 29:3, 241-255.
Roso, Violeta (2009) The emergence and significance of dry ports: the case of the Port of Göteborg . World Review of Intermodal Transportation Research 2009 - Vol. 2, No.4 pp. 296 - 310
Roso, Violeta , Woxenius, Johan & Lumsden, Kenth (2009) The dry port concept: connecting container seaports with the hinterland Journal of Transport Geography 17 (2009) 338–345
Rizzoli Andreas E., Gambardella Luca Maria, Funk Petra (2002), Agent-based planning and Simulation of Combined Rail\Road transport, society of computer Simulation, Vol.78, No , pages 293-3003.
Sasser, W. Ear, Jr., R. Paul Olsen, and D. Daryl Wyckoff (1978), Management of Service Operations: Text and Cases, Boston: Auyn & Bacon
Slack, B. (1993). Pawns in the game: ports in a global transportation system. Growth and Change, v. 24, p.379-388,
Sundar G. Bharadwaj, P. Rajan Varadarajan, & John Fahy (1993). Sustainable Competitive Advantage in Service Industries: A Conceptual Model and Research Propositions. Journal of Marketing Vol. 57, pp 83-99
Sanjay Melkote, Mark S. Daskin, 2001, An integrated model of facility location and transportation network design, Transportation Research Part A: Policy and Practice, Volume 35, Issue 6 , Pages 515-538, July 2001
Song, D.W. (2003).Port co-operation in concept and practice. Maritime Policy and Management, v. 30, n. 1, 29–44,
Stock J.R and LaLonde B.J. "The Transportation Mode Decision Revisited." Transportation Journal. Vol. 17, No. 2 (Winter 1977), pp. 51-59.
Tengku Mahmud Shah T.J (1995). Marketing of freight liner shipping services with reference to the Far East-Europe trade: A Malaysian perspective. Ph.D. Dissertation, Department of Maritime Studies and International Transport, University of Wales, College of Cardiff, UK
The World Bank group (2005). Transport intermediaries. Types and selected drivers of efficiency. Global facilitation partnership for transportation and trade. The United Nations Trade facilitation network

166
Tracey M. (1998). The importance of logistics efficiency to customer service and firm performance. International Journal of Physical Distribution and Logistics Management. Volume 9, No 2
Tuna. O K and Silan M U. (2006). “Freight Transportation Selection Criteria: An Empirical Investigation Of Turkish Liner Shipping”. Dokuz Eylul University, School of Maritime Business and Management
Tyworth Je and Zeng AZ (1998). Estimating the effect of carrier transit-time performance on logistics cost and service. Transportation Research A, Vol. 32A, No. 2, pp. 89-97. Van Klink, H.A., Van Den Berg, G.C. (1998) Gateways and intermodalism. Journal of Transport Geography 6, 1–9,
Van Der Horst Martijn R & De Langen Peter W (2008) Coordination in hinterland transport chain: a major challenge for seaport community . Maritime Economics & Logistics. Volume 10 Issue 1(Year): 10 (2008) pp 108-129
Van Der Horst, Martijn & Van de Lugt, Larissa (2009) Coordination in railway hinterland chain: An instructional analysis. IAME subtheme: Logistics and Port Economics Copenhagen
Visser, Johan; Konings, Rob; Pielage, Ben-Jaap and Wiegmans, Bart (2007).A new hinterland transport concept for the port of Rotterdam: Organisational and/or technological challenges? In s.n. (Ed.), Transportation Research Forum . North Dakota State University: Upper Great Plains Transportation Institute (UGPTI).
Whyte, J.L. (1993), The freight transport market: buyer-seller relationship and selection criteria, International Journal of Physical Distribution & Logistics Management, Vol. 23 No. 3, pp. 29-37.
Woodburn, Allan (2007)' The role for rail in port-based container freight flows in Britain, Maritime Policy & Management, 34:4,311 — 330
Woodburn, Allan G. (2008) Container train operations between ports and their hinterlands: a UK case study. In: United Nations Economic Commission for Europe (UNECE) Conference: Hinterland Connections of Seaports, 17 - 18 Sep 2008, Piraeus, Greece.

167
Winkelmans, W. (Eds), Port Competitiveness, An Economic and Legal Analysis of the Factors Determining the Competitiveness of Seaports, De Boeck, Antwerp, pp. 67–87.
Wiegmans, B. W. (2003) Performance Conditions for Rail Terminals (Soest: Atlas).
Wiegmans, Bart W. (2005) 'Evaluation of Potentially Successful Barge Innovations', Transport Reviews, 25:5,573 —589
Wiegmans, Bart W., Hekkert, Marko and Langstraat, Marnix (2007) 'Can Innovations in Rail Freight Transhipment Be Successful?', Transport Reviews, 27:1,103 — 122
Wiegmans Bart W, Geerlings Harry, Pielage Ben-Jaap A. & Visser Johan (2008). Evaluation of Potential Successful Innovative Freight Transport Options Planning, Practice & Research, Vol. 23, No. 3, pp. 423–439
Woxenius Johan and Bergqvist Rickard (2007). Hinterland transport by rail – a success for maritime containers but still a challenge for semi-trailers Paper presented at the Logistics Research Network Annual Conference 2007, 10tth-12tth September 2008 in Liverpool, UK .Woxenius, Johan (2007) Hinterland transport of containers – seaports, dryports and shippers in co-operation The PROMIT conference Antwerp, 16th of March 2007
Woxenius, J., Roso, V. and Lumsden, K. (2004), "The Dry Port Concept – Connecting Seaports with their Hinterland by Rail", ICLSP, Dalian, 22-26 September.
Yung-Hsiang Cheng & Chian-Yu Yeh (2007). Core Competencies and Sustainable Competitive Advantage in Air-Cargo Forwarding: Evidence from Taiwan. Transportation Journal pp 6-21
ZeithamI, Valarie A. (1981), "How Consumer Evaluation Processes Differ between Goods and Services," in Marketing of Services. J. Donnelly and W. George, eds., Chicago: American Marketing, 186-190.

168
Reports and websites
Industrial Master Plan 3 (2005), Ministry of International Trade and Industries (Malaysia)
Port of Gothenburg (2008); Annual report 2008 www.portgot.se
Port of Gothenburg (2009) : Rail service 2009 www.portgot.se
Port of Gothenburg (2008) Rail, road & logistics www.portgot.se
Port of Rotterdam (2008) Annual Report
Port of Rotterdam (2008) Port Statistics
Västra Götaland and Scandinavian Growth Region. Västra Götalandsregionen http://www.vgregion.se/Pages/114750/EST%20eng.pdf
http://www.eskilstunadryport.se Västra Götaland and Scandinavian Growth Region. Västra Götalandsregionen http://www.vgregion.se/Pages/114750/EST%20eng.pdf

169
1. APPENDIX 1: CUSTOMERS (MANUFACTURERS)
QUESTIONNAIRE
HINTERLAND CONTAINER TRANSPORT SERVICES FOR INLAND CONTAINER MOVEMENT IN MALAYSIA
My name is Shahrin Nasir. I am a lecturer at the Department of Transport, Logistics and Operation Management, Faculty of Business Management and also a Research Fellow at the Malaysian Institute of Transport (MITRANS), Universiti Teknologi Mara, Shah Alam. Currently I am pursuing my PhD studies at the Royal Institute of Technology (KTH) Stockholm, Sweden.
My PhD research is on the inland container movement from the port to the hinterland. I would appreciate if you could spend some time to answer this questionnaire.
This study is important for the development of the future freight transport services for inland container movements to and from port in Peninsular Malaysia. Your response will be used as one of the components in this process
Your response to this questionnaire will be treated confidentially.
I hope that I can get your feedback through email within two weeks after you have received this questionnaire
If you have any questions, you can email me at : [email protected] or [email protected]
This questionnaire consists of 2 Sections
Section A : General Information of the Company
Section B : Current Information on Container movement

170
Section A General Information A1: Background information
1. Name of company: 2. Company address: 3. Telephone: 4. Fax:5. Email:6. Website:
7. Name of respondent:
8. Position in the company::
A2: Business activities for containerized goods
9. The type of product Please tick ( / )
Type of product Import Export Finished product
Semi finished product (components)
Others, please state e.g raw materials

171
10. Which industry do you belong to:
Please tick ( / )
Industry Import Export Agricultural products Automotive parts and components Building materials, machinery and
related products Cement & concrete products Ceramics & tiles Chemical and adhesive products Electrical and electronics products Environmental & waste management:
Product and services Food & beverage Furniture & wood related products Gifts, stationery and office supplies Household product and appliances Industrial engineering products &
services Iron & steel products Laboratory equipment, fittings &
services Paper, packaging, labeling and
printing Pharmaceutical, medical equipment,
cosmetics and toiletries Plastics products Rubber products Others, please state

172
Section B Current Information on Inland Container Movement
11.No of Containers per shipment
20’ Container 40’Container 20’Container 40’Container
12.Shipment frequency per month
20’ container 40’container 20’container 40’container
13.Port of loading in Malaysia
Malaysian Port Import /per month Export/per month
20’ container
40’ container
20’ container
40’ container
Port Klang i) Northport
ii) Westport
Penang Port
Johor Port
Others, please state
No of Import Containers per shipment
No of Export Containers per shipment
Import Shipment frequency per month
Export shipment frequency per month

173
14.Movement from your location to the port of loading (export container)
Malaysian Port
Transport Mode 20’container/per annum
40’ container /per annum
Port Klang Road haulage to port Rail to port (own
track) Intermodal (road-
rail) to port PenangPort
Road haulage to port
Rail to port (own track)
Intermodal (road-rail) to port
Johor Port Road haulage to port Rail to port (own
track) Intermodal (road-
rail) to port Other Port, Please state
Road haulage to port
Rail to port (own track)
Intermodal (road-rail) to port

174
15.Movement from the port of loading to your location (import container) Malaysian Port
Transport Mode 20’container/per annum
40’ container /per month annum
Port Klang Road haulage to port Rail to port (own
track) Intermodal (road-
rail) to port PenangPort
Road haulage to port
Rail to port (own track)
Intermodal (road-rail) to port
Johor Port Road haulage to port Rail to port (own
track) Intermodal (road-
rail) to port Other Port, Please state
Road haulage to port
Rail to port (own track)
Intermodal (road-rail) to port
16.Who decides on the mode of transport for inland container services (road or rail)?
Always Sometimes Nevera) Own company b) Agents
(intermediaries)

175
17.How do you purchase your transport service for your import and export inland container movement (from port to your premise and vice versa)?
Please tick ( / )
Import Exporta) Ad-hoc basis
b) Contract basis
c) Others: Please state

176
18.Please rank the following reasons in terms of the importance of this statement to your current mode choice for inland container movement. (Between port and your premise)
1 Most Important 2 Very Important 3 Important 4 A little important 5 Not important
Import Container Types of Cargo: (Please state)
Export ContainerTypes of Cargo: (Please State)
1 2 3 4 5 Factors 1 2 3 4 5 Cost Related Factors Low Cost transport
1 2 3 4 5 Factors 1 2 3 4 5 Quality Related
factors
Low damage High capacity availability
High Reliability
High Flexibility
Low Environmental impact
1 2 3 4 5 Factors 1 2 3 4 5 Agent/Carrier related
factors
Willingness to negotiate service and rates
Special preference given to shipper
High Quality of personnel
Good Records in satisfying customers

177
19.Please state the problems you faced with the current mode choice.
Mode Problems Road
Rail (own track)
Intermodal(Road-rail)
Ports
20.Comments
________________________________________________________________________________________________________________________________________________________________________________________________________________________________________________________________________________________________________________________________________________________________________________________________________________________________________________________________________________________________________________________________________________________________________
THANK YOU FOR YOUR COOPERATION

178


SHAHRIN NASIR Interm
odal container transport logistics to and from M
alaysian ports
TRITA-TSC-PHD 14-010ISBN 978-91-87353-62-8
KTH
2014
Intermodal container transport logistics to and from Malaysian portsEvaluation of Customer requirements and environmental e� ects
SHAHRIN NASIR
DOCTORAL THESIS IN TRANSPORT SCIENCESTOCKHOLM, SWEDEN 2014
KTH ROYAL INSTITUTE OF TECHNOLOGYSCHOOL OF ARCHITECTURE AND THE BUILT ENVIRONMENTwww.kth.se