shale gas and the environment - carnegie mellon university · pdf filewhat is shale gas? shale...
TRANSCRIPT

Shale Gas and the Environment:Critical Need for a
Government–University–Industry Research Initiative
P O L I C Y M A K E R G U I D E

Shale gas production is increasing at a rapid
rate and is expected to become half of the U.S.
natural gas supply by 2040. A government–
university–industry research initiative is needed
to fill critical gaps in knowledge at the interface
of shale gas development and environmental
protection so the nation can better prepare
for its energy future.
C O NT E NT S
4 OV E RV I E W
4 What Is Shale Gas?
4 Where Is Shale Gas Located in the United States?
5 How Is Shale Gas Extracted?
5 Are All Shale Gas Plays the Same?
6 How Much Shale Gas Production Is Expected in the United States?
6 What Are the Potential Benefits from Shale Gas?
8 What Does the Public Think about Shale Gas Development and
the Environment?
10 SHALE GAS DEVELOPMENT AND THE ENVIRONMENT
10 How Might Shale Gas Development Impact Water Resources?
12 What Have Carnegie Mellon University Researchers Found about
Shale Gas Development and Water Resources?
13 What Key Questions about Shale Gas and Water Resources
Are Unanswered?
14 How Might Shale Gas Development Impact Air Quality?
15 What Have Carnegie Mellon University Researchers Found about Shale
Gas Development and Air Quality?
16 What Key Questions about Shale Gas and Air Quality Are Unanswered?
16 How Might Shale Gas Development Impact Greenhouse Gas Emissions?
17 What Have Carnegie Mellon University Researchers Found about Shale
Gas Development and Greenhouse Gas Emissions?
18 What Key Questions about Shale Gas and Greenhouse Gas Emissions
Are Unanswered?
19 How Can Future Problems with Orphaned Shale Gas Wells Be Avoided?
19 What Have Carnegie Mellon University Researchers Found about the
Economics of Shale Gas Well Abandonment?
20 What Key Questions about Shale Gas and the Economics of Shale Gas Well
Abandonment Are Unanswered?
22 R E C O M M E N DAT I O N F O R G OV E R N M E NT – U N I V E R S I T Y –
I N D U ST RY S H A L E G AS R E S E A R C H I N I T I AT I V E
22 Why Do Carnegie Mellon University Researchers Believe a Shale Gas
Government–University–Industry Research Initiative Is Necessary?
23 What Is a Government–University–Industry Research Initiative?
25 What Approach Should Be Taken to the Research Initiative?
26 How will the Research Initiative Work?
27 C O N C L U S I O N
28 F O R M O R E I N F O R M AT I O N
A B OUT T H E C A R N E G I E M E L L O N U N I V E RS IT Y
Wilton E. Scott Institute for Energy Innovation
Over the coming decades the world must make fundamental transformations in how energy is
used and produced. This will require new science, technology and public policy innovations.
That’s where we come in.
The Carnegie Mellon University (CMU) Wilton E. Scott Institute for Energy Innovation is
addressing several complex challenges:
• How to use and deliver the energy we already have far more efficiently
• How to expand the mix of energy sources in ways that are clean, reliable, affordable
and sustainable
• How to create innovations in energy technologies, regulations and policies
Carnegie Mellon University’s longstanding expertise in technology, policy, integrated systems,
and behavioral and social science uniquely suits these challenges. What makes us different is our
ability to seamlessly combine these areas for maximum impact.
The purpose of this policymaker guide is to take a systems approach to energy issues–collecting
information and research results from throughout Carnegie Mellon University–to provide an
up-to-date understanding of energy issues facing today’s policymakers.
For more information about the Carnegie Mellon’s Scott Institute for Energy Innovation and the
research discussed in this guide, visit www.cmu.edu/energy. The institute’s directors are Jared
L. Cohon, President Emeritus and University Professor, Civil and Environmental Engineering &
Engineering and Public Policy, and Andrew J. Gellman, Lord Professor of Chemical Engineering.
Deborah D. Stine, Professor of the Practice, Department of Engineering and Public Policy, is the
Associate Director for Policy Outreach for the Scott Institute for Energy Innovation. If you have
questions about this guide, please contact Dr. Stine at [email protected].
A team of Carnegie Mellon University researchers developed this policymaker guide. The team
was led by Deborah D. Stine and included Peter Adams, Elizabeth Casman, Kelvin Gregory,
Michael Griffin, Chris Hendrickson, Paulina Jaramillo, Mohan Jiang, Austin Mitchell,
Allen Robinson, Anirban Roy and Jeanne VanBriesen.
© Carnegie Mellon UniversityCover photo rights reserved by Carnegie Mellon University
2

Overview

OV E RV I E W
Shale gas production is increasing at a rapid rate and is expected to become half of the U.S. natural gas supply by 2040. This Carnegie Mellon University Scott Institute for EnergyInnovation policymaker guide provides a primer on shale gas, including the potential economic opportunities and environmental challenges shale gas production poses to the nation, and an overview of Carnegie Mellon University research results on this topic. After reviewing this information,Carnegie Mellon University researchers have concluded that a government-university-industry research initiative is needed to fill critical gaps in knowledge at the interface of shale gas development and environmental protection so the nation can better prepare for its energy future.
W H AT I S S H A L E G AS ?
Shale gas is one of several forms of “unconventional gas,” which also includes coalbed methane, tight sand gas and methane hydrates. Shale gas is trapped within shale formations, which is fine-grained sedimentary rock that is both its source and reservoir.i In the past, the cost of extracting this gas from the shale made it uneconomical to produce, so the nation relied instead on conventional gas. However, technological advancements in horizontal drilling and hydraulic fracturing over the past decade have improved the economics of developing unconventional reservoirs, particularly from tight shale.
W H E R E I S S H A L E G AS LO C AT E D
I N T H E U N I T E D STAT E S ?
Shale gas is located in “shale plays”—geographic areas targeted for exploration because there is an economic quantity of oil and/or gas available based on favorable geoseismic survey results as well as well logs or production results.ii Shale gas occurs throughout much of the United States.
The map to the left shows the known extent of shale plays that have economically viable shale gas, shale oil, or both shale oil and gas reservoirs. Our understanding of these reservoirs changes constantly. For example, in 2012 the U.S. Geological Service found that the Utica Shale contains 38 trillion cubic feet of undiscovered, technically recoverable shale gas, 940 million barrels of shale oil and 208 million barrels of unconventional natural gas liquids. This guide focuses on shale gas. The guide does not address the issue of shale oil, such as that located in the Bakken, Eagle Ford and Utica shale plays.
Chattanooga
Eagle Ford
Western Gulf
TX-LA-MSSalt Basin
Uinta Basin
Devonian (Ohio)Marcellus
Utica
Bakken***
Avalon-Bone Spring
San JoaquinBasin
MontereySanta Maria,Ventura, Los
AngelesBasins
Monterey-Temblor
Pearsall
Tuscaloosa
Big HornBasin
DenverBasin
Powder RiverBasin
ParkBasin
Niobrara*
Mowry
Niobrara*
Heath**
ManningCanyon
AppalachianBasin
Antrim
Barnett
Bend
New Albany
Woodford
Barnett-Woodford
Lewis
Hilliard-Baxter-Mancos
Excello-Mulky
Fayetteville
Floyd-Neal
Gammon
Cody
Haynesville-Bossier
HermosaMancos
Pierre
Conasauga
MichiganBasin
Ft. Worth Basin
Palo DuroBasin
PermianBasin
IllinoisBasin
AnadarkoBasin
Greater Green River Basin
Cherokee Platform
San JuanBasin
WillistonBasin
Black WarriorBasin
Ardmore Basin
Paradox Basin
RatonBasin
Montana Thrust
Belt
Marfa Basin
Valley & Ridge Province
Arkoma Basin
Forest City Basin
PiceanceBasin
Lower 48 states shale plays
0 200 400100 300
Miles
±
Source: Energy Information Administration based on data from various published studies. Updated: May 9, 2011
BasinsShale plays
Stacked plays
BasinsCurrent playsProspective plays
* Mixed shale & chalk play
** Mixed shale & limestone play
***Mixed shale &tight dolostone-
siltstone-sandstoneIntermediate depth/ ageShallowest/ youngest
Deepest/ oldest
4
Schematic Geology of Natural Gas Resources
Source: U.S. Energy Information Administration, “What is Shale Gas and Why is it Important?” at http://energy.gov/fe/shale-gas-101
Shale Gas and Oil Plays in the Lower 48 States
Source: U.S. Energy Information Administration, “What is Shale Gas and Why is it Important?” at http://energy.gov/fe/shale-gas-101

H OW I S S H A L E G AS
E X T R AC T E D ?
Shale gas is extracted through a combination of hydraulic fracturing and horizontal drilling. (See figure to the right.) As will be discussed later, unless done properly, this process can harm the environment. Different risks are associated with the various activities. For example, as illustrated in the figure, after a well is drilled and prior to production, a protective casing is put into place to stabilize the well, protect the well stream from outside contaminants and the well stream from contaminating fresh water reservoirs. This casing reduces the potential environmental risk from the well during production. However, there is no casing in place during the initial drilling so this step of the process may be riskier to the environment.
A R E A L L S H A L E G AS P L AY S
T H E SA M E ?
No. The challenges of economically developing unconventional shale reservoirs vary with the characteristics of the reservoir, extraction costs, topography, land uses, water resource availability and climate. Proximity to gas consumers and to infrastructure for transporting and processing produced gas is also a key factor in economic viability of localized shale gas regions.
Particularly important is whether the natural gas extracted is “dry” or “wet.” The figure to the right shows dry shale gas production, by play. “Dry” gas contains mostly methane, while “wet” gas is associated with higher rates of natural gas liquids production, including ethane, propane and butane. Both natural gas liquids and shale oil have higher economic value today than dry gas. The amount of natural gas liquids varies from one shale play to the next as well as within a single shale play. For example, in the Pennsylvania portion of the Marcellus shale, the shale gas in north central and northeast Pennsylvania is dry, but that extracted in southwestern Pennsylvania is wet.
5
Hydraulic Fracturing Well Construction
Source: American Petroleum Institute, “Hydraulic Fracturing Well Construction,” www.api.org/policy-and-issues/policy-items/exploration/hydraulic-fracturing-well-construction.aspx
U.S. Dry Shale Gas Production, by shale play, 2000-2012
Shale Gas Production (dry) Billion Cubic Feet Per Day
Source: Adam Sieminski, Administrator, U.S. Energy Information Administration, Presentation to the Consumer Energy Alliance, February 21, 2013, Washington, DC at www.eia.gov/pressroom/presentations/sieminski_02212013.ppt
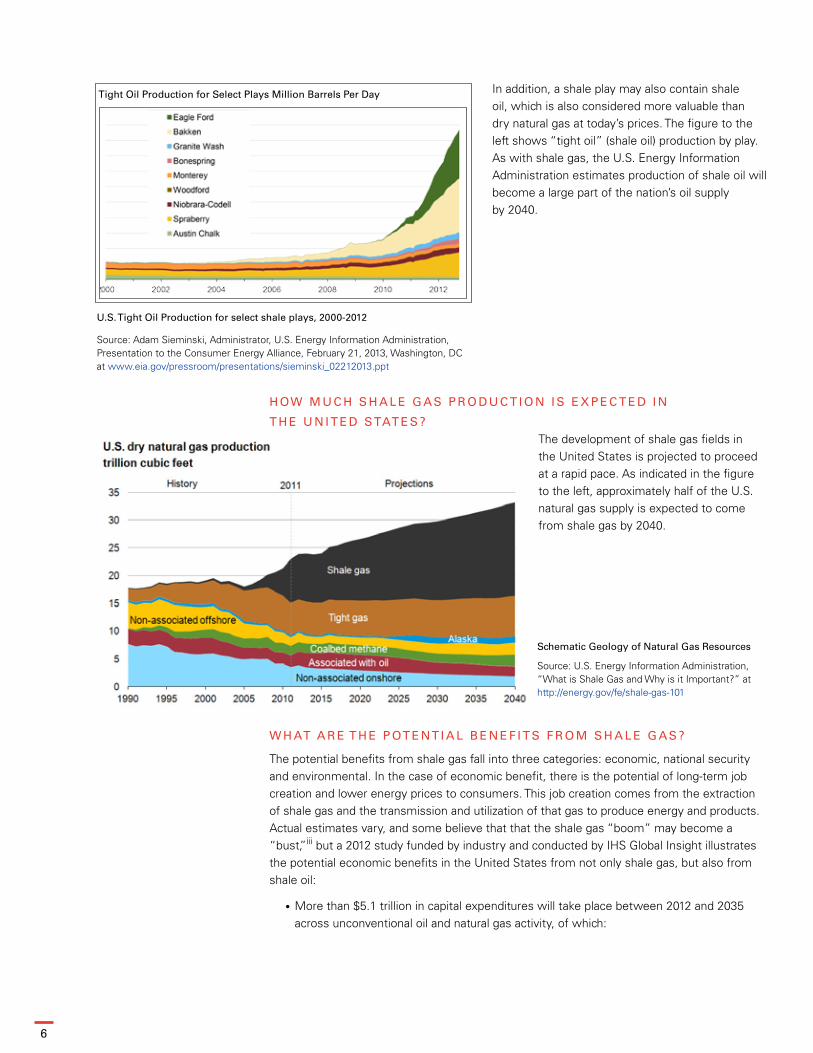
H OW M U C H S H A L E G AS P R O D U C T I O N I S E X P E C T E D I N
T H E U N I T E D STAT E S ?The development of shale gas fields in the United States is projected to proceed at a rapid pace. As indicated in the figure to the left, approximately half of the U.S. natural gas supply is expected to come from shale gas by 2040.
W H AT A R E T H E P OT E NT I A L B E N E F I T S F R O M S H A L E G AS ?
The potential benefits from shale gas fall into three categories: economic, national security and environmental. In the case of economic benefit, there is the potential of long-term job creation and lower energy prices to consumers. This job creation comes from the extraction of shale gas and the transmission and utilization of that gas to produce energy and products. Actual estimates vary, and some believe that that the shale gas “boom” may become a “bust,”iii but a 2012 study funded by industry and conducted by IHS Global Insight illustrates the potential economic benefits in the United States from not only shale gas, but also from shale oil:
• More than $5.1 trillion in capital expenditures will take place between 2012 and 2035 across unconventional oil and natural gas activity, of which:
6
Schematic Geology of Natural Gas Resources
Source: U.S. Energy Information Administration, “What is Shale Gas and Why is it Important?” at http://energy.gov/fe/shale-gas-101
Tight Oil Production for Select Plays Million Barrels Per Day
U.S. Tight Oil Production for select shale plays, 2000-2012
Source: Adam Sieminski, Administrator, U.S. Energy Information Administration, Presentation to the Consumer Energy Alliance, February 21, 2013, Washington, DC at www.eia.gov/pressroom/presentations/sieminski_02212013.ppt
In addition, a shale play may also contain shale oil, which is also considered more valuable than dry natural gas at today’s prices. The figure to the left shows “tight oil” (shale oil) production by play. As with shale gas, the U.S. Energy Information Administration estimates production of shale oil will become a large part of the nation’s oil supply by 2040.
• Over $2.1 trillion in capital expenditures will take place between 2012 and 2035 in unconventional oil activity.
• Close to $3 trillion in capital expenditures will take place between 2012 and 2035 in unconventional natural gas activity.
• Employment attributed to upstream unconventional oil and natural gas activity will support more than 1.7 million jobs in 2012, growing to some 2.5 million jobs in 2015, 3 million jobs in 2020, and 3.5 million jobs in 2035.
• On average, direct employment will represent about 20% of all jobs resulting from unconventional oil and natural gas activity with the balance contributed by indirect [supporting businesses] and induced [direct and indirect employee spending] employment.
• In 2012, unconventional oil and natural gas activity will contribute nearly $62 billion in federal, state and local tax receipts. By 2020, total government revenues will grow to just over $111 billion. On a cumulative basis, unconventional oil and natural gas activity will generate more than $2.5 trillion in tax revenues between 2012 and 2035.iv
National security benefits are also possible. Shale gas and oil provide the potential for the United States to become reliant only on North American energy supplies. The following results from a Rice University analysis provide an illustration of some of the potential geopolitical benefits:
• Virtual elimination of U.S. requirements for imported liquefied natural gas (LNG) for at least two decades;
• Reduced competition for LNG supplies from the Middle East, thereby moderating prices and spurring greater use of natural gas, an outcome with significant implications for global environmental objectives;
• Lower likelihood of a long-term potential monopoly power of a “gas OPEC” or a single producer such as Russia that exercises dominance over large natural gas consumers in Europe and elsewhere;
• Less opportunity for Venezuela to become a major LNG exporter and thereby lower longer-term dependence in the Western Hemisphere and in Europe on Venezuelan NG;
• Easing of U.S. and Chinese dependence on Middle East natural gas supplies, limiting the incentives for geopolitical and commercial competition between the two largest consuming countries and providing both countries with new opportunities to diversify their energy supply;
• Reduced ability by Iran to tap energy diplomacy as a means to strengthen its regional power or to buttress its nuclear aspirations.v
To the extent that shale gas displaces coal and oil, for example, in power production or as a vehicle fuel, respectively, there are potential environmental benefits—though it should be kept in mind that natural gas is a fossil fuel that can impact climate change (see later discussion) more than renewable energy sources and energy efficiency mechanisms.
Future Scott Institute activities will address the midstream (e.g., pipeline and storage) and downstream (e.g., petrochemical industry manufacturing) aspects of this industry so as to identify activities that will lead to the optimal benefits from shale gas development.
7

W H AT D O E S T H E P U B L I C T H I N K A B O U T S H A L E G AS D E V E LO P M E NT
A N D T H E E N V I R O N M E NT ?
According to Rasmussen polls, the majority of Americans (57%) favor the use of hydraulic fracturing of shale to produce more oil and gas and believe it is possible to develop these energy reserves without doing environmental damage (63%); however, a significant percentage (23%) are not sure or believe it is impossible (14%) to develop these resources while still protecting the environment.vi
A poll taken by the University of Pittsburgh/Pittsburgh Today of residents in the Pittsburgh metropolitan area who live near the area where shale drilling occurs found that “more residents overall support Marcellus Shale drilling than oppose it by a margin of 45% to 25%, with the rest in neither camp. In Washington County (a highly active drilling area), the rates of those who support and
those who oppose drilling are higher, and fewer people are without a strong opinion on the issue. At the same time, more than 8 in 10 residents believe drilling poses at least a slight threat to the environment and public health.”vii
Trust is also an issue. As shown in the table above, the public has the greatest trust in researchers to provide this information rather than either industry, state environmental departments or other groups:
• 37% reported they had little or no trust in the gas industry; 50% expressed at least some trust; 13% had no opinion.
• 33% had little or no trust in local task forces, 5% had a great deal of trust.
• 32% had little or no trust in the state’s Department of Environmental Protection, 9% had a great deal.
• 30% trusted local environmental groups very little or not at all, 10% trusted these groups a great deal and 46% had some trust.
• 20% of the subjects trusted Cooperative Extension and other educators very little or not at all; 14% trusted them a great deal and 48% trusted them some.
• Just 16% of the respondents gave scientists/researchers little or no trust ratings, 20% of the subjects trusted them a great deal and an additional 51% had some trust.viii
8
Source: Alter et al, “Baseline Socioeconomic Analysis For The Marcellus Shale Development In Pennsylvania,” A project funded by the Appalachian Regional Commission to The Institute for Public Policy & Economic Development at Wilkes University, August 31, 2010 at www.institutepa.org/PDF/Marcellus/MarcellusShale-Study08312010.pdf Note: This household survey was conducted in 2009–2010 of residents in the Marcellus Shale region in Pennsylvania.
How much trust do you have in each of the following related to natural gas? (Question B20)

Environment

S H A L E G AS D E V E LO P M E NT A N D T H E E N V I R O N M E NT
The following sections discuss how shale gas development might impact the environment,and what Carnegie Mellon University researchers have found on this issue. The research they conduct addresses concerns and optimal practices such as those in the two studies below.
• A Government Accountability Office (GAO) study found that “oil and gas development, which includes development from shale formations, poses inherent risks to air quality, water quantity, water quality, and land and wildlife.” Further, the GAO study indicates that the extent and severity of environmental and public health risks “may vary significantly across shale basins and also within basins.”ix
• The International Energy Agency (IEA) has identified seven golden rules that it recommends be undertaken for developing shale gas in a sustainable way. These include: (1) Measure, disclose & engage; (2) Watch where you drill; (3) Isolate well & prevent leaks; (4) Treat water responsibly; (5) Eliminate venting, minimize flaring & other emissions; (6) Be ready to think big;x (7) Ensure a consistently high level of environmental performance.xi
HOW MIGHT SHALE GAS
DEVELOPMENT IMPACT WATER
RESOURCES?
Shale gas production can affect ground and surface water resources—including water quantity and water quality—during well pad construction, drilling, hydraulic fracturing, completed well operation and pipeline transmission. Water is used directly in drilling fluids and hydraulic fracturing fluids, and indirectly in the supply chain production such as the production of hydraulic fracturing additives and the extraction of sand. As in the case of all industries, surface water needs to be protected from chemical and wastewater spills. Groundwater needs to be isolated from drilling and hydraulic fracturing operations. In addition, water quality can be affected by construction activities associated with the well pad, drilling activities and pipeline development.
The hydraulic fracturing process uses significant quantities of water (3–6 million gallons of water per well depending upon the length of the lateral drilled). When fracturing is complete, wastewater returning to the surface contains residual fracturing chemicals and naturally occurring salts, metals, radioactive elements and organic chemicals.
The Hydraulic Fracturing Water Cycle
Source: U.S. Environmental Protection Agency, “The Hydraulic Fracturing Water Cycle,” at www.epa.gov/hfstudy/hfwatercycle.html
10
As illustrated in the figure on page 10, there are five primary actions xii that occur during hydraulic fracturing that may affect water resources:
1. Water acquisition: Water acquisition involves locating, permitting, extracting and transporting water from the source to the well site. Although the volume of water needed for hydraulic fracturing may represent a small portion of total withdrawals in some areas with active development, the effects of large water withdrawals for hydraulic fracturing operations depend upon the capacity of the source. Large water withdrawals can affect the quantity and quality of water sources. Reducing the in-stream flow of rivers and streams can negatively impact ecosystems and downstream uses of water resources, altering dilution of pollutants and affecting public water supply.
2. Chemical mixing: Chemical additives and proppant (a “propping agent” such as coated sand that holds cracks in the shale open so the natural gas can flow) are added to the water. If hydraulic fracturing liquid is spilled or leaks, they can contaminate surface and ground water.
3. Well injection: The hydraulic fracturing fluid is injected into the well under pressure to create cracks in the geological formation. If the well is poorly constructed or operated, leaks may occur that provide a pathway from the new well into the environment where they could contaminate ground and surface water.
4. Flowback period: The flowback period is typically 10–14 days after fracturing occurs, before gas production begins. “Flowback water” is the fluid used to fracture the shale, which then flows back to the surface during and after the completion of the hydraulic fracturing as pressure is released in the well. This water contains residuals from the hydraulic fracturing chemicals as well as naturally occurring materials that dissolve in the water from the formation (predominately salts, but also radioactive materials and hydrocarbons). This water is often stored on site, partially treated and then reused in subsequent hydraulic fracturing activities. Improper storage or transport has the potential to contaminate the environment during spills or leakage.
5. Wastewater treatment, recycling and disposal: As natural gas is being produced from the well, water also continues to be produced from the well throughout its lifetime. This produced water is collected continuously from the well while in production and stored until retrieved periodically by trucks that transport the water to a location where it can be recycled, treated or disposed of properly. Most is recycled or sent to deep well injection for disposal, but it can also be treated and then discharged to surface waters. Water resources can be contaminated if the produced water released to surface water is inadequately treated, or if accidents or spills occur during storage, transport or treatment of the produced water.
The impact of hydraulic fracturing can vary among shale plays and individual wells. For example, Marcellus Shale produced water is generally much saltier than produced water from other shale formations in the United States. If salt water enters the environment, it can adversely affect our ability to treat water for drinking and industrial purposes, and can destroy ecosystems, killing fish bivalves and amphibians and wiping out aquatic vegetation.
After the well is in production, it joins thousands of other wells in producing water and gas for many years. The cumulative effect of thousands of wells across the large geographical expanse of the Marcellus formation has not been fully evaluated. And, most development has taken place in areas with extensive deep well injection capabilities for produced water disposal. It is not clear how much produced water, containing how much salt and other contaminants, will need to be managed across the multi-state Marcellus formation, which has more limited deep well injection capacity. After development slows and most wells are in the production phase, reuse options will disappear and long-term strategies for management of the continuously produced salty water will be needed.
11

W H AT H AV E C A R N EG I E M E L LO N U N I V E R S I T Y R E S E A R C H E R S F O U N D
A B O U T S H A L E G AS D E V E LO P M E NT A N D WAT E R R E S O U R C E S ?
A team of Carnegie Mellon University researchers has been studying the impact of shale gas development in the Marcellus Shale region on Pennsylvania water resources. With research focused on water withdrawals from streams and rivers and the management of contaminated water, the team has so far found the following:
• The volume of water withdrawn for shale gas development is large; however, in areas with abundant and renewable water resources, concerns focus more on timing and location of withdrawals than on total quantity.
• Withdrawals during seasonal dry periods when flows are low have more significant effects than withdrawals during wetter periods.
• Small rivers, streams and creeks are often in close proximity to well pads, reducing costs associated with transporting water. However, it is difficult to determine whether the flows in these locations are sufficient to accommodate withdrawals for shale gas development because the available stream flow data are limited.
• Existing standards designed to minimize the impacts of surface water withdrawals on the environment, and on the existing uses of the region’s water resources, are based on calculations that are subject to considerable uncertainty.
M A N AG E M E N T O F C O N TA M I N AT E D WAT E R
• Basin-wide plans are needed to control the many sources of chemicals that can enter drinking water sources. Shale gas resources often co-exist with other extraction and utilization industries in energy, including coal mining and electric power plants, which also produce wastewaters that may contain salts (including bromide).
• Shale gas produced water in Pennsylvania contains chemicals similar to produced water from conventional oil and gas wells in Pennsylvania; however, the volumes from shale gas operations are much higher. Shale gas produced water in Pennsylvania is more highly concentrated than similar produced waters in other states. Management of all produced waters requires new approaches to protect water resources.
• For example, during the rapid expansion of shale gas extraction from 2008 to 2011 in Pennsylvania, many disposal options were utilized for produced water, including treatment through conventional sewage treatment plants and brine treatment plants. Many of these plants did not provide adequate treatment, leading to high levels of salt and bromide in
discharges to surface waters. Surface waters in the region contained unacceptably high levels of salts, sulfate and bromide at times over the past few years, affecting drinking water treatment. Following the identification of this problem, shale gas producers selected alternative management options.
• In Pennsylvania, many shale gas companies are extensively reusing flowback and produced water. Storage of these waters on site at well pads presents challenges due to microbial growth. For example, inadequate aeration can lead to nuisance odors at impoundments.
Graduate student sampling Pennsylvania stream to test for water pollutants
12
Photo Credit: Sandra Karcher, Carnegie Mellon University

W H AT K EY QU E ST I O N S A B O U T S H A L E G AS A N D WAT E R R E S O U R C E S
A R E U N A N S W E R E D ?
Based on their work thus far, Carnegie Mellon University researchers have identified a number of research questions that would aid policymaker decision making including:
• How do water withdrawal locations affect ecosystems?
• How does produced water quality change over well life? Do alterations in chemical composition over time change the management options and costs?
• How do decisions about produced water management change as development moves geographically?
• What are the long-term quantities of produced water expected from shale gas wells once development is done and the play enters stable production? When options for recycling are reduced, what produced water management options will dominate?
• Can reduced cost treatment technologies be developed for produced water? Can treatment technologies enable extraction of usable materials from produced water? Can on-site treatment technologies be developed to avoid transportation costs and risks?
• What are the economics of treating produced wastewater to remove contaminants added during the process and those related to shale gas?
• What effect does uncertainty have on the regulatory frameworks for water withdrawals?
• What regulatory hurdles exist to the use of impaired water (e.g., acid mine drainage) for hydraulic fracturing?
• What regulatory hurdles exist to the development of new technologies for treatment and reuse of produced water and its byproducts?
• What long-term monitoring is necessary after well closure to ensure adequate protection of ground water resources?
Additional resources would help Carnegie Mellon University and other researchers throughout the country answer these questions for policymakers.
Fresh Water Impoundment Flowback Impoundment
A Personal Perspective…
“There’s no substitute for good streamflow data when deciding how much water drillers can take from a stream.
Unfortunately, many of the small high-quality streams near drilling operations are ungauged. The effects of the uncertainty
this introduces are not currently considered in water withdrawal permits for drillers.”
CARNEGIE MELLON UNIVERSITY RESEARCHER Elizabeth Casman
13
Photo Credit: Austin Mitchell, Carnegie Mellon University
H OW M I G H T S H A L E G AS D E V E LO P M E NT I M PAC T A I R QU A L I T Y ?
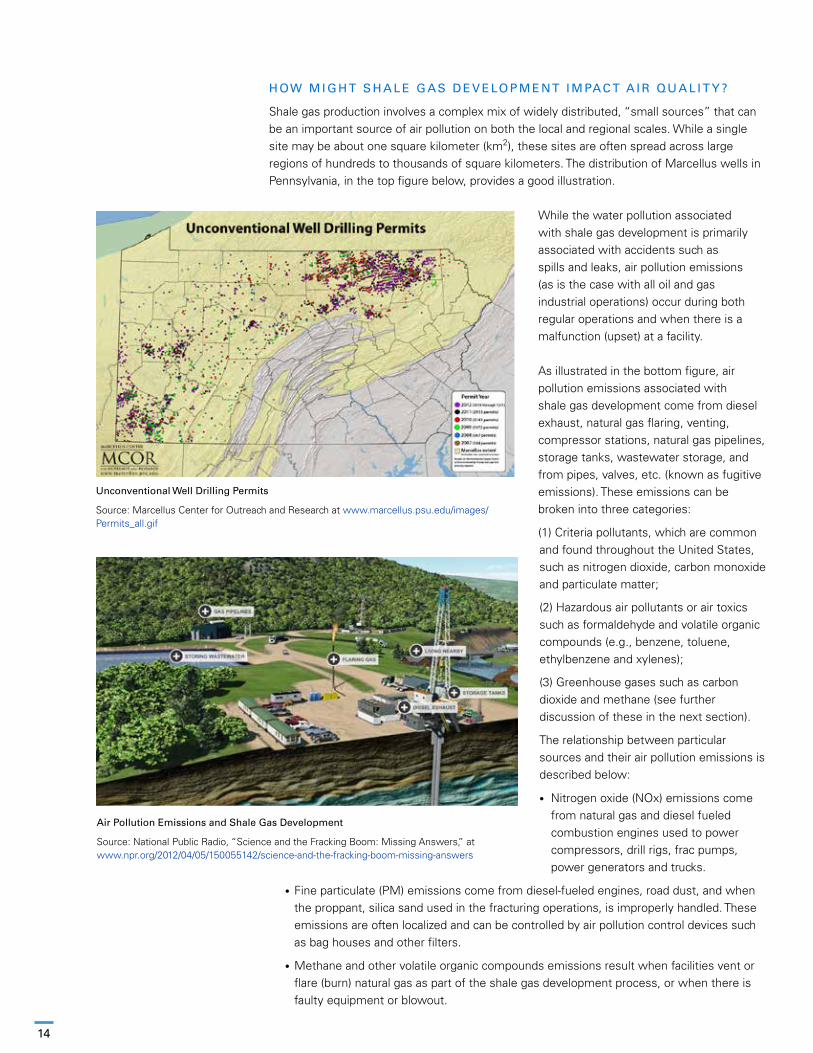
Shale gas production involves a complex mix of widely distributed, “small sources” that can be an important source of air pollution on both the local and regional scales. While a single site may be about one square kilometer (km2), these sites are often spread across large regions of hundreds to thousands of square kilometers. The distribution of Marcellus wells in Pennsylvania, in the top figure below, provides a good illustration.
While the water pollution associated with shale gas development is primarily associated with accidents such as spills and leaks, air pollution emissions (as is the case with all oil and gas industrial operations) occur during both regular operations and when there is a malfunction (upset) at a facility.
As illustrated in the bottom figure, air pollution emissions associated with shale gas development come from diesel exhaust, natural gas flaring, venting, compressor stations, natural gas pipelines, storage tanks, wastewater storage, and from pipes, valves, etc. (known as fugitive emissions). These emissions can be broken into three categories:
(1) Criteria pollutants, which are common and found throughout the United States, such as nitrogen dioxide, carbon monoxide and particulate matter;
(2) Hazardous air pollutants or air toxics such as formaldehyde and volatile organic compounds (e.g., benzene, toluene, ethylbenzene and xylenes);
(3) Greenhouse gases such as carbon dioxide and methane (see further discussion of these in the next section).
The relationship between particular sources and their air pollution emissions is described below:
• Nitrogen oxide (NOx) emissions come from natural gas and diesel fueled combustion engines used to power compressors, drill rigs, frac pumps, power generators and trucks.
• Fine particulate (PM) emissions come from diesel-fueled engines, road dust, and when the proppant, silica sand used in the fracturing operations, is improperly handled. These emissions are often localized and can be controlled by air pollution control devices such as bag houses and other filters.
• Methane and other volatile organic compounds emissions result when facilities vent or flare (burn) natural gas as part of the shale gas development process, or when there is faulty equipment or blowout.
Unconventional Well Drilling Permits
Source: Marcellus Center for Outreach and Research at www.marcellus.psu.edu/images/ Permits_all.gif
Air Pollution Emissions and Shale Gas Development
Source: National Public Radio, “Science and the Fracking Boom: Missing Answers,” at www.npr.org/2012/04/05/150055142/science-and-the-fracking-boom-missing-answers
14
• Hazardous air pollutants, including volatile organic compounds (VOC), occur from compressors, diesel-fueled engines, when fracturing fluid and produced water stored in impoundments evaporate, and when there are fugitive emissions.
W H AT H AV E C A R N EG I E M E L LO N U N I V E R S I T Y R E S E A R C H E R S F O U N D
A B O U T S H A L E G AS D E V E LO P M E NT A N D A I R QU A L I T Y ?
A team of Carnegie Mellon University researchers has been studying the impact of shale gas development in the Marcellus Shale region on Pennsylvania air quality. So far, they have found the following:
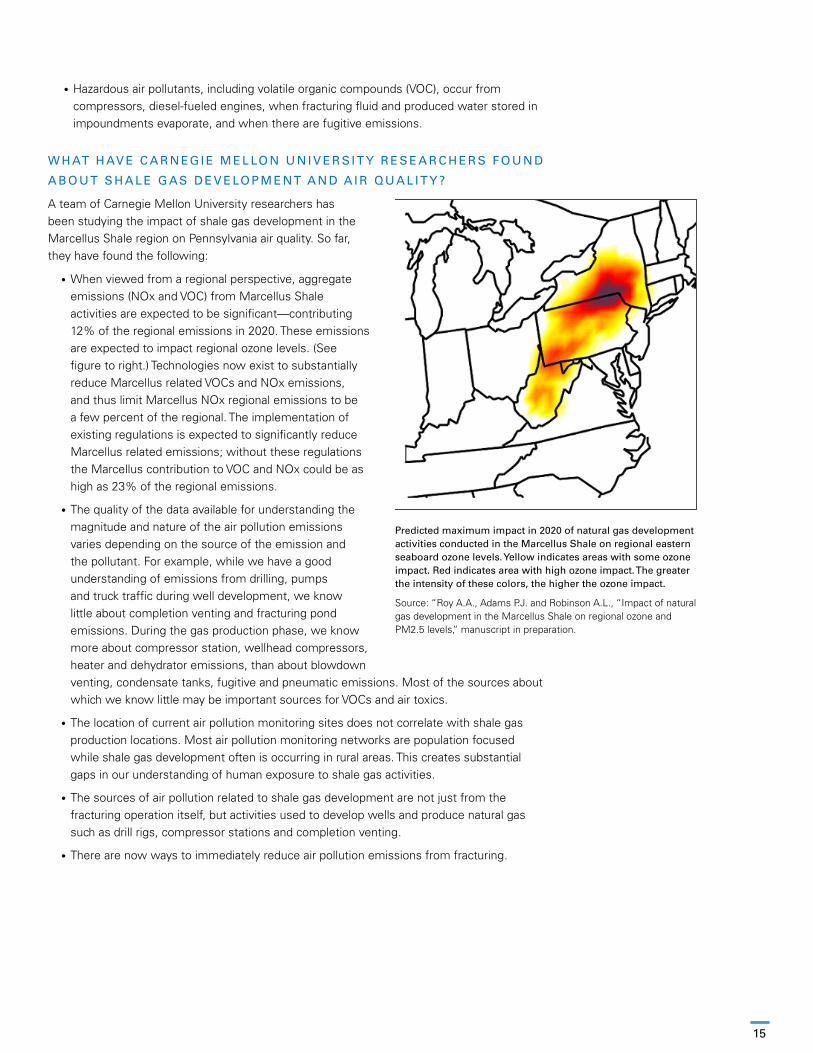
• When viewed from a regional perspective, aggregate emissions (NOx and VOC) from Marcellus Shale activities are expected to be significant —contributing 12% of the regional emissions in 2020. These emissions are expected to impact regional ozone levels. (See figure to right.) Technologies now exist to substantially reduce Marcellus related VOCs and NOx emissions, and thus limit Marcellus NOx regional emissions to be a few percent of the regional. The implementation of existing regulations is expected to significantly reduce Marcellus related emissions; without these regulations the Marcellus contribution to VOC and NOx could be as high as 23% of the regional emissions.
• The quality of the data available for understanding the magnitude and nature of the air pollution emissions varies depending on the source of the emission and the pollutant. For example, while we have a good understanding of emissions from drilling, pumps and truck traffic during well development, we know little about completion venting and fracturing pond emissions. During the gas production phase, we know more about compressor station, wellhead compressors, heater and dehydrator emissions, than about blowdown venting, condensate tanks, fugitive and pneumatic emissions. Most of the sources about which we know little may be important sources for VOCs and air toxics.
• The location of current air pollution monitoring sites does not correlate with shale gas production locations. Most air pollution monitoring networks are population focused while shale gas development often is occurring in rural areas. This creates substantial gaps in our understanding of human exposure to shale gas activities.
• The sources of air pollution related to shale gas development are not just from the fracturing operation itself, but activities used to develop wells and produce natural gas such as drill rigs, compressor stations and completion venting.
• There are now ways to immediately reduce air pollution emissions from fracturing.
15
• Impact of Marcellus development on regional ozone levels. The map shows differences from the base inventory (results from base inventory on previous slide)
• Ozone levels could go up as much as 11 ppb in Marcellus hotspots.
Predicted maximum impact in 2020 of natural gas development activities conducted in the Marcellus Shale on regional eastern seaboard ozone levels. Yellow indicates areas with some ozone impact. Red indicates area with high ozone impact. The greater the intensity of these colors, the higher the ozone impact.
Source: “Roy A.A., Adams P.J. and Robinson A.L., “Impact of natural gas development in the Marcellus Shale on regional ozone and PM2.5 levels,” manuscript in preparation.

W H AT K EY QU E ST I O N S A B O U T S H A L E G AS A N D A I R QU A L I T Y A R E
U N A N S W E R E D ?
Based on their work thus far, Carnegie Mellon University researchers have identified a number of research questions that would aid policymaker decision making including:
• What is the positive and negative marginal impact of shale gas development on regional and local air pollution? For example, if natural gas replaces coal at electric generation facilities, there can be substantial reductions in air pollution. The impact of such reductions might be offset however, by increased air pollution from the development and production of shale gas. What is the spatial distribution of these benefits and costs?
• From a regulatory perspective, should each site be viewed as an individual source of air pollution emissions or a very large chemical plant or refinery distributed over a large area such as an air basin or valley?
• Are toxic air emissions such as diesel particulate matter and formaldehyde likely to create local problems?
H OW M I G H T S H A L E G AS D E V E LO P M E NT I M PAC T
G R E E N H O U S E G AS E M I S S I O N S ?
As with all oil and gas production and development, greenhouse gas emissions like methane (natural gas) and carbon dioxide (resulting from combustion of mechanical devices used for shale gas processing and goods transportation) are a result of shale gas operations. Because greenhouse gas emissions occur throughout many different processes related to the production of shale gas, it is important to perform life cycle analysis, which analyzes emissions from “cradle to grave” (i.e., from raw material extraction through materials processing, manufacture, distribution, use, repair and maintenance, and disposal or recycling). Further, some greenhouse gases have more impact on climate change than others. The impact of methane, for example, is 25% higher than that of carbon dioxide (CO2) on climate change over a 100-year time period (notated as CO2e).
A team of Carnegie Mellon University researchers in a paper entitled Life Cycle Greenhouse Gas Emissions of Marcellus Shale Gas found that the development and completion of a typical Marcellus shale well results in roughly 5,500 tons of carbon dioxide equivalent produced or about 1.8 grams CO2e/Megajoule (MJ) of gas produced.
16
Carnegie Mellon University Air Monitoring VanPhoto Credit: Carnegie Mellon University
A Personal Perspective…
“Today, there is generally poor spatial correlation between existing air monitoring networks and oil and gas development
and production. Therefore, relatively little data exists to quantify the effects of oil and gas activities on local and regional air
quality. A government-university-industry research initiative would provide the resources necessary to better understand this
complex situation.”
CARNEGIE MELLON UNIVERSITY RESEARCHER Allen Robinson

0.0
0.5
1.0
1.5
2.0
2.5
3.0
3.5
4.0
4.5
5.0
Well pad preparation Well drilling Hydraulic Fracturing Well completion
Marc
ellus
gas p
repro
ducti
on G
HG em
ission
s (g
CO 2e/
MJ)
Well Pad Construction Drilling
Water Use Pumping
Additives Production Well Completion
Greenhouse gas emissions result from:
• Well pad preparation: Vegetation clearing and well pad construction, which includes the access road and pad
• Well drilling: Drilling energy, mud and water consumption
• Shale gas development: Pumping, additives reduction and water consumption
• Well completion: Venting and flaring
• Wastewater disposal: Deep well injection
• Production, processing, transmission, storage, distribution and combustion: Vented methane (gas released as part of normal operations), fugitive methane (unintentional leaks) and CO2
emissions from the processing plants, the natural gas transmission and distribution system, and from fuel consumption.
The figure on the upper right provides the greenhouse gas emissions from different stages of Marcellus shale gas preproduction as measured in CO2 equivalent (CO2e). Note that this figure does not include emissions from the full life cycle of shale gas. These are shown in the figure on the lower right.
W H AT H AV E C A R N EG I E
M E L LO N U N I V E R S I T Y
R E S E A R C H E R S F O U N D A B O U T
S H A L E G AS D E V E LO P M E NT
A N D G R E E N H O U S E
G AS E M I S S I O N S ?
• An electric power plant burning Marcellus shale gas emits 50% fewer greenhouse gas emissions than any U.S. coal-fired plant. (See figure on page 18.)
• In the absence of effective carbon capture and storage processes, the life cycle GHG emissions from electricity generated with shale gas are 20–50% lower than the emissions from electricity generated with coal. (See figure on page 18.)
• The ranges in these values depend on power plant efficiencies and natural gas emission variability. The accuracy of this estimate depends on our understanding of the gathering, processing and transmission of natural gas, particularly that associated with methane leaks. Monitoring would help reduce this uncertainty.
Greenhouse gas emissions from different stages of Marcellus shale gas preproduction
Source: Jiang et al, “Life cycle greenhouse gas emissions of Marcellus shale gas,” Environ.Res.Lett. 6(2011) 034014 at iopscience.iop.org/1748-9326/6/3/034014
Pre productionProduction Processing Transmission Distribution0
1
2
3
4
5
6
7
8
9
10
11
Ups
trea
m G
HG
em
issi
ons
(g C
O2e
/MJ)
Pre productionNon combustion CO2N2OCH4Lease fuelFlaringPlant fuelPipeline fuel
Combustion Life cycle0
10
20
30
40
50
60
70
Life
cyc
le G
HG
em
issi
ons
(g C
O2e
/MJ)
Greenhouse gas emissions through the life cycle of Marcellus shale gas
Source: Jiang et al, “Life cycle greenhouse gas emissions of Marcellus shale gas,” Environ.Res.Lett. 6(2011) 034014 at iopscience.iop.org/1748-9326/6/3/034014.Note: Preproduction through distribution emissions are on left scale; combustion and total life cycle emissions are on right scale. No carbon capture is included after combustion.
17
Additional to U.S. domestic gas

W H AT K EY QU E ST I O N S A B O U T S H A L E G AS A N D
G R E E N H O U S E G AS E M I S S I O N S A R E U N A N S W E R E D ?
Based on their work thus far, Carnegie Mellon University researchers have identified a number of research questions that would aid policymaker decision making including:
• What are the eventual production volumes (ultimate recoveries) of Marcellus shale wells?
• What will the impact be of the most common industry practices related to flaring and venting at Marcellus wells (e.g., “green completions” which capture methane and VOC compounds during well completions instead of venting and flaring)?
• What are the greenhouse gas emissions from shale plays other than Marcellus? Regional environmental variability and reservoir heterogeneity must be evaluated.
• What is the overall methane leakage rate from the entire natural gas system?
Answering these questions will reduce the uncertainty in these calculations.
A Personal Perspective…
“While understanding the greenhouse gas emissions associated with shale gas production
is important, the discussion about whether they are higher than coal is a distraction from
more legitimate concerns about air and water quality, and habitat destruction.”
CARNEGIE MELLON UNIVERSITY RESEARCHERS Paulina Jaramillo and Michael Griffin
18
0
100
200
300
400
500
600
700
800
900
1000
NGCC w/o CCS NGCC w CCS IGCC w/o CCS IGCC w/CCS PC w/o CCS PC w/ CCS
Life
cyc
le G
HG
em
issio
ns (g
CO
2e/k
Wh)
Natural Gas Baseline Marcellus shale gas Coal
NGCC:Natural Gas Combined Cycle IGCC:Intergrated Coal Gasification Cycle PC: Pulverized Coal CCS: Carbon Captures Sequestration
Technology comparison of life cycle GHG emissions from current domestic natural gas, Marcellus shale gas and coal for use in electric-ity production
Source: Jiang et al, “Life cycle greenhouse gas emissions of Marcellus shale gas,” Environ.Res.Lett. 6(2011) 034014 at iopscience.iop.org/1748-9326/6/3/034014
NOTES:• A natural gas combined cycle (NGCC) power
plant combines two technologies and is more efficient than a traditional plant.
• Power plants that use carbon capture and sequestration (CCS) remove the carbon dioxide generated during combustion and send the CO2 via pipeline where it is injected into underground reservoirs.
• Integrated coal gasification cycle (IGCC) is an advanced power plant technology that uses gas produced from coal that reduces air pollution emissions and improves fuel efficiency.
• Pulverized coal (PC) refers to a coal plant that burns coal more rapidly and efficiently due to the use of very finely ground (pulverized) coal.

H OW C A N F U T U R E P R O B L E M S W I T H O R P H A N E D
S H A L E G AS W E L L S B E AVO I D E D ?
In the later stages of a shale gas well’s life, producing wells decline in value. Eventually the cost to properly plug and abandon a nonproducing well and restore the surface of the site exceeds the remaining economic potential of the well.
To create an economic incentive for compliance with well abandonment laws, most states and the federal government now require well owners to provide financial assurance, usually in the form of collateral, performance bonds or sureties.
Typical policies require a minimum financial guarantee that is based on the number of wells and, sometimes, on a per operator basis. It is common for the minimum amount to be substantially less than the cost to properly plug and abandon a well site.
If a lack of financial resources precludes timely plugging of nonproducing shale gas wells, the risks to the integrity of the well casing increase, and unintentional pathways for the movement of fluids, particularly methane, may form. Failure to restore the surface environment has long-term impacts on ecosystems and will enhance the negative effects of forest fragmentation.
W H AT H AV E C A R N EG I E M E L LO N U N I V E R S I T Y R E S E A R C H E R S F O U N D
A B O U T T H E E C O N O M I C S O F S H A L E G AS W E L L A B A N D O N M E NT ?
A team of Carnegie Mellon University researchers has been studying economic incentives for environmental reclamation regulatory compliance in the Marcellus shale region of Pennsylvania. So far, they have found the following:
• Without accurate data on the producing status of a well, regulators lack the necessary information to monitor compliance with environmental reclamation requirements. The production status of more than 17,000 wells in Pennsylvania subject to the state’s financial assurance requirements is not known.
• The cost of reclaiming a single well site is estimated to be between $100,000 and $700,000. Currently the amount of money required under Pennsylvania’s financial assurance program is capped at $10,000 per well or $600,000 per operator.
• Regulators in Pennsylvania do not have the authority to prevent the sale of shale gas wells to entities with insufficient financial resources to cover expected liabilities. Modern Marcellus Shale gas wells may produce gas for decades, but production drops to marginal volumes of gas and liquids after the first 5–10 years. It is the industry norm for gas producing assets (including wells) to change ownership multiple times, but as these assets decline in value, owners tend to have lower financial capacity to undertake reclamation activities.
• With 90,000 shale gas wells expected in the coming decades, the amount of money held in performance bonds and sureties will be much smaller than the billions of dollars in unfunded environmental liabilities that will accrue over the same time. If the money recovered by foreclosing on performance bonds or other assets is insufficient to cover these liabilities, the balance of the financial burden falls to states and their taxpayers.
19

20
Producing Well Before Intermediate Reclamation Producing Well After Intermediate ReclamationPhoto Credit: Austin Mitchell, Carnegie Mellon University
A Personal Perspective….
“I believe that Pennsylvania’s current financial assurance requirements are too small to shield
taxpayers from billions of dollars in currently unfunded environmental liabilities. Establishing
designated trust accounts and funding them by fees or production taxes during periods of
highest production is an efficient way to ensure adequate resources exist in the future.”
CARNEGIE MELLON UNIVERSITY RESEARCHER Austin Mitchell
W H AT K EY QU E ST I O N S A B O U T S H A L E G AS A N D T H E E C O N O M I C S
O F S H A L E G AS W E L L A B A N D O N M E NT A R E U N A N S W E R E D ?
• What is the long-term reliability of cement plugs and casing in abandoned wells? What water and/or air monitoring would be required to efficiently identify problems?
• What changes in current environmental policy and implementation could minimize a future abandoned shale gas well problem in Western Pennsylvania?

Recommendation

R E C O M M E N DAT I O N F O R G OV E R N M E NT – U N I V E R S I T Y – I N D U ST RY
S H A L E G AS R E S E A R C H I N I T I AT I V E
Carnegie Mellon University researchers recommend that federal, state and/or regional governments launch a government–university–industry initiative to engage in broad environmental monitoring, coupled with research, to understand the meaning of collected data, and to develop support tools to enable data-informed decisions regarding development of shale resources. By working together, researchers, policymakers and industrial partners can provide information to the public that is unbiased and informed by science and engineering. Each member of the initiative should provide financial and/or human resources so the goals can be reached.
W H Y D O C A R N EG I E M E L LO N U N I V E R S I T Y R E S E A R C H E R S B E L I E V E
A S H A L E G AS G OV E R N M E NT – U N I V E R S I T Y – I N D U ST RY R E S E A R C H
I N I T I AT I V E I S N E C E S SA RY ?
Carnegie Mellon University’s researchers believe a shale gas government–university–industry research initiative is necessary because:
• Insufficient research is in place to assess the impact of shale gas operations. Monitoring is a good illustration. In Pennsylvania there are just over 100 surface water monitoring stations for 86,000 miles of rivers and streams and almost 4,000 lakes, reservoirs and ponds—yet approximately 60% of Pennsylvania’s land mass, 95,000 square miles, is included in the Marcellus Shale geological formation, and many of its water resources lie within this region.xiii Similarly, an analysis by the Maryland Department of Natural Resources indicates that their staff and citizen volunteers are currently collecting data from 82 stream reaches, which account for less than 15% of the total number of stream reaches in one county (Garrett) that could be affected by Marcellus Shale natural gas development.xiv Further, the insufficient funding of research on this topic emphasizes the need for communication amongst researchers to avoid duplicating efforts. An initiative will provide an opportunity to enhance these communications.
• A government–university–industry initiative, if properly designed and implemented, can provide a “firewall” between the funding of research and the research priorities, activities and results and can set a common basis for conflict of interest policies and requirements. Although most Americans favor shale gas development and believe it is possible to develop these reserves without environmental damage, a large and vocal percentage also are not sure or believe it is impossible to do so while protecting the environment. As discussed in the data presented earlier, scientists and researchers are those most trusted by the public to assess shale gas activities. If those assessments, however, are funded directly by industry or if researchers have ties to that industry, that trust dissipates as has been illustrated in several situations related to shale gas research.xv
• Policymakers who make decisions regarding shale gas development policy face a very complex system of economic, environmental, regulatory, social, business and job implications for any decision that they make regarding shale gas exploration and production.xvi Each of these elements, and the risk and uncertainties associated with them, must be assessed as a system to enhance policymaker decision making. In addition, the research conducted by universities may not align well with the information needs of federal, state and local leadership and regulatory staff due to insufficient communication and research priority-setting relative to policymaker needs.
• Industry initiation and leadership are the key criteria for a successful government-university-industry research initiative according to a National Academies study of similar efforts.xxv Other important criteria, according to the study, are limited and defined public commitments, clear objectives, cost sharing, sustained measurable outcome evaluations, and application of the lessons learned to enhance program operations.
22
W H AT I S A G OV E R N M E NT – U N I V E R S I T Y – I N D U ST RY
R E S E A R C H I N I T I AT I V E ?
A government–university–industry research initiative occurs when each of these organizations works collaboratively together to provide a public good—in this case research that will benefit the public. Foundations may also play a major role in the initiative. Such initiatives generate new knowledge and learning by pooling of capital, personnel and funding resources. They are typically formed for a variety of reasons such as:
• Productivity – greater ability to transform limited resources into improved results,
• Information – greater access to information to make a program more effective,
• Legitimacy – enhanced credibility of a project, and
• Resources – greater access to diverse financial resources from private firms and individuals.xvii
In the case of shale gas and the environment, all these reasons apply. The financial and human resources of each of these entities—government, university, industry and foundations—are limited. By pooling their resources, they can realize productivity gains. Each entity also has access to data that can be usefully pooled together to provide the information policymakers need. The legitimacy of each with the public, as illustrated by the poll data, also varies, so there can be enhanced credibility through an initiative. Finally, while private individuals and organizations such as foundations may find it challenging to provide financial resources to industry and government, they can easily provide such resources to a nonprofit organization such as a research initiative.
The concept of a research initiative formed around a particular industry is not a new one. Some examples include the following:
• Electric Power Research Institute (EPRI)—a non-profit organization chartered in 1972 as an independent research organization to conduct research and development relating to the generation, delivery and use of electricity for the benefit of the public. EPRI’s members represent approximately 90% of the electricity generated and delivered in the United States, and international participation extends to more than 30 countries. Council members represent state utility regulatory commissions (10 members) and other industry stakeholders such as environmental organizations, experts on energy and technology policy, and the financial and academic communities. In 2011, half of EPRI’s $360 million budget came from membership dues with the remaining half from other sources including U.S. federal agencies.xviii
• Gas Technology Institute (GTI)—a nonprofit corporation chartered in 2000 that combined the Institute of Gas Technology (founded in 1941) with the Gas Research Institute (founded in 1976). GTI is a research, development and training organization that works with its customers to find, produce, move, store and use natural gas. Customers include energy industry companies, equipment manufacturers, government agencies and other organizations. Until 2004, some of GTI’s funding came from a Federal Energy Regulatory Commission (FERC) approved surcharge on natural gas pipelines. GTI’s 2011 program budget of approximately $60 million came from 170 organizations including federal and state agencies, natural gas and pipeline companies, blue-chip industrial companies, electric utilities and independent power producers, technology developers, national laboratories, equipment manufacturers and private equity-backed energy companies.xx
• Research Partnership to Secure Energy for America (RPSEA)—a nonprofit corporation established in Texas focused on industry-led cooperative research and development work to help commercialize domestic ultra-deepwater and unconventional onshore hydrocarbon resources. RPSEA operates under the guidance of the Secretary of Energy
23
and began its research activities in 2007 after its establishment in response to the Title IX, Subtitle J EPAct of the Energy Policy Act of 2005, which directed that $50 million per year of federal royalties, rents and bonus payments be used to fund an oil and natural gas R&D effort. The National Energy Technology Laboratory (NETL) is responsible for implementation of the program. Its membership includes commercial energy companies, national laboratories, academic institutions, non-governmental organizations, industry trade associations, and federal and state agencies.xxi
An alternative or addition to a national level initiative is a regional or state initiative. Each initiative could operate independently, or it could be scaled up to be part of a national network with substantial interaction amongst the regions. Provided below is information on several existing proposed initiatives:
• National Energy Technology Laboratory–Regional University Alliance (NETL-RUA) has a mission “To support the environmentally and socially sustainable development of shale resources through collaborative research and development among industry, university and government partners on: resource characterization; drilling and extraction technology; near-term and cumulative environmental and social impacts; and empirically supported policy.”xxii Universities in Pennsylvania, Virginia and West Virginia are part of this alliance as well as industry.
• The Ben Franklin Technology Partners Shale Gas Innovation and Commercialization Center fosters partnerships among universities and industries in Pennsylvania with the goal of funding research in energy, clean technology and related fields that have commercial potential.
• The “Shale Alliance for Energy Research” is a proposal to focus on the state of Pennsylvania with a program managed by GTI. Its proposed mission is to “engage government, natural gas producers, providers of services and other stakeholders to ensure the safe development of shale gas resources in the State of Pennsylvania.” It would develop new technology, analysis and education to assist in the safe and dependable development of Pennsylvania’s shale gas resources, and provide this information to stakeholders and policymakers.
• A University of Pittsburgh Institute of Politics Shale Gas Roundtable study on Shale Gas Research, co-chaired by Carnegie Mellon University President Jared Cohon and James Roddey, partner, Parente Beard and former Allegheny County chief executive, systematically analyzed a number of options to respond to the need for shale gas research and decided, based on the need for a credible research in this controversial area, that the Health Effects Institute (HEI) was especially well-suited to lead a regional research fund that would focus on unconventional geological formations found in the Appalachian Basin, which includes New York, Pennsylvania, Ohio, West Virginia and Kentucky.
The HEI was designed from its inception to apply government, university, and industry resources in a manner that ensures the highest level of credibility and trust. HEI, which was initiated in 1980 and receives its core balanced funding in equal measure from the US Environmental Protection Agency and industry (the motor vehicle, oil, chemical and other industries). Its independent Board and scientific committees oversee a targeted program of research on air pollution and health of approximately $12 million per year, which is relied upon by both government and regulatory agencies for major, often controversial decisions. xix The Roundtable recommended this shale gas research program include:
• Diverse funding streams (including state and federal governments, industry and private philanthropy);
• Regularly updated 5-year strategic plans, scientifically rigorous, and peer-reviewed research transparency;
24
• Strong government and stakeholder relationships;
• Support of informed policy on use of state-of-the art science to inform but not recommend policy;
• Ability to quickly synthesize available information on pressing shale gas, connected to and aware of prior shale gas research;
• Adequate initial funding support of $4–7 million per year in the early years (with later budgets growing to meet the needs identified in the multi-year plan). xxiii
Although this review focused on the Marcellus Shale region and Pennsylvania, similar effortsmay well be occurring in other shale gas regions.
W H AT A P P R OAC H S H O U L D B E TA K E N TO T H E R E S E A R C H I N I T I AT I V E ?
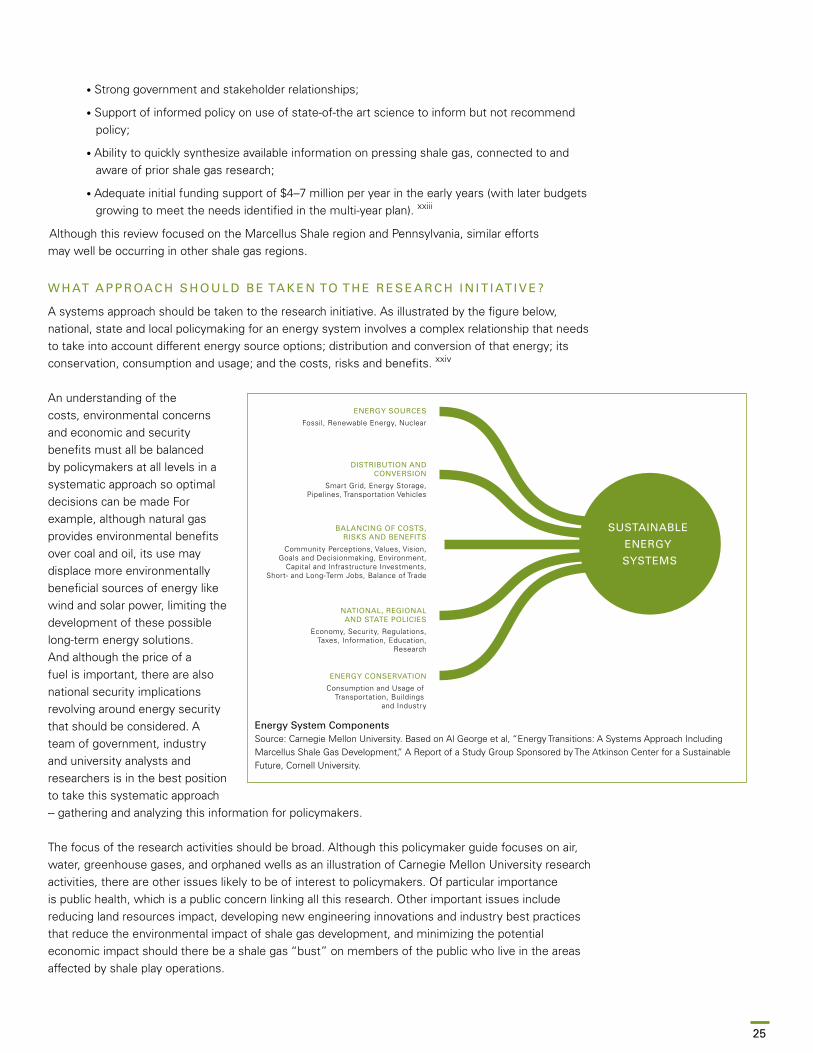
A systems approach should be taken to the research initiative. As illustrated by the figure below, national, state and local policymaking for an energy system involves a complex relationship that needs to take into account different energy source options; distribution and conversion of that energy; its conservation, consumption and usage; and the costs, risks and benefits. xxiv
An understanding of the costs, environmental concerns and economic and security benefits must all be balanced by policymakers at all levels in a systematic approach so optimal decisions can be made For example, although natural gas provides environmental benefits over coal and oil, its use may displace more environmentally beneficial sources of energy like wind and solar power, limiting the development of these possible long-term energy solutions. And although the price of a fuel is important, there are also national security implications revolving around energy security that should be considered. A team of government, industry and university analysts and researchers is in the best position to take this systematic approach -- gathering and analyzing this information for policymakers. The focus of the research activities should be broad. Although this policymaker guide focuses on air, water, greenhouse gases, and orphaned wells as an illustration of Carnegie Mellon University research activities, there are other issues likely to be of interest to policymakers. Of particular importance is public health, which is a public concern linking all this research. Other important issues include reducing land resources impact, developing new engineering innovations and industry best practices that reduce the environmental impact of shale gas development, and minimizing the potential economic impact should there be a shale gas “bust” on members of the public who live in the areas affected by shale play operations.
ENERGY SOURCES
Fossil, Renewable Energy, Nuclear
DISTRIBUTION ANDCONVERSION
Smart Grid, Energy Storage,Pipelines, Transportation Vehicles
BALANCING OF COSTS,RISKS AND BENEFITS
Community Perceptions, Values, Vision,Goals and Decisionmaking, Environment,
Capital and Infrastructure Investments,Short- and Long-Term Jobs, Balance of Trade
NATIONAL, REGIONALAND STATE POLICIES
Economy, Security, Regulations,Taxes, Information, Education,
Research
ENERGY CONSERVATION
Consumption and Usage of Transportation, Buildings
and Industry
SUSTAINABLE
ENERGY
SYSTEMS
Energy System Components Source: Carnegie Mellon University. Based on Al George et al, “Energy Transitions: A Systems Approach Including Marcellus Shale Gas Development,” A Report of a Study Group Sponsored by The Atkinson Center for a Sustainable Future, Cornell University.
25
26
H OW W I L L T H E R E S E A R C H I N I T I AT I V E WO R K ?
The five steps in this process are:
(1) Develop Prioritized Research Agenda: a key element to ensure the independence of researchers is to keep a “firewall” between those funding the research and those conducting the research. So although sponsor views as to the appropriate research agenda would be solicited at the beginning of the process, an independent board will develop the criteria for determining which questions researchers will address and prioritizing the research agenda for the initiative. (2) Prioritize Proposals for Support: An anonymous committee of experts reviews the proposals received from researchers based on their merit and proximity to the approved research agenda (3) Monitor Funded Research: This includes site visits by initiative staff and expert reviewers; encouraging interaction among researchers through conferences, workshops, and symposia; conducting another expert review process once the penultimate report is completed; and then responding to those review comments as the report is finalized. (4) Communicate Research Results to Policymakers: The report is released to the public with a summary that interprets the report results to policymakers including the unresolved reviewer critiques and policymakers are briefed. (5) Policymaker Feedback to Initiative Board: Policymakers will be provided an opportunity to indicate whether or not existing research products meet their needs and to provide their perspective on future research priorities including their unanswered questions.
Taking these steps should fill critical gaps in knowledge at the interface of shale gas development and environmental protection while maintaining the independence of researchers, setting research funding priorities based on sponsor input, funding research of the highest quality and relevance to the initiative’s goals, monitoring that research to ensure the desired outcome is reached, communicating results to policymakers in an easy-to-understand report, and providing a mechanism for policymakers to let the initiative’s board knows whether or not their analysis and information needs are being satisfied.
A Personal Perspective…
“The primary challenge in establishing a new government–university–industry initiative is
industry leadership. If the top leadership of one major company takes the initial lead, and
recruits others, then the partnership has the potential of moving forward successfully.
CARNEGIE MELLON UNIVERSITY RESEARCHER Deborah D. Stine

ConclusionShale gas production is increasing at a rapid
rate and is expected to become half of the U.S.
natural gas supply by 2040. A government–
university–industry research initiative is needed
to fill critical gaps in knowledge at the interface
of shale gas development and environmental
protection so the nation can better prepare for
its energy future.
F O R M O R E I N F O R M AT I O N
This document is available from the Scott Institute for Energy Innovation website at www.cmu.edu/energy. If you have questions about this document, please contact Dr. Deborah Stine, associate director for policy outreach, Scott Institute at [email protected]. In addition, a Carnegie Mellon University research guide for the public on the Marcellus and Utica shale play is available at: www.andrew.cmu.edu/org/marcellus-biblio/
N OT E S
i Centre for Global Environmental Studies, “What is Shale Gas?,” July 2010 at www.cges.co.uk/resources/articles/2010/07/22/what-is-shale-gas.
ii Eagle Ford Shale Blog, “What is a Shale Gas Play?,“ at eaglefordshaleblog.com/2010/03/03/what-is-a-shale-gas-play/.
iii Bill Chameides, “Fracking in Pennsylvania: A Boom That’s Fizzling?,” Huffington Post, July 30, 2012 at www.huffingtonpost.com/bill-chameides/fracking-in-pennsylvania_b_1647176.html.
iv IHS Global Insight, “America’s New Energy Future: The Unconventional Oil and Gas Revolution and the US Economy,” October 2012, at www.ihs.com/info/ecc/a/americas-new-energy-future.aspx. This study was sponsored by American Petroleum Institute, Institute for 21st Century Energy, the American Chemical Council, and the Natural Gas Supply Association.
v Baker Institute Policy Report“Shale Gas and U.S. National Security,” James A. Baker III Institute for Public Policy of Rice University, October 2011 at www.bakerinstitute.org/publications/EF-pub-PolicyReport49.pdf.
vi The Rasmussen poll data is available at: www.rasmussenreports.com/public_content/business/gas_oil/march_2012/57_favor_use_of_fracking_to_find_more_u_s_oil_and_gas and www.rasmussenreports.com/public_content/business/gas_oil/march_2012/63_say_shale_oil_development_possible_without_hurting_the_environment.
vii www.pittsburghtoday.org/special_marcellus_brief.html.
viii Adopted from Alter et al, “Baseline Socioeconomic Analysis for the Marcellus Shale Development in Pennsylvania,” A project funded by the Appalachian Regional Commission to The Institute for Public Policy & Economic Development at Wilkes University, August 31, 2010 at www.institutepa.org/PDF/Marcellus/MarcellusShaleStudy08312010.pdf based on personal communication with F.K. Willits, Distinguished Professor, Emerita, Pennsylvania State University on February 22, 2013.
ix Government Accountability Office (GAO), “Oil and Gas: Information on Shale Resources, Development, and Environmental and Public Health Risks,” September 2012, GAO-12-732 at www.gao.gov/products/GAO-12-732.
x According to the International Energy Administration, this is “Seek opportunities for realising the economies of scale and co-ordinated development of local infrastructure that can reduce environmental impacts.” And “Take into account the cumulative and regional effects of multiple drilling, production and delivery activities on the environment, notably on water use and disposal, land use, air quality, traffic and noise.” See xi for more details.
xi International Energy Administration, “Are We Entering a Golden Age of Gas?,” June 2011 at www.worldenergyoutlook.org/goldenageofgas/.
28
xii Adapted from U.S. Environmental Protection Agency, “The Hydraulic Fracturing Water Cycle,” at www.epa.gov/hfstudy/hfwatercycle.html.
xiii State of Pennsylvania, “Draft 2012 Pennsylvania Integrated Water Quality Monitoring and Assessment Report” at files.dep.state.pa.us/Water/Drinking%20Water%20and%20Facility%20Regulation/WaterQualityPortalFiles/2012%20Integrated%20List/2012%20Pennsylvania%20Integrated%20Water%20Quality%20Monitoring%20and%20Assessment%20Report.pdf.
xiv State of Maryland at www.dnr.state.md.us/streams/marcellus.asp.
xv Terrence Henry, “Review of UT Fracking Study Finds Failure to Disclose Conflict of Interest,” State Impact National Public Radio, December 6, 2012 at stateimpact.npr.org/texas/2012/12/06/review-of-ut-fracking-study-finds-failure-to-disclose-conflict-of-interest/.
xvi Al George et al, “Energy Transitions: A Systems Approach Including Marcellus Shale Gas Development,” A Report of a Study Group Sponsored by The Atkinson Center for a Sustainable Future, Cornell University at cce.cornell.edu/EnergyClimateChange/NaturalGasDev/Documents/PDFs/Systems%20Research%20-%20Energy%20Transitions%20_v1%208%2025%2011a.pdf
xvii John D. Donahue and Richard J. Zeckhauser, Collaborative Governance, Princeton University Press, 2011.
xviii “Governance,” at http://www.epri.com/About-Us/Pages/Governance.aspx Budget information is from EPRI’s 2011 audit at mydocs.epri.com/docs/CorporateDocuments/Governance/EPRI_FY_2011_Financial_Statements.pdf.
xix “What is the Health Effects Institute,” at www.healtheffects.org/about.htm. Budget information is from HEI’s 2011 annual report at pubs.healtheffects.org/getfile.php?u=684.
xx “About GTI” at http://www.gastechnology.org/About/Pages/default.aspx. Budget information is from GTI’s 2011 annual report at http://www.gastechnology.org/news/Documents/Annual_Reports/GTI_AnnualReport2011_fnl_lowres.pdf
xxi U.S. Department of Energy, “2012 Annual Plan: Ultra-Deepwater and Unconventional Natural Gas and Other Petroleum Resources Research and Development Program: Report to Congress,” August 2012 at www.rpsea.org/attachments/contentmanagers/3234/2012%20Annual%20Plan%20Final%208-9-12.pdf.
xxii NETL-RUA, “Shale Energy Resources Alliance (SERA)” at www.netl.doe.gov/publications/factsheets/rd/R%26D181.pdf.
xxiii University of Pittsburgh Institute of Politics Shale Gas Roundtable, “Shale Gas Research Fund Proposal”, December 2012.
xxiv Al George et al, “Energy Transitions: A Systems Approach Including Marcellus Shale Gas Development,” A Report of a Study Group Sponsored by The Atkinson Center for a Sustainable Future, Cornell University at cce.cornell.edu/EnergyClimateChange/NaturalGasDev/Documents/PDFs/Systems%20Research%20-%20Energy%20Transitions%20_v1%208%2025%2011a.pdf.
xxv National Research Council, “Government–Industry Partnerships for the Development of New Technologies,” 2002.
29

Wilton E. Scott Institute
for Energy Innovation
5000 Forbes Avenue
Pittsburgh, PA 15213
412-268-2000
March 2013
cmu.edu/energy