shallow intraplate earthquakes in western australia...
TRANSCRIPT

Shallow intraplate earthquakes in Western Australia observed
by Interferometric Synthetic Aperture Radar
John Dawson,1,2 Phil Cummins,1 Paul Tregoning,2 and Mark Leonard1
Received 16 May 2008; revised 20 August 2008; accepted 18 September 2008; published 20 November 2008.
[1] We investigate two intraplate earthquakes in a stable continental region of southwestWestern Australia. Both small-magnitude events occur in the top �1 km of crust andtheir epicenters are located with an accuracy of �100 m (1s) using satellite InterferometricSynthetic Aperture Radar (InSAR). For the Mw 4.7 Katanning earthquake (10 October2007) the average slip magnitude is 42 cm, over a rupture area of �1 km2. This implies ahigh static stress drop of 14–27 MPa, even for this very shallow earthquake, whichmay have important implications for regional seismic hazard assessment. The earthquakerupture extends from a depth of around 640 m to the surface, making it a rarelyobserved intraplate, surface-rupturing event. Using InSAR observations, we estimate thecoseismic slip distribution of the shallow earthquake, such estimates being rarelyavailable for small magnitude events. For the Mw 4.4 composite Kalannie earthquakesequence (21–22 September 2005), we use a long-term time series analysis technique toimprove the measurement of the co-seismic signal, which is a maximum of 27 mm in theline-of-sight direction. Double difference seismic analysis shows some relocatedcluster seismicity which corresponds in timing, location, and source parameters to theInSAR-observed deformation. This earthquake is the smallest magnitude seismic event tohave been investigated using InSAR and demonstrates the capability of the techniqueto provide important constraints on small-magnitude coseismic events. The shallowdepth of both these events adds weight to the suggestion that earthquakes associatedwith tectonic processes in this area of Western Australia often initiate in the upper 1 kmof crust.
Citation: Dawson, J., P. Cummins, P. Tregoning, and M. Leonard (2008), Shallow intraplate earthquakes in Western Australia
observed by Interferometric Synthetic Aperture Radar, J. Geophys. Res., 113, B11408, doi:10.1029/2008JB005807.
1. Introduction
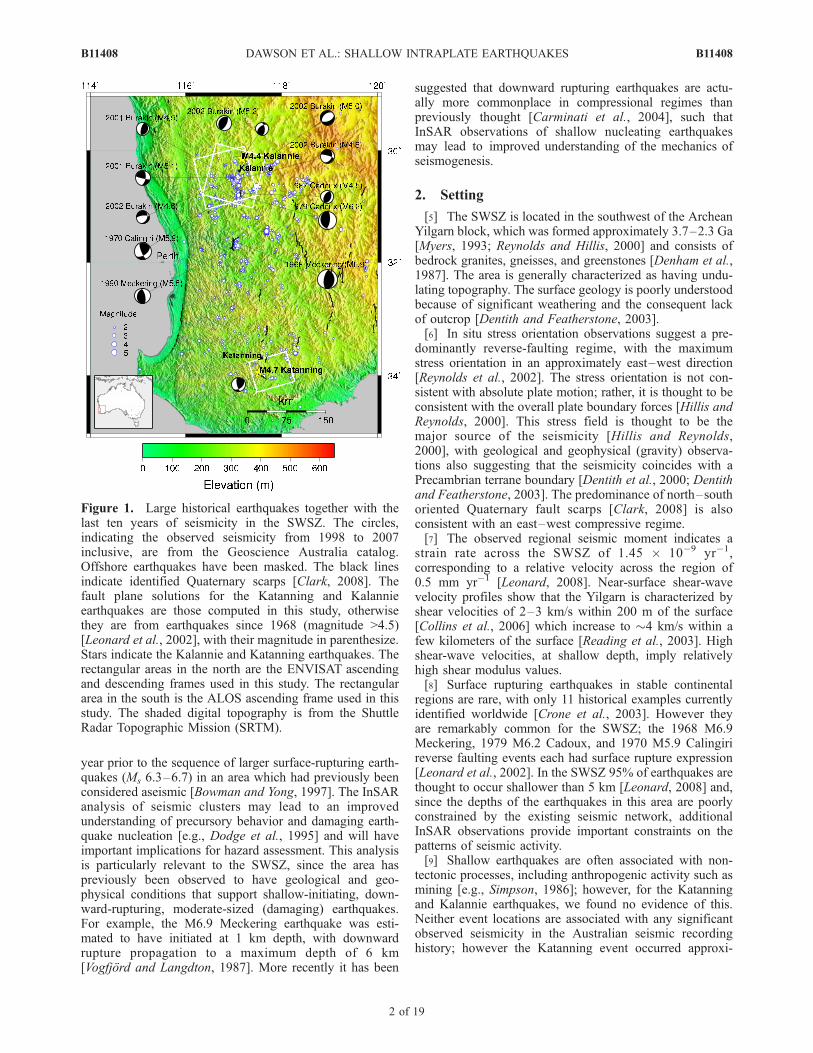
[2] The South West Seismic Zone (SWSZ), located in thesouthwest region of Western Australia (WA), is an area ofconcentrated intraplate earthquake activity within a recog-nized stable continental region [Crone et al., 1997]. In thelast 40 yr, the area has experienced a number of damagingintraplate earthquakes, including the M6.9 1968 Meckering[Everingham et al., 1969] and the M6.2 1979 Cadouxearthquakes [Denham et al., 1987], as well as a numberof other significant damaging earthquakes [Leonard et al.,2002] (Figure 1). The SWSZ is near to the Perth populationcenter of 1.5 million people. Consequently, the area hassignificant seismic risk and hazard mitigation efforts willbenefit from an improved understanding of the observedseismicity. In this study, we undertook elastic dislocationmodeling, using satellite Interferometric Synthetic Aperture
Radar (InSAR) data, of two shallow earthquakes, includingthe Mw 4.4 (composite) Kalannie earthquakes (21–22September 2005) and the Mw 4.7 Katanning earthquake(10 October 2007).[3] For the Katanning earthquake we also investigated the
distribution of slip on the fault plane. The investigation ofshallow earthquakes and seismic cluster events in the SWSZmay provide insight into the larger, more damaging but lessfrequent earthquakes. For these events, the InSAR dataprovide significantly more accurate estimates of earthquakelocation, depth, and source parameters [Dawson andTregoning, 2007] than those derived from the sparseAustralian National Seismograph Network [Leonard,2008], and add to the understanding of deformation inthe uppermost crust, which subsequently has importantimplications for the predictions of the intensity of groundshaking [e.g., Fialko et al., 2005].[4] Small-magnitude seismic clusters in Australia have
previously been found to represent foreshock behavior ofmoderate-sized earthquakes. For example in Tennant Creek,in the Northern Territory of Australia, a precursory clusterof spatially concentrated earthquakes (M4–5) occurred a
JOURNAL OF GEOPHYSICAL RESEARCH, VOL. 113, B11408, doi:10.1029/2008JB005807, 2008ClickHere
for
FullArticle
1Geoscience Australia, Canberra, ACT, Australian National University,Canberra, Australia.
2Research School of Earth Sciences, Australian National University,Canberra, ACT, Australia.
Copyright 2008 by the American Geophysical Union.0148-0227/08/2008JB005807$09.00
B11408 1 of 19
year prior to the sequence of larger surface-rupturing earth-quakes (Ms 6.3–6.7) in an area which had previously beenconsidered aseismic [Bowman and Yong, 1997]. The InSARanalysis of seismic clusters may lead to an improvedunderstanding of precursory behavior and damaging earth-quake nucleation [e.g., Dodge et al., 1995] and will haveimportant implications for hazard assessment. This analysisis particularly relevant to the SWSZ, since the area haspreviously been observed to have geological and geo-physical conditions that support shallow-initiating, down-ward-rupturing, moderate-sized (damaging) earthquakes.For example, the M6.9 Meckering earthquake was esti-mated to have initiated at 1 km depth, with downwardrupture propagation to a maximum depth of 6 km[Vogfjord and Langdton, 1987]. More recently it has been
suggested that downward rupturing earthquakes are actu-ally more commonplace in compressional regimes thanpreviously thought [Carminati et al., 2004], such thatInSAR observations of shallow nucleating earthquakesmay lead to improved understanding of the mechanics ofseismogenesis.
2. Setting
[5] The SWSZ is located in the southwest of the ArcheanYilgarn block, which was formed approximately 3.7–2.3 Ga[Myers, 1993; Reynolds and Hillis, 2000] and consists ofbedrock granites, gneisses, and greenstones [Denham et al.,1987]. The area is generally characterized as having undu-lating topography. The surface geology is poorly understoodbecause of significant weathering and the consequent lackof outcrop [Dentith and Featherstone, 2003].[6] In situ stress orientation observations suggest a pre-
dominantly reverse-faulting regime, with the maximumstress orientation in an approximately east–west direction[Reynolds et al., 2002]. The stress orientation is not con-sistent with absolute plate motion; rather, it is thought to beconsistent with the overall plate boundary forces [Hillis andReynolds, 2000]. This stress field is thought to be themajor source of the seismicity [Hillis and Reynolds,2000], with geological and geophysical (gravity) observa-tions also suggesting that the seismicity coincides with aPrecambrian terrane boundary [Dentith et al., 2000; Dentithand Featherstone, 2003]. The predominance of north–southoriented Quaternary fault scarps [Clark, 2008] is alsoconsistent with an east–west compressive regime.[7] The observed regional seismic moment indicates a
strain rate across the SWSZ of 1.45 � 10�9 yr�1,corresponding to a relative velocity across the region of0.5 mm yr�1 [Leonard, 2008]. Near-surface shear-wavevelocity profiles show that the Yilgarn is characterized byshear velocities of 2–3 km/s within 200 m of the surface[Collins et al., 2006] which increase to �4 km/s within afew kilometers of the surface [Reading et al., 2003]. Highshear-wave velocities, at shallow depth, imply relativelyhigh shear modulus values.[8] Surface rupturing earthquakes in stable continental
regions are rare, with only 11 historical examples currentlyidentified worldwide [Crone et al., 2003]. However theyare remarkably common for the SWSZ; the 1968 M6.9Meckering, 1979 M6.2 Cadoux, and 1970 M5.9 Calingirireverse faulting events each had surface rupture expression[Leonard et al., 2002]. In the SWSZ 95% of earthquakes arethought to occur shallower than 5 km [Leonard, 2008] and,since the depths of the earthquakes in this area are poorlyconstrained by the existing seismic network, additionalInSAR observations provide important constraints on thepatterns of seismic activity.[9] Shallow earthquakes are often associated with non-
tectonic processes, including anthropogenic activity such asmining [e.g., Simpson, 1986]; however, for the Katanningand Kalannie earthquakes, we found no evidence of this.Neither event locations are associated with any significantobserved seismicity in the Australian seismic recordinghistory; however the Katanning event occurred approxi-
Figure 1. Large historical earthquakes together with thelast ten years of seismicity in the SWSZ. The circles,indicating the observed seismicity from 1998 to 2007inclusive, are from the Geoscience Australia catalog.Offshore earthquakes have been masked. The black linesindicate identified Quaternary scarps [Clark, 2008]. Thefault plane solutions for the Katanning and Kalannieearthquakes are those computed in this study, otherwisethey are from earthquakes since 1968 (magnitude >4.5)[Leonard et al., 2002], with their magnitude in parenthesize.Stars indicate the Kalannie and Katanning earthquakes. Therectangular areas in the north are the ENVISAT ascendingand descending frames used in this study. The rectangulararea in the south is the ALOS ascending frame used in thisstudy. The shaded digital topography is from the ShuttleRadar Topographic Mission (SRTM).
B11408 DAWSON ET AL.: SHALLOW INTRAPLATE EARTHQUAKES
2 of 19
B11408

mately 3 km northeast from the termination of a previouslyidentified Quaternary scarp (Figure 2) [Clark, 2008].
3. InSAR Observations and Analysis
3.1. Data
[10] The co-seismic deformation field associated with theKatanning earthquake was observed using the ALOS,
Phased Array type L-band Synthetic Aperture Radar (PAL-SAR), instrument. Routine ALOS observations have beenmade of the Australian continent since the satellite’s launchin 2006 and the Katanning event (10 October 2007) wasthe first significant shallow seismic event since then.The deformation from the Katanning earthquake wasbest resolved using acquisitions from 8 September 2007(orbit 8643) and 24 October 2007 (orbit 9314), when thePALSAR instrument was operating in Fine Beam Double(FBD) mode (frame 6490). The perpendicular baselinebetween the repeat-pass satellite trajectories was 423 m (B?).[11] The investigation of the Kalannie earthquake se-
quence was undertaken in a time series analysis scheme,using routinely acquired ENVISAT, Advanced SyntheticAperture Radar (ASAR), C-Band data. This data setincludes 24 descending and 14 ascending passes, observedfrom November 2004 to August 2007 (Tables 1 and 2).
3.2. InSAR Analysis
[12] The SWSZ is generally well suited to the observationof surface deformation by satellite-based InSAR techniques[e.g., Massonnet and Feigl, 1995; Feigl, 2002], as the areahas small undulating topography and minimal vegetationcover because of the dry climate (rainfall of �350 mm/yr,source: www.bom.gov.au). This cover commonly consistsof annual low-growing crops, including wheat and barley,and the associated agricultural activity often reduces theInSAR observation quality.[13] We formed interferograms from Single Look Com-
plex (SLC) products using an in-house modified version ofthe DORIS software (i.e., DORIS with an added ALOScapability) [Kampes and Usai, 1999]. To improve thesignal-to-noise ratio the ALOS interferograms were down-sampled by a factor of 10 in azimuth and 2 in range,resulting in 30 � 30 m pixels. The ENVISAT interfero-grams were down-sampled by a factor of 5 in the azimuthcomponent (range was not down-sampled), resulting in20 � 20 m pixels. The topographic signal in the re-sampledinterferograms was reduced using the 3 arc sec digitalelevation model (DEM) from the Shuttle Radar TopographyMission (SRTM) [Farr et al., 2007]. The ALOS satelliteposition was modeled with the trajectory data availablewithin the PALSAR product metadata, while for ENVISATits position was modeled using the precise trajectory dataavailable from the Delft University of Technology [e.g.,Scharroo and Visser, 1998]. Any residual orbital error wasfurther minimized through the removal of a planar trendsurface from each computed interferogram.[14] The phase unwrapping was undertaken where possi-
ble with a conventional 2-D phase unwrapping approach[Chen and Zebker, 2001]. For interferograms where largepatches of low coherence, caused by agricultural activity,prevented reliable phase unwrapping with conventionalapproaches [e.g., Ghiglia and Pritt, 1998; Chen and Zebker,2001], we used in-house-developed software which imple-ments a sparse unwrapping technique. This software isbased on a Minimum Cost Flow (MCF) approach[Costantini and Rosen, 1999; Eineder and Holzner, 1999],where low-quality pixels are masked (for example, lowspatial coherence), the remaining data triangulated, residuesidentified and the data subsequently unwrapped along apreferred path.
Figure 2. The Mw 4.7 Katanning earthquake. (a) Aerialphotography with the observed interferogram as an overlay.The black line indicates the observed surface cracking andscarp feature (V. Dent, personal communication, 2007).Each fringe (or full color cycle) represents the line-of-sightrange change of one half of the radar instrument wavelength(i.e., 0.118 m), the wavelength of the radar data from theALOS PALSAR instrument was 0.236 m. The ascendingpass line-of-sight (target to satellite) unit vector was�0.596,�0.139, 0.792 in the east, north, and up components,respectively. The direction of the satellite trajectory andthe satellite-to-target direction is shown in red. (b) Theinterferogram with shaded digital topography and theidentified Quaternary scarps (black lines) are as per Figure 1.
B11408 DAWSON ET AL.: SHALLOW INTRAPLATE EARTHQUAKES
3 of 19
B11408
3.3. InSAR Time Series Analysis
[15] The Kalannie co-seismic deformation field wasrefined using an InSAR time series analysis approach.The technique was used to reduce the impact of residual-topography and atmospheric signals which, if left uncor-rected, can be important error sources when observingsmall deformation signals. The significant agriculturalactivity in the SWSZ poses an interesting challenge forthe time series analysis of InSAR data, since at relativelyregular intervals the entire surface is completely modified.Techniques such as persistent scatterer interferometry[Ferretti et al., 2000] can perform poorly in such con-ditions, as the method requires phase stable observationsover long time periods.[16] The InSAR time series analysis was undertaken
using in-house developed software which is based on amodified SBAS (i.e., Small BAseline Subset) technique[Berardino et al., 2002]. The adopted SBAS approach hasa number of advantages over other InSAR analysis methods.First, the technique allows the convenient combination ofmultiple interferometric pairs by implicitly reducing redun-dant observations into a temporal deformation series. Thisimplicit reduction step is important when seismic catalogspoorly constrain the epicenter and depth of small and remoteevents, which is often the case in Australia. Consequently itbecomes increasingly difficult to eliminate the possibility ofnon-tectonic phenomena, such as atmospheric signals, beinginterpreted as co-seismic deformation. Second, while in itssimplest implementation the SBAS approach does notenforce any a priori assumptions about temporal develop-ment of the deformation, it provides a framework forspatially variable, temporal smoothing. Third, the technique
mitigates decorrelation effects by using only highly corre-lated image pairs. Fourth, the data can be multilooked(down-sampled) making the technique computationallyefficient for analyzing large areas as compared to persistentscatterer techniques. Finally, the SBAS approach allows forthe modeling of residual topography errors. For example,the best quality interferometric pair (ENVISAT) spanningthe Mw 4.4 Kalannie earthquake, had a perpendiculardistance between the orbit trajectories (B?) of 140 m,corresponding to an altitude of ambiguity of 63 m. Atopography residual of 10 m corresponds to an error inthe observed line-of-sight deformation of 5 mm or �20%of the maximum co-seismic signal (see section 4.2 below).[17] In our analysis, the SBAS model is implemented as
[e.g., Cavalie et al., 2007]:
T 4pB?lr sin q
gK 0
� �v
hc
� �¼ dfð Þ; ð1Þ
where T is a matrix of reference time intervals, v is a vectorof the average velocity between each time step, hc is theresidual topography signal, and df is a vector of unwrappedphase change observations, l is the radar wavelength, r isthe satellite-to-target range, q is the incidence angle, g is asmoothing parameter, and K is a matrix of velocityparameter finite difference constraints [e.g., Schmidt andBurgmann, 2003].[18] In our modified approach the g parameter is allowed
to vary spatially and temporally, its value selected tooptimize the resolution of the small seismic signal. Forexample there is no temporal smoothing over co-seismicevents. We also incorporate interferograms with large B?values, up to �600 m, since the SWSZ has small topogra-phy and geometric decorrelation is a less important sourceof noise. An initial analysis step begins without anysmoothing constraint and, as the location and extent ofany deformation signal becomes apparent, we subsequentlyapply smoothing as appropriate. The parameters B?, r, and qare evaluated for each pixel and equation (1) was solved,
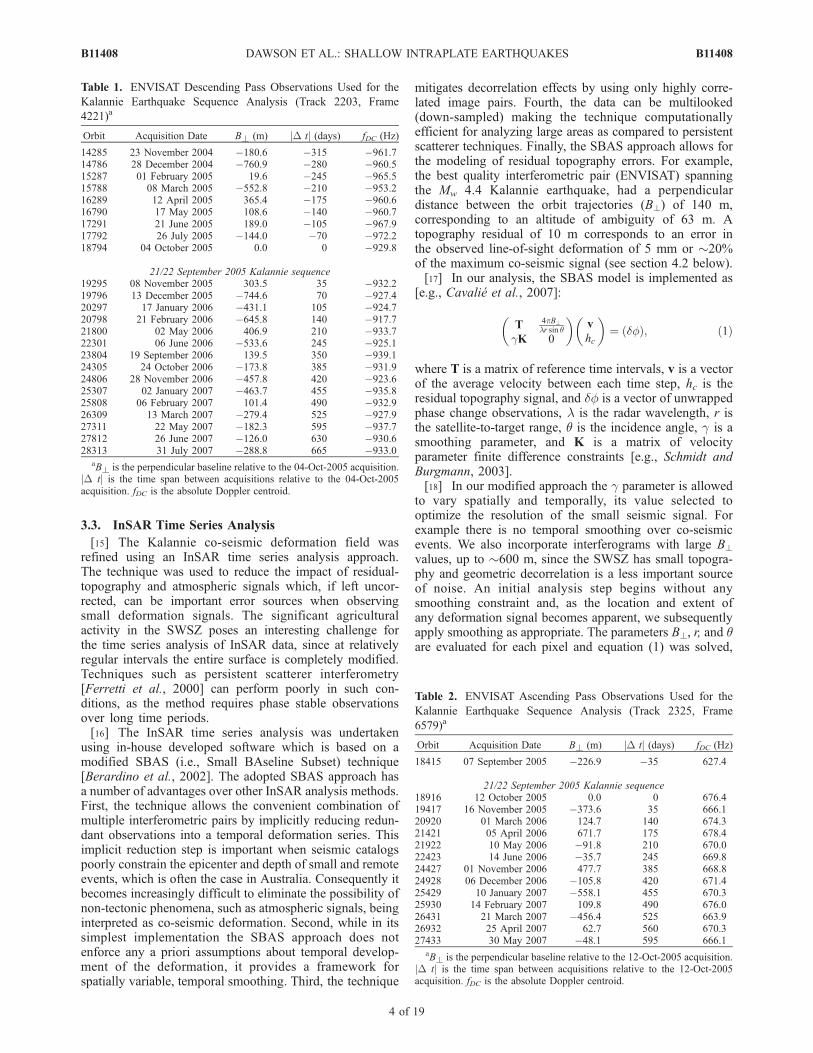
Table 1. ENVISAT Descending Pass Observations Used for the
Kalannie Earthquake Sequence Analysis (Track 2203, Frame
4221)a
Orbit Acquisition Date B? (m) jD tj (days) fDC (Hz)
14285 23 November 2004 �180.6 �315 �961.714786 28 December 2004 �760.9 �280 �960.515287 01 February 2005 19.6 �245 �965.515788 08 March 2005 �552.8 �210 �953.216289 12 April 2005 365.4 �175 �960.616790 17 May 2005 108.6 �140 �960.717291 21 June 2005 189.0 �105 �967.917792 26 July 2005 �144.0 �70 �972.218794 04 October 2005 0.0 0 �929.8
21/22 September 2005 Kalannie sequence19295 08 November 2005 303.5 35 �932.219796 13 December 2005 �744.6 70 �927.420297 17 January 2006 �431.1 105 �924.720798 21 February 2006 �645.8 140 �917.721800 02 May 2006 406.9 210 �933.722301 06 June 2006 �533.6 245 �925.123804 19 September 2006 139.5 350 �939.124305 24 October 2006 �173.8 385 �931.924806 28 November 2006 �457.8 420 �923.625307 02 January 2007 �463.7 455 �935.825808 06 February 2007 101.4 490 �932.926309 13 March 2007 �279.4 525 �927.927311 22 May 2007 �182.3 595 �937.727812 26 June 2007 �126.0 630 �930.628313 31 July 2007 �288.8 665 �933.0
aB? is the perpendicular baseline relative to the 04-Oct-2005 acquisition.jD tj is the time span between acquisitions relative to the 04-Oct-2005acquisition. fDC is the absolute Doppler centroid.
Table 2. ENVISAT Ascending Pass Observations Used for the
Kalannie Earthquake Sequence Analysis (Track 2325, Frame
6579)a
Orbit Acquisition Date B? (m) jD tj (days) fDC (Hz)
18415 07 September 2005 �226.9 �35 627.4
21/22 September 2005 Kalannie sequence18916 12 October 2005 0.0 0 676.419417 16 November 2005 �373.6 35 666.120920 01 March 2006 124.7 140 674.321421 05 April 2006 671.7 175 678.421922 10 May 2006 �91.8 210 670.022423 14 June 2006 �35.7 245 669.824427 01 November 2006 477.7 385 668.824928 06 December 2006 �105.8 420 671.425429 10 January 2007 �558.1 455 670.325930 14 February 2007 109.8 490 676.026431 21 March 2007 �456.4 525 663.926932 25 April 2007 62.7 560 670.327433 30 May 2007 �48.1 595 666.1
aB? is the perpendicular baseline relative to the 12-Oct-2005 acquisition.jD tj is the time span between acquisitions relative to the 12-Oct-2005acquisition. fDC is the absolute Doppler centroid.
B11408 DAWSON ET AL.: SHALLOW INTRAPLATE EARTHQUAKES
4 of 19
B11408

since in the general case it may be singular, by applicationof the singular value decomposition (SVD) method.
4. Results
4.1. Katanning Earthquake
[19] The Katanning earthquake occurred approximately30 km south of the township of Katanning, WesternAustralia (Figure 1). The earthquake resulted in someproperty damage in the local vicinity and it was felt inareas of Perth, 260 km northwest of the epicenter. Therewere some observations of associated surface cracking, withsmall (1–2 cm) surface cracks visible and some largersurface topography changes, including a 2.5 � 90 m longlinear feature which was uplifted by approximately 0.3 mrelative to the surrounding surface (G. Taylor, land owner,personal communication, 2007). Conventional two-passInSAR analysis of the ALOS data resulted in a highcoherence interferogram, which clearly indicates the asso-ciated co-seismic deformation (Figure 2).[20] The unwrapped co-seismic displacement field was
modeled using elastic dislocation theory. The potential toincorporate other geodetic observations at nearby surveymarks into the elastic dislocation modeling was discounted,since the marks were too distant (>7 km) from the epicenterand their estimated coordinate precision insufficient. Wemodeled the fault as a rectangular plane with a uniform-slipdistribution [Okada, 1985], and we estimated the earth-quake’s latitude, longitude, depth, strike, dip, rake, slip-magnitude, and the dimensions of the best-fitting fault-plane.The earthquake was assumed to be a double-couple sourcewithout tensile components and we assumed that the Earth’scrust was well modeled as a Poisson solid with a shearmodulus of 30 GPa.[21] To reduce the volume of InSAR observations, the
data were down-sampled using a quadtree partitioningalgorithm [Jonsson et al., 2002], with a threshold varianceof 12 mm2, such that the InSAR data set, spanning the timeof the earthquake, contained approximately 3000 observa-tions. As an alternative to averaging the observations withineach quadrant, we selected the pixel with the medianobservation value over the quadrants rather than the con-ventional approach of averaging the observations. Thismedian selection approach gives slightly improved results[Dawson and Tregoning, 2007].[22] The model inversions were undertaken using the
Direction Set Method [Press et al., 1992] which wasiterated with randomly selected a priori values for modeledparameters [e.g., Wright et al., 1999]. The search of param-eter space was unconstrained, although the rupture planewas constrained to be below the surface through theapplication of auxiliary parameter transforms so as to avoidphysically unrealistic depth estimates [e.g., Wright et al.,1999]. The observations were treated as equally weightedand uncorrelated which, based on our previous simulations,has minimal impact on the source parameter estimates whencompared to a spatially correlated observation weighting[Dawson and Tregoning, 2007].[23] A Monte Carlo technique was used to assess the
precision of the derived earthquake source parameters [e.g.,Funning et al., 2005]. Specifically, a variogram model wasevaluated using the residual unwrapped data (observed
minus modeled), and then subsequently used to generate100 synthetic noise models by non-conditional simulation[Cressie, 1993]. The maximum variance of our variogrammodel was 41 mm2, while at distance of 2 km the modelvariance is sub mm. The noise models were then combinedwith the elastic deformation model, estimated from theobservations. The combined (noise-plus-deformation) datasets were unwrapped and inverted, providing an ensemble ofearthquake source parameters. The scatter of each parameterwithin the ensemble provided a robust estimate of theprecision of the model source parameters.[24] The standard deviation of the unwrapped phase data
outside the immediate co-seismic deformation field was7.7 mm, reflecting the precision of the ALOS PALSARobservations. The earthquake was well modeled as anelastic rupture (Figure 3), with a Root Mean Square(RMS) error of 12.2 mm. The InSAR-derived mechanismand its precision are given in Tables 3 and 4. The earth-quake’s mechanism is predominately right-lateral strike–slip with a thrust component, the rupture plane extends from640 ± 10 m depth to the surface, and the average estimatedslip on the rupture was 422 ± 59 mm. The model suggeststhat the earthquake has ruptured to the regolith and thedeeply weathered geology probably explains the lack of aclear surface rupture.[25] Since the east–west compressive regime of the
SWSZ would suggest the predominance of thrust mecha-nism earthquakes we assessed this possibility directly byrepeating the analysis with the rake fixed to 90� (i.e., purethrust) (Figure 4, Tables 3 and 4). The RMS error of thissolution was, 12.9 mm, only marginally worse than the bestfitting solution (12.2 mm). We found that the InSARobservations poorly resolve the rake of the event, sincethe satellite-to-target direction is near to parallel to theearthquake strike, and is largely unable to differentiatebetween vertical and toward-the-satellite deformation(Figure 2). While we prefer the best fitting solution, we alsoexercise caution when making rake-related interpretations.[26] From the Monte Carlo analysis, the estimated preci-
sion (1s) of the rupture location is better than 100 m. Wewere able to estimate the rupture plane orientation to betterthan 7� (1s). The length and width of the rupture plane wasalso well determined to better than 100 m or 10% of thetotal fault size, such good estimates resulting in part fromhaving an earthquake depth that is of similar magnitude toits fault dimensions. Equally, the conjugate fault planesseem well differentiated in the model inversion. Parametertrade-off analysis indicated that the rupture location coor-dinates are the most highly correlated parameter pairsand both are also highly correlated with the fault width(Figure 5); however the rake is well resolved. Overall, thenarrow peak of each parameter histogram provides confi-dence in our fault parameter estimates.[27] At shallow depths the rheological parameters of the
crust may differ from what is conventionally adopted for theestimation of elastic dislocation models from geodeticobservations. The homogeneous, isotropic, Poisson-solid,and half-space assumptions adopted can have importantconsequences as these assumptions become less valid[e.g., Masterlark, 2003]. We found our model was largelyinsensitive to a range of shear modulus and Poisson ratiovalues, with the exception of moment magnitude (which is
B11408 DAWSON ET AL.: SHALLOW INTRAPLATE EARTHQUAKES
5 of 19
B11408

of course directly proportional to the adopted shear modulusvalue). Seismically derived estimates of the Poisson’s ratioin this region are not available. Since, for crustal rocks, thePoisson’s ratio is 0.1 < u < 0.4 [Turcotte and Schubert,2002] we repeated the inversion adopting these extremevalues. These tests indicated that the estimated parameterswere not significantly different (95% confidence level) fromour preferred model (u = 0.25, Tables 3 and 4) except forthe depth parameter which we found varied by 100 mbetween the extremes (i.e., when u = 0.1 the depth was620 m, while when u = 0.4 the depth was 720 m). Overall,the impact of the Poisson-solid assumption is low.[28] We cannot exclude the possibility of some inelastic
behavior of the upper crust, since the fault most likely
ruptured into weathered rocks. However, since the elasticmodel recovers the surface displacement convincingly,significant inelastic behavior is unlikely. In some circum-stances superficial layering (i.e., elastic stratification of thecrust) can have an important impact on the observed surfacedeformation [e.g., Cattin et al., 1999]; however this effect isunlikely to be significant for small-magnitude, shallowevents. The Geoscience Australia and the USGS NEICseismic catalogs report a magnitude 4.8 for this earthquake;the consistency between the geodetic (4.74 ± 0.03) andseismic moment magnitude thus supports our choice ofshear modulus.[29] Modeling limitations may result from our use of a
single plane, uniform-slip distribution rupture model. The
Figure 3. Best-fitting uniform rectangular fault modeling and observations of the Mw 4.7 Katanningearthquake. (a) Observed L-Band interferogram. The images were acquired on 8 September 2007 and24 October 2007. Scale and the satellite-to-target look direction are as per Figure 2. Negative rangechange profiles are indicated in black. (b) Modeled interferogram, modeled horizontal deformationvectors are shown in black. The modeled rupture rectangle is shown in black. (c–f) Modeled andobserved unwrapped negative range change profiles.
B11408 DAWSON ET AL.: SHALLOW INTRAPLATE EARTHQUAKES
6 of 19
B11408

deformation field has features that are suggestive of a non-planar rupture and/or a non-uniform slip distribution. Thesefeatures include the sigmoidal bend of the apparent faulttrace near its southern end, and the computed residuals,again at the southern end, indicate an under estimation ofthe deformation magnitude and extent (Figure 3c).[30] The investigation of the finer details of the slip
distribution is possible given the shallowness of the event.For this we fixed the fault geometry to the parameters fromthe best-fitting uniform-slip model and estimated the slip onsmall patches (Tables 3 and 4). We segmented the ruptureinto 400 patches and ensured that the patched area extendedpast the previously estimated rupture by 0.5 km in thealong-strike direction and 1.0 km in down-dip direction.The resulting patch dimensions were 150 � 90 m, in thealong-strike and down-dip directions, respectively. We setup a system of equations relating the slip on the patches tothe observations given a fixed rupture geometry [e.g.,Jonsson et al., 2002; Funning et al., 2005]:
d
0
� �¼ G
k2r2
� �m ð2Þ
where d is a vector of the observed line-of-sight displace-ments, G are the data kernels (i.e., the elastic model) whichrelate the slip to the observations, m is a vector of slip oneach of the patches, k2 is a weighting parameter whichcontrols the degree of smoothing. The Laplacian smoothingcondition (r2) is used to avoid unphysical slip oscillationsin the estimated slip. The degree of smoothing was selectedas a trade-off between resolution and accuracy and, afterplotting k values against their respective misfits, weselected the largest value of k which did not significantlyincrease the solution misfit. The fixed geometry problem(i.e., equation (2)) is linear and was solved directly using anon-negative least squares estimation technique [Lawsonand Hanson, 1974].
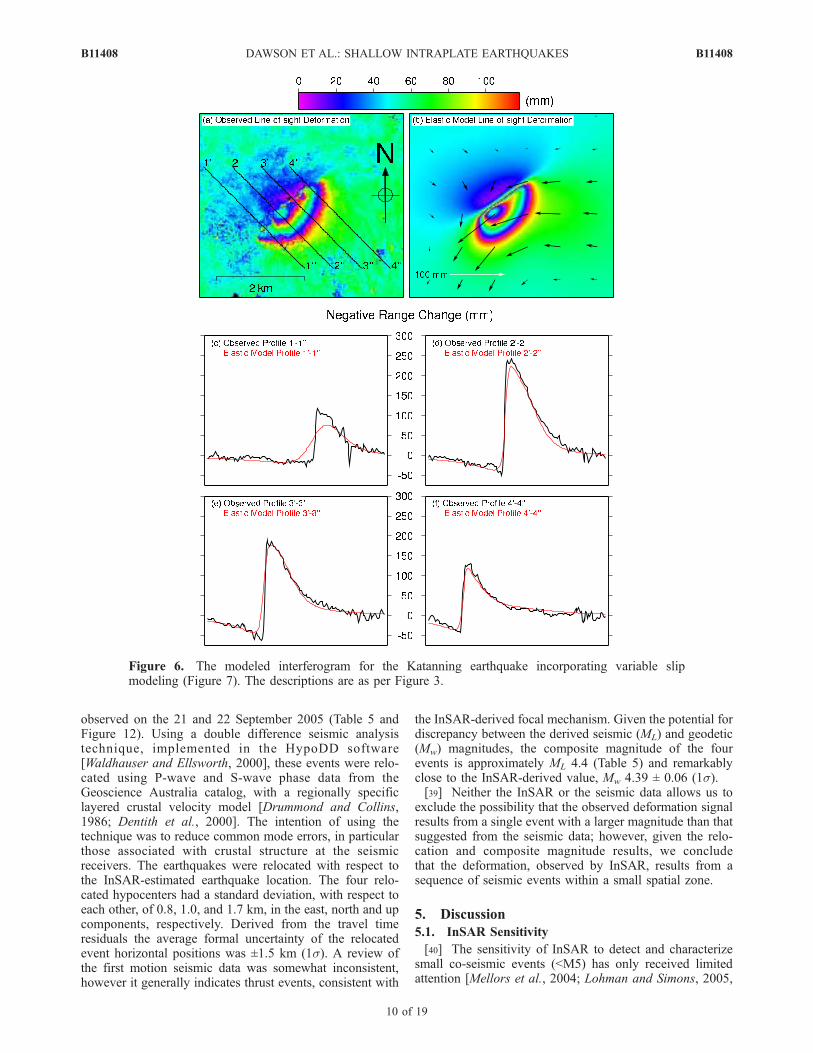
[31] We used the same Monte Carlo technique as insection 4.1 to assess the precision of the derived slipparameters [e.g., Funning et al., 2005]. Figure 6 showsthe modeled interferogram incorporating the variable slipdistribution, while Figure 7 shows the slip distributionmodel. The misfit of the distributed slip model was11.3 mm compared to 12.2 mm for the uniform slip model.Overall, the solution was significantly improved (i.e., F-testat 95% confidence level) over the previous model, this isdemonstrated particularly in the area where the maximumdeformation is observed. However the model still has someremaining misfit at the southern end of the deformation fieldand we conclude that slip on a singular planar fault cannotfully explain all the observed deformation.[32] We modeled significant slip between the surface and a
depth of approximately 700 mwhile we found maximum slipmagnitudes of 76 cm at a depth of approximately 400 m. Thecentroid of the slip was estimated to be at a depth of 320 m.The estimated slip at the location corresponding to the surfaceuplift feature was between 25 and 35 cm and is consistentwith the apparent uplift. The maximum estimated slip nearthe surface was 58 cm and is located to the south west alongthe rupture relative to the uplift feature. The maximumestimated 1s uncertainty of the slip estimates was 14 cm.[33] To assess the robustness of the estimated slip distri-
bution, we undertook a series of synthetic tests. For thesetests we adopted the fixed geometry as used previously,generated synthetic slip distributions, then modeled anL-band interferogram, combined it with realistic syntheticnoise, and finally estimated the slip distribution (Figure 8).The modeling indicates that events of magnitude �4.7 (Mw)which occur in the top kilometer of crust have slip distri-butions which are generally well constrained from L-BandInSAR observations. The reconstructed distributions had thehighest accuracy when the slip is largely contained in thetop �750 m of crust, which is the case for the Katanningearthquake. The slip tends to be underestimated if it occursbelow this level.
4.2. Kalannie Earthquake Sequence
[34] Between September 2005 and January 2007 a clusterof seismicity was observed in an area centered approxi-mately 24 km north of the township of Kalannie. Prior tothis period, within a 15 km radius, the area was essentiallyaseismic in the seismic recording history. Transient clusterseismicity is a feature of the SWSZ [Denham et al., 1987]and while in some cases the enhanced local seismicityrelates to aftershock sequences, other clusters are not
Table 3. InSAR-Derived Earthquake Location and Magnitude
Estimates of the Mw 4.7 Katanning Earthquakea
Longitude Latitude
Rupture-Depth
Magnitude(Mw)
Misfit(mm)
Bottom(km)
Top(km)
Best Fitting Solution117.5319� �33.9544� 0.64 0.05 4.74 12.2±0.05 km ±0.08 km ±0.01 ±0.01 ±0.03
Pure Thrust Solution117.5318� �33.9555� 0.913 0.085 4.82 12.9±0.04 km ±0.06 km ±0.06 ±0.06 ±0.02
Seismic Solution117.50� �33.95� 4.80
aThe location and depth refer to the bottom left of the fault rectangle,following the convention of Okada [1985]. The misfit is the root meansquare error between the observed and modeled elastic dislocation. Theearthquake magnitude Mw was computed using the relation log10(M0) =3/2(Mw + 10.7) [Hanks and Kanamori, 1979] where M0 is the seismicmoment. M0 was computed using the relation M0 = m L W U where m isthe shear modulus of the Earth’s crust, L and W are rupture length andwidth respectively, and U is the average slip [Aki and Richards, 2002].The seismic solution is from the Geoscience Australia catalog. Theuncertainties are 1s.
Table 4. InSAR-Derived Earthquake Source Parameters of theMw
4.7 Katanning Earthquakea
Length(km)
Width(km)
Strike(�)
Dip(�)
Rake(�)
U1(mm)
U2(mm)
Slip(mm)
Best Fitting Solution1.255 0.861 53.4 43.5 151.4 �388 212 422±0.05 ±0.08 ±0.4 ±2.9 ±11.9 ±93 ±60 ±59
Pure Thrust Solution1.305 1.082 53.4 49.9 90.0 0 450 450±0.02 ±0.06 ±0.4 ±2.0 - - ±15 ±15
aU1 is the left-lateral transverse component of the slip and U2 is thethrusting dip-slip component [e.g., Okada, 1985]. Slip is the average slip.The uncertainties are 1s.
B11408 DAWSON ET AL.: SHALLOW INTRAPLATE EARTHQUAKES
7 of 19
B11408

associated with any previously known seismic events. Theclosest recorded moderate-sized earthquake to the Kalanniecluster is the 1987 M6.2 Cadoux earthquake, which waslocated over 50 km to the south.[35] Using all the acquired data (2004–2007) we com-
puted a large redundant set of the possible interferogrampairs. In the subsequent analysis we selected only signifi-cantly correlated interferograms, discarding the remainder.The adopted data set included acquisition spans of up to280 days, B? values up to 603 m, and overall included 55descending pass interferograms and 28 ascending passinterferograms (Tables 1 and 2). The subsequent time seriesanalysis revealed a surface deformation signature, and giventhe availability of descending and ascending observations,allowed us to constrain the deformation to a period between7 September 2005 and 4 October 2005. A maximumdeformation of 27 mm (line-of-sight toward the satellite inthe descending pass) was observed in the target-to-satellitedirection, the deformation field had a circular extent of 2 km
diameter (Figure 9), while there was no field evidence ofassociated rupturing or deformation of the surface (R.Leach, land owner, personal communication, 2007).[36] When estimating a topographic correction surface,
we found maximum residual topography corrections of14 m, with an RMS of 1.3 m (i.e., with respect to thereference DEM). The reduced average velocities coveringthe co-seismic event were then converted to displacementand these data were inverted in the elastic dislocationmodeling. The modeling and the parameter uncertaintyestimation followed the approach detailed in section 4.1except that we adopted a point-source elastic dislocationmodel [Okada, 1985] because of the small magnitude of theearthquake, and the quadtree threshold variance was set to1 mm2. We estimated the earthquake location, depth,rupture strike, dip and rake, and the magnitude. No param-eter constraints were applied and no preferred initial valueswere selected. The ascending and descending observations areinverted together and the earthquake is characterized as a
Figure 4. Pure thrust constrained uniform rectangular fault modeling and observations of the Mw 4.7Katanning earthquake. The descriptions are as per Figure 3.
B11408 DAWSON ET AL.: SHALLOW INTRAPLATE EARTHQUAKES
8 of 19
B11408

reverse right-lateral oblique fault (Figure 10, Table 5), withan RMS error of 2.6 and 2.5 mm, for the descending andascending pass data, respectively. The event had a welldetermined location, better than 150 m (1s) and we wereable to estimate its rupture plane orientation to better than15� (1s).[37] Since the observed deformation had a nearly circular
appearance we assessed the strike of the event with particularcare by undertaking a direct search of the parameter space.This analysis indicated that the observations do resolve the
strike with a quality which is consistent with its uncertainty(i.e., ±12.1� (1s)). There are two clear preferred solutions,the first around our best-fitting solution and the secondcorresponding to its conjugate fault plane (Figure 11).
4.3. Kalannie Seismic Relocations
[38] A review of the seismic catalog data suggested apotentially causative sequence of shallow, <5 km depth,small-magnitude earthquakes, 3.7 to 4.1 ML, located towithin 5 km of the observed surface deformation, and
Figure 5. Parameter trade-offs and correlations computed using Monte Carlo analysis for the Katanningearthquake. The parameter correlation coefficients are shown in the upper boxes, while parameter scatter-plots are shown in the lower boxes. The parameter histograms are shown in the diagonal boxes, thevertical line indicates the mean value. X and Y is the location of the bottom left of the fault rectangle[e.g., Okada, 1985] in an arbitrary local coordinate frame in the east and north components (km),respectively. The length and width are in km, Strike, Dip, and Rake are in degrees.
B11408 DAWSON ET AL.: SHALLOW INTRAPLATE EARTHQUAKES
9 of 19
B11408
observed on the 21 and 22 September 2005 (Table 5 andFigure 12). Using a double difference seismic analysistechnique, implemented in the HypoDD software[Waldhauser and Ellsworth, 2000], these events were relo-cated using P-wave and S-wave phase data from theGeoscience Australia catalog, with a regionally specificlayered crustal velocity model [Drummond and Collins,1986; Dentith et al., 2000]. The intention of using thetechnique was to reduce common mode errors, in particularthose associated with crustal structure at the seismicreceivers. The earthquakes were relocated with respect tothe InSAR-estimated earthquake location. The four relo-cated hypocenters had a standard deviation, with respect toeach other, of 0.8, 1.0, and 1.7 km, in the east, north and upcomponents, respectively. Derived from the travel timeresiduals the average formal uncertainty of the relocatedevent horizontal positions was ±1.5 km (1s). A review ofthe first motion seismic data was somewhat inconsistent,however it generally indicates thrust events, consistent with
the InSAR-derived focal mechanism. Given the potential fordiscrepancy between the derived seismic (ML) and geodetic(Mw) magnitudes, the composite magnitude of the fourevents is approximately ML 4.4 (Table 5) and remarkablyclose to the InSAR-derived value, Mw 4.39 ± 0.06 (1s).[39] Neither the InSAR or the seismic data allows us to
exclude the possibility that the observed deformation signalresults from a single event with a larger magnitude than thatsuggested from the seismic data; however, given the relo-cation and composite magnitude results, we concludethat the deformation, observed by InSAR, results from asequence of seismic events within a small spatial zone.
5. Discussion
5.1. InSAR Sensitivity
[40] The sensitivity of InSAR to detect and characterizesmall co-seismic events (<M5) has only received limitedattention [Mellors et al., 2004; Lohman and Simons, 2005,
Figure 6. The modeled interferogram for the Katanning earthquake incorporating variable slipmodeling (Figure 7). The descriptions are as per Figure 3.
B11408 DAWSON ET AL.: SHALLOW INTRAPLATE EARTHQUAKES
10 of 19
B11408

Dawson and Tregoning, 2007]. Globally to date, very fewearthquakes in the magnitude range investigated here havebeen imaged by InSAR, previous C-band InSAR examplesinclude the M5.4 (depth 2.6 km) 1992 Landers aftershock[Feigl et al., 1995], the M4.8 (depth 2.2 km), 5.3 (depth4.2 km), 5.0 (depth 3.5 km), and 5.4 (depth 5.3 km)earthquakes in the Zagros Mountains, Iran [Lohman andSimons, 2005], and the M5.6 (depth 9.4 km) Little SkullMountain earthquake [Lohman et al., 2002]. Our analysis ofthe Katanning and Kalannie earthquakes is at the lower limitof the co-seismic characterization capabilities of satellite
InSAR (C-Band and L-Band). We have added to the globallist of small magnitude earthquakes investigated withInSAR, demonstrating the reach of this method to charac-terize earthquakes as small as around M4.4.
5.2. Slip Distribution
[41] Slip distributions computed from geodetic observa-tions are routinely estimated for large magnitude earth-quakes, for example, the 2003 Mw 6.6 Bam, Iran,earthquake [Funning et al., 2005] and the 1999 Mw 7.1Hector Mine, California earthquake [Jonsson et al., 2002].However they are generally not available for small magni-tude events, as surface deformation decreases rapidly as afunction of event depth, with only very shallow earthquakesreaching the geodetic detection limits of InSAR and GPS.The latter are not generally available at sufficient spatialdensity for characterizing small earthquakes. To our knowl-edge the Katanning earthquake is the smallest event forwhich a slip distribution has been determined using geodeticdata.[42] Slip distributions for small-magnitude events have
been determined from seismic data, for example, the 1997Mw 4.5 Northridge, California, aftershocks [Venkataramanet al., 2000]. However such studies are rare since theyrequire dense seismic networks (�20 km spacing) operatingclose to the event.
5.3. Stress Orientation
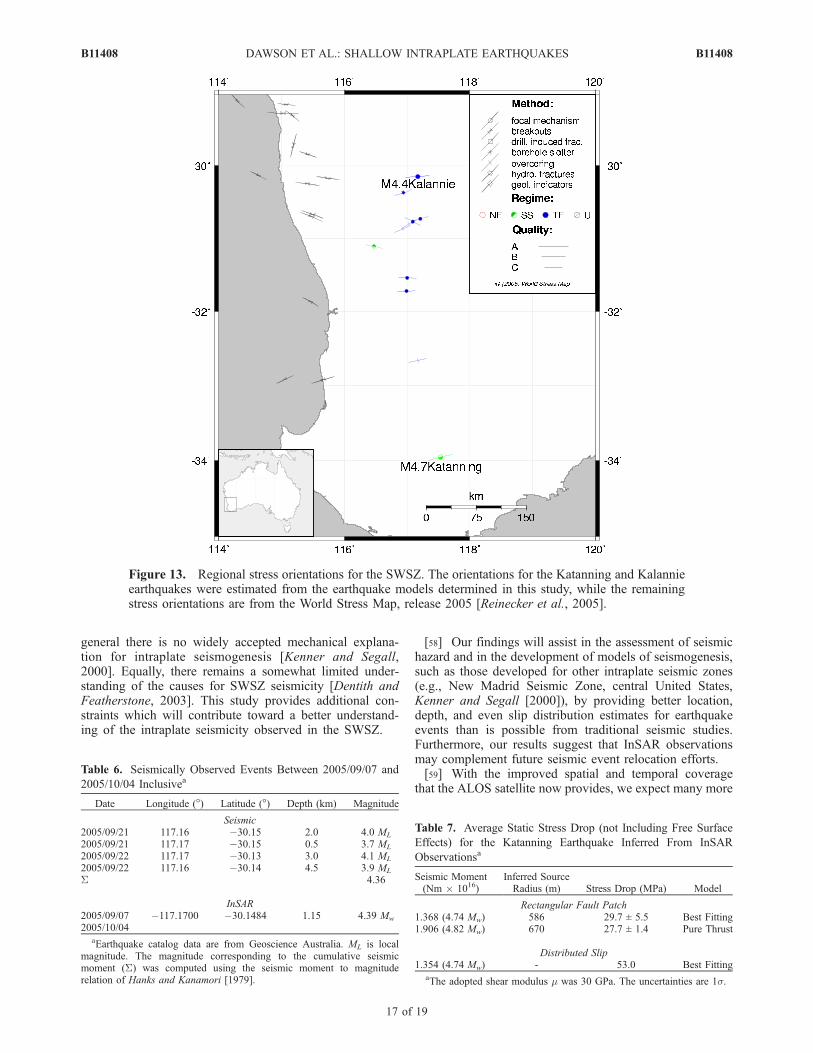
[43] The InSAR determined earthquake models allow theestimation of the local stress field orientation, which is oftenpoorly determined from sparse regional seismic networksfor moderate-sized earthquakes (M4–M6.5) [e.g., Zoback,1992]. The Katanning earthquake mechanism indicates aprincipal stress orientation, assuming it is consistent withthe earthquake’s slip, of 75� (azimuth) while for the Kalan-nie earthquake sequence it was 84� (Figure 13). Thesevalues agree favorably with the broad-scale regional stressfield [Reinecker et al., 2005], and are consistent with aneast–west compressive regime.
5.4. Static Stress Drop
[44] We evaluated the static stress drop Ds using therelation [Brune, 1970, 1971; Scholz, 2002], Table 6.
Ds ¼ 7
16
M0
r3ð3Þ
where M0 is seismic moment and r is the source radius. Thisrelation assumes a circular rupture and the parameter r wasmodeled as r =
ffiffiffiffiffiffiffiffiffiffiffiffiffiLW=p
pwhere L and W are the rupture
length and width. Table 7 gives the computed stress drop,which is �30 ± 6 MPa, for the best-fitting uniform slipmodel. To assess the impact of the elastic modeling on theestimated stress drop, we repeated this calculation for thepure-thrust constrained model and found a similar result,�28 ± 1 MPa. For the distributed slip model we found thatthe average stress drop, averaged over those segments witha detected slip, is a much larger 53 MPa. The uncertaintiesfor the stress drop were evaluated using the Monte Carlomethod described in section 4.1, however we did notconsider the uncertainty of the shear modulus m parameterTable 8.
Figure 7. The slip distribution model for the Katanningearthquake. The earthquake geometry was fixed to the bestfitting solution (Tables 3 and 4). (a) Estimated slip. View isnormal to the fault plane. A zero down-dip value wouldindicate the surface. (b) 1s uncertainties of the slip. (c) Planview of the rupture in an arbitrary local coordinate system.(d) Viewing azimuth and elevation is 210� and 10�,respectively.
B11408 DAWSON ET AL.: SHALLOW INTRAPLATE EARTHQUAKES
11 of 19
B11408

[45] The large computed stress drop is consistent with thehigh slip magnitude relative to the rupture area. The stressdrop is larger, by a factor of 3 or more, than those associatedwith the 1968 Meckering and 1970 Calingiri earthquakes,which were �10 MPa [Denham et al., 1980]. They are alsolarger than typical stress drops observed elsewhere in the
world, which rarely exceed �10 MPa [Scholz, 2002],although stress drops up to approximately 100 MPa havebeen observed [e.g., Abercrombie and Leary, 1993]. Theobserved stress drop is consistent with the stress magnitudesof 20–40 MPa predicted, on the Australian continent, byplate boundary force modeling [Coblentz et al., 1998] and
Figure 8. A comparison between input slip and reconstructed slip, for four synthetic models (a–d),used to examine slip estimation robustness. The rupture geometry is fixed to the best-fitting uniform-slipdistribution model (Table 4). The slip magnitudes, in each case, are scaled so that they equate to a�4.7 (Mw) earthquake. The synthetic interferogram includes realistic noise and otherwise is identical incharacteristics to the interferogram in Figure 2. The black rectangle indicates the extents of the segmentedrupture.
B11408 DAWSON ET AL.: SHALLOW INTRAPLATE EARTHQUAKES
12 of 19
B11408

intraplate earthquakes are thought to be more likely torelease the local tectonic stress completely [Richardsonand Solomon, 1977]. The drop is also somewhat larger thanthe compressive horizontal stresses of �20 MPa which havebeen observed close to the surface (<10 m) in the SWSZ[Denham et al., 1980].[46] This high stress drop may have a number of explan-
ations. First, the adopted shear modulus may be too large.The value we adopted (i.e., m = 30 GPa) is generally used inthe elastic dislocation modeling of earthquakes at greaterdepth. However shear modulus is expected to increasewith depth and may be four times smaller at the surface[Wu et al., 1998]. If we assume the stress drop observedfor Meckering and Calingiri is typical of the region (i.e.,�10 MPa) then it would suggest a shear modulus of�10 GPa for the near surface crust. This would be unlikelygiven the high shear-wave velocities, at shallow depth,observed in the region, i.e., an upper crustal density of 2.8 gcm�3 (source: Reference Earth Model (REM) http://mahi.ucsd.edu/Gabi/rem.html) and a shear-wave velocity of 3 km s�1
gives a shear modulus of 25.2 GPa. Second, the relation weadopted for the static stress drop (i.e., equation (3)) may notbe valid. Similar expressions for static stress drop – exceptfor a rectangular rupture – have also been proposed (i.e.,Ds / M0/W
2L) [e.g., Stein and Wysession, 2003] and theseproduce an estimate of the stress drop which is less than thecircular rupture model by a factor of two. Third, the inferred
stress drop, while being unusually large, is real. The stressdrop relation we adopted ignores the free surface effect and,for surface rupturing earthquakes, may be less by a factor of�2 [Boore and Dunbar, 1977]. This would reduce the stressdrop to �14 MPa for the rectangular patch models and�27 MPa for the distributed slip model, values which aresomewhat larger than that observed for other earthquakes inthis region. However a large drop is consistent with theearthquake being felt up to 260 km from the epicenter and,assuming total tectonic stress release, the stress drop mag-nitude is consistent with the magnitude of the prevailingstress field.We prefer the high stress drop explanation which,assuming a free surface effect, has a range of 14–27 MPa.
5.5. Earthquake Scaling Relations
[47] Empirical earthquake scaling relations are deter-mined from instrumentally recorded earthquakes [e.g.,Bonilla et al., 1984], and express the relationship betweenmoment magnitude and various other earthquake sourceparameters, such as displacement, rupture length, rupturewidth, etc. Such relations are determined using data fromglobal catalogs. Many of the relationships remain valid overall earthquake magnitudes [e.g., Wells and Coppersmith,1994], such that our observations of small earthquakes canbe used to infer the characteristics of larger earthquakes aswell as providing a well determined data set from which it ispossible to test the validity of these globally determinedrelationships. This is important since few Australian earth-quake observations are available for such computations, forexample, only 4 Australian earthquakes were used in theWells and Coppersmith [1994] relations. For the Katanningearthquake the source parameters estimated from the InSARdata indicate that the observed surface displacements areconsiderably larger than those predicted (Table 7), implyingthat some caution should be exercised in the use of theserelations for SWSZ seismic hazard assessment.[48] Our results suggest that surface faulting earthquakes
can occur at magnitudes down to at least 4.7 (Mw). Thisestimate is lower than the M4.9 – M5 earthquakes previ-ously thought to represent a lower limit on co-seismicsurface faulting [Bonilla, 1988; Wells and Coppersmith,1994] and is much lower than the typical, greater thanM5.5, events which rupture the surface [Mohammadiounand Serva, 2001]. This may have implications for seismichazard assessments based on the interpretation of Quater-nary faults.
5.6. Contributions to Earthquake Location
[49] InSAR-derived earthquake location, depth and mag-nitude estimates are valuable since they allow for anindependent assessment of those determined teleseismicallyand they may be used to calibrate regionally specificseismic models [Lohman and Simons, 2005] which maysubsequently be used to improve earthquake positioningfrom seismic data or provide reference sources for nucleartest detection [Mellors et al., 2004]. The level of accuracy ofthe InSAR-derived earthquake location and depth (±100 m1s) is not currently obtainable from the sparse AustralianNational Seismograph Network, whose estimates have for-mal precisions of �5 km (2s) in the SWSZ [Leonard,2008]. Seismic observations constrain 95% of earthquakesin the SWSZ to the top 5 km of crust. Our observations of
Figure 9. Descending pass interferogram of the Mw 4.4Kalannie earthquake sequence. Reduced descending passENVISAT interferometric observations, 26 July 2005 to 4October 2005. The triangles, indicating the observedseismicity in the period 1 January 2004 until 20 December2007, are from the Geoscience Australia catalog(www.ga.gov.au). The stars indicate relocated seismic eventsfrom Table 5. Each color cycle corresponds to a 28.3 mmline-of-sight deformation. An indicative ±1.5 km errorellipse (1s) is depicted for one of the relocated events.
B11408 DAWSON ET AL.: SHALLOW INTRAPLATE EARTHQUAKES
13 of 19
B11408

shallow earthquakes and the history of moderate-sizesurface-rupturing earthquakes suggests that very shallow(�1 km) seismogenesis is commonplace in the SWSZ. Inthe period November 2004 to December 2007, the SWSZexperienced eight earthquakes of magnitude greater than orequal to 4.2 (up to magnitude 4.8, source: USGS NEIC andGeoscience Australia catalog). Two of the eight earthquakeswere associated with the Mw 4.4 Kalannie event and oneevent was associated with Katanning earthquake, that is,nearly half of the most significant recent seismicity in the
SWSZ is definitively associated with events in the top 1 kmof crust. Of the remaining events, the InSAR acquisitioncoverage is insufficient to characterize these events. Anongoing InSAR survey of the SWSZ is required to furtherdevelop an accurate earthquake depth histogram, and theALOS satellite will provide this opportunity.
5.7. Katanning Quaternary Scarp
[50] Earthquakes in stable continental regions are gener-ally thought to be associated with the reactivation of ancient
Figure 10. The reduced line-of-sight and modeled interferograms for the 4.4 Kalannie earthquakesequence. (a) The reduced ascending pass interferogram. (b) The reduced descending pass interferogram.(c) The modeled ascending pass interferogram. (d) The modeled descending pass interferogram. Thedescending pass line-of-sight (target to satellite) unit vector was 0.366, �0.086, 0.927 in the east, north,and up components respectively. The ascending pass target to satellite unit vector was �0.420, �0.099,0.902 in the east, north and up components respectively. Each color cycle corresponds to a 28.3 mm line-of-sight deformation.
Table 5. The Mw 4.4 Kalannie Earthquake Sequence, InSAR-Derived, Source Parameters and Their 1s Uncertaintiesa
Longitude Latitude Depth (km) Magnitude (Mw) Strike (�) Dip (�) Rake (�) Des. Misfit (mm) Asc. Misfit (mm)
117.1700� �30.1484� 1.15 4.39 231.1 51.9 132.6 2.6 2.5±0.12 km ± 0.10 km ± 0.08 ± 0.06 ± 12.1 ± 6.2 ± 11.1
aThe misfit is the root mean square error between the observed and modeled elastic dislocation, and the corresponding values for the descending (des.)and ascending (asc.) passes are given. The uncertainties are 1s.
B11408 DAWSON ET AL.: SHALLOW INTRAPLATE EARTHQUAKES
14 of 19
B11408

faults in response to the contemporary stress field [Crone etal., 2003; Zoback, 1992]. In Australia, geological evidencesuggests that large surface faults experience multiple sur-face-rupturing events over time spans of 104 to 105 yr,separated by long periods of seismic quiescence greater than106 yr [Crone et al., 1997]. A previously identified Qua-ternary fault scarp terminates 3 km southwest of the Katan-ning earthquake and the proximity and the relativeorientation between the scarp and earthquake rupture planeis suggestive of some physical relationship (Figure 2).[51] The Quaternary scarp has a height of approximately
5 m and continues in three sections for approximately 20 kmin a southeast direction [Clark, 2008]. The scarp is some-what anomalous for the SWSZ, since it is oriented in anorthwest direction and not north–south like the majority ofidentified Quaternary scarps which are consistent with theeast–west compressive regime observed in the SWSZ.However the scarp is indicative of large crustal earthquakesand its presence is not well explained by other geologicalprocesses (D. Clark, personal communication, 2007). In theabsence of trenching data, little is known about the scarp’sage, temporal development or geometry.[52] The spatial distribution of sequences of many large
earthquakes is consistent with Coulomb stress changes (e.g.,1992 Landers earthquake sequence [King et al., 1994]).While direct static Coulomb stress changes do not explaindelayed failure, stress changes associated with large earth-quake events are thought to perturb the stress state onnearby faults and delay or advance subsequent earthquakes[Freed, 2005].[53] To assess the potential relationship between the
Katanning earthquake and the Quaternary scarp, we modeleda moderate-sized, M6.5, thrusting earthquake with a faultplane following the scarp along the three visible segments(Figure 2). Assuming that the earthquake rupture plane metthe surface along its length and the base of the ruptureextended to a depth of 8 km, consistent with other
moderate-sized earthquakes in the SWSZ, the hypotheticalevent corresponds to a rupture with an average slip of 1 m.Using the COULOMB (version 3.105) software [Toda etal., 2005; Lin and Stein, 2004] we evaluated the co-seismicCoulomb stress changes associated with such a rupture onthe Quaternary scarp and found that the modeled earth-quake generates 1 MPa of Coulomb stress change on theobserved rupture plane of the Katanning event. The mag-nitude of the stress changes are mostly insensitive to alarge range of dip angles (30–60�) and friction coefficients(0.4–0.8) in the model. Thus an earthquake associated withthe scarp formation would have increased the likelihood offailure at the observed location of the Katanning event.[54] If the Quaternary scarp represents a preexisting
crustal weakness then it may be subject to reactivationgiven local stress changes. To explore this possibility werepeated the previous computation to consider the impact ofthe Katanning event on the existing scarp. We segmentedthe hypothetical M6.5 rupture plane into 10 � 10 individualsegments and computed the Coulomb stress changes oneach fault segment and found Coulomb stress changes of�0.1 MPa, which is of the order of the minimum stresschanges thought to be able to initiate earthquakes [Seeber etal., 1998]. Thus if the Quaternary scarp was already pre-disposed to rupture then the recent event may advance itsoccurrence.
6. Conclusions
[55] The SWSZ is particularly suited to the InSARtechnique since the seismicity tends to be very shallowand we are able to provide high-quality geodetic constraintson the epicenter and source parameters of two small-magnitude intraplate earthquakes. These earthquakes aresome of the smallest to be investigated by InSAR and area demonstration of the technique for use in characterizingsmall-magnitude coseismic events. Our observations sup-port the suggestion that earthquakes in the SWSZ ofteninitiate in the shallow upper crust (1 km). We provide anaccurate coseismic slip distribution for the Mw 4.7 Katan-ning earthquake, such estimates being rarely available forsmall magnitude events. The high slip magnitudes across arupture area of �1 km2 suggests a coseismic stress drop of14–27 MPa, values larger than �10 MPa which haspreviously been estimated for earthquakes in this region.Since stress drops are strongly correlated to ground motionamplitude the observed large stress drop magnitude hasimportant implications for ground motion attenuation in theSWSZ, particularly if our results can be scaled to largermagnitude earthquakes.[56] While highly successful in many international con-
texts, InSAR has not been utilized to investigate anyAustralian earthquakes, although its potential to do so hasbeen previously noted [Dawson and Tregoning, 2007].Our InSAR observations are the first used in a study ofAustralian earthquakes and extends the published capabilityof the InSAR technique to observe and characterize smallco-seismic deformations. We used a time series approachto refine the coseismic displacement characterization byreducing topographic and atmospheric signals.[57] Globally there is a limited understanding of shallow
intraplate seismogenesis [Klose and Seeber, 2007] and in
Figure 11. Misfit (i.e., RMS) versus the fault strike. Thecomputed misfit values were obtained from a direct searchof the full parameter space. The misfit values weresmoothed using Gaussian filter with a width of 30�. Thevertical lines indicate the strike of the best-fitting solution(i.e., 231.1�) and the strike of the corresponding conjugatefault plane.
B11408 DAWSON ET AL.: SHALLOW INTRAPLATE EARTHQUAKES
15 of 19
B11408

Figure 12. Long-term seismicity in the region of the observed Mw 4.4 Kalannie earthquake sequence.The circles, indicating the observed seismicity in the period 1 January 2004 until 20 December 2007, arefrom the Geoscience Australia catalog. Event times are color coded showing temporal variation in theseismicity. The rectangular areas are the ENVISAT ascending and descending scenes. The surroundingsub-plots shows seismicity from 1978 to 2007 in a circular area around each of the four apparent clusters.The radius of the circular areas is either 12 or 15 km.
B11408 DAWSON ET AL.: SHALLOW INTRAPLATE EARTHQUAKES
16 of 19
B11408
general there is no widely accepted mechanical explana-tion for intraplate seismogenesis [Kenner and Segall,2000]. Equally, there remains a somewhat limited under-standing of the causes for SWSZ seismicity [Dentith andFeatherstone, 2003]. This study provides additional con-straints which will contribute toward a better understand-ing of the intraplate seismicity observed in the SWSZ.
[58] Our findings will assist in the assessment of seismichazard and in the development of models of seismogenesis,such as those developed for other intraplate seismic zones(e.g., New Madrid Seismic Zone, central United States,Kenner and Segall [2000]), by providing better location,depth, and even slip distribution estimates for earthquakeevents than is possible from traditional seismic studies.Furthermore, our results suggest that InSAR observationsmay complement future seismic event relocation efforts.[59] With the improved spatial and temporal coverage
that the ALOS satellite now provides, we expect many more
Table 6. Seismically Observed Events Between 2005/09/07 and
2005/10/04 Inclusivea
Date Longitude (�) Latitude (�) Depth (km) Magnitude
Seismic2005/09/21 117.16 �30.15 2.0 4.0 ML
2005/09/21 117.17 �30.15 0.5 3.7 ML
2005/09/22 117.17 �30.13 3.0 4.1 ML
2005/09/22 117.16 �30.14 4.5 3.9 ML
S 4.36
InSAR2005/09/07 �117.1700 �30.1484 1.15 4.39 Mw
2005/10/04aEarthquake catalog data are from Geoscience Australia. ML is local
magnitude. The magnitude corresponding to the cumulative seismicmoment (S) was computed using the seismic moment to magnituderelation of Hanks and Kanamori [1979].
Figure 13. Regional stress orientations for the SWSZ. The orientations for the Katanning and Kalannieearthquakes were estimated from the earthquake models determined in this study, while the remainingstress orientations are from the World Stress Map, release 2005 [Reinecker et al., 2005].
Table 7. Average Static Stress Drop (not Including Free Surface
Effects) for the Katanning Earthquake Inferred From InSAR
Observationsa
Seismic Moment(Nm � 1016)
Inferred SourceRadius (m) Stress Drop (MPa) Model
Rectangular Fault Patch1.368 (4.74 Mw) 586 29.7 ± 5.5 Best Fitting1.906 (4.82 Mw) 670 27.7 ± 1.4 Pure Thrust
Distributed Slip1.354 (4.74 Mw) - 53.0 Best Fitting
aThe adopted shear modulus m was 30 GPa. The uncertainties are 1s.
B11408 DAWSON ET AL.: SHALLOW INTRAPLATE EARTHQUAKES
17 of 19
B11408
SWSZ earthquakes to be observed in the coming years. Thiswill provide important constraints on the patterns of seismicactivity, and will be complementary to the conventionalseismic acquisition efforts in the SWSZ.
[60] Acknowledgments. We thank Herb McQueen, Richard Coleman,Dianne Hobday, Guorong Hu, Craig Smith, and John Schneider forsuggestions on earlier versions of the manuscript. The reviews by KurtFeigl and Juliet Biggs improved this paper. Lan-Wei Wang from Geosci-ence Australia and Hiroshi Sato from the Earth Observation Department,Remote Sensing Technology Center of Japan (RESTEC) are thanked fortheir assistance in obtaining an additional unscheduled PALSAR FBD dataacquisition by the ALOS satellite. The landowners Grant Taylor and RossLeach are thanked for their general assistance. Vic Dent, Ryan Ruddick andAlex Woods of Geoscience Australia are thanked for their assistance withfield observations. The ENVISAT SAR data are copyright of ESA 2004–2007, Distribution Spot Image S.A., all rights reserved, and was purchasedby Geoscience Australia. The ALOS PALSAR data used in this analysis is#Japan Aerospace Exploration Agency (JAXA) and the Japanese Ministryof Economy, Trade and Industry (METI) (2007) and is used with thepermission of JAXA and METI and Geoscience Australia. STRM data arethe void-filled seamless SRTM data V1, 2004, International Centre forTropical Agriculture (CIAT), available from the CGIAR-CSI SRTM 90mDatabase: http://srtm.csi.cgiar.org. Figures were generated using the GenericMapping Tools (GMT) software [Wessel and Smith, 1991]. The first author iscurrently on supported study leave from Geoscience Australia. JD, PC andML publish with the permission of Chief Executive Officer, GeoscienceAustralia.
ReferencesAbercrombie, R., and P. Leary (1993), Source parameters of small earth-quakes recorded at 2.5 km depth, Cajon Pass, southern California: Im-plications for earthquake scaling, Geophys. Res. Lett., 20(14), 1511–1514.
Aki, K., and P. G. Richards (2002), Quantitative Seismology, 2nd ed.,University Science Books, Sausalito, Calif.
Berardino, P., G. Fornaro, R. Lanari, and E. Sansosti (2002), A new algo-rithm for surface deformation monitoring based on small baseline differ-ential SAR interferograms, IEEE Trans. Geosci. Remote Sens., 40,2375–2383.
Bonilla, M. (1988), Minimum earthquake magnitude associated withcoseismic surface faulting, Bull. Assoc. Eng. Geologists, 25, 17–29.
Bonilla, M. G., R. K. Mark, and J. J. Lienkaemper (1984), Statistical rela-tions among earthquake magnitude, surface rupture length, and surfacefault displacement, Bull. Seismol. Soc. Am., 74(6), 2379–2411.
Boore, D. M., and W. S. Dunbar (1977), Effect of the free surface oncalculated stress drops, Bull. Seismol. Soc. Am., 67(6), 1661–1664.
Bowman, J., and C. Yong (1997), Case 22 a seismicity precursor to asequence of Ms 6.3–6.7 midplate earthquakes in Australia, Pure Appl.Geophys., 149(1), 61–78.
Brune, J. (1970), Tectonic stress and the spectra of seismic shear wavesfrom earthquakes, J. Geophys. Res., 75(26), 4997–5009.
Brune, J. (1971), Tectonic stress and the spectra of seismic shear wavesfrom earthquakes (correction), J. Geophys. Res., 76, 20,5002.
Carminati, E., C. Doglioni, and S. Barba (2004), Reverse migration ofseismicity on thrusts and normal faults, Earth Sci. Rev., 65(3–4), 195–222.
Cattin, R., P. Briole, H. Lyon-Caen, P. Bernard, and P. Pinettes (1999),Effects of superficial layers on coseismic displacements for a dip-slipfault and geophysical implications, Geophys. J. Int., 137, 149–158.
Cavalie, O., M. Doin, C. Lasserre, and P. Briole (2007), Ground motionmeasurement in the Lake Mead area, Nevada, by differential syntheticaperture radar interferometry time series analysis: Probing the lithosphererheological structure, J. Geophys. Res., 112, B03403, doi:10.1029/2006JB004344.
Chen, C. W., and H. A. Zebker (2001), Two-dimensional phase unwrappingwith use of statistical models for cost functions in nonlinear optimization,J. Opt. Soc. Am. A, 18, 338–351.
Clark, D. (2008), Identification of Quaternary scarps in southwest andcentral west Western Australia using DEM-based hill shading: Applica-tion to seismic hazard assessment and neotectonics, Int. J. Remote Sens.,in press.
Coblentz, D., S. Zhou, R. Hillis, R. Richardson, and M. Sandiford (1998),Topography, boundary forces, and the Indo-Australian intraplate stressfield, J. Geophys. Res., 103(B1), 919–932.
Collins, C., R. Kayen, B. Carkin, A. Trevor, P. Cummins, and A. McPherson(2006), Shear wave velocity measurement at Australian ground motionseismometer sites by the spectral analysis of surface waves (SASW)method, paper presented at 2006 The Australian Earthquake Engineer-ing Society Conference Proceedings, Canberra, ACT.
Costantini, M., and P. A. Rosen (1999), A generalized phase unwrappingapproach for sparse data, Geosci. Remote Sens. Symp. (1999), IGARSS’99 Proc., IEEE 1999 Int., 1, 267–269.
Cressie, N. A. C. (1993), Statistics for Spatial Data, John- Wiley, NewYork.
Crone, A. J., M. N. Machette, and J. Bowman (1997), Episodic nature ofearthquake activity in stable continental regions revealed by palaeoseis-micity studies of Australian and North American quaternary faults, Aust.J. Earth Sci., 44(2), 203–214.
Crone, A. J., P. M. De Martini, M. N. Machette, K. Okumura, and J. R.Prescott (2003), Paleoseismicity of two historically quiescent faults inAustralia: Implications for fault behavior in stable continental regions,Bull. Seismol. Soc. Am., 93(5), 1913–1934, doi:10.1785/0120000094.
Dawson, J., and P. Tregoning (2007), Uncertainty analysis of earthquakesource parameters determined from InSAR: A simulation study, J. Geo-phys. Res., 112, B09406, doi:10.1029/2007JB005209.
Denham, D., L. Alexander, and G. Worotnicki (1980), The stress fieldnear the sites of the Meckering (1968) and Calingiri (1970) earthquakes,Western Australia, Tectonophysics, 67, 283–317.
Denham, D., L. G. Alexander, I. B. Everingham, P. J. Gregson, R.McCaffrey,and J. R. Enever (1987), The 1979 Cadoux earthquake and intraplate stressin Western Australia, Aust. J. Earth Sci., 34, 507–521.
Dentith, M. C., and W. E. Featherstone (2003), Controls on intra-plateseismicity in southwestern Australia, Tectonophysics, 376, 167–184.
Dentith, M., V. Dent, and B. Drummond (2000), Deep crustal structure inthe southwestern Yilgarn Craton, Western Australia, Tectonophysics,325(3–4), 227–255.
Dodge, D. A., G. C. Beroza, and W. Ellsworth (1995), Foreshock se-quence of the 1992 Landers, California, earthquake and its implicationsfor earthquake nucleation, J. Geophys. Res., 100(B6), 9865–9880.
Drummond, B. J., and C. D. N. Collins (1986), Seismic evidence for under-plating of the lower continental crust of Australia, Earth Planet. Sci. Lett.,79(3–4), 361–372.
Eineder, M., and J. Holzner (1999), Phase unwrapping of low coherencedifferential interferograms, Geosci. Remote Sens. Symp. (1999),IGARSS’99 Proc., IEEE 1999 Inte., 3.
Everingham, I. B., P. J. Gregson, and H. A. Doyle (1969), Thrust fault scarpin the Western Australian shield, Nature (London), 223, 701–703.
Farr, T. G., et al. (2007), The shuttle radar topography mission, Rev. Geo-phys., 45, RG2004, doi:10.1029/2005RG000183.
Feigl, K. L. (2002), Estimating earthquake source parameters from geodeticmeasurements, Int. Handb. Earthq. Eng. Seismol., 81A, 607–620.
Feigl, K., A. Sergent, and D. Jacq (1995), Estimation of an earthquakefocal mechanism from a satellite radar interferogram: Application tothe December 4, 1992 Landers aftershock, Geophys. Res. Lett., 22(9),1037–1040.
Ferretti, A., C. Prati, and F. Rocca (2000), Nonlinear subsidence rate esti-mation using permanent scatterers in differential SAR interferometry,IEEE Trans. Geosci. Remote Sens., 38, 2202–2212.
Fialko, Y., D. Sandwell, M. Simons, and P. Rosen (2005), Three-dimensionaldeformation caused by the Bam, Iran, earthquake and the origin of shallowslip deficit, Nature, 435, 295–299.
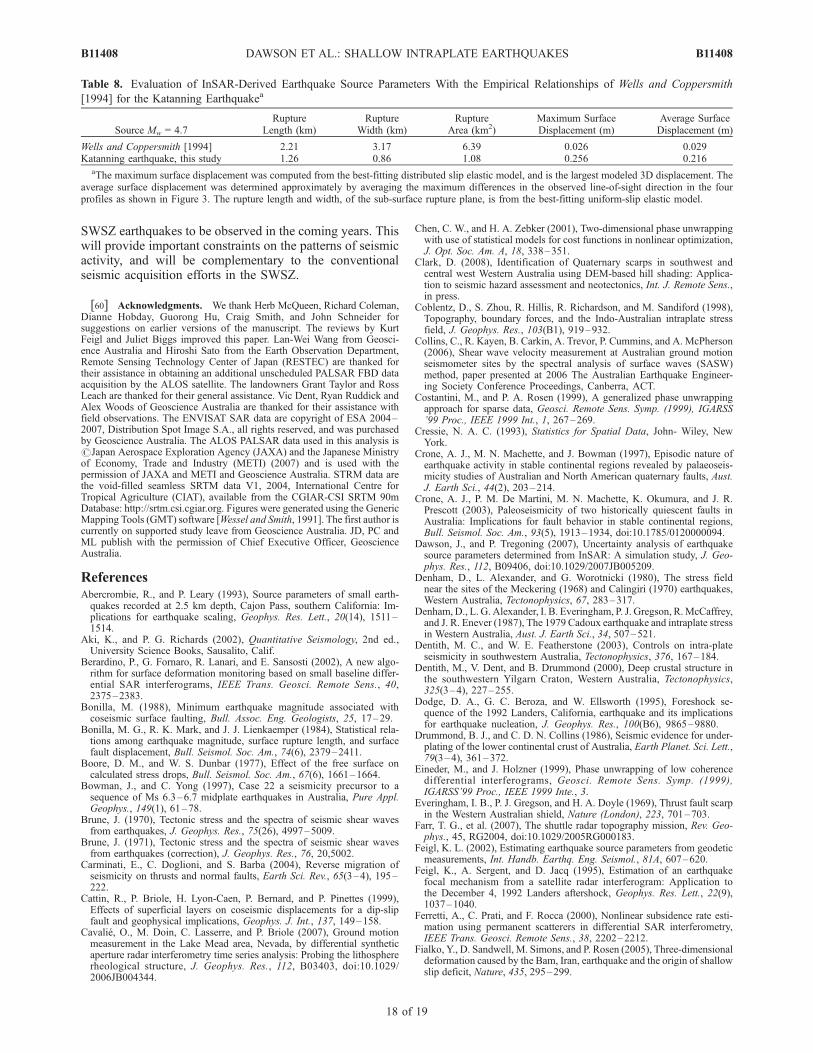
Table 8. Evaluation of InSAR-Derived Earthquake Source Parameters With the Empirical Relationships of Wells and Coppersmith
[1994] for the Katanning Earthquakea
Source Mw = 4.7Rupture
Length (km)Rupture
Width (km)Rupture
Area (km2)Maximum SurfaceDisplacement (m)
Average SurfaceDisplacement (m)
Wells and Coppersmith [1994] 2.21 3.17 6.39 0.026 0.029Katanning earthquake, this study 1.26 0.86 1.08 0.256 0.216
aThe maximum surface displacement was computed from the best-fitting distributed slip elastic model, and is the largest modeled 3D displacement. Theaverage surface displacement was determined approximately by averaging the maximum differences in the observed line-of-sight direction in the fourprofiles as shown in Figure 3. The rupture length and width, of the sub-surface rupture plane, is from the best-fitting uniform-slip elastic model.
B11408 DAWSON ET AL.: SHALLOW INTRAPLATE EARTHQUAKES
18 of 19
B11408

Freed, A. M. (2005), Earthquake triggering by static, dynamic, and post-seismic stress transfer, Annu. Rev. Earth Planet. Sci., 335–367.
Funning, G. J., B. Parsons, T. J. Wright, J. A. Jackson, and E. J. Fielding(2005), Surface displacements and source parameters of the 2003 Bam(Iran) earthquake from ENVISAT advanced synthetic aperture radar ima-gery, J. Geophys. Res., 110, B09406, doi:10.1029/2004JB003338.
Ghiglia, D. C., and M. D. Pritt (1998), Two-Dimensional Phase Unwrap-ping: Theory, Algorithms, and Software, John Wiley, New York.
Hanks, T. C., and H. Kanamori (1979), A moment-magnitude scale,J. Geophys. Res., 84(B5), 2348–2350.
Hillis, R. R., and S. D. Reynolds (2000), The Australian stress map,J. Geol. Soc. London, 157, 915–921.
Jonsson, S., H. Zebker, P. Segall, and F. Amelung (2002), Fault slip dis-tribution of the 1999 Mw 7.1 Hector Mine, California, earthquake, esti-mated from satellite radar and GPS measurements, Bull. Seismol. Soc.Am., 92, 1377–1389.
Kampes, B., and S. Usai (1999), Doris: The delft object-oriented radarinterferometric software, paper presented at Proceedings of the ITC2nd ORS Symposium.
Kenner, S. J., and P. Segall (2000), A mechanical model for intraplateearthquakes: Application to the New Madrid seismic zone, Science, 289.
King, G. C. P., R. S. Stein, and J. Lin (1994), Static stress changes and thetriggering of earthquakes, Bull. Seismol. Soc. Am., 84, 935–953.
Klose, C. D., and L. Seeber (2007), Shallow seismicity in stable continentalregions, Seismol. Res., 78(5), 554–562, doi:10.1785/gssrl.78.5.554.
Lawson, C., and R. Hanson (1974), Solving Least Squares Problems,Prentice-Hall, Englewood Cliffs, N. J.
Leonard, M. (2008), One hundred years of earthquake recording inAustralia, Bull. Seismol. Soc. Am., 98, 1458–1470.
Leonard, M., I. D. Ripper, and L. Yue (2002), Australian earthquake faultplane solutions, Geosci. Aust., Record 2002/19, 114.
Lin, J., and R. S. Stein (2004), Stress triggering in thrust and subductionearthquakes, and stress interaction between the southern San Andreas andnearby thrust and strike– slip faults, J. Geophys. Res., 109, B02303,doi:10.1029/2003JB002607.
Lohman, R. B., and M. Simons (2005), Locations of selected small earth-quakes in the Zagros Mountains, Geochem. Geophys. Geosyst., 6,Q03001, doi:10.1029/2004GC000849.
Lohman, R. B., M. Simons, and B. Savage (2002), Location and mechan-ism of the little skull mountain earthquake as constrained by satelliteradar interferometry and seismic waveform modeling, J. Geophys. Res.,107(B6), 2118, doi:10.1029/2001JB000629.
Massonnet, D., and K. L. Feigl (1995), Satellite radar interferometric mapof the coseismic deformation field of the M = 6.1 Eureka Valley, Cali-fornia earthquake of May 17, 1993, Geophys. Res. Lett., 22(12), 1541–1544.
Masterlark, T. (2003), Finite element model predictions of static deforma-tion from dislocation sources in a subduction zone: Sensitivities to homo-geneous, isotropic, Poisson-solid, and half-space assumptions,J. Geophys. Res., 108(B11), 2540, doi:10.1029/2002JB002296.
Mellors, R. J., H. Magistrale, P. Earle, and A. Cogbill (2004), Comparisonof four moderate-size earthquakes in southern California using seismol-ogy and InSAR, Bull. Seismol. Soc. Am., 94, 2004–2014.
Mohammadioun, B., and L. Serva (2001), Stress drop, slip type, earthquakemagnitude, and seismic hazard, Bull. Seismol. Soc. Am., 91(4), 694–707,doi:10.1785/0120000067.
Myers, J. S. (1993), Precambrian history of the West Australian craton andadjacent orogens, Annu. Rev. Earth Planet. Sci., 21, 453–485.
Okada, Y. (1985), Surface deformation due to shear and tensile faults in ahalf-space, Bull. Seismol. Soc. Am., 75, 1135–1154.
Press, W. H., S. A. Teukolsky, W. T. Vetterling, and B. P. Flannery (1992),Numerical Recipes in C, The Art of Scientific Computing, 2nd ed., Cam-bridge Univ. Press, Cambridge.
Reading, A. M., B. L. N. Kennett, and M. C. Dentith (2003), Seismicstructure of the Yilgarn Craton, Western Australia, Aust. J. Earth Sci.,50(3), 427–438.
Reinecker, J., O. Heidbach, M. Tingay, B. Sperner, and B. Muller(2005), The 2005 release of the world stress map. (Available onlineat www.world-stress-map.org)
Reynolds, S. D., and R. R. Hillis (2000), The in situ stress field of the PerthBasin, Australia, Geophys. Res. Lett., 27(20), 3421–3424.
Reynolds, S. D., D. D. Coblentz, and R. R. Hillis (2002), Tectonic forcescontrolling the regional intraplate stress field in continental Australia;results from new finite element modeling, J. Geophys. Res., 107(B7),2131, doi:10.1029/2001JB000408.
Richardson, R., and S. Solomon (1977), Apparent stress and stress drop forintraplate earthquakes and tectonic stress in the plates, Pure Appl. Geo-phys., 115(1), 317–331.
Scharroo, R., and P. Visser (1998), Precise orbit determination and gravityfield improvement for the ERS satellites, Geophys. Res. Lett., 103(C4),8113–8127.
Schmidt, D. A., and R. Burgmann (2003), Time-dependent land uplift andsubsidence in the Santa Clara valley, California, from a large interfero-metric synthetic aperture radar data set, J. Geophys. Res., 108(B8), 2416,doi:10.1029/2002JB002267.
Scholz, C. H. (2002), The Mechanics of Earthquakes and Faulting,2nd ed., Cambridge Univ. Press, Cambridge, U. K.
Seeber, L., J. Armbruster, W. Kim, N. Barstow, and C. Scharnberger (1998),The 1994 Cacoosing Valley earthquakes near Reading, Pennsylvania: Ashallow rupture triggered by quarry unloading, J. Geophys. Res.,103(B10), 24,505–24,522.
Simpson, D. (1986), Triggered earthquakes, Annu. Rev. Earth Planet. Sci.,14(1), 21–42.
Stein, S., and M. Wysession (2003), An Introduction to Seismology, Earth-quakes, and Earth Structure, Blackwell, Malden, Mass.
Toda, S., R. S. Stein, K. Richards-Dinger, and S. Bozkurt (2005), Forecast-ing the evolution of seismicity in southern California: Animations builton earthquake stress transfer, J. Geophys. Res., 110, B05S16,doi:10.1029/2004JB003415.
Turcotte, D., and G. Schubert (2002), Geodynamics, Cambridge Univ.Press, New York.
Venkataraman, A., J. Mori, H. Kanamori, and L. Zhu (2000), Fine structureof the rupture zone of the April 26 and 27, 1997, Northridge aftershocks,J. Geophys. Res., 105(B8), 19,085–19,094.
Vogfjord, K. S., and C. A. Langston (1987), The Meckering earthquake of14 October 1968; a possible downward propagating rupture, Bull. Seis-mol. Soc. Am., 77, 1558–1578.
Waldhauser, F., and W. L. Ellsworth (2000), A double-difference earth-quake location algorithm: Method and application to the Northern Hay-ward Fault, California, Bull. Seismol. Soc. Am., 90, 1353–1368.
Wells, D. L., and K. J. Coppersmith (1994), New empirical relationshipsamong magnitude, rupture length, rupture width, rupture area, and sur-face displacement, Bull. Seismol. Soc. Am., 84, 974–1002.
Wessel, P., and W. H. F. Smith (1991), Free software helps map and displaydata, Eos Trans. AGU, 72, 441.
Wright, T. J., B. E. Parsons, J. A. Jackson, M. Haynes, E. J. Fielding, P. C.England, and P. J. Clarke (1999), Source parameters of the 1 October1995 Dinar (Turkey) earthquake from SAR interferometry and seismicbodywave modelling, Earth Planet. Sci. Lett., 172, 23–37.
Wu, M., C. Sakae, and L. M. Keer (1998), Modeling of crustal layeringusing three-dimensional analysis of stress-drop slip zones in an elasticlayer/half-space system, Bull. Seismol. Soc. Am., 88(6), 1572–1579.
Zoback, M. L. (1992), Stress field constraints on intraplate seismicity inEastern North America, J. Geophys. Res., 97(B8), 11,761–11,782.
�����������������������P. Cummins and M. Leonard, Geoscience Australia, Cnr Jerrabomberra
Avenue and Hindmarsh Drive, Symonston, Canberra, ACT 2609, Australia.J. Dawson and P. Tregoning, Research School of Earth Sciences,
Australian National University, Building 61 Mills Road, Canberra, ACT0200, Australia. ([email protected])
B11408 DAWSON ET AL.: SHALLOW INTRAPLATE EARTHQUAKES
19 of 19
B11408