shanghai, greater china for personal use onlyoutlook for fy2013 . property order book and outlook...
TRANSCRIPT
COVER SLIDE: If you see this text, you must copy the ‘swish’ graphic from a pre-built COVER slide and onto this slide. This text will no longer be visible if done correctly.
PRIVATE & CONFIDENTIAL www.ugllimited.com www.dtz.com
UGL Analyst & Investor Tour Shanghai, Greater China 3 & 4 September 2012
For
per
sona
l use
onl
y

COVER SLIDE: If you see this text, you must copy the ‘swish’ graphic from a pre-built COVER slide and onto this slide. This text will no longer be visible if done correctly.
Welcome and opening Richard Leupen, Managing Director & CEO
1
For
per
sona
l use
onl
y
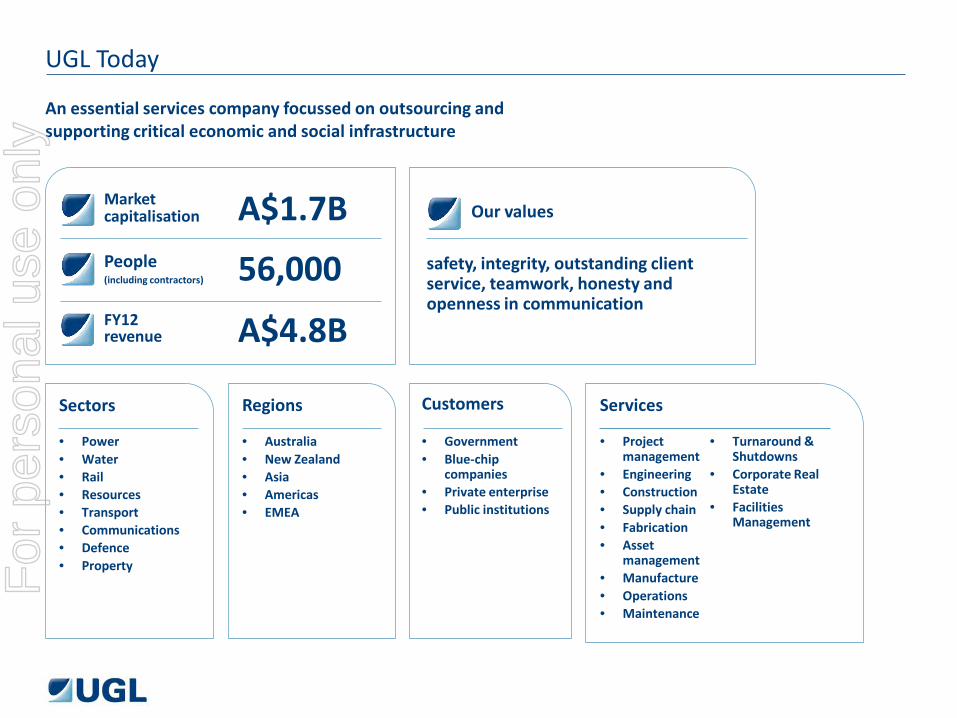
UGL Today
An essential services company focussed on outsourcing and supporting critical economic and social infrastructure
safety, integrity, outstanding client service, teamwork, honesty and openness in communication
People (including contractors)
Market capitalisation
FY12 revenue
Our values
Sectors Regions Customers Services
• Power • Water • Rail • Resources • Transport • Communications • Defence • Property
• Australia • New Zealand • Asia • Americas • EMEA
• Government • Blue-chip
companies • Private enterprise • Public institutions
• Project management
• Engineering • Construction • Supply chain • Fabrication • Asset
management • Manufacture • Operations • Maintenance
• Turnaround & Shutdowns
• Corporate Real Estate
• Facilities Management
56,000
A$1.7B
A$4.8B
For
per
sona
l use
onl
y
DTZ colour palette
Colour used for graphs and pie charts. Use the colours in the following order.
R G B
0 61 121
2
R G B
86 155 190
3
R G B
110 95 63
4
R G B
84 117 141
5
R G B
109 132 173
6
R G B
107 185 195
7
R G B
163 199 219
8
R G B
158 137 137
9
R G B
157 171 187
10
R G B
172 183 210
11
The secondary colours can be accessed from the “Custom Colours” palette The secondary/accent colours should ONLY be used when reporting/using for financials graphics.
R G B
0 139 152
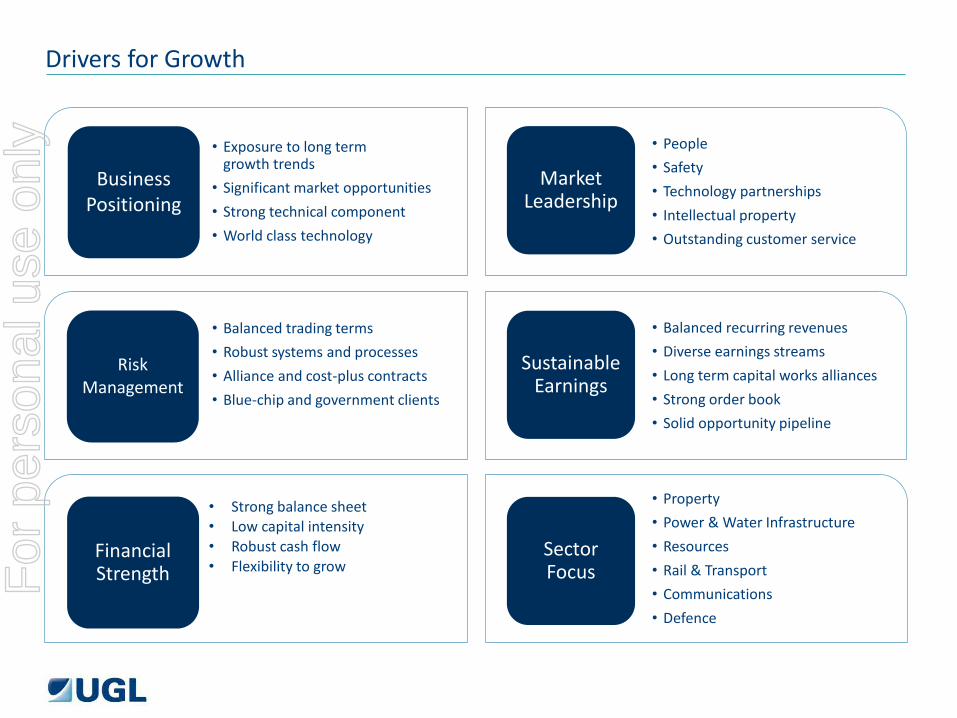
1 Drivers for Growth
• Exposure to long term growth trends
• Significant market opportunities
• Strong technical component
• World class technology
• Balanced trading terms
• Robust systems and processes
• Alliance and cost-plus contracts
• Blue-chip and government clients
• Strong balance sheet • Low capital intensity • Robust cash flow • Flexibility to grow
• Property
• Power & Water Infrastructure
• Resources
• Rail & Transport
• Communications
• Defence
• Balanced recurring revenues
• Diverse earnings streams
• Long term capital works alliances
• Strong order book
• Solid opportunity pipeline
• People
• Safety
• Technology partnerships
• Intellectual property
• Outstanding customer service
Business Positioning
Financial Strength
Risk Management
Sustainable Earnings
Market Leadership
Sector Focus F
or p
erso
nal u
se o
nly

Becoming a Global Leader in Property Services through Selected Acquisitions
UGL acquires facilities services firm UNICCO,
adding 20,000 employees in North
America
UGL acquires Singapore-based
Premas, expanding into 16 major cities
in Asia
UGL acquires the trading operations of CRE company DTZ Holdings plc. expanding presence in the UK, Europe,
Middle East and Asia
2005 2006 2007 2011
UGL acquires Chicago-based CRE firm Equis,
establishing a presence in the US and India
Acquisition of Kilpatrick Green
1998
Acquisition of KFPW
2002
Merged Kilpatrick Green and KFPW
facilities management
business
2004
0.3 0.4
1.1
1.6 1.4 1.3
1.9
FY06 FY07 FY08 FY09 FY10 FY11 FY11 Pro-forma
For
per
sona
l use
onl
y
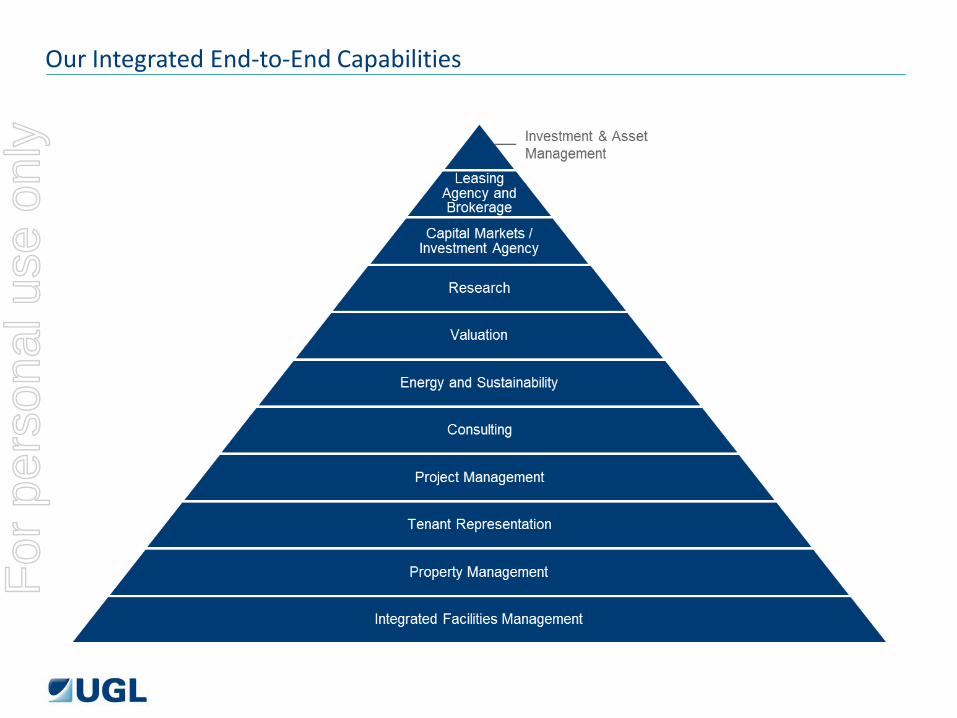
Our Integrated End-to-End Capabilities F
or p
erso
nal u
se o
nly
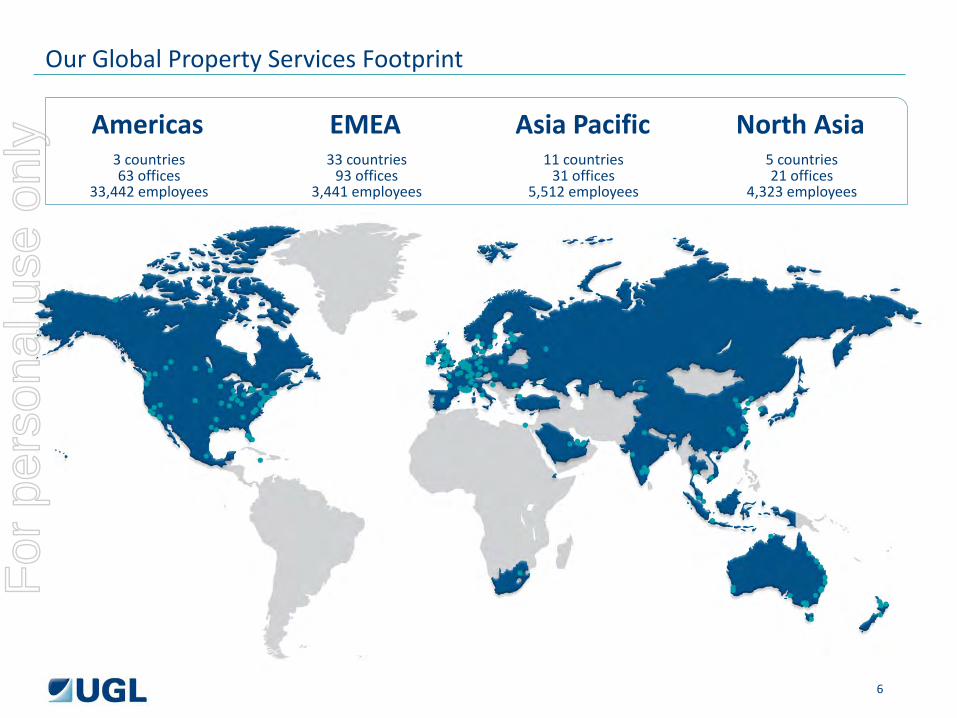
Our Global Property Services Footprint
Americas 3 countries 63 offices
33,442 employees
EMEA 33 countries
93 offices 3,441 employees
Asia Pacific 11 countries
31 offices 5,512 employees
North Asia 5 countries 21 offices
4,323 employees
6
For
per
sona
l use
onl
y
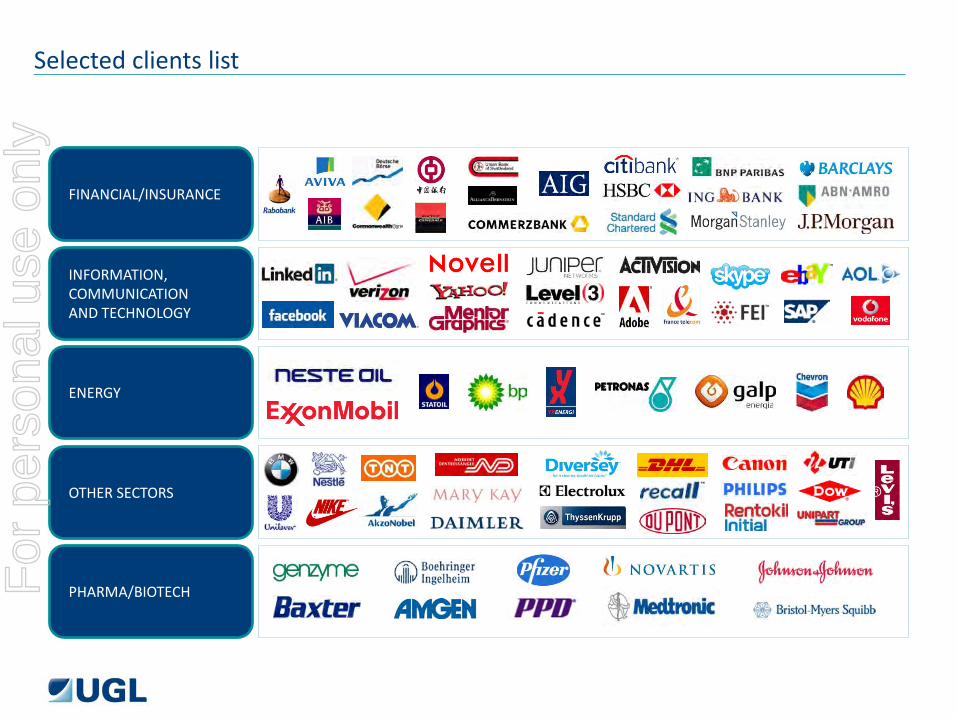
INFORMATION, COMMUNICATION AND TECHNOLOGY
OTHER SECTORS
ENERGY
FINANCIAL/INSURANCE
PHARMA/BIOTECH
Selected clients list F
or p
erso
nal u
se o
nly
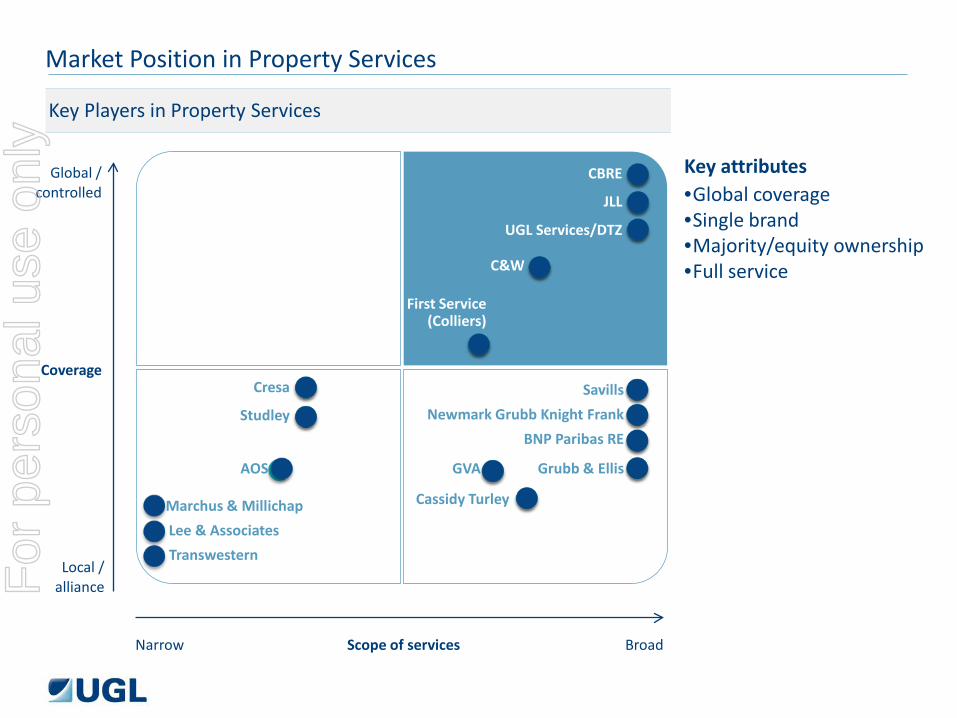
Key Players in Property Services
Key attributes Global / controlled
Coverage
Local / alliance
Narrow Scope of services Broad
•Global coverage •Single brand •Majority/equity ownership •Full service
CBRE
JLL
UGL Services/DTZ
C&W
First Service (Colliers)
Savills
Newmark Grubb Knight Frank
BNP Paribas RE
Grubb & Ellis GVA
Cassidy Turley
AOS
Studley
Cresa
Market Position in Property Services
Marchus & Millichap
Lee & Associates
Transwestern
For
per
sona
l use
onl
y
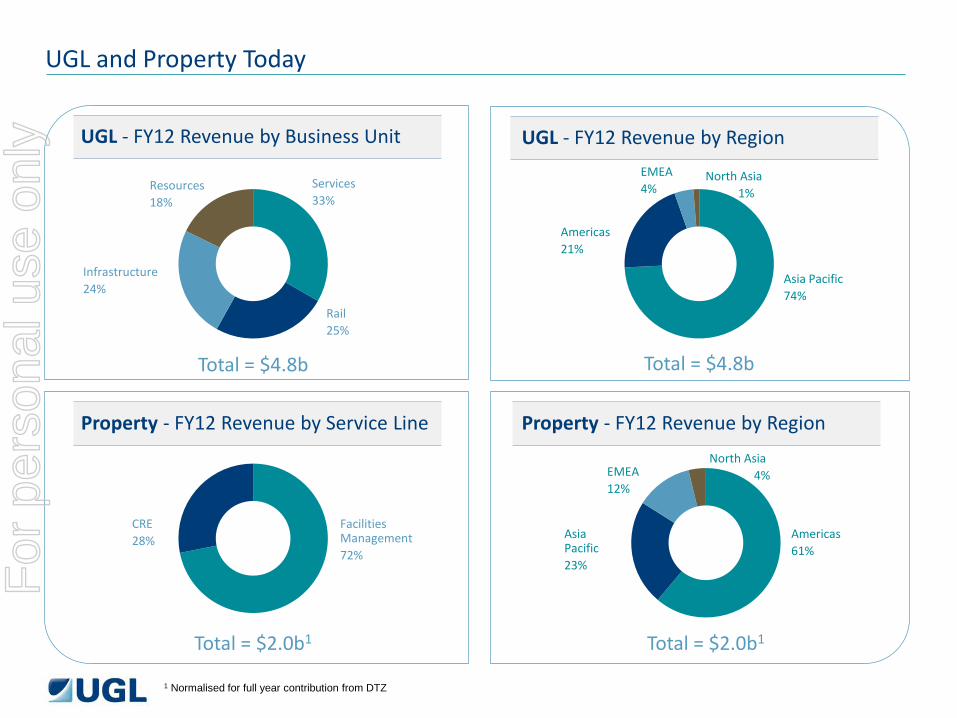
UGL and Property Today
UGL - FY12 Revenue by Business Unit UGL - FY12 Revenue by Region
Property - FY12 Revenue by Region Property - FY12 Revenue by Service Line
Resources 18%
Services 33%
Rail 25%
Infrastructure 24%
Total = $4.8b
North Asia 1%
Asia Pacific 74%
EMEA 4%
Americas 21%
Total = $4.8b
Facilities Management 72%
CRE 28%
Total = $2.0b1
Americas 61%
Asia Pacific 23%
EMEA 12%
North Asia 4%
Total = $2.0b1
1 Normalised for full year contribution from DTZ
For
per
sona
l use
onl
y
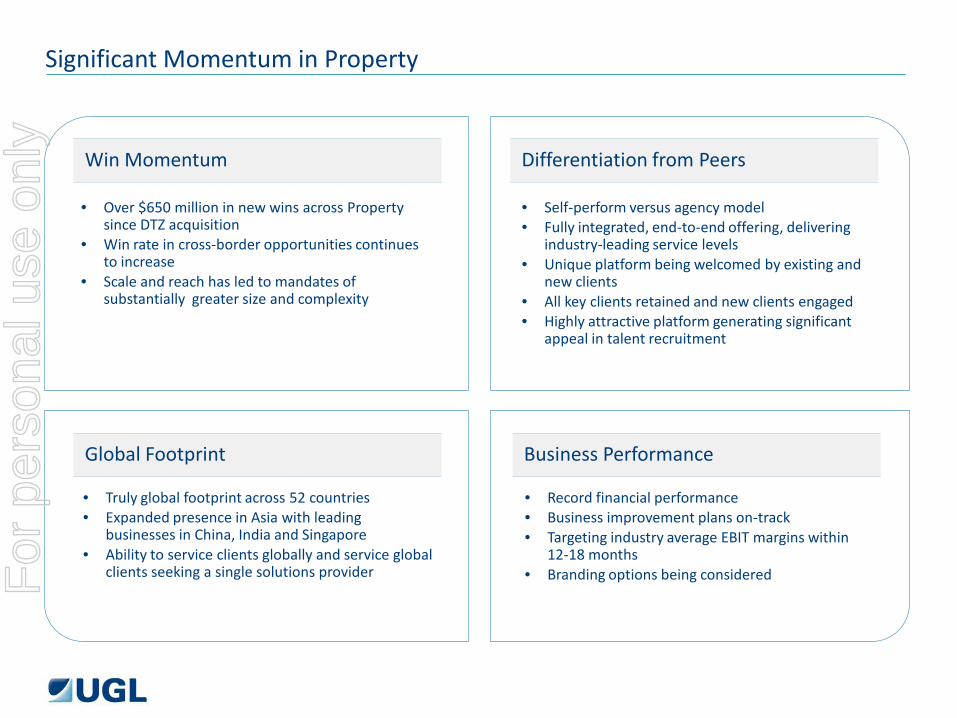
Significant Momentum in Property
Win Momentum Differentiation from Peers
Business Performance Global Footprint
• Over $650 million in new wins across Property since DTZ acquisition
• Win rate in cross-border opportunities continues to increase
• Scale and reach has led to mandates of substantially greater size and complexity
• Self-perform versus agency model • Fully integrated, end-to-end offering, delivering
industry-leading service levels • Unique platform being welcomed by existing and
new clients • All key clients retained and new clients engaged • Highly attractive platform generating significant
appeal in talent recruitment
• Record financial performance • Business improvement plans on-track • Targeting industry average EBIT margins within
12-18 months • Branding options being considered
• Truly global footprint across 52 countries • Expanded presence in Asia with leading
businesses in China, India and Singapore • Ability to service clients globally and service global
clients seeking a single solutions provider For
per
sona
l use
onl
y
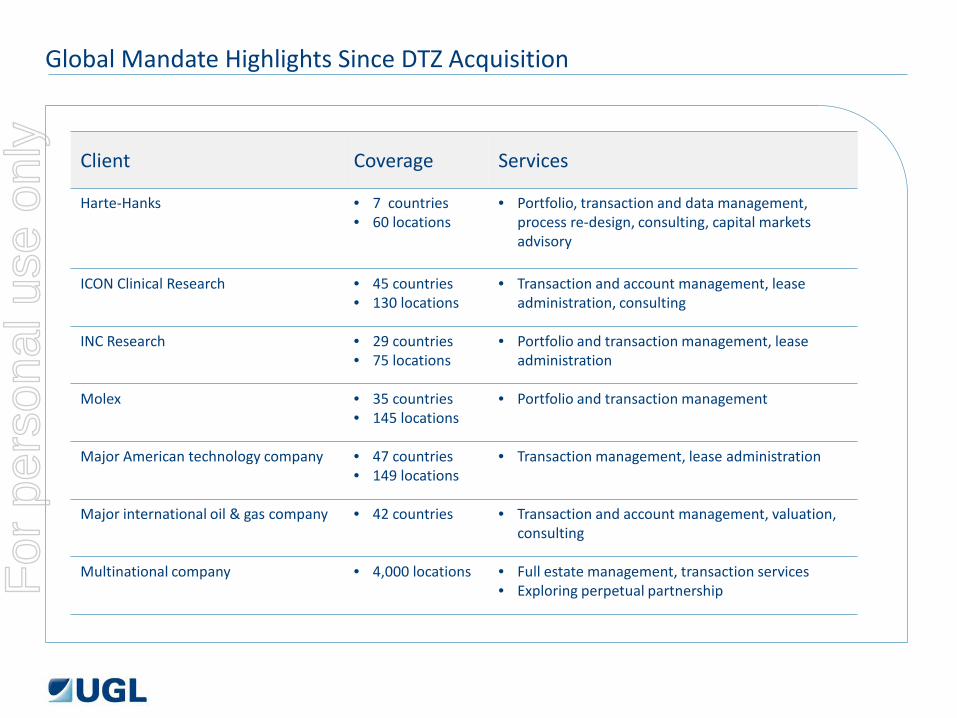
Global Mandate Highlights Since DTZ Acquisition
Client Coverage Services
Harte-Hanks • 7 countries • 60 locations
• Portfolio, transaction and data management, process re-design, consulting, capital markets advisory
ICON Clinical Research • 45 countries • 130 locations
• Transaction and account management, lease administration, consulting
INC Research • 29 countries • 75 locations
• Portfolio and transaction management, lease administration
Molex • 35 countries • 145 locations
• Portfolio and transaction management
Major American technology company • 47 countries • 149 locations
• Transaction management, lease administration
Major international oil & gas company • 42 countries • Transaction and account management, valuation, consulting
Multinational company • 4,000 locations
• Full estate management, transaction services • Exploring perpetual partnership F
or p
erso
nal u
se o
nly
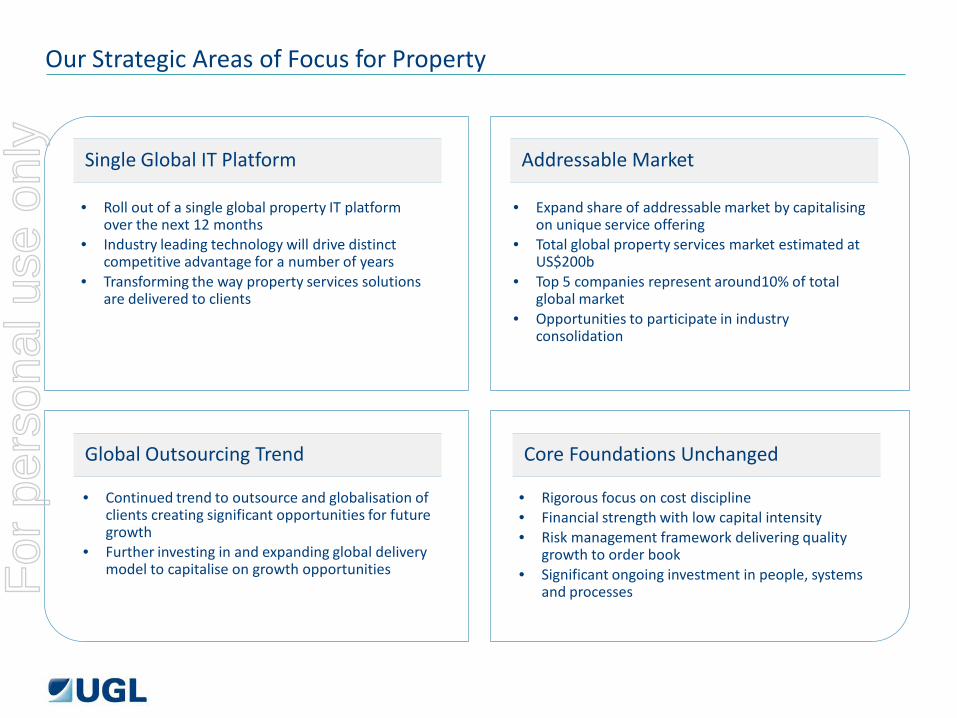
Our Strategic Areas of Focus for Property
Single Global IT Platform Addressable Market
Core Foundations Unchanged Global Outsourcing Trend
• Roll out of a single global property IT platform over the next 12 months
• Industry leading technology will drive distinct competitive advantage for a number of years
• Transforming the way property services solutions are delivered to clients
• Expand share of addressable market by capitalising on unique service offering
• Total global property services market estimated at US$200b
• Top 5 companies represent around10% of total global market
• Opportunities to participate in industry consolidation
• Continued trend to outsource and globalisation of clients creating significant opportunities for future growth
• Further investing in and expanding global delivery model to capitalise on growth opportunities
• Rigorous focus on cost discipline • Financial strength with low capital intensity • Risk management framework delivering quality
growth to order book • Significant ongoing investment in people, systems
and processes
For
per
sona
l use
onl
y
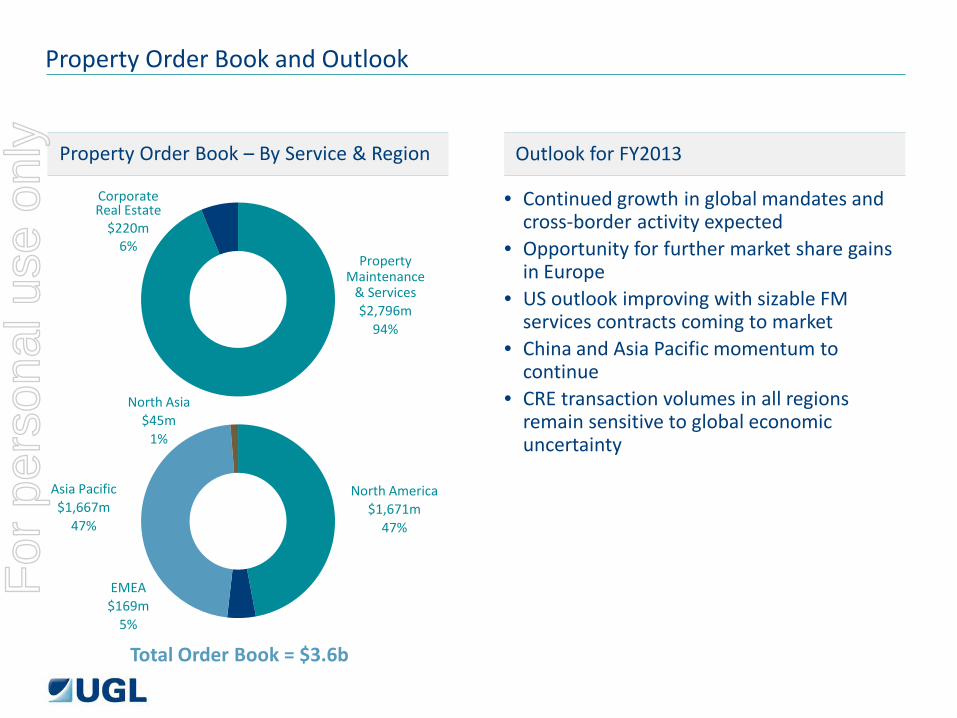
Property Order Book – By Service & Region Outlook for FY2013
Property Order Book and Outlook
• Continued growth in global mandates and cross-border activity expected
• Opportunity for further market share gains in Europe
• US outlook improving with sizable FM services contracts coming to market
• China and Asia Pacific momentum to continue
• CRE transaction volumes in all regions remain sensitive to global economic uncertainty
Total Order Book = $3.6b
Corporate Real Estate
$220m 6%
Property Maintenance
& Services $2,796m
94%
North America $1,671m
47%
Asia Pacific $1,667m
47%
EMEA $169m
5%
North Asia $45m
1%
For
per
sona
l use
onl
y
Robert Shibuya, Group President
UGL Services / DTZ
14
For
per
sona
l use
onl
y
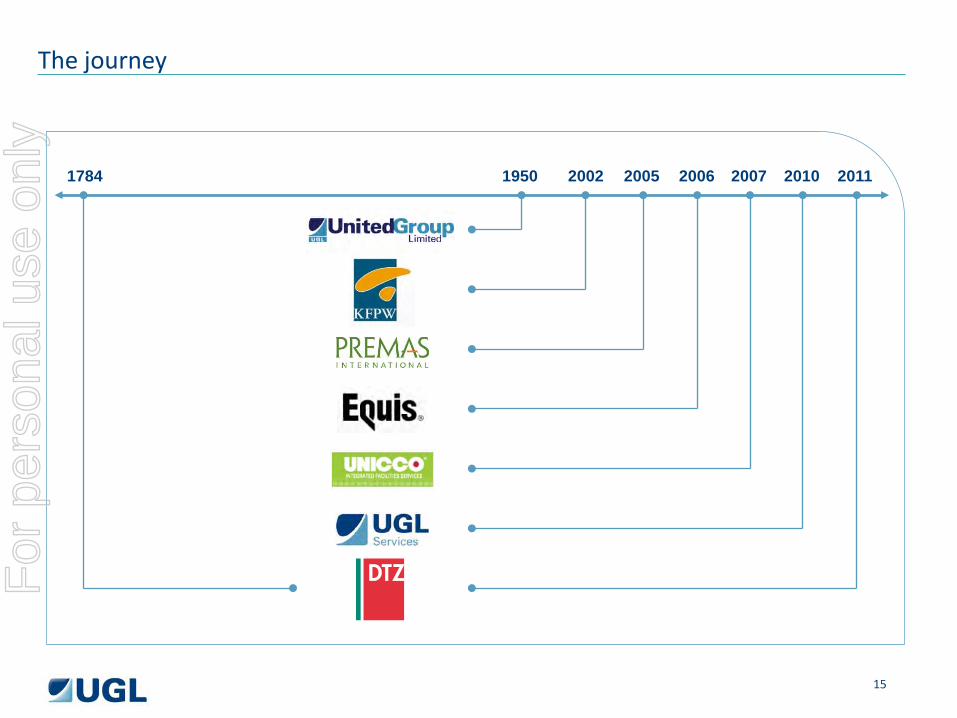
1784 2007 1950 2006 2011 2005 2002 2010
The journey
15
For
per
sona
l use
onl
y
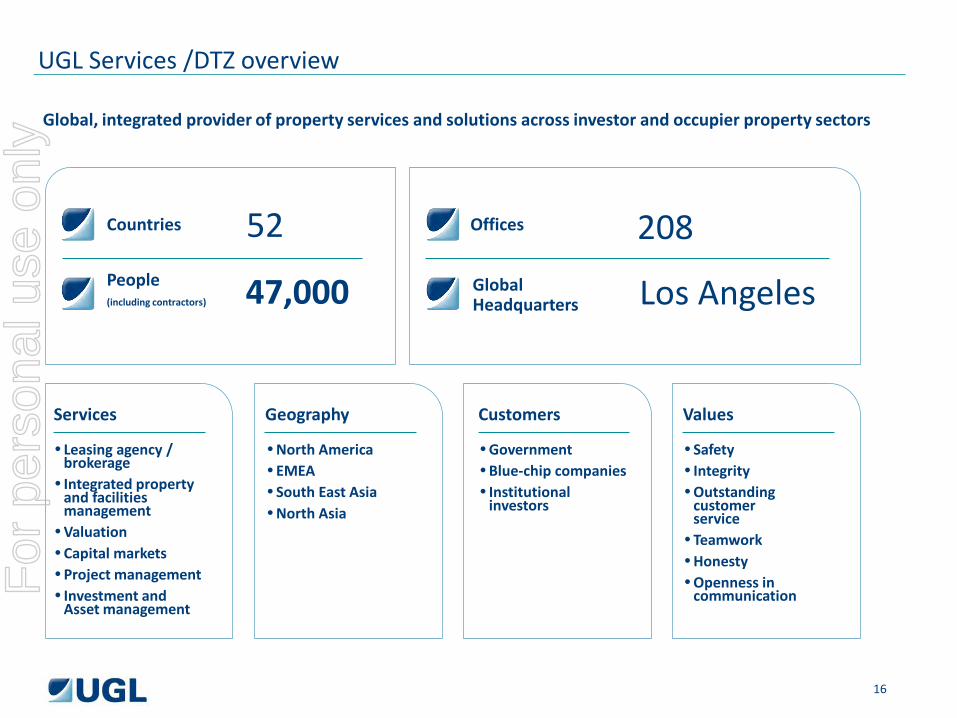
Countries Offices
Geography
Customers
Services
• North America • EMEA • South East Asia • North Asia
• Government • Blue-chip companies • Institutional
investors
• Leasing agency / brokerage
• Integrated property and facilities management
• Valuation • Capital markets • Project management • Investment and
Asset management
52 People (including contractors) 47,000
Values
• Safety • Integrity • Outstanding
customer service
• Teamwork • Honesty • Openness in
communication
208 Global Headquarters Los Angeles
UGL Services /DTZ overview
Global, integrated provider of property services and solutions across investor and occupier property sectors
16
For
per
sona
l use
onl
y
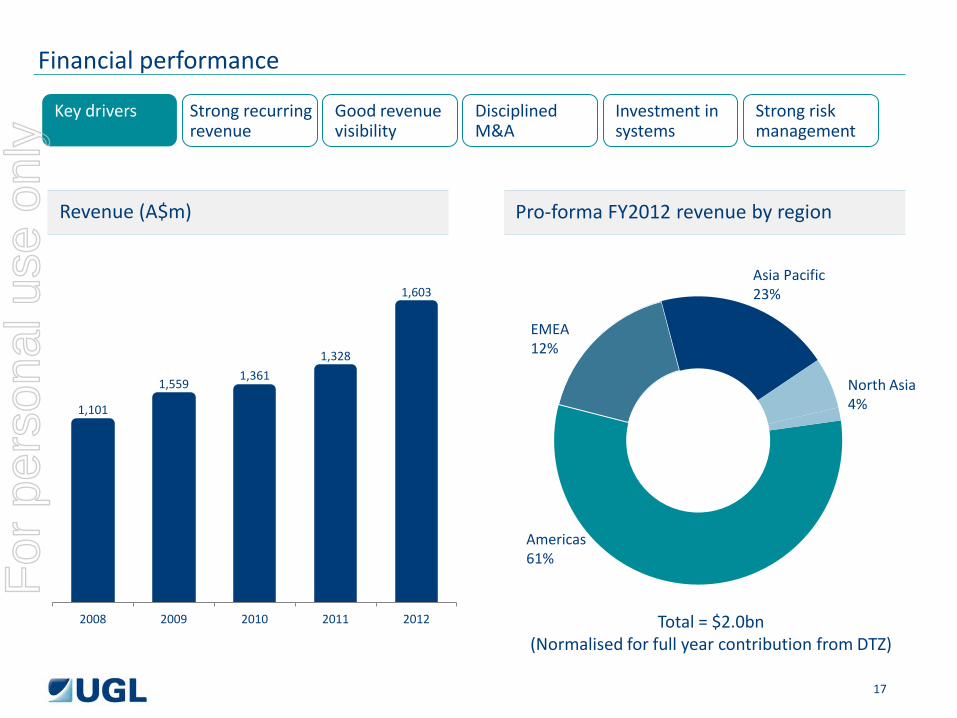
1,101
1,559 1,361
1,328
1,603
2008 2009 2010 2011 2012
Financial performance
Key drivers Strong recurring revenue
Good revenue visibility
Disciplined M&A
Investment in systems
Strong risk management
EMEA 12%
Americas 61%
Asia Pacific 23%
North Asia 4%
Revenue (A$m) Pro-forma FY2012 revenue by region
Total = $2.0bn (Normalised for full year contribution from DTZ)
17
For
per
sona
l use
onl
y

Sustainable platform
Revenue by type – Pre-DTZ acquisition Revenue by type – Post-DTZ acquisition
Transactional revenue 8%
Recurring Revenue 92%
Transactional revenue 28%
Recurring revenue 72%
18
For
per
sona
l use
onl
y
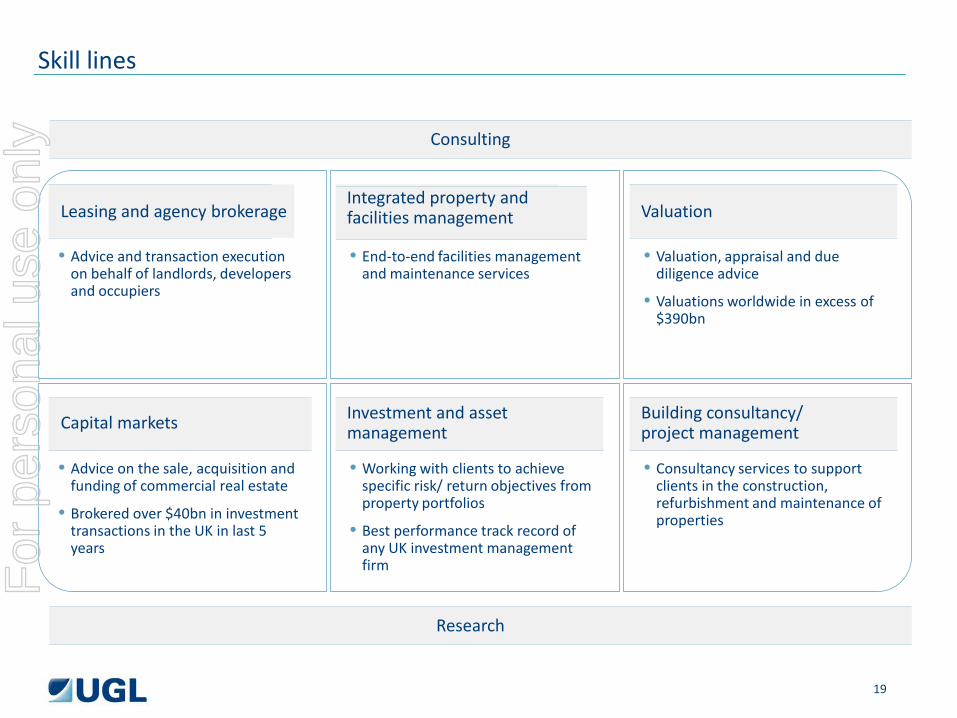
Skill lines
Leasing and agency brokerage
Capital markets
• Advice and transaction execution on behalf of landlords, developers and occupiers
• Advice on the sale, acquisition and funding of commercial real estate
• Brokered over $40bn in investment transactions in the UK in last 5 years
Investment and asset management
• End-to-end facilities management and maintenance services
• Working with clients to achieve specific risk/ return objectives from property portfolios
• Best performance track record of any UK investment management firm
Valuation
Building consultancy/ project management
• Valuation, appraisal and due diligence advice
• Valuations worldwide in excess of $390bn
• Consultancy services to support clients in the construction, refurbishment and maintenance of properties
Consulting
Research
Integrated property and facilities management
19
For
per
sona
l use
onl
y

Select client projects
20
For
per
sona
l use
onl
y
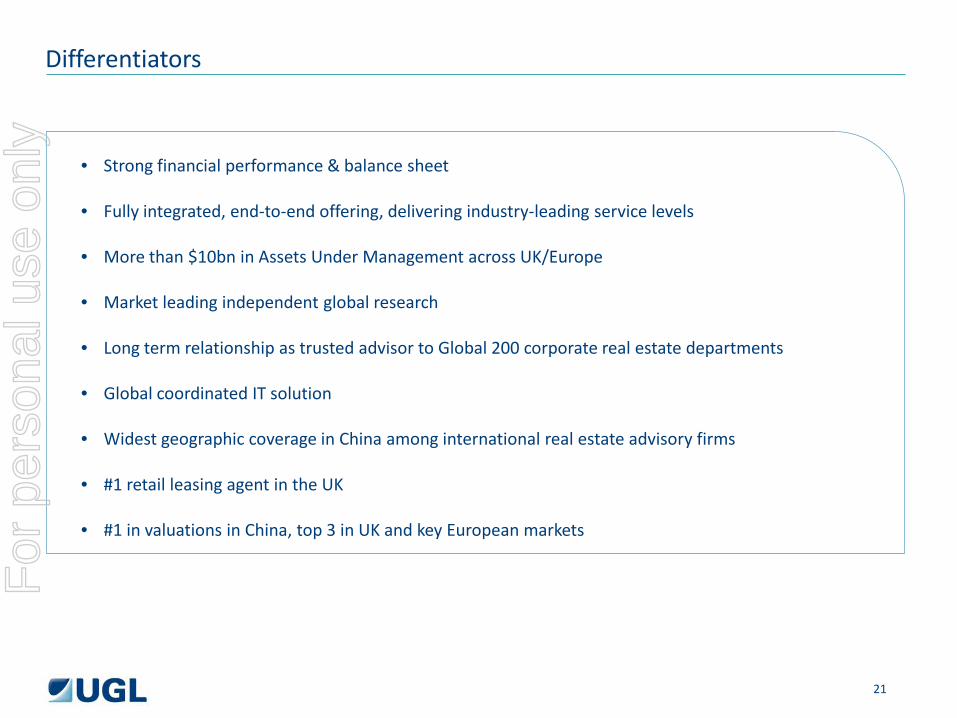
Differentiators
• Strong financial performance & balance sheet
• Fully integrated, end-to-end offering, delivering industry-leading service levels
• More than $10bn in Assets Under Management across UK/Europe • Market leading independent global research
• Long term relationship as trusted advisor to Global 200 corporate real estate departments • Global coordinated IT solution • Widest geographic coverage in China among international real estate advisory firms • #1 retail leasing agent in the UK • #1 retail leasing agent in the UK
• #1 in valuations in China, top 3 in UK and key European markets
21
For
per
sona
l use
onl
y
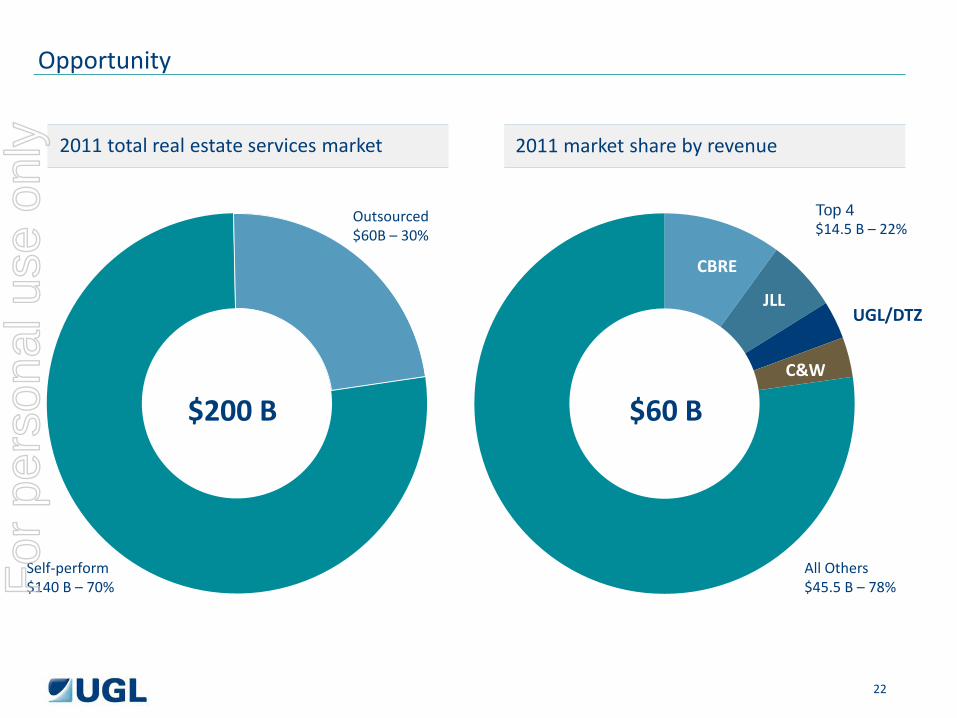
Self-perform $140 B – 70%
CBRE
JLL
C&W
UGL/DTZ
All Others $45.5 B – 78%
Top 4 $14.5 B – 22%
Opportunity
2011 total real estate services market 2011 market share by revenue
Outsourced $60B – 30%
$60 B $200 B
22
For
per
sona
l use
onl
y

Objectives and strategy
Investor
Occupier
Consulting
Leasing agency and brokerage
Building Consultancy/
Project Management
Integrated property and
facilities management
Capital markets Investment and
Asset Management
Valuation
Research
End-to-end
Objective
To be the best firm in the real estate services industry through outstanding customer service to both investor and occupier clients
End-to-end
Strategy
Provide a vertically integrated end-to-end solutions model, creating a unique customer value proposition, seamlessly integrated under a global leadership
23
For
per
sona
l use
onl
y
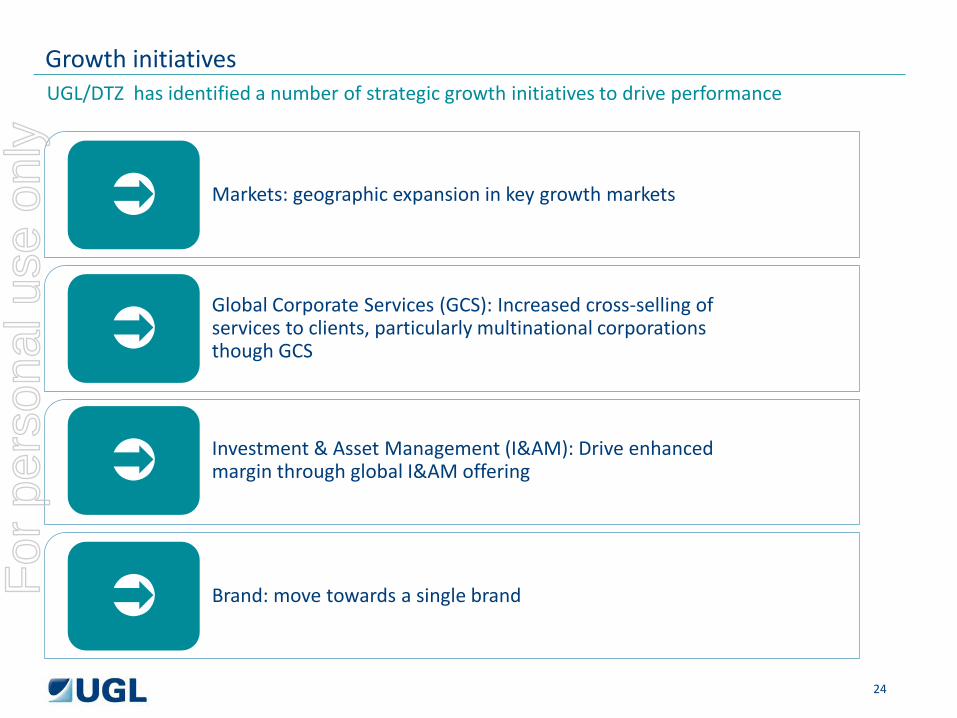
UGL/DTZ has identified a number of strategic growth initiatives to drive performance
Growth initiatives
Markets: geographic expansion in key growth markets
Global Corporate Services (GCS): Increased cross-selling of services to clients, particularly multinational corporations though GCS
Investment & Asset Management (I&AM): Drive enhanced margin through global I&AM offering
Brand: move towards a single brand
24
For
per
sona
l use
onl
y
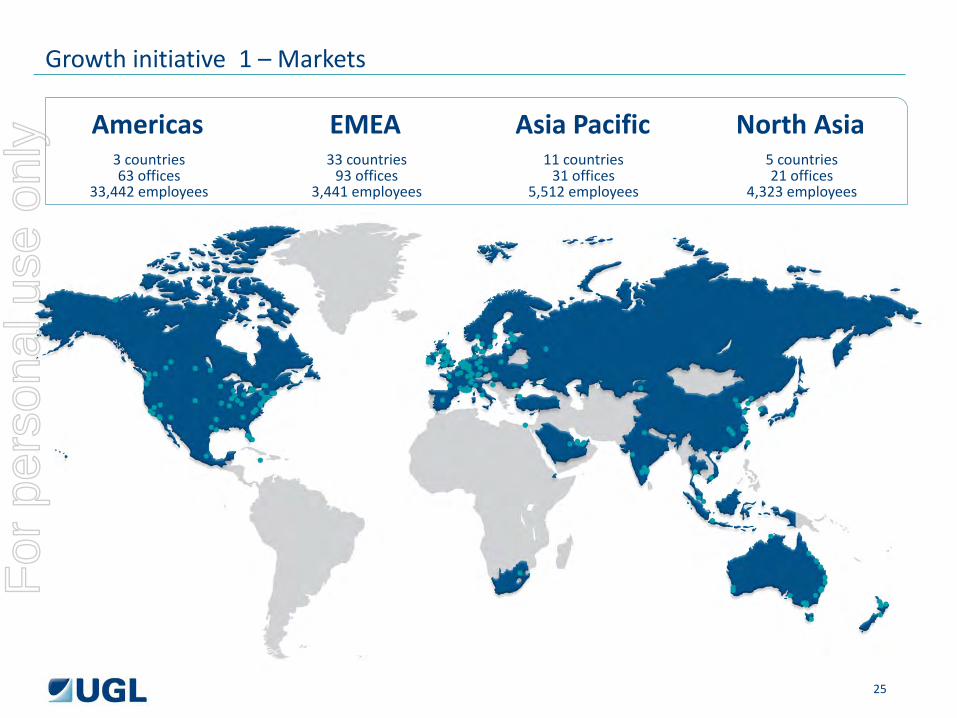
Growth initiative 1 – Markets
Americas 3 countries 63 offices
33,442 employees
EMEA 33 countries
93 offices 3,441 employees
Asia Pacific 11 countries
31 offices 5,512 employees
North Asia 5 countries 21 offices
4,323 employees
25
For
per
sona
l use
onl
y
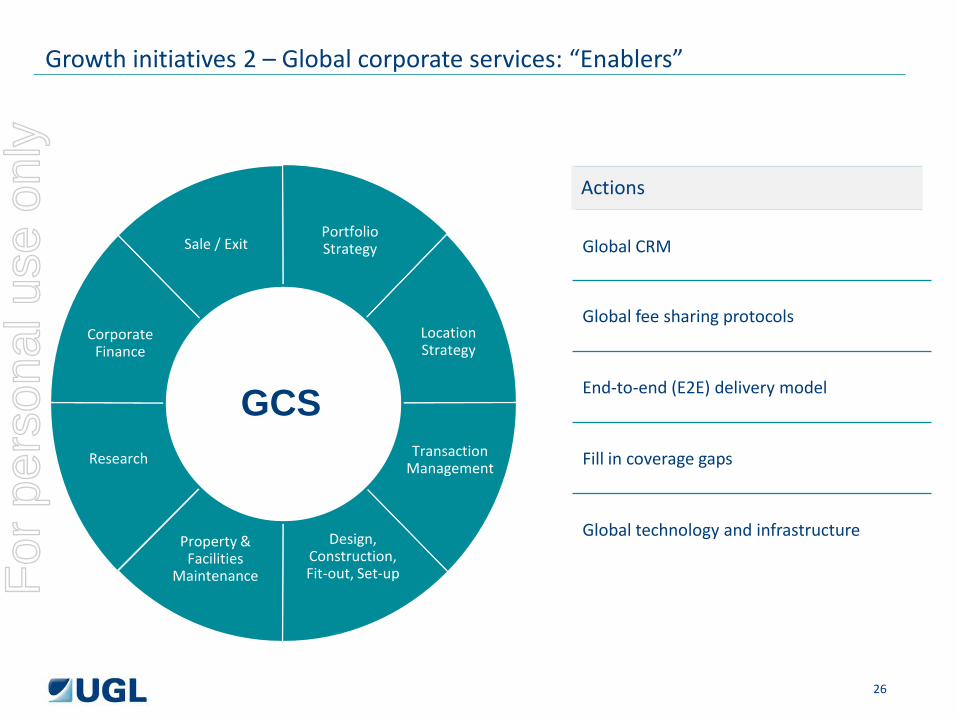
Growth initiatives 2 – Global corporate services: “Enablers”
Location Strategy
Sale / Exit Portfolio Strategy
Design, Construction, Fit-out, Set-up
Research
Corporate Finance
Transaction Management
Property & Facilities
Maintenance
GCS
Actions
Global CRM
Global fee sharing protocols
End-to-end (E2E) delivery model
Fill in coverage gaps
Global technology and infrastructure
26
Actions
For
per
sona
l use
onl
y
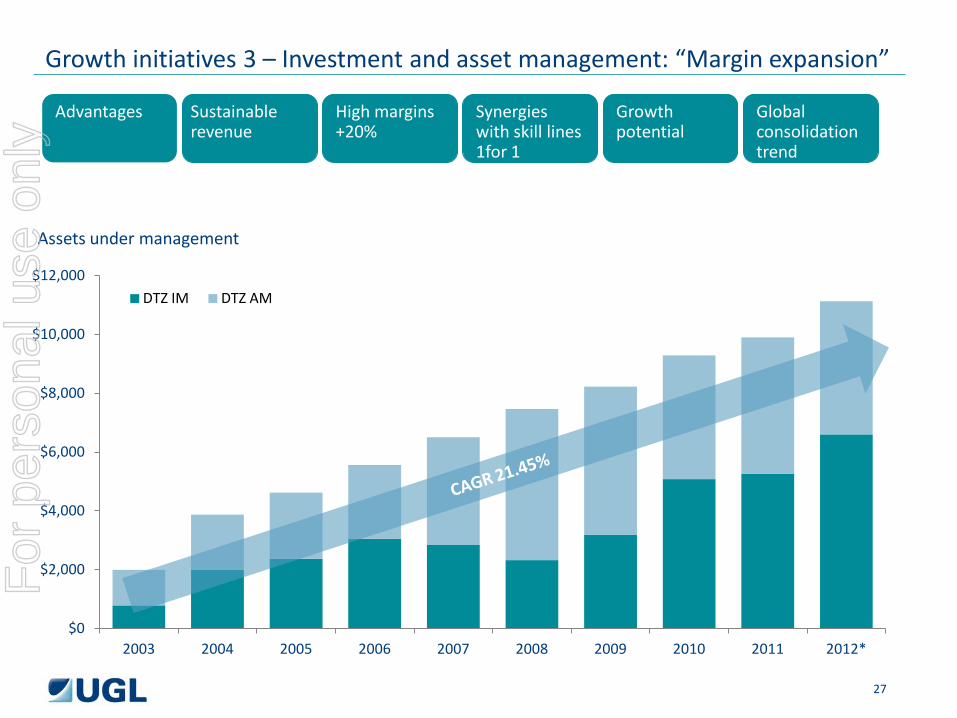
Growth initiatives 3 – Investment and asset management: “Margin expansion”
Location Strategy
Sale / Exit Portfolio Strategy
Design, Construction, Fit-out, Set-up
Research
Corporate Finance
Transaction Management
Property & Facilities
Maintenance
Advantages Sustainable revenue
High margins +20%
Synergies with skill lines 1for 1
Growth potential
Global consolidation trend
$0
$2,000
$4,000
$6,000
$8,000
$10,000
$12,000
2003 2004 2005 2006 2007 2008 2009 2010 2011 2012*
Assets under management
DTZ IM DTZ AM
27
For
per
sona
l use
onl
y
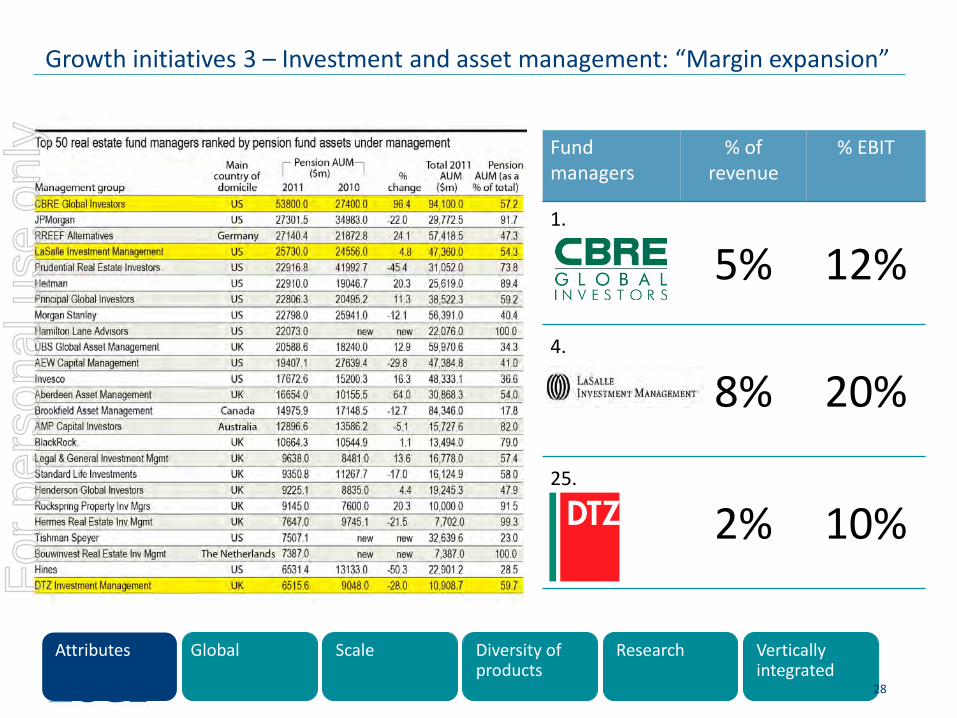
Growth initiatives 3 – Investment and asset management: “Margin expansion”
Attributes Global Scale Diversity of products
Research Vertically integrated
Fund managers
% of revenue
% EBIT
1.
5% 12%
4.
8% 20%
25.
2% 10%
28
For
per
sona
l use
onl
y
Takeaways
• Global coverage
• Full service end-to-end solution
• Scale / institutional acceptability
• Top 3 global platform
• Move towards a single brand
29
For
per
sona
l use
onl
y

John Forrester, Chief Executive
EMEA
30
For
per
sona
l use
onl
y
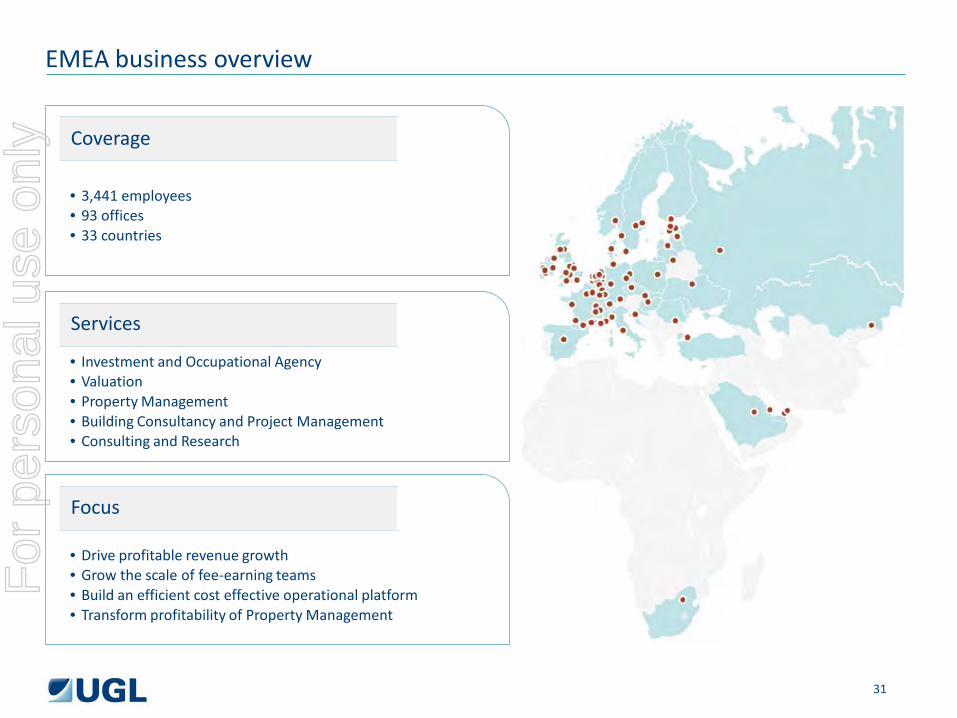
EMEA business overview
Coverage
Services
Focus
• 3,441 employees • 93 offices • 33 countries
• Investment and Occupational Agency • Valuation • Property Management • Building Consultancy and Project Management • Consulting and Research
• Drive profitable revenue growth • Grow the scale of fee-earning teams • Build an efficient cost effective operational platform • Transform profitability of Property Management
31
For
per
sona
l use
onl
y
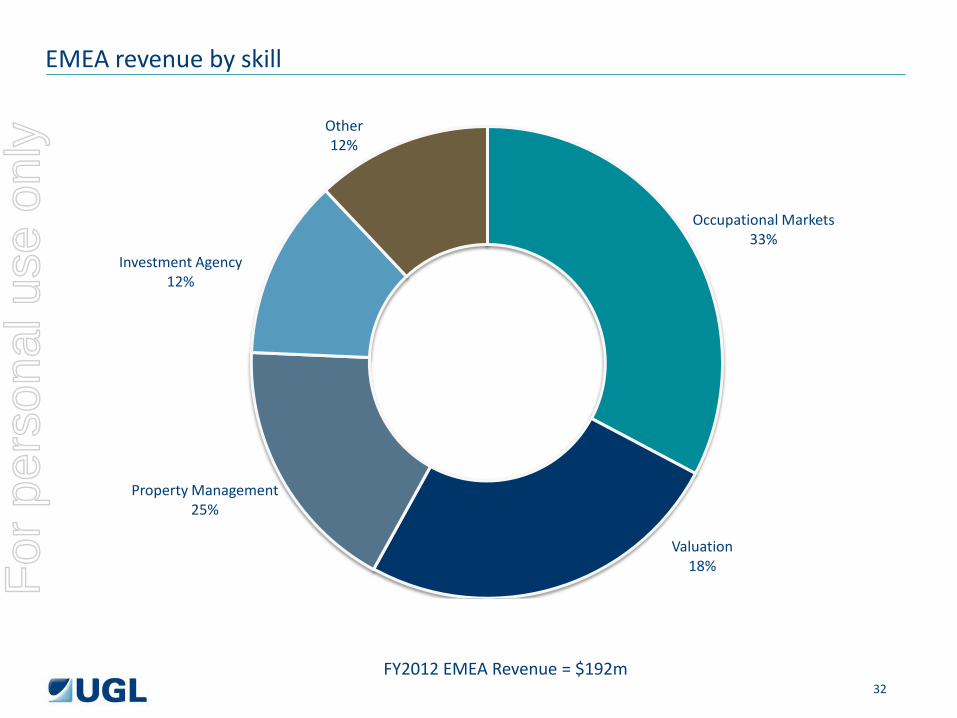
EMEA revenue by skill
Occupational Markets 33%
Property Management 25%
Valuation
18%
Investment Agency 12%
Other 12%
FY2012 EMEA Revenue = $192m 32
For
per
sona
l use
onl
y
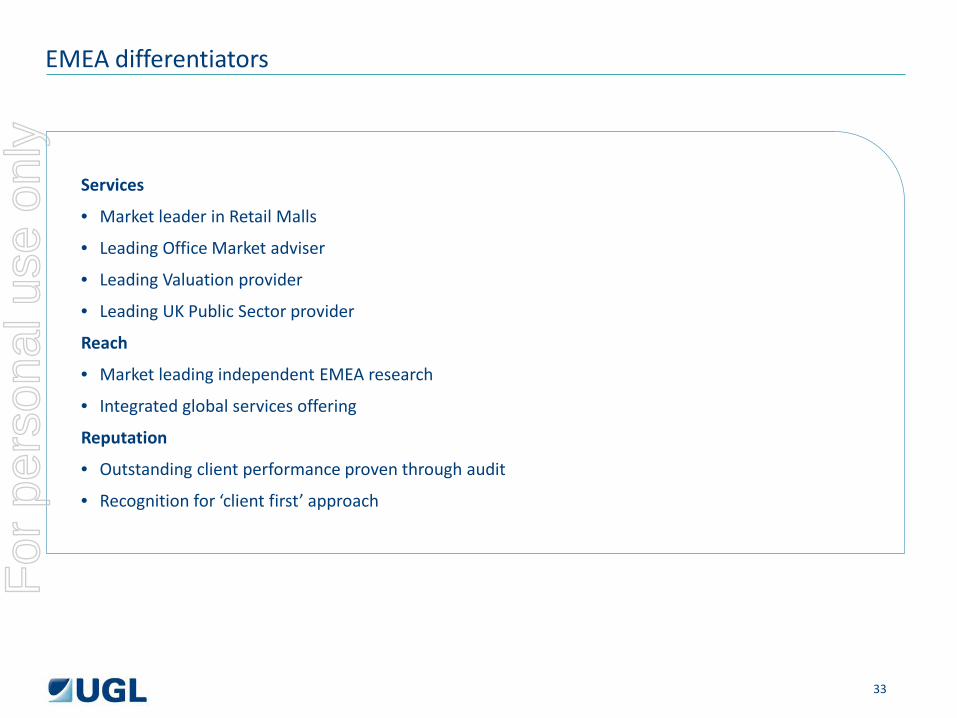
EMEA differentiators
Services
• Market leader in Retail Malls
• Leading Office Market adviser
• Leading Valuation provider
• Leading UK Public Sector provider
Reach
• Market leading independent EMEA research
• Integrated global services offering
Reputation
• Outstanding client performance proven through audit
• Recognition for ‘client first’ approach
33
For
per
sona
l use
onl
y
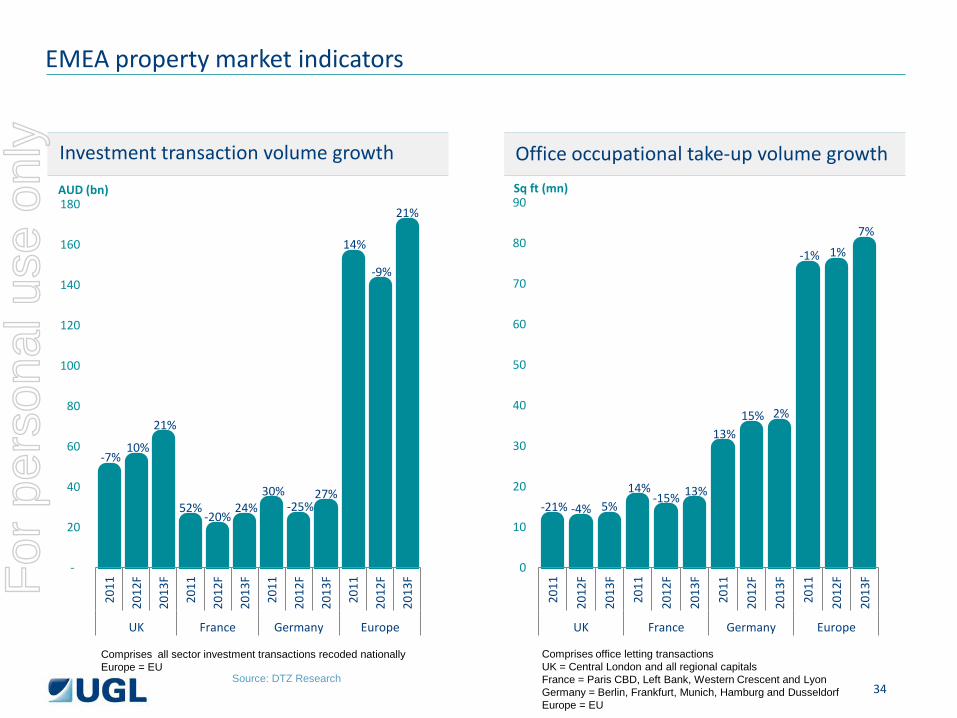
-21% -4% 5% 14%
-15% 13%
13% 15% 2%
-1% 1%
7%
0
10
20
30
40
50
60
70
80
90
2011
2012
F
2013
F
2011
2012
F
2013
F
2011
2012
F
2013
F
2011
2012
F
2013
F
UK France Germany Europe
Investment transaction volume growth Office occupational take-up volume growth
EMEA property market indicators
-7% 10%
21%
52% -20%
24% 30%
-25% 27%
14%
-9%
21%
-
20
40
60
80
100
120
140
160
180
2011
2012
F
2013
F
2011
2012
F
2013
F
2011
2012
F
2013
F
2011
2012
F
2013
F
UK France Germany Europe
AUD (bn)
Comprises all sector investment transactions recoded nationally Europe = EU
Comprises office letting transactions UK = Central London and all regional capitals France = Paris CBD, Left Bank, Western Crescent and Lyon Germany = Berlin, Frankfurt, Munich, Hamburg and Dusseldorf Europe = EU
Sq ft (mn)
Source: DTZ Research 34
For
per
sona
l use
onl
y

EMEA market drivers
Economic growth in EMEA to remain weak in remainder of 2012 and 2013
Overall real estate investment volumes down in FY12 and letting activity now broadly flat on prior year but trending downwards
Corporate occupiers building cash reserves and awaiting better macroeconomic conditions
Investor clients focusing on tenant retention, cash flow and minimising non-recoverable costs
Outlook Actions
Reduce overheads, by delivering on planned cost cutting programme, and establish more efficient systems
Recruit fee-earners in robust markets to improve our market position and drive profitable revenue growth
Implement turnaround of EMEA Property Management
35
For
per
sona
l use
onl
y
EMEA major clients
Advised circa 400 UK public sector organisations – market leader • Consulting, Occupier Markets,
Professional Services, Research and Valuation
A multi-national internet corporation • Agency, Building Consultancy,
Corporate Real Estate Management and Investment Agency
A global retail developer • Retail Leasing, Management
Set-up and Valuation
AEW Europe • Occupier Markets, Professional
Services and Valuation
Aviva Investors • Agency, Building Consultancy,
Investment Agency, Professional Advisory Services, Property Management, Rating, Residential, Retail and Valuation
Henderson Global Investors • Agency, Building Surveying,
Investment, Property Management, Retail and Valuation
36
For
per
sona
l use
onl
y
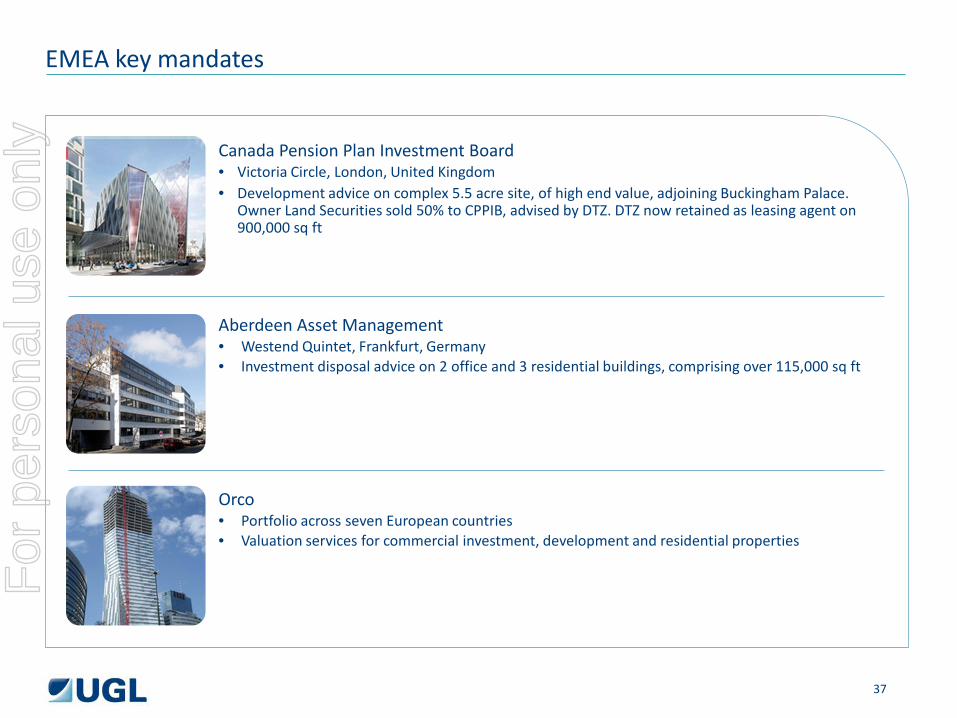
Canada Pension Plan Investment Board • Victoria Circle, London, United Kingdom • Development advice on complex 5.5 acre site, of high end value, adjoining Buckingham Palace.
Owner Land Securities sold 50% to CPPIB, advised by DTZ. DTZ now retained as leasing agent on 900,000 sq ft
EMEA key mandates
Aberdeen Asset Management • Westend Quintet, Frankfurt, Germany • Investment disposal advice on 2 office and 3 residential buildings, comprising over 115,000 sq ft
Orco • Portfolio across seven European countries • Valuation services for commercial investment, development and residential properties
37
For
per
sona
l use
onl
y

Christopher Cooper, UK Managing Director
Investment & Asset Management
38
For
per
sona
l use
onl
y
• The investment and asset management businesses (“IAM”) help our investor clients meet/exceed their return objectives within their risk tolerances by investing in the real estate sector
• The IAM businesses serve a range of investor clients with varying investment horizons and varying
risk requirements. This has enabled us to diversify revenue streams, built on a stable core of recurring income
• The IAM businesses have a history of delivering successful results to clients. This track record has
enabled continued growth of our business, with Assets under Management (“AUM”) increasing by c25% per annum over the last 10 years. This is one of the fastest rates of growth in the market, albeit from a low starting point
• This growth has been achieved organically via targeted additions of staff to our teams. This
approach enabled lower risk growth and delivered high ongoing profitability while growth was realised
39
Introduction to our platform Business overview
For
per
sona
l use
onl
y
Business overview (continued)
The business has four compelling attractions for clients: 1. A unique investment philosophy based on an solid understanding of occupier needs;
2. High quality investment professionals with a long track record with the firm;
3. Disciplined investment processes backed by robust corporate governance; and
4. Top rated long-term investment performance. Future growth priorities are a combination of adding existing service lines to the current platform, and geographic expansion to exploit new sources of capital.
Introduction to our platform
40
For
per
sona
l use
onl
y
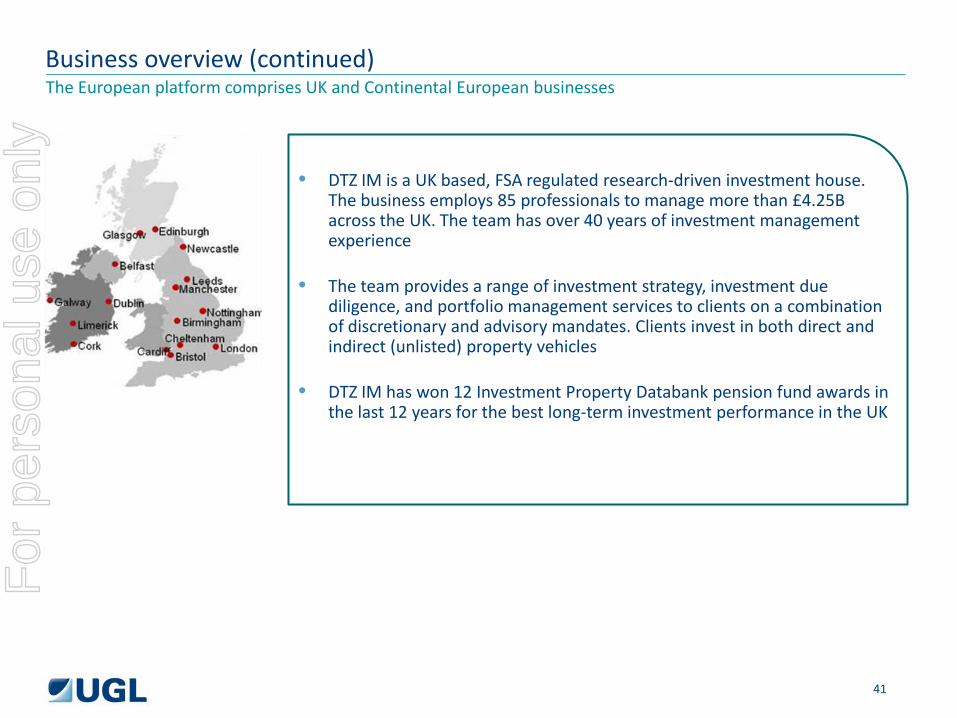
• DTZ IM is a UK based, FSA regulated research-driven investment house. The business employs 85 professionals to manage more than £4.25B across the UK. The team has over 40 years of investment management experience
• The team provides a range of investment strategy, investment due
diligence, and portfolio management services to clients on a combination of discretionary and advisory mandates. Clients invest in both direct and indirect (unlisted) property vehicles
• DTZ IM has won 12 Investment Property Databank pension fund awards in
the last 12 years for the best long-term investment performance in the UK
Business overview (continued) The European platform comprises UK and Continental European businesses
41
For
per
sona
l use
onl
y
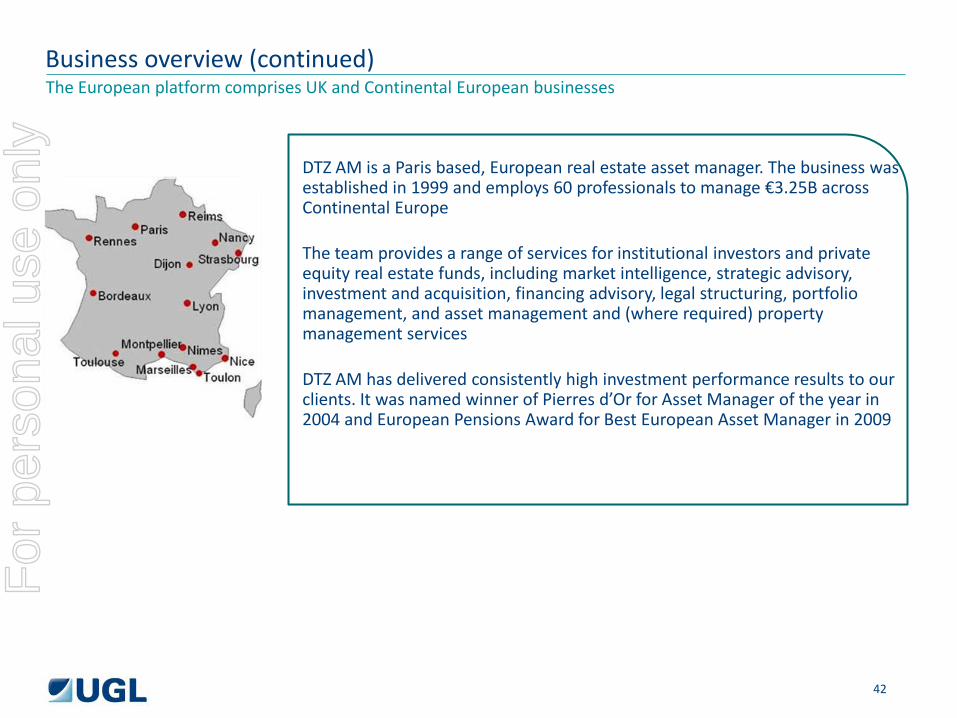
DTZ AM is a Paris based, European real estate asset manager. The business was established in 1999 and employs 60 professionals to manage €3.25B across Continental Europe The team provides a range of services for institutional investors and private equity real estate funds, including market intelligence, strategic advisory, investment and acquisition, financing advisory, legal structuring, portfolio management, and asset management and (where required) property management services DTZ AM has delivered consistently high investment performance results to our clients. It was named winner of Pierres d’Or for Asset Manager of the year in 2004 and European Pensions Award for Best European Asset Manager in 2009
Business overview (continued) The European platform comprises UK and Continental European businesses
42
For
per
sona
l use
onl
y
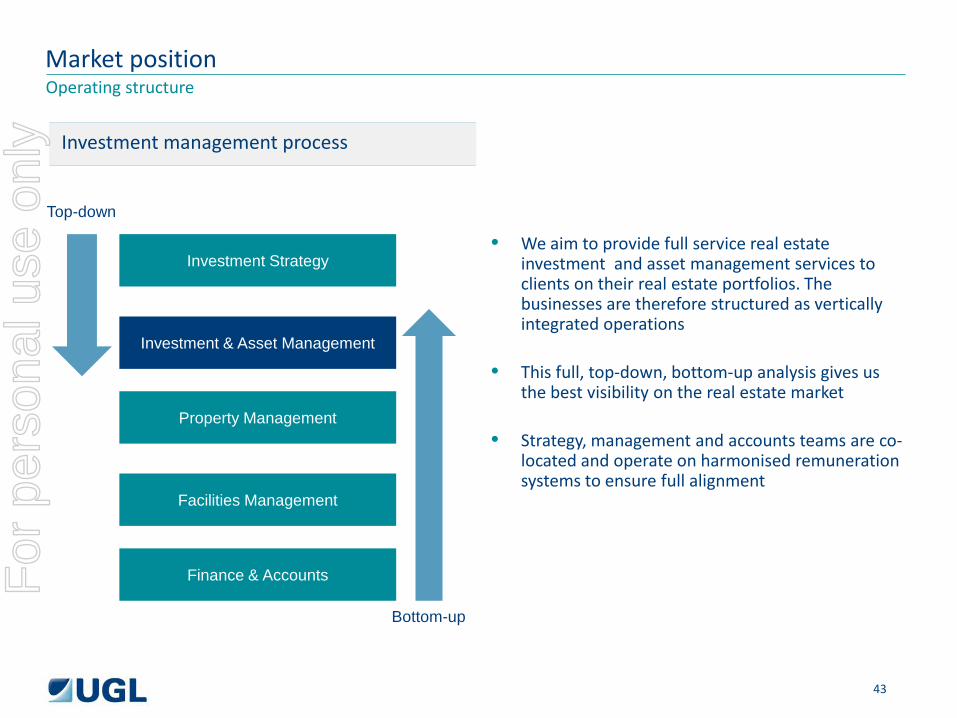
• We aim to provide full service real estate investment and asset management services to clients on their real estate portfolios. The businesses are therefore structured as vertically integrated operations
• This full, top-down, bottom-up analysis gives us
the best visibility on the real estate market • Strategy, management and accounts teams are co-
located and operate on harmonised remuneration systems to ensure full alignment
Market position Operating structure
Investment Strategy
Investment & Asset Management
Property Management
Facilities Management
Finance & Accounts
Top-down
Bottom-up
Investment management process
43
For
per
sona
l use
onl
y
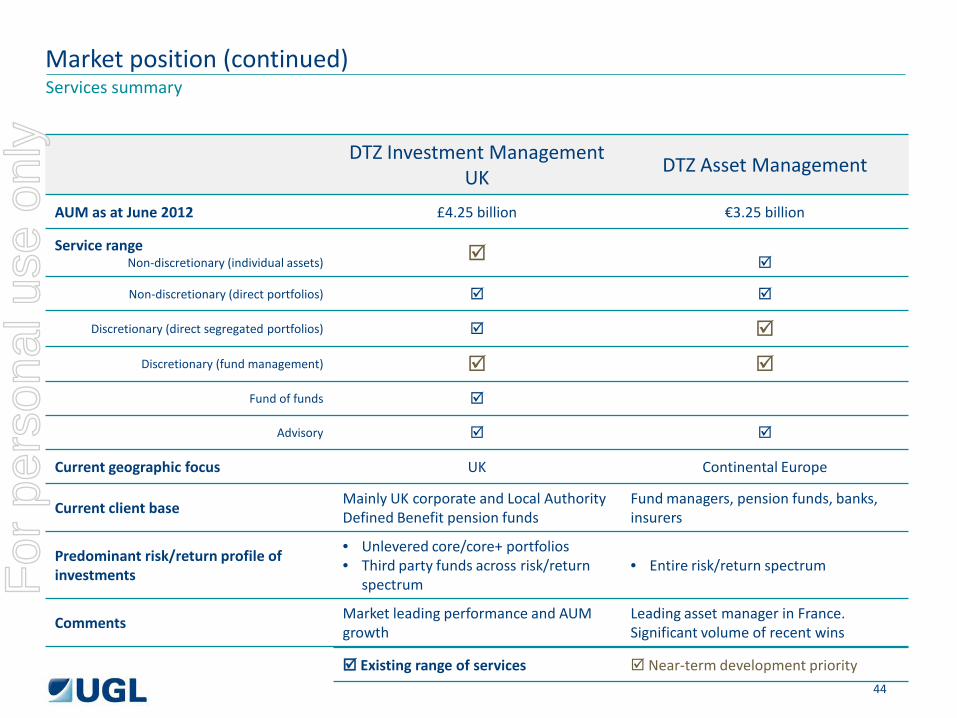
Market position (continued)
DTZ Investment Management UK
DTZ Asset Management
AUM as at June 2012 £4.25 billion €3.25 billion
Service range Non-discretionary (individual assets)
Non-discretionary (direct portfolios)
Discretionary (direct segregated portfolios)
Discretionary (fund management)
Fund of funds
Advisory
Current geographic focus UK Continental Europe
Current client base Mainly UK corporate and Local Authority Defined Benefit pension funds
Fund managers, pension funds, banks, insurers
Predominant risk/return profile of investments
• Unlevered core/core+ portfolios • Third party funds across risk/return
spectrum • Entire risk/return spectrum
Comments Market leading performance and AUM growth
Leading asset manager in France. Significant volume of recent wins
Services summary
Existing range of services Near-term development priority 44
For
per
sona
l use
onl
y
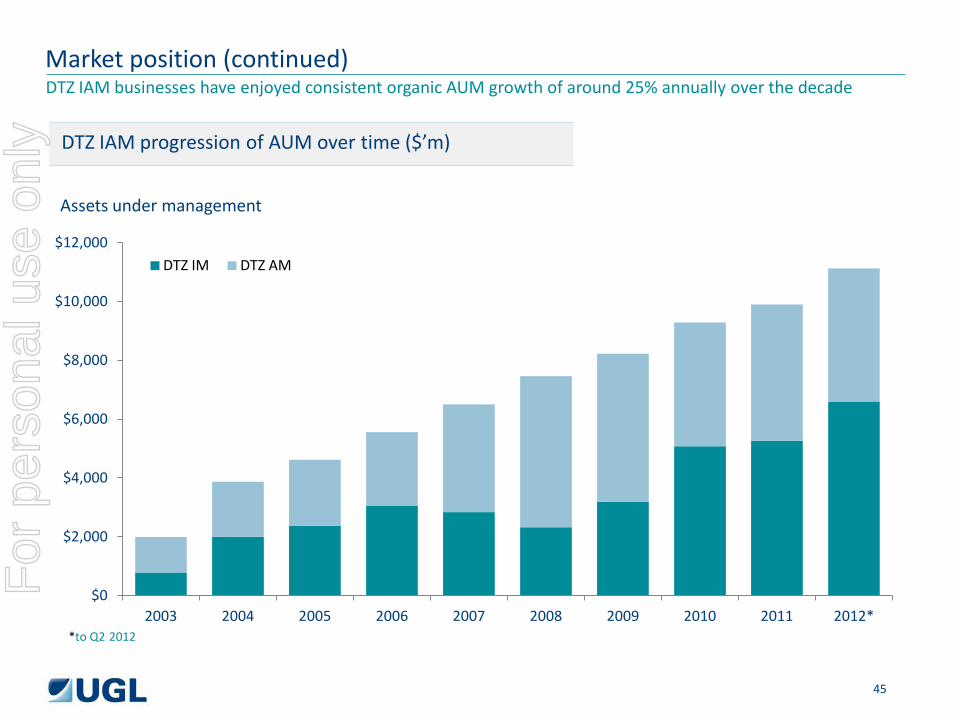
DTZ IAM progression of AUM over time ($’m)
Market position (continued)
*to Q2 2012
DTZ IAM businesses have enjoyed consistent organic AUM growth of around 25% annually over the decade
45
$0
$2,000
$4,000
$6,000
$8,000
$10,000
$12,000
2003 2004 2005 2006 2007 2008 2009 2010 2011 2012*
Assets under management
DTZ IM DTZ AM
For
per
sona
l use
onl
y

39%
41%
15%
5%
Core
Core plus
Value add
Opportunistic
25.6%
35.7%
21.8%
16.9% Retail
Offices
Industrial
Other
0%
20%
40%
60%
Advisory Discretionary 0%
25%
50%
75%
Pension Funds Other Institutions
Market position (continued)
Sector allocation (June 2012) Risk profile (June 2012)
Nature of mandate (June 2012) Sources of capital (June 2012)
We manage exclusively for institutional investors across a range of risk profiles
46
For
per
sona
l use
onl
y
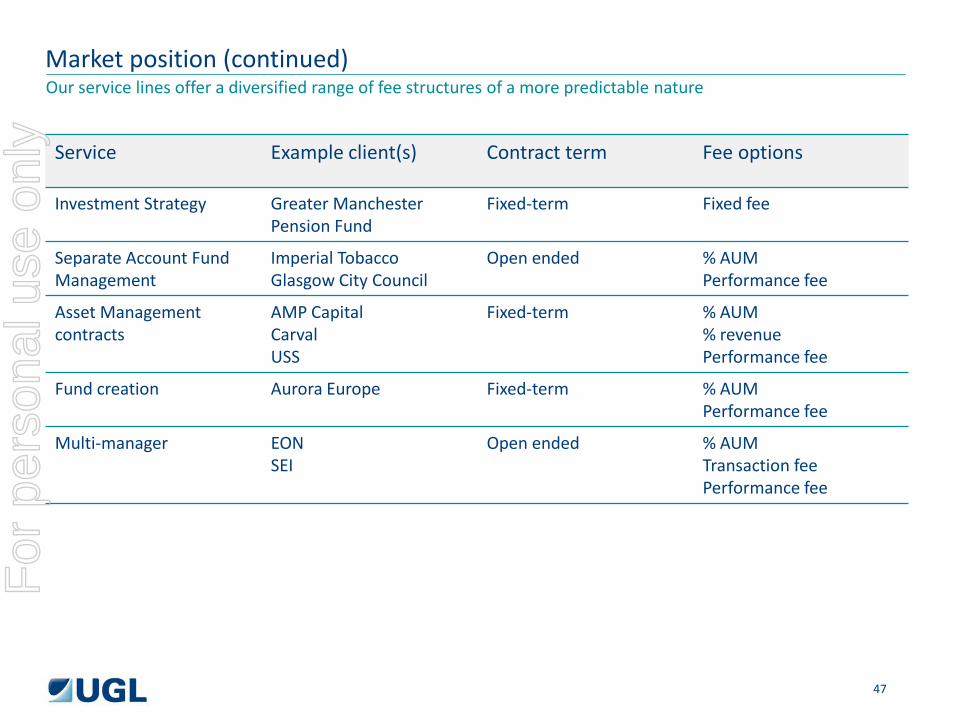
Market position (continued)
Service Example client(s) Contract term Fee options
Investment Strategy Greater Manchester Pension Fund
Fixed-term Fixed fee
Separate Account Fund Management
Imperial Tobacco Glasgow City Council
Open ended % AUM Performance fee
Asset Management contracts
AMP Capital Carval USS
Fixed-term % AUM % revenue Performance fee
Fund creation Aurora Europe Fixed-term % AUM Performance fee
Multi-manager EON SEI
Open ended % AUM Transaction fee Performance fee
Our service lines offer a diversified range of fee structures of a more predictable nature
47
For
per
sona
l use
onl
y
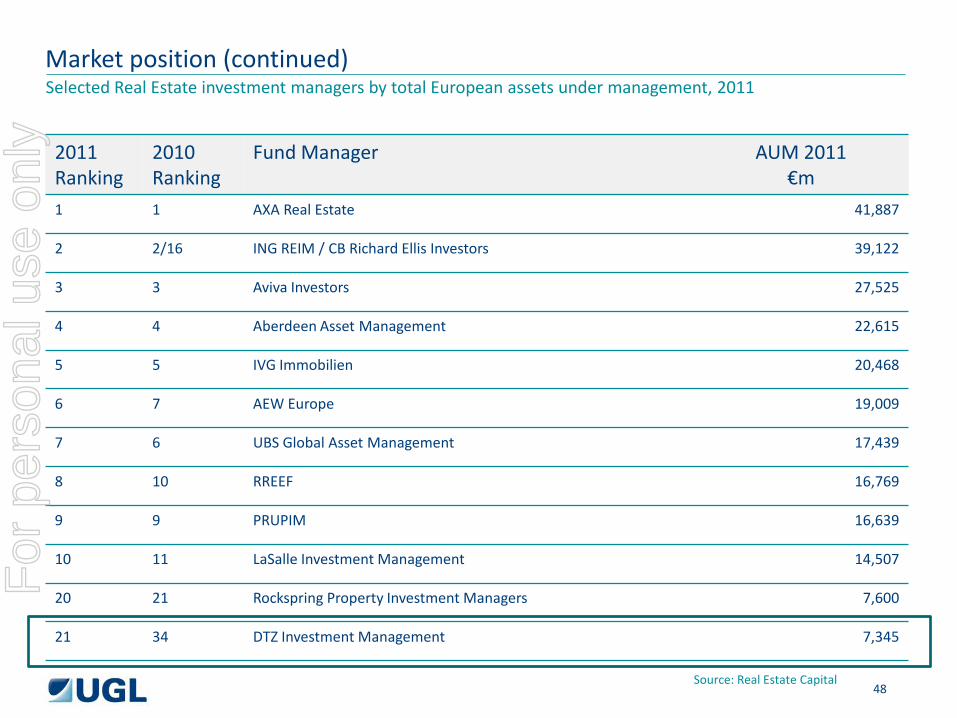
Market position (continued)
2011 Ranking
2010 Ranking
Fund Manager AUM 2011 €m
1 1 AXA Real Estate 41,887
2 2/16 ING REIM / CB Richard Ellis Investors 39,122
3 3 Aviva Investors 27,525
4 4 Aberdeen Asset Management 22,615
5 5 IVG Immobilien 20,468
6 7 AEW Europe 19,009
7 6 UBS Global Asset Management 17,439
8 10 RREEF 16,769
9 9 PRUPIM 16,639
10 11 LaSalle Investment Management 14,507
20 21 Rockspring Property Investment Managers 7,600
21 34 DTZ Investment Management 7,345
Source: Real Estate Capital
Selected Real Estate investment managers by total European assets under management, 2011
48
For
per
sona
l use
onl
y
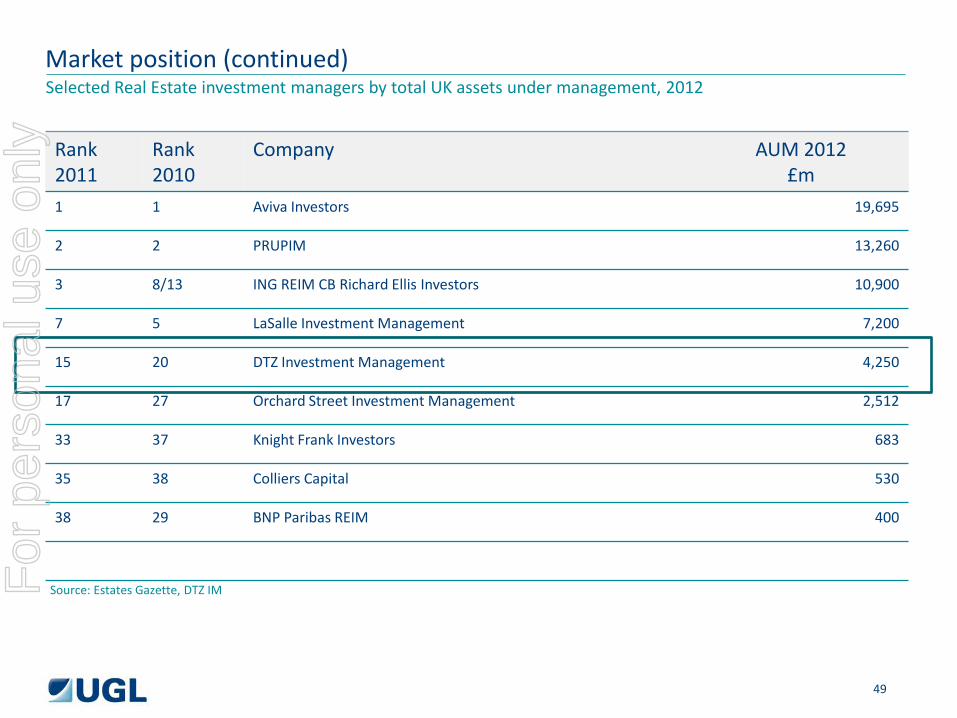
Market position (continued)
Rank 2011
Rank 2010
Company AUM 2012 £m
1 1 Aviva Investors 19,695
2 2 PRUPIM 13,260
3 8/13 ING REIM CB Richard Ellis Investors 10,900
7 5 LaSalle Investment Management 7,200
15 20 DTZ Investment Management 4,250
17 27 Orchard Street Investment Management 2,512
33 37 Knight Frank Investors 683
35 38 Colliers Capital 530
38 29 BNP Paribas REIM 400
Source: Estates Gazette, DTZ IM
Selected Real Estate investment managers by total UK assets under management, 2012
49
For
per
sona
l use
onl
y
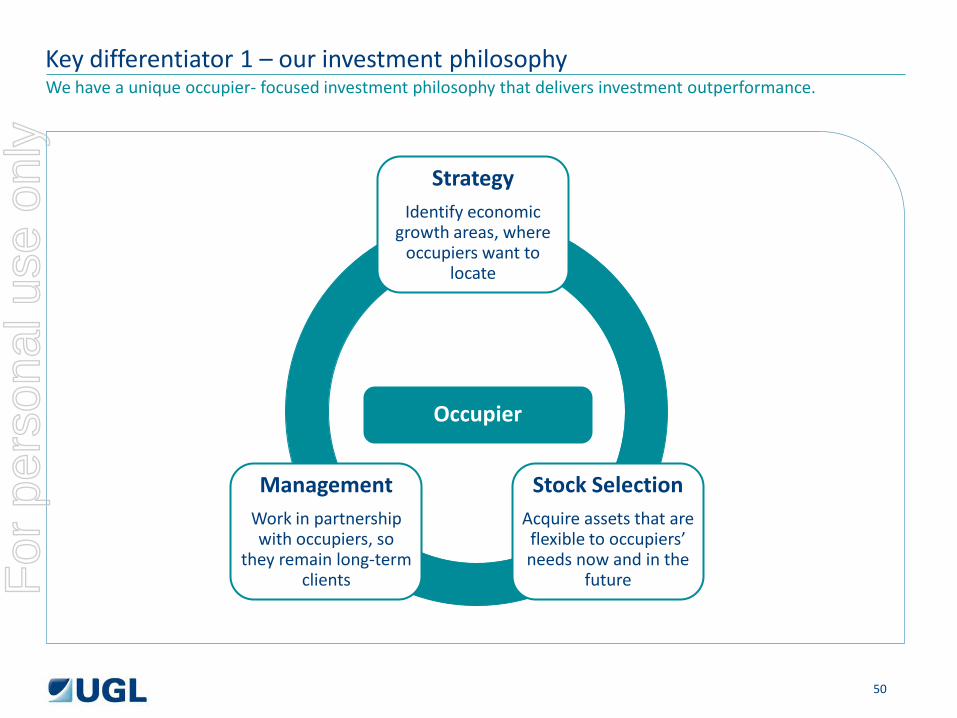
Key differentiator 1 – our investment philosophy We have a unique occupier- focused investment philosophy that delivers investment outperformance.
Strategy
Identify economic growth areas, where
occupiers want to locate
Stock Selection Acquire assets that are flexible to occupiers’ needs now and in the
future
Management
Work in partnership with occupiers, so
they remain long-term clients
Occupier
50
For
per
sona
l use
onl
y
Key differentiator 2 – great, loyal people
• Broad range of seasoned investment professionals • Significant experience gained at DTZ IM • Very low levels of staff attrition • Significant non-executive support and governance from independent industry experts
Senior management average more than 25 years’ industry experience, half of which has been spent at DTZ.
51
For
per
sona
l use
onl
y

Key differentiator 3 – top rate long-term performance track record
100
200
300
400
500
600
700
800
1991 1992 1993 1994 1995 1996 1997 1998 1999 2000 2001 2002 2003 2004 2005 2006 2007 2008 2009 2010 2011
DTZ IPD
DTZ IM total returns relative to UK index (1991 = 100)
Portfolios managed on a fully discretionary basis by DTZ have significantly outperformed the market
52
For
per
sona
l use
onl
y
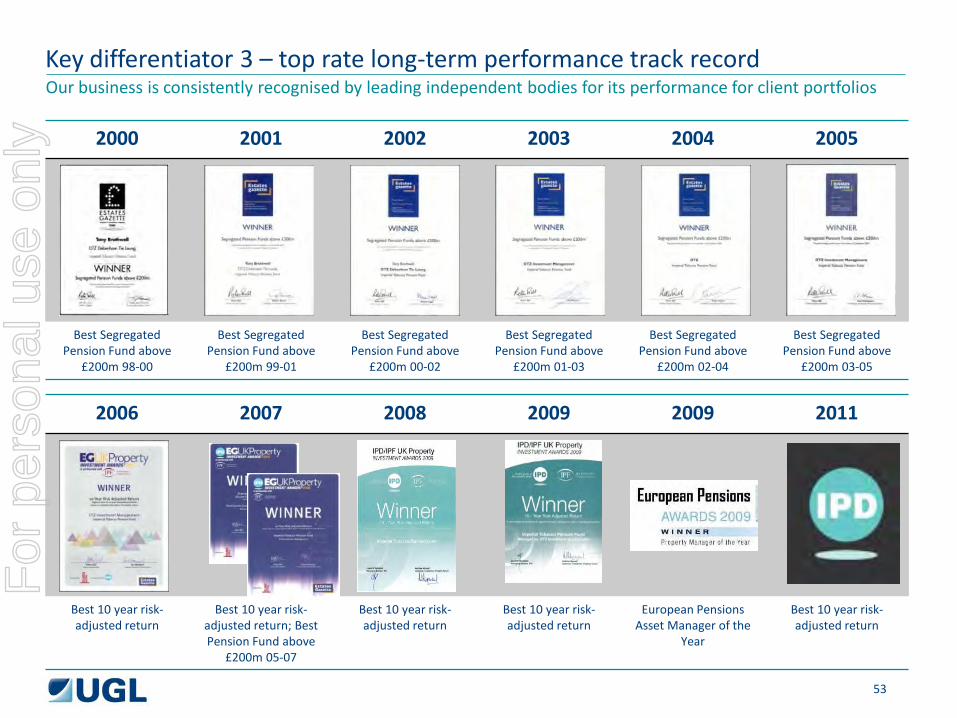
Key differentiator 3 – top rate long-term performance track record
2000 2001 2002 2003 2004 2005
Best Segregated Pension Fund above
£200m 98-00
Best Segregated Pension Fund above
£200m 99-01
Best Segregated Pension Fund above
£200m 00-02
Best Segregated Pension Fund above
£200m 01-03
Best Segregated Pension Fund above
£200m 02-04
Best Segregated Pension Fund above
£200m 03-05
Our business is consistently recognised by leading independent bodies for its performance for client portfolios
2006 2007 2008 2009 2009 2011
Best 10 year risk-adjusted return
Best 10 year risk-adjusted return; Best Pension Fund above
£200m 05-07
Best 10 year risk-adjusted return
Best 10 year risk-adjusted return
European Pensions Asset Manager of the
Year
Best 10 year risk-adjusted return
53
For
per
sona
l use
onl
y
Market drivers
• Property is still viewed as a sensible investment class for institutional investors in the context of a multi-asset class portfolio. This drives demand for our services
• Clients typically recognise the importance of income return. Having hands-on management capability remains
an advantage, with specialist managers seeing the fastest rates of organic growth • Banking turmoil will dominate the real estate investment management arena both in terms of the future
balance of the debt / equity profile in asset ownership, and the future of several major investment management platforms. We expect further consolidation in the fund management industry as a consequence
• Debt maturities and existing funds have a concentration of expiries in 2014-16, which may prove a significant
impact on asset pricing and investor appetite mid-term • Greater scrutiny and regulation is an inevitable consequence of property’s existence at the periphery of the
authorised investment world
54
For
per
sona
l use
onl
y
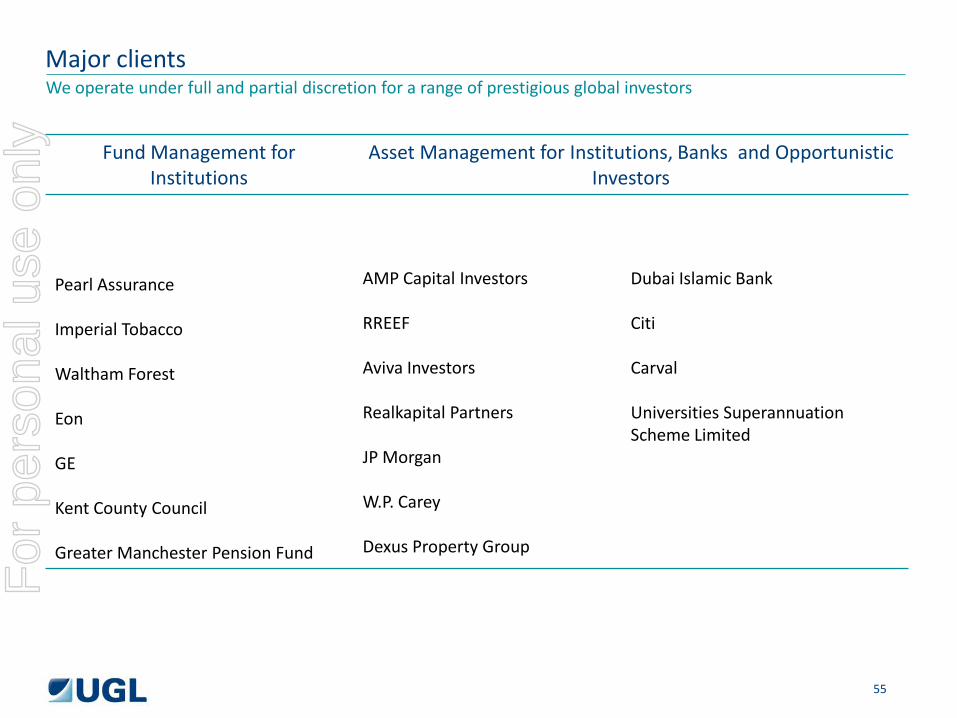
Major clients
Fund Management for Institutions
Asset Management for Institutions, Banks and Opportunistic Investors
Pearl Assurance Imperial Tobacco Waltham Forest Eon GE Kent County Council Greater Manchester Pension Fund
AMP Capital Investors RREEF Aviva Investors Realkapital Partners JP Morgan W.P. Carey Dexus Property Group
Dubai Islamic Bank Citi Carval Universities Superannuation Scheme Limited
We operate under full and partial discretion for a range of prestigious global investors
55
For
per
sona
l use
onl
y
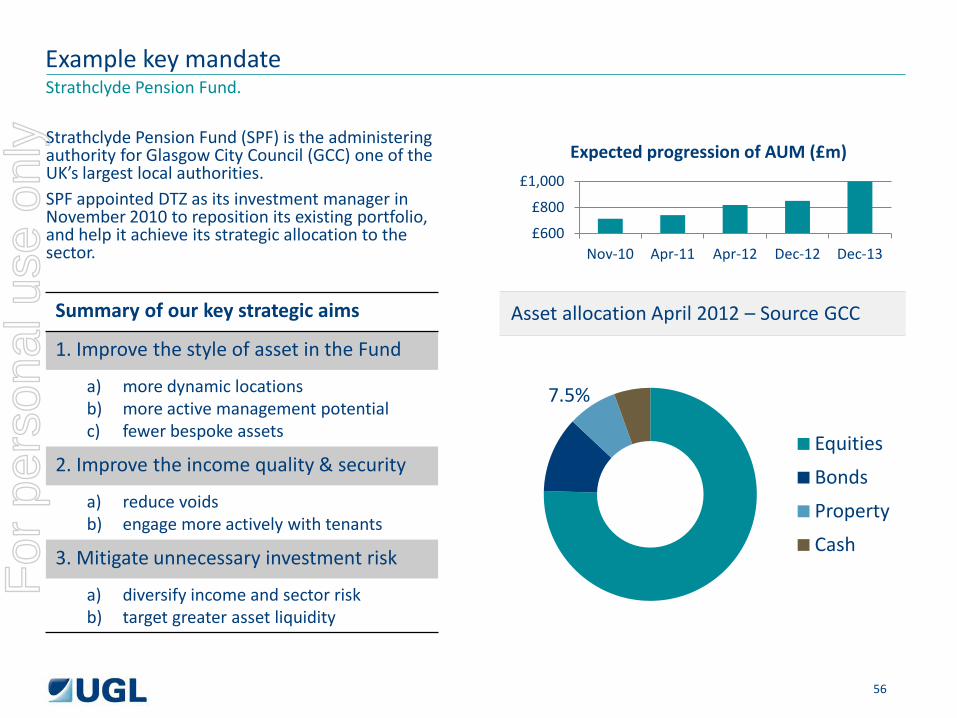
Strathclyde Pension Fund. Example key mandate
Asset allocation April 2012 – Source GCC
Strathclyde Pension Fund (SPF) is the administering authority for Glasgow City Council (GCC) one of the UK’s largest local authorities. SPF appointed DTZ as its investment manager in November 2010 to reposition its existing portfolio, and help it achieve its strategic allocation to the sector.
£600
£800
£1,000
Nov-10 Apr-11 Apr-12 Dec-12 Dec-13
Expected progression of AUM (£m)
Summary of our key strategic aims
1. Improve the style of asset in the Fund
a) more dynamic locations b) more active management potential c) fewer bespoke assets
2. Improve the income quality & security
a) reduce voids b) engage more actively with tenants
3. Mitigate unnecessary investment risk
a) diversify income and sector risk b) target greater asset liquidity
7.5%
Equities
Bonds
Property
Cash
56
For
per
sona
l use
onl
y
George Keches, Chief Executive
Americas
57
For
per
sona
l use
onl
y
Overview
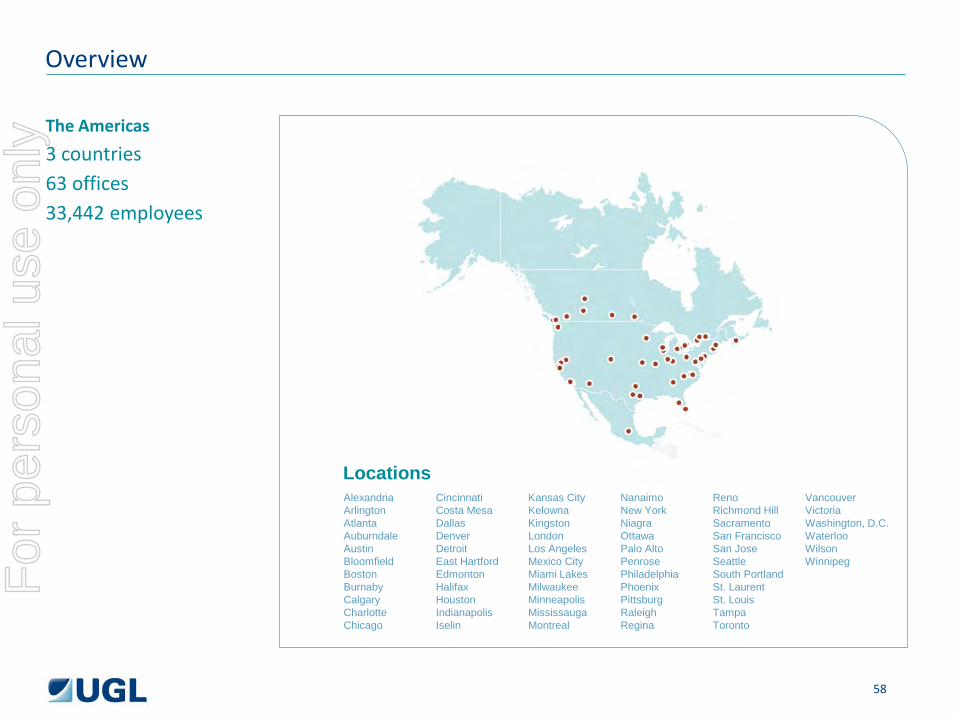
The Americas
3 countries 63 offices 33,442 employees
Locations Alexandria Arlington Atlanta Auburndale Austin Bloomfield Boston Burnaby Calgary Charlotte Chicago
Cincinnati Costa Mesa Dallas Denver Detroit East Hartford Edmonton Halifax Houston Indianapolis Iselin
Kansas City Kelowna Kingston London Los Angeles Mexico City Miami Lakes Milwaukee Minneapolis Mississauga Montreal
Nanaimo New York Niagra Ottawa Palo Alto Penrose Philadelphia Phoenix Pittsburg Raleigh Regina
Reno Richmond Hill Sacramento San Francisco San Jose Seattle South Portland St. Laurent St. Louis Tampa Toronto
Vancouver Victoria Washington, D.C. Waterloo Wilson Winnipeg
58
For
per
sona
l use
onl
y
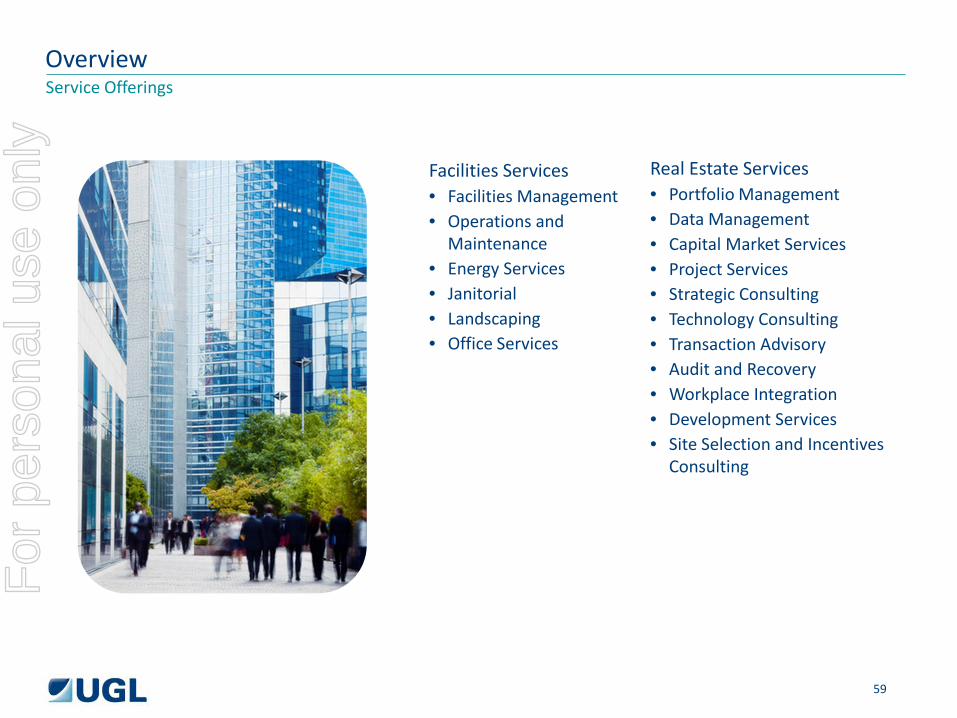
Facilities Services • Facilities Management • Operations and
Maintenance • Energy Services • Janitorial • Landscaping • Office Services
Overview Service Offerings
Real Estate Services • Portfolio Management • Data Management • Capital Market Services • Project Services • Strategic Consulting • Technology Consulting • Transaction Advisory • Audit and Recovery • Workplace Integration • Development Services • Site Selection and Incentives
Consulting
59
For
per
sona
l use
onl
y
#1 Most Recommended Real Estate Firm in North America Identified as the #1 Tenant Representation firm in the world and the most highly recommended service provider among 23 evaluated corporate real estate services firms.
BOMA Building of the Year TOBY Awards Many of our customers across North America have received this distinction which recognizes excellence in property management, tenant services, customer service, facility services, energy management and other superior performance measures.
Overview Distinctions
60
For
per
sona
l use
onl
y
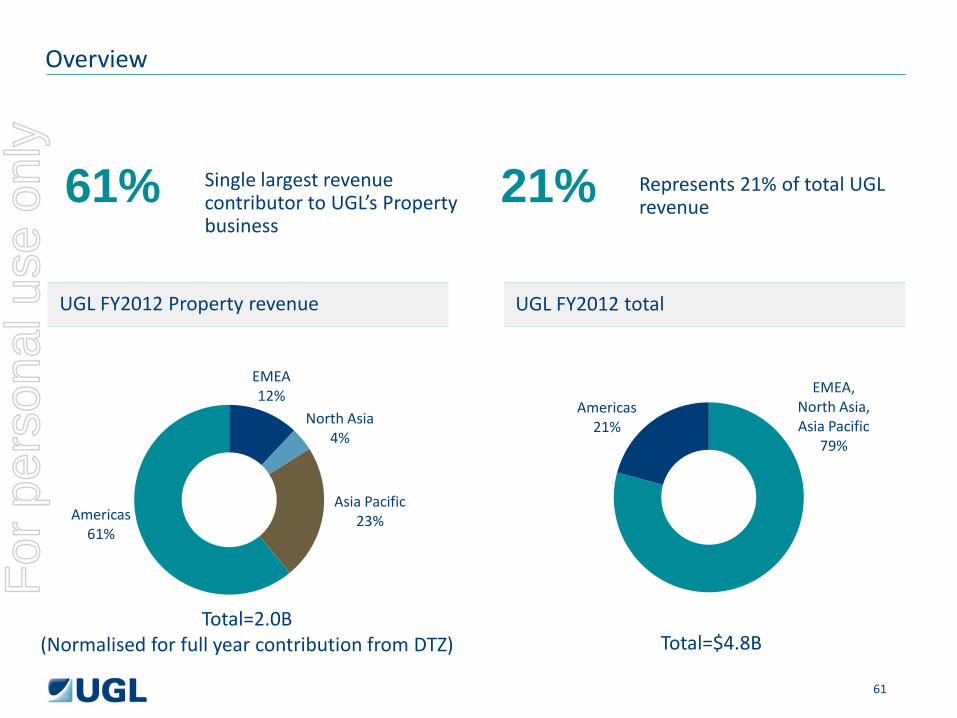
Overview
Total=2.0B (Normalised for full year contribution from DTZ)
Single largest revenue contributor to UGL’s Property business
61% 21%
EMEA, North Asia, Asia Pacific
79%
Americas 21%
Represents 21% of total UGL revenue
Total=$4.8B
EMEA 12%
North Asia 4%
Asia Pacific 23% Americas
61%
UGL FY2012 Property revenue UGL FY2012 total
61
For
per
sona
l use
onl
y

Education 16%
Finance & Insurance 11%
Government 3%
Manufacturing 30% Other 9%
Public Venue 7%
Commercial/ Office 19%
Retail 6%
Overview Broad customer base
Total=$976m
62
For
per
sona
l use
onl
y
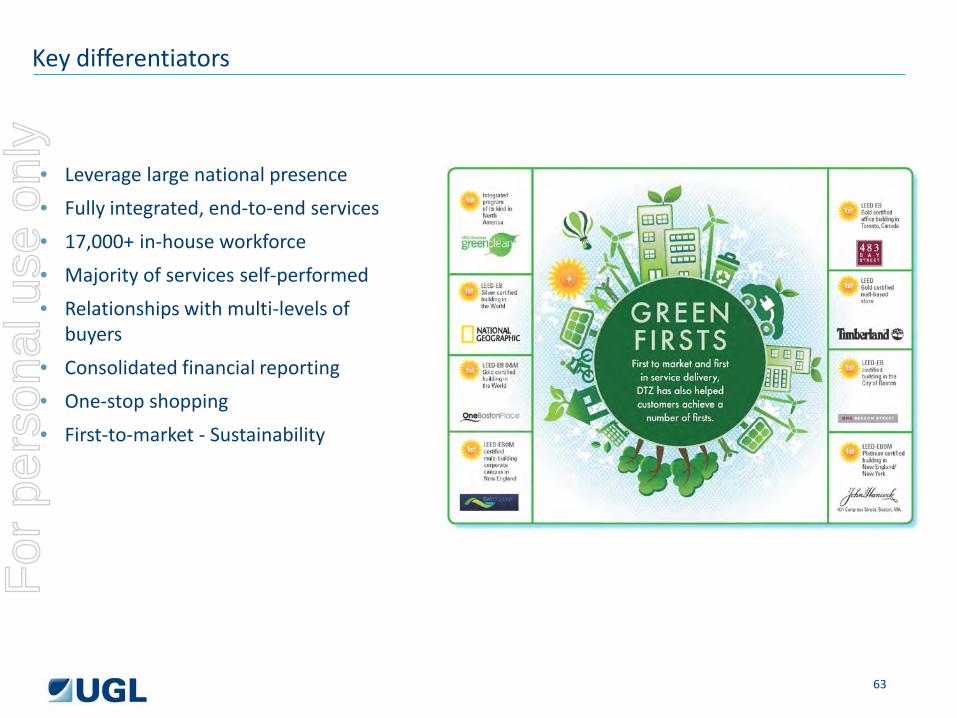
Key differentiators
• Leverage large national presence
• Fully integrated, end-to-end services
• 17,000+ in-house workforce
• Majority of services self-performed
• Relationships with multi-levels of buyers
• Consolidated financial reporting
• One-stop shopping
• First-to-market - Sustainability
63
For
per
sona
l use
onl
y
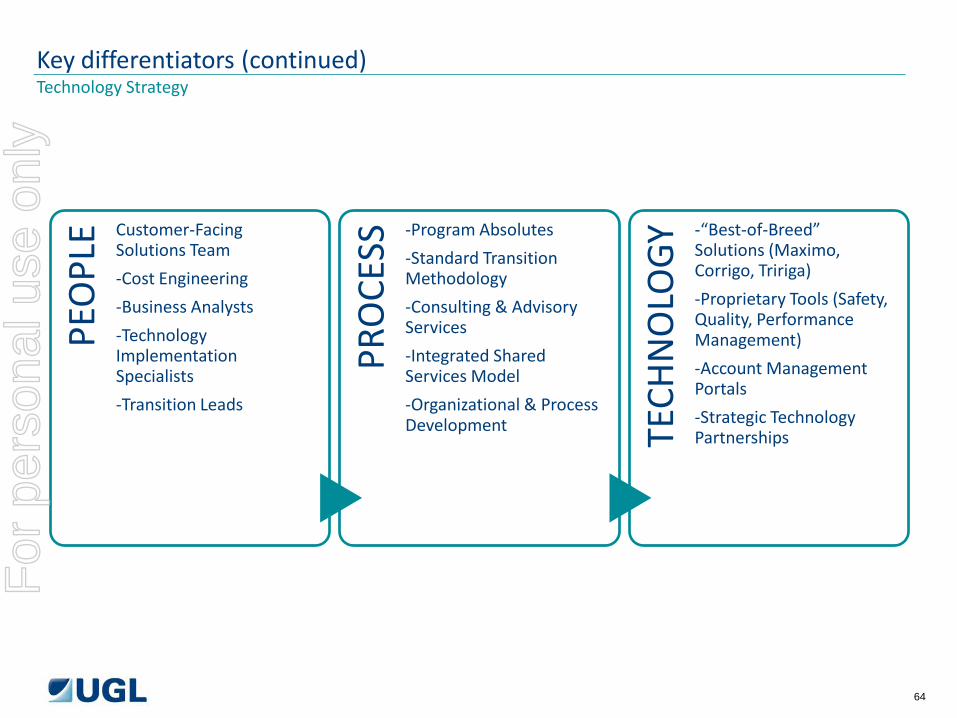
PEO
PLE Customer-Facing
Solutions Team
-Cost Engineering
-Business Analysts
-Technology Implementation Specialists
-Transition Leads
PRO
CESS
-Program Absolutes
-Standard Transition Methodology
-Consulting & Advisory Services
-Integrated Shared Services Model
-Organizational & Process Development TE
CHN
OLO
GY -“Best-of-Breed”
Solutions (Maximo, Corrigo, Tririga)
-Proprietary Tools (Safety, Quality, Performance Management)
-Account Management Portals
-Strategic Technology Partnerships
Key differentiators (continued) Technology Strategy
64
For
per
sona
l use
onl
y
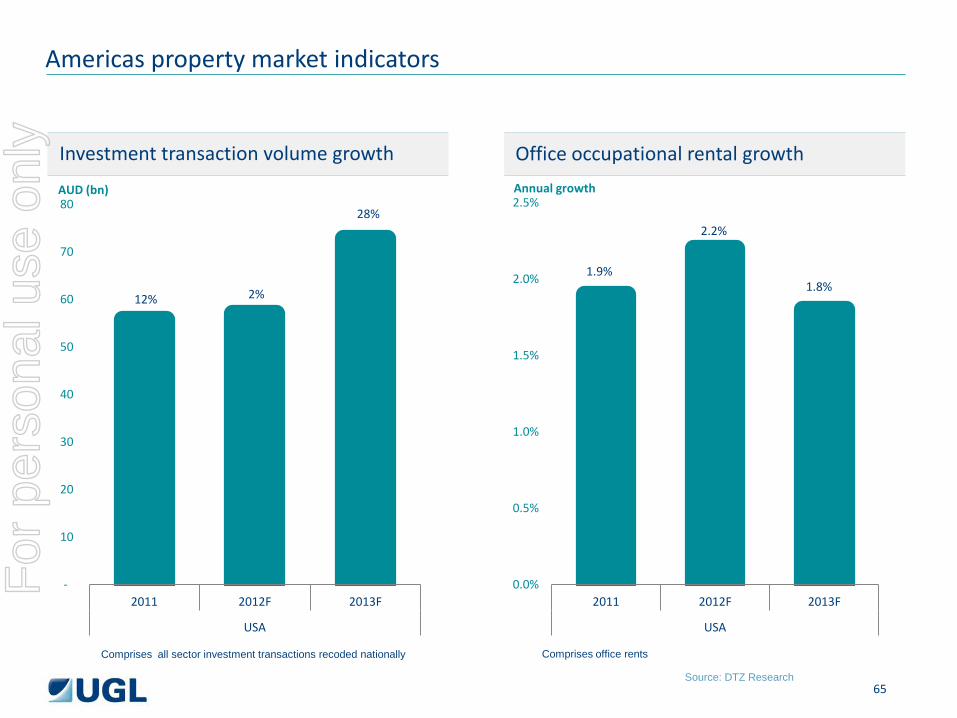
1.9%
2.2%
1.8%
0.0%
0.5%
1.0%
1.5%
2.0%
2.5%
2011 2012F 2013F
USA
Investment transaction volume growth Office occupational rental growth
Americas property market indicators
12% 2%
28%
-
10
20
30
40
50
60
70
80
2011 2012F 2013F
USA
AUD (bn)
Comprises all sector investment transactions recoded nationally
Annual growth
Comprises office rents
Source: DTZ Research 65
For
per
sona
l use
onl
y
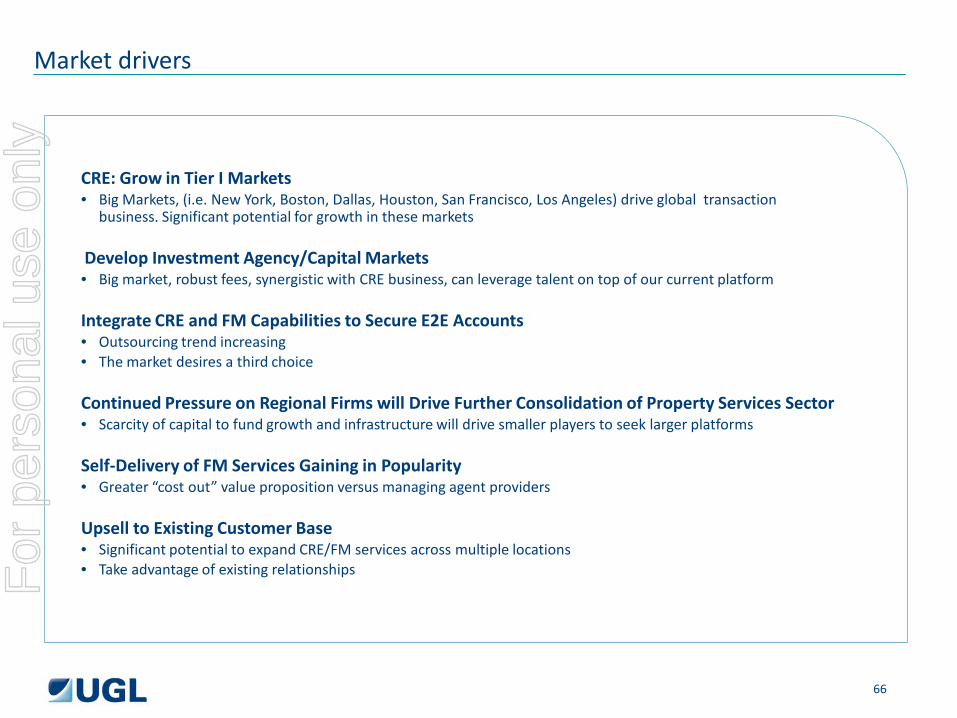
Market drivers
CRE: Grow in Tier I Markets • Big Markets, (i.e. New York, Boston, Dallas, Houston, San Francisco, Los Angeles) drive global transaction
business. Significant potential for growth in these markets Develop Investment Agency/Capital Markets • Big market, robust fees, synergistic with CRE business, can leverage talent on top of our current platform Integrate CRE and FM Capabilities to Secure E2E Accounts • Outsourcing trend increasing • The market desires a third choice
Continued Pressure on Regional Firms will Drive Further Consolidation of Property Services Sector • Scarcity of capital to fund growth and infrastructure will drive smaller players to seek larger platforms Self-Delivery of FM Services Gaining in Popularity • Greater “cost out” value proposition versus managing agent providers Upsell to Existing Customer Base • Significant potential to expand CRE/FM services across multiple locations • Take advantage of existing relationships
66
For
per
sona
l use
onl
y

Recent Wins
Major Retail Grocery Chain
Bank of America World-leading Pharmaceutical Company
Sun Life Stadium
Recent Major Contracts
• 5-year contract for facilities management for the iconic Florida stadium--home to the Miami Dolphins football team.
• 3-year contract to provide facilities management services for 750 stores in North America.
• 5-year contract for Integrated Facilities Management and Project Management.
• United States—”Follow your customer” strategy.
• Relationship began five years ago with locations in Northeast.
• Expanded to Southern California.
• Re-bid has expanded us into Northern California.
• Presence on west coast has opened up business opportunities and recent wins.
67
For
per
sona
l use
onl
y
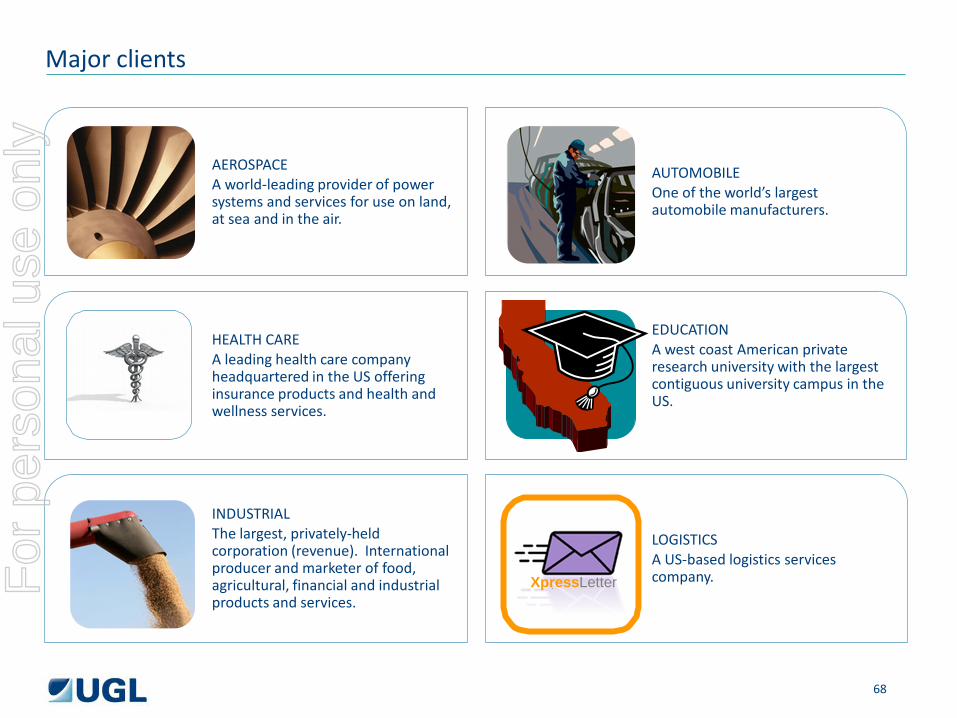
Major clients
LOGISTICS A US-based logistics services company.
EDUCATION A west coast American private research university with the largest contiguous university campus in the US.
AUTOMOBILE One of the world’s largest automobile manufacturers.
Item
HEALTH CARE A leading health care company headquartered in the US offering insurance products and health and wellness services.
INDUSTRIAL The largest, privately-held corporation (revenue). International producer and marketer of food, agricultural, financial and industrial products and services.
AEROSPACE A world-leading provider of power systems and services for use on land, at sea and in the air.
XpressLetter
68
For
per
sona
l use
onl
y
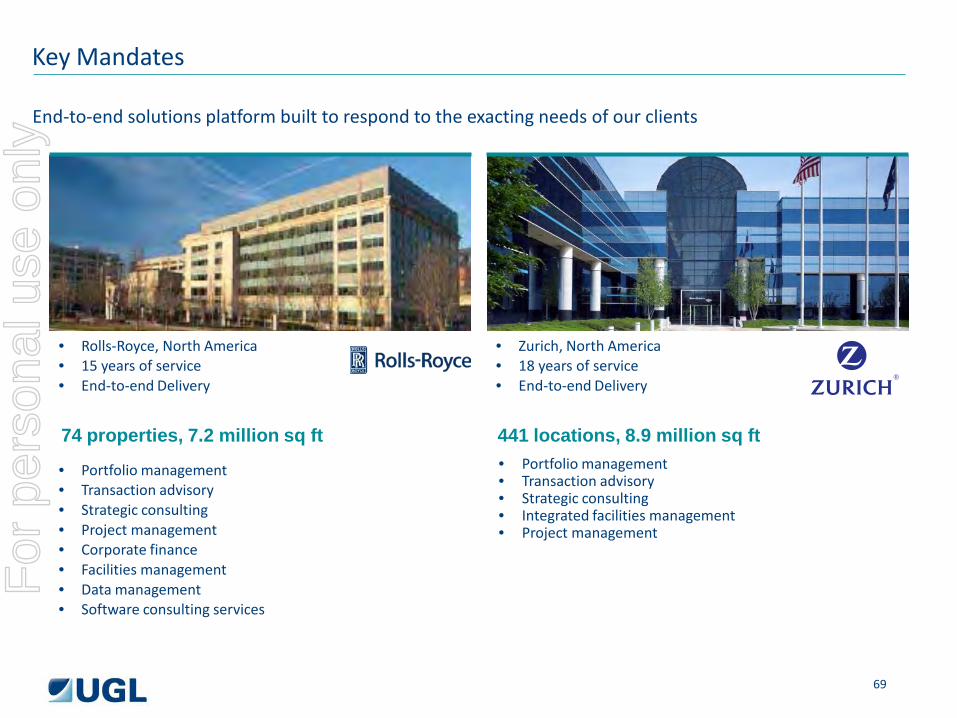
End-to-end solutions platform built to respond to the exacting needs of our clients
Key Mandates
• Portfolio management • Transaction advisory • Strategic consulting • Project management • Corporate finance • Facilities management • Data management • Software consulting services
• Rolls-Royce, North America • 15 years of service • End-to-end Delivery
• Portfolio management • Transaction advisory • Strategic consulting • Integrated facilities management • Project management
• Zurich, North America • 18 years of service • End-to-end Delivery
74 properties, 7.2 million sq ft 441 locations, 8.9 million sq ft
69
For
per
sona
l use
onl
y

Edward Cheung, Chief Executive
North Asia
70
For
per
sona
l use
onl
y
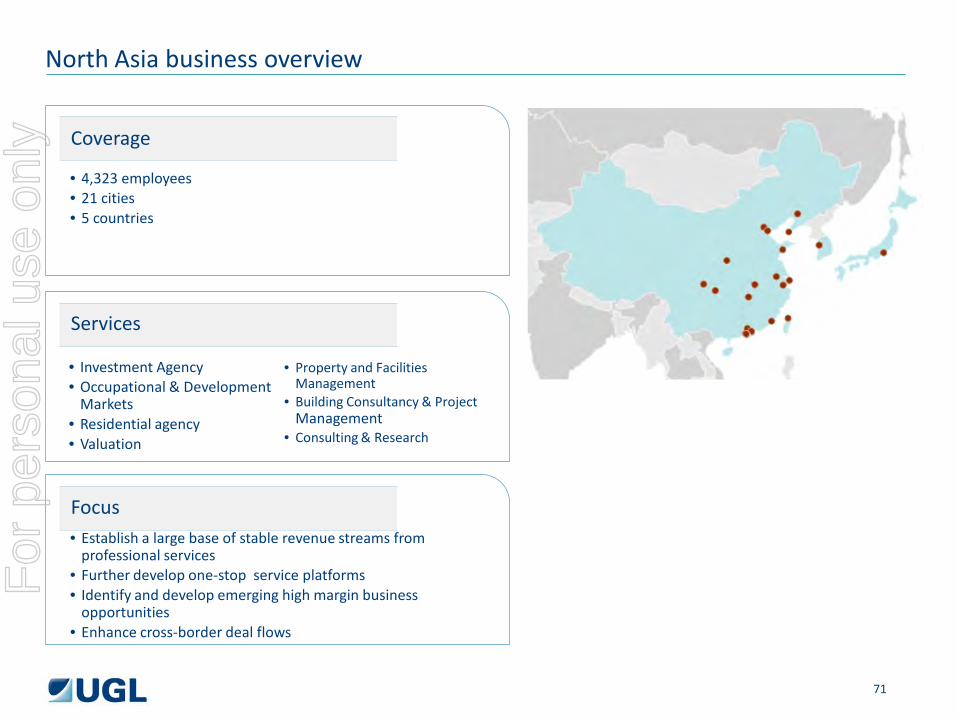
North Asia business overview
Coverage
Services
Focus
• 4,323 employees • 21 cities • 5 countries
• Investment Agency • Occupational & Development
Markets • Residential agency • Valuation
• Establish a large base of stable revenue streams from professional services
• Further develop one-stop service platforms • Identify and develop emerging high margin business
opportunities • Enhance cross-border deal flows
• Property and Facilities Management
• Building Consultancy & Project Management
• Consulting & Research
71
For
per
sona
l use
onl
y
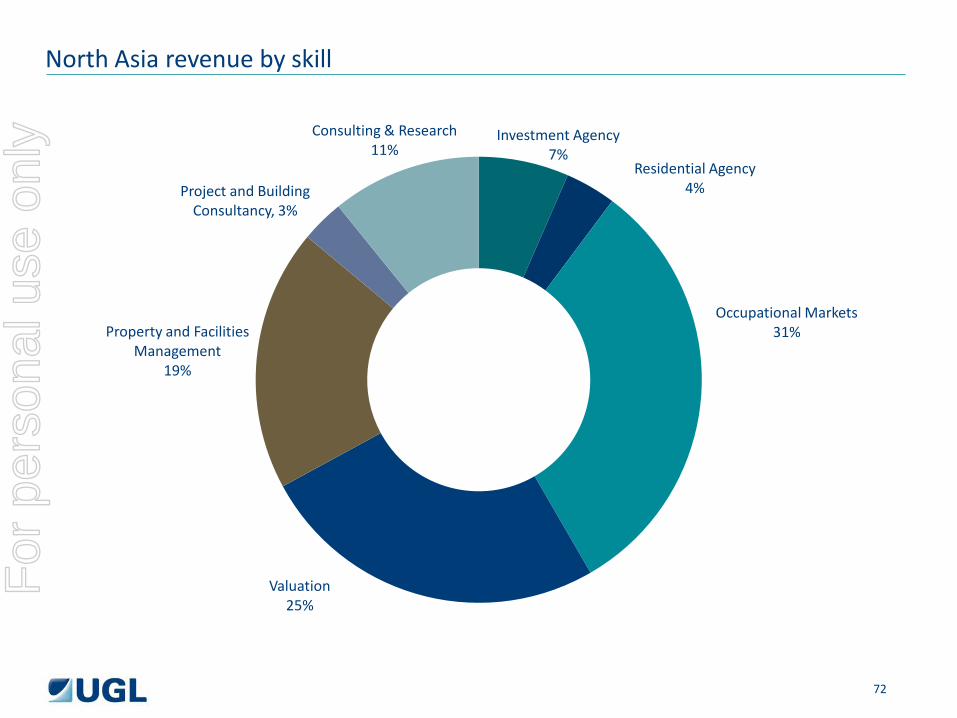
North Asia revenue by skill
Investment Agency 7%
Residential Agency 4%
Occupational Markets 31%
Valuation 25%
Project and Building Consultancy, 3%
Consulting & Research 11%
Property and Facilities Management
19%
72
For
per
sona
l use
onl
y
North Asia differentiators
• With the combined power of UGL and DTZ, we have the most diversified service capability
• We are #1 in valuation business in the North Asia region
• We have the largest foot print in Greater China
• Our brand is synonymous with quality real estate services with integrity in China
• We have the strongest track record of government and local clients appointments
73
For
per
sona
l use
onl
y
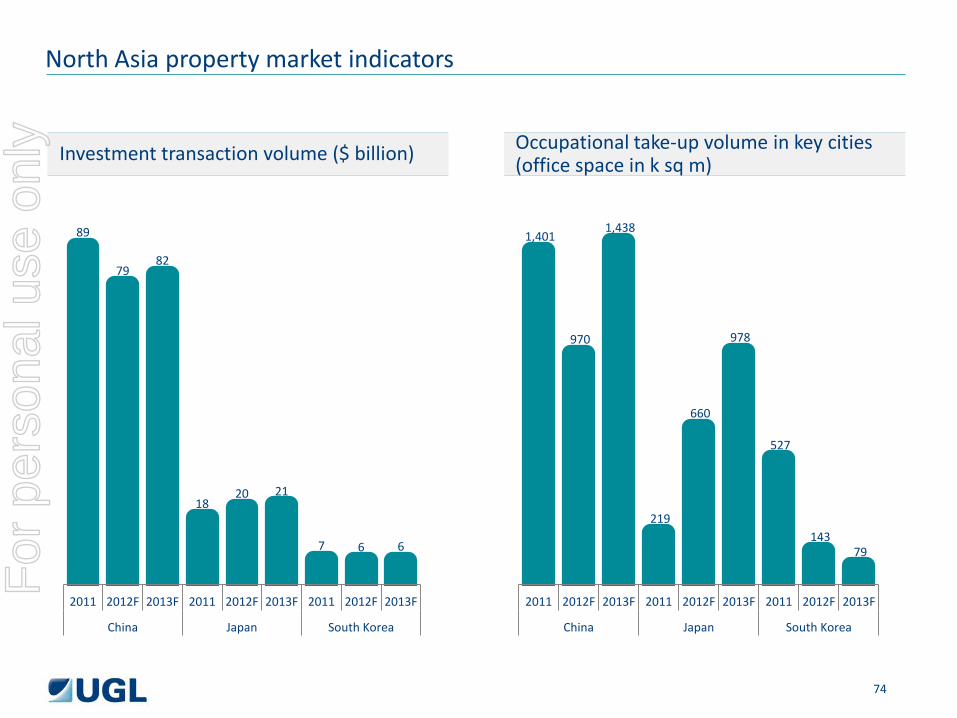
1,401
970
1,438
219
660
978
527
143 79
2011 2012F 2013F 2011 2012F 2013F 2011 2012F 2013F
China Japan South Korea
Investment transaction volume ($ billion) Occupational take-up volume in key cities (office space in k sq m)
North Asia property market indicators
89
79 82
18 20 21
7 6 6
2011 2012F 2013F 2011 2012F 2013F 2011 2012F 2013F
China Japan South Korea
74
For
per
sona
l use
onl
y
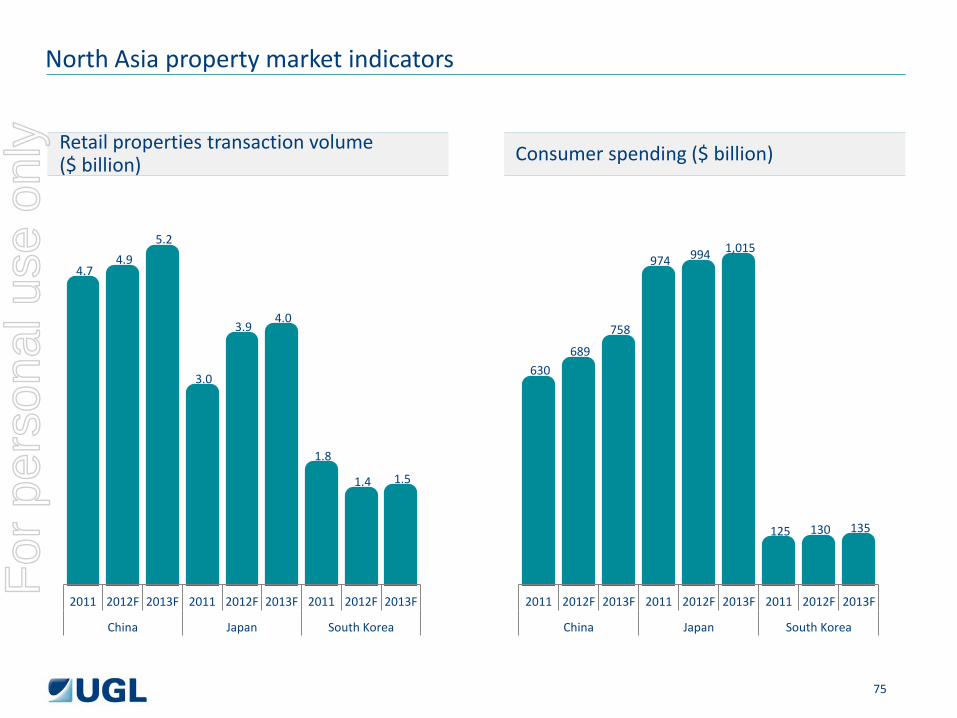
630 689
758
974 994 1,015
125 130 135
2011 2012F 2013F 2011 2012F 2013F 2011 2012F 2013F
China Japan South Korea
Retail properties transaction volume ($ billion) Consumer spending ($ billion)
North Asia property market indicators
4.7 4.9
5.2
3.0
3.9 4.0
1.8
1.4 1.5
2011 2012F 2013F 2011 2012F 2013F 2011 2012F 2013F
China Japan South Korea
75
For
per
sona
l use
onl
y
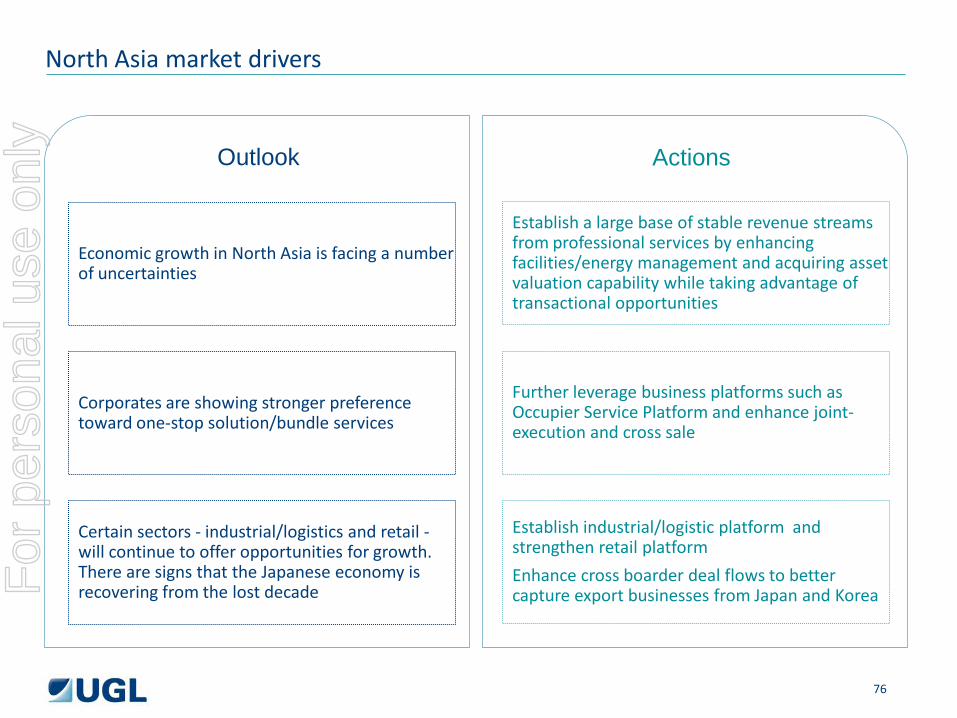
North Asia market drivers
Economic growth in North Asia is facing a number of uncertainties
Corporates are showing stronger preference toward one-stop solution/bundle services
Certain sectors - industrial/logistics and retail - will continue to offer opportunities for growth. There are signs that the Japanese economy is recovering from the lost decade
Outlook Actions
Establish a large base of stable revenue streams from professional services by enhancing facilities/energy management and acquiring asset valuation capability while taking advantage of transactional opportunities
Further leverage business platforms such as Occupier Service Platform and enhance joint-execution and cross sale
Establish industrial/logistic platform and strengthen retail platform
Enhance cross boarder deal flows to better capture export businesses from Japan and Korea
76
For
per
sona
l use
onl
y
North Asia major clients
Volvo • Providing full project management
services for Volvo’s Technical Centre in China
Akzo Nobel • Provided occupier transaction
management and project management services for Akzo Nobel’s office space
Tencent • Providing office space planning and
facilities management consultancy services
HSBC • Working as the exclusive valuer for
the mortgage services of HSBC in Hong Kong
China Merchant Group • Providing development
consultancy and property management services for multiple properties
77
Intel • Provided investment agency
service for Intel’s site disposal in Shanghai F
or p
erso
nal u
se o
nly
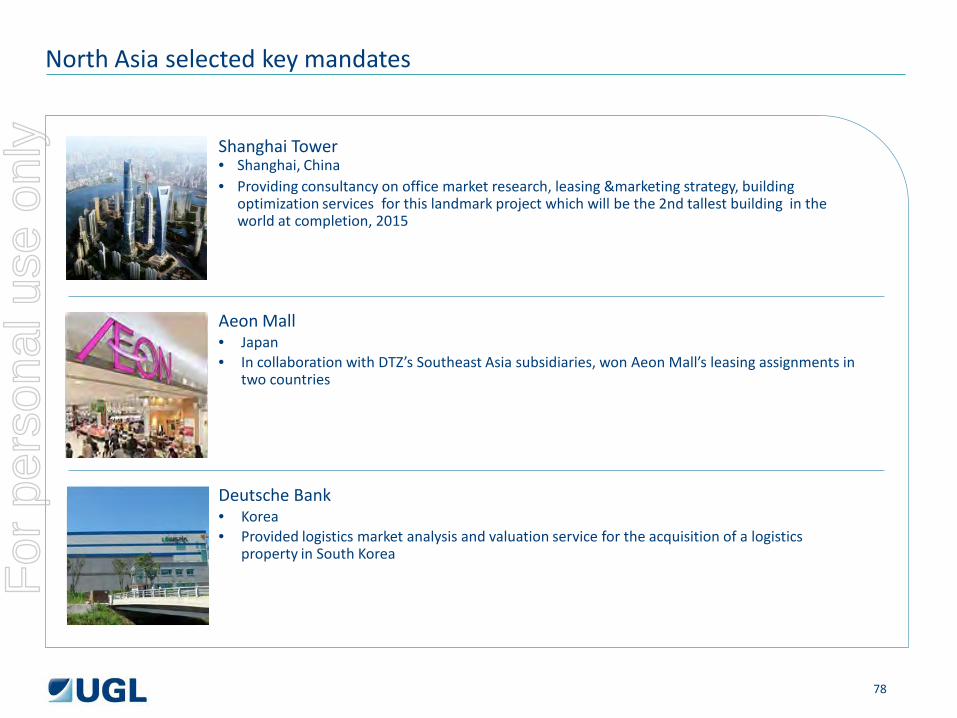
Shanghai Tower • Shanghai, China • Providing consultancy on office market research, leasing &marketing strategy, building
optimization services for this landmark project which will be the 2nd tallest building in the world at completion, 2015
North Asia selected key mandates
Aeon Mall • Japan • In collaboration with DTZ’s Southeast Asia subsidiaries, won Aeon Mall’s leasing assignments in
two countries
Deutsche Bank • Korea • Provided logistics market analysis and valuation service for the acquisition of a logistics
property in South Korea
78
For
per
sona
l use
onl
y

Adam Catchpole
Global Corporate Services - Asia
79
For
per
sona
l use
onl
y

GCS business overview
Coverage
Services
Focus
• 9 FT employees • Core hubs in US, UK and Asia (Hong Kong/Singapore) • Deliver across all UGL/DTZ geographies
• Client management and sales support • Transaction management • Real estate administration • Portfolio planning and strategy • Delivery portal for E2E service delivery
• Drive profitable revenue growth • Grow the scale of fee-earning team • Consolidate platform and infrastructure to deliver E2E
80
For
per
sona
l use
onl
y

• Extensive knowledge of best practices and dedication to
continual improvement
• Core team accountability
• Experienced global account management capabilities
• Technology sector experts • Senior level engagement
• Collaboration and innovation
GCS key differentiators
81
For
per
sona
l use
onl
y
GCS market drivers
Global outsourcing is continuing - no longer a trend or fad
Corporations are strengthening the financial accounting and control over lease and other associated RE expenditures – in light of FASB 6 changes
Portfolio software is being also centralized into global property databases – with corporations owning the system vs. suppliers but outsourcing collection and management
Supplier outsourcing models are getting more regionalized with a focus on best in class broker model - Consolidation of suppliers e.g TNT 8 into 2
Our access to that market is increasing due to our enhanced ability to deliver globally and across multiple skill lines
C-suite is tasking CRE to become more strategic to support the business. Facilities Management, Lease Administration, Brokerage, Workplace Services, Project Management
82
For
per
sona
l use
onl
y
GCS opportunities : growth drivers
Services
• Development of E2E delivery platform
• Development of Occupier Services platform across the region
• Building export opportunities from India and China
• Developing the regional platform for GCS - India and China
• Leveraging the global platform
Resources
• Enhance talent resources through selective hire
• Training and development
83
For
per
sona
l use
onl
y
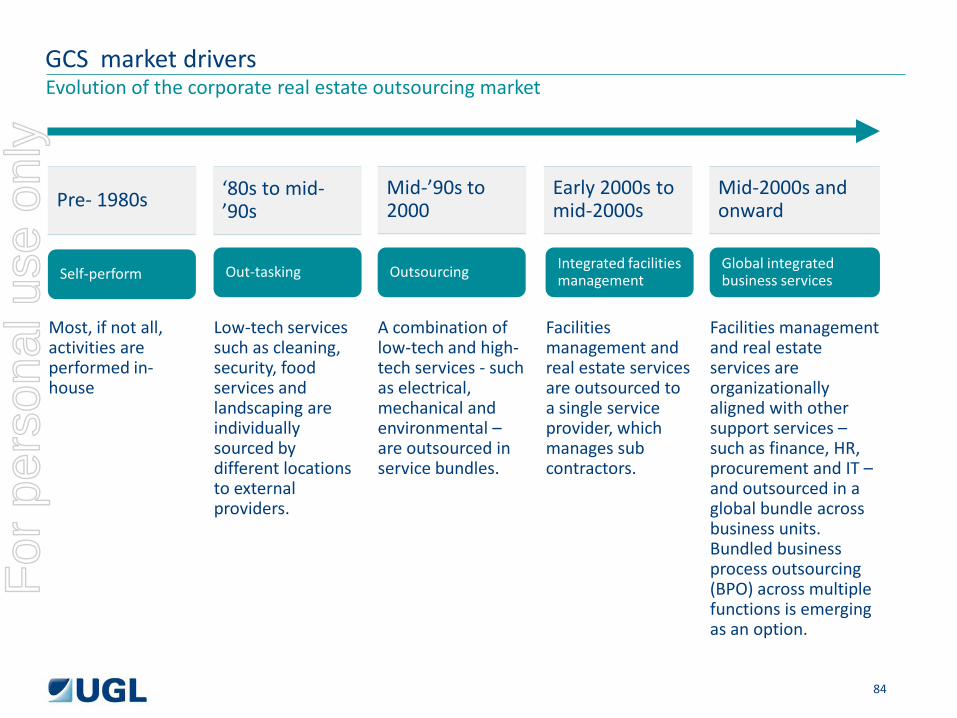
GCS market drivers Evolution of the corporate real estate outsourcing market
Pre- 1980s ‘80s to mid-’90s
Mid-’90s to 2000
Early 2000s to mid-2000s
Mid-2000s and onward
Self-perform Out-tasking Outsourcing Integrated facilities management
Global integrated business services
Most, if not all, activities are performed in-house
Low-tech services such as cleaning, security, food services and landscaping are individually sourced by different locations to external providers.
A combination of low-tech and high-tech services - such as electrical, mechanical and environmental – are outsourced in service bundles.
Facilities management and real estate services are outsourced to a single service provider, which manages sub contractors.
Facilities management and real estate services are organizationally aligned with other support services – such as finance, HR, procurement and IT – and outsourced in a global bundle across business units. Bundled business process outsourcing (BPO) across multiple functions is emerging as an option.
84
For
per
sona
l use
onl
y
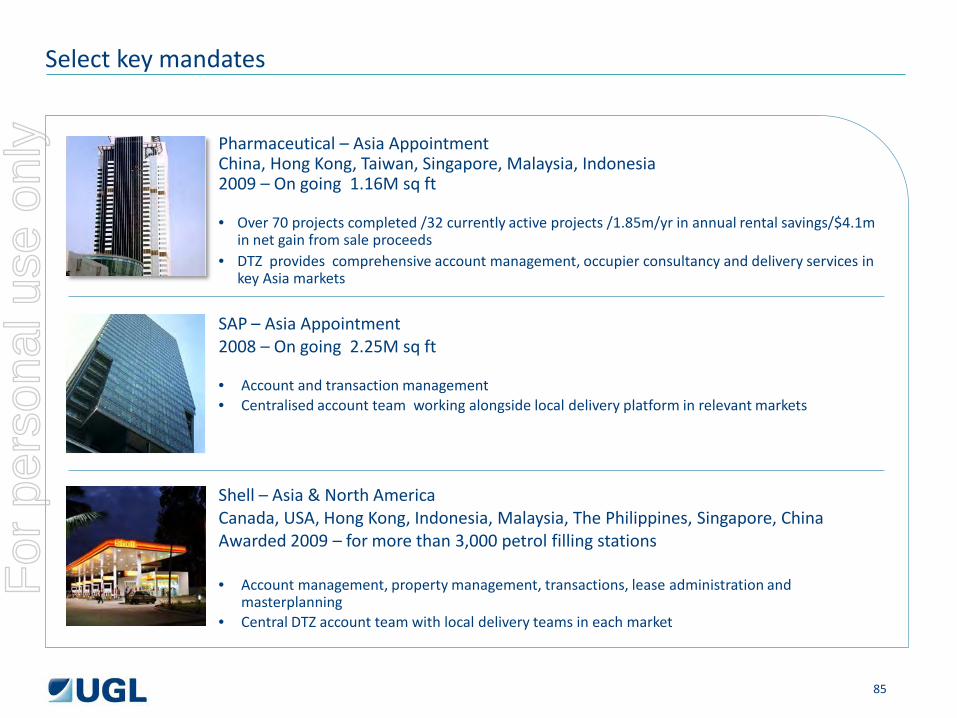
Pharmaceutical – Asia Appointment China, Hong Kong, Taiwan, Singapore, Malaysia, Indonesia 2009 – On going 1.16M sq ft • Over 70 projects completed /32 currently active projects /1.85m/yr in annual rental savings/$4.1m
in net gain from sale proceeds • DTZ provides comprehensive account management, occupier consultancy and delivery services in
key Asia markets
Select key mandates
SAP – Asia Appointment 2008 – On going 2.25M sq ft • Account and transaction management • Centralised account team working alongside local delivery platform in relevant markets
Shell – Asia & North America Canada, USA, Hong Kong, Indonesia, Malaysia, The Philippines, Singapore, China Awarded 2009 – for more than 3,000 petrol filling stations • Account management, property management, transactions, lease administration and
masterplanning • Central DTZ account team with local delivery teams in each market
85
For
per
sona
l use
onl
y
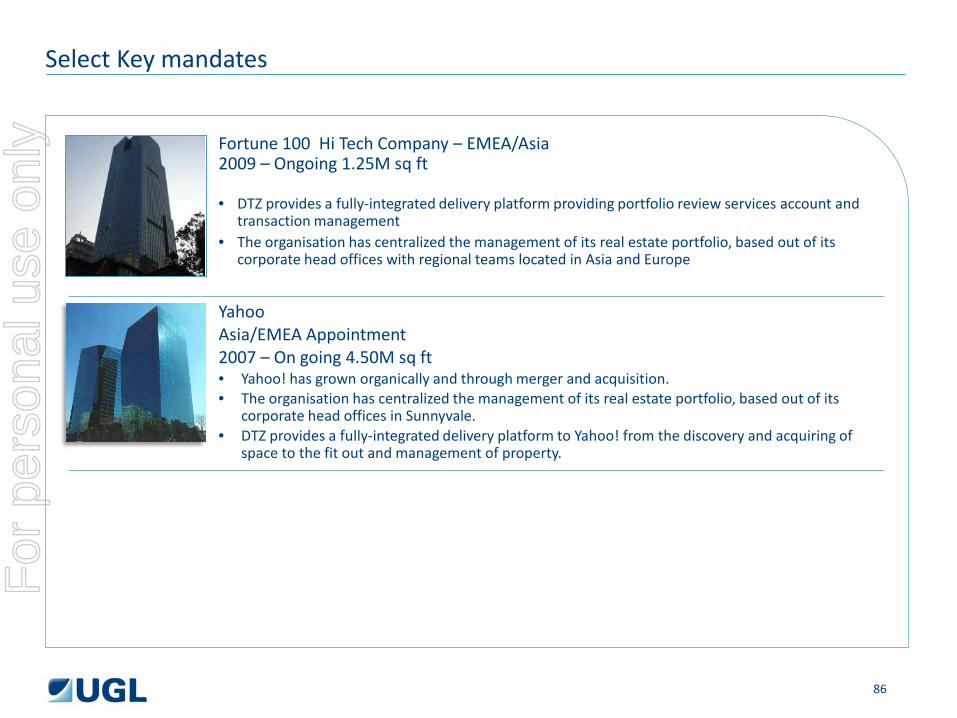
Fortune 100 Hi Tech Company – EMEA/Asia 2009 – Ongoing 1.25M sq ft
• DTZ provides a fully-integrated delivery platform providing portfolio review services account and
transaction management • The organisation has centralized the management of its real estate portfolio, based out of its
corporate head offices with regional teams located in Asia and Europe
Select Key mandates
Yahoo Asia/EMEA Appointment 2007 – On going 4.50M sq ft • Yahoo! has grown organically and through merger and acquisition. • The organisation has centralized the management of its real estate portfolio, based out of its
corporate head offices in Sunnyvale. • DTZ provides a fully-integrated delivery platform to Yahoo! from the discovery and acquiring of
space to the fit out and management of property.
86
For
per
sona
l use
onl
y
Mark Price, Head of Business Space, North Asia
Occupier and Development Markets (ODM), North Asia
87
For
per
sona
l use
onl
y
ODM North Asia business overview
Coverage
Services
Focus
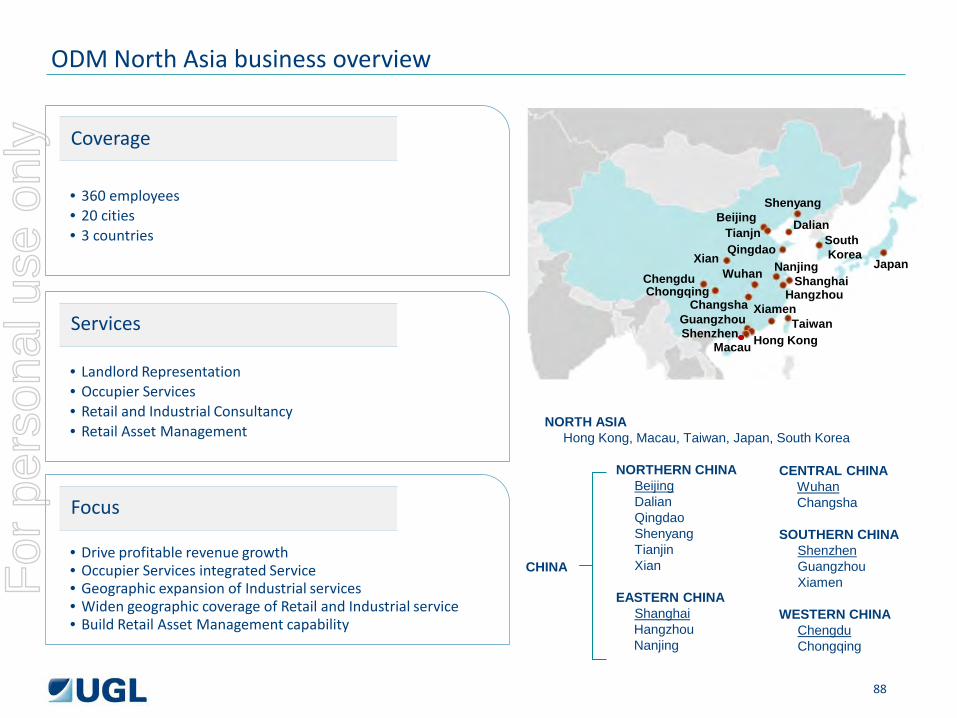
• 360 employees • 20 cities • 3 countries
• Landlord Representation • Occupier Services • Retail and Industrial Consultancy • Retail Asset Management
• Drive profitable revenue growth • Occupier Services integrated Service • Geographic expansion of Industrial services • Widen geographic coverage of Retail and Industrial service • Build Retail Asset Management capability
NORTH ASIA Hong Kong, Macau, Taiwan, Japan, South Korea
CENTRAL CHINA Wuhan Changsha
SOUTHERN CHINA
Shenzhen Guangzhou Xiamen
WESTERN CHINA
Chengdu Chongqing
Guangzhou Shenzhen
Xiamen
Chengdu Chongqing
Xian
Beijing Dalian Tianjn Qingdao
Hangzhou
Wuhan
Changsha
Nanjing Shanghai
Taiwan Hong Kong
South Korea
Japan
Macau
NORTHERN CHINA Beijing Dalian Qingdao Shenyang Tianjin Xian
EASTERN CHINA
Shanghai Hangzhou Nanjing
CHINA
Shenyang
88
For
per
sona
l use
onl
y
ODM North Asia revenue by skill
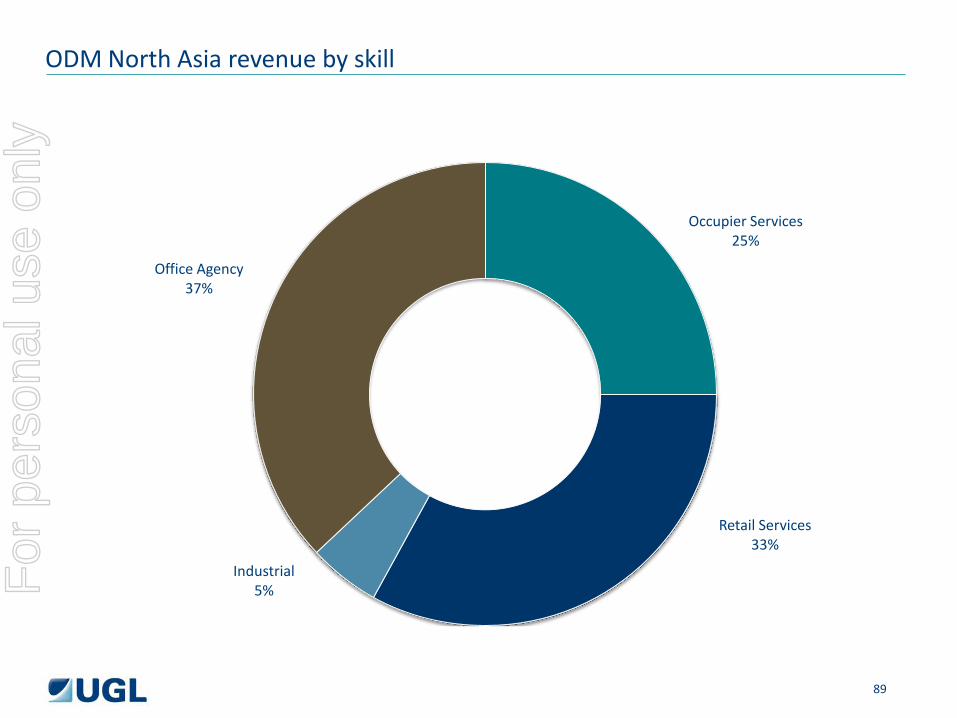
Occupier Services 25%
Retail Services 33%
Industrial 5%
Office Agency 37%
89
For
per
sona
l use
onl
y
ODM North Asia differentiators
• Widest geographic coverage in China among international real estate advisory firms
• Occupier Services market leader advising China Enterprise
• Majority share office strata sales East China
• Retail Services penetrating 2nd and 3rd tier cities in China
• Industrial team China strongest site selection team among peers
• Occupier Services platform providing integrated end to end solution
90
For
per
sona
l use
onl
y
ODM North Asia market drivers
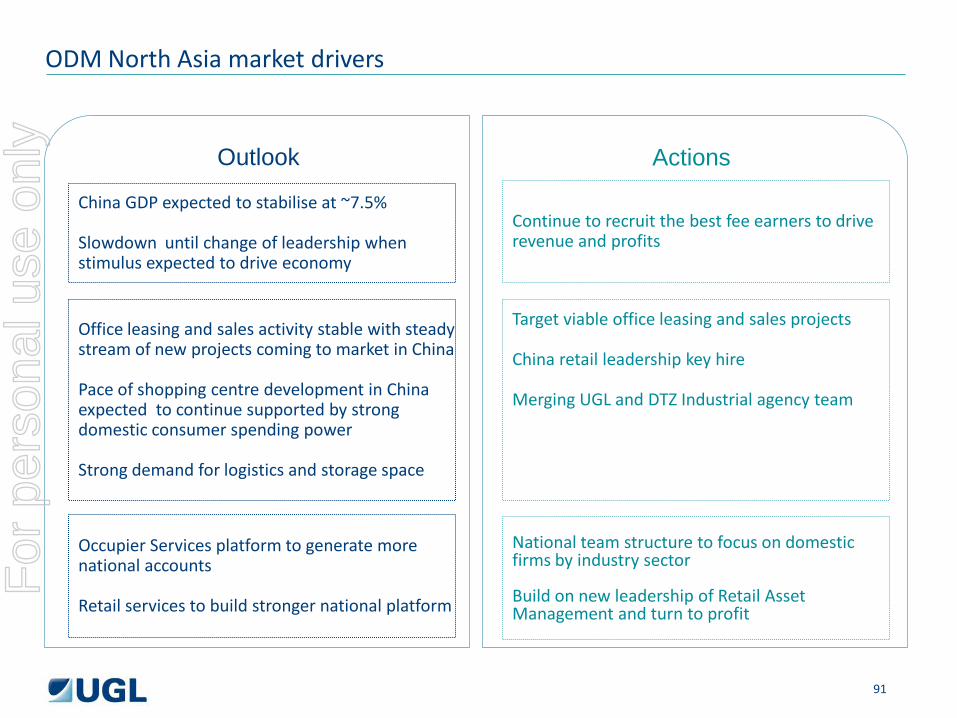
China GDP expected to stabilise at ~7.5% Slowdown until change of leadership when stimulus expected to drive economy
Office leasing and sales activity stable with steady stream of new projects coming to market in China Pace of shopping centre development in China expected to continue supported by strong domestic consumer spending power Strong demand for logistics and storage space
Occupier Services platform to generate more national accounts Retail services to build stronger national platform
Outlook Actions
Continue to recruit the best fee earners to drive revenue and profits
Target viable office leasing and sales projects China retail leadership key hire Merging UGL and DTZ Industrial agency team
National team structure to focus on domestic firms by industry sector Build on new leadership of Retail Asset Management and turn to profit
91
For
per
sona
l use
onl
y
ODM North Asia major clients
Regus • Occupier Services
• Lease acquisitions in multiple cities China
Alibaba • Occupier Services
• Lease acquisitions China
International Bank • Occupier Services
• Bank branch roll out program in 30 plus cities in China
Vanke • Retail Consultancy and leasing
services for 2 new shopping centres North China
Rreef • Leasing services for 800k sq ft
office tower Dalian China
Intel • Site disposal in Weigeijao Shanghai
92
Banking client
For
per
sona
l use
onl
y
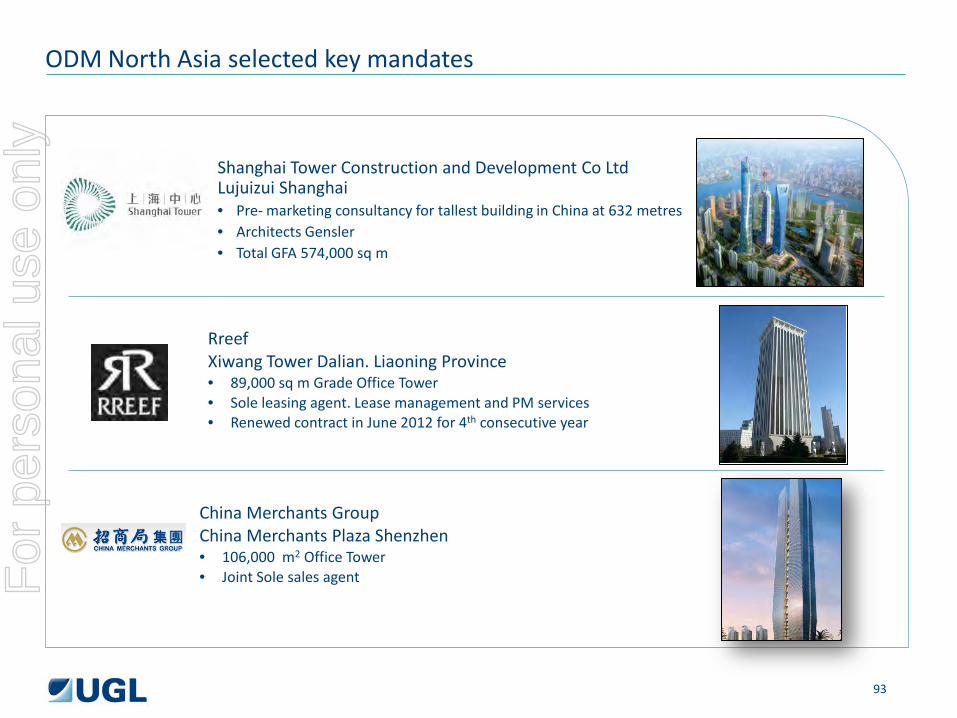
Shanghai Tower Construction and Development Co Ltd Lujuizui Shanghai • Pre- marketing consultancy for tallest building in China at 632 metres • Architects Gensler • Total GFA 574,000 sq m
ODM North Asia selected key mandates
Rreef Xiwang Tower Dalian. Liaoning Province • 89,000 sq m Grade Office Tower • Sole leasing agent. Lease management and PM services • Renewed contract in June 2012 for 4th consecutive year
China Merchants Group China Merchants Plaza Shenzhen • 106,000 m2 Office Tower • Joint Sole sales agent
93
For
per
sona
l use
onl
y
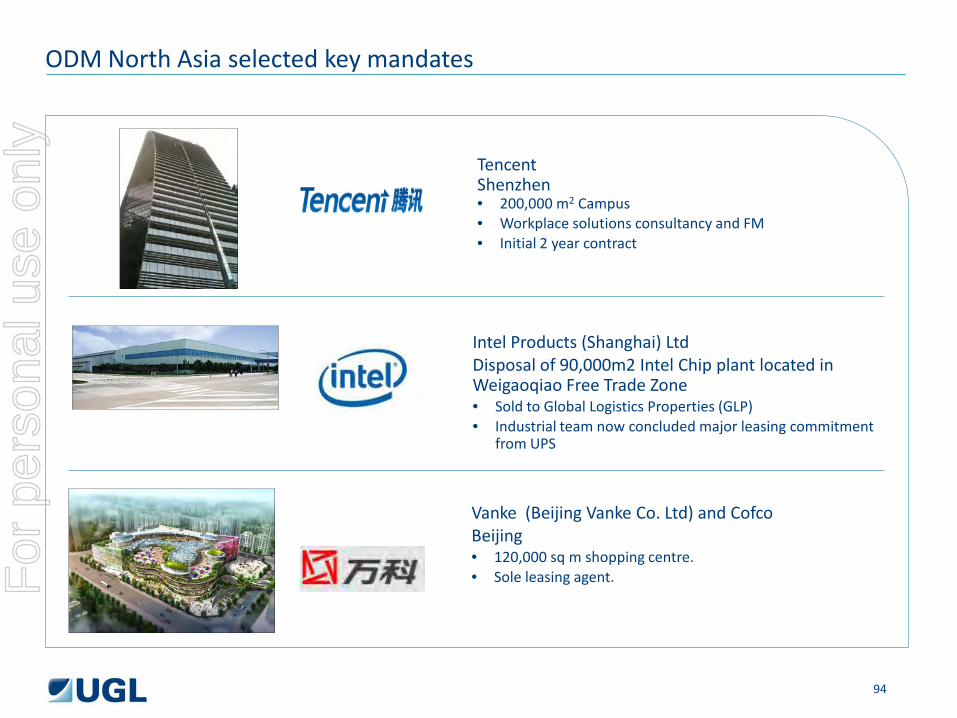
Intel Products (Shanghai) Ltd Disposal of 90,000m2 Intel Chip plant located in Weigaoqiao Free Trade Zone • Sold to Global Logistics Properties (GLP) • Industrial team now concluded major leasing commitment
from UPS
Tencent Shenzhen • 200,000 m2 Campus • Workplace solutions consultancy and FM • Initial 2 year contract
Vanke (Beijing Vanke Co. Ltd) and Cofco Beijing • 120,000 sq m shopping centre. • Sole leasing agent.
ODM North Asia selected key mandates
94
For
per
sona
l use
onl
y

Henry Arundel, Chief Executive Southeast Asia / Australia and New Zealand
Asia Pacific
95
For
per
sona
l use
onl
y
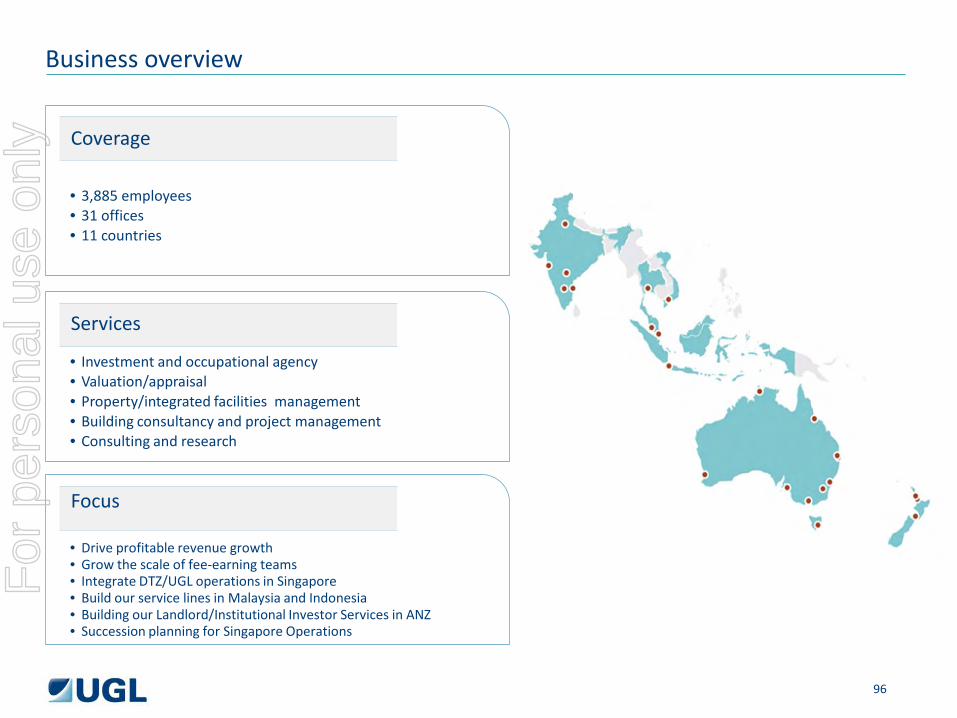
Business overview
Coverage
Services
Focus
• 3,885 employees • 31 offices • 11 countries
• Investment and occupational agency • Valuation/appraisal • Property/integrated facilities management • Building consultancy and project management • Consulting and research
• Drive profitable revenue growth • Grow the scale of fee-earning teams • Integrate DTZ/UGL operations in Singapore • Build our service lines in Malaysia and Indonesia • Building our Landlord/Institutional Investor Services in ANZ • Succession planning for Singapore Operations
96
For
per
sona
l use
onl
y
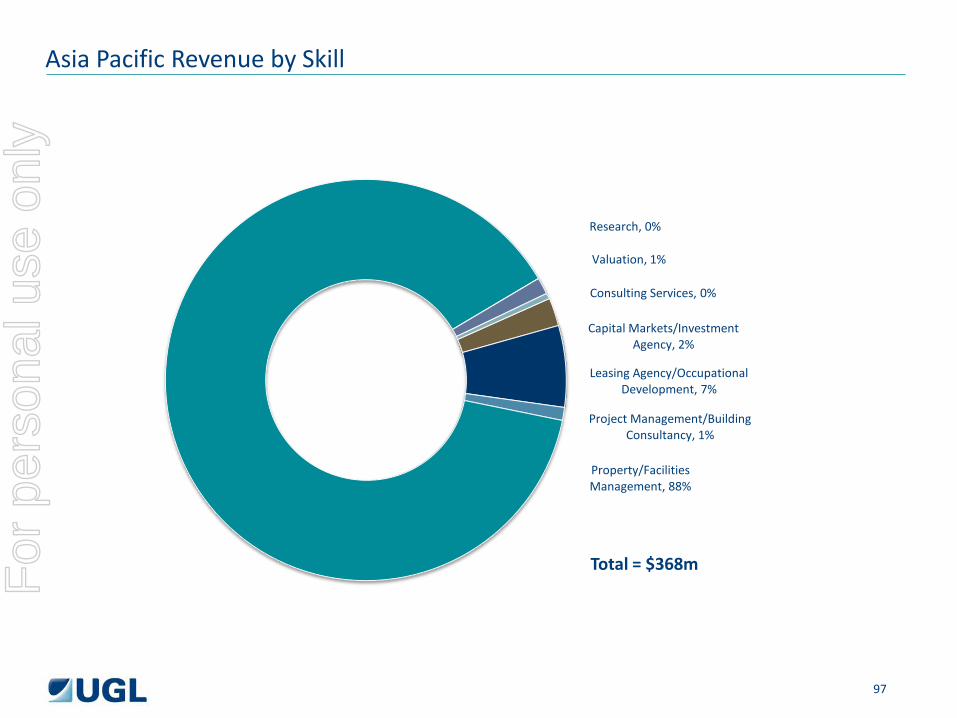
Asia Pacific Revenue by Skill
Capital Markets/Investment Agency, 2%
Leasing Agency/Occupational Development, 7%
Project Management/Building Consultancy, 1%
Property/Facilities Management, 88%
Research, 0%
Valuation, 1%
Consulting Services, 0%
Total = $368m
97
For
per
sona
l use
onl
y
Asia Pacific differentiators
• #1 by revenues in Asia Pacific region
• #1 in ANZ market
• #1 in Singapore market. (Top #3 in Singapore & Malaysia markets for DTZ )
• Singapore – Only International Consultancy providing specialist Hospitality Management services (e.g.
Award winning “Treetops Executive Residences”)
• Singapore - #1 in Residential Resales/brokerage with 2000+ Associate agents.
• Malaysia- #1 in Retail Development Consultancy & Leasing
• Only IPC in India with a niche private banking practice and raised over USD 1.8 Bn
• Only IPC in India with base build project experience for high-rise buildings
• India Valuations team developed RICS Red Book for Valuations standards in India
• India, Awarded ‘Best Property Consultancy of India’ for 3 consecutive years: 2010-2012
98
For
per
sona
l use
onl
y
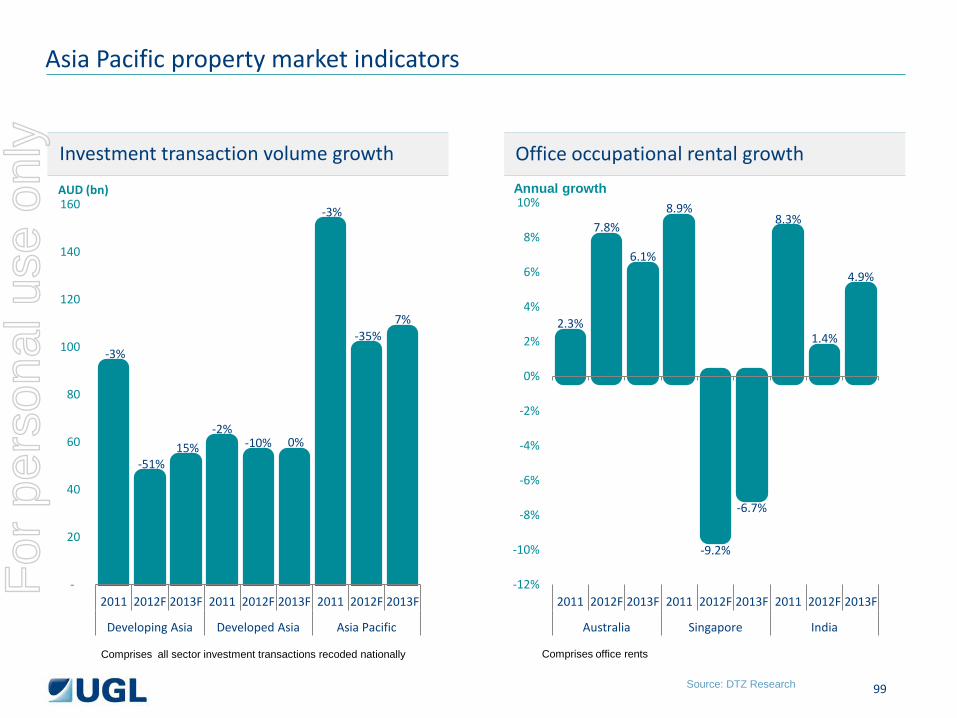
Investment transaction volume growth Office occupational rental growth
Asia Pacific property market indicators
-3%
-51% 15%
-2% -10% 0%
-3%
-35% 7%
-
20
40
60
80
100
120
140
160
2011 2012F 2013F 2011 2012F 2013F 2011 2012F 2013F
Developing Asia Developed Asia Asia Pacific
AUD (bn)
Comprises all sector investment transactions recoded nationally Comprises office rents
Annual growth
2.3%
7.8%
6.1%
8.9%
-9.2%
-6.7%
8.3%
1.4%
4.9%
-12%
-10%
-8%
-6%
-4%
-2%
0%
2%
4%
6%
8%
10%
2011 2012F 2013F 2011 2012F 2013F 2011 2012F 2013F
Australia Singapore India
Source: DTZ Research 99
For
per
sona
l use
onl
y
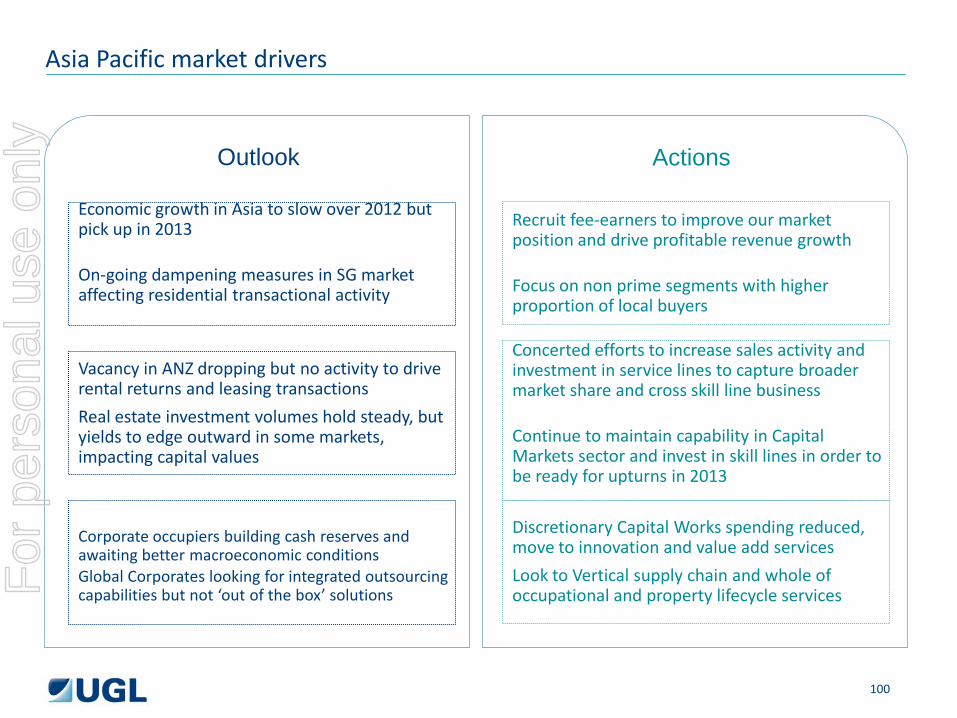
Asia Pacific market drivers
Economic growth in Asia to slow over 2012 but pick up in 2013 On-going dampening measures in SG market affecting residential transactional activity
Vacancy in ANZ dropping but no activity to drive rental returns and leasing transactions
Real estate investment volumes hold steady, but yields to edge outward in some markets, impacting capital values
Corporate occupiers building cash reserves and awaiting better macroeconomic conditions Global Corporates looking for integrated outsourcing capabilities but not ‘out of the box’ solutions
Outlook Actions
Recruit fee-earners to improve our market position and drive profitable revenue growth Focus on non prime segments with higher proportion of local buyers
Concerted efforts to increase sales activity and investment in service lines to capture broader market share and cross skill line business Continue to maintain capability in Capital Markets sector and invest in skill lines in order to be ready for upturns in 2013
Discretionary Capital Works spending reduced, move to innovation and value add services
Look to Vertical supply chain and whole of occupational and property lifecycle services
100
For
per
sona
l use
onl
y
Opportunities: growth drivers
Full Service across the region • Driving depth of service to existing customers • Development of new service lines in geographic areas where we currently have no capability • Developing domestic clients in Indonesia, India • Developing the project management business across the region • Moving to full service in Australia • Moving to full service in India • Developing the regional platform for GCS
Talent Acquisition • Capitalisation on momentum created by new combined company • Opportunity to create connected local and regional teams that capitalise on existing local and
regional capabilities Innovation • Leverage innovation from different parts of the business to create opportunities in other markets –
e.g Energy and Beyond Green
101
For
per
sona
l use
onl
y
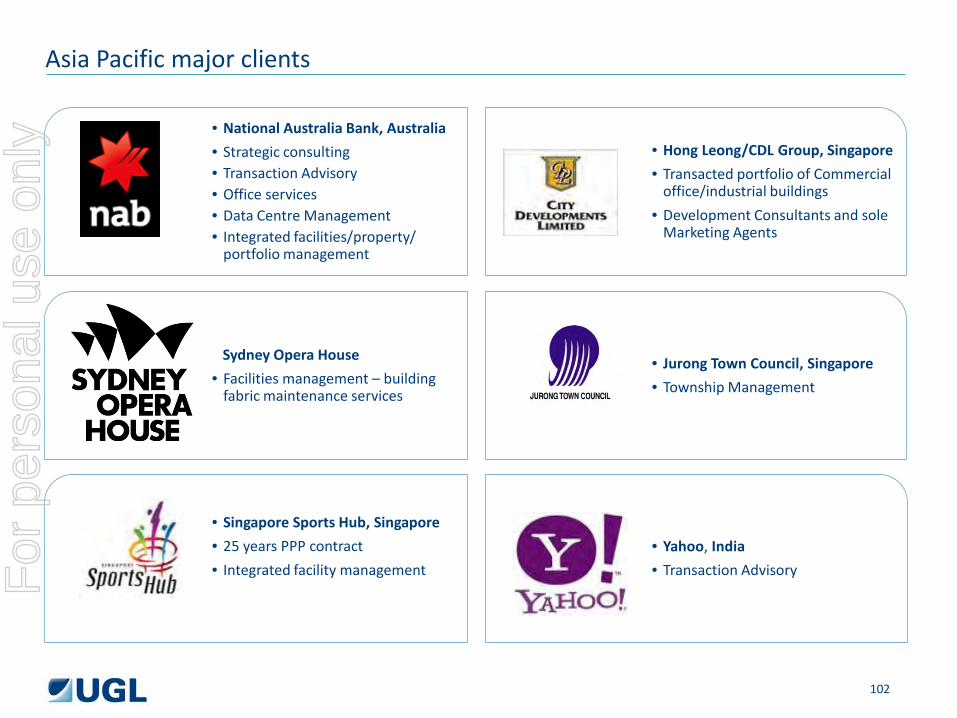
Asia Pacific major clients
• Yahoo, India
• Transaction Advisory
• Jurong Town Council, Singapore
• Township Management
• Hong Leong/CDL Group, Singapore
• Transacted portfolio of Commercial office/industrial buildings
• Development Consultants and sole Marketing Agents
• National Australia Bank, Australia
• Strategic consulting • Transaction Advisory • Office services • Data Centre Management • Integrated facilities/property/
portfolio management
Sydney Opera House
• Facilities management – building fabric maintenance services
• Singapore Sports Hub, Singapore
• 25 years PPP contract
• Integrated facility management
102
For
per
sona
l use
onl
y
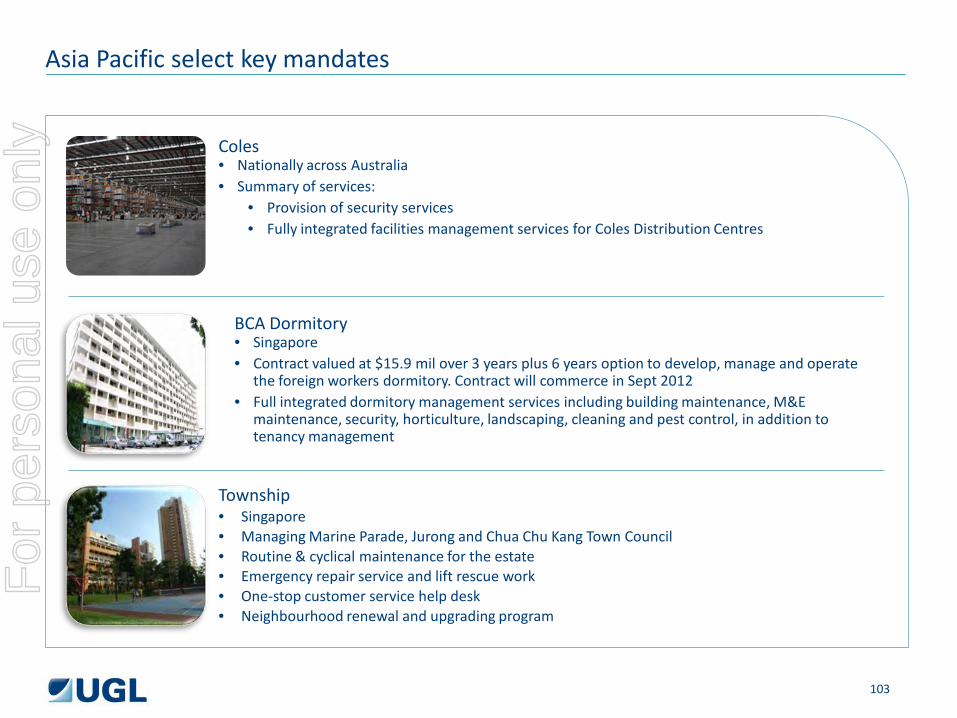
Coles • Nationally across Australia • Summary of services:
• Provision of security services • Fully integrated facilities management services for Coles Distribution Centres
Asia Pacific select key mandates
BCA Dormitory • Singapore • Contract valued at $15.9 mil over 3 years plus 6 years option to develop, manage and operate
the foreign workers dormitory. Contract will commerce in Sept 2012 • Full integrated dormitory management services including building maintenance, M&E
maintenance, security, horticulture, landscaping, cleaning and pest control, in addition to tenancy management
Township • Singapore • Managing Marine Parade, Jurong and Chua Chu Kang Town Council • Routine & cyclical maintenance for the estate • Emergency repair service and lift rescue work • One-stop customer service help desk • Neighbourhood renewal and upgrading program
103
For
per
sona
l use
onl
y
Alva To, Senior Director, Head of Consulting, North Asia
Consulting – North Asia
104
For
per
sona
l use
onl
y
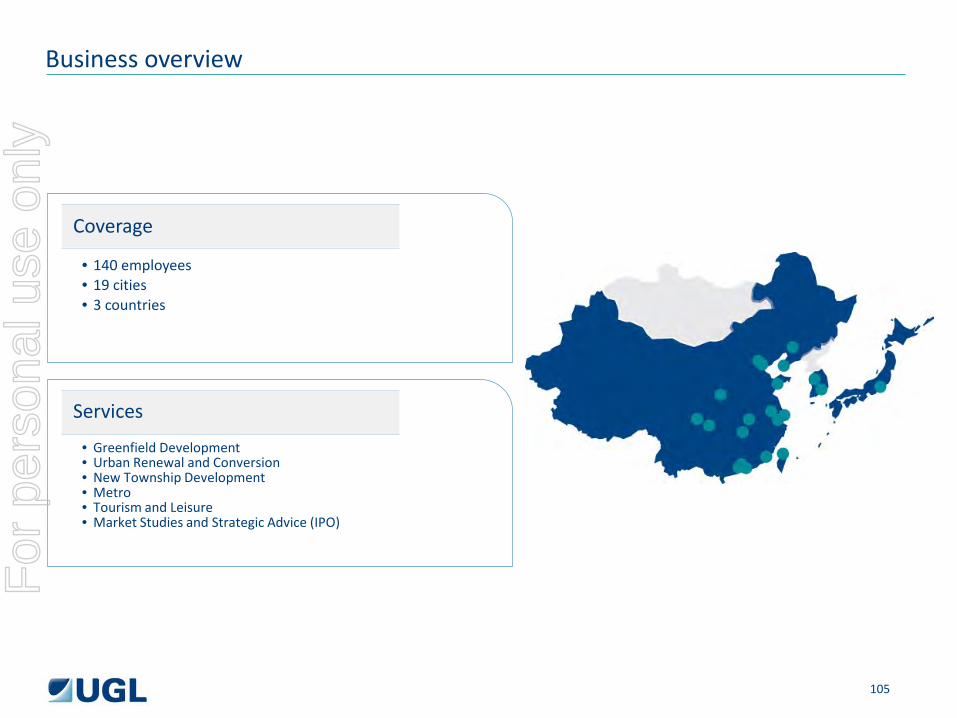
Business overview
Coverage
Services
• 140 employees • 19 cities • 3 countries
• Greenfield Development • Urban Renewal and Conversion • New Township Development • Metro • Tourism and Leisure • Market Studies and Strategic Advice (IPO)
105
For
per
sona
l use
onl
y
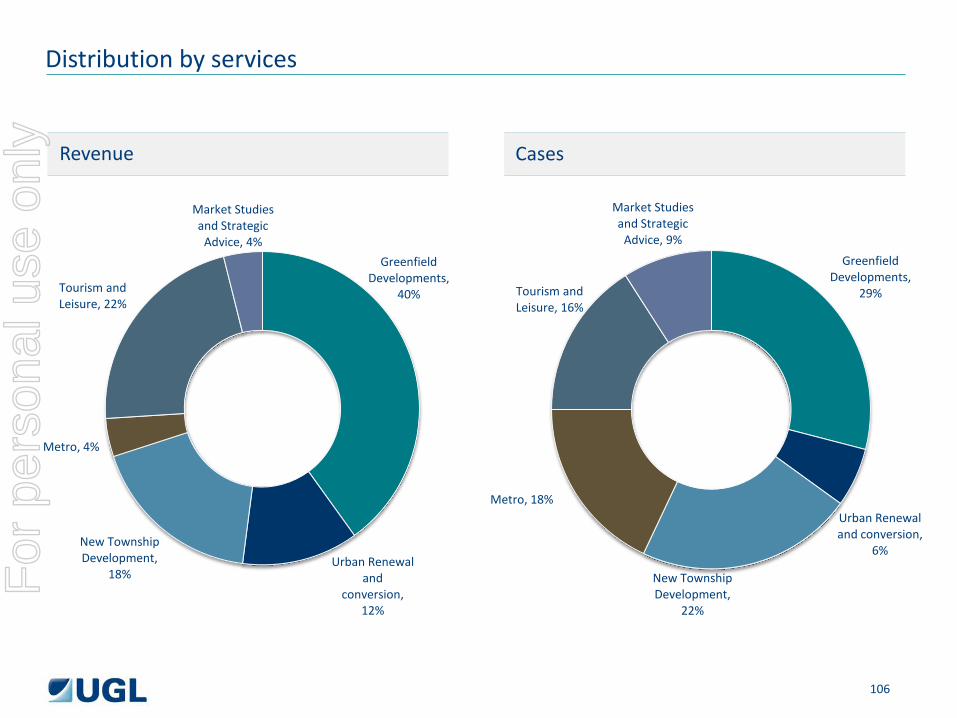
Distribution by services
Greenfield Developments,
40%
Urban Renewal and
conversion, 12%
New Township Development,
18%
Metro, 4%
Tourism and Leisure, 22%
Market Studies and Strategic
Advice, 4% Greenfield
Developments, 29%
Urban Renewal and conversion,
6%
New Township Development,
22%
Metro, 18%
Tourism and Leisure, 16%
Market Studies and Strategic
Advice, 9%
106
Revenue Cases
For
per
sona
l use
onl
y
Differentiators
• Deep history
• Strong track record
• Broad geographic coverage
• Experienced staff and expertise from different disciplines including; surveyors, architects, economists, engineers & town planners
• Support of broader internal network
107
For
per
sona
l use
onl
y
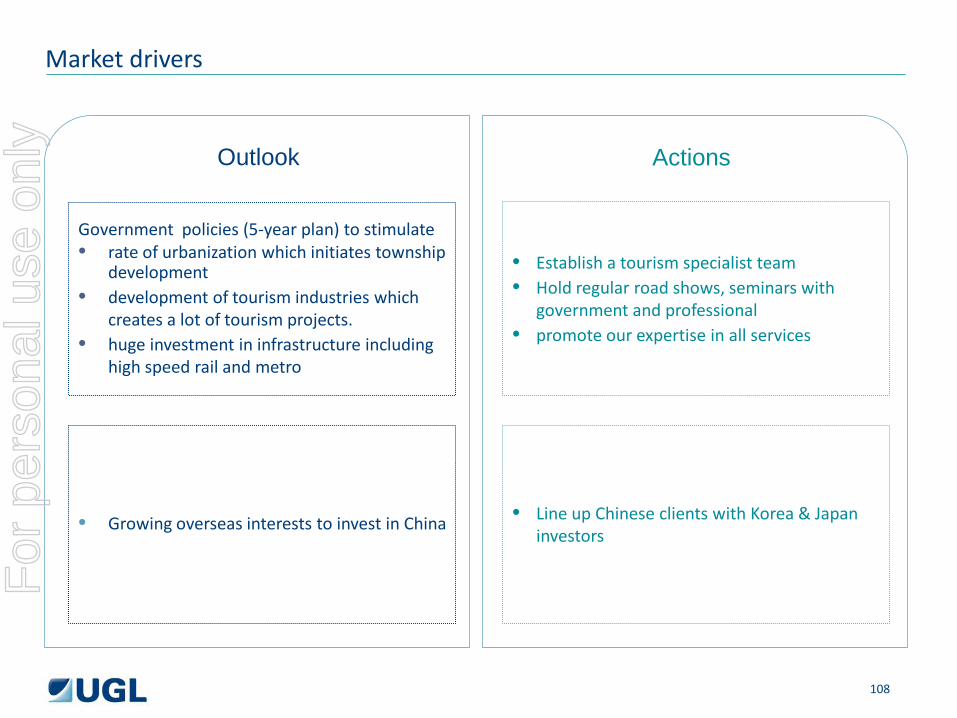
Market drivers
Government policies (5-year plan) to stimulate • rate of urbanization which initiates township
development • development of tourism industries which
creates a lot of tourism projects. • huge investment in infrastructure including
high speed rail and metro
• Growing overseas interests to invest in China
Outlook Actions
• Establish a tourism specialist team • Hold regular road shows, seminars with
government and professional • promote our expertise in all services
• Line up Chinese clients with Korea & Japan investors
108
For
per
sona
l use
onl
y
Major clients
• Lenovo
• Greenfield Development
• Shell
• Strategic Advice
• MTR
• Metro
• HSBC
• Strategic Advice
• Swire Properties
• Market Studies (IPO)
• Sun Hung Kai Properties
• Greenfield Development
109
For
per
sona
l use
onl
y

Key mandates
Lenovo Global Headquarter Project
MTR – Nanjing Project HSBC – HK & Singapore Property Mkt Project
Shell - Petro Station Project
• Overview of Regulations in relation to Petrol Station in China
• Truck Route Analysis • Motorway Analysis • Preliminary Investment
Feasibility of NTI Opportunities
• Overview of SZ real estate markets including retail, office, service apartment & mixed use developments
• Case studies • Positioning • Pedestrian flow • Financial Analysis • Negotiation with government
• Market Modeling, Forecasting and Assessment of Risk Indicators
• Comparative Analysis of the Hong Kong, Singapore, London and New York Commercial Property Markets
• Impact Assessment of a Commercial Property Market Downturn on the HBAP Loan Portfolio
• Overview of Nanjing Residential & Serviced Apartment Market
• Overview of Nanjing Retail Property Market
• Overview of Nanjing Office Market
• Site Analysis
110
For
per
sona
l use
onl
y
KK Chiu, Head of Valuation & Advisory, North Asia
Valuation and Advisory Services
111
For
per
sona
l use
onl
y
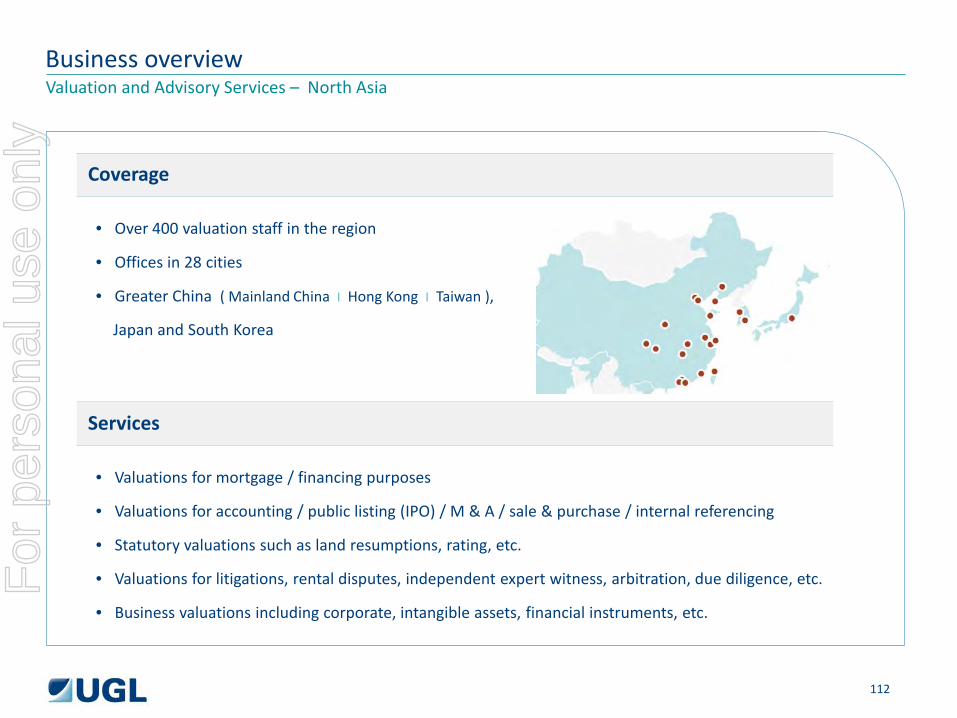
Business overview Valuation and Advisory Services – North Asia
Coverage
Services
• Over 400 valuation staff in the region
• Offices in 28 cities
• Greater China ( Mainland China I Hong Kong I Taiwan ),
Japan and South Korea
• Valuations for mortgage / financing purposes
• Valuations for accounting / public listing (IPO) / M & A / sale & purchase / internal referencing
• Statutory valuations such as land resumptions, rating, etc.
• Valuations for litigations, rental disputes, independent expert witness, arbitration, due diligence, etc.
• Business valuations including corporate, intangible assets, financial instruments, etc.
112
For
per
sona
l use
onl
y

Market position Valuation and Advisory Services – North Asia
Greater China Mainland China I Hong Kong I Taiwan
Japan
• The largest valuation practice among all international real estate services firms in Greater China with
over 360 team members and over 100 qualified valuers thereof
• Sole valuer for HSBC mortgage valuation in Hong Kong and retained market shares of over 30% of
overall mortgage valuation in Hong Kong
• Ranked 2nd in IPO valuation market of Hong Kong and has carried out over 200 IPO valuations for
companies successfully listed in the Main Board of HKEx
• The 2nd largest valuation practice among international real estate services firms in Japan
• Nationwide track records from northernmost Hokkiado to southernmost Okinawa
South Korea
• The largest valuation practice among international real estate services firms in South Korea
• Head office in Seoul and 8 branch offices in Gyeongbuk, Gyeongin, Gwangju & Jeonnam, Gyeonggi,
Busan , Chungcheong, North Gyeonggi and Daegu
113
For
per
sona
l use
onl
y

Key differentiators Valuation and Advisory Services – North Asia
Greater China Mainland China I Hong Kong I Taiwan
Japan
• Extensive office coverage (in 16 major cities of Mainland China)
• The first, if not the only, international firm with both the PRC national Grade A Real Estate and Land
Valuation Licences held under our Shenzhen office in Mainland China
• Strong self-performance capabilities
• Fully integrated, end-to-end offering, delivering industry-leading service levels
• Established relationships with international investors
• Extensive cross-border portfolio valuation assignment experience
South Korea
• National Valuation licensed appraisers
• Experienced valuation professionals with local and international valuation qualifications
114
For
per
sona
l use
onl
y
Market drivers Valuation and Advisory Services – North Asia
Greater China Mainland China I Hong Kong I Taiwan
Japan
• Growth of the capital markets in mainland China is expected to increase the demand for property
valuation and advisory services for RMB funds, REITs, entry of insurance companies to the real estate
market, etc
• Developing the asset appraisal and advisory services and securities valuation for the growing
IPO/capital markets in mainland China
• Step up appointments of local banks in mainland China
• Institutional investors re-enter the Japanese real estate market
• Domestic financial institutions invest positively
South Korea
• Movable assets (machinery & equipments, agricultural/marine/livestock produces, inventories)
valuation for banks’ new collateral loan market derived from the newly enacted law
• Enhancing the asset appraisal and advisory services for intangible assets
115
For
per
sona
l use
onl
y
Selected key mandates Valuation and Advisory Services – Asia Pacific
Engagement
• Sole valuer for HSBC mortgage valuation in Hong Kong
• 2002 to present
Essentials
• providing verbal valuation indication and valuation services to HSBC
• Providing DTZ e-valuation platform implanted to HSBC’s information system
116
For
per
sona
l use
onl
y
Selected key mandates Valuation and Advisory Services – Asia Pacific
Engagement
• Interim and year-end valuations for the Group’s investment properties portfolio from 2011 onwards
• In compliance with the International Accounting Standard (IAS)
Essentials
• Current portfolio of over 1,000 properties spread over 300 cities in China
117
For
per
sona
l use
onl
y

Selected key mandates Valuation and Advisory Services – Asia Pacific
Engagement
• Interim and year end valuations on part of their investment properties portfolio in Asia Pacific region
in the past few years
118
For
per
sona
l use
onl
y

Selected key mandates Valuation and Advisory Services – Asia Pacific
Engagement
• Property valuer for the Company’s listing on the Main Board of
HKEx in January 2012.(Stock Code:1972)
Essentials
• Valuations of over 200 properties in Hong Kong, China, United
States and the United Kingdom
119
For
per
sona
l use
onl
y

Francis Li Head of Investment, North Asia
Investment Agency
120
For
per
sona
l use
onl
y

Business Overview Investment Agency and Advisory Services in North Asia
Mainland China
Hong Kong
Taiwan
Japan
South Korea
Greater China
121
For
per
sona
l use
onl
y
Key differentiators
• Pioneer in China: One of the first international property consultants to have made a foothold in China Investment Market back in 2005
• Regional coverage: Direct, effective and fast cross-border communication, providing a truly “one stop” service in Greater China
• Client relationship: Effective CRM system ensuring quality and attentive service from top to bottom
• Strong track record: Sizable transaction volume achieved in China annually, in terms of both number of deals and transaction amount
• Diverse product offering: Services include consultancy , acquisition/ disinvestment, investment advisory to due diligence
• Experience: Unrivalled professional network with local government officials, domestic investors and institutional investors
• People: An exceptional team with a blend of local and international trained GP surveyors and CFAs
122
For
per
sona
l use
onl
y
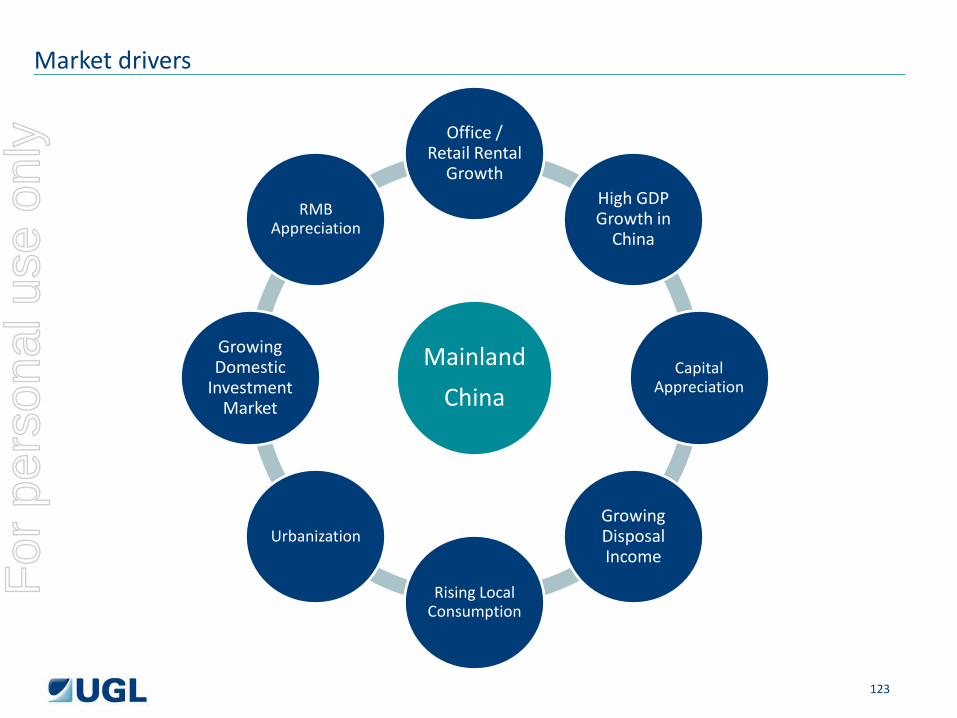
Market drivers
Mainland
China
Office / Retail Rental
Growth High GDP Growth in
China
Capital Appreciation
Growing Disposal Income
Rising Local Consumption
Urbanization
Growing Domestic
Investment Market
RMB Appreciation
123
For
per
sona
l use
onl
y
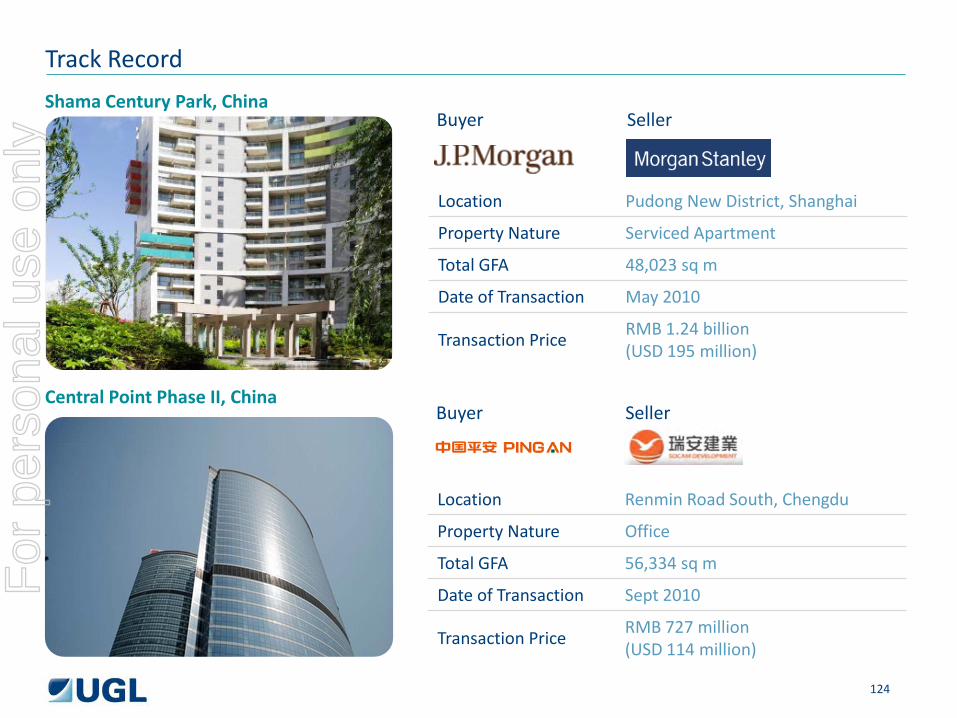
Track Record
Shama Century Park, China
Location Pudong New District, Shanghai
Property Nature Serviced Apartment
Total GFA 48,023 sq m
Date of Transaction May 2010
Transaction Price RMB 1.24 billion (USD 195 million)
Buyer Seller
Central Point Phase II, China
Location Renmin Road South, Chengdu
Property Nature Office
Total GFA 56,334 sq m
Date of Transaction Sept 2010
Transaction Price RMB 727 million (USD 114 million)
Buyer Seller
124
For
per
sona
l use
onl
y

Track Record
Shanghai World Financial Center, China
Location Lujiazui, Shanghai
Property Nature Office
Total GFA 10,000 sq m
Date of Transaction 2010
Transaction Price RMB 800 million (USD 126 million)
Xiwang Plaza, China
Location Zhongshan District, Dalian
Property Nature Office
Total GFA 88,747 sq m
Date of Transaction Sept 2008
Transaction Price RMB 1.05 billion (USD 165 million)
Buyer Various
Seller
Buyer Seller
125
For
per
sona
l use
onl
y

Key Mandates
• DTZ is appointed as the sole agent for the disposal of a office tower and its retail portion of this mixed-use project
• Located in the Kaifu District of Changsha • Office Tower: a 236m 45-storey Grade A office building with a
GFA of 70,000 sq m • Retail: a retail podium and a retail parade with a GFA of
approx. 125,000 sq m
North Star Changsha Delta Project, China
Location Changsha, China
Property Nature Office, Retail
Total GFA Approx. 195,000 sq m
Completion Date 2013
Target Price RMB 4 billion (USD 628 million)
126
For
per
sona
l use
onl
y

Johnson Yip, Head of Property and Facilities Management, North Asia
Property and Facilities Management
127
For
per
sona
l use
onl
y
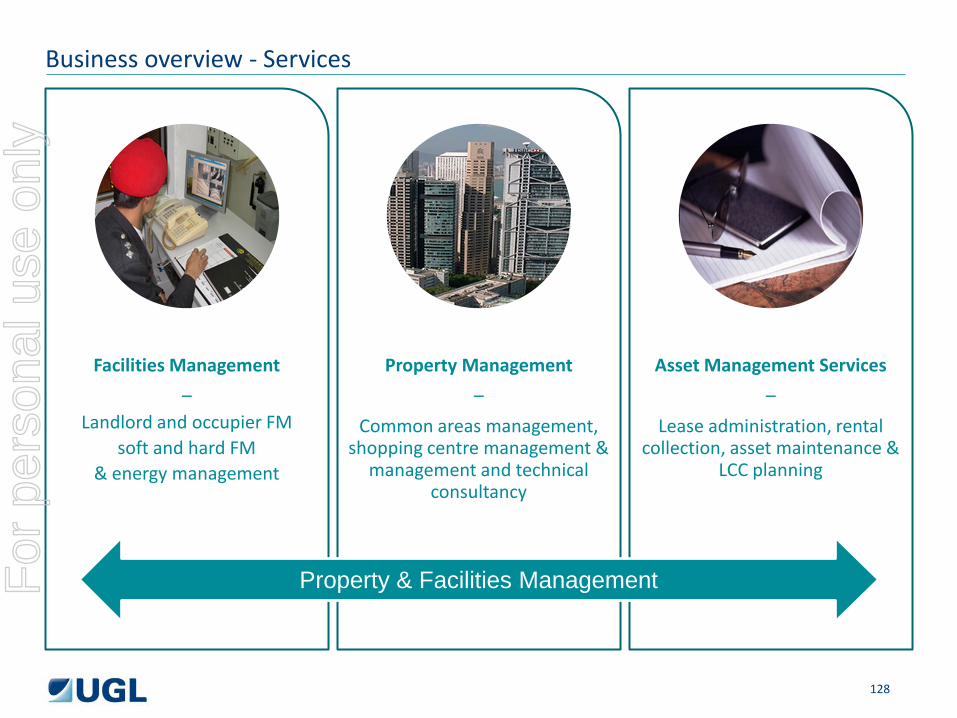
Business overview - Services
Facilities Management
– Landlord and occupier FM
soft and hard FM & energy management
Property Management
–
Common areas management, shopping centre management &
management and technical consultancy
Asset Management Services
–
Lease administration, rental collection, asset maintenance &
LCC planning
Property & Facilities Management
128
For
per
sona
l use
onl
y
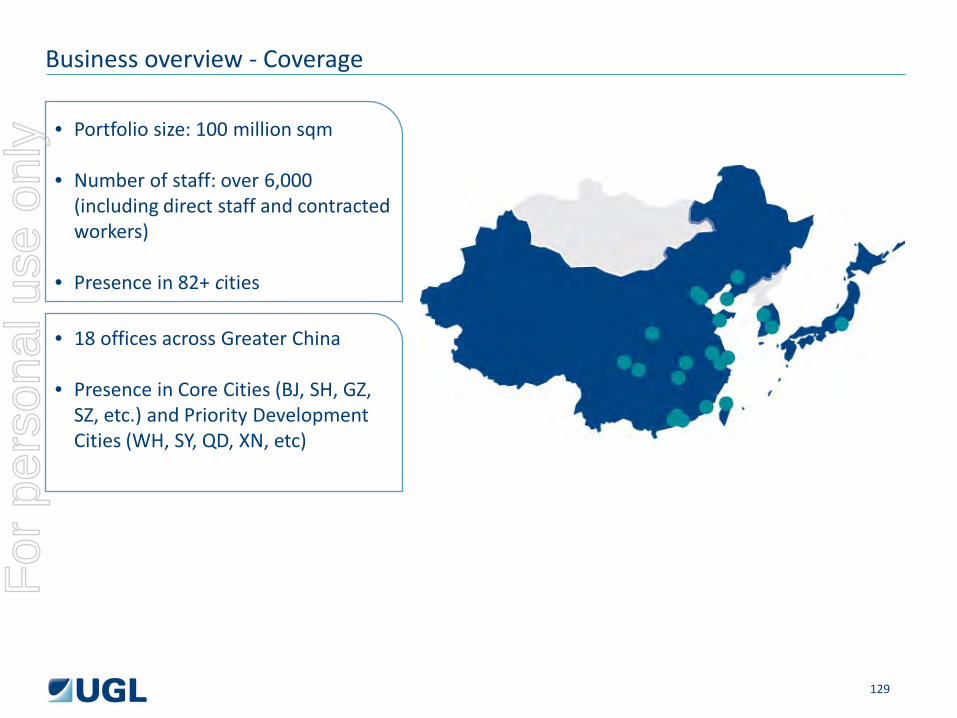
Business overview - Coverage
• Portfolio size: 100 million sqm • Number of staff: over 6,000
(including direct staff and contracted workers)
• Presence in 82+ cities
• 18 offices across Greater China • Presence in Core Cities (BJ, SH, GZ,
SZ, etc.) and Priority Development Cities (WH, SY, QD, XN, etc)
129
For
per
sona
l use
onl
y
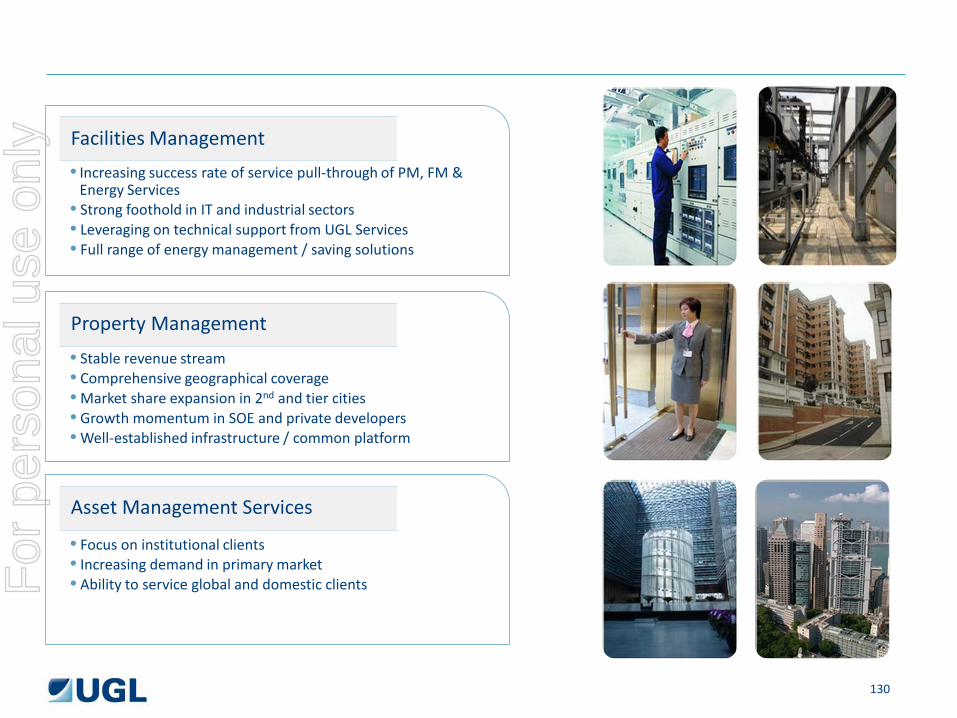
Facilities Management
Property Management
Asset Management Services
• Increasing success rate of service pull-through of PM, FM & Energy Services
• Strong foothold in IT and industrial sectors • Leveraging on technical support from UGL Services • Full range of energy management / saving solutions
• Stable revenue stream • Comprehensive geographical coverage • Market share expansion in 2nd and tier cities • Growth momentum in SOE and private developers • Well-established infrastructure / common platform
• Focus on institutional clients • Increasing demand in primary market • Ability to service global and domestic clients
130
For
per
sona
l use
onl
y
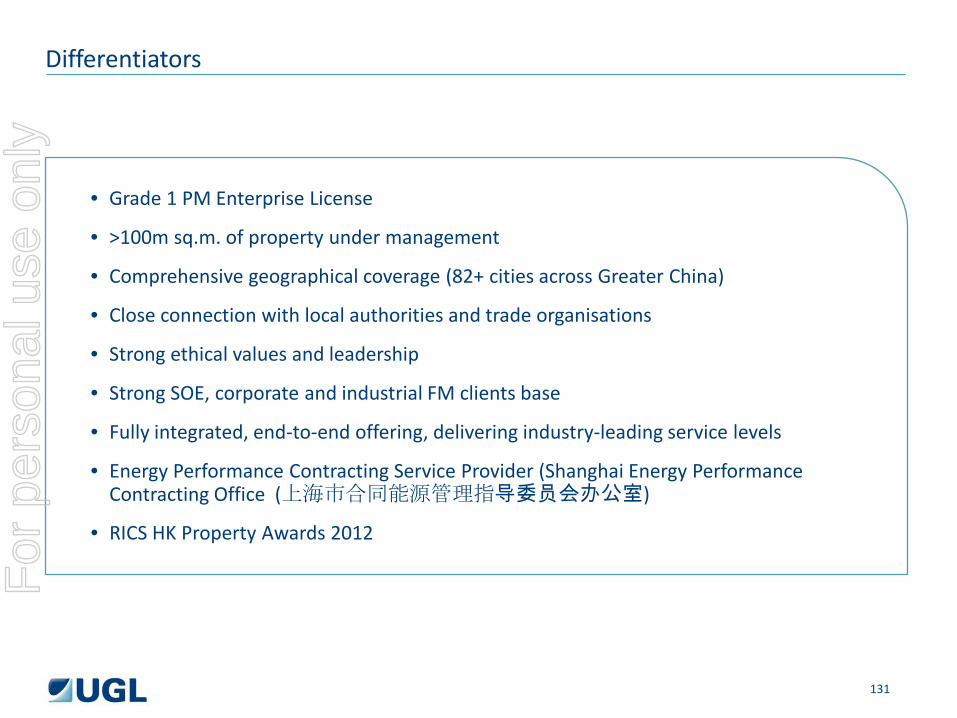
Differentiators
• Grade 1 PM Enterprise License
• >100m sq.m. of property under management
• Comprehensive geographical coverage (82+ cities across Greater China)
• Close connection with local authorities and trade organisations
• Strong ethical values and leadership
• Strong SOE, corporate and industrial FM clients base
• Fully integrated, end-to-end offering, delivering industry-leading service levels
• Energy Performance Contracting Service Provider (Shanghai Energy Performance Contracting Office (上海市合同能源管理指导委员会办公室)
• RICS HK Property Awards 2012
131
For
per
sona
l use
onl
y
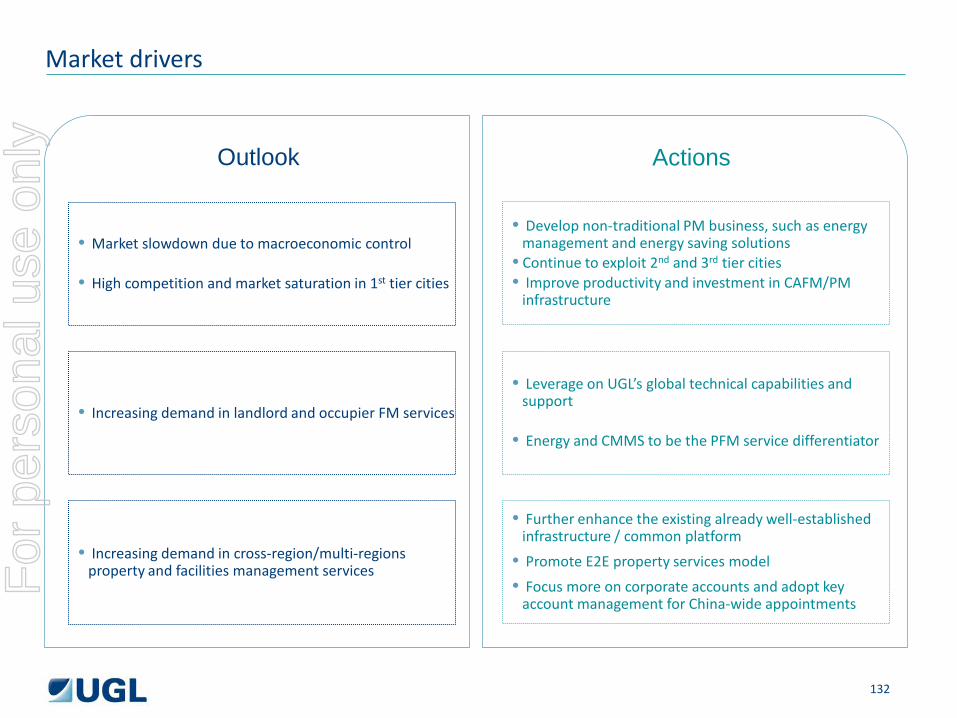
Market drivers
• Market slowdown due to macroeconomic control
• High competition and market saturation in 1st tier cities
• Increasing demand in landlord and occupier FM services
• Increasing demand in cross-region/multi-regions property and facilities management services
Outlook Actions
• Develop non-traditional PM business, such as energy management and energy saving solutions
• Continue to exploit 2nd and 3rd tier cities • Improve productivity and investment in CAFM/PM
infrastructure
• Leverage on UGL’s global technical capabilities and support
• Energy and CMMS to be the PFM service differentiator
• Further enhance the existing already well-established infrastructure / common platform
• Promote E2E property services model
• Focus more on corporate accounts and adopt key account management for China-wide appointments
132
For
per
sona
l use
onl
y

Major Clients
Shell HK - Lease administration, account management
Lerthai Group BJ – Property management
China Huaneng Group BJ – Property and facilities management
Shimao Group Multi-regions – Property management
Giant Interactive Group SH – Facilities management
CITIC Pacific SH – Property Management
133
Client Services
For
per
sona
l use
onl
y
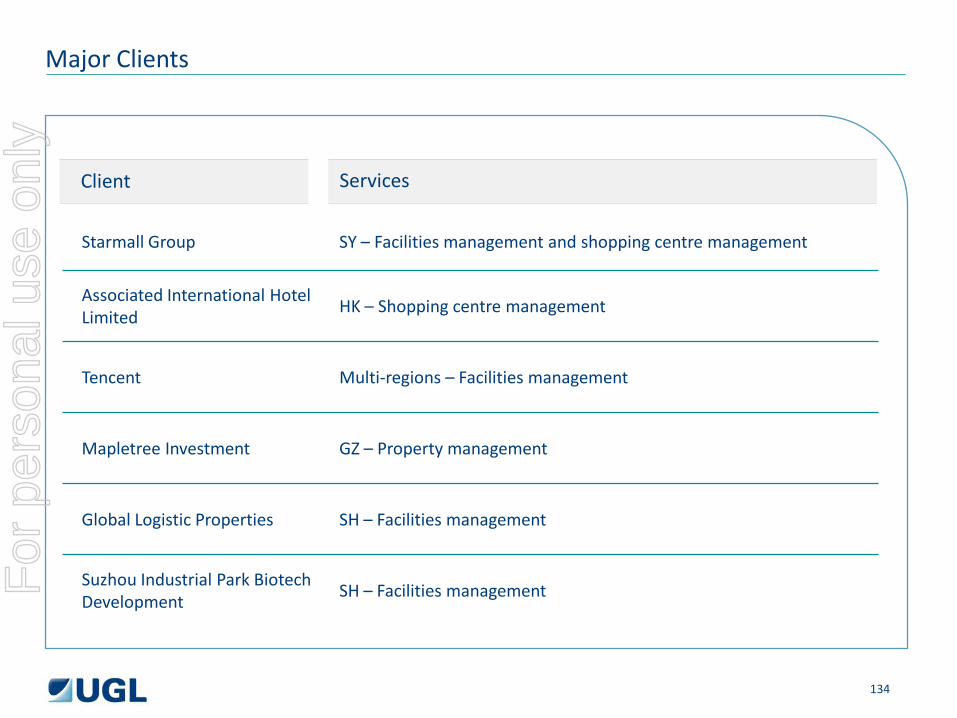
Major Clients
Starmall Group SY – Facilities management and shopping centre management
Associated International Hotel Limited
HK – Shopping centre management
Tencent Multi-regions – Facilities management
Mapletree Investment GZ – Property management
Global Logistic Properties SH – Facilities management
Suzhou Industrial Park Biotech Development
SH – Facilities management
134
Client Services
For
per
sona
l use
onl
y

Nishimatsu Construction Company Limited • Standard Chartered Bank Building, Central, Hong Kong • Headquarter of Standard Chartered Bank and Hang Lung Group in HK • One of the first commercial buildings in Hong Kong accredited with HK BEAM Green Label • DTZ has been appointed to provide property management services, since 1999
Selected key mandates
CITIC Pacific / China State Shipbuilding Corp • Riviera Twinstar Square, Pudong, Shanghai, China • The twin towers provide 260,000 sqm of office space in the World’s famous business district
and are the headquarter buildings of Agricultural Bank of China and Construction Bank of China • DTZ is the property manager providing full property management services
Associated International Hotel Limited • iSQUARE, Tsimshatsui, Hong Kong • Providing a total 58,000 sqm of retail space in downtown Kowloon. • DTZ has been appointed to provide full RE services, covering project management, retail
consultancy, and property management
135
For
per
sona
l use
onl
y
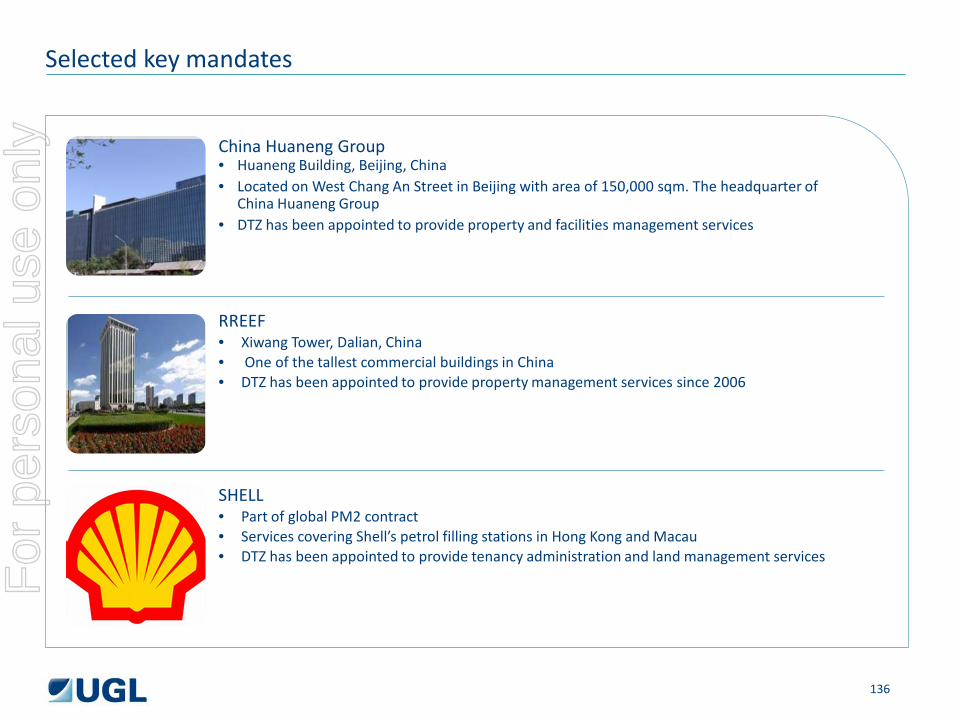
China Huaneng Group • Huaneng Building, Beijing, China • Located on West Chang An Street in Beijing with area of 150,000 sqm. The headquarter of
China Huaneng Group • DTZ has been appointed to provide property and facilities management services
Selected key mandates
RREEF • Xiwang Tower, Dalian, China • One of the tallest commercial buildings in China • DTZ has been appointed to provide property management services since 2006
SHELL • Part of global PM2 contract • Services covering Shell’s petrol filling stations in Hong Kong and Macau • DTZ has been appointed to provide tenancy administration and land management services
136
For
per
sona
l use
onl
y
This presentation and any oral presentation accompanying it: • is not an offer, invitation, inducement or recommendation to purchase or subscribe for any securities in UGL Limited (“UGL”) or
to retain any securities currently held;
• is for information purposes only, is in summary form and does not purport to be complete;
• is not intended to be relied upon as advice to investors or potential investors and does not take into account the investment objectives, financial situation or needs of any particular investor, potential investor or any other person. Such persons should consider seeking independent financial advice depending on their specific investment objectives, financial situation or needs when deciding if an investment is appropriate or varying any investment;
• may contain forward looking statements. Any forward looking statements are not guarantees of future performance. Any forward looking statements have been prepared on the basis of a number of assumptions which may prove to be incorrect or involve known and unknown risks, uncertainties and other factors, many of which are beyond the control of UGL, which may cause actual results, performance or achievements to differ materially from those expressed or implied in such statements. There can be no assurance that actual outcomes will not differ materially from these statements. Any forward looking statement reflects views held only as of the date of this presentation. Subject to any continuing obligations under applicable law or any relevant stock exchange listing rules, UGL does not undertake any obligation to publicly update or revise any of the forward looking statements or any change in events, conditions or circumstances on which any such statement is based.
No representation or warranty, express or implied, is made as to the fairness, accuracy, completeness or correctness of the information, opinions and conclusions contained in this presentation and any oral presentation accompanying it. To the maximum extent permitted by law, UGL and its related bodies corporate, and their respective directors, officers, employees, agents and advisers, disclaim and exclude all liability (including, without limitation, any liability arising from fault or negligence) for any loss, damage, claim, demand, cost and expense of whatever nature arising in any way out of or in connection with this presentation and any oral presentation accompanying it, including any error or omission therefrom, or otherwise arising in connection with any reliance by any person on any part of this presentation and any oral presentation accompanying it.
Important notice F
or p
erso
nal u
se o
nly