shangri-la hotel toronto - securities lending · shangri-la hotel toronto tuesday, june 6, 2017 7th...
TRANSCRIPT

SHANGRI-LA HOTEL TORONTO Tuesday, June 6, 2017
7TH ANNUAL CASLA CONFERENCE ON CANADIAN
SECURITIES LENDING

PRESENTATION: WHAT’S NORMAL?
Benjamin Tal Managing Director and Deputy Chief Economist CIBC

June 2017Benjamin Tal
What’s Normal? What’s Normal?
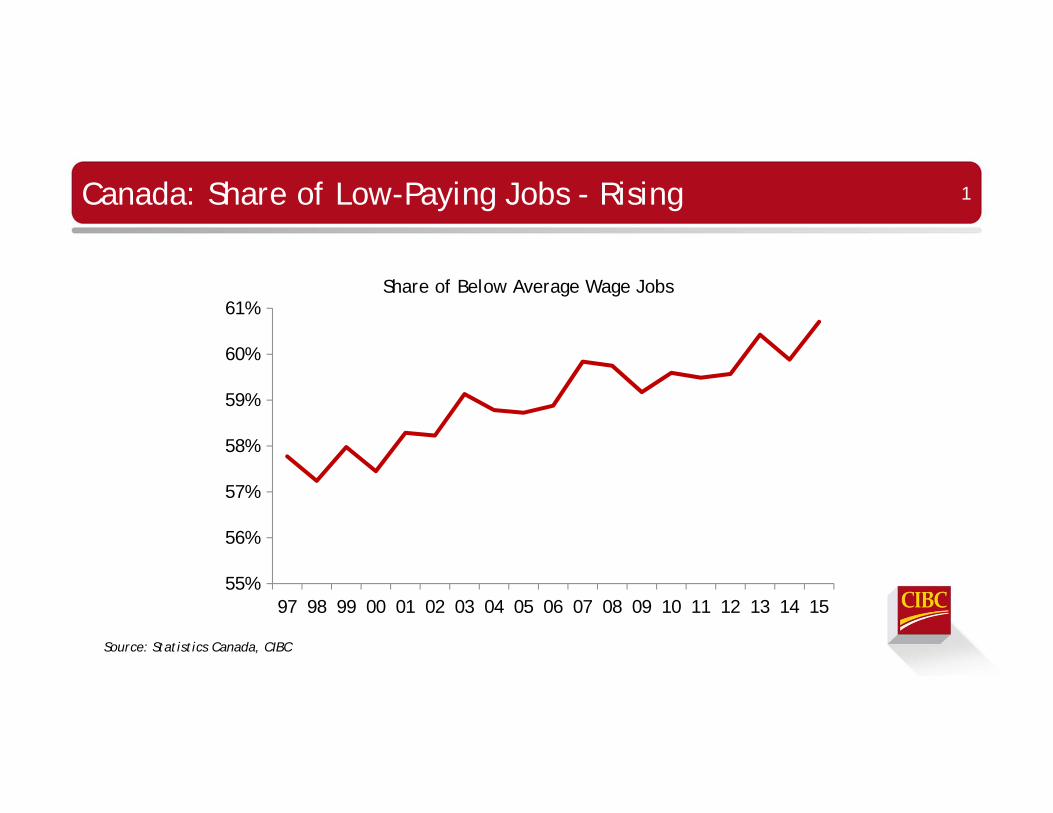
Canada: Share of Low-Paying Jobs - Rising 1
Source: Statistics Canada, CIBC
55%
56%
57%
58%
59%
60%
61%
97 98 99 00 01 02 03 04 05 06 07 08 09 10 11 12 13 14 15
Share of Below Average Wage Jobs

Surprise Indexes Show 2017 Starting Strong 2
Source: Bloomberg, Citi, CIBC
-15
-10
-5
0
5
10
15
20
25
30
35
2013 2014 2015 2016 2017
Major Economies
Developing
Economic Surprise Index readings at Start of Year
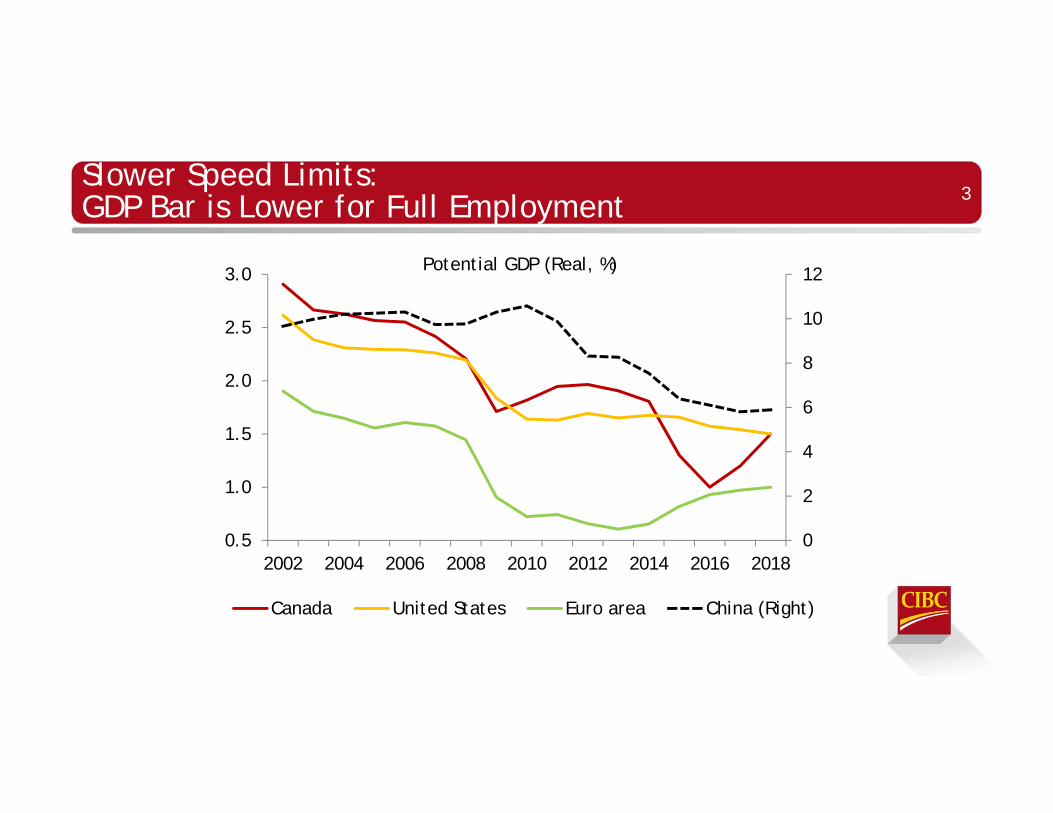
Slower Speed Limits: GDP Bar is Lower for Full Employment 3
0
2
4
6
8
10
12
0.5
1.0
1.5
2.0
2.5
3.0
2002 2004 2006 2008 2010 2012 2014 2016 2018
Canada United States Euro area China (Right)
Potential GDP (Real, %)

Chinese Growth is Likely to Slow in the Years Ahead 4
0
2
4
6
8
10
12
14
0 5 10 15 20 25 30Per Capita GDP (Current International $, 000's)
Per Capita GDP (%
China Since 1990
Regression of Japan and Korea Development Paths

Shale Marginal Supplier in the Medium Term 5
Source: BP, CIBC
0
20
40
60
80
100
120
20 40 60 80 100$/bbl
Production (mn bbl/d)
Middle East
Cdn Oil Sands
Global Oil Demand 2018
North American Shale

The Infrastructure “Bonanza” 6
Source: CIBC
0
500,000
1,000,000
1,500,000
2,000,000
2,500,000
3,000,000
Estimated infrastructure jobcreation per year
Total US job creation in 2016
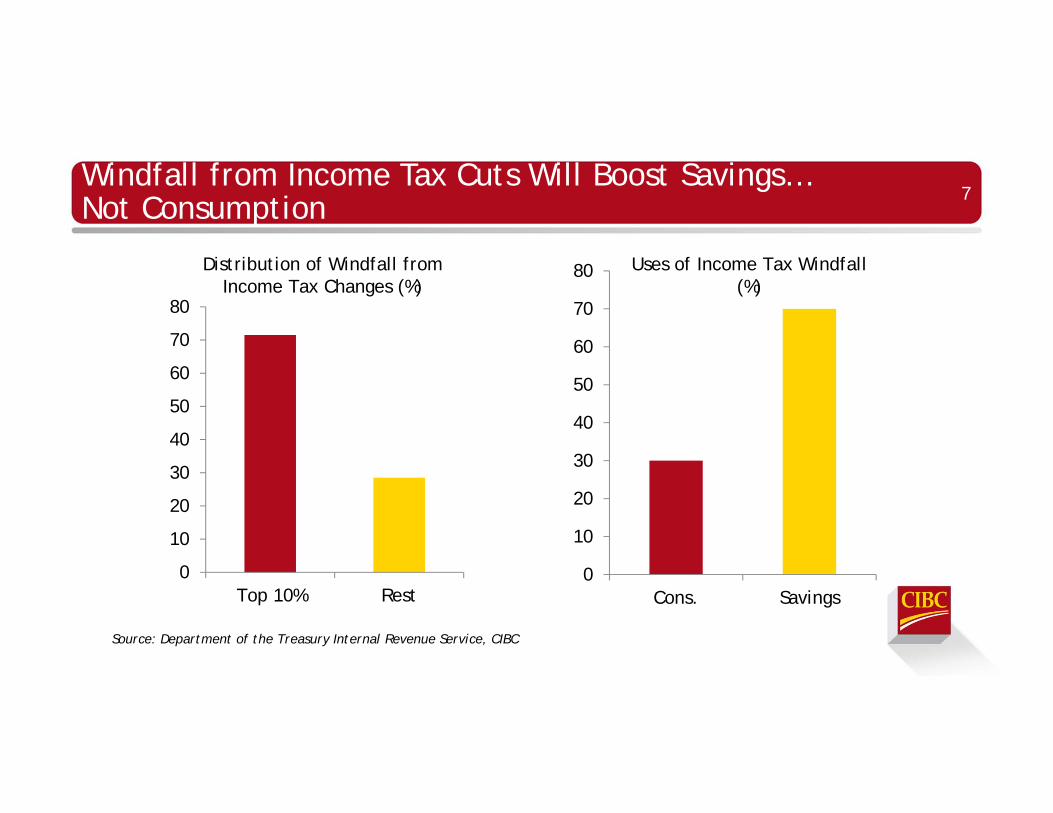
Windfall from Income Tax Cuts Will Boost Savings… Not Consumption 7
Source: Department of the Treasury Internal Revenue Service, CIBC
0
10
20
30
40
50
60
70
80
Top 10% Rest
Distribution of Windfall from Income Tax Changes (%)
0
10
20
30
40
50
60
70
80
Cons. Savings
Uses of Income Tax Windfall (%)

Cash Repatriation –Positive for Valuations… Not So Much for Employment 8
Source: US Senate Staff Report, CIBC
-10
0
10
20
30
40
2003 2004 2005 2006 2007Stock Repurchases Employment
Change for Top 15 Companies Receiving 2004 Repatriation Holiday (%)
Repatriation Tax Holiday
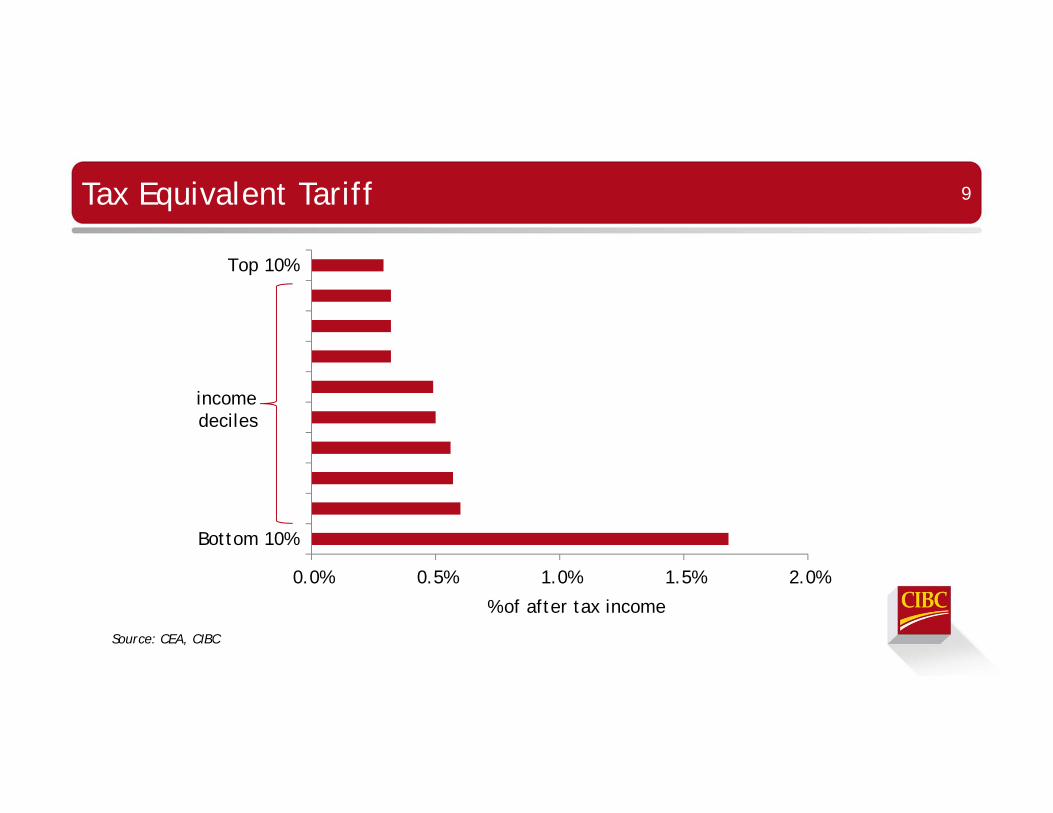
Tax Equivalent Tariff 9
Source: CEA, CIBC
0.0% 0.5% 1.0% 1.5% 2.0%
Bottom 10%
Top 10%
% of after tax income
income deciles

Consumer Spending in China to Rise at Double the US Rate (L), Leaving it $1.4 tn Higher in 2020 (R ) 10
Source: BEA, National Bureau of Statistics of China, CIBC
0
1
2
3
4
5
6
2010
2011
2012
2013
2014
2015
2016
2017
2018
2019
2020
1.4Trillion
USD
Chinese Household Consumption(Trillions of USD)
0
1
2
3
4
5
6
7
8
9
US China
Forecasted Nominal Household Consumption Growth
(2016-2020, Annual Rate, %)

2017 Canadian Growth: Refueled by Oil & Gas 11
-1.5
-1.0
-0.5
0.0
0.5
1.0
1.5
13 14 15 16E 17F 18FProduction CapEx
Energy Sector Contribution to GDP Growth (%-pts)
~1% swing

Broadly-Based Growth 12
Source: Statistics Canada, CIBC
0
10
20
30
40
50
60
70
80
16Q1 16Q2 16Q3 16Q4
Share of Positive Growth Industries in GDP
%, 4-qtr ma
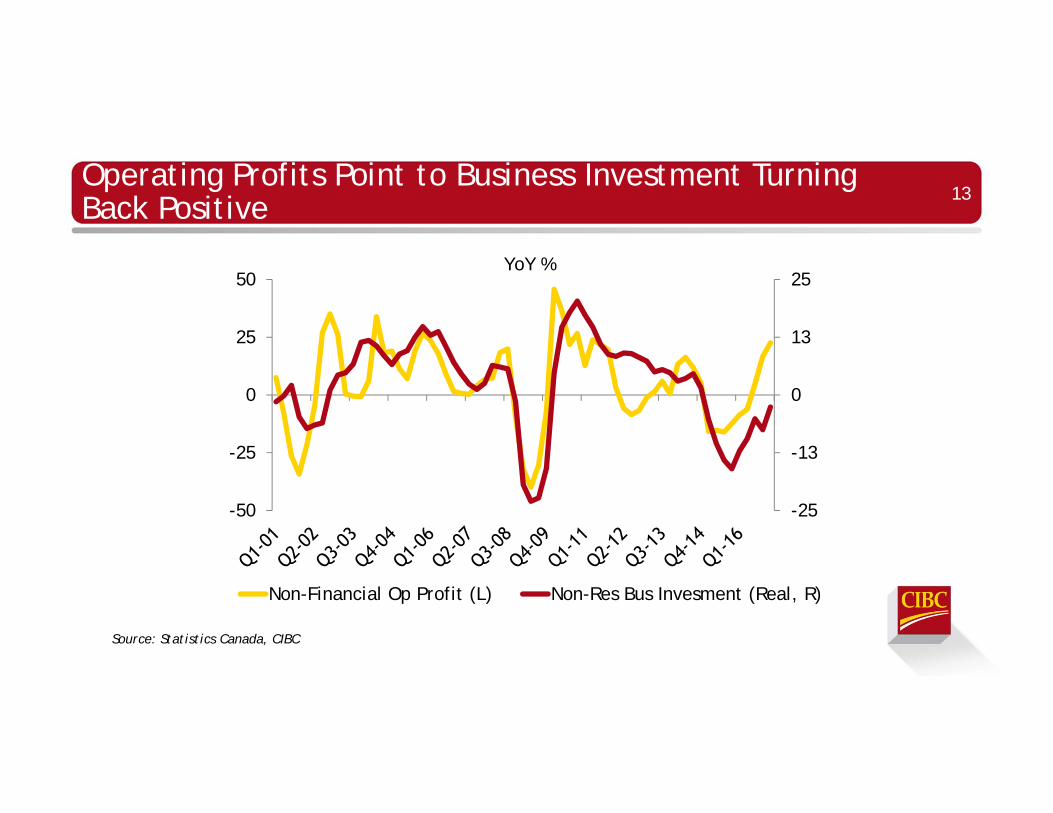
Operating Profits Point to Business Investment Turning Back Positive 13
Source: Statistics Canada, CIBC
-25
-13
0
13
25
-50
-25
0
25
50
Non-Financial Op Profit (L) Non-Res Bus Invesment (Real, R)
YoY %

Still Foggy 14
• BAT
• NAFTA
• Trade by Twitter
• Regulatory Policy
• Tax Changes
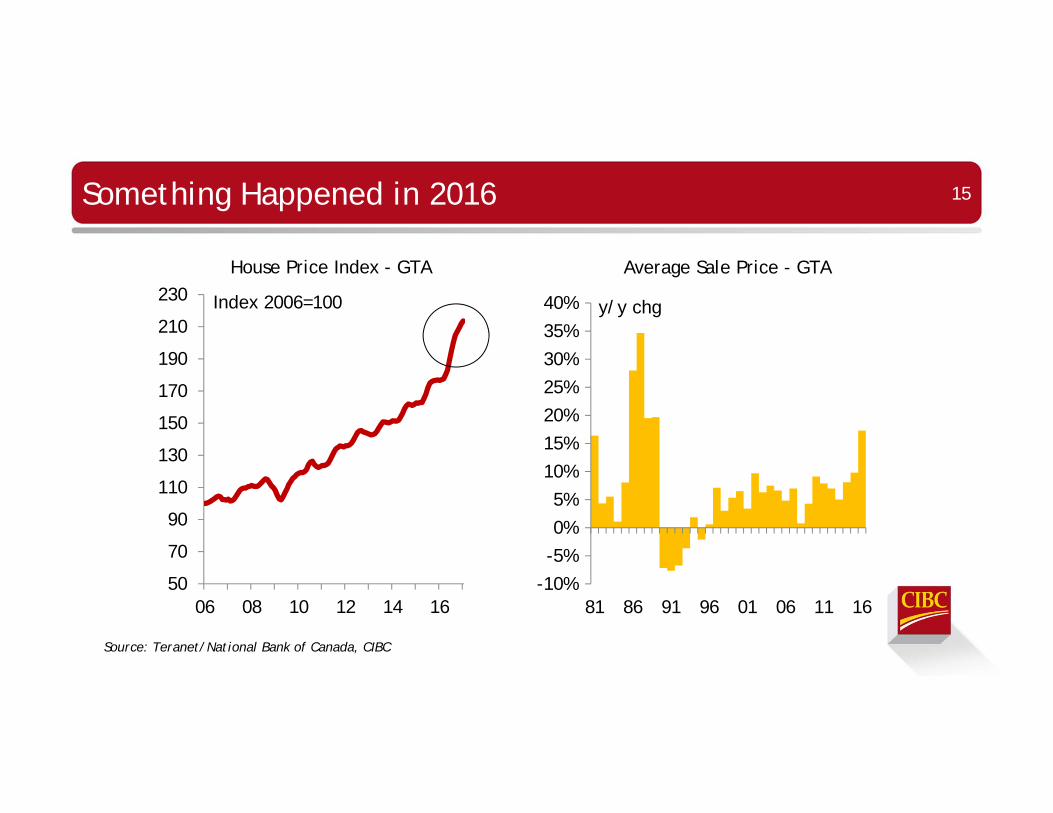
Something Happened in 2016 15
Source: Teranet/National Bank of Canada, CIBC
50
70
90
110
130
150
170
190
210
230
06 08 10 12 14 16
Index 2006=100
House Price Index - GTA
-10%
-5%
0%
5%
10%
15%
20%
25%
30%
35%
40%
81 86 91 96 01 06 11 16
y/y chg
Average Sale Price - GTA
PRESENTATION: A DATA-DRIVEN PERSPECTIVE
Chris Benedict Director, DataLend

Securities Lending:
A Data Driven Perspective
A Data-Driven Perspective
Chris Benedict, Director, DataLend

© Copyright 2017 EquiLend Holdings LLC. Proprietary and Confidential. For discussion purposes only.
AGENDA
1) GLOBAL PERSPECTIVE
2) MARKET TRENDS
3) CANADIAN PERSPECTIVE

© Copyright 2017 EquiLend Holdings LLC. Proprietary and Confidential. For discussion purposes only.
INTRODUCTION
SECURITIES LENDING DATA IS BIG DATA
• 3.25 MILLION TRANSACTIONS PROCESSED DAILY
• 45,000 UNIQUE SECURITIES ON LOAN
• 150,000 UNIQUE SECURITIES IN INVENTORY
• 23 TERABYTES OF DATA
DATALEND COVERS: • $2.1 TRILLION OF ON LOAN ASSETS
• $16.7 TRILLION OF LENDABLE ASSETS
© Copyright 2017 EquiLend Holdings LLC. Proprietary and Confidential. For discussion purposes only.
GLOBAL PERSPECTIVE

© Copyright 2017 EquiLend Holdings LLC. Proprietary and Confidential. For discussion purposes only.
$9,159,863,746 Global Revenue in 2016
*as of 31st March 2017
$491,727,524 Canada Revenue in 2016

© Copyright 2017 EquiLend Holdings LLC. Proprietary and Confidential. For discussion purposes only.
GLOBAL $2,050,681,040
UNITED STATES
$955,529,458
EUROPE
$548,688,102
ASIA PACIFIC
$370,171,977
OTHERS
$38,887,452
Q1 2017 REVENUE
CANADA
$137,404,051
(JAN 1 – MAR 31)

© Copyright 2017 EquiLend Holdings LLC. Proprietary and Confidential. For discussion purposes only.
UNITED STATES 8.8 trillion 1.14 trillion 32 bps 955m
CANADA 1.2 trillion 138 bn 39 bps 137m
EUROPE 3.9 trillion 506 bn 42 bps 549m
ASIA PACIFIC 1.7 trillion 163 bn 88 bps 370m
OTHERS 287 bn 27 bn 58 bps 39m
SUMMARY: Q1 2017 (Jan 1 – Mar 31)
LENDABLE ON LOAN FEE REVENUE
EQUITY 10 trillion 899 bn 68 bps 1.53bn
FIXED INCOME 5.9 trillion 1.08 trillion 18 bps 517m
TOTAL 15.9 trillion 1.97 trillion 40 bps 2.05 bn

© Copyright 2017 EquiLend Holdings LLC. Proprietary and Confidential. For discussion purposes only.
REVENUE: Q1 2016 vs 2017 (Jan 1 – Mar 31)
R
EG
ION
UNITED STATES 1.10bn 955m -145m
CANADA 121m 137m 16m
EUROPE 602m 549m -53m
ASIA PACIFIC 417m 370m -47m
OTHERS 54m 39m -15m
TOTAL 2,294m 2,050m -244m
Q1 2016 Q1 2017 ∆

© Copyright 2017 EquiLend Holdings LLC. Proprietary and Confidential. For discussion purposes only.
REVENUE: Q1 2016 vs 2017 (Jan 1 – Mar 31)
AS
SE
T
EQUITY 1,933m 1,533m -400m
FIXED INCOME 361m 517m 156m
TOTAL 2,294m 2,050m -244m
Q1 2016 Q1 2017 ∆

© Copyright 2017 EquiLend Holdings LLC. Proprietary and Confidential. For discussion purposes only.
MARKET TRENDS

© Copyright 2017 EquiLend Holdings LLC. Proprietary and Confidential. For discussion purposes only.
m
100 m
200 m
300 m
400 m
500 m
600 m
700 m
800 m
Q1 2016 Q2 2016 Q3 2016 Q4 2016 Q1 2017
RE
VE
NU
E (
US
D)
REVENUE - GLOBAL TOP 50 EARNING SECURITIES
584bps
228bps
583bps 498bps
268bps
© Copyright 2017 EquiLend Holdings LLC. Proprietary and Confidential. For discussion purposes only.
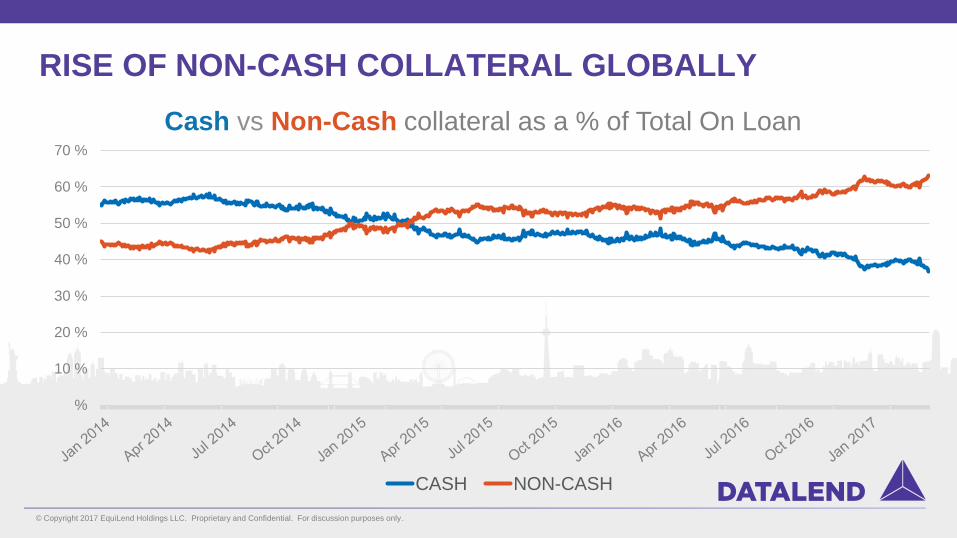
RISE OF NON-CASH COLLATERAL GLOBALLY
%
10 %
20 %
30 %
40 %
50 %
60 %
70 %
Cash vs Non-Cash collateral as a % of Total On Loan
CASH NON-CASH

© Copyright 2017 EquiLend Holdings LLC. Proprietary and Confidential. For discussion purposes only.
RISE OF TERM TRADES GLOBALLY
0%
5%
10%
15%
20%
25%Term Trades as a % of Total On Loan
REST OF WORLD CANADA
© Copyright 2017 EquiLend Holdings LLC. Proprietary and Confidential. For discussion purposes only.
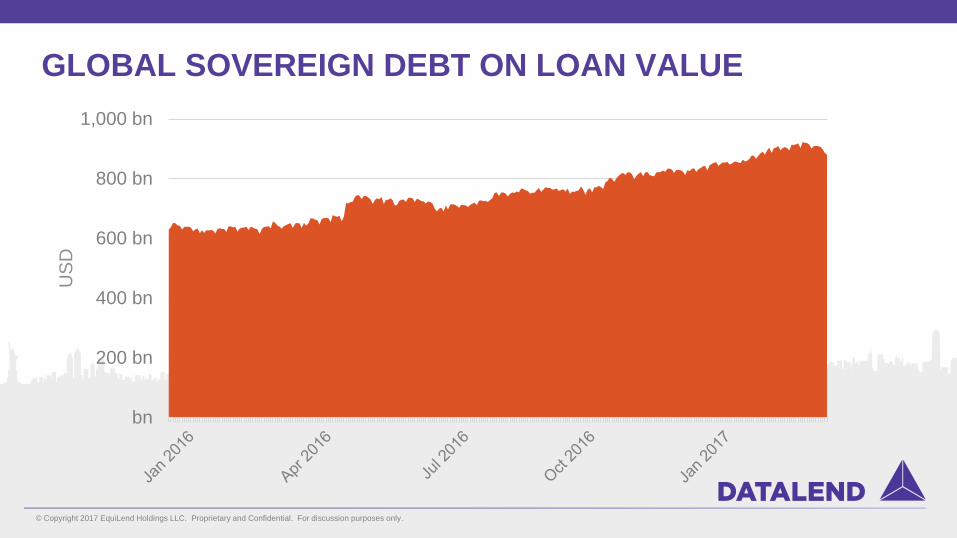
GLOBAL SOVEREIGN DEBT ON LOAN VALUE
bn
200 bn
400 bn
600 bn
800 bn
1,000 bn
US
D
© Copyright 2017 EquiLend Holdings LLC. Proprietary and Confidential. For discussion purposes only.
CANADIAN PERSPECTIVE

© Copyright 2017 EquiLend Holdings LLC. Proprietary and Confidential. For discussion purposes only.
REVENUES BY ASSET – CANADA
Q1 2016 Q1 2017 ∆ Equity 105.6m 114m 8.4m
Common Shares 104.7m 112.3m 7.6m
Other equity issues 0.9m 1.7m 0.8m
Fixed Income 15.3m 23.2m 7.9m
Sovereign 9.8m 13.4m 3.6m
Agency / Provincial 2m 5m 3m
Corporate 3.5m 4.8m 1.3m

© Copyright 2017 EquiLend Holdings LLC. Proprietary and Confidential. For discussion purposes only.
CANADA EQUITY ON LOAN AND REVENUES BY FEES
39b
5b
2b
AVERAGE ON LOAN Q1 2017
12%
85%
3%
79m
23m
12m
TOTAL REVENUE Q1 2017
70%
20%
10%

© Copyright 2017 EquiLend Holdings LLC. Proprietary and Confidential. For discussion purposes only.
REVENUE – HOT CANADIAN SECURITIES Q1 2017
Security Name Sector Revenue
Home Capital Financial Services $18m
Badger Daylighting Industrial Goods $3.3m
Prometic Life Sciences Health Care $1.67m
Canopy Growth Health Care $1.58m
Boardwalk REIT Real Estate $1.54m
Hudson’s Bay Consumer Discretionary $1.24m
© Copyright 2017 EquiLend Holdings LLC. Proprietary and Confidential. For discussion purposes only.
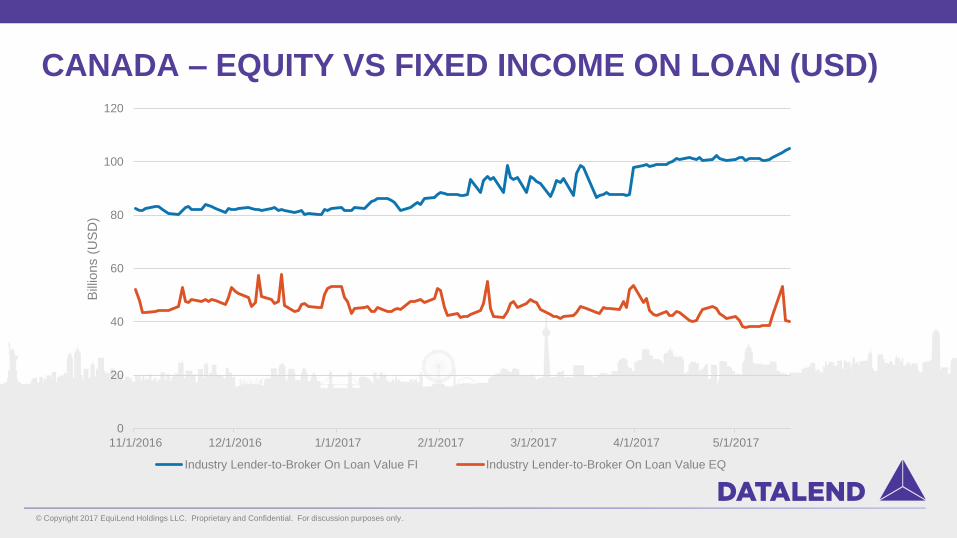
CANADA – EQUITY VS FIXED INCOME ON LOAN (USD)
0
20
40
60
80
100
120
11/1/2016 12/1/2016 1/1/2017 2/1/2017 3/1/2017 4/1/2017 5/1/2017
Bill
ions (
US
D)
Industry Lender-to-Broker On Loan Value FI Industry Lender-to-Broker On Loan Value EQ

© Copyright 2017 EquiLend Holdings LLC. Proprietary and Confidential. For discussion purposes only.
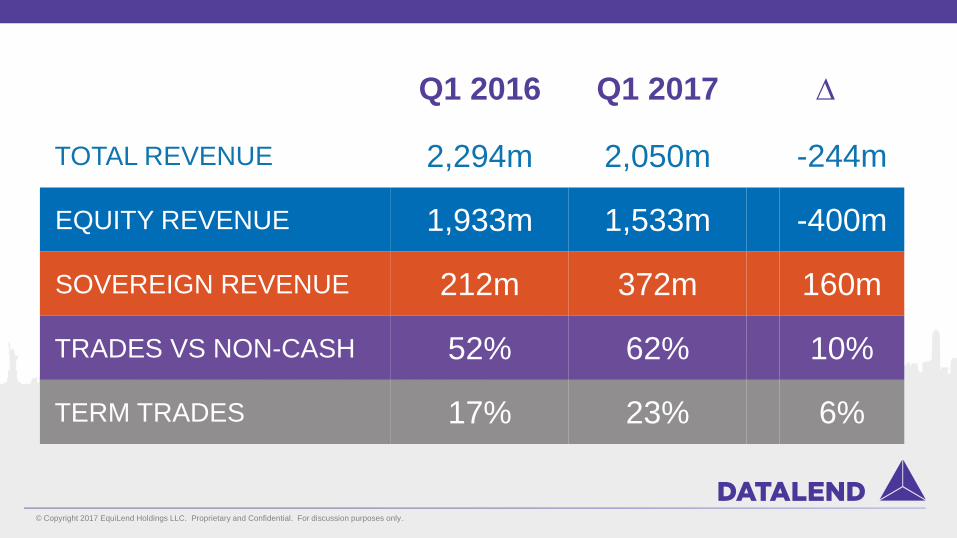
SUMMARY
© Copyright 2017 EquiLend Holdings LLC. Proprietary and Confidential. For discussion purposes only.
Q1 2016 Q1 2017 ∆
TOTAL REVENUE 2,294m 2,050m -244m
EQUITY REVENUE 1,933m 1,533m -400m
SOVEREIGN REVENUE 212m 372m 160m
TRADES VS NON-CASH 52% 62% 10%
TERM TRADES 17% 23% 6%

© Copyright 2017 EquiLend Holdings LLC. Proprietary and Confidential. For discussion purposes only.
The information contained herein is proprietary to EquiLend and select third parties; may not be copied or distributed without the express
consent of EquiLend; shall not constitute investment advice by EquiLend, or any representative thereof; is not warranted to be accurate,
complete or timely; is provided for informational purposes only; is not intended for trading purposes; and should not be construed as
EquiLend making forecasts, projecting returns or recommending any particular course of action. Neither EquiLend nor any representative
thereof shall be an advisor or a fiduciary of a visitor to this website. EquiLend is not responsible or liable in any way to the reader or visitor,
or to any person, firm or corporation for any damages or losses arising from any use of the information contained herein. In considering the
information contained herein, A visitor to this website does so solely in reliance on the visitor's own judgment. Past performance is no
guarantee of future performance. This disclaimer applies to all information on pages that you access from this page.

SHANGRI-LA HOTEL TORONTO Tuesday, June 6, 2017
7TH ANNUAL CASLA CONFERENCE ON CANADIAN
SECURITIES LENDING