shanna h. swan, kirsten waller, barbara hopkins, gerald delorenze, gayle windham, laura fenster,...
TRANSCRIPT

Shanna H. Swan, Kirsten Waller, Barbara Hopkins, Gerald DeLorenze, Gayle Windham, Laura Fenster, Catherine Schaefer, Raymond NeutraEnvironmental Health Investigations BranchCalifornia Department of Health Services
Division of ResearchKaiser Permanente Medical Care Program
Water Consumption in Early Pregnancy and Risk of Spontaneous Abortion:
Trihalomethanes and Other Factors
Water Consumption in Early Pregnancy and Risk of Spontaneous Abortion:
Trihalomethanes and Other Factors

Why was the Pregnancy Outcome Study Conducted?Why was the Pregnancy Outcome Study Conducted?To examine this association in:
A prospective studySanta Clara and two additional areas of
California (Walnut Creek and Fontana)More recent pregnancies
Also conducted analysis of chlorination by-products.

How was this Study Conducted?How was this Study Conducted?
Study participants were members of Kaiser Permanente HMOPregnant women were recruited in 1990-1991 when scheduling prenatal care Phone interview in first trimester of pregnancyPregnancy outcome from medical records

Study PopulationStudy PopulationN
Women contacted 7,881Women eligible/willing (78%) 6,179Interviews completed (86%) 5,342Pregnancy outcome determined (99%) 5,289Final study population* 5,144
*Excludes ectopics, molar pregnancies and therapeutic abortions

Exposure Assessment: Type and Amount of Water Consumed?Exposure Assessment: Type and Amount of Water Consumed?
“How many glasses did you drink per day of...cold tap water (and drinks made from cold tap
water) at home?”heated tap water (and drinks made from heated
tap water) at home?”bottled (noncarbonated) water consumed
anywhere?”carbonated water consumed anywhere?”

Exposure Assessment:When in pregnancy?Exposure Assessment:When in pregnancy?
Women were asked to estimate:glasses consumed in the week beginning with
the last menstrual periodglasses consumed in the week ending with the
interviewwhen amount changed (if different)
Exposure at 8 weeks gestation used in analysis

Other Water Exposure VariablesOther Water Exposure Variables
Name of water utility (confirmed by address)How tap water was consumed:
– Straight from the tap– Let stand before drinking– Stored in refrigerator– Filtered (type of filter)
Brand of bottled waterFrequency and duration of showering (and swimming)

Study Population—All Study AreasStudy Population—All Study Areas
Age: less than 35 89%Interviewed by 8 weeks gestation 64%Pregnancy history:
Nulliparous 26%Multiparous: 0 or 1 prior SAB 69%
at least 2 prior SABs 5%Race: White 66%Hispanic 18%Employed during pregnancy 79%At least some college education 68%Any smoking in week before interview 10%
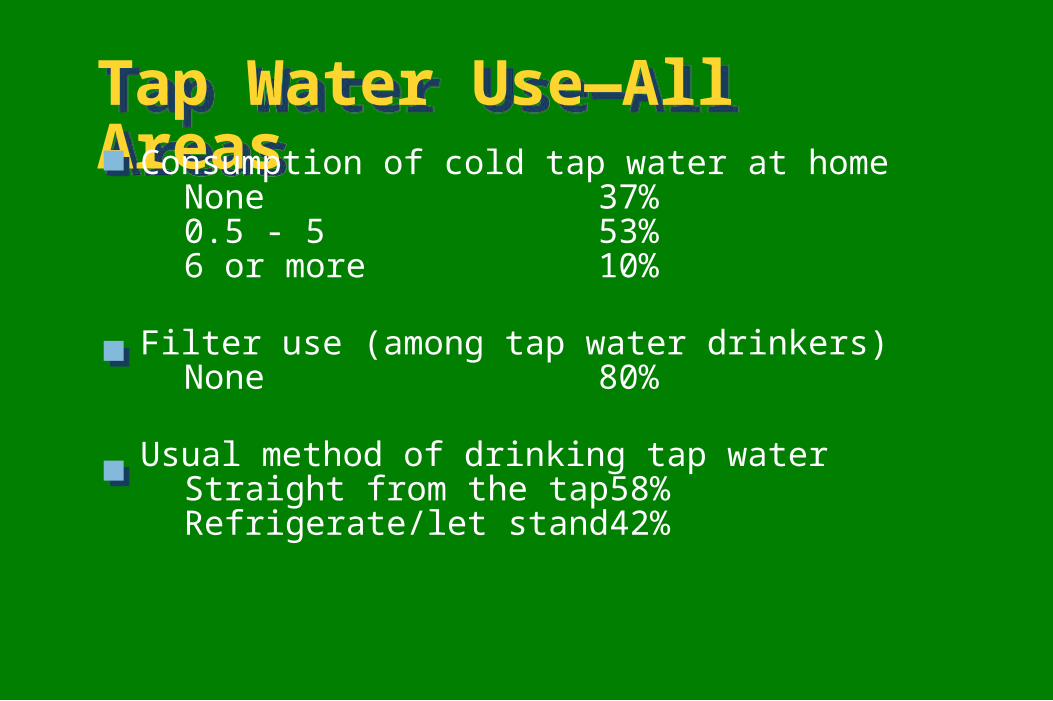
Tap Water Use—All AreasTap Water Use—All AreasConsumption of cold tap water at home
None 37%0.5 - 5 53%6 or more 10%
Filter use (among tap water drinkers)None 80%
Usual method of drinking tap waterStraight from the tap 58%Refrigerate/let stand 42%

Analysis (Swan et al)Analysis (Swan et al)
“High” consumption defined as >5 glasses/dayAnalyses stratified by study areaCovariates considered initially:
– Age, parity, prior SAB, body weight, race, smoking, alcohol, caffeine, education, marital status, gestational age at interview
– Water-related variablesVariables included in multivariate models:
– Age, prior SAB, body weight, race, gestational age, showering
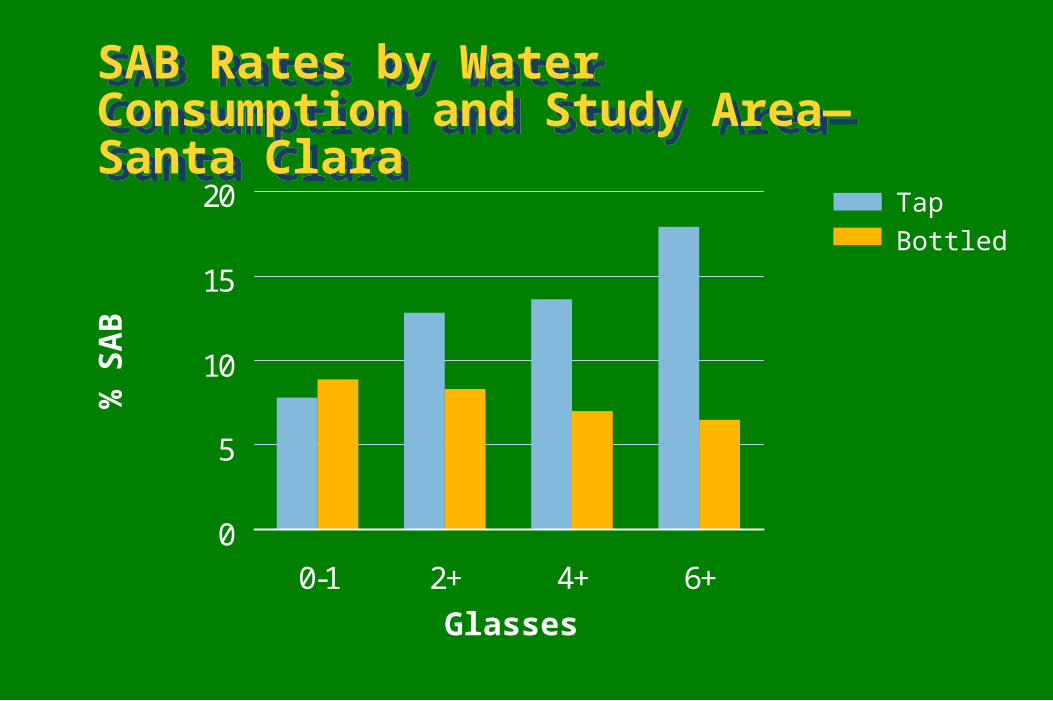
SAB Rates by Water Consumption and Study Area—Santa ClaraSAB Rates by Water Consumption and Study Area—Santa Clara
0
5
10
15
20
0-1 2+ 4+ 6+
% S
AB
Glasses
Tap
Bottled

Results: Santa Clara County (Swan et al)Results: Santa Clara County (Swan et al)
SAB rate among women drinking >1glass/day:tap water only: 12.8%bottled water only: 8.3%Adjusted Odds Ratio =1.7 (95% CI 1.1, 2.6)
SAB rate among women drinking >5 glasses/day:tap water only: 17.9%bottled water only: 6.5%Adjusted Odds Ratio = 4.6 (95% CI 2.0, 10.6)

SAB Rates by Water Consumption and Study Area—Walnut Creek and FontanaSAB Rates by Water Consumption and Study Area—Walnut Creek and Fontana
0
5
10
15
20
0-1 2+ 4+ 6+
% S
AB
Glasses
Tap
Bottled
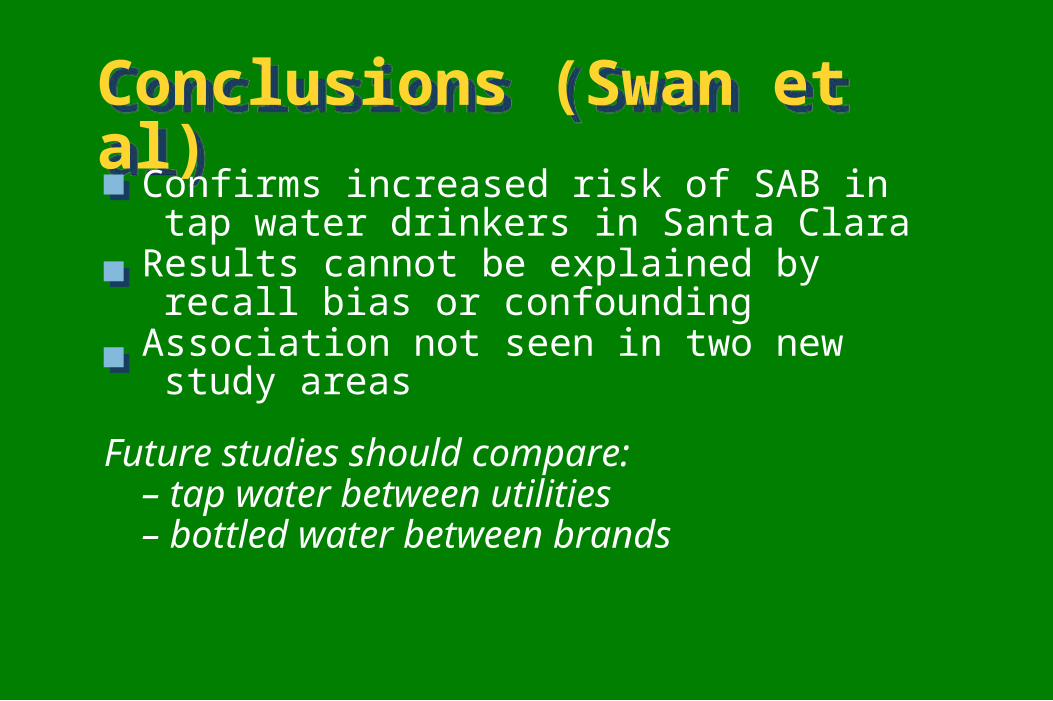
Conclusions (Swan et al)Conclusions (Swan et al)
Confirms increased risk of SAB in tap water drinkers in Santa Clara
Results cannot be explained by recall bias or confounding
Association not seen in two new study areas
Future studies should compare:– tap water between utilities– bottled water between brands

Disinfection By-ProductsDisinfection By-Products
Formed in water that is chlorinated and contains organic matter
Trihalomethanes (THM) are most prevalent by-products and include 4 compounds
Some evidence of mutagenicity and reproductive toxicity in animals, so USEPA regulates maximum contaminant levels
New studies find association with LBW

Exposure Assessment for THM Levels (Waller et al)Exposure Assessment for THM Levels (Waller et al)
Identified 85 drinking water utilities that served women’s residences
Obtained quarterly trihalomethane (THM) measurements from utilities
Estimated THM levels by averaging measurements throughout the utility during first trimester
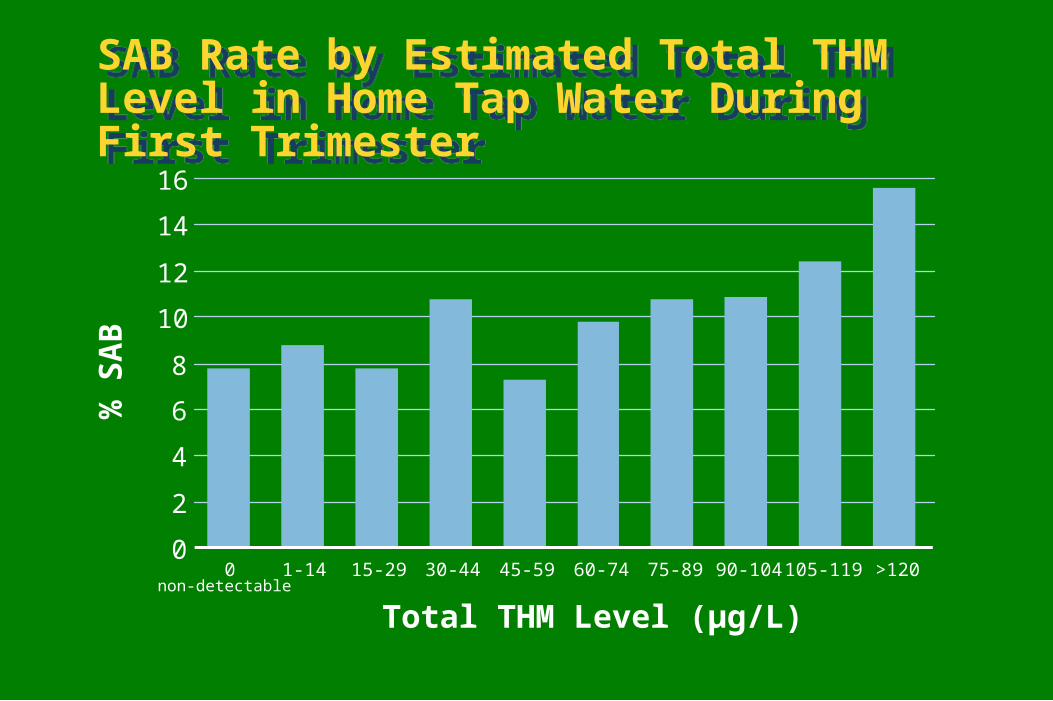
SAB Rate by Estimated Total THM Level in Home Tap Water During First Trimester SAB Rate by Estimated Total THM Level in Home Tap Water During First Trimester
0
2
4
6
8
10
12
14
16
0non-detectable
1-14 15-29 30-44 45-59 60-74 75-89 90-104 105-119 >120
Total THM Level (µg/L)
% S
AB
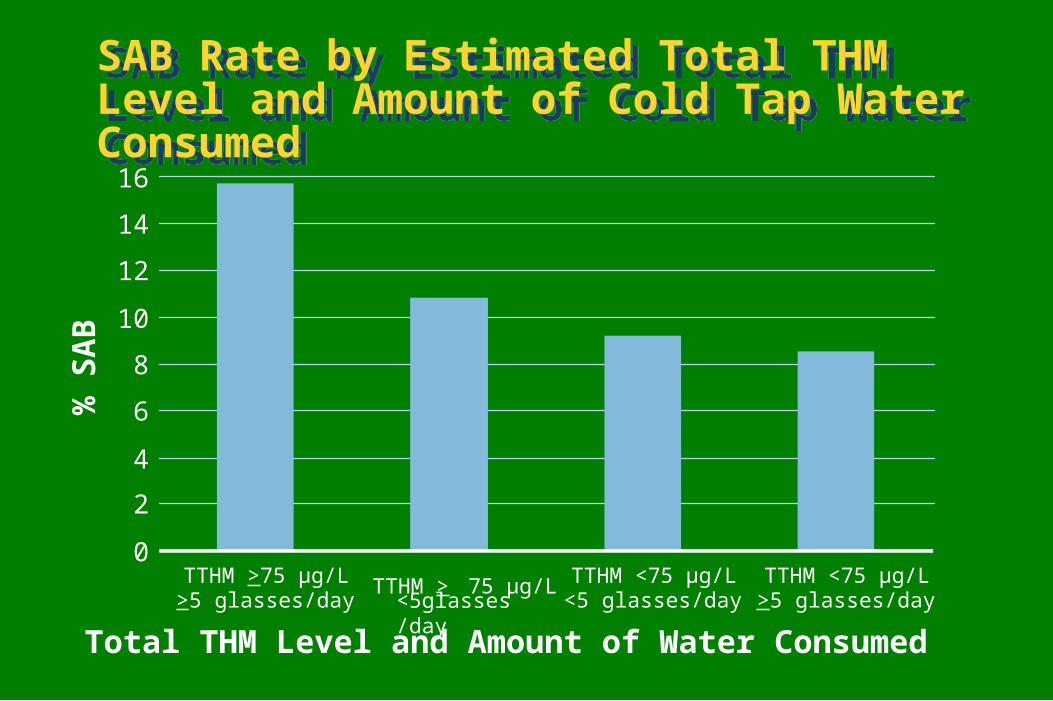
SAB Rate by Estimated Total THM Level and Amount of Cold Tap Water ConsumedSAB Rate by Estimated Total THM Level and Amount of Cold Tap Water Consumed
0
2
4
6
8
10
12
14
16
TTHM >75 µg/L>5 glasses/day
TTHM > 75 µg/L<5glasses/day
TTHM <75 µg/L<5 glasses/day
TTHM <75 µg/L>5 glasses/day
Total THM Level and Amount of Water Consumed
% S
AB
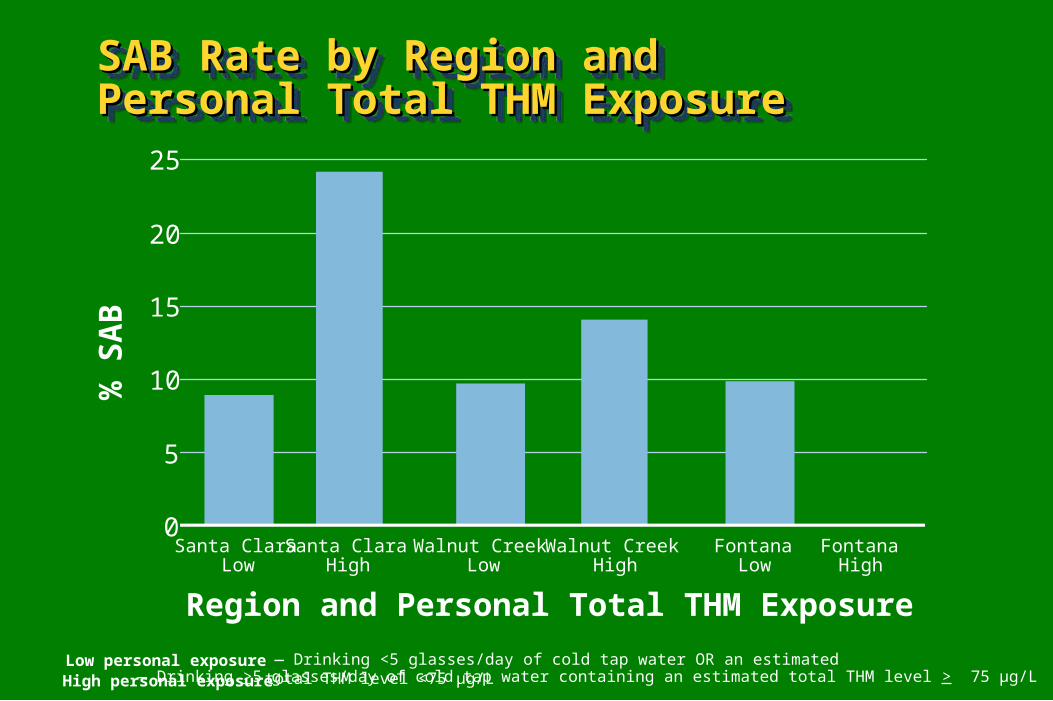
SAB Rate by Region and Personal Total SAB Rate by Region and Personal Total THM ExposureTHM ExposureSAB Rate by Region and Personal Total SAB Rate by Region and Personal Total THM ExposureTHM Exposure
Region and Personal Total THM Exposure
Low personal exposure — Drinking >5 glasses/day of cold tap water containing an estimated total THM level > 75 µg/LHigh personal exposure
— Drinking <5 glasses/day of cold tap water OR an estimated total THM level <75 µg/L
Santa ClaraLow
Santa ClaraHigh
Walnut CreekLow
Walnut CreekHigh
FontanaLow
FontanaHigh
0
5
10
15
20
25
% S
AB

SAB Rate by Estimated BDCM Level and SAB Rate by Estimated BDCM Level and Amount of Cold Tap Water ConsumedAmount of Cold Tap Water ConsumedSAB Rate by Estimated BDCM Level and SAB Rate by Estimated BDCM Level and Amount of Cold Tap Water ConsumedAmount of Cold Tap Water Consumed
0
2
4
6
8
10
12
14
16
18
BDCM Level and Amount of Water Consumed
BDCM >18 µg/L>5 glasses/day
BDCM >18 µg/L<5 glasses/day
BDCM <18 µg/L<5 glasses/day
BDCM <18 µg/L>5 glasses/day

Study StrengthsStudy Strengths
Interviews in early pregnancy
Nearly complete follow-up of all pregnancies
Detailed information on water consumption
THM measurements specific to first trimester
Diverse study population with range of water sources and trihalomethane levels

Study WeaknessesStudy Weaknesses
About 25% of SABs missedOther sources of water not ascertainedInsufficient power to look at specific utilities, bottled water brands, filters, letting water standSome misclassification of THM likelyTHM may be markers for other chlorination by-products

Regulatory StandardsRegulatory Standards
Maximum Contaminant Level (MCL)Based on utility-wide average over 4 quarters
Current total THM = 100µg/LNew total THM = 80µg/LNo MCLs for individual trihalomethanes
Conclusions (Waller et al)Conclusions (Waller et al)
One of the first studies to find association between total THMs and SABBromodichloromethane most strongly associatedResults not explained by recall bias or confounding Results stronger among women not employed outside the home
Repeat study in other areas and obtain more precise THM assessment