shape analysis of fine aggregates used for concrete · standards (bs 812-105.1) and (bs 812-105.2)...
TRANSCRIPT
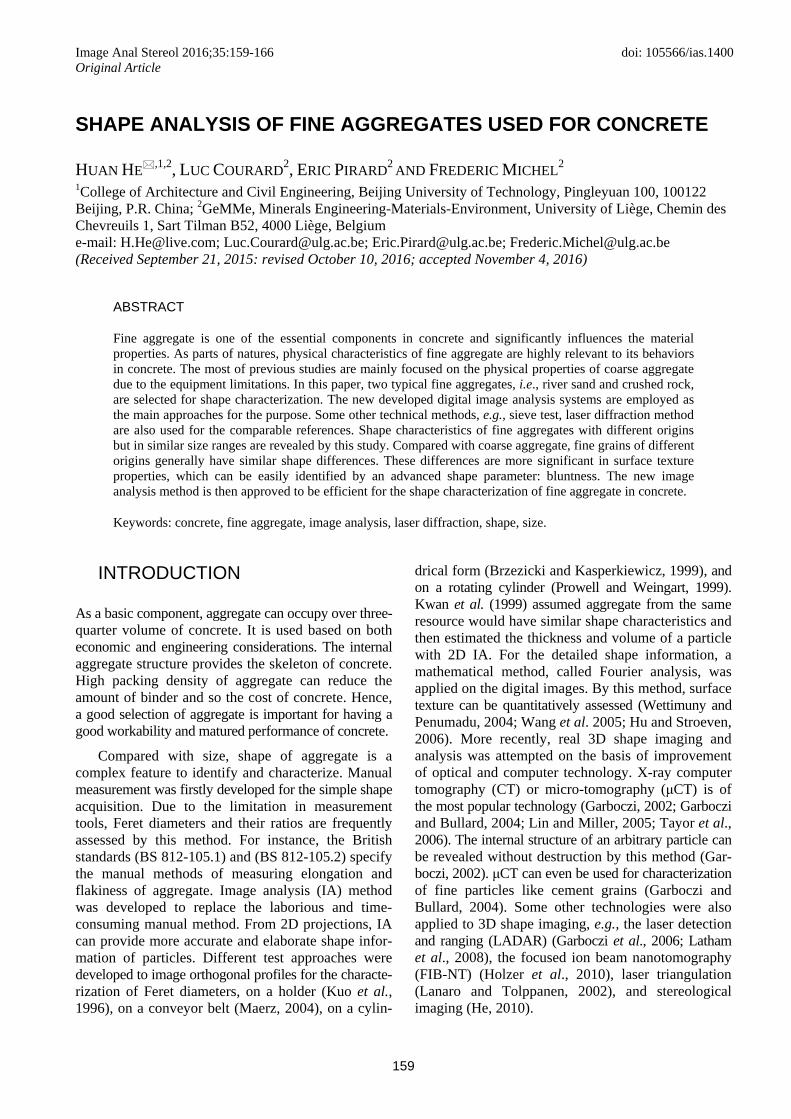
Image Anal Stereol 2016;35:159-166 doi: 105566/ias.1400 Original Article
159
SHAPE ANALYSIS OF FINE AGGREGATES USED FOR CONCRETE
HUAN HE ,1,2, LUC COURARD2, ERIC PIRARD2 AND FREDERIC MICHEL2 1College of Architecture and Civil Engineering, Beijing University of Technology, Pingleyuan 100, 100122 Beijing, P.R. China; 2GeMMe, Minerals Engineering-Materials-Environment, University of Liège, Chemin des Chevreuils 1, Sart Tilman B52, 4000 Liège, Belgium e-mail: [email protected]; [email protected]; [email protected]; [email protected] (Received September 21, 2015: revised October 10, 2016; accepted November 4, 2016)
ABSTRACT
Fine aggregate is one of the essential components in concrete and significantly influences the material properties. As parts of natures, physical characteristics of fine aggregate are highly relevant to its behaviors in concrete. The most of previous studies are mainly focused on the physical properties of coarse aggregate due to the equipment limitations. In this paper, two typical fine aggregates, i.e., river sand and crushed rock, are selected for shape characterization. The new developed digital image analysis systems are employed as the main approaches for the purpose. Some other technical methods, e.g., sieve test, laser diffraction method are also used for the comparable references. Shape characteristics of fine aggregates with different origins but in similar size ranges are revealed by this study. Compared with coarse aggregate, fine grains of different origins generally have similar shape differences. These differences are more significant in surface texture properties, which can be easily identified by an advanced shape parameter: bluntness. The new image analysis method is then approved to be efficient for the shape characterization of fine aggregate in concrete.
Keywords: concrete, fine aggregate, image analysis, laser diffraction, shape, size.
INTRODUCTION
As a basic component, aggregate can occupy over three-quarter volume of concrete. It is used based on both economic and engineering considerations. The internal aggregate structure provides the skeleton of concrete. High packing density of aggregate can reduce the amount of binder and so the cost of concrete. Hence, a good selection of aggregate is important for having a good workability and matured performance of concrete.
Compared with size, shape of aggregate is a complex feature to identify and characterize. Manual measurement was firstly developed for the simple shape acquisition. Due to the limitation in measurement tools, Feret diameters and their ratios are frequently assessed by this method. For instance, the British standards (BS 812-105.1) and (BS 812-105.2) specify the manual methods of measuring elongation and flakiness of aggregate. Image analysis (IA) method was developed to replace the laborious and time-consuming manual method. From 2D projections, IA can provide more accurate and elaborate shape infor-mation of particles. Different test approaches were developed to image orthogonal profiles for the characte-rization of Feret diameters, on a holder (Kuo et al., 1996), on a conveyor belt (Maerz, 2004), on a cylin-
drical form (Brzezicki and Kasperkiewicz, 1999), and on a rotating cylinder (Prowell and Weingart, 1999). Kwan et al. (1999) assumed aggregate from the same resource would have similar shape characteristics and then estimated the thickness and volume of a particle with 2D IA. For the detailed shape information, a mathematical method, called Fourier analysis, was applied on the digital images. By this method, surface texture can be quantitatively assessed (Wettimuny and Penumadu, 2004; Wang et al. 2005; Hu and Stroeven, 2006). More recently, real 3D shape imaging and analysis was attempted on the basis of improvement of optical and computer technology. X-ray computer tomography (CT) or micro-tomography (μCT) is of the most popular technology (Garboczi, 2002; Garboczi and Bullard, 2004; Lin and Miller, 2005; Tayor et al., 2006). The internal structure of an arbitrary particle can be revealed without destruction by this method (Gar-boczi, 2002). μCT can even be used for characterization of fine particles like cement grains (Garboczi and Bullard, 2004). Some other technologies were also applied to 3D shape imaging, e.g., the laser detection and ranging (LADAR) (Garboczi et al., 2006; Latham et al., 2008), the focused ion beam nanotomography (FIB-NT) (Holzer et al., 2010), laser triangulation (Lanaro and Tolppanen, 2002), and stereological imaging (He, 2010).
HE H ET AL: Shape analysis of fine aggregates
160
Although various experimental methods have been developed for shape characterization, IA is still the conventional most canvassed and effective method. It allows imaging and analyzing tens of thousands of particles per minute with a suitable equipment and software. Furthermore, most previous studies focus on characterization of coarse aggregate (from several millimeters to several centimeters) due to the limi-tations of equipment and software (Kuo et al., 1996; Kwan et al., 1999; Prowell and Weingart, 1999; Garboczi, 2002; Lanaro and Tolppanen, 2002; Maerz, 2004; Wettimuny and Penumadu, 2004; Lin and Miller, 2005; Wang et al. 2005; Garboczi et al., 2006; Hu and Stroeven, 2006; Tayor et al., 2006; Latham et al., 2008; He, 2010). Only recent comprehensive X-ray tomography methods go into details of the size level below 1 millimeter or even in the cement-size level (Garboczi and Bullard, 2004; Holzer et al., 2010). Fine aggregate used in concrete is closely relevant to properties of concrete. Granular behavior and packed structure of fine aggregate can directly influence the fresh properties and hardened strength properties. Elastic properties and fracture behaviors (e.g., peak force, softening, fracture energy, etc.) of concrete are also affected by the particle packing of fine aggregate (Brzezicki and Kasperkiewicz, 1997; He et al., 2011; 2012; Du et al., 2013). Finally, the details of the pore microstructure relevant for durability assessment are influenced by the fine particle fraction in concrete because of its impact on the amount of ITZ percolation (Le, 2015). In this study, some advanced IA methods are used for size and shape characterization of fine aggregate.
MATERIALS AND METHODS Two types of typical aggregate used in Belgium for concrete, i.e., a fine natural river sand (RS) and a crushed (intrusive) rock (CR), with the same nominal range 0~2 mm are selected in this study. The samples are analyzed by the sieve tests. The global particle
size distributions (PSDs) are plotted in Fig. 1. The relatively large particles (>0.315 mm) are separated by the sieve analysis and then tested in another packing study, which will not be discussed here due to the topic limitation of this paper. Another important reason to exclude the large particle is the instrument feasibility. Smaller aggregates are more suitable for the IA equipment, which will be discussed later. Particles of the two selected aggregate materials passing through the sieve of 0.315 mm are retained as the experimental material and analyzed in the paper.
Fig. 1. General PSDs of different types of fine aggre-gates by the sieve test.
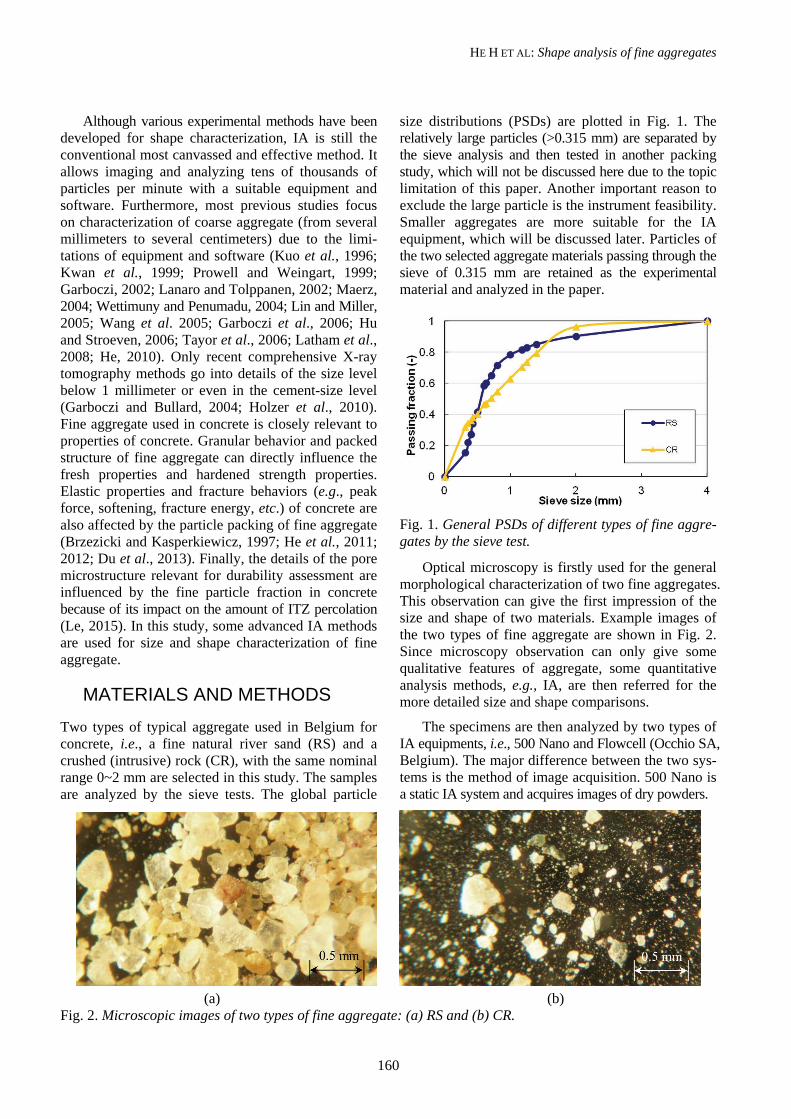
Optical microscopy is firstly used for the general morphological characterization of two fine aggregates. This observation can give the first impression of the size and shape of two materials. Example images of the two types of fine aggregate are shown in Fig. 2. Since microscopy observation can only give some qualitative features of aggregate, some quantitative analysis methods, e.g., IA, are then referred for the more detailed size and shape comparisons.
The specimens are then analyzed by two types of IA equipments, i.e., 500 Nano and Flowcell (Occhio SA, Belgium). The major difference between the two sys-tems is the method of image acquisition. 500 Nano is a static IA system and acquires images of dry powders.
(a) (b) Fig. 2. Microscopic images of two types of fine aggregate: (a) RS and (b) CR.
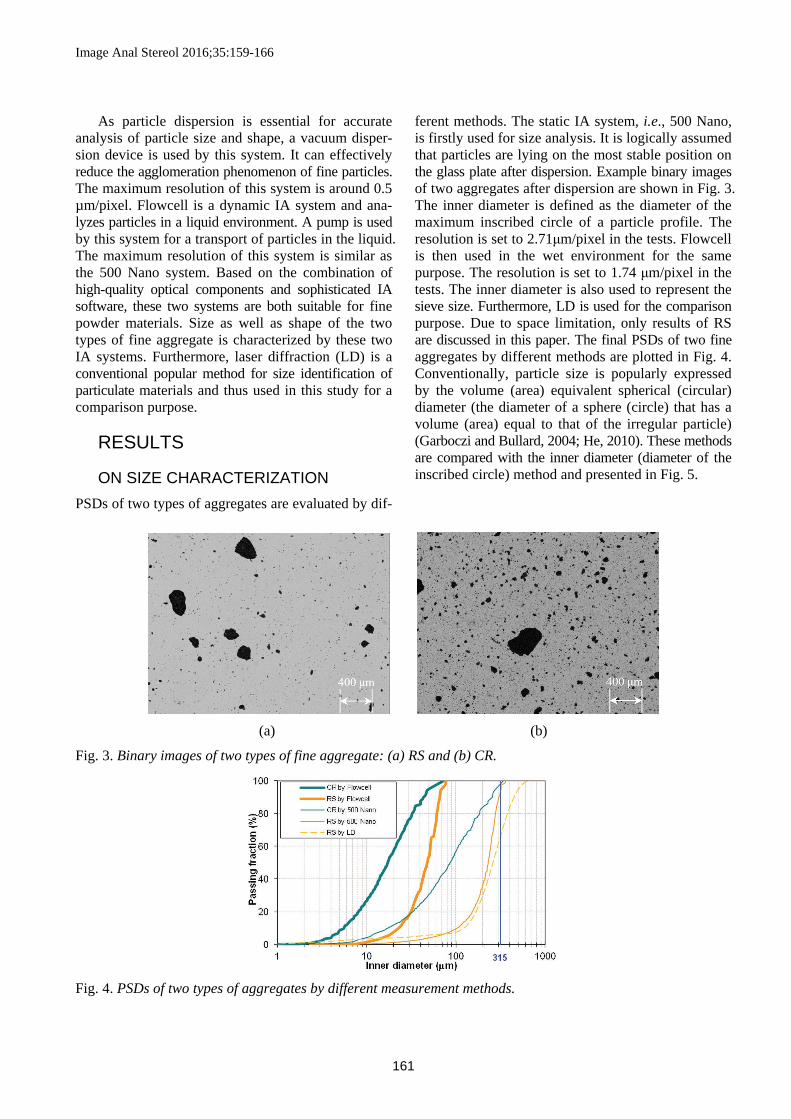
Image Anal Stereol 2016;35:159-166
161
As particle dispersion is essential for accurate analysis of particle size and shape, a vacuum disper-sion device is used by this system. It can effectively reduce the agglomeration phenomenon of fine particles. The maximum resolution of this system is around 0.5 µm/pixel. Flowcell is a dynamic IA system and ana-lyzes particles in a liquid environment. A pump is used by this system for a transport of particles in the liquid. The maximum resolution of this system is similar as the 500 Nano system. Based on the combination of high-quality optical components and sophisticated IA software, these two systems are both suitable for fine powder materials. Size as well as shape of the two types of fine aggregate is characterized by these two IA systems. Furthermore, laser diffraction (LD) is a conventional popular method for size identification of particulate materials and thus used in this study for a comparison purpose.
RESULTS
ON SIZE CHARACTERIZATION PSDs of two types of aggregates are evaluated by dif-
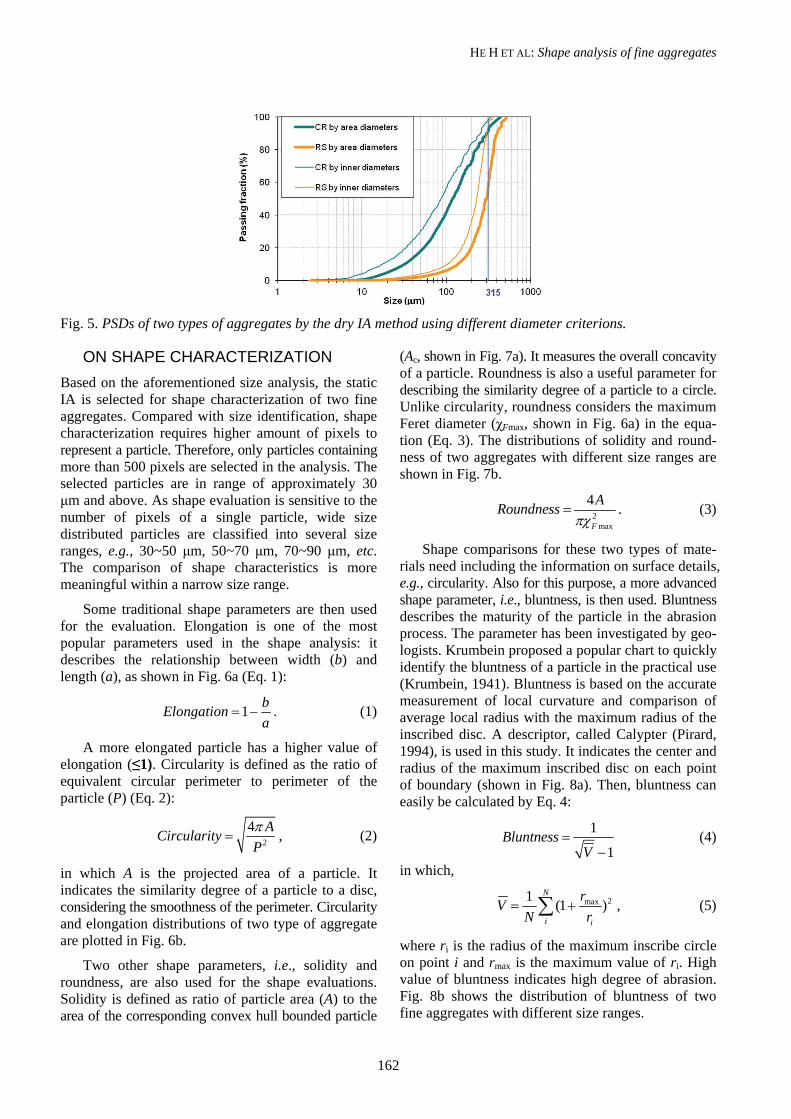
ferent methods. The static IA system, i.e., 500 Nano, is firstly used for size analysis. It is logically assumed that particles are lying on the most stable position on the glass plate after dispersion. Example binary images of two aggregates after dispersion are shown in Fig. 3. The inner diameter is defined as the diameter of the maximum inscribed circle of a particle profile. The resolution is set to 2.71μm/pixel in the tests. Flowcell is then used in the wet environment for the same purpose. The resolution is set to 1.74 μm/pixel in the tests. The inner diameter is also used to represent the sieve size. Furthermore, LD is used for the comparison purpose. Due to space limitation, only results of RS are discussed in this paper. The final PSDs of two fine aggregates by different methods are plotted in Fig. 4. Conventionally, particle size is popularly expressed by the volume (area) equivalent spherical (circular) diameter (the diameter of a sphere (circle) that has a volume (area) equal to that of the irregular particle) (Garboczi and Bullard, 2004; He, 2010). These methods are compared with the inner diameter (diameter of the inscribed circle) method and presented in Fig. 5.
(a) (b)
Fig. 3. Binary images of two types of fine aggregate: (a) RS and (b) CR.
Fig. 4. PSDs of two types of aggregates by different measurement methods.
HE H ET AL: Shape analysis of fine aggregates
162
Fig. 5. PSDs of two types of aggregates by the dry IA method using different diameter criterions.
ON SHAPE CHARACTERIZATION Based on the aforementioned size analysis, the static IA is selected for shape characterization of two fine aggregates. Compared with size identification, shape characterization requires higher amount of pixels to represent a particle. Therefore, only particles containing more than 500 pixels are selected in the analysis. The selected particles are in range of approximately 30 μm and above. As shape evaluation is sensitive to the number of pixels of a single particle, wide size distributed particles are classified into several size ranges, e.g., 30~50 μm, 50~70 μm, 70~90 μm, etc. The comparison of shape characteristics is more meaningful within a narrow size range.
Some traditional shape parameters are then used for the evaluation. Elongation is one of the most popular parameters used in the shape analysis: it describes the relationship between width (b) and length (a), as shown in Fig. 6a (Eq. 1):
1 bElongationa
= − . (1)
A more elongated particle has a higher value of elongation (≤1). Circularity is defined as the ratio of equivalent circular perimeter to perimeter of the particle (P) (Eq. 2):
2
4 ACircularityPπ
= , (2)
in which A is the projected area of a particle. It indicates the similarity degree of a particle to a disc, considering the smoothness of the perimeter. Circularity and elongation distributions of two type of aggregate are plotted in Fig. 6b.
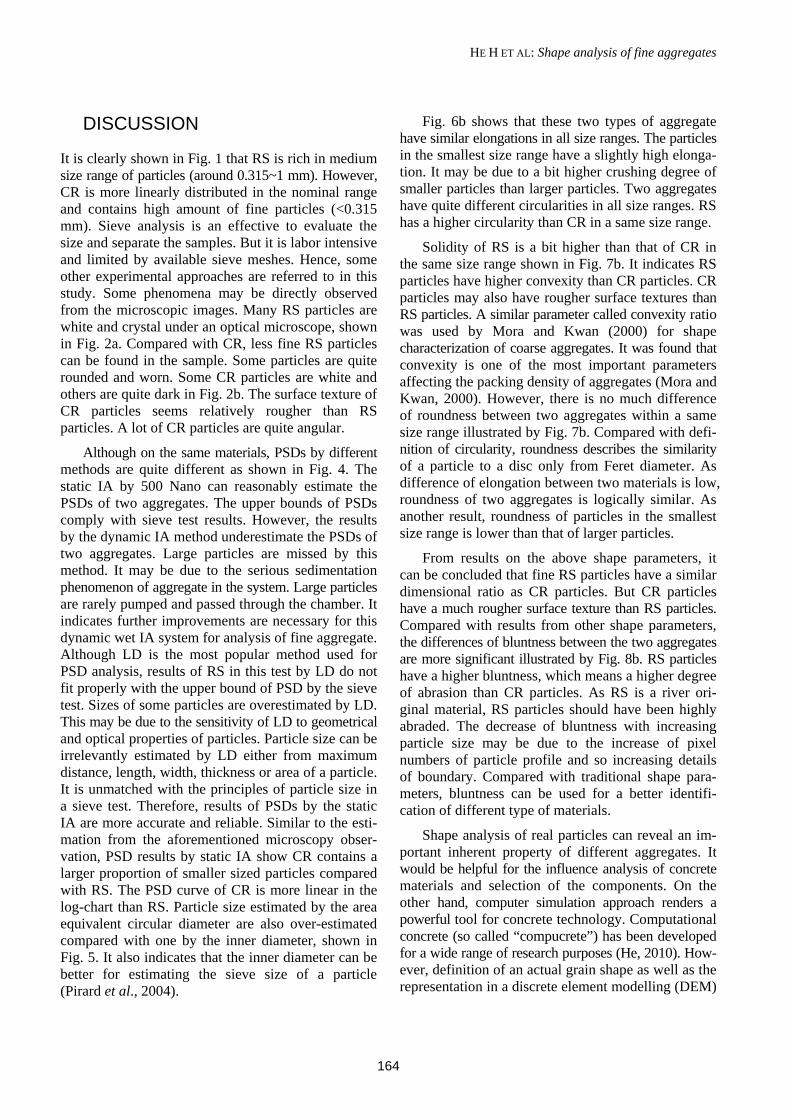
Two other shape parameters, i.e., solidity and roundness, are also used for the shape evaluations. Solidity is defined as ratio of particle area (A) to the area of the corresponding convex hull bounded particle
(Ac, shown in Fig. 7a). It measures the overall concavity of a particle. Roundness is also a useful parameter for describing the similarity degree of a particle to a circle. Unlike circularity, roundness considers the maximum Feret diameter (χFmax, shown in Fig. 6a) in the equa-tion (Eq. 3). The distributions of solidity and round-ness of two aggregates with different size ranges are shown in Fig. 7b.
2max
4
F
ARoundnessπχ
= . (3)
Shape comparisons for these two types of mate-rials need including the information on surface details, e.g., circularity. Also for this purpose, a more advanced shape parameter, i.e., bluntness, is then used. Bluntness describes the maturity of the particle in the abrasion process. The parameter has been investigated by geo-logists. Krumbein proposed a popular chart to quickly identify the bluntness of a particle in the practical use (Krumbein, 1941). Bluntness is based on the accurate measurement of local curvature and comparison of average local radius with the maximum radius of the inscribed disc. A descriptor, called Calypter (Pirard, 1994), is used in this study. It indicates the center and radius of the maximum inscribed disc on each point of boundary (shown in Fig. 8a). Then, bluntness can easily be calculated by Eq. 4:
1
1Bluntness
V=
− (4)
in which,
2max1 (1 )N
i i
rVN r
= +∑ , (5)
where ri is the radius of the maximum inscribe circle on point i and rmax is the maximum value of ri. High value of bluntness indicates high degree of abrasion. Fig. 8b shows the distribution of bluntness of two fine aggregates with different size ranges.
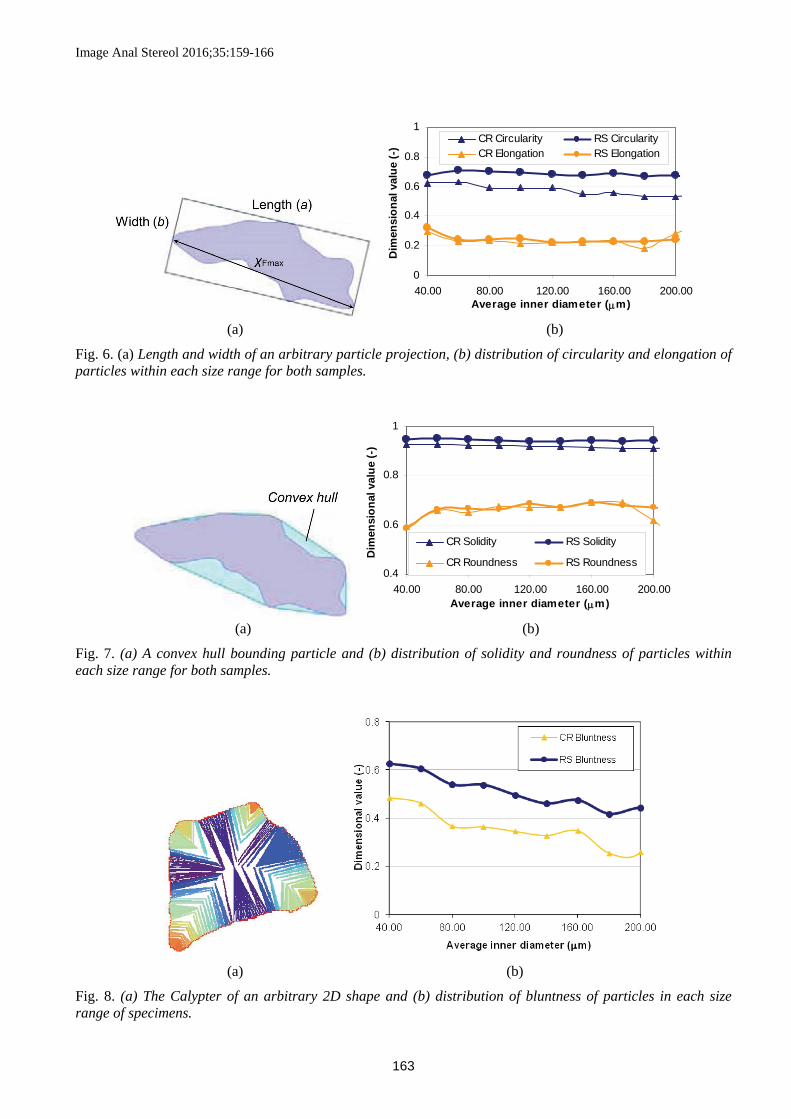
Image Anal Stereol 2016;35:159-166
163
0
0.2
0.4
0.6
0.8
1
40.00 80.00 120.00 160.00 200.00Average inner diameter (μm)
Dim
ensi
onal
val
ue (-
)
CR Circularity RS Circularity CR Elongation RS Elongation
(a) (b)
Fig. 6. (a) Length and width of an arbitrary particle projection, (b) distribution of circularity and elongation of particles within each size range for both samples.
0.4
0.6
0.8
1
40.00 80.00 120.00 160.00 200.00Average inner diameter (μm)
Dim
ensi
onal
val
ue (-
)
CR Solidity RS Solidity
CR Roundness RS Roundness
(a) (b)
Fig. 7. (a) A convex hull bounding particle and (b) distribution of solidity and roundness of particles within each size range for both samples.
(a) (b)
Fig. 8. (a) The Calypter of an arbitrary 2D shape and (b) distribution of bluntness of particles in each size range of specimens.
HE H ET AL: Shape analysis of fine aggregates
164
DISCUSSION
It is clearly shown in Fig. 1 that RS is rich in medium size range of particles (around 0.315~1 mm). However, CR is more linearly distributed in the nominal range and contains high amount of fine particles (<0.315 mm). Sieve analysis is an effective to evaluate the size and separate the samples. But it is labor intensive and limited by available sieve meshes. Hence, some other experimental approaches are referred to in this study. Some phenomena may be directly observed from the microscopic images. Many RS particles are white and crystal under an optical microscope, shown in Fig. 2a. Compared with CR, less fine RS particles can be found in the sample. Some particles are quite rounded and worn. Some CR particles are white and others are quite dark in Fig. 2b. The surface texture of CR particles seems relatively rougher than RS particles. A lot of CR particles are quite angular.
Although on the same materials, PSDs by different methods are quite different as shown in Fig. 4. The static IA by 500 Nano can reasonably estimate the PSDs of two aggregates. The upper bounds of PSDs comply with sieve test results. However, the results by the dynamic IA method underestimate the PSDs of two aggregates. Large particles are missed by this method. It may be due to the serious sedimentation phenomenon of aggregate in the system. Large particles are rarely pumped and passed through the chamber. It indicates further improvements are necessary for this dynamic wet IA system for analysis of fine aggregate. Although LD is the most popular method used for PSD analysis, results of RS in this test by LD do not fit properly with the upper bound of PSD by the sieve test. Sizes of some particles are overestimated by LD. This may be due to the sensitivity of LD to geometrical and optical properties of particles. Particle size can be irrelevantly estimated by LD either from maximum distance, length, width, thickness or area of a particle. It is unmatched with the principles of particle size in a sieve test. Therefore, results of PSDs by the static IA are more accurate and reliable. Similar to the esti-mation from the aforementioned microscopy obser-vation, PSD results by static IA show CR contains a larger proportion of smaller sized particles compared with RS. The PSD curve of CR is more linear in the log-chart than RS. Particle size estimated by the area equivalent circular diameter are also over-estimated compared with one by the inner diameter, shown in Fig. 5. It also indicates that the inner diameter can be better for estimating the sieve size of a particle (Pirard et al., 2004).
Fig. 6b shows that these two types of aggregate have similar elongations in all size ranges. The particles in the smallest size range have a slightly high elonga-tion. It may be due to a bit higher crushing degree of smaller particles than larger particles. Two aggregates have quite different circularities in all size ranges. RS has a higher circularity than CR in a same size range.
Solidity of RS is a bit higher than that of CR in the same size range shown in Fig. 7b. It indicates RS particles have higher convexity than CR particles. CR particles may also have rougher surface textures than RS particles. A similar parameter called convexity ratio was used by Mora and Kwan (2000) for shape characterization of coarse aggregates. It was found that convexity is one of the most important parameters affecting the packing density of aggregates (Mora and Kwan, 2000). However, there is no much difference of roundness between two aggregates within a same size range illustrated by Fig. 7b. Compared with defi-nition of circularity, roundness describes the similarity of a particle to a disc only from Feret diameter. As difference of elongation between two materials is low, roundness of two aggregates is logically similar. As another result, roundness of particles in the smallest size range is lower than that of larger particles.
From results on the above shape parameters, it can be concluded that fine RS particles have a similar dimensional ratio as CR particles. But CR particles have a much rougher surface texture than RS particles. Compared with results from other shape parameters, the differences of bluntness between the two aggregates are more significant illustrated by Fig. 8b. RS particles have a higher bluntness, which means a higher degree of abrasion than CR particles. As RS is a river ori-ginal material, RS particles should have been highly abraded. The decrease of bluntness with increasing particle size may be due to the increase of pixel numbers of particle profile and so increasing details of boundary. Compared with traditional shape para-meters, bluntness can be used for a better identifi-cation of different type of materials.
Shape analysis of real particles can reveal an im-portant inherent property of different aggregates. It would be helpful for the influence analysis of concrete materials and selection of the components. On the other hand, computer simulation approach renders a powerful tool for concrete technology. Computational concrete (so called “compucrete”) has been developed for a wide range of research purposes (He, 2010). How-ever, definition of an actual grain shape as well as the representation in a discrete element modelling (DEM)
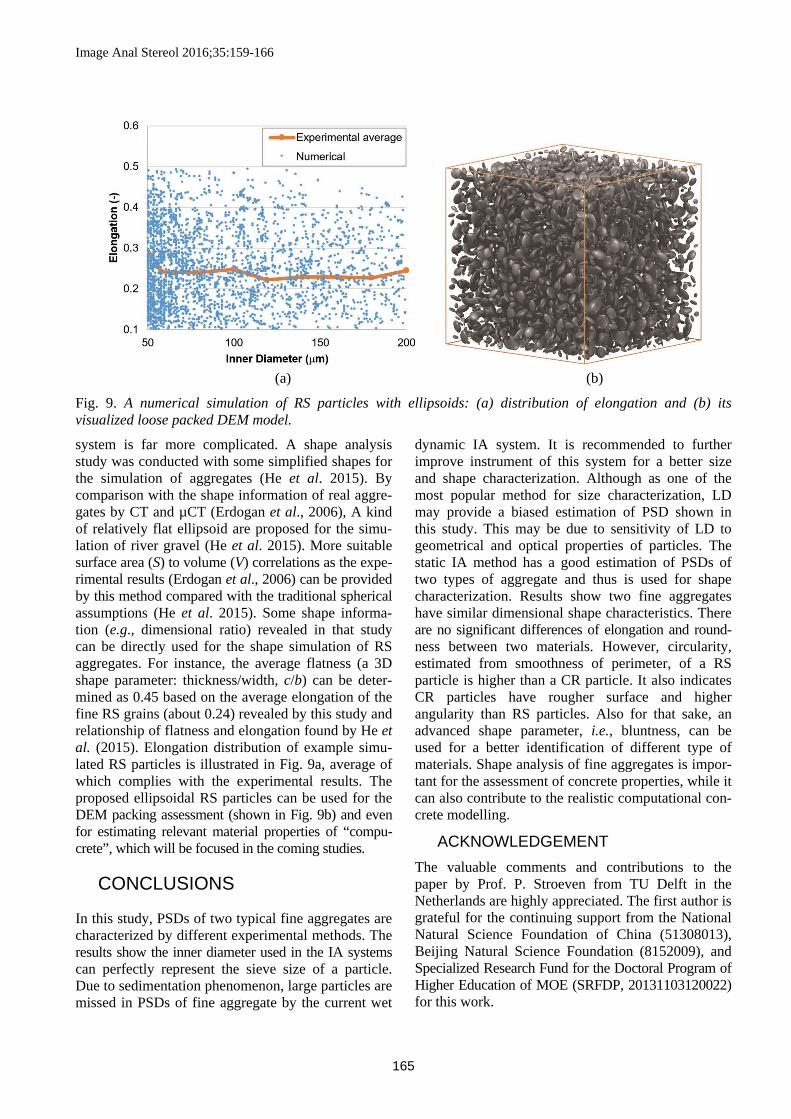
Image Anal Stereol 2016;35:159-166
165
(a) (b)
Fig. 9. A numerical simulation of RS particles with ellipsoids: (a) distribution of elongation and (b) its visualized loose packed DEM model.
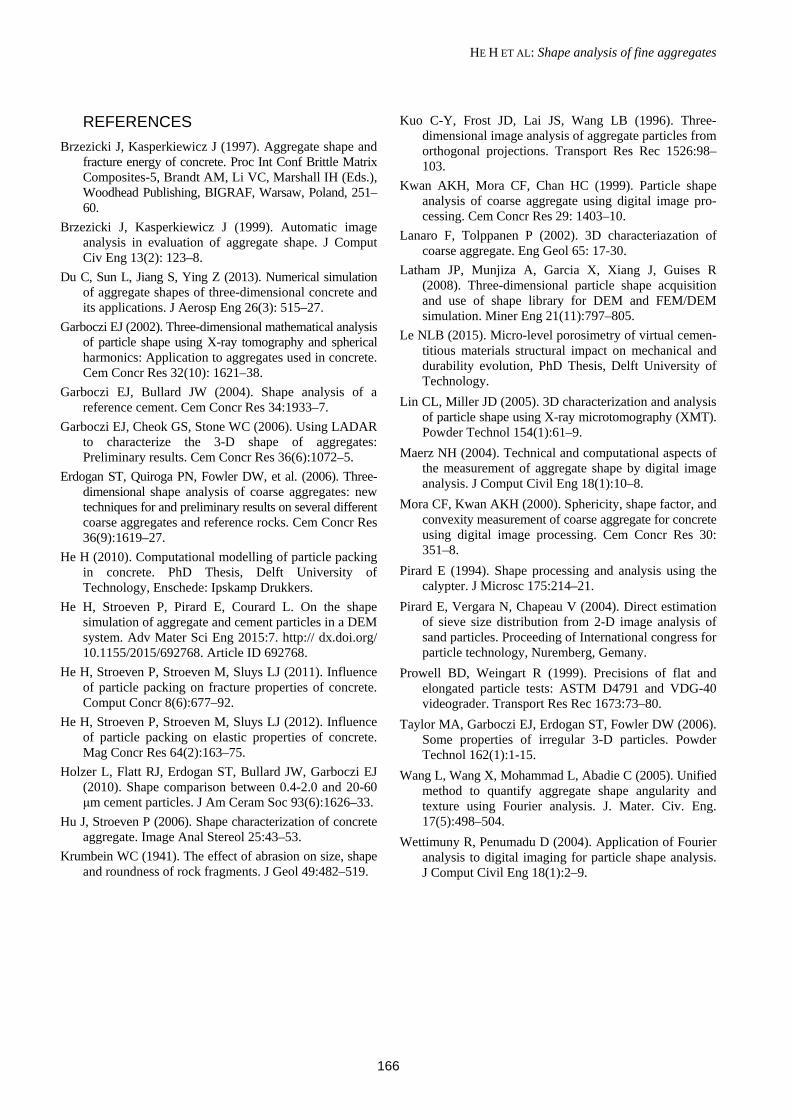
system is far more complicated. A shape analysis study was conducted with some simplified shapes for the simulation of aggregates (He et al. 2015). By comparison with the shape information of real aggre-gates by CT and µCT (Erdogan et al., 2006), A kind of relatively flat ellipsoid are proposed for the simu-lation of river gravel (He et al. 2015). More suitable surface area (S) to volume (V) correlations as the expe-rimental results (Erdogan et al., 2006) can be provided by this method compared with the traditional spherical assumptions (He et al. 2015). Some shape informa-tion (e.g., dimensional ratio) revealed in that study can be directly used for the shape simulation of RS aggregates. For instance, the average flatness (a 3D shape parameter: thickness/width, c/b) can be deter-mined as 0.45 based on the average elongation of the fine RS grains (about 0.24) revealed by this study and relationship of flatness and elongation found by He et al. (2015). Elongation distribution of example simu-lated RS particles is illustrated in Fig. 9a, average of which complies with the experimental results. The proposed ellipsoidal RS particles can be used for the DEM packing assessment (shown in Fig. 9b) and even for estimating relevant material properties of “compu-crete”, which will be focused in the coming studies.
CONCLUSIONS
In this study, PSDs of two typical fine aggregates are characterized by different experimental methods. The results show the inner diameter used in the IA systems can perfectly represent the sieve size of a particle. Due to sedimentation phenomenon, large particles are missed in PSDs of fine aggregate by the current wet
dynamic IA system. It is recommended to further improve instrument of this system for a better size and shape characterization. Although as one of the most popular method for size characterization, LD may provide a biased estimation of PSD shown in this study. This may be due to sensitivity of LD to geometrical and optical properties of particles. The static IA method has a good estimation of PSDs of two types of aggregate and thus is used for shape characterization. Results show two fine aggregates have similar dimensional shape characteristics. There are no significant differences of elongation and round-ness between two materials. However, circularity, estimated from smoothness of perimeter, of a RS particle is higher than a CR particle. It also indicates CR particles have rougher surface and higher angularity than RS particles. Also for that sake, an advanced shape parameter, i.e., bluntness, can be used for a better identification of different type of materials. Shape analysis of fine aggregates is impor-tant for the assessment of concrete properties, while it can also contribute to the realistic computational con-crete modelling.
ACKNOWLEDGEMENT The valuable comments and contributions to the paper by Prof. P. Stroeven from TU Delft in the Netherlands are highly appreciated. The first author is grateful for the continuing support from the National Natural Science Foundation of China (51308013), Beijing Natural Science Foundation (8152009), and Specialized Research Fund for the Doctoral Program of Higher Education of MOE (SRFDP, 20131103120022) for this work.
HE H ET AL: Shape analysis of fine aggregates
166
REFERENCES Brzezicki J, Kasperkiewicz J (1997). Aggregate shape and
fracture energy of concrete. Proc Int Conf Brittle Matrix Composites-5, Brandt AM, Li VC, Marshall IH (Eds.), Woodhead Publishing, BIGRAF, Warsaw, Poland, 251–60.
Brzezicki J, Kasperkiewicz J (1999). Automatic image analysis in evaluation of aggregate shape. J Comput Civ Eng 13(2): 123–8.
Du C, Sun L, Jiang S, Ying Z (2013). Numerical simulation of aggregate shapes of three-dimensional concrete and its applications. J Aerosp Eng 26(3): 515–27.
Garboczi EJ (2002). Three-dimensional mathematical analysis of particle shape using X-ray tomography and spherical harmonics: Application to aggregates used in concrete. Cem Concr Res 32(10): 1621–38.
Garboczi EJ, Bullard JW (2004). Shape analysis of a reference cement. Cem Concr Res 34:1933–7.
Garboczi EJ, Cheok GS, Stone WC (2006). Using LADAR to characterize the 3-D shape of aggregates: Preliminary results. Cem Concr Res 36(6):1072–5.
Erdogan ST, Quiroga PN, Fowler DW, et al. (2006). Three-dimensional shape analysis of coarse aggregates: new techniques for and preliminary results on several different coarse aggregates and reference rocks. Cem Concr Res 36(9):1619–27.
He H (2010). Computational modelling of particle packing in concrete. PhD Thesis, Delft University of Technology, Enschede: Ipskamp Drukkers.
He H, Stroeven P, Pirard E, Courard L. On the shape simulation of aggregate and cement particles in a DEM system. Adv Mater Sci Eng 2015:7. http:// dx.doi.org/ 10.1155/2015/692768. Article ID 692768.
He H, Stroeven P, Stroeven M, Sluys LJ (2011). Influence of particle packing on fracture properties of concrete. Comput Concr 8(6):677–92.
He H, Stroeven P, Stroeven M, Sluys LJ (2012). Influence of particle packing on elastic properties of concrete. Mag Concr Res 64(2):163–75.
Holzer L, Flatt RJ, Erdogan ST, Bullard JW, Garboczi EJ (2010). Shape comparison between 0.4-2.0 and 20-60 μm cement particles. J Am Ceram Soc 93(6):1626–33.
Hu J, Stroeven P (2006). Shape characterization of concrete aggregate. Image Anal Stereol 25:43–53.
Krumbein WC (1941). The effect of abrasion on size, shape and roundness of rock fragments. J Geol 49:482–519.
Kuo C-Y, Frost JD, Lai JS, Wang LB (1996). Three-dimensional image analysis of aggregate particles from orthogonal projections. Transport Res Rec 1526:98–103.
Kwan AKH, Mora CF, Chan HC (1999). Particle shape analysis of coarse aggregate using digital image pro-cessing. Cem Concr Res 29: 1403–10.
Lanaro F, Tolppanen P (2002). 3D characteriazation of coarse aggregate. Eng Geol 65: 17-30.
Latham JP, Munjiza A, Garcia X, Xiang J, Guises R (2008). Three-dimensional particle shape acquisition and use of shape library for DEM and FEM/DEM simulation. Miner Eng 21(11):797–805.
Le NLB (2015). Micro-level porosimetry of virtual cemen-titious materials structural impact on mechanical and durability evolution, PhD Thesis, Delft University of Technology.
Lin CL, Miller JD (2005). 3D characterization and analysis of particle shape using X-ray microtomography (XMT). Powder Technol 154(1):61–9.
Maerz NH (2004). Technical and computational aspects of the measurement of aggregate shape by digital image analysis. J Comput Civil Eng 18(1):10–8.
Mora CF, Kwan AKH (2000). Sphericity, shape factor, and convexity measurement of coarse aggregate for concrete using digital image processing. Cem Concr Res 30: 351–8.
Pirard E (1994). Shape processing and analysis using the calypter. J Microsc 175:214–21.
Pirard E, Vergara N, Chapeau V (2004). Direct estimation of sieve size distribution from 2-D image analysis of sand particles. Proceeding of International congress for particle technology, Nuremberg, Gemany.
Prowell BD, Weingart R (1999). Precisions of flat and elongated particle tests: ASTM D4791 and VDG-40 videograder. Transport Res Rec 1673:73–80.
Taylor MA, Garboczi EJ, Erdogan ST, Fowler DW (2006). Some properties of irregular 3-D particles. Powder Technol 162(1):1-15.
Wang L, Wang X, Mohammad L, Abadie C (2005). Unified method to quantify aggregate shape angularity and texture using Fourier analysis. J. Mater. Civ. Eng. 17(5):498–504.
Wettimuny R, Penumadu D (2004). Application of Fourier analysis to digital imaging for particle shape analysis. J Comput Civil Eng 18(1):2–9.