shape analysis of simulated breast anatomical structures … · 2016-07-20 · shape analysis of...
TRANSCRIPT

Shape Analysis of Simulated Breast Anatomical Structures
Francisco Contijoch1*, Jennifer M. Lynch2*, David D. Pokrajac3, Andrew D.A. Maidment4, Predrag R. Bakic4
Departments of 1Bioengineering, 2Physics and Astronomy, and 4Radiology,
University of Pennsylvania, Philadelphia, PA 19104 3Applied Mathematics Research Center, Delaware State University, Dover, DE 19901
{francisco.contijoch@uphs,jenlynch@sas,andrew.maidment@uphs,predrag.bakic@uphs}.upenn.edu
ABSTRACT
Recent advances in high-resolution 3D breast imaging, namely, digital breast tomosynthesis and dedicated breast CT, have enabled detailed analysis of the shape and distribution of anatomical structures in the breast. Such analysis is critically important, since the projections of breast anatomical structures make up the parenchymal pattern in clinical images which can mask the existing abnormalities or introduce false alarms; the parenchymal pattern is also correlated with the risk of cancer. As a first step towards the shape analysis of anatomical structures in the breast, we have analyzed an anthropomorphic software breast phantom. The phantom generation is based upon the recursive splitting of the phantom volume using octrees, which produces irregularly shaped tissue compartments, qualitatively mimicking the breast anatomy. The shape analysis was performed by fitting ellipsoids to the simulated tissue compartments. The ellipsoidal semi-axes were calculated by matching the moments of inertia of each individual compartment and of an ellipsoid. The distribution of Dice coefficients, measuring volumetric overlap between the compartment and the corresponding ellipsoid, as well as the distribution of aspect ratios, measuring relative orientations of the ellipsoids, were used to characterize various classes of phantoms with qualitatively distinctive appearance. A comparison between input parameters for phantom generation and the properties of fitted ellipsoids indicated the high level of user control in the design of software breast phantoms. The proposed shape analysis could be extended to clinical breast images, and used to inform the selection of simulation parameters for improved realism.
Keywords: Breast anatomy simulation, software breast phantoms, shape analysis, ellipsoidal fitting, Dice coefficient
1. INTRODUCTION One hundred and seventy years ago, Sir Astley Cooper published the first qualitative analysis of the distribution and shape of adipose tissue compartments in the breast.1 These compartments are formed by fibrous tissue septa, eponymously named Cooper’s ligaments, which provide structural stability to the breast. Projections of Cooper’s ligaments make up part of the parenchymal pattern in clinical breast images, which can influence cancer detection by masking the existing abnormalities or introducing false alarms. The parenchymal pattern is characterized using texture analysis of clinical images, and has been correlated with the risk of breast cancer.2 A direct quantification of the underlying breast anatomical structures was not possible until the recent advent of high resolution 3D clinical imaging modalities, namely, digital breast tomosynthesis3 and dedicated breast computed tomography.4
We have proposed a new method for shape analysis of breast anatomy by fitting ellipsoids to adipose tissue compartments. The ellipsoidal semi-axes were calculated by matching the moments of inertia of each individual compartment and of an ellipsoid.5 In this paper, the method is demonstrated on the analysis of simulated tissue compartments of an anthropomorphic software breast phantom. The software phantom of the breast was recently developed at the University of Pennsylvania for use in pre-clinical validation of breast imaging systems.6 A competitive
* Joint first authorship.
Medical Imaging 2012: Physics of Medical Imaging, edited by Norbert J. Pelc, Robert M. Nishikawa, Bruce R. Whiting,Proc. of SPIE Vol. 8313, 83134J · © 2012 SPIE · CCC code: 1605-7422/12/$18 · doi: 10.1117/12.912275
Proc. of SPIE Vol. 8313 83134J-1
Downloaded From: http://spiedigitallibrary.org/ on 07/15/2016 Terms of Use: http://spiedigitallibrary.org/ss/TermsOfUse.aspx

interaction of simulated compartments results in their irregular shape, qualitatively mimicking real breast anatomy. The properties of the fitted ellipsoids are used for characterization of various classes of anthropomorphic software phantoms with qualitatively distinctive appearance. Based upon these properties, we assessed the relationship between the input parameters of the simulation and the final appearance of the breast phantoms. In the long term, the proposed method could be extended to include shape analysis of real breast tissue (from clinical breast images or histological specimen). Such analyses would allow an informed selection of simulation parameters, aimed at improving the realism of anatomy simulation.
2. METHODS 2.1. Software breast phantoms The X-ray Physics Lab at the Univ. of Pennsylvania has over 15 years of experience in developing breast anthropomorphic software phantoms.7-14 The anthropomorphic software breast phantom6 used in this study is based upon recursive partitioning of the simulated breast volume using octrees.15-17 The octree-based simulation allows for fast generation of phantoms with very small voxel size. Control of the phantom is provided through selection of input parameters which specify the simulated breast size, glandularity, thickness of the skin and Cooper’s ligaments, and the number, distribution, and size and shape of adipose compartments. The proposed shape analysis is used here to investigate the relationship between the properties of simulated tissue compartments and the corresponding input parameters, thus reflecting the level of user control over the phantom appearance. In this study, we have specifically focused on the effect of 2 parameters related to the relative size (rS) and the relative orientation, (i.e., aspect ratios, rO) of simulated tissue compartments. The simulated compartments are specified by shape functions fi(x), i=1,…, K, consistent with the quadratic decision boundaries described by a maximum a posteriori (MAP) classifier:18
( ) ( ) ( ) ( )11 detlog21log
21 −− Σ−−−Σ−= iiii
Tii qf sxsxx , (1)
where K is the number of compartments, x is the 3D coordinate within the phantom volume, si (sxi, syi, szi) are compartment seed vectors, 1−Σ i are positive definite matrices, and qi , (0≤ qi ≤1) are parameters corresponding to distribution priors in MAP. We define the relative size and orientation of a simulated compartment using the matrix 1−Σ i , with eigenvalues 1/kai
2,
1/kbi2, 1/kci
2 and eigenvectors in , iu , iv :
Tiii
ci
bi
ai
iiii vun
k
k
k
vun ]ˆˆˆ[
100
010
001
]ˆˆˆ[
2
2
2
1 ⋅
⎥⎥⎥⎥⎥⎥⎥
⎦
⎤
⎢⎢⎢⎢⎢⎢⎢
⎣
⎡
⋅≡Σ− (2)
aiiS kr =)( (3)
)/,/()( aiciaibiiO kkkkr = (4)
Proc. of SPIE Vol. 8313 83134J-2
Downloaded From: http://spiedigitallibrary.org/ on 07/15/2016 Terms of Use: http://spiedigitallibrary.org/ss/TermsOfUse.aspx

2.2. Ellipsoid fitting Each phantom analyzed in this work has been generated as a labeled 3D volume with each compartment assigned a unique intensity value. Using these intensity values, we created lists of voxels corresponding to individual compartments. For each compartment, the moment of inertia tensor, IC ,was calculated and compared with the moment of inertia tensor of an ellipsoid, IE (Eq. 5). (m denotes the total number of voxels in the fitted ellipsoid.) Thediagonal elements of the tensor (Ixx, Iyy, Izz) were used to calculate the semiaxes (a, b, c) of an ellipsoid fitted to the compartment. Please note that we assumed the moments of inertia were calculated relative to the center of mass of each compartment. In that case, the tensor of inertia becomes diagonal. Fig. 1 illustrates the cross-sections of a phantom and the corresponding fitted ellipsoids.
⎥⎥⎥
⎦
⎤
⎢⎢⎢
⎣
⎡
==
⎥⎥⎥⎥⎥⎥
⎦
⎤
⎢⎢⎢⎢⎢⎢
⎣
⎡
+
+
+
=
zzzyzx
yzyyyx
xzxyxx
CE
IIIIIIIII
I
bam
acm
cbm
I
500
05
0
005
22
22
22
(5)
∑∑ ==−=+=
N
k kkxyN
k kkxx yxIzyI11
22 ;);( (for all combinations of x, y, z) (6)
Figure 1: Vertical cross-sections through a sample breast phantom analyzed in this study (left)
and the corresponding fitted ellipsoids (right). 2.3. Characterization of the fitted ellipsoids To evaluate the appropriateness of fitting ellipsoids to inherently non-ellipsoidal compartments, we calculated the volumetric overlap between a compartment (C) and the corresponding ellipsoid (E) using the Dice coefficient, s:19
ECEC
s+∩
= 2 (7)
Proc. of SPIE Vol. 8313 83134J-3
Downloaded From: http://spiedigitallibrary.org/ on 07/15/2016 Terms of Use: http://spiedigitallibrary.org/ss/TermsOfUse.aspx

We also calculated the aspect ratios of fitted ellipsoids (a1/a2) and (a1/a3), where a1 denotes the principal axis. The Dice coefficients and aspect ratios were evaluated as a function of compartment volume. We analyzed the correlation between the ellipsoidal aspect ratios and the input relative orientations, rO, of the corresponding compartments, to assess the level of control for compartment orientations. The shape analysis was performed on 16 phantoms from four classes with simulated compartments which have a distinct appearance. The classes were defined by different distribution of rS and rO parameters (Table 1). Each class contained four phantoms. Each phantom simulated a 450 ml breast, with 500μm voxel size, and 333 compartments.
Table 1: Values of the input parameter defining relative compartment orientation, rO, and the relative compartment size, rS, used for the generation of the four analyzed classes of phantoms.
rS
rO 1 [0.01, 100]
1 Class 1 Class 2
[0.25, 4] Class 3 Class 4 Cross-sections through sample phantoms from the four analyzed classes of phantoms (Fig 2) illustrate differences in the shapes and orientations of simulated compartment shapes between the different classes. For example, compartments in a phantom from Class 1 have comparable sizes and planar border surfaces, resulting from the constant values of the rS and rO parameters used for simulation.
Class 1 Class 2
Class 3 Class 4
Figure 2: Coronal cross-sections through sample phantoms from the four analyzed classes.
Proc. of SPIE Vol. 8313 83134J-4
Downloaded From: http://spiedigitallibrary.org/ on 07/15/2016 Terms of Use: http://spiedigitallibrary.org/ss/TermsOfUse.aspx

3. RESULTS AND DISCUSSION 3.1 Fitted ellipsoids The proposed use of ellipsoidal fitting for the shape analysis of simulated breast tissue compartments was evaluated using several qualitative and quantitative measures. Fig. 3 illustrates the result of fitting ellipsoids to sample phantoms from the four analyzed classes. A qualitative comparison of phantom cross-sections (Fig. 2) and the corresponding cross-sections of the fitted ellipsoids (Fig. 3) demonstrates that the ellipsoids appear in the correct position, with orientation and size similar to underlying compartments.
Class 1 Class 2
Class 3 Class 4
Figure 3: Coronal cross-sections of the fitted ellipsoids corresponding to sample phantoms from Fig. 2.
Fig. 3 also demonstrates the relationship between phantom appearance and varying input parameters. In Class 1, a desired spherical shape of the compartments (rO = 1) with desired uniform size (rS = 1), resulted in phantom compartments with varying, but relatively homogenous size, as evident by the fitted ellipsoids. The fitted ellipsoids showed a range of orientations, which is due to the competitive interaction of a relatively large number of compartments (333) within the limited phantom volume. Comparing the results from Class 1 and Class 2, a larger variation in sizes of fitted ellipsoids was observed, consistent with the wider range of the input parameter controlling the relative compartment size (rS ∈ [0.01,100]). For the selected range of input parameters (four orders of magnitude wide), a much larger variations in ellipsoid sizes might be expected. We observed somewhat limited variations, which might be also due to the large number of compartments within the limited phantom volume. Comparison of the results from Class 1 and Class 3 demonstrates the effects of varying the input relative orientations. The fitted ellipsoids for Class 3 demonstrate a wide range of orientations, which is consistent with the 16-fold difference between the minimum and maximum value of the rO parameter. The compartments from Class 3 also have various sizes, as compared to those from Class 1. The observed variation in compartment sizes for Class 3 is still smaller compared to Class 4 which was generated using a wide range of both rO and rS parameters.
Proc. of SPIE Vol. 8313 83134J-5
Downloaded From: http://spiedigitallibrary.org/ on 07/15/2016 Terms of Use: http://spiedigitallibrary.org/ss/TermsOfUse.aspx
400
350
300
m 250
ú 200ó
150
100
5
Class 1
Class 2
Class 3
Class 4
Ihg0 Ey_...EA.,_ 6 , A a JR II 1 11 A1 IN 31 E 11 E I1 11 f1 IA 1I 1.1
0.5 0.6 0.7 0.8 0.9 1
Dice Coefficeint
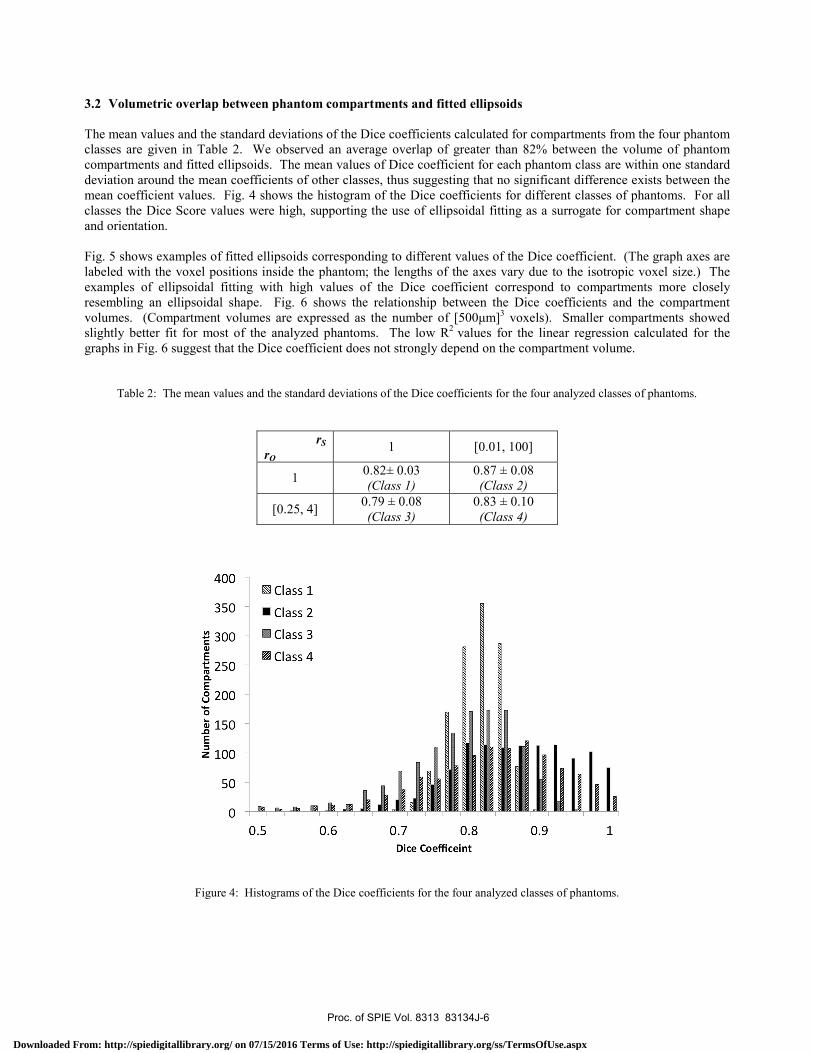
3.2 Volumetric overlap between phantom compartments and fitted ellipsoids The mean values and the standard deviations of the Dice coefficients calculated for compartments from the four phantom classes are given in Table 2. We observed an average overlap of greater than 82% between the volume of phantom compartments and fitted ellipsoids. The mean values of Dice coefficient for each phantom class are within one standard deviation around the mean coefficients of other classes, thus suggesting that no significant difference exists between the mean coefficient values. Fig. 4 shows the histogram of the Dice coefficients for different classes of phantoms. For all classes the Dice Score values were high, supporting the use of ellipsoidal fitting as a surrogate for compartment shape and orientation. Fig. 5 shows examples of fitted ellipsoids corresponding to different values of the Dice coefficient. (The graph axes are labeled with the voxel positions inside the phantom; the lengths of the axes vary due to the isotropic voxel size.) The examples of ellipsoidal fitting with high values of the Dice coefficient correspond to compartments more closely resembling an ellipsoidal shape. Fig. 6 shows the relationship between the Dice coefficients and the compartment volumes. (Compartment volumes are expressed as the number of [500μm]3 voxels). Smaller compartments showed slightly better fit for most of the analyzed phantoms. The low R2 values for the linear regression calculated for the graphs in Fig. 6 suggest that the Dice coefficient does not strongly depend on the compartment volume.
Table 2: The mean values and the standard deviations of the Dice coefficients for the four analyzed classes of phantoms.
rS
rO 1 [0.01, 100]
1 0.82± 0.03 (Class 1)
0.87 ± 0.08 (Class 2)
[0.25, 4] 0.79 ± 0.08 (Class 3)
0.83 ± 0.10 (Class 4)
Figure 4: Histograms of the Dice coefficients for the four analyzed classes of phantoms.
Proc. of SPIE Vol. 8313 83134J-6
Downloaded From: http://spiedigitallibrary.org/ on 07/15/2016 Terms of Use: http://spiedigitallibrary.org/ss/TermsOfUse.aspx

=Compartment= Ellipsoidal Fitting
210
200,
190-
180.
40
30
20
4030
- Compartment= Ellipsoidal Fitting
60
40
20
0
20
CompartmentEllipsoida Fitting
130,
125,
120,
115,
16525
160 20
- Compartment= Ellipsoidal Fitting240,
220,
200,
180,
160150
100 60 80 100
R2= 0.11441 slope = 2.7442e -06
dg 0.8
2 3 4 5Compartment Volume x 10'
R2=0.36003 slope -5.1101e-06
vÚ
0.7
5 0.6
0.50
.
2 3 4 5
Compartment Volume x 10'
R2= 0.09479 slope =- 4.3626e -06
,(4 0.9 .4c
.'. '. tA) r,.g0.8
y' : :,+ r tid . . ._oo 0.7g ,r t..,_ :° '0.6
2 3
Compartment Volume4 5
0a
x1
R2= 0.27295 slope =- 5.0885e -06
mu -. . t: i +
d ¡:0
.
0.50 1 2 3 4 5
Compartment Volume x 10'
(a) (b)
(c) (d)
Figure 5: Examples of simulated compartments (dark red) and the overlapped fitted ellipsoids (bright green), corresponding to the Dice coefficients of (a) 0.9, (b) 0.27, (c) 0.94, and (d) 0.42.
Figure 6: Scatter graphs of the Dice coefficients and the corresponding compartment volumes, calculated for different classes of phantoms. (Volumes are expressed in the number of [500μm]3 voxels). Shown also are the linear regression lines with R2 values.
Class 1 Class 2
Class 3 Class 4
Proc. of SPIE Vol. 8313 83134J-7
Downloaded From: http://spiedigitallibrary.org/ on 07/15/2016 Terms of Use: http://spiedigitallibrary.org/ss/TermsOfUse.aspx
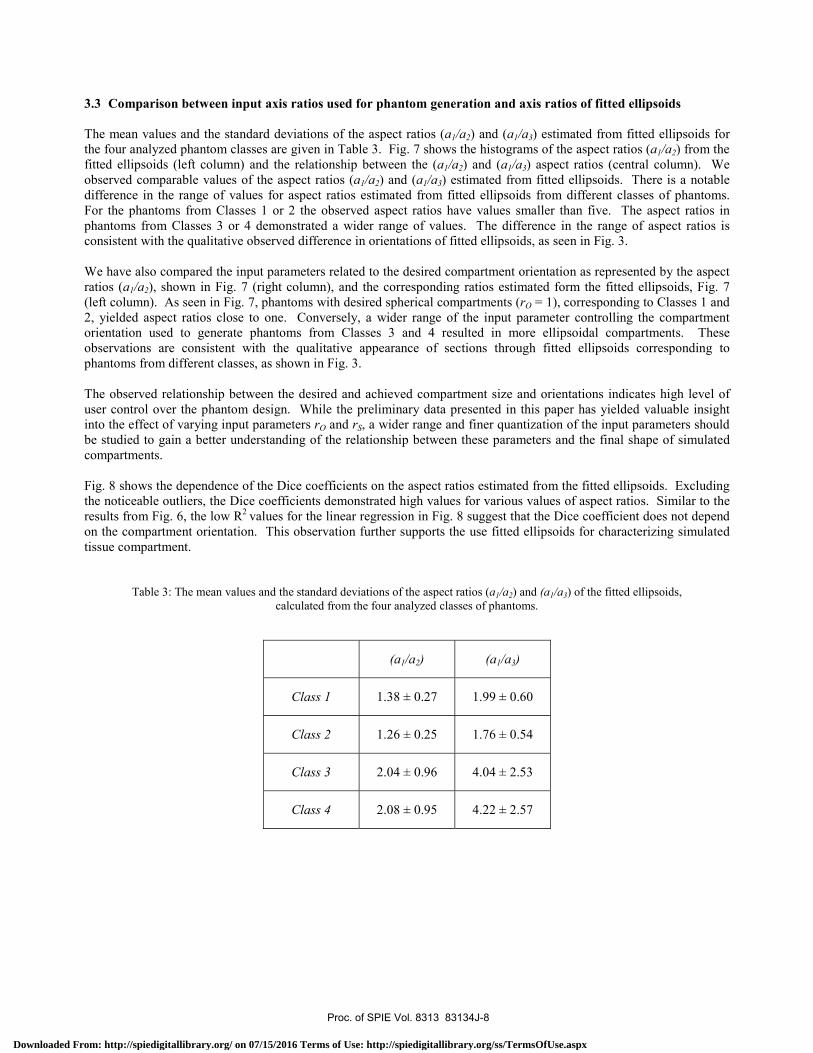
3.3 Comparison between input axis ratios used for phantom generation and axis ratios of fitted ellipsoids The mean values and the standard deviations of the aspect ratios (a1/a2) and (a1/a3) estimated from fitted ellipsoids for the four analyzed phantom classes are given in Table 3. Fig. 7 shows the histograms of the aspect ratios (a1/a2) from the fitted ellipsoids (left column) and the relationship between the (a1/a2) and (a1/a3) aspect ratios (central column). We observed comparable values of the aspect ratios (a1/a2) and (a1/a3) estimated from fitted ellipsoids. There is a notable difference in the range of values for aspect ratios estimated from fitted ellipsoids from different classes of phantoms. For the phantoms from Classes 1 or 2 the observed aspect ratios have values smaller than five. The aspect ratios in phantoms from Classes 3 or 4 demonstrated a wider range of values. The difference in the range of aspect ratios is consistent with the qualitative observed difference in orientations of fitted ellipsoids, as seen in Fig. 3. We have also compared the input parameters related to the desired compartment orientation as represented by the aspect ratios (a1/a2), shown in Fig. 7 (right column), and the corresponding ratios estimated form the fitted ellipsoids, Fig. 7 (left column). As seen in Fig. 7, phantoms with desired spherical compartments (rO = 1), corresponding to Classes 1 and 2, yielded aspect ratios close to one. Conversely, a wider range of the input parameter controlling the compartment orientation used to generate phantoms from Classes 3 and 4 resulted in more ellipsoidal compartments. These observations are consistent with the qualitative appearance of sections through fitted ellipsoids corresponding to phantoms from different classes, as shown in Fig. 3. The observed relationship between the desired and achieved compartment size and orientations indicates high level of user control over the phantom design. While the preliminary data presented in this paper has yielded valuable insight into the effect of varying input parameters rO and rS, a wider range and finer quantization of the input parameters should be studied to gain a better understanding of the relationship between these parameters and the final shape of simulated compartments. Fig. 8 shows the dependence of the Dice coefficients on the aspect ratios estimated from the fitted ellipsoids. Excluding the noticeable outliers, the Dice coefficients demonstrated high values for various values of aspect ratios. Similar to the results from Fig. 6, the low R2 values for the linear regression in Fig. 8 suggest that the Dice coefficient does not depend on the compartment orientation. This observation further supports the use fitted ellipsoids for characterizing simulated tissue compartment.
Table 3: The mean values and the standard deviations of the aspect ratios (a1/a2) and (a1/a3) of the fitted ellipsoids, calculated from the four analyzed classes of phantoms.
(a1/a2) (a1/a3)
Class 1 1.38 ± 0.27 1.99 ± 0.60
Class 2 1.26 ± 0.25 1.76 ± 0.54
Class 3 2.04 ± 0.96 4.04 ± 2.53
Class 4 2.08 ± 0.95 4.22 ± 2.57
Proc. of SPIE Vol. 8313 83134J-8
Downloaded From: http://spiedigitallibrary.org/ on 07/15/2016 Terms of Use: http://spiedigitallibrary.org/ss/TermsOfUse.aspx

200
150
100
50
o
Mean =1.38 STD =0.27
2 3 4al /a2 Aspect Ratio
5
R2= 0.303 slope =1.23205
r
1 2 3 4 5Fitted (a1 /a2) Aspect Ratio
5
R2= -0.002 slope X332658089176.249
0.5 1 1.5
Input (a1 /a2) Aspect Ratio
2
R`= 0.401 slope =1.382
3 4 5Fitted (a1 /a2) Aspect Ratio
R2= -0.000 slope = 382122161638.565
5
0.5 1 1.5
Input (a1 /a2) Aspect Ratio
2
illillikilirai....-1
200
150
100
50
o1
Mean =2.04 STD =0.96
2 3 4a1 /a2 Aspect Ratio
5
R2= 0.434 slope =1.7340 15
'775
ccÚ ,Ñ 10
Ts 5
LL
5 10 15Fitted (a1 /a2) Aspect Ratio
10o.ro
¢ 8S)Naá eiR 42LL 2 \j;_, ); , v. . -.._-:`-`s:'i^'. .'r;'J. . . . . .
5 10 15Input (a1/a2) Aspect Ratio
R2= 0.001 slope = -0.009
200
150
100
50
0
Mean =2.08 STD =0.95
-4 a--- -- ------_J1 2 3 4 5
a1 /a2 Aspect Ratio
R2= 0.309 slope =1.557
5 10 15Fitted (a1 /a2) Aspect Ratio
R2= 0.001 slope =0.009
5 10Input (a1/a2) Aspect Ratio
15
Class 1
Class 2
Class 3
Class 4
Figure 7: Comparison between the input and fitted aspect ratios. Shown are the histograms of (a1/a2) aspect ratios from fitted ellipsoids (left), the scatter plots of (a1/a2) vs. (a1/a3) aspect ratios (center), and the scatter plots of the input (a1/a2) aspect ratios vs. the corresponding ratios from fitted ellipsoids (right). Scatter plots include the linear regression lines, with the R2 values.
Proc. of SPIE Vol. 8313 83134J-9
Downloaded From: http://spiedigitallibrary.org/ on 07/15/2016 Terms of Use: http://spiedigitallibrary.org/ss/TermsOfUse.aspx

1
0N
m 0.8
R2= 0.011 slope = -0.013
V fr
g 0.%-.C.)
cN. 0.6-
0.5
0.41 2 3 4
Fitted (a1 /a2) Aspect Ratio
0.9
iS 0.8.41)
0.7o
0.6o
0.5
0.41
R2= 0.291 slope =-0.182
2 3Fitted (al /a2) Aspect Ratio
4
0.9
Ñ 0.8
ó 0.7Uti 0.6a
0.5
0.4
R2= 0.018 slope = -0.011
2 4 6 8Fitted (al /a2) Aspect Ratio
10
R2= 0.007 slope = -0.009
0.42 4 6 8 10
Fitted (al /a2) Aspect Ratio
Class 1 Class 2
Class 3 Class 4 Figure 8: Scatter plots of the Dice coefficients vs. the corresponding (a1/a2) aspect ratios for the four analyzed classes of phantoms. Shown are the linear regression lines, with the goodness-of-fit (R2) values. Extension of the proposed shape analysis to clinical 3D breast images, (i.e., digital breast tomosynthesis or breast CT,) will allow the estimation of the shape and orientation of tissue compartments in real breasts. Shape properties estimated from clinical images can inform the selection of input parameters to improve phantom realism. Ultimately, the shape analysis methods could be used for direct validation of software breast phantoms, in which the simulated anatomy is compared with anatomical specimens. There have been only few examples of direct validation, e.g., a study of breast ductal branching pattern.20 Direct validation of phantom realism is challenging, largely due to the fact that detailed visualization of whole breast histology sections is relatively rare.21-27 The seminal work by Sir Astley Cooper1 still represents one of the most detailed treatises of breast anatomy. Analysis of the shape and orientation of breast tissue compartments may also elucidate the correlation between the properties of anatomical structures and the corresponding parenchymal texture. Conventionally used texture descriptors are often hard to interpret in terms of the corresponding histologic properties. On the other hand, there are reports on the structural properties of the breast tissue, as visualized in clinical images.28 These reports have motivated the development of methods for structural analysis of 2D mammographic parenchymal patterns, e.g., based upon the morphological size analysis11 or a multi-scale fitting of spherical blobs29. The ellipsoidal fitting can be used for quantifying 3D structural properties of breast anatomy, and to facilitate comparison between the 2D and 3D parenchymal properties.
4. CONCLUSIONS A new method has been proposed for shape analysis of breast anatomy, based upon the fitting of ellipsoids to the adipose tissue compartments. The method has been used for assessing the user control in the design of software breast phantoms. The proposed approach could be extended to the analysis of clinical breast images in order to inform the selection of phantom parameters for improved realism.
Proc. of SPIE Vol. 8313 83134J-10
Downloaded From: http://spiedigitallibrary.org/ on 07/15/2016 Terms of Use: http://spiedigitallibrary.org/ss/TermsOfUse.aspx
ACKNOWLEDGMENT This work was supported in part by the US Department of Defense Breast Cancer Research Program (HBCU Partnership Training Award #BC083639), the US National Institutes of Health (R01 grant #CA154444), the US National Science Foundation (CREOSA grant #HRD-0630388), and the US Department of Defense/Department of Army (45395-MA-ISP, #54412-CI-ISP).
REFERENCES 1. Cooper A. On the Anatomy of the Breast. Vol 1-2. London: Longman; 1840. 2. Wolfe JN. Risk for breast cancer development determined by mammographic parenchymal pattern. Cancer.
1976;37(5):2486-2492. 3. Niklason LT, Christian BT, Niklason LE, et al. Digital tomosynthesis in breast imaging. Radiology.
1997;205(2):399-406. 4. Boone JM, Nelson TR, Lindfors KK, Seibert JA. Dedicated breast CT: radiation dose and image quality
evaluation. Radiology. 2001;221(3):657-667. 5. Chaudhury BB, Samanta GP. Elliptic fit of objects in two and three dimensions by moment of inertia
optimization. Pattern Recognition Letters. 1991;12(1):1-7. 6. Pokrajac DD, Maidment ADA, Bakic PR. A Method for Fast Generation of High Resolution Software Breast
Phantoms. Medical Physics. 2011;38:3431. 7. Bakic PR, Brzakovic D. Simulation of digital mammogram acquisition. In: Boone JM, Dobbins III JT, eds.
SPIE Medical Imaging: Physics of Medical Imaging. Vol 3659. San Diego, CA; 1999:866-877. 8. Bakic PR, Brzakovic D, Zhu Z. Anatomic Segmentation of Mammograms via Breast Model. In: Kerssemeijer
ea, ed. 4th International Workshop on Digital Mammography. Nijmegen, The Netherlands: Kluwer, Dordrecht; 1998:291-294.
9. Bakic PR, Brzakovic D, Brzakovic P, Zhu Z. An Approach to Using a Generalized Breast Model to Segment Digital Mammograms. 11th Symposium on Computer-Based Medical Systems. Lubbock, TX; 1998:84-89.
10. Bakic PR, Albert M, Brzakovic D, Maidment ADA. Mammogram synthesis using a 3D simulation. I. Breast tissue model and image acquisition simulation. Medical Physics. 2002;29(9):2131-2139.
11. Bakic PR, Albert M, Brzakovic D, Maidment ADA. Mammogram synthesis using a 3D simulation. II. Evaluation of synthetic mammogram texture. Medical Physics. 2002;29(9):2140-2151.
12. Bakic PR, Albert M, Brzakovic D, Maidment ADA. Mammogram synthesis using a three-dimensional simulation. III. Modeling and evaluation of the breast ductal network. Medical Physics. 2003;30(7):1914-1925.
13. Zhang C, Bakic PR, Maidment ADA. Development of an Anthropomorphic Breast Software Phantom Based on Region Growing Algorithm. Paper presented at: SPIE Medical Imaging, 2008; San Diego, CA.
14. Bakic PR, Zhang C, Maidment ADA. Development and Characterization of an Anthropomorphic Breast Software Phantom Based upon Region-Growing Algorithm. Medical Physics. 2011;38(6):3165-3176.
15. Meagher D. Geometric Modeling Using Octree Encoding. Computer Graphics and Image Processing. 1981;19:129-147.
16. Megalooikonomou V, Kontos D, Pokrajac D, Lazarevic A, Obradovic Z. An adaptive partitioning approach for mining discriminant regions in 3D image data. Journal of Intelligent Information Systems. 2008;31:217-242.
17. Badal A, Kyprianou I, Banh DP, Badano A, Sempau J. penMesh--Monte Carlo radiation transport simulation in a triangle mesh geometry. IEEE Transactions on Medical Imaging. 2009;28:1894-1901.
18. Duda RO, Hart PR, Stork DG. Pattern Classification. New York, NY: John Wiley & Sons, Inc.; 2001. 19. Dice LR. Measures of the Amount of Ecologic Association Between Species. Ecology. 1945;26(3):297-302. 20. Taylor P, Owens R. Simulated Mammography using Synthetic 3D Breasts. Paper presented at: 4th International
Workshop on Digital Mammography, 1998; Nejmegen, Netherlands. 21. Wellings SR, Jensen HM, Marcum RG. An Atlas of the Subgross Pathology of the Human Breast. J. Natl.
cancer Inst. 1975;55:231-273. 22. Ohtake T, Abe R, Kimijima I, et al. Intraductal extension of primary invasive breast carcinoma treated by
breast-conservative surgery. Computer graphic three-dimensional reconstruction of the mammary duct-lobular systems. Cancer. 1995;76(1):32-45.
Proc. of SPIE Vol. 8313 83134J-11
Downloaded From: http://spiedigitallibrary.org/ on 07/15/2016 Terms of Use: http://spiedigitallibrary.org/ss/TermsOfUse.aspx

23. Moffat DF, Going JJ. Three dimensional anatomy of complete duct systems in human breast: pathological and developmental implications. J Clin Pathol. 1996;49:48-52.
24. Ohtake T, Kimijima I, Fukushima T, et al. Computer-Assisted Complete Three-Dimensional Reconstruction of the Mammary Ductal/Lobular Systems: Implications of Ductal Anastomoses for Breast-Conserving Surgery. Cancer. 2001;91:2263-2272.
25. Going JJ, Moffat DF. Escaping from Flatland: clinical and biological aspects of human mammary duct anatomy in three dimensions. Journal of Pathology. 2004;203:538-544.
26. Clarke GM, Peressotti C, Mawdesley GE, Yaffe MJ. Design and characterization of a digital image acquisition system for whole-specimen breast histopathology. Physics in Medicine and Biology. 2006;51:5089-5103.
27. Clarke GM, Peressotti C, Constantinou P, Hosseinzadeh D, Martel A, Yaffe MJ. Increasing specimen coverage using digital whole-mount breast pathology: implementation, clinical feasibility and application in research. Comput Med Imaging Graph. 2011;35(534-41).
28. Gram IT, Funkhouser E, Tabar L. The Tabar classification of mammographic parenchymal patterns. European Journal of Radiology. 1997;24(2):131-136.
29. Chen Z, Denton E, Zwiggelaar R. A Multi-Scale Blob Based Representation of Mammographic Parenchymal Patterns for Breast Density Classification. MICCAI Workshop on Breast Image Analysis. Toronto, Canada; 2011.
Proc. of SPIE Vol. 8313 83134J-12
Downloaded From: http://spiedigitallibrary.org/ on 07/15/2016 Terms of Use: http://spiedigitallibrary.org/ss/TermsOfUse.aspx