shape and size effects on concrete properties under an
TRANSCRIPT
Civil and Environmental Research www.iiste.org
ISSN 2224-5790 (Paper) ISSN 2225-0514 (Online)
Vol.3, No.7, 2013
27
Shape and Size Effects on Concrete Properties under an Elevated Temperature
AHMED HASSAN
Lecturer, Civil Engineering Department, Beni-suef University, Egypt * E-mail of the corresponding author: [email protected]
Abstract Concrete is a versatile material with tremendous applications in civil engineering construction. The size and shape of control specimens change according to different codes. Experimental, analytical and theoretical analyses were performed to suggest an equation to determine the suitable exposure time of an elevated temperature for small-scale specimens. First, the effect of the elevated temperature on the main properties of concrete was assessed. Cylinders and cubes with lengths of 10 and 15 cm were chosen as the test specimens. The specimens were exposed to temperatures of 200 °C, 400 °C and 600 °C and exposure times of 30, 45 and 60 minutes. Analytical calculations were performed to estimate the required time to reach a uniform temperature for different shapes and sizes. Thermal finite element analyses were conducted to study the thermal distribution on concrete specimens and to verify the proposed theoretical formulation. An equation for adjusting the elevated temperature’s exposure time was suggested. Keywords: Sample size, elevated temperature, endurance, Mechanical properties of concrete. 1. Introduction It is a well-known fact that size affects the nominal strength of specimens made with quasi-brittle materials, such as concrete, rock, and composite materials [1-7]. In the compressive and flexural failures of quasi-brittle materials, the size effect is quite apparent. Investigations of the size effect on the nominal strength have become a focus of interest for many researchers [4-9]. An experimental study [10] showed that the compressive strength decreases as the specimen size increases. This reduction in the strength, which is dependent on the specimen size, is referred to as the reduction phenomenon because of the statistical effect of an inherent large number of flaws in a larger sample. The elevated temperature rating of structural concrete buildings must address catastrophic events, i.e., terrorism, earthquakes, etc. However, a literature study shows that little attention has been paid to the size effect on the mechanical properties of concrete members at an elevated temperature. The thermal similitude effect was clearly identified in a previous work [11]. Extensive research was performed on half and quarter scale samples [12], in which the scale factor equation introduced by ASTM 119 -95a was adopted [13]. Small size samples cannot be treated in a similar way. There was a reduction in the elevated temperature resistance rating in the reduced cross-section, i.e., ¼ of the exposure time of that for the full-scale specimens, based on the small scale specimens’ elevated temperature exposure testing in a furnace [14]. The transient heat flow through the concrete thickness is promoted by the variation in the furnace temperature Tf, which is controlled by D (the thermal diffusivity). Therefore, the shape of the temperature profile at any time (t) can be described by the one dimensional unsteady heat flow partial differential equation: δ T/ δt = D δ2T/ δ x2 (1) where δT/ δt is the rate of change of the temperature with respect to time and δ2T/ δx2 is the curvature of the temperature profile in relation to the geometry. A dimensional analysis between the model and the prototype was conducted with the aid of Buckingham's pi theorem, and using the variables involved in the thermal model, a dimensionless product, or pi term, was generated. (L2 /Dt) *(Tf / T) (2) This pi term is known as the Fourier number for heat transfer, where T is the generalised temperature representative of the temperature profile at any time interval t. As the material properties for modelled concrete are the same as those as the prototype (i.e., (Dm) = (Dp)) and because of similar temperature profiles in the model and prototype, it is necessary for both the model’s and prototype’s elevated temperature curves to retain a similar temperature. The model’s elevated temperature curve must therefore retain the temperature axis, which is the same as that of the standard elevated temperature curve applied to the prototype, and the scaling effects are then only applied to the time axis, giving the following equations. ((L2 /t) *(Tf / T)) m= ((L2 /t) *(Tf / T)) p (L2 /t) m= (L2 /t) p tm= (Lm2 / Lp2) * tp = (1 / S2) * tp (3) This equation is valid at large and normal scales. The sizes and shapes of the concrete control specimens changed according to different specification codes. The previous scale factor equation was not valid for small scales. Therefore, this study suggests a modification to this
Civil and Environmental Research www.iiste.org
ISSN 2224-5790 (Paper) ISSN 2225-0514 (Online)
Vol.3, No.7, 2013
28
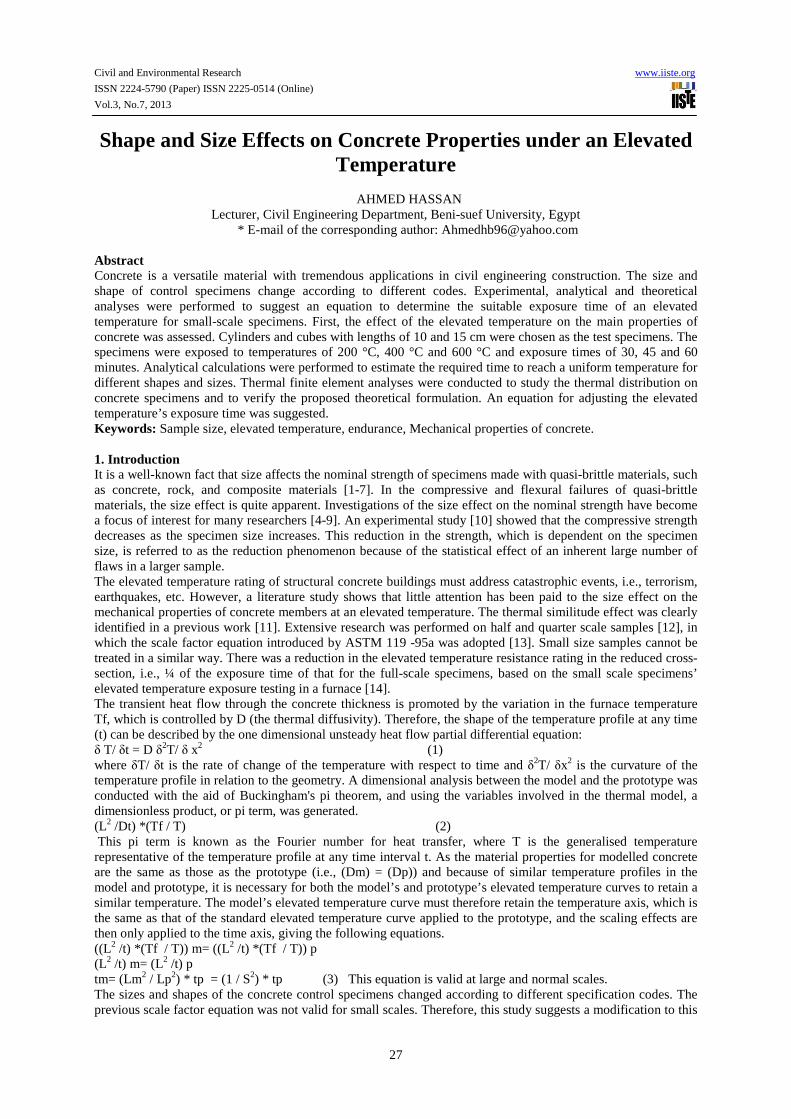
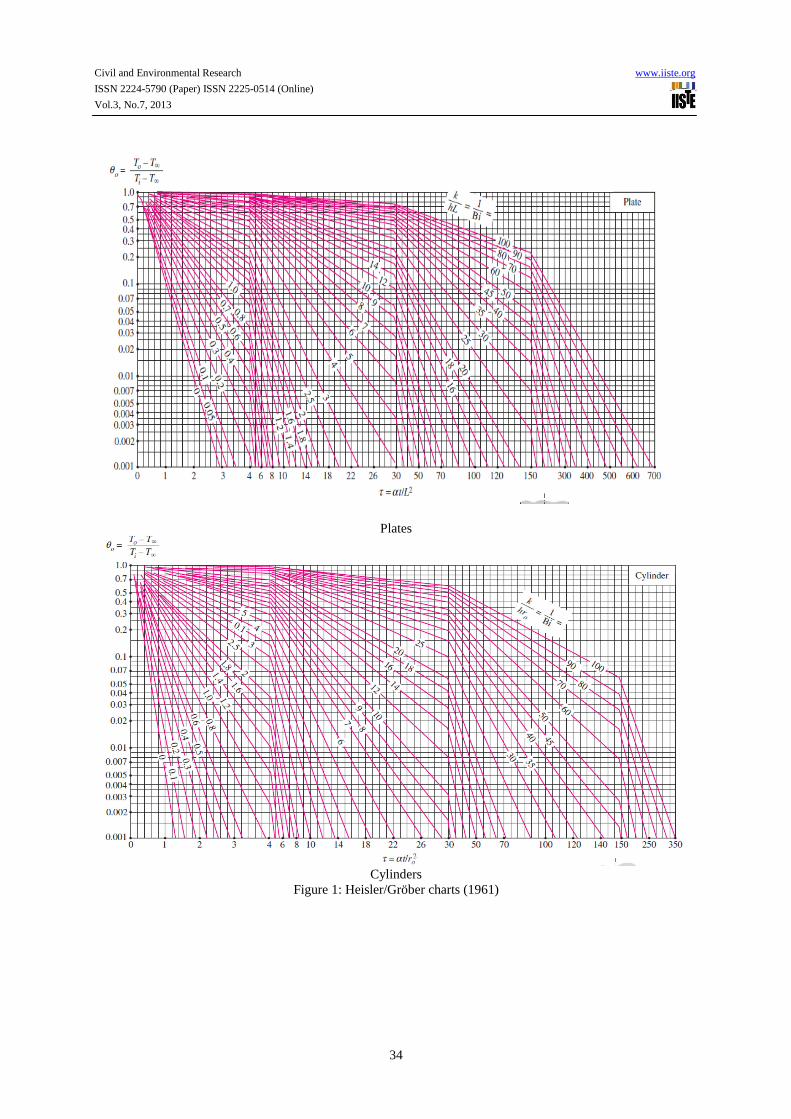
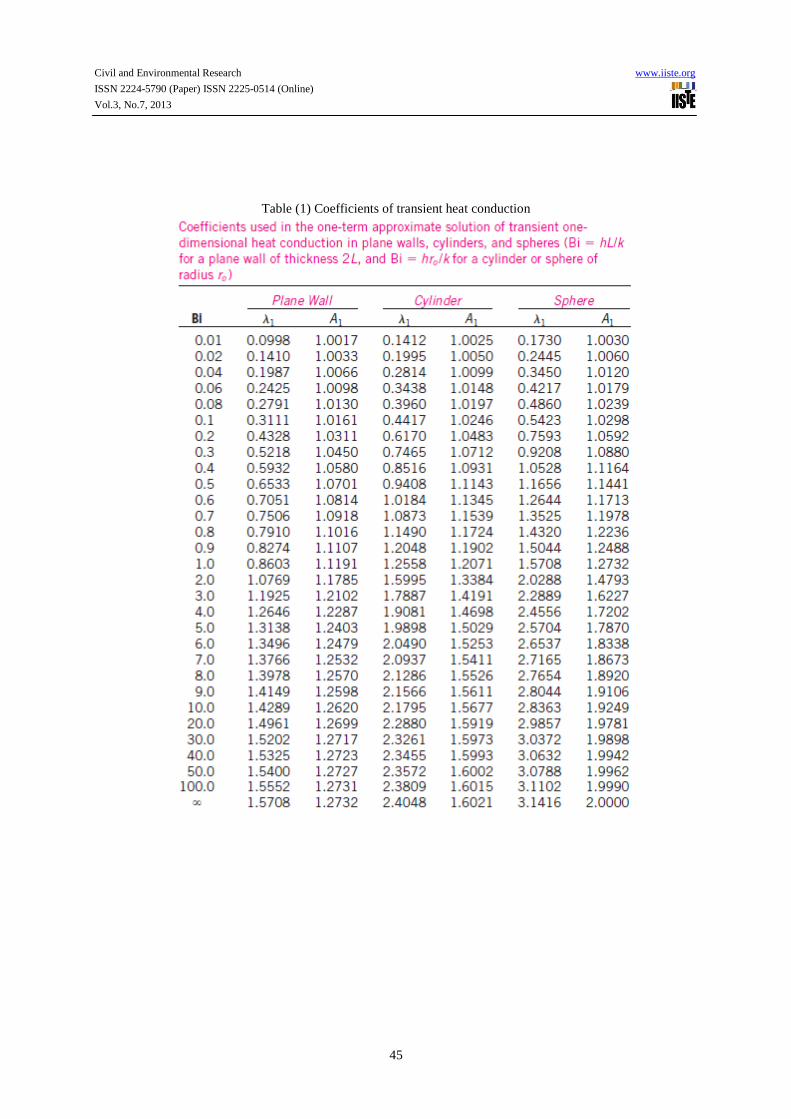
equation to create a relationship between different small scales and determine the required exposure time to reach a cross sectional uniform temperature. The sizes and shapes of the concrete affected the mechanical properties of concrete under an elevated temperature. Two commonly used shapes were used in this study. Cubes with dimensions of 10*10*10 cm and 15*15*15 cm and cylinders with dimensions of 10*20 cm and 15*30 cm were tested. Pronounced differences were observed within the temperature range of 25 to 600°C at exposure times of 30, 45, and 60 minutes. An analytical approach was used using Heisler /Gröber charts to calculate the required time to reach a uniform temperature through a specimen section for cubes and cylinders 10, 15, 20 and 30 cm in size. A thermal analysis using a finite element investigation was performed to a set of cubes of different lengths, and the analysis was the basis for verifying a series of elevated temperature experiments for different scale samples. 2. Analytical approach and calculation of thermal coefficients. For similar transient conduction problems, solutions for the temperature at any point in systems with similar geometries depend only on the dimensionless time and the Biot number [17]. The Biot number, used in unsteady-state heat transfer calculations, relates the heat transfer resistance inside a body to the surface of the body. If the diffusivities and the Biot numbers are the same, transient conduction times in similarly shaped bodies are proportional to the body surface area. Likewise, if two bodies of similar geometries have the same Biot number, they undergo exactly the same dimensionless temperature history Ө (t*). The complete solution for a finite-sized body of regular geometry can be represented by a Fourier series [17]. The three most common shapes for which exact transient solutions are known are a slab of finite thickness, a long cylinder, and a sphere. In practical engineering problems, convection is suddenly applied at the surface. 2.1 Adopted assumptions It is assumed that the bodies are at a uniform initial temperature Ti. At t=0, the surfaces are suddenly exposed to a uniform convection environment ho and To. The temperature varies with time and a single spatial coordinate. On the basis of this program, it is assumed that the prismatic test specimens behave similar to the long cylinder. This is justified by the fact that the heat will transfer to the centre of the specimen by the shortest path, and the corners of the prismatic specimens will not influence the heat transfer. In direct elevated temperature conditions, the specimens are heated rapidly at the surface, while the heat transfer into the specimen varies with time and the radius. 2.2 Solution of Fourier series and Heisler charts To overcome the complexity of the three Fourier series, Heisler, 1947 [18], constructed a series of nine parametric graphs called the Heisler charts. The charts show the variation of Ө (temperature difference variable) with x/L (or r/r0 for a cylinder or sphere), αt/ (L2) or αt/(ro2) for a cylinder or sphere), and Bi in a reasonably complete manner. These charts were further extended and improved by Gröber et al. [19] and renamed the Heisler/Gröber charts. The summing of multiple terms in the three Fourier series solutions for the common geometries is necessary only for the very early stages of the transient solution (approximately the first 10-20% of the total heating of the body). If the dimensionless time, (t*= αt/ (L2), where α is the thermal diffusivity, t= real time, and L= length) is greater than 0.2, a single term of the series is sufficient with an accuracy of 1% or better. The latter 80-90% of the heating period occurs at the region of interest, and the point of greatest interest is the centre of the body, which is the slowest to react to the surface convection. Therefore, all points in the body decay at exactly the same rate as the centre point if the dimensionless time is greater than 0.2. Thus, a value for the heat transfer coefficient is necessary to proceed with the application of the Heisler/Gröber charts (Fig. 1). However, the quantification of the heat transfer coefficient in this experimental programme is complicated because of the uncertainty in the flow characteristics and flame projection near the surface. Therefore, a reasonable range of heat transfer coefficients that empirically compensate for the convection and radiation variations will be used for the analysis. In many practical cases, both the convective and radioactive mechanisms occur simultaneously, and conditions may be such that the heat transfer by each of these mechanisms may be of the same order of magnitude, as shown by Chapman [20]. The Heisler/Gröber charts are applied to each scale specimen. On the basis of this analysis, a temperature difference variable of 0.5 will be assumed to analytically retain the centre temperature of the specimens to half of the total subjected temperature at the surface of the members. This value is just a baseline figure that provides reasonable results for the dimensional analysis. Other values will be investigated to justify the assumption. By using the Biot number and the coefficients for the Heisler centreline formulas, as reported in table (1), the dimensionless time, and the temperature difference variable, a real heat transfer time will be established for the small scale specimens (10 cm) and the intermediate-scale specimens (15 cm), representing the time it would take the elevated temperature to affect the centre of the concrete specimens. Lastly, a ratio of the full-scale time to the small-scale time will be determined for each of the heat transfer coefficient cases.
Civil and Environmental Research www.iiste.org
ISSN 2224-5790 (Paper) ISSN 2225-0514 (Online)
Vol.3, No.7, 2013
29
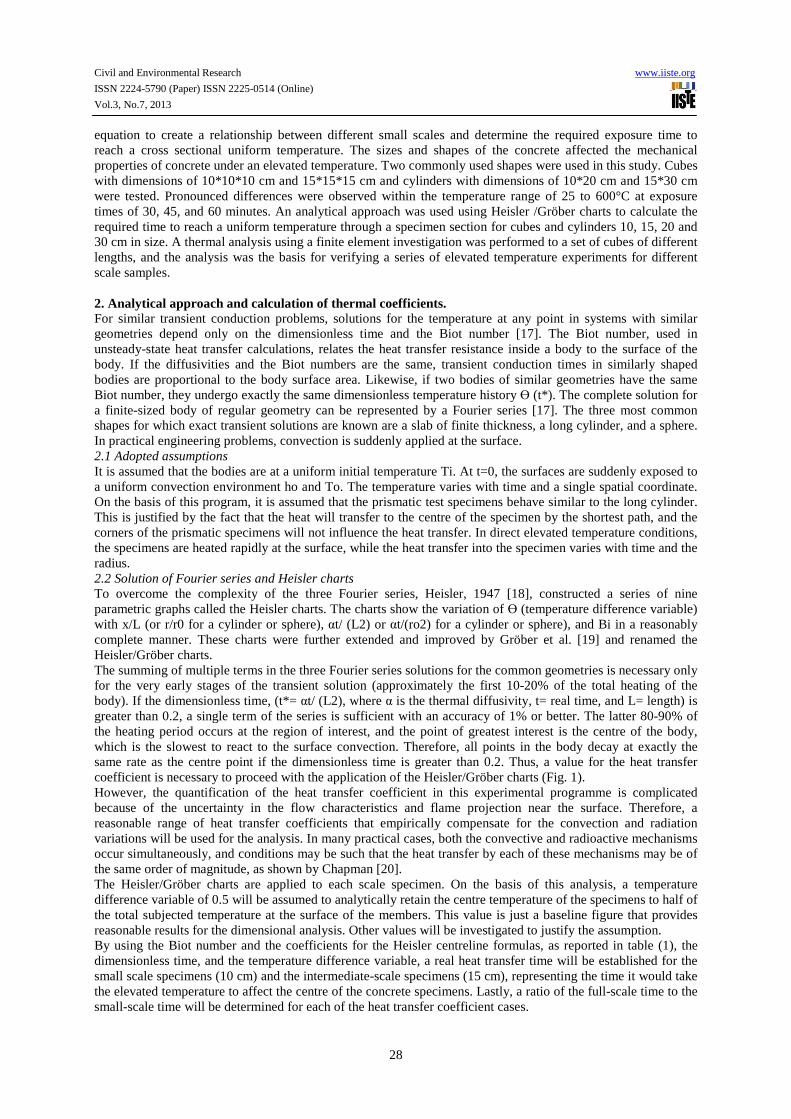
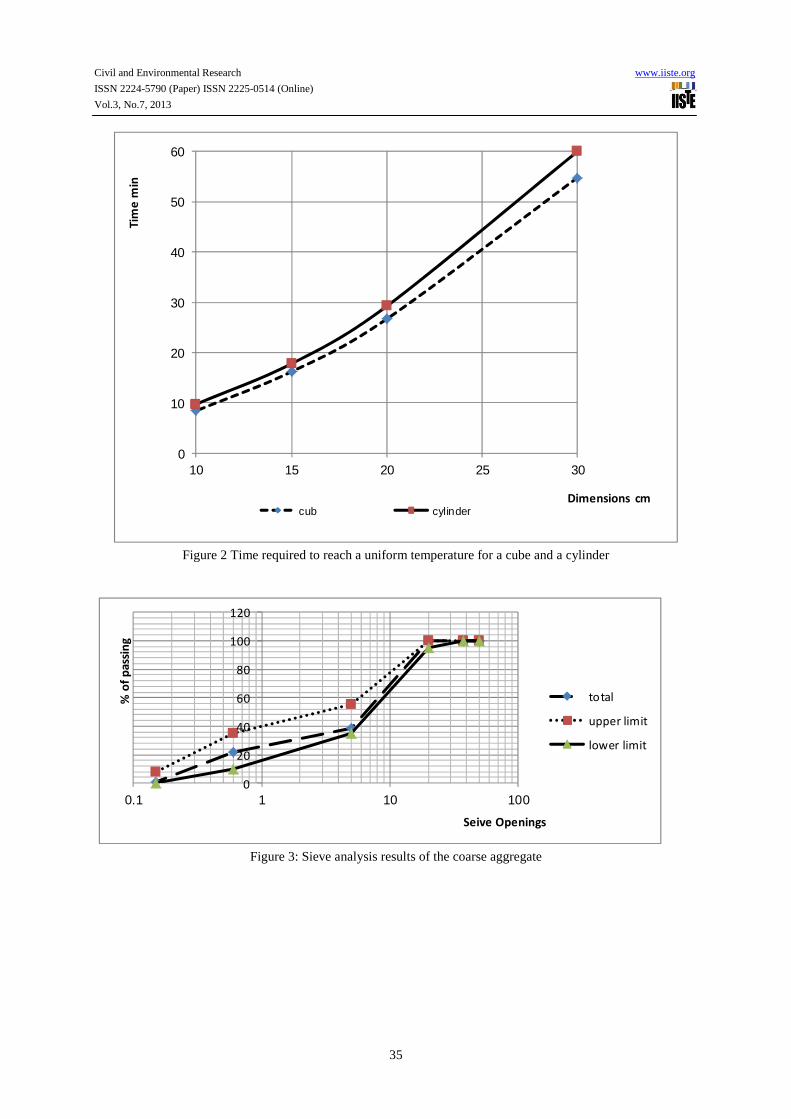
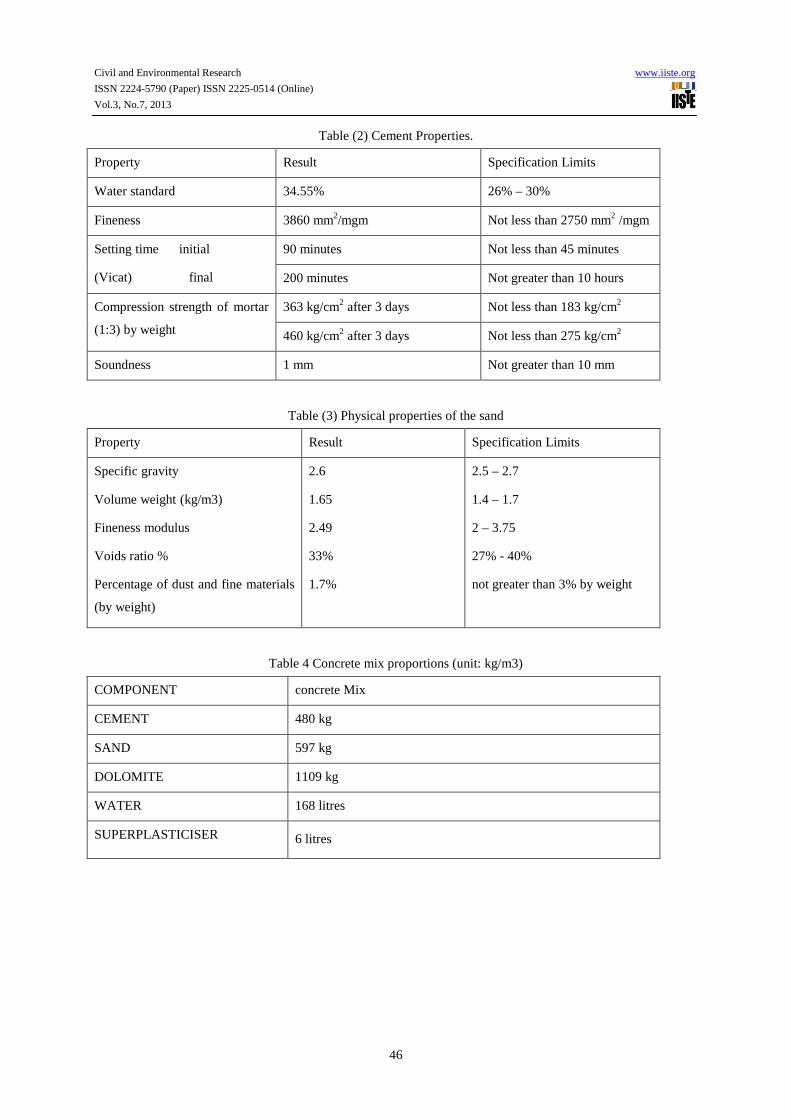
2.3 Similitude Analysis Thermal Diffusivity: where k= Thermal conductivity ρCp= Heat Capacity J/ (H*k)) Heat Conduction Equation: Dimensionless Time: Biot Number: where T= Temperature (°F or K) α= Thermal Diffusivity h= Heat Transfer W/(m2k) The Heisler charts show the variation of Ө with x/L (r/ro cylinder/sphere), t*, and Bi A study was performed on cubes and cylinders of different sizes using Heisler charts and concrete properties. The required exposure time was calculated and is reported in fig (2). The exposure time required to reach a uniform temperature for cubes was less than that for cylinders by 10 %. 8.44, 16.2, 26.7 and 54.8 minutes were required to reach a uniform temperature for cubes with dimensions of 10, 15, 20, and 30 cm, respectively. 3. Experimental Program 3.1 Material properties The concrete mixtures were prepared with ordinary Portland cement (PC), which is equivalent to ASTM Type I. The results of the cement tests are listed in table (2). A coarse aggregate of crushed stone (dolomite) was used as the filler. Figure (3) shows the sieve analysis results of the coarse aggregate. The fine aggregate was natural desert sand, and table (3) shows the main properties of the sand and the corresponding recommended limits of the standard specification. A naphthalene-based super plasticiser was used to achieve the required workability of the concrete mixes. 3.2 Mix proportions The proportions of the concrete mix were designed to give an adequate compressive strength of 700 kg\cm2. The maximum aggregate size was restricted to 10 mm to reduce scale effects on the aggregate interlock action. Concrete mixes were prepared in three series of different shapes and sizes. Each series comprised a prepared control mix. The details of the mix proportions are shown in table 4. 3.3 Specimen preparation The aggregate and cement were first dry mixed for 2 or 3 min and then mixed with water, and a super-plasticiser was added to the mixture. The mixing continued for an additional 3 min. All of the specimens were cast in three layers in moulds and were compacted using a vibrating table machine. The specimens were then transferred to the moist-curing room. The concrete mixtures were prepared in a pan mixer. For each mix, a total of 204 specimens, including 30 specimens of cubes with dimensions 10*10*10 cm, 30 specimens of cubes with dimensions 15*15*15 cm, 72 specimens of cylinders with dimensions of 10*20 cm and 72 specimens of cylinders with dimensions of 15*30 cm. The specimens were removed from the steel moulds after 1 day, and the specimens were then cured in water at 25 °C for 28 days. All of the specimens were air dried for 2 days before being exposed to heat to allow for the moisture to escape. The casting and curing system was in accordance with ACI specifications. 3.4 Test procedure Three cubes and three cylinders were tested immediately after conditioning, and the results obtained under normal curing (unheated) will be referred to as the control results. The remaining specimens were subjected to different temperatures for different durations. The rate of temperature increase in the electric furnace was adjusted to be close as possible to the ASTM E119-95a curve, as reported in fig (4). The maximum temperature of the furnace was 1200 °C. A programmable control unit was manufactured with the furnace, which allowed for the automatic control of the opening and closing times of the furnace door, pre-setting the temperature before beginning the test, and temperature control with time. The furnace was heated to the desired temperature. At the end of the elevated temperature test after the desired time, the furnace was turned off and allowed to cool before the specimens were removed to prevent thermal shock to the specimens. Three elevated temperatures, 200°C, 400°C, and 600°C, were tested for each sample type. Three exposure durations, 30, 45 and 60 minutes, were applied on each specimen after reaching the desert temperature. After the temperature test, each group of specimens was subjected to a compression test, modulus of elasticity and indirect tension test to assess the mechanical properties. The tested specimens results were compared with those observed at room temperature. At least three specimens were tested for each variable, and the average was considered for reliability. 4. Results 4.1 Effect of elevated temperature on the compressive strength of concrete Two different factors were investigated to determine how elevated temperatures influence the concrete

Civil and Environmental Research www.iiste.org
ISSN 2224-5790 (Paper) ISSN 2225-0514 (Online)
Vol.3, No.7, 2013
30
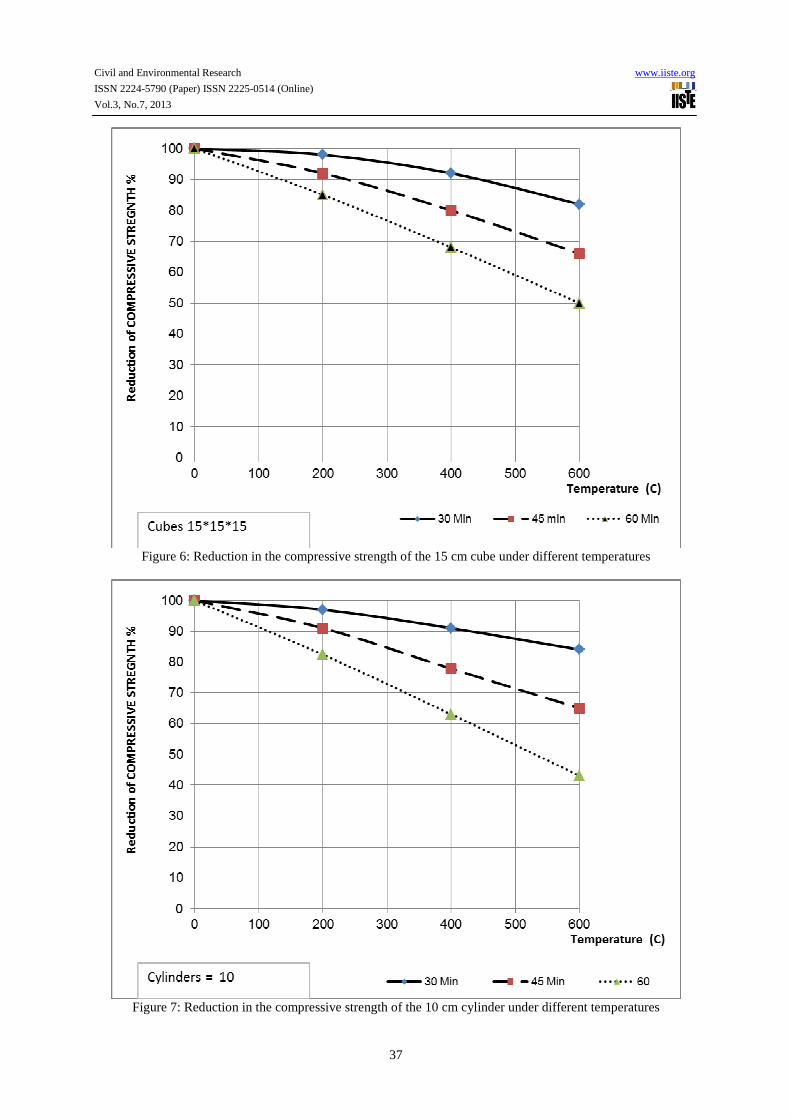
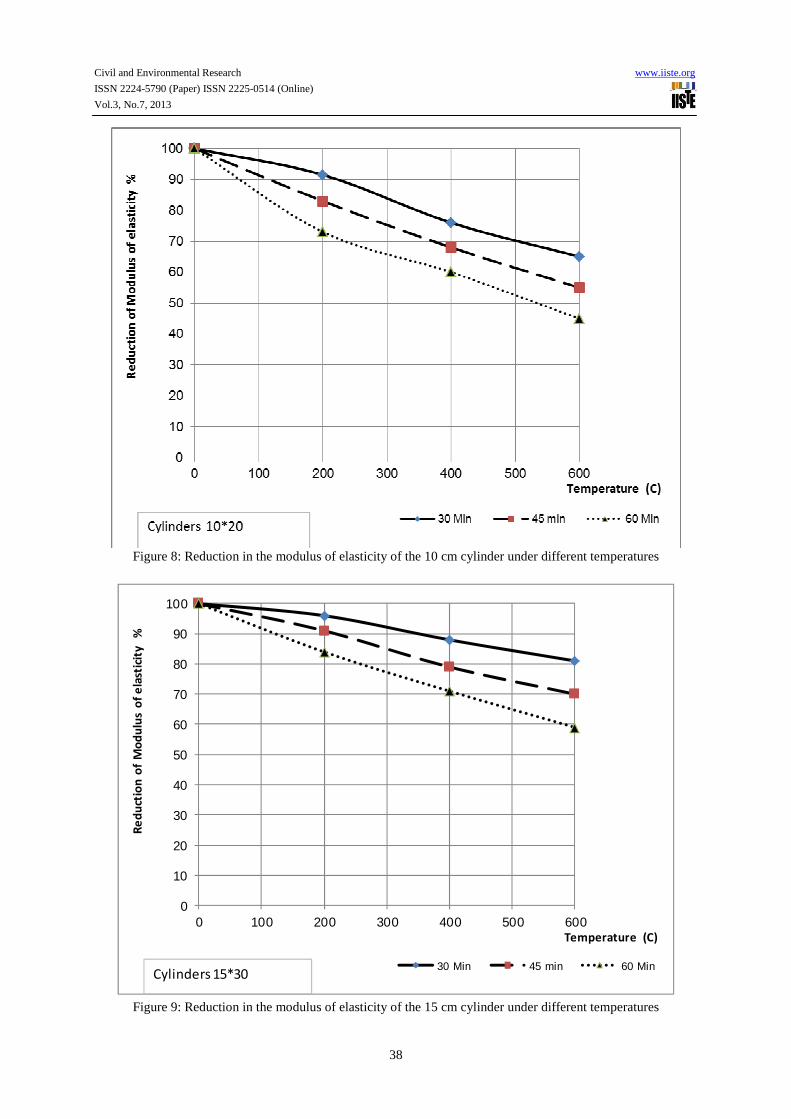
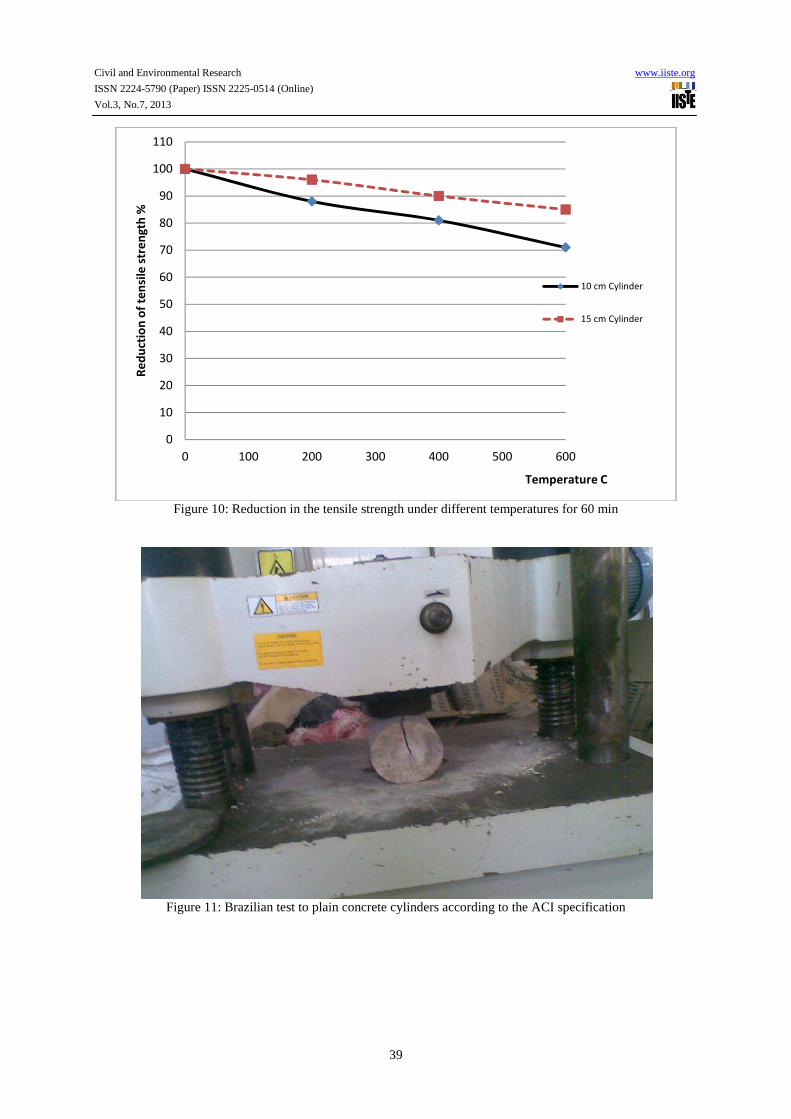
compressive strength test results. The factors were two different shapes and two different sizes. The employed moulds were two different cube sizes (10 cm and 15 cm) and cylinder sizes (10*20 cm and 15*30 cm). Three samples were casted for each case to minimise scatter and errors in the results and analyses. The compressive strength was measured before and after heating for each case to determine the effect of the elevated temperatures on the compressive strength of concrete. The control concrete compressive strength in normal conditions was 680 kg/cm2. Figures 5 and 6 depict the reduction of the compressive strength under an elevated temperature for a cube of plain concrete with dimensions of 10 cm and 15 cm. Figure 5 shows the reduction in the compressive strength for 10*10*10 cm cubs under an elevated temperature for different exposure times. The specimens were subjected to 200 °C to 600 °C for exposure times ranging from 0 to 60 minutes. The compressive strength for specimens begins to have a slight effect when subjected to 200 °C at 30 min. The compressive strength decreased by 80% at 60 min for 200 °C. The compressive strength decreased significantly at 400 °C, and this reduction was 90%, 72% and 58 % at 30, 45 and 60 min, respectively. The compressive strength decreased at 600 °C in the beginning of the elevated temperature test until it reached 77%, 59% and 36% after 30, 45 and 60 min, respectively. Figure 6 shows the improvement of the compressive strength under an elevated temperature by increasing the cube dimensions to 15 * 15 *15 cm. The compressive strength under the temperature effect gradually decreased to 85% for specimens at 200 °C at 60 min. The reduction in the compressive strength increased to 91%, 81% and 69% at 30, 40 and 60 min, respectively, at 400 °C. At 600 °C, these reductions were 82%, 68% and 50% at 30, 45 and 60 min, respectively. The specimens’ shapes affect the compressive strength of concrete under an elevated temperature. Cylinder shapes were studied, and the results were compared with the previous results of the 10 cm cube to evaluate the shape effect. A similar investigation was made on the 10 * 20 cm cylinders specimens. The reduction in the compressive strength for a concrete cylinder is shown in Fig 7. At 200 °C, the compressive strength decreased gradually at 30, 45 and 60 min to 97%, 91%, and 83 %, respectively. The reductions in the compressive strength were 91%, 78% and 63% at 400 °C at 30, 45 and 60 min, respectively. There were significant reductions of 84%, 65% and 43% after 30, 45 and 60 min, respectively, in the compressive strength at 600 °C. 4.2 Effect of elevated temperature on the modulus of elasticity of concrete In this section, concrete specimens of different sizes were chosen to study the effect of elevated temperature on the modulus of elasticity. The measured values of the modulus of elasticity tested for the 10*20 cm and 15 * 30 cm cylinders. The measurements of the modulus of elasticity were made according to ASTM. The reported values of the modulus of elasticity were reported as an average of 3 cylinders. The modulus of elasticity measured using the 10 * 20 cm cylinders was always higher than the modulus of elasticity obtained from the 15 * 30 cm cylinders. For the data considered in this study, the modulus of elasticity for the 10*20 cm cylinder was on average 8% higher than the 15 * 30 cm specimens. The stiffness of the concrete also decreased with increasing elevated temperature. Figure 8 shows the results of the tests conducted to determine the modulus of elasticity of concrete for cylinders 10 cm in diameter, and the modulus of elasticity decreased to 91%, 83% and 72% at 200°C after 30, 45, and 60 min, respectively. At 400°C, the elastic modulus decreased at a faster rate to 77%, 69% and 60 % at 30, 45, and 60 min, respectively. At 600°C, the elastic modulus decreased to 66%, 55%, and 45 % at 30, 45, and 60 min, respectively. Figure 9 shows that the temperature-dependent modulus of elasticity exhibits a linear rather than a parabolic degradation with increasing temperature from 30 to 60 min. Generally, the modulus of elasticity decreased gradually with an increase in the temperature. The rate of decrease in the modulus of elasticity increased as the temperature increased from 200°C to 600°C. The modulus of elasticity decreased to 83% at 200°C after 60 min. At 400°C, the elastic modulus decreased by 71% compared to that at room temperature after 60 min. Lastly, at 600°C, the modulus of elasticity decreased to 59% compared with its original value after 60 min. 4.3 Effect of elevated temperature on the tensile strength of concrete The tensile strength of concrete was calculated from a Brazilian test to plain concrete cylinders according to the ASTM specification. The specimens were heated according to the ASTM rate to target temperatures of 200°C 400°C and 600 °C, which was maintained for 60 minutes, and the specimens were then allowed to cool at room temperature. Splitting tensile tests and direct tensile tests were performed to obtain the relationship between the reduction in the tensile strength and the temperature. Figure 10 shows the effect of elevated temperature on the tensile strength. The tensile strengths decreased similarly and nearly linearly with an increase in the temperature. The tensile strengths for the 10 to 15 cm cylinders were 89% to 97 % at 200°C. At 400 °C, the tensile strength decreased by 81% and 90% for the 15 cm and 10 cm cylinders, respectively. For 600°C, these reductions were 70% to 86 % for the 15 cm and 10 cm cylinders, respectively. The failure of the indirect tension test is shown in fig 11. 5. Finite element thermal modelling of the cube specimens during the elevated temperature Test The finite element method has emerged as the most powerful general numerical method for solving problems in
Civil and Environmental Research www.iiste.org
ISSN 2224-5790 (Paper) ISSN 2225-0514 (Online)
Vol.3, No.7, 2013
31
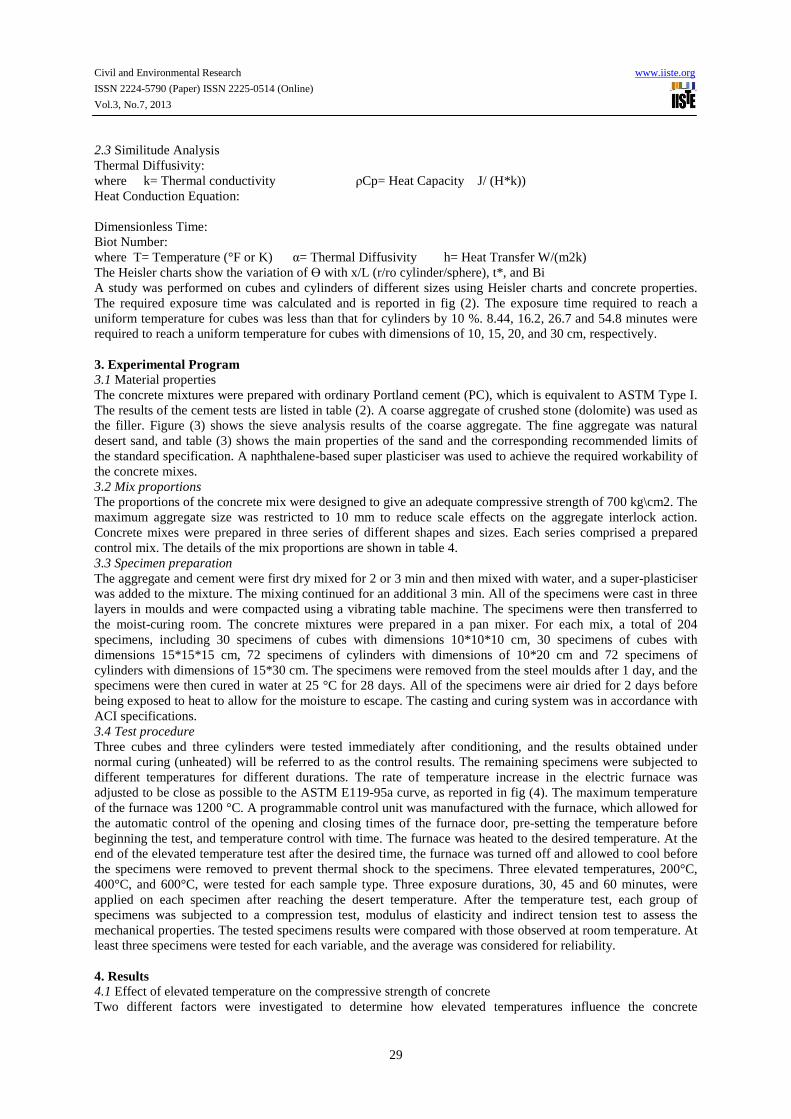
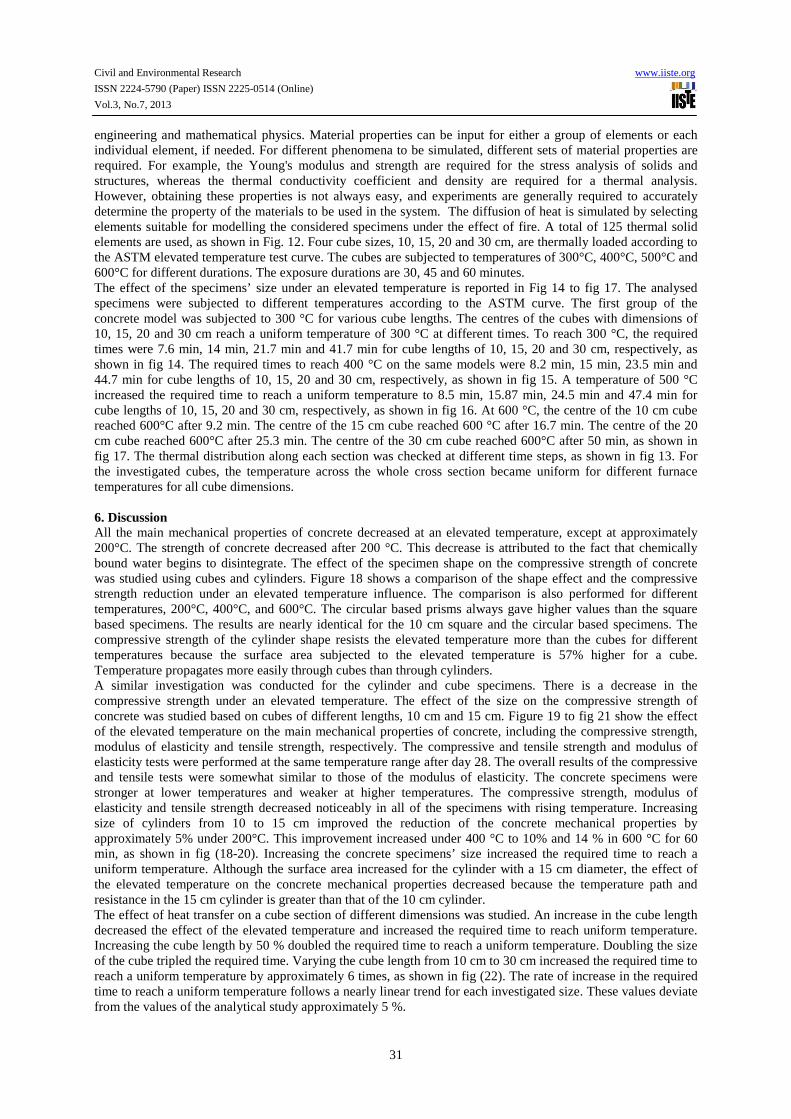
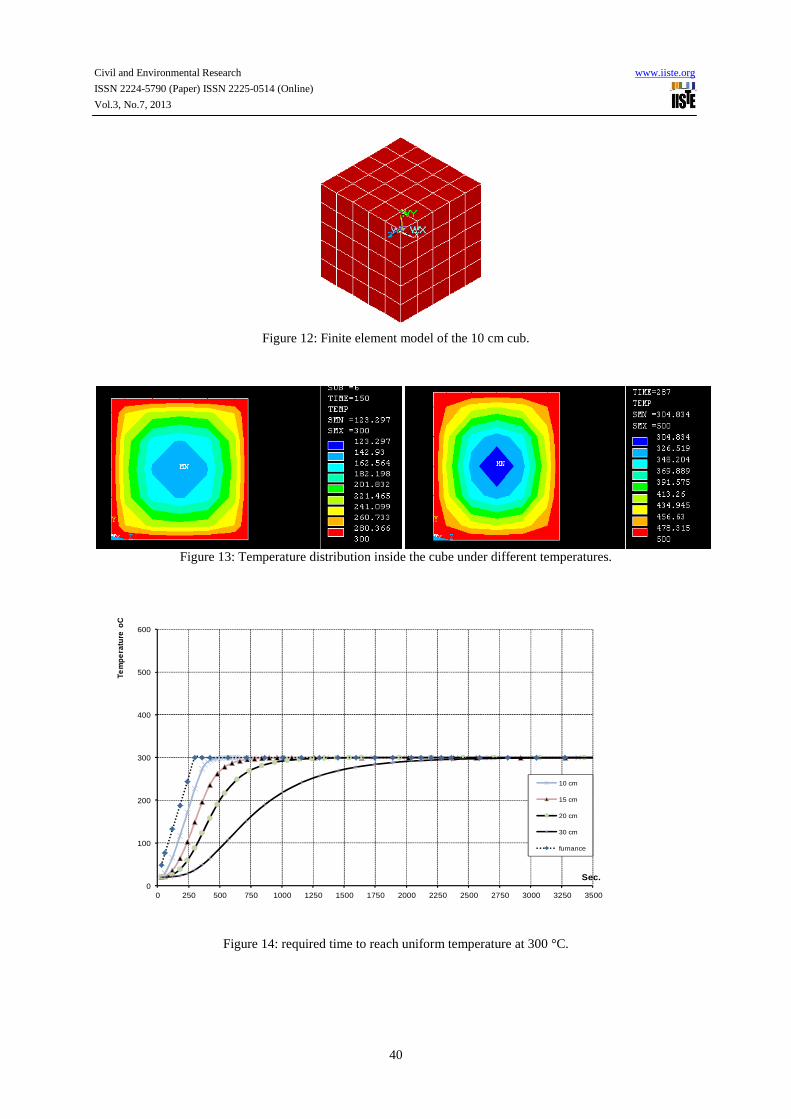
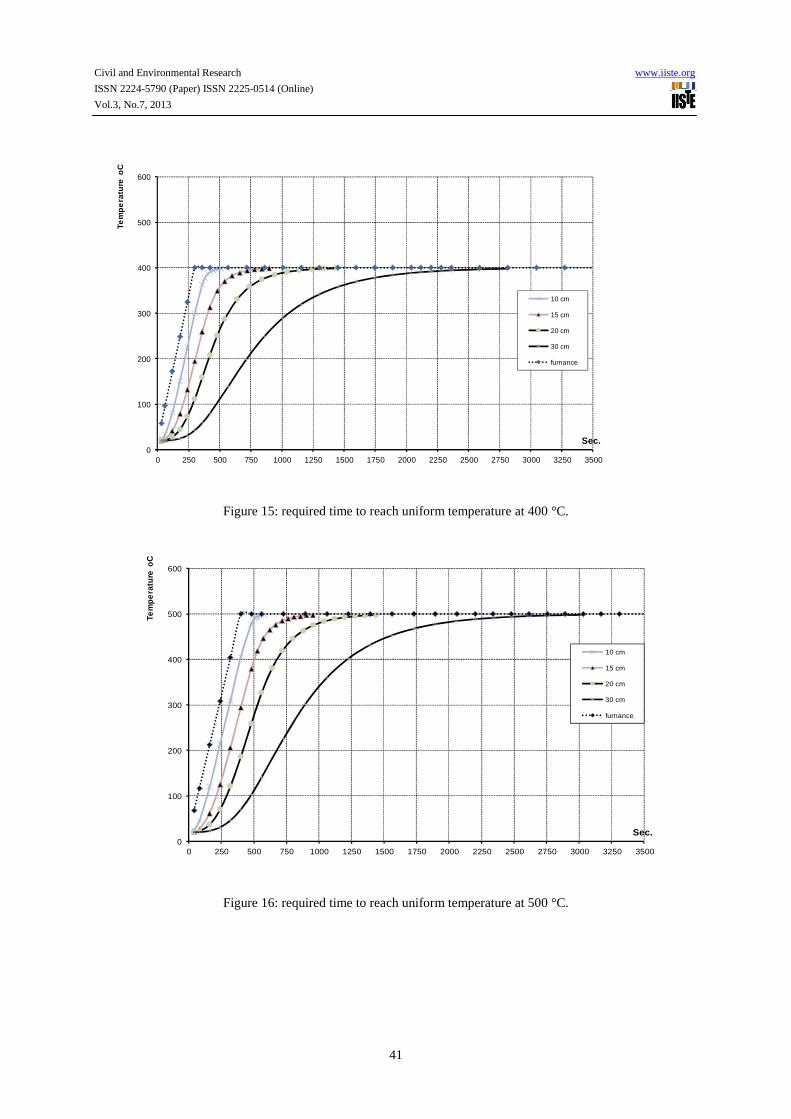
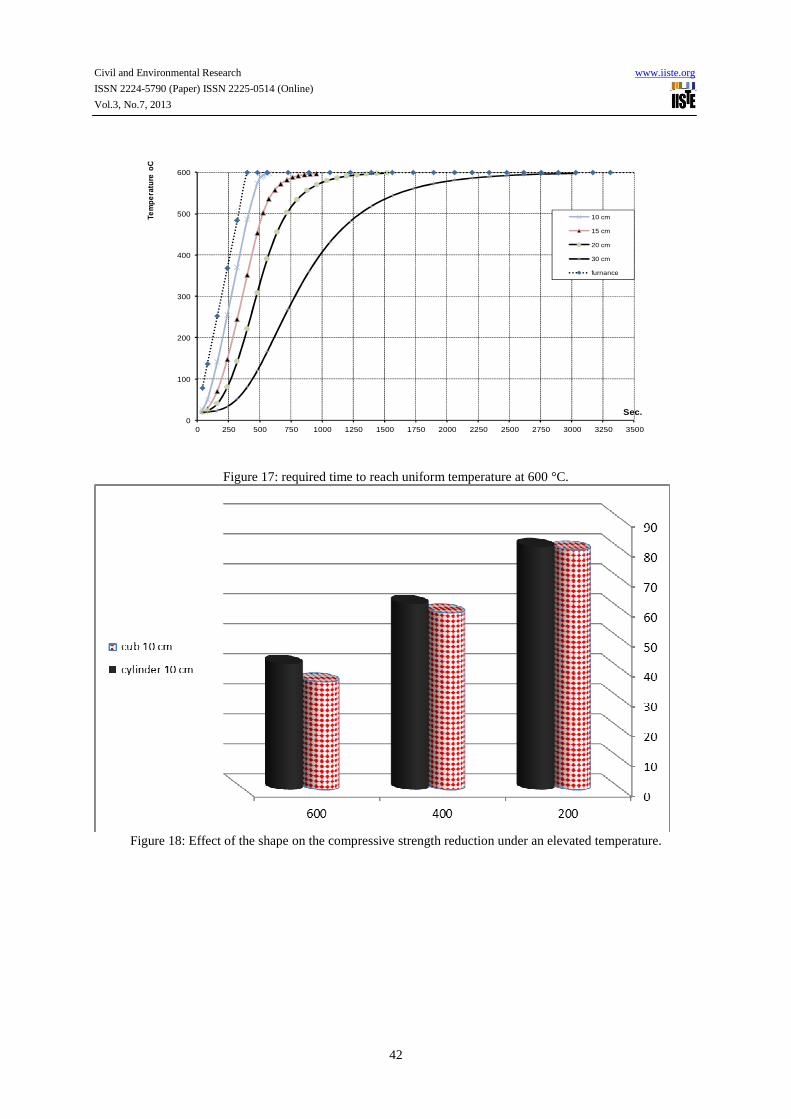
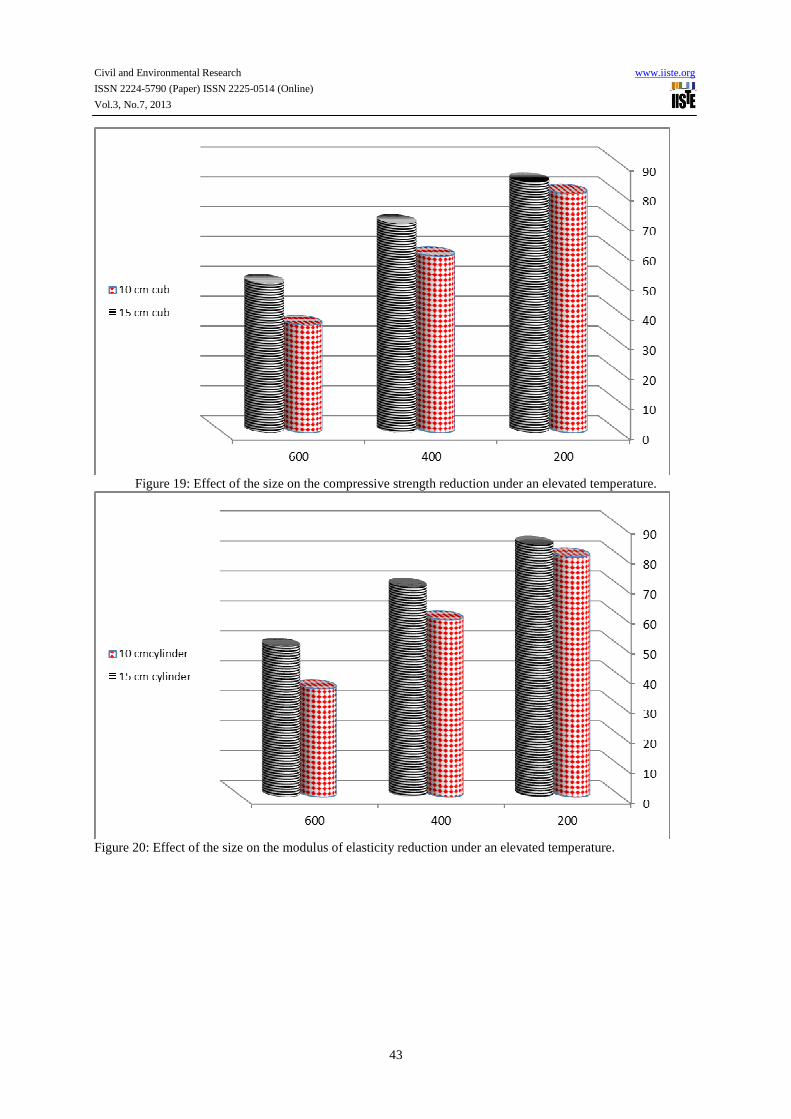
engineering and mathematical physics. Material properties can be input for either a group of elements or each individual element, if needed. For different phenomena to be simulated, different sets of material properties are required. For example, the Young's modulus and strength are required for the stress analysis of solids and structures, whereas the thermal conductivity coefficient and density are required for a thermal analysis. However, obtaining these properties is not always easy, and experiments are generally required to accurately determine the property of the materials to be used in the system. The diffusion of heat is simulated by selecting elements suitable for modelling the considered specimens under the effect of fire. A total of 125 thermal solid elements are used, as shown in Fig. 12. Four cube sizes, 10, 15, 20 and 30 cm, are thermally loaded according to the ASTM elevated temperature test curve. The cubes are subjected to temperatures of 300°C, 400°C, 500°C and 600°C for different durations. The exposure durations are 30, 45 and 60 minutes. The effect of the specimens’ size under an elevated temperature is reported in Fig 14 to fig 17. The analysed specimens were subjected to different temperatures according to the ASTM curve. The first group of the concrete model was subjected to 300 °C for various cube lengths. The centres of the cubes with dimensions of 10, 15, 20 and 30 cm reach a uniform temperature of 300 °C at different times. To reach 300 °C, the required times were 7.6 min, 14 min, 21.7 min and 41.7 min for cube lengths of 10, 15, 20 and 30 cm, respectively, as shown in fig 14. The required times to reach 400 °C on the same models were 8.2 min, 15 min, 23.5 min and 44.7 min for cube lengths of 10, 15, 20 and 30 cm, respectively, as shown in fig 15. A temperature of 500 °C increased the required time to reach a uniform temperature to 8.5 min, 15.87 min, 24.5 min and 47.4 min for cube lengths of 10, 15, 20 and 30 cm, respectively, as shown in fig 16. At 600 °C, the centre of the 10 cm cube reached 600°C after 9.2 min. The centre of the 15 cm cube reached 600 °C after 16.7 min. The centre of the 20 cm cube reached 600°C after 25.3 min. The centre of the 30 cm cube reached 600°C after 50 min, as shown in fig 17. The thermal distribution along each section was checked at different time steps, as shown in fig 13. For the investigated cubes, the temperature across the whole cross section became uniform for different furnace temperatures for all cube dimensions. 6. Discussion All the main mechanical properties of concrete decreased at an elevated temperature, except at approximately 200°C. The strength of concrete decreased after 200 °C. This decrease is attributed to the fact that chemically bound water begins to disintegrate. The effect of the specimen shape on the compressive strength of concrete was studied using cubes and cylinders. Figure 18 shows a comparison of the shape effect and the compressive strength reduction under an elevated temperature influence. The comparison is also performed for different temperatures, 200°C, 400°C, and 600°C. The circular based prisms always gave higher values than the square based specimens. The results are nearly identical for the 10 cm square and the circular based specimens. The compressive strength of the cylinder shape resists the elevated temperature more than the cubes for different temperatures because the surface area subjected to the elevated temperature is 57% higher for a cube. Temperature propagates more easily through cubes than through cylinders. A similar investigation was conducted for the cylinder and cube specimens. There is a decrease in the compressive strength under an elevated temperature. The effect of the size on the compressive strength of concrete was studied based on cubes of different lengths, 10 cm and 15 cm. Figure 19 to fig 21 show the effect of the elevated temperature on the main mechanical properties of concrete, including the compressive strength, modulus of elasticity and tensile strength, respectively. The compressive and tensile strength and modulus of elasticity tests were performed at the same temperature range after day 28. The overall results of the compressive and tensile tests were somewhat similar to those of the modulus of elasticity. The concrete specimens were stronger at lower temperatures and weaker at higher temperatures. The compressive strength, modulus of elasticity and tensile strength decreased noticeably in all of the specimens with rising temperature. Increasing size of cylinders from 10 to 15 cm improved the reduction of the concrete mechanical properties by approximately 5% under 200°C. This improvement increased under 400 °C to 10% and 14 % in 600 °C for 60 min, as shown in fig (18-20). Increasing the concrete specimens’ size increased the required time to reach a uniform temperature. Although the surface area increased for the cylinder with a 15 cm diameter, the effect of the elevated temperature on the concrete mechanical properties decreased because the temperature path and resistance in the 15 cm cylinder is greater than that of the 10 cm cylinder. The effect of heat transfer on a cube section of different dimensions was studied. An increase in the cube length decreased the effect of the elevated temperature and increased the required time to reach uniform temperature. Increasing the cube length by 50 % doubled the required time to reach a uniform temperature. Doubling the size of the cube tripled the required time. Varying the cube length from 10 cm to 30 cm increased the required time to reach a uniform temperature by approximately 6 times, as shown in fig (22). The rate of increase in the required time to reach a uniform temperature follows a nearly linear trend for each investigated size. These values deviate from the values of the analytical study approximately 5 %.

Civil and Environmental Research www.iiste.org
ISSN 2224-5790 (Paper) ISSN 2225-0514 (Online)
Vol.3, No.7, 2013
32
The scale factor for large or normal specimen sizes is decided by ASTM to adjust the exposure time for the elevated temperature test. Figure 22 shows the relation between the cube size and the time required to reach a uniform temperature in the specimen’s centre. From this study, we can conclude that the suggested equation for small scale sizes do not exceed a 5 % error. Time model = (1/scale1.57) time prototype 7. Conclusion The following conclusions are drawn from the investigation on the size and shape effects of concrete cube and cylinder specimens under elevated temperatures.
• The experimental, analytical and theoretical studies have the same trend. • The reaching of a uniform distribution in a cross section follows a nearly linear trend (temperature
versus exposure duration). • The size effect on the time required to reach a uniform distribution is quite significant. Half the amount
of time is required for a 10 cm cube compared to a 15 cm cube. For a 30 cm cube, it takes six times as long to reach a uniform temperature as for a 10 cm cube.
• The mechanical properties of concrete decrease with increasing temperature, and the peak value in the ratio of the compressive strength at a high temperature to that at ambient temperature is observed at approximately 600°C after one hour.
• Indirect elevated temperature exposure led to a reduction in the strength in both the tested cylinders and cubes and ranged from 18% after one hour of exposure at 200°C to approximately 58% after one hour exposure at 600 °C.
• Cubes reach a maximum temperature faster than cylinders, and the strength of cubes under an elevated temperature is less than that of cylinders.
• The scale factor for concrete cubes 10 to 15 cm in size have a slight effect on the concrete mechanical properties, which decreased by approximately 12 %.
• The exposure time required to reach a uniform temperature for cubes is less than that for cylinders by 10 %.
• Time model = (1/scale1.57)*time prototype is a suggested equation to determine the suitable required time for small scale specimens.
References [1] BaMzant Z P 1984 Size effect in blunt fracture; concrete, rock, metal. J. Eng. Mech., Am. Soc. Civil Eng. 110: 518–53 [2] BaMzant Z P 1993a Size effect in tensile and compressive quasi brittle failures. JCI Int. Workshop on Size Effect in Concrete Structures (Sendai: ICI) pp 141–160 [3] Zdenek P. Batant,' F. ASCE, and Yunping XF, “STAISTICAL SIZE EFFECT IN QUASI-BRITTLE STRUCTURES “,The journal of Engineering Mechanics, Vol. 117, No.11, November, 1991. ©ASCE, ISSN 0733-9399. Paper No. 26347. [4] BaMzant Z P, Xi Y 1991 Statistical size effect in quasi-brittle structures: II. Non local theory. J. Eng. Mech., Am. Soc. Civil Eng. 117: 2623–2640 [5] Bazant, Z.P., Y. Xiang and S.G. Reid, 1997. Size effect in compression fracture: Splitting crack band propagation. J. Eng. Mech. Am. Soc. Civil Eng., 123: 162-172. [6] Kim J K, Eo S H 1990 Size effect in concrete specimens with dissimilar initial cracks. Maga. ConcreteRes. 42: 233–238 [7] Kim J K, Yi S T, Park C K, Eo S H 1999 Size effect on compressive strength of plain and spirally reinforced concrete cylinders. ACI Struct. J. 96: 88–94 [8] Kim J K, Yi S T, Yang E I 2000 Size effect on flexural compressive strength of concrete specimens. ACI Struct. J. 97: 291–296 [9] KimJK, Yi S T, KimJHJ 2001 Effect of specimen sizes on flexural compressive strength of concrete. ACI Struct. J. 98: 416–424 [10] Gonnerman H F 1925 Effect of size and shape of test specimen on compressive strength of concrete .Proc. ASTM. 25: 237–250 [11] H. Elkady,” Effect of High Temperature on CFRP Retrofitted Columns, Protected with Different Coatings “, Structural Elevated temperature Engineering Journal, vol.1, no.2, pp. 89-100 ,June 2010. [12] H. Elkady and A. Hassan, “Protection of reinforced concrete beams retrofitted by carbon fibre-reinforced polymer composites against elevated temperatures “, Canadian journal of civil engineering, pp. 1171-1178, Sep 2010.

Civil and Environmental Research www.iiste.org
ISSN 2224-5790 (Paper) ISSN 2225-0514 (Online)
Vol.3, No.7, 2013
33
[13] ASTM E119-00a , standard test methods for elevated temperature tests of building construction and materials, ASTM international, west Conshohocken, Penn. Doi: 10.1520/E119-00 [14] D. V. Reddy, K. Sobhan, and J. Young, “Effect of Fire on Structural Elements Retrofitted by Carbon Fiber Reinforced Polymer Composites “, 31st Conference on OUR WORLD IN CONCRETE & STRUCTURES: 16 - 17 August 2006, Singapore. [15] Buckingham, E. "On Physically Similar Systems: Illustrations of the Use of Dimensional Equations." Phys. Rev. 4, 345-376, 1914. [16] Buckingham, E. "Model Experiments and the Form of Empirical Equations." Trans. ASME 37, 263, 1915. [17] White, F.M., Heat and Mass Transfer, Addison- Wesley, Reading, MA. 1988. [18] Heisler, M.P., Temperature Charts for Induction Heat-ing and Constant-Temperature, Trans. ASME, Vol.69, 1947, pp. 227-236. [19] Grober, H., Erk, S., and Grigull, U., Fundamentals of Heat Transfer, McGraw-Hill Book Company, Inc.,New York, 1961. [20] Chapman, A.J., Fundamentals of Heat Transfer, Macmillan Publishing Company, New York, 1987. AHMED HASSAN is a Lecturer of structural engineering and reinforced concrete design Beni-suef University. Dr AHMED HASSAN obtained his PhD from Minia University, Egypt, worked as a Lecturer for the Civil Engineering Department. Ahmed covers concrete repair, fire protection, concrete design, and advanced composite materials.
Civil and Environmental Research www.iiste.org
ISSN 2224-5790 (Paper) ISSN 2225-0514 (Online)
Vol.3, No.7, 2013
34
Plates
Cylinders
Figure 1: Heisler/Gröber charts (1961)
Civil and Environmental Research www.iiste.org
ISSN 2224-5790 (Paper) ISSN 2225-0514 (Online)
Vol.3, No.7, 2013
35
0
10
20
30
40
50
60
10 15 20 25 30
Tim
e m
in
Dimensions cmcub cylinder
Figure 2 Time required to reach a uniform temperature for a cube and a cylinder
0
20
40
60
80
100
120
0.1 1 10 100
% o
f p
ass
ing
Seive Openings
total
upper limit
lower limit
Figure 3: Sieve analysis results of the coarse aggregate

Civil and Environmental Research www.iiste.org
ISSN 2224-5790 (Paper) ISSN 2225-0514 (Online)
Vol.3, No.7, 2013
36
0
100
200
300
400
500
600
0 200 400 600 800 1000 1200 1400 1600 1800 2000
Tem
pe
ratu
re o
C
Sec.
astm 600 c
astm 400 c
astm 200 c
Figure 4: ASTM rate of the furnace temperature
Figure 5: Reduction in the compressive strength of the 10 cm cube under different temperatures
0
10
20
30
40
50
60
70
80
90
100
0 100 200 300 400 500 600
Re
du
ctio
n o
f C
OM
PR
ES
SIV
E S
TR
EG
NT
H %
Temperature (C)
30 Min 45 min 60 MinCubes 10*10*10
Civil and Environmental Research www.iiste.org
ISSN 2224-5790 (Paper) ISSN 2225-0514 (Online)
Vol.3, No.7, 2013
37
Figure 6: Reduction in the compressive strength of the 15 cm cube under different temperatures
Figure 7: Reduction in the compressive strength of the 10 cm cylinder under different temperatures
Civil and Environmental Research www.iiste.org
ISSN 2224-5790 (Paper) ISSN 2225-0514 (Online)
Vol.3, No.7, 2013
38
Figure 8: Reduction in the modulus of elasticity of the 10 cm cylinder under different temperatures
0
10
20
30
40
50
60
70
80
90
100
0 100 200 300 400 500 600
Re
du
ctio
n o
f M
od
ulu
s o
f e
last
icit
y
%
Temperature (C)
30 Min 45 min 60 MinCylinders 15*30
Figure 9: Reduction in the modulus of elasticity of the 15 cm cylinder under different temperatures
Civil and Environmental Research www.iiste.org
ISSN 2224-5790 (Paper) ISSN 2225-0514 (Online)
Vol.3, No.7, 2013
39
Figure 10: Reduction in the tensile strength under different temperatures for 60 min
Figure 11: Brazilian test to plain concrete cylinders according to the ACI specification
0
10
20
30
40
50
60
70
80
90
100
110
0 100 200 300 400 500 600
Re
du
ctio
n o
f te
nsi
le s
tre
ng
th %
Temperature C
10 cm Cylinder
15 cm Cylinder
Civil and Environmental Research www.iiste.org
ISSN 2224-5790 (Paper) ISSN 2225-0514 (Online)
Vol.3, No.7, 2013
40
Figure 12: Finite element model of the 10 cm cub.
Figure 13: Temperature distribution inside the cube under different temperatures.
0
100
200
300
400
500
600
0 250 500 750 1000 1250 1500 1750 2000 2250 2500 2750 3000 3250 3500
Tem
pe
ratu
re o
C
Sec.
10 cm
15 cm
20 cm
30 cm
furnance
Figure 14: required time to reach uniform temperature at 300 °C.
Civil and Environmental Research www.iiste.org
ISSN 2224-5790 (Paper) ISSN 2225-0514 (Online)
Vol.3, No.7, 2013
41
0
100
200
300
400
500
600
0 250 500 750 1000 1250 1500 1750 2000 2250 2500 2750 3000 3250 3500
Tem
pe
ratu
re o
C
Sec.
10 cm
15 cm
20 cm
30 cm
furnance
Figure 15: required time to reach uniform temperature at 400 °C.
0
100
200
300
400
500
600
0 250 500 750 1000 1250 1500 1750 2000 2250 2500 2750 3000 3250 3500
Tem
pe
ratu
re o
C
Sec.
10 cm
15 cm
20 cm
30 cm
furnance
Figure 16: required time to reach uniform temperature at 500 °C.
Civil and Environmental Research www.iiste.org
ISSN 2224-5790 (Paper) ISSN 2225-0514 (Online)
Vol.3, No.7, 2013
42
0
100
200
300
400
500
600
0 250 500 750 1000 1250 1500 1750 2000 2250 2500 2750 3000 3250 3500
Tem
pera
ture
oC
Sec.
10 cm
15 cm
20 cm
30 cm
furnance
Figure 17: required time to reach uniform temperature at 600 °C.
Figure 18: Effect of the shape on the compressive strength reduction under an elevated temperature.
Civil and Environmental Research www.iiste.org
ISSN 2224-5790 (Paper) ISSN 2225-0514 (Online)
Vol.3, No.7, 2013
43
Figure 19: Effect of the size on the compressive strength reduction under an elevated temperature.
Figure 20: Effect of the size on the modulus of elasticity reduction under an elevated temperature.

Civil and Environmental Research www.iiste.org
ISSN 2224-5790 (Paper) ISSN 2225-0514 (Online)
Vol.3, No.7, 2013
44
Figure 21: Effect of the size on the tensile strength reduction under an elevated temperature.
0
500
1000
1500
2000
2500
3000
3500
10 15 20 25 30
Tim
e S
ec.
Depth cm
600 C
500 C
400 C
300 C
Figure 22: Required time to reach a uniform temperature.
Civil and Environmental Research www.iiste.org
ISSN 2224-5790 (Paper) ISSN 2225-0514 (Online)
Vol.3, No.7, 2013
45
Table (1) Coefficients of transient heat conduction
Civil and Environmental Research www.iiste.org
ISSN 2224-5790 (Paper) ISSN 2225-0514 (Online)
Vol.3, No.7, 2013
46
Table (2) Cement Properties.
Property Result Specification Limits
Water standard 34.55% 26% – 30%
Fineness 3860 mm2/mgm Not less than 2750 mm2 /mgm
Setting time initial
(Vicat) final
90 minutes Not less than 45 minutes
200 minutes Not greater than 10 hours
Compression strength of mortar
(1:3) by weight
363 kg/cm2 after 3 days Not less than 183 kg/cm2
460 kg/cm2 after 3 days Not less than 275 kg/cm2
Soundness 1 mm Not greater than 10 mm
Table (3) Physical properties of the sand
Property Result Specification Limits
Specific gravity
Volume weight (kg/m3)
Fineness modulus
Voids ratio %
Percentage of dust and fine materials
(by weight)
2.6
1.65
2.49
33%
1.7%
2.5 – 2.7
1.4 – 1.7
2 – 3.75
27% - 40%
not greater than 3% by weight
Table 4 Concrete mix proportions (unit: kg/m3)
COMPONENT concrete Mix
CEMENT 480 kg
SAND 597 kg
DOLOMITE 1109 kg
WATER 168 litres
SUPERPLASTICISER 6 litres