share capital € 206,083,420.75 fully paid up registered ... · as regards the type of products...
TRANSCRIPT

1
Management and coordination IMMSI S.p.A. Share capital € 206,083,420.75 fully paid up Registered office: Viale R. Piaggio 25, Pontedera (Pisa)
Pisa Register of Companies and Tax Code 04773200011 Pisa Economic and Administrative Index no. 134077
Interim Report on Operations
as of 31 March 2014

2
3
CONTENTS REPORT ON OPERATIONS
Introduction ................................................................................................................................... 5
Key operating and financial data ........................................................................................ 6
Company Boards .......................................................................................................................... 8
Significant events in the first quarter of 2014 ............................................................. 9
Financial position and performance of the Group .................................................... 10
Consolidated income statement (reclassified) .................................................................... 10
Consolidated statement of financial position ....................................................................... 13
Consolidated Statement of Cash Flows.................................................................................. 15
Results by type of product ................................................................................................... 16
Two-Wheeler Vehicles .................................................................................................................. 16
Commercial Vehicles ..................................................................................................................... 18
Significant events after 31 March 2014 ......................................................................... 20
Operating outlook ..................................................................................................................... 21
Transactions with related parties ..................................................................................... 22
Relations with Parent Companies ............................................................................................. 22
Transactions with subsidiaries .................................................................................................. 23
Relations between subsidiaries and JV Zongshen Piaggio Foshan Motorcycle Co.
Ltd ........................................................................................................................................................ 25
Other information ..................................................................................................................... 26
Condensed Interim Financial Statements, Consolidated Financial
Statements and Notes as of 31 March 2014 ................................................................ 27
Consolidated Income Statement .............................................................................................. 28
Consolidated Statement of Comprehensive Income ......................................................... 29
Consolidated Statement of Financial Position ..................................................................... 30
Consolidated Statement of Cash Flow .................................................................................... 32
Changes in Consolidated Shareholders’ Equity................................................................... 33
Notes to the Consolidated Financial Statements as of 31 March 2014 ..................... 35

4

5
Introduction
This unaudited Interim Report on Operations as of 31 March 2014 has been prepared in
compliance with Italian Legislative Decree no. 58/1998 as amended, as well as with Consob
Regulation on Issuers.
These Interim Financial Statements have been prepared in compliance with International
Financial Reporting Standards (« IFRS ») issued by the International Accounting Standards
Board (« IASB ») and approved by the European Union and in accordance with IAS 34 –
Interim Financial Reporting.

6
Key operating and financial data
First Quarter Financial
Statements
In millions of euros 2014 2013 2013
Data on financial position
Net sales revenues 276.8 303.4 1,212.5
Gross industrial margin 83.2 88.0 357.5
Operating income 11.7 9.8 62.6
Profit before tax 1.8 1.8 30.3
Net profit 1.1 1.1 (6.5)
.Minority interest 0.0 0.0 0.0
.Group 1.1 1.1 (6.5)
Data on financial performance
Net capital employed (NCE) 934.4 931.6 867.7
Net debt (541.0) (487.7) (475.6)
Shareholders’ equity 393.4 443.8 392.1
Balance sheet figures and financial ratios
Gross margin on net revenues 30.1% 29.0% 29.5%
Net profit as a percentage of net revenues 0.4% 0.3% -0.5%
ROS (Operating income/net revenues) 4.2% 3.2% 5.2%
ROE (Net profit/shareholders' equity) 0.3% 0.2% -1.7%
ROI (Operating income/NEC) 1.3% 1.1% 7.2%
EBITDA 32.5 30.1 146.8
EBITDA on Net Revenues 11.7% 9.9% 12.1%
Other information
Sales volumes (unit/000) 123.9 138.4 555.6
Investments in property, plant and equipment and intangible assets 16.3 22.3 87.6
Research and Development1 14.6 17.1 47.7
Employees at the end of the period (number) 7,634 8,487 7,688
1 The item Research and Development includes investments recognised in the statement of financial position and costs recognised in profit and loss.

7
Results by operating segments
EMEA and
AMERICAS INDIA
ASIA PACIFIC
2W TOTAL
1st Quarter 2014 52.6 51.5 19.8 123.9
Sales volumes 1st Quarter 2013 52.3 61.9 24.2 138.4
(units/000) Change 0.3 (10.3) (4.4) (14.4)
Change % 0.5% -16.7% -18.2% -10.4%
1st Quarter 2014 169.4 70.1 37.3 276.8
Turnover 1st Quarter 2013 170.6 87.7 45.1 303.4
(million euros) Change (1.2) (17.6) (7.9) (26.7)
Change % -0.7% -20.1% -17.4% -8.8%
As of 31.03.2014 4,066 2,651 917 7,634
Staff As of 31.03.2013 4,322 3,216 949 8,487
(no.) Change (256.0) (565.0) (32.0) (853)
Change % -5.9% -17.6% -3.4% -10.1%
1st Quarter 2014 14.1 1.3 1.0 16.3
Investments 1st Quarter 2013 15.1 4.3 2.9 22.3
(million euros) Change (1.0) (3.1) (1.9) (6.0)
Change % -6.7% -70.5% -66.7% -26.8%
1st Quarter 2014 12.6 1.1 0.9 14.6
Research and Development2 1st Quarter 2013 12.6 2.8 1.6 17.1
(million euros) Change (0.0) (1.7) (0.7) (2.5)
Change % -0.2% -60.6% -43.3% -14.3%
2 The item "Research and Development" includes investments recognised in the statement of financial position and costs recognised in income statement.

8
Company Boards
Board of Directors
Chairman and Chief Executive Officer Roberto Colaninno (1)
Deputy Chairman Matteo Colaninno
Directors Michele Colaninno (3)
Franco Debenedetti (3), (4)
Daniele Discepolo (2), (4), (5), (6)
Mauro Gambaro
Livio Corghi
Luca Paravicini Crespi (3), (5),(6)
Riccardo Varaldo (4), (5), (6)
Vito Varvaro
Andrea Paroli
Board of Statutory Auditors
Chairman Giovanni Barbara
Statutory Auditors Attilio Francesco Arietti
Alessandro Lai
Alternate Auditors Mauro Girelli
Elena Fornara
Supervisory Body Antonino Parisi
Giovanni Barbara
Ulisse Spada
General Manager Finance Gabriele Galli
Executive in charge of
financial reporting
Alessandra Simonotto
Independent Auditors PricewaterhouseCoopers S.p.A.
(1) Director in charge of internal audit
(2) Lead Independent Director
(3) Member of the Appointment Proposal Committee
(4) Member of the Remuneration Committee
(5) Member of the Internal Control and Risks Management Committee
(6) Member of the Related Party Transactions Committee
12.5%
32.5%

9
Significant events in the first quarter of 2014
24 February 2014 The company Foshan Piaggio Vehicles Technology R&D Co. LTD obtained all
necessary authorisations from the local authorities to start the sale of two-wheeler products in China.
14 March 2014 Following the completion of the tax assessment which began in 2012 and solely to
prevent tax litigation with reference to assessment aspects, that concern contrasting positions with
outcomes that are hard to predict, Piaggio & C. S.p.A. considered it appropriate to agree to the
settlement proposal made by the Italian Revenue Agency that will involve a financial outflow, only as
concerns regional production tax, of €5.1 million, while the overall impact on the 2013 income
statement is equal to €24.6 million, including the use for the purposes of corporate income tax of
previous losses to offset the total sum of the proposals.
19 March 2014 Approval of the 2014-2017 Industrial Plan.

10
Financial position and performance of the Group Consolidated income statement (reclassified)
1st Quarter 2014 1st Quarter 2013 Change
In millions of
euros
Accounting for a
%
In millions of
euros
Accounting for
a % In millions of euros %
Net sales revenues 276.8 100.0% 303.4 100.0% (26.7) -8.8%
Cost to sell 193.6 69.9% 215.4 71.0% (21.8) -10.1%
Gross industrial margin 83.2 30.1% 88.0 29.0% (4.8) -5.5%
Operating expenses 71.5 25.8% 78.2 25.8% (6.7) -8.6%
EBITDA 32.5 11.7% 30.1 9.9% 2.4 7.9%
Amortisation 20.7 7.5% 20.3 6.7% 0.5 2.2%
Operating income 11.7 4.2% 9.8 3.2% 1.9 19.6%
Result of financial items (9.9) -3.6% (8.0) -2.6% (1.9) 23.5%
Profit before tax 1.8 0.6% 1.8 0.6% 0.0 1.8%
Taxes 0.7 0.3% 0.7 0.2% 0.0 1.8%
Net profit 1.1 0.4% 1.1 0.3% 0.0 1.8%
Vehicles sold
In thousands of units 1st Quarter 2014 1st Quarter 2013 Change
EMEA and Americas 52.6 52.3 0.3
India 51.5 61.9 (10.3)
Asia Pacific 2W 19.8 24.2 (4.4)
TOTAL VEHICLES 123.9 138.4 (14.4)
Two-Wheeler Vehicles 76.5 87.6 (11.1)
Commercial Vehicles 47.5 50.8 (3.3)
TOTAL VEHICLES 123.9 138.4 (14.4)
Net revenues
In millions of euros 1st Quarter 2014 1st Quarter 2013 Change
EMEA and Americas 169.4 170.6 (1.2)
India 70.1 87.7 (17.6)
Asia Pacific 2W 37.3 45.1 (7.9)
TOTAL NET REVENUES 276.8 303.4 (26.7)
Two-Wheeler Vehicles 195.7 208.4 (12.7)
Commercial Vehicles 81.1 95.1 (14.0)
TOTAL NET REVENUES 276.8 303.4 (26.7)

11
During the first quarter of 2014, the Piaggio Group sold 123,900 vehicles worldwide, reporting a
decrease of 10.4% in volume compared to the same period of the previous year when 138,400 units
were sold. The Emea and Americas are showing slight signs of recovery and have recorded a small
increase (+ 0.5%) after a long period of negative trends. Results for vehicles sold in India and Asia
Pacific are instead negative (- 16.7% and - 18.2% respectively).
As regards the type of products sold, the main downturn occurred in the two-wheeler segment (-
12.7%).
The European two-wheeler market finally recorded a positive growth trend, after several years of a
steady downturn. Vehicle registrations went up by 12.9% in Europe and by 9.7% in Italy. The result in
the motorcycle segment was particularly good, with an increase of 21.1% in Europe and 12.2% in Italy.
Growth in the scooter segment was more moderate, up by 6.3% in Europe and by 8.3% in Italy.
On the US two-wheeler market, performance on the scooter segment declined by 10.7%, while the
motorcycle segment grew (+1.0%).
The Group's main reference markets in Asia reported contrasting trends. In India, the scooter segment
grew by 33%, while in Vietnam the two-wheeler market fell by 9%.
The light commercial vehicles market in Europe also reported a buoyant trend. In particular, sales of
four-wheeler light commercial vehicles went up by 9.5% in Europe and by 10.5% in Italy. In the same
areas, sales of three-wheeler vehicles increased in Europe by 5.3%, while they fell by 21% in Italy.
In India, instead, the light commercial vehicles market declined considerably. In particular, the three-
wheeler segment decreased by 15.6%, while the four-wheeler segment was affected by a 40.1% drop.
In terms of consolidated turnover, the Group ended the first three months of 2014 with lower net
revenues compared to the same period of the previous year (-26.7 ML € and - 8.8%) and equal to €
276.8 million. This decrease, mainly in India and Asia Pacific, was exacerbated by the devaluation of the
dollar and all Asian currencies, which had an impact of 14.4 ML € on the decrease in turnover. The trend
in Emea and the Americas was basically steady, with a slight downturn (- 0.7%) compared to the first
quarter of 2013. The decrease in turnover in Asia Pacific (- 17.4%) and India (- 20.1%) was more
marked, also due to the above-mentioned exchange effect.
Analysis of sales by product type shows a more considerable downturn in the commercial vehicles
segment (- 14.7%). As a result, the impact of two-wheeler vehicles on overall turnover went up from
68.7% in the first quarter of 2013 to 70.7% in the same period in 2014; whereas, the same parameter
in the Commercial Vehicles segment decreased from 31.3% in the first quarter of 2013 to 29.3% in the
same period of 2014.
The Group's gross industrial margin, defined as the difference between “net revenues” and “cost to
sell” decreased by € 4.8 million in absolute terms compared to the first quarter of the previous year,
while in relation to net turnover, it went up from 29.0% in the first quarter of 2013 to 30.1%.
For example, the "cost to sell" includes costs for materials (direct and consumables), accessory
purchase costs (transport of incoming material, customs, warehousing), employee costs for direct and

12
indirect manpower and related expenses, work carried out by third parties, energy costs, depreciation of
property, plant, machinery and industrial equipment, maintenance and cleaning costs net of sundry cost
recovery recharged to suppliers. Amortisation/depreciation included in the gross industrial margin was
equal to € 8.6 million (€ 8.5 million in the first quarter of 2013).
Operating expenses incurred during the first quarter of 2014 totalled € 71.5 million, € 6.7 million less
compared to the same period of the previous year (€ 78.2 million), and confirm the Group's constant
focus on keeping costs down and maintaining high profitability levels.
For example, operating expenses include employee costs, costs for services, leases and rentals, as well
as operating costs net of operating income not included in the gross industrial margin. Operating
expenses also include amortisation/depreciation not included in the gross industrial margin, amounting
to € 12.1 million (€ 11.8 million in the first quarter of 2013).
These trends in the income statement resulted in a consolidated EBITDA, defined as operating income
gross of amortisation/depreciation, which was higher in absolute terms compared to the first quarter of
2013 (€ 32.5 million in the first three months of 2014 and € 30.1 million in the same period in 2013),
and in relation to turnover (11.7% compared to 9.9% the previous year). In terms of Operating Income
(EBIT), performance for the period was also up in absolute terms compared to the first three months of
2013, with a consolidated EBIT equal to € 11.7 million and 4.2% in relation to turnover (3.2% the
previous year).
The result of financing activities worsened compared to the first three months of the previous year, with
Net Charges amounting to € 9.9 million (€ 8.0 million in the first three months of 2013). This was
mainly due to the lower capitalisation of borrowing costs in the first quarter of 2014 and higher average
financial debt, only partially offset by a decrease in the cost of funding.
Consolidated net profit amounted to € 1.1 million, as in the first three months of 2013. Income taxes for
the period are estimated at € 0.7 million, equivalent to 40% of profit before tax.

13
Consolidated statement of financial position
In millions of euros As of 31 March
2014 As of 31 December
2013 Change
Statement of financial
position
Net working capital 33.7 (30.4) 64.1
Net tangible assets 307.3 310.1 (2.8)
Net intangible assets 655.7 654.5 1.2
Financial assets 9.6 9.9 (0.2)
Provisions (72.0) (76.4) 4.4
Net capital employed 934.4 867.7 66.6
Net Financial Debt 541.0 475.6 65.3
Shareholders’ equity 393.4 392.1 1.3
Sources of funds 934.4 867.7 66.6
Minority interest capital 0.9 0.9 (0.0)
Net working capital as of 31 March 2014, equal to € 33.7 million, used cash for € 64.1 million in the
first three months of 2014. This trend is mainly due to the seasonal effect of the two-wheeler market
which, as is well-known, uses resources in the first part of the year and generates them in the second
half. Specifically, net working capital is defined as the sum of trade receivables, inventories, trade
payables and other non-trade assets and liabilities.
Plant property and equipment, comprising plant, property, machinery and industrial equipment, net
of amortisation quota and assets held for sale, amounted to € 307.3 million as of 31 March 2014, down
by € 2.8 million compared to 31 December 2013. This decrease is mainly due to the value of
depreciation, which exceeded the volume of acquisitions in the period.
Intangible assets, comprising capitalised development costs, costs for patents and know-how, as well
as goodwill arising from acquisitions/mergers taking place within the Group over the last few years,
totalled € 655.7 million, with an increase of approximately € 1.2 million compared to 31 December
2013. This increase is due to the value of investments which exceeded amortisation.
Financial assets, defined as the sum of “investments” and “other non-current financial assets” totalled
€ 9.6 million, more or less in line with values as of 31 December 2013.
Provisions, comprising retirement funds and employee benefits, other long term provisions and the
current portion of other long term provisions, totalled € 72.0 million, registering a decrease compared to
31 December 2013 (€ 76.4 million).

14
As fully described in the next section on the “Consolidated Statement of Cash Flows”, net financial
debt as of 31 March 2014 was equal to € 541.0 million, compared to € 475.6 million as of 31 December
2013. The decrease of approximately € 65.3 million in net debt is mainly due to the seasonal nature of
the Two-Wheeler market which, as is well-known, uses resources in the first part of the year and
generates them in the second half. This negative deviation was down by € 31 million compared to the
same period of the previous year, due to a lower use of working capital.
Shareholders' equity as of 31 March 2014 amounted to € 393.4 million, up by approximately € 1.3
million compared to 31 December 2013.
15
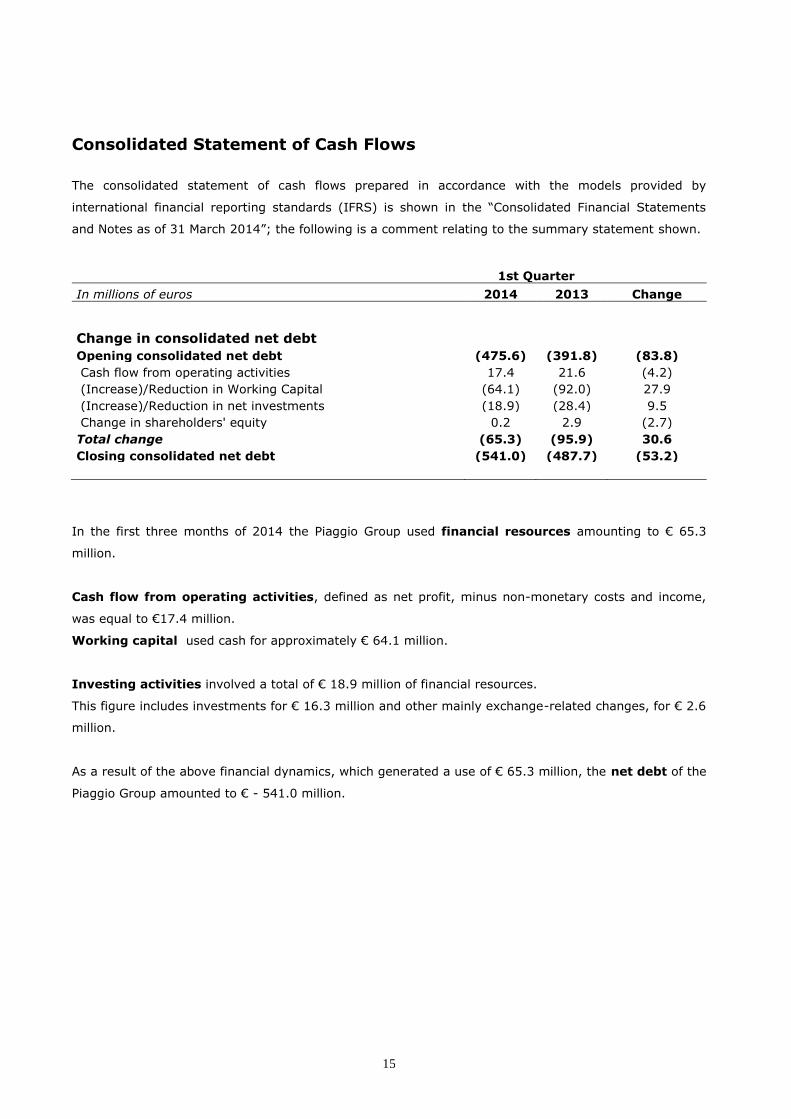
Consolidated Statement of Cash Flows
The consolidated statement of cash flows prepared in accordance with the models provided by
international financial reporting standards (IFRS) is shown in the “Consolidated Financial Statements
and Notes as of 31 March 2014”; the following is a comment relating to the summary statement shown.
1st Quarter
In millions of euros 2014 2013 Change
Change in consolidated net debt
Opening consolidated net debt (475.6) (391.8) (83.8)
Cash flow from operating activities 17.4 21.6 (4.2)
(Increase)/Reduction in Working Capital (64.1) (92.0) 27.9
(Increase)/Reduction in net investments (18.9) (28.4) 9.5
Change in shareholders' equity 0.2 2.9 (2.7)
Total change (65.3) (95.9) 30.6
Closing consolidated net debt (541.0) (487.7) (53.2)
In the first three months of 2014 the Piaggio Group used financial resources amounting to € 65.3
million.
Cash flow from operating activities, defined as net profit, minus non-monetary costs and income,
was equal to €17.4 million.
Working capital used cash for approximately € 64.1 million.
Investing activities involved a total of € 18.9 million of financial resources.
This figure includes investments for € 16.3 million and other mainly exchange-related changes, for € 2.6
million.
As a result of the above financial dynamics, which generated a use of € 65.3 million, the net debt of the
Piaggio Group amounted to € - 541.0 million.

16
Results by type of product
Two-Wheeler Vehicles
1st Quarter 2014 1st Quarter 2013 Change % Change
Volumes
Turnover
Volumes
Turnover
Volumes Turnover Volumes Turnover
Sell-in Sell-in
(units/000)
(million
euros) (units/000)
(million
euros)
EMEA and Americas 50.6 154.4 50.3 155.0 0.6% -0.4% 0.3 (0.5)
of which EMEA 46.3 136.7 46.1 136.1 0.3% 0.4% 0.1 0.6
(of which Italy) 8.1 26.6 8.8 29.5 -7.9% -10.1% (0.7) (3.0) of which America
4.3 17.7 4.2 18.9 3.7% -6.1% 0.2 (1.2)
India 6.1 4.0 13.1 8.3 -53.6% -51.7% (7.0) (4.3)
Asia Pacific 2W 19.8 37.3 24.2 45.1 -18.2% -17.4% (4.4) (7.9)
TOTAL 76.5 195.7 87.6 208.4 -12.7% -6.1% (11.1) (12.7)
Scooters 68.3 130.0 79.9 139.1 -14.5% -6.6% (11.6) (9.1)
Motorcycles 8.1 39.6 7.6 41.9 6.1% -5.5% 0.5 (2.3)
Spare parts and Accessories
25.5 25.4 0.5% 0.1
Other 0.6 2.0 -68.4% (1.4)
TOTAL 76.5 195.7 87.6 208.4 -12.7% -6.1% (11.1) (12.7)
The Two-Wheeler market mainly comprises two product segments: scooters and motorcycles, in
addition to the related spare parts and accessories business, the sale of engines to third parties,
involvement in main two-wheeler sports championships and technical service.
Comments on main results and significant events of the sector
The European Two-Wheeler market finally recorded a positive growth trend, after several years of a
steady downturn. Vehicle registrations went up by 12.9% in Europe and by 9.7% in Italy. The result in
the motorcycle segment was particularly good, with an increase of 21.1% in Europe and 12.2% in Italy.
Growth in the scooter segment was more moderate, up by 6.3% in Europe and by 8.3% in Italy.
On the US two-wheeler market, performance on the scooter segment declined by 10.7%, while the
motorcycle segment grew (+1.0%).
The Group's main reference markets in Asia reported contrasting trends. In India, the scooter segment
grew by 33%, while in Vietnam the two-wheeler market fell by 9%.

17
The Piaggio Group maintained its leadership position on the European two-wheeler market in the first
three months of 2014, with a 15.1% market share, a 25.4% share in the scooter segment (+0.1%
compared to 2013) and a 4.0% share in the motorcycle segment, down compared to 2013.
On the Italian market, the Piaggio Group retained its leadership position with a total share of 20.7%,
(30.6% in the scooter segment), down compared to 2013 figures.
Healthy performance was reported in the USA, where, against a 10.7% decline on the scooter market,
Piaggio Group scooter sales rose by 4.6% for a 23.7% share of the segment. Overall sales volumes
(scooters and motorcycles) increased by 3.7% across the Americas area (USA+Canada+Latin America).
Results in Asia Pacific were not so good, where volumes (sell in) dropped by 18.2%, also following the
general weakness of the reference market.
Sales in India also fell, where volumes (sell in) decreased by 53.6%.

18
Commercial Vehicles
1st Quarter 2014 1st Quarter 2013 Change % Change
Volumes
Turnover
Volumes
Turnover
Volumes Turnover Volumes Turnover
Sell-in Sell-in
(units/000)
(million
euros) (units/000)
(million
euros)
EMEA and Americas 2.0 15.0 2.0 15.6 -1.5% -4.2% (0.0) (0.7)
(of which Italy) 0.9 8.8 0.8 8.1 10.5% 8.6% 0.1 0.7
(of which America) 0.0 0.2 0.1 0.4 -67.5% -54.0% (0.1) (0.2)
India 45.5 66.1 48.8 79.4 -6.7% -16.8% (3.3) (13.3)
TOTAL 47.5 81.1 50.8 95.1 -6.5% -14.7% (3.3) (14.0)
Ape 45.0 62.6 49.8 78.3 -9.5% -20.0% (4.7) (15.7)
Porter 0.5 5.7 0.6 6.7 -11.4% -14.4% (0.1) (1.0) Quargo 0.2 1.2 0.2 1.0 23.8% 23.0% 0.0 0.2 Mini Truk 1.7 3.3 0.3 0.5 543.9% 497.1% 1.5 2.7
Spare parts and Accessories
8.3
8.5 -3.5% -0.3
TOTAL 47.5 81.1 50.8 95.1 -6.5% -14.7% (3.3) (14.0)
The Commercial Vehicles business includes three- and four-wheelers with a maximum mass below 3.5
tons (category N1 in Europe) designed for commercial and private use, and related spare parts and
accessories.
Comments on main results and significant events of the sector
The light commercial vehicles market in Europe reported a buoyant trend. In particular, sales of four-
wheeler light commercial vehicles went up by 9.5% in Europe and by 10.5% in Italy. In the same areas,
sales of three-wheeler vehicles increased in Europe by 5.3%, while they fell by 21% in Italy.
In India, instead, the light commercial vehicles market declined considerably. In particular, the three-
wheeler segment decreased by 15.6%, while the four-wheeler segment was affected by a 40.1% drop.
In this context, in the first quarter of 2014, the Piaggio Group sold commercial vehicles realising a
turnover of approximately € 81.1 million, including approximately € 8.3 million relative to spare parts
and accessories, down 14.7% over the same period of 2013. Units sold fell from 50,800 units in the first
three months of 2013 to 47,500 units in the current period, with a downturn, lower than turnover, of
6.5%.

19
On the EMEA and Americas markets, the Piaggio Group sold 2,000 units in the first three months of
2014, generating a net total turnover of approximately € 15.0 million, including spare parts and
accessories, down slightly on the same period in 2013.
On the Indian three-wheeler market, considerably down compared to the first quarter of 2013 (-15.6%),
Piaggio Vehicles Private Limited, with 38,200 units sold against 44,800 units in the same period of 2013,
retained its position as reference player, with a market share of 33.3%. In more detail, Piaggio Vehicles
Private Limited maintained its role as market leader in the cargo segment, with a market share of
49.7% and as a leading player in the important passenger segment with a market share of 28.3%.
On the four-wheeler market (<2 Ton), Piaggio Vehicles Private Limited considerably increased sales
(+502%) in the first three months of 2014, to obtain a 4.6% share (0.5% in March 2013).

20
Significant events after 31 March 2014
14 April 2014, the new Moto Guzzi V7 range was launched in the historic Moto Guzzi factory in
Mandello del Lario. The range offers three models: Racer, Stone and Special.
14 April 2014, the Piaggio Concept Store Mantova S.r.l. company was established, owned 100% by
Piaggio & C., S.p.A. Its corporate purpose is to market two-, three- and four-wheel vehicles and related
spare parts and accessories, to provide repair and technical support services, and motorcycle services.
The new company also sells clothing, food and beverages.
15 April 2014, the new Mechanical Factory was opened at the Piaggio industry park in Pontedera, to
house high-precision machining operations on scooter and motorcycle components for the entire Group.
The production facility covers a total surface area of approximately 7,500 m2, of which 5,500 indoors,
and performs high-precision machining on sumps, crankcases and other engine and chassis
components, with a workforce of around 90 people. Most of these people were hired by the Piaggio
Group in 2011, after its former supplier Tecnocontrol went bankrupt.
16 April 2014 Piaggio & C. S.p.A. successfully completed the placement of an unsecured, non-
convertible, high-yield senior debenture loan, amounting to € 250 million with a 7-year duration, an
annual interest rate of 4.625%, semi-annual fixed coupon and issue price equal to 100%. The debenture
loan will make it possible to optimise debt, in particular extending average maturity (from 2.4 to over 4
years), reducing the average cost of funding and increasing the debt component raised on capital
markets.
22 April 2014, the new Vespa GTS, also available in a GTS Super sports version with 125 and 300 cc
engines, was launched in Tuscany. This is the largest and most powerful Vespa scooter ever produced,
and features an ASR electronic traction control system (a world exclusive and technological first from
the Piaggio Group) and an ABS braking system.

21
Operating outlook
As outlined in the new 2014-2017 Industrial Plan, approved on 19 March 2014, and as regards business
and industrial operations:
• the Group's leadership position on the European two-wheeler market has been confirmed, levering the
expected recovery by further consolidating the product range and targeting growth in sales and margins
in the motorcycle segment, with the Moto Guzzi and Aprilia ranges; current positions on the European
commercial vehicles market will be maintained;
• the growth strategy in the Asia Pacific area will continue, exploring new opportunities in medium and
large sized motorcycle segments, and replicating the premium strategy for Vietnam, throughout the
region. During 2014, direct sales activities of the Group will start up in China, with the aim of
penetrating the premium two-wheeler market;
• sales on the Indian scooter market will be consolidated, and will focus on an increase in Vespa
products and the introduction of new models in the premium scooter and motorcycle segments;
• an increase in sales of commercial vehicles in India will be targeted - also through the consolidation of
new segments of the Indian three-wheeler market with the Apè City Pax and the introduction of new
models in the four-wheeler segment - and further development in exports to African and Latin American
markets will be targeted in emerging countries.
In technological terms, the Piaggio Group is continuing to develop technologies and platforms that
underline the functional aspects and emotional appeal of vehicles with ongoing developments to
engines, extended use of vehicle/user digital platforms and the trialling of new product and service
configurations.
More in general, the Group is committed - as in the past and for operations in 2014 - to increasing
productivity with a strong focus on efficient costs and investments, while complying with its business
ethics.

22
Transactions with related parties
Revenues, costs, receivables and payables as of 31 March 2014 involving parent companies, subsidiaries
and affiliated companies refer to the sale of goods or services which are a part of normal operations of
the Group.
Transactions are carried out at normal market values, depending on the characteristics of the goods and
services provided.
The information on transactions with related parties, including information required by Consob in its
communication of 28 July 2006, is given in the notes of the Consolidated Financial Statements.
The procedure for transactions with related parties, pursuant to article 4 of Consob Regulation no.
17221 of 12 March 2010 as amended, approved by the Council on 30 September 2010, is published on
the institutional site of the Issuer www.piaggiogroup.com, under Governance.
Relations with Parent Companies
Piaggio & C. S.p.A. is subject to the management and coordination of IMMSI S.p.A. pursuant to article
2497 et seq. of the Italian Civil Code. During the period, this management and coordination concerned
the following activities:
As regards mandatory financial disclosure, and in particular the financial statements and reports
on operations of the Group, IMMSI has produced a group manual containing the accounting
standards adopted and options chosen for implementation, in order to give a consistent and fair
view of the consolidated financial statements.
IMMSI has defined procedures and times for preparing the budget and in general the industrial
plan of Group companies, as well as final management analysis to support management control
activities.
IMMSI has also provided services for the development and management of Company assets,
with a view to optimising resources within the Group, and provided property consultancy
services and other administrative services.
IMMSI has provided consultancy services and assistance for the Company and subsidiaries
concerning extraordinary financing operations, organisation, strategy and coordination, as well
as services intended to optimise the financial structure of the Group.
In 2013, for a further three years, the Parent Company signed up for the National Consolidated Tax
Convention pursuant to articles 117 - 129 of the Consolidated Income Tax Act (T.U.I.R) of which IMMSI
S.p.A. is the consolidating company, and to whom other IMMSI Group companies report to. The

23
consolidating company determines a single global income equal to the algebraic sum of taxable amounts
(income or loss) realised by individual companies that opt for this type of group taxation.
The consolidating company recognises a receivable from the consolidated company which is equal to the
corporate tax to be paid on the taxable income transferred by the latter. Whereas, in the case of
companies reporting tax losses, the consolidating company recognises a payable related to corporate
tax on the portion of loss actually used to determine global overall income. Under the National
Consolidated Tax Convention, companies may, pursuant to Article 96 of Presidential Decree no. 917/86,
allocate the excess of interest payable which is not deductible to one of the companies so that, up to the
excess of Gross Operating Income produced in the same tax period by other subjects party to
consolidation (or, in the presence of specific legal requirements, from foreign companies), it may be
used to reduce the total income of the Group.
Piaggio & C. S.p.A. has undertaken a rental agreement for offices owned by Omniaholding S.p.A.. This
agreement, signed in normal market conditions, was previously approved by the Related Parties
Transactions Committee, as provided for by the procedure for transactions with related parties adopted
by the Company.
In addition, Omniaholding S.p.A. has undersigned Piaggio & C. bonds for a value of € 2.9 million on the
financial market, and collected related interest.
Pursuant to article 2.6.2, section 13 of the Regulation of Stock Markets organised and managed by
Borsa Italiana S.p.A., the conditions as of article 37 of Consob regulation no. 16191/2007 exist.
Transactions with subsidiaries
The main relations with subsidiaries, eliminated in the consolidation process, refer to the following
transactions:
Piaggio & C. S.P.A.
o sells vehicles, spare parts and accessories to sell on respective markets, to:
Piaggio Hrtvaska Piaggio Hellas Piaggio Group Americas Piaggio Vehicles Private Limited Piaggio Vietnam
o sells components to:
Piaggio Vehicles Private Limited Piaggio Vietnam
o grants licences for rights to use the brand and technological know how to:
24
Piaggio Vehicles Private Limited Piaggio Vietnam
o provides support services for scooter and engine industrialisation to:
Piaggio Vehicles Private Limited Piaggio Vietnam
o provides support services for staff functions of other Group companies;
o issues guarantees for the Group's subsidiaries, for medium-term loans. Piaggio Vietnam sells vehicles, spare parts and accessories, which it has manufactured in some cases, for sale on respective markets, to:
o Piaggio Indonesia o Piaggio Group Japan o Piaggio & C. S.p.A.
Piaggio Vehicles Private Limited sells vehicles, spare parts and accessories, for sale on respective markets, and components and engines to use in manufacturing, to Piaggio & C. S.p.A..
Piaggio Vespa provides
o back office business and administration services as well as credit management services for Piaggio & C. S.p.A.
Piaggio Hrtvaska, Piaggio Hellas, Piaggio Group Americas and Piaggio Vietnam
o distribute vehicles, spare parts and accessories purchased by Piaggio & C. on their respective
markets. Piaggio Indonesia and Piaggio Group Japan
o provide a vehicle, spare part and accessory distribution service to Piaggio Vietnam for their respective markets.
Piaggio France, Piaggio Deutschland, Piaggio Limited, Piaggio Espana and Piaggio Vespa
o provide a sales promotion service and after-sales services to Piaggio & C. S.p.A. for their
respective markets. Piaggio Asia Pacific
o provides a sales promotion service and after-sales services to Piaggio Vietnam in the Asia Pacific
region. Foshan Piaggio Vehicles Technologies R&D provides to:
Piaggio & C. S.p.A.:
o a component and vehicle design/development service;
o scouting of local suppliers;
Piaggio Vietnam:
o scouting of local suppliers;

25
Piaggio Advanced Design Center:
o provides a vehicle and component research/design/development service to Piaggio & C. S.p.A.
Aprilia Racing:
o a racing team management service; o a vehicle design service for Piaggio & C. S.p.a.
Atlantic 12
o rents a property to Piaggio & C. S.p.a.
Relations between subsidiaries and JV Zongshen Piaggio Foshan Motorcycle Co. Ltd
Main intercompany relations between subsidiaries and JV Zongshen Piaggio Foshan Motorcycle Co. Ltd,
refer to the following transactions:
Piaggio & C. S.p.A.
grants licences for rights to use the brand and technological know how to Zongshen Piaggio Foshan
Motorcycle Co. Ltd
Zongshen Piaggio Foshan Motorcycle Co. Ltd sells vehicles, spare parts and accessories, which it has manufactured in some cases, to the
following companies for sale on their respective markets:
o Piaggio Vietnam o Piaggio & C. S.P.A.
Investments of members of the board of directors and members of the control committee
Members of the board of directors and members of the control committee of the Issuer do not hold
shares in the Issuer.

26
Other information
Corporate
During the period, the company structure of the Group did not change.
On 14 April 2014, a new company, Piaggio Concept Store Mantova, was established, which will manage
the Group's first “flagship store” in the city of Mantua.
Mantua, 8 May 2014
For the Board of Directors
Chairman and Chief Executive Officer
Roberto Colaninno
27
Piaggio Group
Condensed Interim Financial Statements,
Consolidated Financial Statements and Notes as of
31 March 2014

28
Consolidated Income Statement
1st Quarter 2014 1st Quarter 2013
In thousands of Euros Notes Total
of which related parties Total
of which related parties
Net revenues 4 276,786 17 303,449 18
Cost for materials 5 160,088 5,979 175,318 5,063
Cost for services and leases and rentals 6 48,778 902 54,272 990
Employee costs 7 52,638 61,887
Depreciation of property, plant and equipment 8 10,239 9,891
Amortisation of intangible assets 8 10,495 10,387
Other operating income 9 21,168 2,297 22,525 176
Other operating costs 10 3,987 8 4,415 4
Operating income 11,729 9,804
Income/(loss) from investments 11
Financial income 12 130 436
Borrowing costs 12 9,969 51 8,308 51
Net exchange gains/(losses) 12 (94) (168)
Profit before tax 1,796 1,764
Taxes for the period 13 719 706
Profit from continuing operations 1,077 1,058
Assets held for disposal:
Profits or losses arising from assets held for disposal 14
Net Profit (loss) for the period 1,077 1,058
Attributable to:
Shareholders of the Parent Company 1,083 1,072
Non-controlling interests (6) (14)
Earnings per share (figures in €) 15 0.003 0.003
Diluted earnings per share (figures in €) 15 0.003 0.003

29
Consolidated Statement of Comprehensive Income
1st Quarter 2014
1st Quarter 2013
In thousands of euros Notes
Net Profit (Loss) for the period (A) 1,077 1,058
Items that will not be reclassified in the income statement
Re-measurements of post employment benefit 29 (959) (403)
Total (959) (403)
Items that may be reclassified in the income statement
Profit (loss) deriving from the translation of financial statements of foreign companies denominated in foreign currency 29 1,153 2,336
Total profits (losses) on cash flow hedge instruments 29 (72) 1,687
Total 1,081 4,023
Other components of the Statement of Comprehensive Income (B)* 122 3,620
Total Profit (loss) for the period (A + B) 1,199 4,678
* Other Profits (and losses) take account of relative tax effects
Attributable to:
Shareholders of the Parent Company
1,222 4,699
Non-controlling interests
(23) (21)

30
Consolidated Statement of Financial Position
As of 31 March 2014 As of 31 December 2013
In thousands of Euros Notes Total
of which related parties Total
of which related parties
ASSETS
Non-current assets
Intangible assets 16 655,696 654,528
Property, plant and equipment 17 299,978 302,767
Investment property 18 7,346 7,346
Investments 19 8,152 8,152
Other financial assets 20 9,559 10,468
Long-term tax receivables 21 2,958 2,974
Deferred tax assets 22 36,192 33,660
Trade receivables 23 127
Other receivables 24 12,406 231 13,368 231
Total non-current assets 1,032,414 1,033,263
Assets held for sale 28
Current assets
Trade receivables 23 119,740 873 75,722 864
Other receivables 24 29,944 11,130 26,514 7,162
Short-term tax receivables 21 29,360 23,615
Inventories 25 230,668 207,808
Other financial assets 26 838
Cash and cash equivalents 27 71,048 66,504
Total current assets 480,760 401,001
TOTAL ASSETS 1,513,174 1,434,264

31
As of 31 March 2014
As of 31 December 2013
In thousands of Euros Notes Total
of which related parties Total
of which related parties
SHAREHOLDERS’ EQUITY AND LIABILITIES
Shareholders’ equity
Share capital and reserves attributable to the shareholders of the Parent Company 29 392,496 391,183
Share capital and reserves attributable to non-controlling interests 29 909 932
Total shareholders’ equity 393,405 392,115
Non-current liabilities
Financial liabilities falling due after one year 30 440,328 2,900 434,865 2,900
Trade payables 31
Other long-term provisions 32 10,952 11,083
Deferred tax liabilities 33 5,887 5,722
Retirement funds and employee benefits 34 50,800 49,830
Tax payables 35 0 0
Other long-term payables 36 3,880 4,148
Total non-current liabilities 511,847 505,648
Current liabilities
Financial liabilities falling due within one year 30 179,784 116,872
Trade payables 31 360,951 12,411 346,164 11,204
Tax payables 35 11,410 12,587
Other short-term payables 36 45,521 8,093 45,416 6,474
Current portion of other long-term provisions 32 10,256 15,462
Total current liabilities 607,922 536,501
TOTAL SHAREHOLDERS’ EQUITY AND
LIABILITIES 1,513,174 1,434,264

32
Consolidated Statement of Cash Flow
This statement shows the factors behind changes in cash and cash equivalents, net of short-term bank overdrafts, as required by IAS 7.
1st Quarter 2014 1st Quarter 2013
Total
of which related parties Total
of which related parties
In thousands of euros Notes
Operating activities Consolidated net profit
1,083
1,072 Allocation of profit to non-controlling interests
(6)
(14)
Taxes for the period 13 719
706 Depreciation of property, plant and equipment 8 10,239
9,891
Amortisation of intangible assets 8 10,495
10,387 Provisions for risks and retirement funds and employee benefits
3,904
4,334
Write-downs / (Reversals)
180
329 Losses / (Gains) on the disposal of property, plants and equipment
19
6
Losses / (Gains) on the disposal of intangible assets
0 Financial income 12 (106)
(250) Borrowing costs 12 8,627
7,150
Income from public grants
(320)
(1,758) Portion of earnings of affiliated companies
0
Change in working capital: (Increase)/Decrease in trade receivables 23 (43,973) (9) (57,051) (45)
(Increase)/Decrease in other receivables 24 (2,468) (3,968) 7,398 29
(Increase)/Decrease in inventories 25 (22,860)
(36,293) Increase/(Decrease) in trade payables 31 14,787 1,207 1,159 (5,989)
Increase/(Decrease) in other payables
(163) 1,619 5,440 8
Increase/(Decrease) in provisions for risks 32 (7,275)
(2,514) Increase/(Decrease) in retirement funds and employee benefits 34 (930)
(1,670)
Other changes
(11,490)
(14,292) Cash generated from operating activities (39,538) (65,970)
Interest paid
(7,052)
(4,099) Taxes paid
(2,279)
(3,586)
Cash flow from operating activities (A) (48,869) (73,655)
Investing activities Investment in property, plant and equipment 17 (5,497)
(9,316)
Sale price, or repayment value, of property, plant and equipment 247
22 Investment in intangible assets 16 (10,820)
(12,993)
Unconsolidated investments
0 Sale price, or repayment value, of intangible assets
34
10
Sale price of financial assets
838 Collected interests
99
89
Cash flow from investing activities (B) (15,099) (22,188)
Financing activities Exercise of stock options 29 91
Purchase of treasury shares 29 0
(703) Loans received 30 89,493
118,497
Outflow for repayment of loans 30 (13,342)
(5,624) Financing received for leases 30 263
Repayment of finance leases 30 (240)
(231) Cash flow from funding activities (C) 76,265 111,939
Increase / (Decrease) in cash and cash equivalents (A+B+C) 12,297 16,096
Opening balance 52,816 84,140
Exchange differences
538 Closing balance 65,651 100,236
33
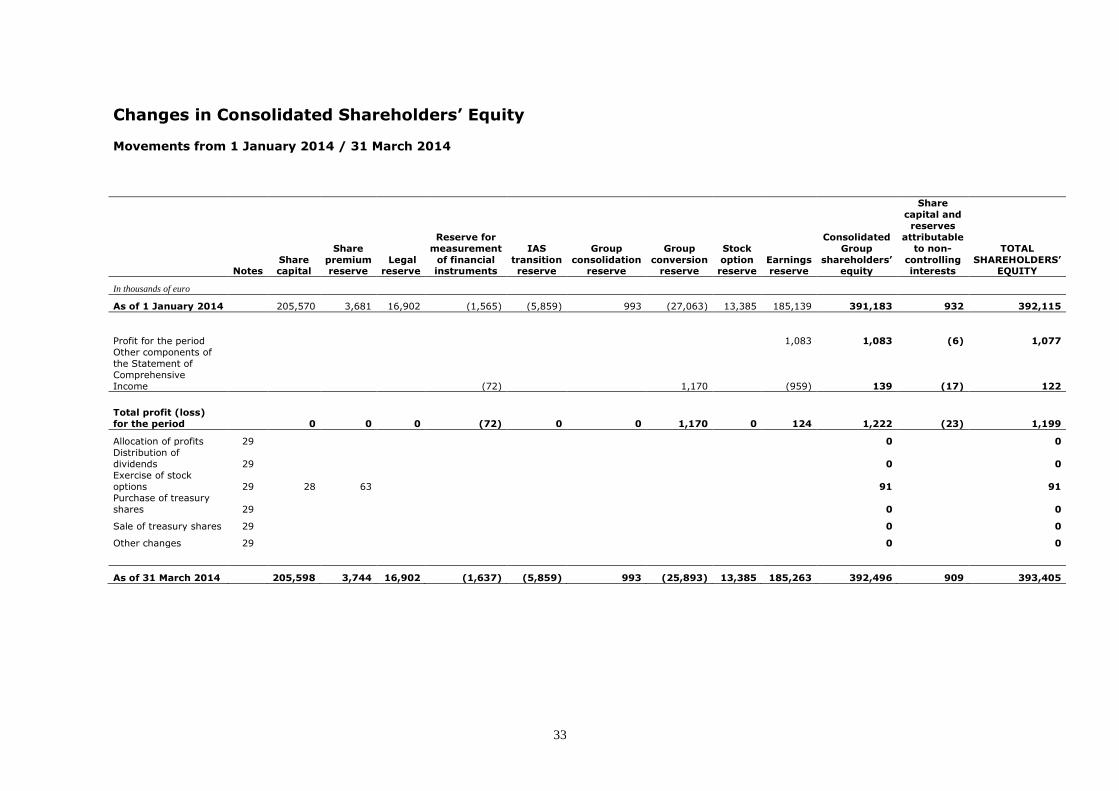
Changes in Consolidated Shareholders’ Equity Movements from 1 January 2014 / 31 March 2014
Notes Share capital
Share
premium reserve
Legal reserve
Reserve for
measurement
of financial instruments
IAS
transition reserve
Group
consolidation reserve
Group
conversion reserve
Stock
option reserve
Earnings reserve
Consolidated
Group
shareholders’ equity
Share
capital and
reserves
attributable
to non-
controlling interests
TOTAL
SHAREHOLDERS’ EQUITY
In thousands of euro
As of 1 January 2014 205,570 3,681 16,902 (1,565) (5,859) 993 (27,063) 13,385 185,139 391,183 932 392,115
Profit for the period
1,083 1,083 (6) 1,077
Other components of
the Statement of
Comprehensive
Income
(72) 1,170 (959) 139 (17) 122
Total profit (loss)
for the period 0 0 0 (72) 0 0 1,170 0 124 1,222 (23) 1,199
Allocation of profits 29 0 0
Distribution of
dividends 29 0 0
Exercise of stock
options 29 28 63 91 91
Purchase of treasury
shares 29 0 0
Sale of treasury shares 29 0 0
Other changes 29 0 0
As of 31 March 2014 205,598 3,744 16,902 (1,637) (5,859) 993 (25,893) 13,385 185,263 392,496 909 393,405

34
Movements from 1 January 2013 / 31 March 2013
Notes
Share
capital
Share
premium
reserve
Legal
reserve
Reserve for
measurement
of financial
instruments
IAS
transition
reserve
Group
consolidation
reserve
Group
conversion
reserve
Stock
option
reserve
Earnings
reserve
Consolidated
Group
shareholders’
equity
Share
capital and
reserves
attributable
to non-
controlling
interests
TOTAL
SHAREHOLDERS’
EQUITY
In thousands of euro
As of 1 January 2013 199,504 3,493 14,593 (3,269) (5,859) 993 (16,902) 13,385 232,690 438,628 1,245 439,873
Profit for the period
1,072 1,072 (14) 1,058
Other components of
the Statement of
Comprehensive
Income
1,687
2,343
(403) 3,627 (7) 3,620
Total profit (loss)
for the period 0 0 0 1,687 0 0 2,343 0 669 4,699 (21) 4,678
Allocation of profits 29
0
0 Distribution of
dividends 29
0
0
Annulment of treasury
shares 29
0
0 Exercise of stock
options 29
0
0
Purchase of treasury
shares 29 (196)
(507) (703)
(703)
Sale of treasury shares 29
0
0
Other changes 29
0
0
As of 31 March 2013 199,308 3,493 14,593 (1,582) (5,859) 993 (14,559) 13,385 232,852 442,624 1,224 443,848

35
Notes to the Consolidated Financial Statements as of 31 March 2014 A) GENERAL ASPECTS
Piaggio & C. S.p.A. (the Company) is a joint-stock company established in Italy at the Register of
Companies of Pisa. The main operations of the company and its subsidiaries (the Group) are described in
the Report on Operations.
The Condensed Interim Financial Statements are expressed in Euros (€) since that is the currency in
which most of the Group’s transactions take place. Foreign assets are booked in accordance with
currently effective international accounting standards.
1. Scope of consolidation
The scope of consolidation has not changed compared to 31 December 2013 and the first quarter of
2013.
2. Compliance with INTERNATIONAL ACCOUNTING STANDARDS
These Condensed Interim Financial Statements have been drafted in compliance with the International
Accounting Standards (IAS/IFRS) in force at that date, issued by the International Accounting Standards
Board and approved by the European Commission, as well as in compliance with the provisions
established in Article 9 of Legislative Decree no. 38/2005 (Consob Resolution no. 15519 dated 27 July
2006 containing the “Provisions for the presentation of financial statements", Consob Resolution no.
15520 dated 27 July 2006 containing the “Changes and additions to the Regulation on Issuers adopted by
Resolution no. 11971/99”, Consob communication no. 6064293 dated 28 July 2006 containing the
“Corporate reporting required in accordance with Article 114, paragraph 5 of Legislative Decree no.
58/98"). The interpretations of the International Financial Reporting Interpretations Committee (“IFRIC”),
previously called the Standing Interpretations Committee (“SIC”), were also taken into account.
During the drafting of these Condensed Interim Financial statements, prepared in compliance with IAS 34
- Interim Financial Reporting, the same accounting standards adopted in the drafting of the Consolidated
Financial Statements as of 31 December 2013 were applied, with the exception of items in section 2.1,
"Accounting standards, amendments and interpretations applied as from 1 January 2014".
The preparation of the interim financial statements requires management to make estimates and
assumptions which have an impact on the values of revenues, costs, consolidated balance sheet assets
and liabilities and on the information regarding contingent assets and liabilities at the reporting date. If
these management estimates and assumptions should, in future, differ from the actual situation, they will
be changed as appropriate in the period in which the circumstances change.
It should also be noted that some assessment processes, in particular the most complex ones such as
establishing any impairment of fixed assets, are generally undertaken in full only when preparing the
annual financial statements, when all the potentially necessary information is available, except in cases
where there are indications of impairment which require an immediate assessment of any impairment
loss.

36
The Group’s activities, especially those regarding two-wheeler products, are subject to significant
seasonal changes in sales during the year.
Income tax is recognised on the basis of the best estimate of the average weighted tax rate for the entire
financial period.
2.1. Accounting standards, amendments and interpretations applied as from 1 January 2014
On 12 May 2011, the IASB issued the standard IFRS 10 - Consolidated Financial Statements which
replaces SIC-12 Consolidation - Special Purpose Entities and parts of IAS 27 - Consolidated and Separate
Financial Statements that have been renamed Separate Financial Statements and regulate the accounting
treatment of investments in separate financial statements. The new standard deviates from existing
standards by identifying the concept of control, according to a new definition, as the determinant factor
for the purposes of consolidation of a company in the consolidated financial statements of the parent
company. It also provides a guide for determining the existence of control where this is difficult to
establish (effective control, potential votes, specific-purpose company, etc.). The standard is applicable in
a retrospective manner from 1 January 2014.
On 12 May 2011, the IASB issued the standard IFRS 11 – Joint Arrangements which replaces IAS 31 –
Interests in Joint Ventures and SIC-13 – Jointly Controlled Entities - Non-Monetary Contributions by
Venturers. The new standard provides methods for identifying joint arrangements based on the rights
and obligations under such arrangements rather than their actual legal form and establishes the equity
method as the only accounting treatment for jointly controlled entities in consolidated financial
statements. The standard is applicable in a retrospective manner from 1 January 2014. After the issue
the standard IAS 28 – Investments in Associates was amended to include jointly controlled entities within
its field of application, as of the date the standard became effective.
On 12 May 2011, the IASB issued the standard IFRS 12 – Disclosure on Interests in Other Entities which
is a new and complete standard on disclosures to provide on all types of investments including in
subsidiaries, joint arrangements, associates, special purpose entities and unconsolidated structured
entities. The standard is applicable in a retrospective manner from 1 January 2014.
2.2 Amendments and interpretations effective from 1 April 2014
On 29 May 2013, the IASB issued an amendment to IAS 36 – Impairment of Assets, which regulates
disclosure on the recoverable amount of assets subject to impairment, if the amount is based on the fair
value net of costs to sell. The amendments must be adopted retroactively, for years commencing from or
after 1 April 2014.
37
On 16 December 2011, the IASB issued some amendments to IAS 32 – Financial Instruments:
Presentation, to clarify the use of some criteria for offsetting financial assets and liabilities contained in
IAS 32. The amendments are applicable in a retrospective manner for years commencing from or after 1
April 2014.
On 27 June 2013, the IASB issued some minor amendments to IAS 39 – Financial Instruments:
Recognition and Measurement - Novation of Derivatives and Continuation of Hedge Accounting. The
amendments allow for the continuation of hedge accounting if a financial derivative, designated as a
hedging instrument, is novated following the adoption of the law or regulations in order to replace the
original counterparty to guarantee the successful outcome of the obligation undertaken and if certain
conditions are met. This amendment is also included in IFRS 9 - Financial Instruments. The amendments
must be adopted retroactively, for years commencing from or after 1 April 2014.
2.3 Accounting standards, amendments and interpretations which are not yet applicable or adopted in
advance by the Group
At the date of issue of these Interim Financial Statements, competent bodies of the European Union had
not completed the approval process necessary for the application of these amendments and standards.
On 12 November 2009, the IASB published IFRS 9 – Financial Instruments. This standard was
amended on 28 October 2010. The standard, which is applicable from 1 January 2015, in a
retrospective manner, represents the first part of a process to entirely phase out and replace
IAS 39 with new criteria for classifying and recognising financial assets and liabilities and for
eliminating financial assets (derecognition) from the financial statements. In particular the
new standard adopts a single approach for financial assets, based on financial instrument
management and the characteristics of contractual cash flows of financial assets, to
determine measurement criteria, replacing the rules of IAS 39. For financial liabilities instead,
the main change concerns the accounting treatment of fair value changes of a financial
liability designated as a financial liability measured at fair value through profit or loss, in the
case where changes are due to a change in the creditworthiness of the liability. According to
this new standard, the changes will be recognised as "Other comprehensive income" and will
no longer be recognised in profit or loss.
On 20 May 2013, the IASB issued IFRIC 21 - Levies, an interpretation of IAS 37 - Provisions,
Contingent Liabilities and Contingent Assets. IFRIC 21 provides clarifications on when an
entity must recognise a liability for the payment of levies imposed by governments, other
than levies regulated by other standards (e.g. IAS 12 – Income Taxes). IAS 37 establishes
criteria for the recognition of a liability, including the existence of the current obligation of the
entity as the result of a past event (known as the binding fact). The interpretation clarifies
that the binding fact, which gives rise to a liability for the payment of the tax, is described in
the reference standard from which the payment arises. IFRIC 21 is effective from years
commencing from 1 January 2014.

38
OTHER INFORMATION
A specific paragraph in this document provides information on any significant events occurring after the
end of the first three months of 2014 and on the operating outlook.
The following exchange rates were used to translate the financial statements of companies included in
the scope of consolidation into euros:
Currency Spot exchange rate
31 March 2014
Average exchange rate
1st Quarter 2014
Spot exchange rate
31 December 2013
Average exchange rate
1st Quarter 2013
US Dollar 1.3788 1.36963 1.3791 1.32036
Pounds Sterling 0.8282 0.82780 0.8337 0.85172
Indian Rupee 82.578 84.57944 85.366 71.52121
Singapore Dollars 1.7366 1.73788 1.7414 1.63454
Chinese Renminbi 8.5754 8.35762 8.3491 8.21930
Croatian Kuna 7.6475 7.64977 7.6265 7.58409
Japanese Yen 142.42 140.79778 144.72 121.91006
Vietnamese Dong 28,818.78 28,690.33143 28,801.07 27,823.60779
Canadian Dollars 1.5225 1.51068 1.4671 1.33172
Indonesian Rupiah 15,739.00 16,226.98 16,866.39 12,787.45348
Brazilian Real 3.1276 3.23995 3.2576 2.63469

39
B) SEGMENT REPORTING
3. Operating segment reporting
The organisational structure of the Group is based on 3 Geographic Segments, involved in the production
and sale of vehicles, relative spare parts and assistance in areas under their responsibility: EMEA and the
Americas, India and Asia Pacific 2W. Operating segments are identified by management, in line with the
management and control model used.
In particular, the structure of disclosure corresponds to the structure of periodic reporting analysed by
the Chairman and Chief Executive Officer for business management purposes.
Each Geographic Segment has production sites and a sales network dedicated to customers in the
relative segment. Specifically:
Emea and the Americas have production sites and deal with the distribution and sale of two-
wheeler and commercial vehicles;
India has production sites and deals with the distribution and sale of two-wheeler and commercial
vehicles;
Asia Pacific 2W has production sites and deals with the distribution and sale of two-wheeler
vehicles.
Central structures and development activities currently dealt with by EMEA and the Americas, are
handled by individual segments.
40
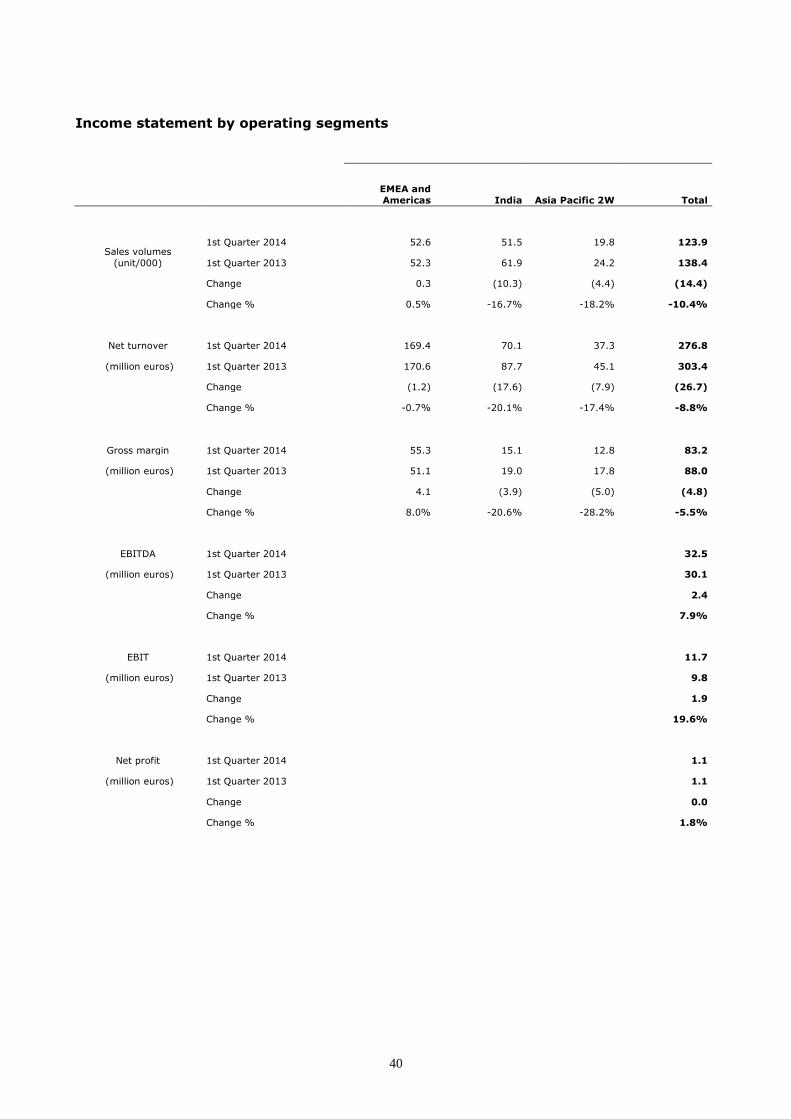
Income statement by operating segments
EMEA and
Americas India Asia Pacific 2W Total
Sales volumes
(unit/000)
1st Quarter 2014 52.6 51.5 19.8 123.9
1st Quarter 2013 52.3 61.9 24.2 138.4
Change 0.3 (10.3) (4.4) (14.4)
Change % 0.5% -16.7% -18.2% -10.4%
Net turnover 1st Quarter 2014 169.4 70.1 37.3 276.8
(million euros) 1st Quarter 2013 170.6 87.7 45.1 303.4
Change (1.2) (17.6) (7.9) (26.7)
Change % -0.7% -20.1% -17.4% -8.8%
Gross margin 1st Quarter 2014 55.3 15.1 12.8 83.2
(million euros) 1st Quarter 2013 51.1 19.0 17.8 88.0
Change 4.1 (3.9) (5.0) (4.8)
Change % 8.0% -20.6% -28.2% -5.5%
EBITDA 1st Quarter 2014 32.5
(million euros) 1st Quarter 2013 30.1
Change 2.4
Change % 7.9%
EBIT 1st Quarter 2014 11.7
(million euros) 1st Quarter 2013 9.8
Change 1.9
Change % 19.6%
Net profit 1st Quarter 2014 1.1
(million euros) 1st Quarter 2013 1.1
Change 0.0
Change % 1.8%

41
C) INFORMATION ON THE CONSOLIDATED INCOME STATEMENT
4. Net revenues €/000 276,786
Revenues are shown net of premiums recognised to customers (dealers).
This item does not include transport costs, which are recharged to customers (€/000 5,329) and invoiced
advertising cost recoveries (€/000 647), which are posted under other operating income.
The revenues for disposals of Group core business assets essentially refer to the marketing of vehicles
and spare parts on European and non-European markets.
Revenues by geographic segment
The breakdown of revenues by geographic segment is shown in the following table:
1st Quarter 2014 1st Quarter 2013 Changes
In thousands of Euros Amount % Amount % Amount %
EMEA and Americas 169,410 61.2 170,607 56.2 (1,197) -0.7
India 70,091 25.3 87,695 28.9 (17,604) -20.1
Asia Pacific 2W 37,285 13.5 45,147 14.9 (7,862) -17.4
Total 276,786 100.0 303,449 100.0 (26,663) -8.8
The decrease in revenues, mainly in India and Asia Pacific, was exacerbated by the devaluation of the
dollar and all Asian currencies, which had an impact of 14.4 ML € on the decrease in turnover.
5. Costs for materials €/000 160,088
The percentage accounting for net revenues was stable at 57.8%.
This item includes €/000 5,979 for costs relative to purchases of scooters from the Chinese subsidiary
Zongshen Piaggio Foshan, which are sold on European and Asian markets.
6. Costs for services, lease and rental costs €/000 48,778
The saving of €/000 5,494 was basically generated by a reduction in sales volumes.
Services include costs for the transport of vehicles and spare parts (€/000 7,812), third party work for
production components (€/000 3,752), utilities (€/000 4,682), advertising and promotion costs (€/000
6,475), as well as costs for legal and tax advice and outsourced services (€/000 7,176). The item
includes costs for temporary work of €/000 185.
Costs for leases and rentals include lease rentals for business properties of €/000 1,641, as well as lease
payments for car hire, computers and photocopiers.

42
7. Employee costs €/000 52,638
Employee costs fell considerably compared to figures for the first quarter of 2013 (-14.9%). The saving
was due to a reduction in the average workforce and lower costs related to mobility plans. Employee
costs for 2013 included €/000 5,642 mainly relating to costs for mobility plans for the Martorelles site.
Below is a breakdown of the headcount by actual number and average number:
Average number
Level 1st Quarter 2014 1st Quarter 2013 Change
Senior management 94 96 (2)
Middle management 573 566 7
White collars 2,123 2,206 (83)
Intermediate/blue collars 4,909 5,604 (695)
Total 7,699 8,472 (773)
Number as of
Level 31 March 2014 31 December 2013 Change
Senior management 95 95 0
Middle management 571 572 (1)
White collars 2,119 2,132 (13)
Intermediate/blue collars 4,849 4,889 (40)
Total 7,634 7,688 (54)
Number as of
Employee/staff numbers 31 March 2014 31 December 2013 Change
EMEA and Americas 4,066 4,098 (32)
India 2,651 2,677 (26)
Asia Pacific 2W 917 913 4
Total 7,634 7,688 (54)
The reduction in the average workforce is mainly due to the decrease in employees of the Indian
subsidiary and the closure of the production site in Spain, at the end of March 2013.
Average employee numbers were affected by seasonal workers in the summer (on fixed-term
employment contracts).
In fact the Group uses fixed-term employment contracts to handle typical peaks in demand in the
summer months.
8. Amortisation, depreciation and impairment
costs
€/000 20,734
Overall, this item was stable compared to the first quarter of 2013 (€/000 20,278).
Goodwill is not amortised but tested annually for impairment.
The impairment test carried out as of 31 December 2013 confirmed the full recoverability of the amounts
recorded in the financial statements.

43
9. Other operating income €/000 21,168
Other operating income decreased by €/000 1,357 compared to figures for the same period of 2013.
The decrease in other operating income is mainly due to the reduction in research contributions
recognised in profit and loss.
10. Other operating costs €/000 3,987
Overall, other operating costs decreased by €/000 428.
11. Net income from investments €/000 0
Income from investments was not recorded in the first quarter of 2014 or 2013.
12. Net financial income (borrowing costs) €/000 (9,933)
The result of financing activities worsened compared to the first three months of the previous year, with
Net Charges amounting to €/000 9,933 (€/000 8,040 in the first three months of 2013). The deviation is
due to the lower capitalisation of borrowing costs in the first quarter of 2014 and higher average financial
debt, only partially offset by a decrease in the cost of funding.
13. Taxes €/000 719
Income taxes for the period, calculated in accordance with IAS 34 are estimated as €/000 719,
equivalent to 40% of profit before tax, and are equal to the best estimate of the average weighted rate
expected for the entire period.
14. Gain / (loss) on assets held for disposal or
sale
€/000 0
At the end of the reporting period, there were no gains or losses from assets held for disposal or sale.

44
15. Earnings per share
Earnings per share are calculated as follows:
1st Quarter
2014
1st Quarter
2013
Net profit €/000 1,077 1,058
Earnings attributable to ordinary shares €/000 1,077 1,058
Average number of ordinary shares in circulation 360,057,362 371,793,901
Earnings per ordinary share € 0.003 0.003
Adjusted average number of ordinary shares
360,788,612
372,460,580
Diluted earnings per ordinary share € 0.003 0.003
The potential effects deriving from stock option plans were considered when calculating diluted earnings
per share.

45
D) INFORMATION ON THE CONSOLIDATED STATEMENT OF FINANCIAL POSITION - ASSETS
16. Intangible assets €/000 655,696
The table below shows the breakdown of intangible assets as of 31 March 2014 and 31 December 2013,
as well as movements during the period.
In thousands of euro Development
costs Patent rights
Concessions, licences and trademarks Goodwill Other
Assets under
development and
advances Total
Historical cost 125,623 230,024 149,074 557,322 7,010 32,293 1,101,346
Provisions for write-down 0
Accumulated depreciation (56,513) (187,933) (86,385) (110,382) (5,605) (446,818)
Assets as of 31.12.2013 69,110 42,091 62,689 446,940 1,405 32,293 654,528
Investments 2,080 262 59 8,419 10,820
Transitions in the period 1,884 252 182 (2,318) 0
Amortisation (5,786) (3,229) (1,206) (274) (10,495)
Disposals (34) (34)
Write-downs 0
Exchange differences 794 54 (2) 83 929
Other changes (52) 0 (52)
Total changes (1,062) (2,713) (1,206) 0 (35) 6,184 1,168
Historical cost 130,962 230,688 149,074 557,322 7,248 38,477 1,113,771
Provisions for write-down 0
Accumulated amortisation (62,914) (191,310) (87,591) (110,382) (5,878) (458,075)
Assets as of 31.03.2014 68,048 39,378 61,483 446,940 1,370 38,477 655,696
The breakdown of intangible assets for the period and under construction is as follows:
Value as of 31 March 2014 Value as of 31 December 2013 Change
In thousands of euros
For the period
Under development
and advances Total
For the period
Under development
and advances Total
For the period
Under development
and advances Total
R&D costs 68,048 33,178 101,226 69,110 26,940 96,050 (1,062) 6,238 5,176 Patent rights 39,378 5,184 44,562 42,091 5,172 47,263 (2,713) 12 (2,701) Concessions, licences and trademarks 61,483 61,483 62,689 62,689 (1,206) 0 (1,206) Goodwill 446,940 446,940 446,940 446,940 0 0 0 Other 1,370 115 1,485 1,405 181 1,586 (35) (66) (101)
Total 617,219 38,477 655,696 622,235 32,293 654,528 (5,016) 6,184 1,168
Increases mainly refer to the capitalisation of development costs for new products and new engines.

46
17. Property, plant and machinery €/000 299,978
The table below details the breakdown of property, plant and equipment as of 31 March 2014 and as of
31 December 2013, as well as changes for the period.
In thousands of euro Land Buildings Plant and
equipment Equipment Other
assets
Assets under
development and
advances Total
Historical cost 28,040 153,593 398,588 492,649 44,842 27,640 1,145,352
Provisions for write-down (362) (1,409) (46) (1,817)
Accumulated depreciation (51,564) (287,752) (462,357) (39,095) (840,768)
Assets as of 31.12.2013 28,040 102,029 110,474 28,883 5,701 27,640 302,767
Investments 186 156 843 640 3,672 5,497
Transitions in the period 544 5,207 6,392 204 (12,347) 0
Amortisation (1,209) (4,873) (3,705) (452) (10,239)
Disposals (22) (179) (65) (266)
Write-downs (8) (8)
Exchange differences 461 1,600 (1) 78 89 2,227
Other changes 2 317 (319) 0
Total changes 0 (16) 2,385 3,023 405 (8,586) (2,789)
Historical cost 28,040 156,919 406,593 497,865 45,478 19,054 1,153,949
Provisions for write-down (339) (1,419) (46) (1,804)
Accumulated amortisation (54,906) (293,395) (464,540) (39,326) (852,167)
Assets as of 31.03.2014 28,040 102,013 112,859 31,906 6,106 19,054 299,978
The breakdown of plant, property and equipment for the period and under construction is as follows:
Value as of 31 March 2014 Value as of 31 December 2013 Change
In thousands of euros
For the period
Under development
and advances Total
For the period
Under development
and advances Total
For the period
Under development
and advances Total
Land 28,040 28,040 28,040 28,040 0 0 0 Buildings 102,013 2,013 104,026 102,029 2,328 104,357 (16) (315) (331) Plant and equipment 112,859 7,114 119,973 110,474 10,688 121,162 2,385 (3,574) (1,189) Equipment 31,906 9,514 41,420 28,883 14,150 43,033 3,023 (4,636) (1,613) Other assets 6,106 413 6,519 5,701 474 6,175 405 (61) 344
Total 280,924 19,054 299,978 275,127 27,640 302,767 5,797 (8,586) (2,789)
Property, plant and equipment mainly refer to Group production facilities in Pontedera (Pisa), Noale
(Venice), Mandello del Lario (Lecco), Baramati (India) and Vinh Phuc (Vietnam).
The increases mainly relate to the construction of moulds for new vehicles launched during the period.
Warranties
As of 31 March 2014, the Group had no land and building encumbered by mortgage liens or privileges in
favour of banks to secure loans obtained in previous years.

47
18. Investment property €/000 7,346
The item refers to the fair value measurement of the former Spanish site of Martorelles, which
Management decided to rent to third parties. The fair value recognised at 31 December 2013 was
confirmed by a specific valuation of an independent expert, who measured the “Fair value less cost of
disposal” based on a market approach (as provided for by IFRS 13).
In thousands of euros As of 31 March 2014 As of 31 December
2013 Change
Investment property 7,346 7,346 0
Total 7,346 7,346 0
19. Investments €/000 8,152
The Investments heading comprises:
In thousands of euros As of 31 March 2014 As of 31 December
2013 Change
Interests in joint ventures 7,938 7,938 0
Investments in affiliated companies 214 214 0
Total 8,152 8,152 0
The value of interests in joint ventures refers to the valuation of the portion of shareholders' equity in the
Zongshen Piaggio Foshan joint venture, held by the Group.
20. Other non-current financial assets €/000 9,559
In thousands of euros As of 31 March 2014 As of 31 December
2013 Change
Fair value of hedging derivatives 9,396 10,305 (909)
Investments in other companies 163 163 0
Total 9,559 10,468 (909)
The item Fair Value of hedging derivatives refers to €/000 4,561 from the fair value of the Cross
Currency Swap on a private debenture loan, and €/000 4,835 from the fair values of Cross Currency
Swaps on medium-term loans of the Indian subsidiary.
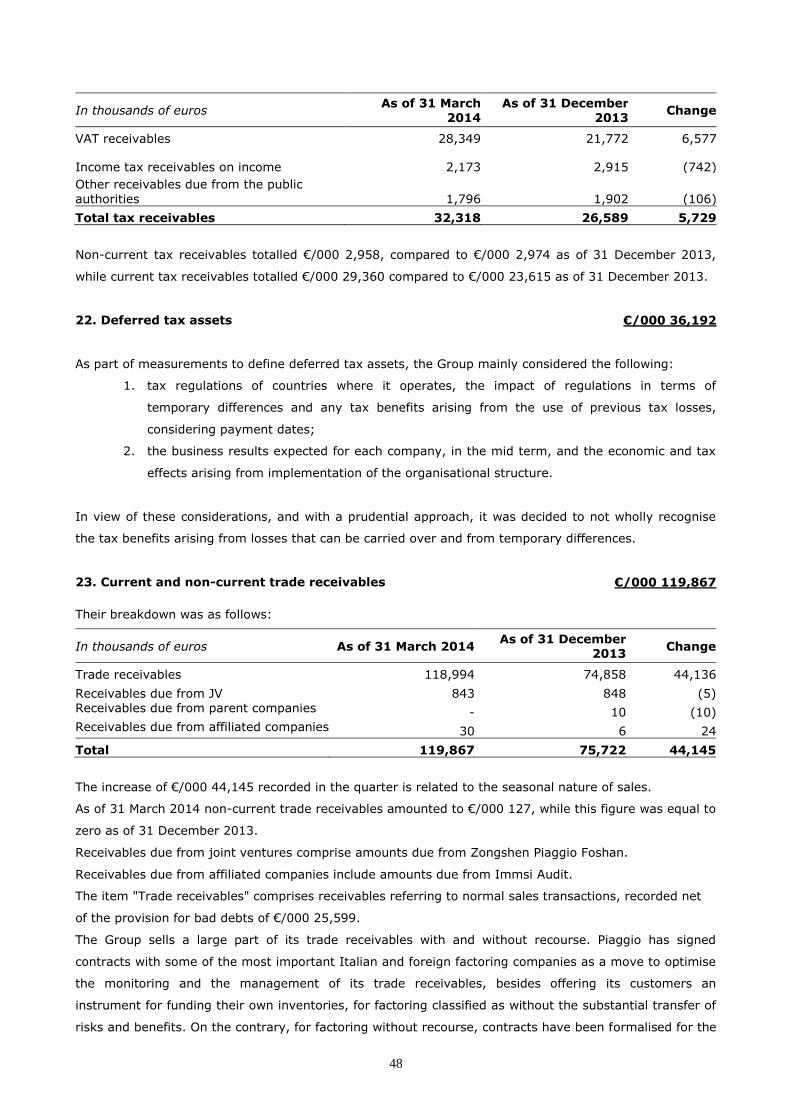
21. Current and non-current tax receivables €/000 32,318
Receivables due from tax authorities consist of:
48
In thousands of euros As of 31 March
2014
As of 31 December
2013 Change
VAT receivables 28,349 21,772 6,577
Income tax receivables on income 2,173 2,915 (742)
Other receivables due from the public
authorities 1,796 1,902 (106)
Total tax receivables 32,318 26,589 5,729
Non-current tax receivables totalled €/000 2,958, compared to €/000 2,974 as of 31 December 2013,
while current tax receivables totalled €/000 29,360 compared to €/000 23,615 as of 31 December 2013.
22. Deferred tax assets €/000 36,192
As part of measurements to define deferred tax assets, the Group mainly considered the following:
1. tax regulations of countries where it operates, the impact of regulations in terms of
temporary differences and any tax benefits arising from the use of previous tax losses,
considering payment dates;
2. the business results expected for each company, in the mid term, and the economic and tax
effects arising from implementation of the organisational structure.
In view of these considerations, and with a prudential approach, it was decided to not wholly recognise
the tax benefits arising from losses that can be carried over and from temporary differences.
23. Current and non-current trade receivables €/000 119,867
Their breakdown was as follows:
In thousands of euros As of 31 March 2014 As of 31 December
2013 Change
Trade receivables 118,994 74,858 44,136
Receivables due from JV 843 848 (5) Receivables due from parent companies - 10 (10) Receivables due from affiliated companies 30 6 24
Total 119,867 75,722 44,145
The increase of €/000 44,145 recorded in the quarter is related to the seasonal nature of sales.
As of 31 March 2014 non-current trade receivables amounted to €/000 127, while this figure was equal to
zero as of 31 December 2013.
Receivables due from joint ventures comprise amounts due from Zongshen Piaggio Foshan.
Receivables due from affiliated companies include amounts due from Immsi Audit.
The item "Trade receivables" comprises receivables referring to normal sales transactions, recorded net
of the provision for bad debts of €/000 25,599.
The Group sells a large part of its trade receivables with and without recourse. Piaggio has signed
contracts with some of the most important Italian and foreign factoring companies as a move to optimise
the monitoring and the management of its trade receivables, besides offering its customers an
instrument for funding their own inventories, for factoring classified as without the substantial transfer of
risks and benefits. On the contrary, for factoring without recourse, contracts have been formalised for the

49
substantial transfer of risks and benefits. As of 31 March 2014, trade receivables still due sold without
recourse totalled €/000 93,304.
Of these amounts, Piaggio received payment prior to natural expiry, of €/000 82,117. As of 31 March 2014, advance payments received from factoring companies and banks, for trade
receivables sold with recourse totalled €/000 24,651 with a counter entry recorded in current liabilities.
24. Other current and non-current receivables €/000 42,350
They consist of:
In thousands of euros As of 31 March
2014
As of 31 December
2013 Change
Other non-current receivables:
Due from associated companies 231 231 0 Prepaid expenses 9,598 9,864 (266) Advances to employees 67 67 0 Security deposits 605 621 (16)
Due from others 1,905 2,585 (680)
Total non-current portion 12,406 13,368 (962)
Receivables due from affiliated companies regard amounts due from the Fondazione Piaggio
(Foundation).
In thousands of euros As of 31 March
2014
As of 31 December
2013 Change
Other current receivables: Receivables due from parent companies 6,746 6,759 (13)
Receivables due from JV 4,364 372 3,992
Receivables due from affiliated companies 20 31 (11) Accrued income 744 701 43 Prepaid expenses 5,526 4,751 775
Advance payments to suppliers 791 599 192 Advances to employees 453 2,859 (2,406) Fair value of hedging derivatives - 3 (3)
Security deposits 235 215 20
Receivables due from others 11,065 10,224 841
Total current portion 29,944 26,514 3,430
Receivables due from the Parent Company regard the assignment of tax receivables that took place
within the group consolidated tax procedure.
Receivables due from joint venture companies comprise amounts due from Zongshen Piaggio Foshan.
Receivables due from affiliated companies regard amounts due from Immsi Audit.
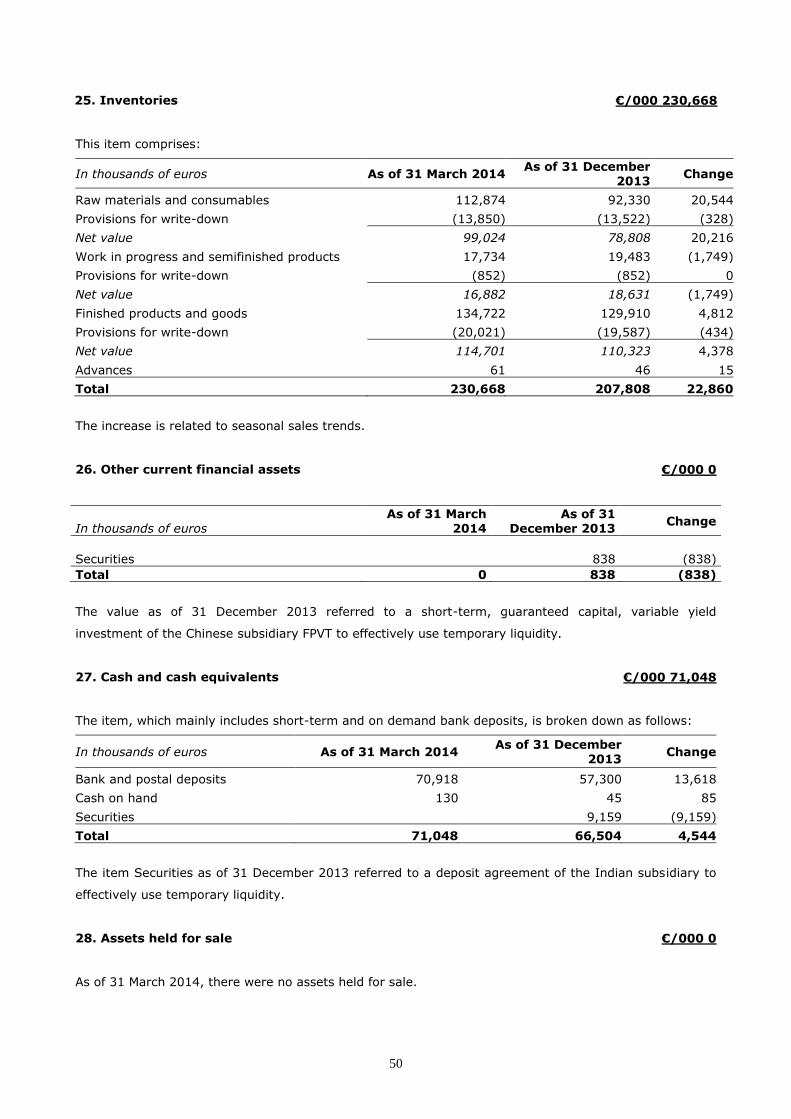
50
25. Inventories €/000 230,668
This item comprises:
In thousands of euros As of 31 March 2014 As of 31 December
2013 Change
Raw materials and consumables 112,874 92,330 20,544
Provisions for write-down (13,850) (13,522) (328)
Net value 99,024 78,808 20,216
Work in progress and semifinished products 17,734 19,483 (1,749)
Provisions for write-down (852) (852) 0
Net value 16,882 18,631 (1,749)
Finished products and goods 134,722 129,910 4,812
Provisions for write-down (20,021) (19,587) (434)
Net value 114,701 110,323 4,378
Advances 61 46 15
Total 230,668 207,808 22,860
The increase is related to seasonal sales trends.
26. Other current financial assets €/000 0
In thousands of euros As of 31 March
2014 As of 31
December 2013 Change
Securities 838 (838)
Total 0 838 (838)
The value as of 31 December 2013 referred to a short-term, guaranteed capital, variable yield
investment of the Chinese subsidiary FPVT to effectively use temporary liquidity.
27. Cash and cash equivalents €/000 71,048
The item, which mainly includes short-term and on demand bank deposits, is broken down as follows:
In thousands of euros As of 31 March 2014 As of 31 December
2013 Change
Bank and postal deposits 70,918 57,300 13,618
Cash on hand 130 45 85
Securities 9,159 (9,159)
Total 71,048 66,504 4,544
The item Securities as of 31 December 2013 referred to a deposit agreement of the Indian subsidiary to
effectively use temporary liquidity.
28. Assets held for sale €/000 0
As of 31 March 2014, there were no assets held for sale.

51
INFORMATION ON THE CONSOLIDATED STATEMENT OF FINANCIAL POSITION - LIABILITIES
29. Share capital and reserves €/000 393,405
Share capital €/000 205,598
During the period, share capital changed, following the issue of 50,000 new shares subscribed by stock
option plan beneficiaries.
The change in share capital during the first quarter of 2014 period was as follows:
In thousands of euro
Subscribed and paid up capital 206,027
Treasury shares purchased as of 31 December 2013 (457)
Share capital as of 1 January 2014 205,570
Exercise of stock options 28
Share capital as of 31 March 2014 205,598
As of 31 March 2014, the Parent Company held 839,669 treasury shares, equal to 0.23% of the share
capital.
In accordance with international accounting standards, the acquisitions were recognised as a decrease in
shareholders' equity.
no. of shares 2014 2013
Situation as of 1 January
Shares issued 360,894,880 371,793,901
Treasury portfolio shares 839,669 11,726,521
Shares in circulation 360,055,211 360,067,380
Movements for the year
Exercise of stock options 50,000 150,000
Cancellation of treasury shares
(11,049,021)
Purchase of treasury shares
512,169
Sale of treasury shares
(350,000)
Situation as of 31 March 2014 and 31 December 2013
Shares issued 360,944,880 360,894,880
Treasury portfolio shares 839,669 839,669
Shares in circulation 360,105,211 360,055,211
0.23% 0.23%

52
As of 31 March 2014, according to the shareholder ledger and notices received pursuant to article 120 of
Legislative Decree no. 58/1998 and other information available, the following shareholders held voting
rights, either directly or indirectly, exceeding 2% of the share capital:
Declarer Direct shareholder % of ordinary share capital
% of shares with voting rights
Omniaholding S.p.A.
IMMSI S.p.A. 50.632 50.632 Omniaholding S.p.A.
0.028 0.028
Total 50.660 50.660
Diego della Valle Diego della Valle & C. S.a.p.a. 5.4491 5.4491
Total 5.4491 5.4491
Financiere de
l’Echiquier
Financiere de l’Echiquier 5.1308 5.1308
Total 5.1308 5.1308
Share premium reserve €/000 3,744
The share premium reserve as of 31 March 2014 had increased by €/000 63, following the exercise of
50,000 stock options.
Legal reserve €/000 16,902
The legal reserve as of 31 March 2014 was unchanged and equal to €/000 16,902.
Other reserves €/000 (19,011)
This item consists of:
In thousands of euros As of 31 March
2014 As of 31 December
2013 Change
Translation reserve (25,893) (27,063) 1,170
Stock option reserve 13,385 13,385 0
Financial instruments’ fair value reserve (1,637) (1,565) (72)
IFRS transition reserve (5,859) (5,859) 0
Total other reserves (20,004) (21,102) 1,098
Consolidation reserve 993 993 0
Total (19,011) (20,109) 1,098
The financial instruments fair value provision is negative by €/000 1,637 and refers to the effects of cash
flow hedge accounting in foreign currencies, interest and specific business transactions. These
transactions are described in full in the note on financial liabilities.
Earnings reserve €/000 185,263
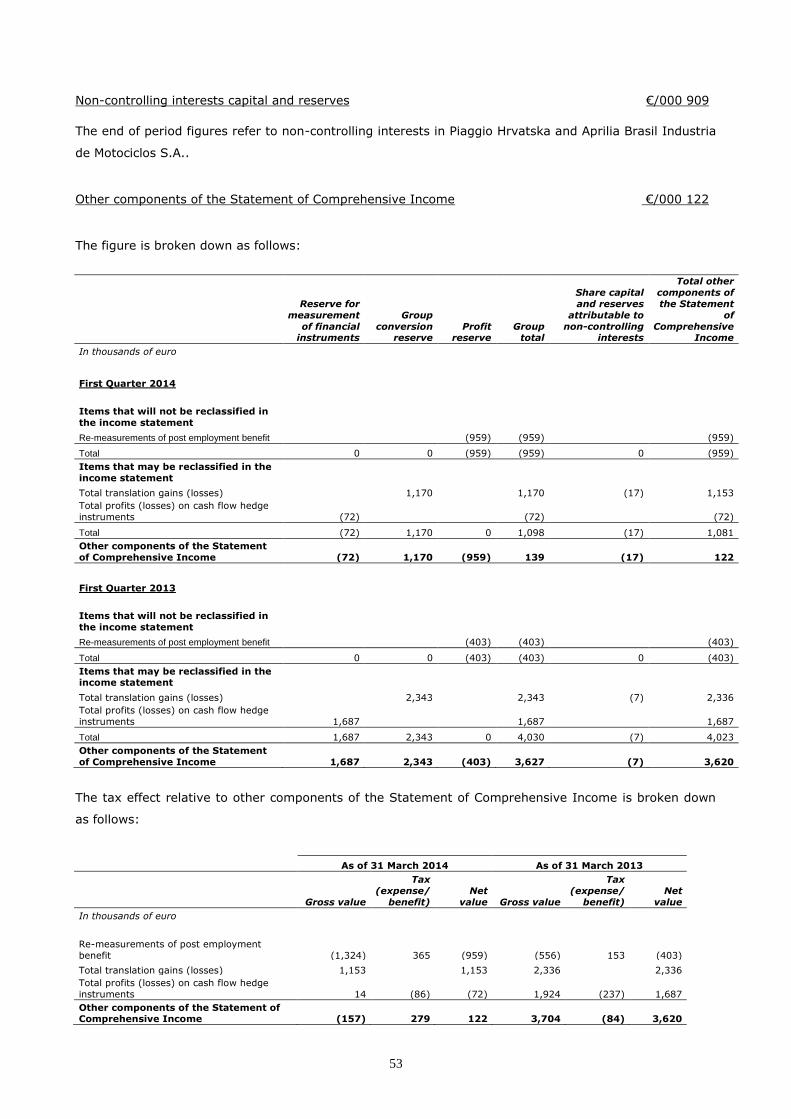
53
Non-controlling interests capital and reserves €/000 909
The end of period figures refer to non-controlling interests in Piaggio Hrvatska and Aprilia Brasil Industria
de Motociclos S.A..
Other components of the Statement of Comprehensive Income €/000 122
The figure is broken down as follows:
Reserve for
measurement
of financial instruments
Group
conversion reserve
Profit reserve
Group total
Share capital
and reserves
attributable to
non-controlling interests
Total other
components of
the Statement
of
Comprehensive Income
In thousands of euro
First Quarter 2014
Items that will not be reclassified in
the income statement
Re-measurements of post employment benefit
(959) (959)
(959)
Total 0 0 (959) (959) 0 (959)
Items that may be reclassified in the
income statement
Total translation gains (losses)
1,170
1,170 (17) 1,153
Total profits (losses) on cash flow hedge
instruments (72) (72) (72)
Total (72) 1,170 0 1,098 (17) 1,081
Other components of the Statement
of Comprehensive Income (72) 1,170 (959) 139 (17) 122
First Quarter 2013
Items that will not be reclassified in
the income statement
Re-measurements of post employment benefit
(403) (403)
(403)
Total 0 0 (403) (403) 0 (403)
Items that may be reclassified in the income statement
Total translation gains (losses)
2,343
2,343 (7) 2,336
Total profits (losses) on cash flow hedge
instruments 1,687 1,687 1,687
Total 1,687 2,343 0 4,030 (7) 4,023
Other components of the Statement
of Comprehensive Income 1,687 2,343 (403) 3,627 (7) 3,620
The tax effect relative to other components of the Statement of Comprehensive Income is broken down
as follows:
As of 31 March 2014 As of 31 March 2013
Gross value
Tax
(expense/
benefit)
Net
value Gross value
Tax
(expense/
benefit)
Net
value
In thousands of euro
Re-measurements of post employment
benefit (1,324) 365 (959) (556) 153 (403)
Total translation gains (losses) 1,153
1,153 2,336
2,336
Total profits (losses) on cash flow hedge
instruments 14 (86) (72) 1,924 (237) 1,687
Other components of the Statement of Comprehensive Income (157) 279 122 3,704 (84) 3,620

54
30. Current and non-current financial liabilities €/000 620,112
During the first quarter of 2014, the Group’s overall debt increased by €/000 68,375, going up from
€/000 551,737 to €/000 620,112. Total financial debt of the Group, net of the fair value measurement of
financial derivatives to hedge foreign exchange risk and interest rate risk and adjustment of relative
hedged items, as of 31 March 2014, increased by €/000 69,041.
Financial liabilities as of 31
March 2014
Financial liabilities as of 31
December 2013
Change
Current Non-
current Total Current Non-
current Total Current Non-
current Total
In thousands of euro
Gross financial debt
179,784
432,227
612,011
116,872
426,098
542,970 62,912 6,129 69,041
Fair Value of hedging derivatives
8,101
8,101
8,767
8,767
(666) (666)
Total 179,784 440,328 620,112 116,872 434,865 551,737 62,912 5,463 68,375
The Group’s net debt totalled €/000 540,963 as of 31 March 2014, compared to €/000 475,628 as of 31
December 2013, as indicated in the table on Net Debt included in the financial statements.
In thousands of euros As of 31 March
2014 As of 31
December 2013 Change
Liquidity 71,048 66,504 4,544
Securities 838 (838)
Current financial receivables 0 838 (838)
Payables due to banks (87,771) (52,092) (35,679)
Current portion of bank financing (59,839) (33,180) (26,659)
Amounts due to factoring companies (24,651) (23,871) (780)
Amounts due under leases (5,597) (5,809) 212
Current portion of payables due to other lenders (1,926) (1,920) (6)
Current financial debt (179,784) (116,872) (62,912)
Net current financial debt (108,736) (49,530) (59,206)
Payables due to banks and lenders (234,565) (227,587) (6,978)
Debenture loan (195,353) (195,318) (35)
Amounts due under leases (235) 0 (235)
Amounts due to other lenders (2,074) (3,193) 1,119
Non-current financial debt (432,227) (426,098) (6,129)
NET FINANCIAL DEBT (540,963) (475,628) (65,335)
* Pursuant to Consob Communication of 28 July 2006 and in compliance with the recommendation of the CESR of 10 February 2005 “Recommendation for the consistent implementation of the European Commission’s Regulation on Prospectuses“. The indicator does not include financial assets and liabilities arising from the fair value measurement of financial derivatives used as hedging, the fair value adjustment of relative hedged items equal to €/000 8,101 and relative accruals.

55
The attached tables summarise the breakdown of financial debt as of 31 March 2014 and as of 31
December 2013, as well as changes for the period.
Book value
As of 31.12.2013 Repayments
New issues
Reclassification to the current
portion Exchange
delta Other
changes
Book value as of
31.03.2014 In thousands of euro
Non-current portion:
Bank financing 227,587 45,000 (38,211) 189 234,565
Bonds 195,318 35 195,353
Other medium-/long-term loans:
of which leases - 263 (28) 235
of which amounts due to other lenders 3,193 (1,119) 2,074
Total other loans 3,193 0 263 (1,147) 0 0 2,309
Total 426,098 0 45,263 (39,358) 0 224 432,227
Book value
As of 31.12.2013 Repayments
New issues
Reclassification from the non-
current portion
Exchange delta
Other changes
Book value as of
31.03.2014 In thousands of euro
Current portion:
Current account overdrafts 13,688 (8,291) 5,397
Current account payables 38,404 43,713 257 82,374
Bonds - -
Payables due to factoring companies 23,871 780 24,651
Current portion of medium-
/long-term loans:
of which leases 5,809 (240) 28 5,597
of which due to banks 33,180 (12,229) 38,211 677 59,839
of which amounts due to other lenders 1,920 (1,113) 1,119 1,926
Total other loans 40,909 (13,582) 0 39,358 677 0 67,362
Total 116,872 (21,873) 44,493 39,358 934 0 179,784
Medium and long-term bank debt amounts to €/000 294,404 (of which €/000 234,565 non-current and
€/000 59,839 current) and consists of the following loans:
a €/000 42,857 medium-term loan from the European Investment Bank to finance Research &
Development investments planned for the period 2009-2012. The loan will fall due in February
2016 and has an initial amortisation quota of 14 six-monthly instalments to be repaid at a
variable rate equal to the six-month Euribor plus a spread of 1.323%. Contract terms require
covenants (described below). An Interest Rate Swap has been taken out on this loan to hedge
the interest rate risk;
a €/000 60,000 medium-term loan from the European Investment Bank to finance Research &
Development investments planned for the period 2013-2015. The loan will fall due in December
2019 and has an amortisation quota of 11 six-monthly instalments at a fixed rate of 2.723%.
Contract terms require covenants (described below);

56
a medium-term revolving syndicated loan of €/000 128,664 (nominal value of €/000 130,000)
granted in December 2011 and finalised in January 2012, as suspension conditions had been met.
The loan, of a total value of €/000 200,000, has an irrevocable duration of 4 years and because
of this commitment undertaken by the lenders, inter-annual use may be extended up to final
maturity. As a result, loans are classified as non-current liabilities, apart from the sum of €/000
25,000 classified as current liabilities following the planned reimbursement with funds taken from
the issue of the new Debenture Loan in April 2014. Contract terms require covenants (described
below);
a €/000 20,000 medium-term revolving loan granted in December 2013 maturing in June 2015.
The loan has an irrevocable duration of 18 months, and because of this commitment, inter-annual
use may be extended up to final maturity;
a €/000 9,099 medium-term loan for USD/000 19,000 granted by International Finance
Corporation (a World Bank member) to the subsidiary Piaggio Vehicles Private Limited with
interest accruing at a variable rate. The loan will fall due on 15 January 2018 and has an
amortisation quota of six-monthly instalments from January 2014. Contract terms include a
guarantee of the Parent Company and some covenants (described below). Cross currency swaps
have been taken out on this loan to hedge the exchange risk and interest rate risk;
a €/000 11,906 medium-term loan for USD/000 17,850 granted by International Finance
Corporation to the subsidiary Piaggio Vehicles Private Limited with interest accruing at a variable
rate. The loan will fall due on 15 July 2019 and has an amortisation quota of six-monthly
instalments from July 2015. Contract terms include a guarantee of the Parent Company and some
covenants (described below). Cross currency swaps have been taken out on this loan to hedge
the exchange risk and interest rate risk;
a €/000 14,355 medium-term loan for USD/000 19,680 granted by International Finance
Corporation to the subsidiary Piaggio Vietnam with interest accruing at a variable rate. The loan
will fall due on 15 July 2018 and has an amortisation quota of six-monthly instalments from July
2014. Contract terms include a guarantee of the Parent Company and some covenants (described
below). Cross currency swaps have been taken out on this loan to hedge the exchange risk and
interest rate risk;
€/000 3,427 of loans from various banks pursuant to Italian Law no. 346/88 on subsidised
applied research;
a €/000 3,196 loan from Banca Intesa granted pursuant to Italian Law no. 297/99 on subsidised
applied research;
a €/000 900 eight-year subsidised loan from ICCREA in December 2008 granted under Italian
Law 100/90.
All the above financial liabilities are unsecured.
The item Bonds for €/000 195,353 (nominal value of €/000 201,799) refers to:
€/000 143,837 (nominal value of €/000 150,000) related to a high-yield debenture loan issued on
4 December 2009 for a nominal amount of €/000 150,000, falling due on 1 December 2016 and
with a semi-annual coupon with fixed annual nominal rate of 7%. Standard & Poor’s and Moody’s

57
assigned a BB- rating with a negative outlook and a Ba3 rating with a stable outlook
respectively;
€/000 51,516 (nominal value of €/000 51,799) related to a private debenture loan (US Private
Placement) issued on 25 July 2011 for $/000 75,000 wholly subscribed by an American
institutional investor, payable in 5 annual portions from July 2017, with a semi-annual coupon
with fixed annual nominal rate of 6.50%. As of 31 March 2014 the fair value measurement of the
debenture loan was equal to €/000 56,134 (the fair value is determined based on IFRS relative
to fair value hedging). A Cross Currency Swap has been taken out on this loan to hedge the
exchange risk and interest rate risk.
The items Medium-/long-term bank debt and Bonds include loans which, in accounting terms, have been
recognised on an amortised cost basis (revolving loan, high-yield debenture loan and private debenture
loan). According to this criterion, the nominal amount of the liability is decreased by the amount of
relative costs of issue and/or stipulation, in addition to any costs relating to refinancing of previous
liabilities. The amortisation of these costs is determined on an effective interest rate basis, and namely
the rate which discounts the future flows of interest payable and reimbursements of capital at the net
carrying amount of the financial liability. Some liabilities were recognised at fair value, with relative
effects recognised in profit or loss.
Medium-/long-term payables due to other lenders equal to €/000 9,832 of which €/000 2,309 due after
the year and €/000 7,523 as the current portion, are detailed as follows:
a property lease for €/000 5,569 granted by Unicredit Leasing (including the entire current
portion);
a finance lease for €/000 263 granted by VFS Servizi Finanziari for the use of vehicles (non-
current portion equal to €/000 235);
subsidised loans for a total of €/000 4,000 provided by the Italian Ministry of Economic
Development and Italian Ministry of Education, University and Research using regulations to
encourage exports and investment in research and development (non-current portion of €/000
2,074).
Financial advances received from factoring companies and banks, on the sale of trade receivables with
recourse, totalled €/000 24,651.
58
Covenants
In line with market practices for borrowers with a similar credit rating, main loan contracts require
compliance with:
1) financial covenants, on the basis of which the company undertakes to comply with certain levels
of contractually defined financial indices, with the most significant comprising the ratio of net
financial debt/gross operating margin (EBITDA), measured on the consolidated perimeter of the
Group, according to definitions agreed on with lenders;
2) negative pledges according to which the company may not establish collaterals or other
constraints on company assets;
3) "pari passu" clauses, on the basis of which the loans will have the same repayment priority as
other financial liabilities, and change of control clauses, which are effective if the majority
shareholder loses control of the company;
4) limitations on the extraordinary operations the company may carry out.
The measurement of financial covenants and other contract commitments is monitored by the Group on
an ongoing basis. According to results as of 31 December 2013, all covenants had been fully met.
The high-yield debenture loan issued by the company in December 2009 requires compliance with typical
covenants of international high-yield market practices. In particular, the company must observe the
EBITDA/Net financial borrowing costs index, based on the threshold established in the Prospectus, to
increase financial debt defined during issue. In addition, the Prospectus includes some obligations for the
issuer, which limit, inter alia, the capacity to:
1) pay dividends or distribute capital;
2) make some payments;
3) grant collaterals for loans;
4) merge with or establish some companies;
5) sell or transfer own assets.
Failure to comply with the covenants and other contract commitments of the loan and debenture loan, if
not remedied in agreed times, may give rise to an obligation for the early repayment of the outstanding
amount of the loan.
Financial instruments
Exchange Risk
The Group operates in an international context where transactions are conducted in currencies different
from the Euro. This exposes the Group to risks arising from exchange rates fluctuations. For this purpose,
the Group has an exchange rate risk management policy which aims to neutralise the possible negative
effects of the changes in exchange rates on company cash-flows.
This policy analyses:

59
- the exchange risk: the policy wholly covers this risk which arises from differences between the
recognition exchange rate of receivables or payables in foreign currency in the financial statements and
the recognition exchange rate of actual collection or payment. To cover this type of exchange risk, the
exposure is naturally offset in the first place (netting between sales and purchases in the same currency)
and if necessary, by signing currency future derivatives, as well as advances of receivables denominated
in currency;
- the exchange risk: arises from changes in company profitability in relation to annual figures planned in
the economic budget on the basis of a reference change (the "budget change") and is covered by
derivatives. The items of these hedging operations are therefore represented by foreign costs and
revenues forecast by the sales and purchases budget. The total of forecast costs and revenues is
processed monthly and relative hedging is positioned exactly on the average weighted date of the
economic event, recalculated based on historical criteria. The economic occurrence of future receivables
and payables will occur during the budget year.
Cash flow hedging
As of 31 March 2014, the Group had undertaken the following futures operations (recognised based on
the regulation date), relative to payables and receivables already recognised to hedge the transaction
exchange risk:
Company Operation Currency Amount in
local
currency
Value in euro
(forward exchange
rate)
Average maturity
In thousands In thousands
Piaggio & C. Purchase CAD 1,000 652 30/04/2014
Piaggio & C. Purchase CNY 63,000 7,484 08/04/2014
Piaggio & C. Purchase GBP 1,000 1,211 28/04/2014
Piaggio & C. Purchase JPY 235,000 1,666 12/04/2014
Piaggio & C. Purchase USD 23,650 17,190 26/04/2014
Piaggio & C. Sale CAD 3,300 2,178 20/05/2014
Piaggio & C. Sale CNY 18,000 2,129 08/04/2014
Piaggio & C. Sale GBP 150 180 27/06/2014
Piaggio & C. Sale INR 150,000 1,781 28/04/2014
Piaggio & C. Sale SEK 4,900 550 24/06/2014
Piaggio & C. Sale USD 47,450 34,616 04/05/2014
Piaggio Vietnam Purchase € 7,700 7,700 15/04/2014
Piaggio Vietnam Purchase USD 2,000 1,479 15/04/2014
Piaggio Indonesia Purchase € 3,100 3,100 28/04/2014
Piaggio Vespa BV Sale USD 4,000 2,912 29/04/2014

60
As of 31 March 2014, the parent Company had undertaken the following transactions to hedge the
business exchange risk:
Company Operation Currency Amount in
local
currency
Value in euro
(forward exchange
rate)
Average
maturity
In thousands In thousands
Piaggio & C. Purchase CNY 138,250 16,568 20/07/2014
Piaggio & C. Sale GBP 11,680 13,968 01/08/2014
To hedge the exchange risk alone, cash flow hedging is adopted with the effective portion of profits and
losses recognised in a specific shareholders' equity reserve. Fair value is determined based on market
quotations provided by main traders.
As of 31 March 2014 the total fair value of hedging instruments for the economic exchange risk
recognised on a hedge accounting basis was negative by €/000 532.
Interest rate risk
This risk arises from fluctuating interest rates and the impact this may have on future cash flows arising
from variable rate financial assets and liabilities. The Group regularly measures and controls its exposure
to the risk of interest rate changes, as established by its management policies, in order to reduce
fluctuating borrowing costs, and limit the risk of a potential increase in interest rates. This objective is
achieved through an adequate mix of fixed and variable rate exposure, and the use of derivatives, mainly
interest rate swaps and cross currency swaps.
As of 31 March 2014, the following hedging derivatives were in use:
Financial flow hedging derivatives
an interest rate swap to cover a variable rate loan for a nominal amount of €/000 117,857 (as of
31 December 2013 for €/000 42,857) granted by the European Investment Bank. The structure
has fixed step-up rates, in order to stabilise financial flows associated with the loan; in accounting
terms, the instrument is recognised on a cash flow hedge basis, with profits/losses arising from
the fair value measurement allocated to a specific reserve in shareholders' equity; as of 31 March
2014, the fair value of the instrument was negative by €/000 1,524.
Fair value hedging derivatives
a Cross Currency Swap to hedge the private debenture loan issued by the Company for a nominal
amount of $/000 75,000. The purpose of the instrument is to hedge both the exchange risk and
interest rate risk, turning the loan from US dollars to euro, and from a fixed rate to a variable
rate; the instrument is accounted for on a fair value hedge basis, with effects arising from the
measurement recognised in profit or loss. As of 31 March 2014 the fair value of the instrument

61
was equal to €/000 4,561. The net economic effect arising from the measurement of the
instrument and underlying private debenture loan was negative by €/000 53;
a cross currency swap to hedge loans relative to the Indian subsidiary for $/000 19,000 granted
by International Finance Corporation. The purpose of the instruments is to hedge the exchange
risk and interest rate risk, turning the loan from US dollars to Indian Rupees, and half of said loan
from a variable rate to a fixed rate; As of 31 March 2014 the fair value of the instruments was
equal to €/000 3,447;
a cross currency swap to hedge loans relative to the Indian subsidiary for $/000 17,850 granted
by International Finance Corporation. The purpose of the instruments is to hedge the exchange
risk, turning the loan from US dollars to Indian Rupees, and to hedge the interest rate risk on the
US dollar. As of 31 March 2014 the fair value of the instruments was equal to €/000 1,388;
a cross currency swap to hedge a loan relative to the Vietnamese subsidiary for $/000 19,680
granted by International Finance Corporation. The purpose of the instruments is to hedge the
exchange risk and partially hedge the interest rate risk, turning the loan from US dollars at a
variable rate into Vietnamese Dong at a fixed rate, except for a minor portion (24%) at a variable
rate. As of 31 March 2014 the fair value of the instruments was negative by €/000 186.
As of 31 March 2014, the Group had a cross currency swap relative to the Indian subsidiary to hedge the
intercompany loan of $/000 5,000 granted by the Parent Company. The purpose of the instrument is to
hedge the exchange risk and interest rate risk, turning the loan from Euros to Indian Rupees and from a
variable to a fixed rate. Based on hedge accounting principles, this derivative is classified as non-hedging
and therefore is measured at fair value with measurement effects recognised in profit or loss. As of 31
March 2014, the fair value of the instrument was negative by €/000 48.
FAIR VALUE
In thousands of euro
Piaggio & C. S.p.A.
Interest Rate Swap (1,524)
Cross Currency Swap 4,561
Piaggio Vehicles Private Limited
Cross Currency Swap
Cross Currency Swap
4,835
(48)
Piaggio Vietnam
Cross Currency Swap (186)

62
31. Trade payables (current) €/000 360,951
As of 31 March 2014 and as of 31 December 2013 no tax payables were recorded under non-current
liabilities.
Current trade payables as of 31 March 2014 are broken down as follows:
In thousands of euros As of 31 March
2014 As of 31 December
2013 Change
Current portion:
Amounts due to suppliers 348,540 334,960 13,580
Amounts due to JV 11,825 10,492 1,333
Amounts due to affiliated companies 0
Amounts due to parent companies 586 712 (126)
Total 360,951 346,164 14,787
Payables to joint venture companies refer to the supply of vehicles from the Chinese subsidiary Zongshen
Piaggio Foshan.
32. Current and non-current portions of provisions €/000 21,208
The breakdown and changes in provisions for risks during the period were as follows:
In thousands of euros
Balance as of 31
December 2013
Allocations Applications
Reclassifications
Delta exchange
rate
Balance as of 31
March 2014
Provision for product warranties 12,478 1,969 (1,882) 16 12,581
Provision for quality-related events 0 0
Provisions for risk on investments 239 239
Provision for contractual risks 3,916 3,916
Provisions for risk on guarantee 58 58
Provision for tax risks 5,130 (5,130) 0
Other provisions for risks 4,724 35 (263) (82) 4,414
Total 26,545 2,004 (7,275) 0 (66) 21,208
The breakdown between the current and non-current portion of long-term provisions is as follows:
In thousands of euros As of 31 March
2014
As of 31 December
2013 Change
Non-current portion:
Provision for product warranties 3,913 3,826 87
Provision for quality-related events 0
Provisions for risk on investments 239 239 0
Provision for contractual risks 3,916 3,916 0
Provisions for risk on guarantee
0
Provision for tax risks 0
Other provisions for risks and charges 2,884 3,102 (218)
Total non-current portion 10,952 11,083 (131)

63
In thousands of euros As of 31 March
2014 As of 31 December
2013 Change
Current portion:
Provision for product warranties 8,668 8,652 16
Provision for quality-related events
Provisions for risk on investments
Provision for contractual risks Provisions for risk on guarantee
58 58 0
Provision for tax risks 5,130 (5,130)
Other provisions for risks and charges 1,530 1,622 (92)
Total current portion 10,256 15,462 (5,206)
The product warranty provision relates to allocations for technical assistance on products covered by
customer service which are estimated to be provided over the contractually envisaged warranty period.
This period varies according to the type of goods sold and the sales market, and is also determined by
customer take-up to commit to a scheduled maintenance plan.
The provision increased during the period by €/000 1,969 and was used for €/000 1,882 in relation to
charges incurred during the period.
Risk provisions for investments cover the portion of negative shareholders' equity of the subsidiaries
Piaggio China Co. Ltd and AWS do Brasil, as well as charges that may arise from said.
The provision of contractual risks refers mainly to charges which may arise from the ongoing negotiation
of a supply contract.
The provision for risks for taxes, established in 2013, relative to the allocation of estimated costs
following the assessment made by the Italian Revenue Agency for the years 2009, 2010 and 2011, which
ended with the issue of an Audit Report mainly concerning transfer pricing, was wholly used as it was
reclassified under tax payables following the start of settlement proceedings, which were completed with
the signing of settlement agreements in March 2014.
“Other provisions” include provisions for legal risks for €/000 2,752.
33. Deferred tax liabilities €/000 5,887
Deferred tax liabilities totalled €/000 5,887 compared to €/000 5,722 as of 31 December 2013.
34. Retirement funds and employee benefits €/000 50,800
In thousands of euros As of 31 March
2014 As of 31 December
2013 Change
Retirement funds 1,102 1,082 20
Post-employment benefits provision 49,698 48,748 950
Total 50,800 49,830 970
Retirement funds comprise provisions for employees allocated by foreign companies and additional
customer indemnity provisions, which represent the compensation due to agents in the case of the
agency contract being terminated for reasons beyond their control.

64
35. Current and non-current tax payables €/000 11,410
The item includes tax payables recorded in the interim financial statements of individual consolidated
companies, set aside in relation to tax charges for the individual companies on the basis of applicable
national laws.
Non-income tax payables comprise 4 quarterly instalments still to be paid to the Inland Revenue (from
June 2014 to March 2015) and relative to expenses arising from the assessment made by the Italian
Revenue Agency for the years 2009, 2010 and 2011, which ended with the issue of an Audit Report
mainly concerning transfer pricing, and with the subsequent signing of settlement agreements.
Payables for tax withholdings made refer mainly to withholdings on employees’ earnings, on employment
termination payments and on self-employed earnings.
Their breakdown was as follows:
In thousands of euros As of 31 March
2014 As of 31 December
2013 Change
Current portion:
Due for income taxes
1,176 2,870 (1,694)
Due for non-income tax 4,125 30 4,095
Tax payables for:
- VAT 1,957 2,283 (326)
- Withheld taxes made 2,710 6,140 (3,430)
- Other 1,442 1,264 178
Total 6,109 9,687 (3,578)
Total 11,410 12,587 (1,177)
As of 31 March 2014 and as of 31 December 2013 no tax payables were recorded under non-current
liabilities.
36. Current and non-current other payables
€/000 49,401
The breakdown between the current and non-current portion of other payables is as follows:
In thousands of euros As of 31 March
2014 As of 31 December
2013 Change
Non-current portion:
Payables to employees 1 (1)
Guarantee deposits 1,796 1,722 74
Accrued expenses 0
Deferred income 1,122 1,123 (1)
Fair Value of hedging derivatives 762 1,102 (340)
Other payables 200 200 0
Total 3,880 4,148 (268)

65
In thousands of euros As of 31 March
2014
As of 31 December
2013 Change
Current portion:
Payables to employees 19,345 15,807 3,538
Guarantee deposits 0
Accrued expenses 7,063 5,956 1,107
Deferred income 1,132 523 609
Amounts due to social security institutions 5,299
8,388 (3,089) Fair value of hedging derivatives 1,294
972 322
Sundry payables due to affiliated companies 1,614
58 1,556
Sundry payables due to parent companies 38 26 12
Sundry payables due to other related parties 6,441 6,390 51
Other payables 3,295
7,296 (4,001)
Total 45,521 45,416 105
Amounts due to employees include the amount for holidays accrued but not taken of €/000 10,444 and
other payments to be made for €/000 8,901.
The item Fair Value of hedging derivatives refers to the fair value (€/000 762 non-current portion and
€/000 762 current portion) of a hedging Interest Rate Swap recognised on a cash flow hedge basis as
provided for by IAS 39 and the fair value of hedging derivatives to hedge the exchange risk on forecast
transactions recognised on a cash flow hedge basis (€/000 532 current portion).
37. Share-based incentive plans
Since 2010, Piaggio has no longer approved any incentive plans based on the allocation of financial
instruments.
Stock option plans adopted assign rights free of charge to purchase Piaggio shares on a 1:1 ratio.
With regard to the 2007-2009 incentive plan approved by the General Meeting of Shareholders on 7 May
2007 for executives of the Company or of its Italian and/or foreign subsidiaries, in compliance with article
2359 of the Italian Civil Code, as well as for directors having powers in the aforesaid subsidiaries ("2007-
2009 plan") during the period 50,000 option rights were exercised, while 390,000 option rights expired.

66
Rights No. of
options
Average
exercise price (euro)
Market price (euro)
Rights existing as of 31.12.2013 3,370,000 1.71
° of which exercisable as of 31.12.2013
3,370,000
New rights assigned in the first quarter of 2014
Rights exercised in the first quarter of 2014 (50,000) 1.826
Rights expired in the first quarter of 2014 (390,000)
Rights existing as of 31.03.2014 2,930,000 1.78
° of which exercisable as of 31.03.2014
2,930,000
As of 31 March 2014, 2,930,000 option rights had been assigned for a corresponding number of shares.
Options are divided as follows, by assignment plan:
Number of rights as
of 31 March 2014 Period when rights may be
exercised Exercise price (€)
Assignment 11 May 2009
200,000 11 May 2012 - 11 May 2014 1.2237
Assignment 18 December 2009
2,730,000 18 Dec 2012 - 18 Dec 2014 1.826
Total
2,930,000
At the date of publication of this document, 200,000 option rights relative to the assignment of 11 May
2009, as well as 1,481,000 option rights relative to the assignment of 18 May 2009 were exercised.
Options at the date of approval of these interim financial statements therefore amounted to 1,249,000.
Detailed information on the 2007-2009 Plan is available in the documents published by the Issuer in
accordance with article 84-bis of Consob Regulation on Issuers. These documents are available on the
Issuer's institutional website www.piaggiogroup.com under Governance.
As previously mentioned in the section on consolidation principles, the cost of payments, corresponding
to the present value of options which the company determined applying the Black-Scholes valuation
model, that uses the average historical volatility of the share of the Company and average interest rate of
loans with a maturity equal to the duration of the agreement, is recognised under employee costs on a
straight line basis in the period between the date of assignment and date of accrual, with a counter entry
directly recognised in shareholders' equity.

67
37. Transactions with related parties
The main business and financial relations of Group companies with related parties have already been
described in the specific paragraph in the Report on Operations to which reference is made here. To
supplement this information, the following table provides an indication by company of outstanding items
as of 31 March 2014, as well as their contribution to the respective headings.
In thousands of euros Fondazione
Piaggio Zongshen
Piaggio Foshan IMMSI
Audit Is Molas Studio D’Urso Omniaholding IMMSI Total
% of accounting
item
Income statement
revenues from sales
17
17 0.01%
costs for materials
5,979
- 5,979 3.73%
costs for services, lease and rentals - - 213 - 25 16 648 902 1.85%
other operating income - 2,274 11
12 2,297 10.85%
other operating costs
-
8 8 0.20%
borrowing costs
-
51
51 0.51%
Assets
other non-current receivables 231
231 1.86%
current trade receivables - 843 30
- 873 0.73%
other current receivables - 4,364 20
- 6,746 11,130 37.17%
Liabilities
financial liabilities falling due after one year
2,900
2,900 0.66%
current trade payables - 11,825 - - - 20 566 12,411 3.44%
other current payables 26 1,614 12
- - 6,441 8,093 17.78%

68
38. Subsequent events
To date, no events have occurred after 31 March 2014 that make additional notes or adjustments to
these Financial Statements necessary.
In this regard, reference is made to the Report on Operations for significant events after 31 March 2014.
39. Authorisation for publication
This document was published on 14 May 2014 and authorised by the Chairman and Chief Executive
Officer.
In accordance with paragraph 2 of article 154 bis of the Consolidated Finance Act, the Executive in
Charge of Financial Reporting, Alessandra Simonotto, states that the accounting information in this
document is consistent with the accounts.
* * *
Mantua, 8 May 2014 for the Board of Directors
Chairman and Chief Executive Officer
Roberto Colaninno

69
Management and coordination IMMSI S.p.A. Share capital € 206,083,420.75 fully paid up Registered office: Viale R. Piaggio 25, Pontedera (Pisa) Pisa Register of Companies and Tax Code 04773200011
Pisa Economic and Administrative Index no. 134077
This report is available on the Internet at: www.piaggiogroup.com
CONTACTS
INVESTOR RELATIONS DEPARTMENT
Raffaele Lupotto – Senior Vice President – Head of Investor Relations
Email: [email protected]
Tel. +390587 272286
Fax +390587 276093
Piaggio & C. SpA
Via Rinaldo Piaggio 25
56025 Pontedera (PI)