shared learning oral health powerpoint - crhn.org
TRANSCRIPT

Shared Learning: Oral Health
SHARED LEARNINGS FUNDED BY THE ANTHEM FOUNDATION
55
Special Guest: Glenn Puckett, Director of Health Systems Integration withWashington Dental Service Foundation

56 I Putting the Mouth Back in the Body – WDS Foundation March 2017
May 17, 2017
Putting the Mouth Back in the Body:CPAA & The Medicaid Demonstration
Glenn Puckett, Director, Health Systems IntegrationWashington Dental Service Foundation

Agenda
> The case for change: review of the current state & why oral health is an essential part of (whole person) wellbeing
> Implementing evidence based models for oral health integration & population health
> Using the Demonstration Toolkit to Address Oral Health

Oral Disease PrevalenceTooth Decay• Most common chronic disease in
childhood Nearly 40% of kindergarteners in WA
have tooth decay Nearly 1 in 4 adults in the U.S. have
untreated tooth decay
Periodontal Disease 47% of U.S. adults have some form of
periodontal disease (> with age) 19% of adults aged 25–44 have severe
periodontal disease
Photo: Robert Henry, DMD, MPH
Photo: ICOHP

Apple Health FY 2016Children 1-17 with Dental Decay (cavities)
Children 1-17Users' Region Eligibles Accessing Care Children with
Dental Decay% of Eligibles with Dental Decay
% of Users with Dental Decay
North Central 49,480 36,158 12,546 25.4% 34.7%
Cascade Pacific Action Alliance 77,762 44,336 14,863 19.1% 33.5%
WA State 815,123 515,012 161,105 19.8% 31.3%
Pierce 103,547 60,130 18,791 18.1% 31.3%
Greater Columbia 130,893 93,235 28,826 22.0% 30.9%
King 175,952 105,323 32,552 18.5% 30.9%
North Sound 123,965 73,086 22,421 18.1% 30.7%
Better Health Together 82,711 53,700 16,178 19.6% 30.1%
Olympic 33,137 17,322 5,017 15.1% 29.0%
SW WA Regional Health Alliance 63,060 35,801 10,210 16.2% 28.5%
Other/Out of State 3,343 177 40 1.2% 22.6%

Oral Disease Systemic Diseases
> People with serious gum disease are 40% more likely to have a chronic condition on top of it.1
> Periodontal disease—correlated with a variety of conditions with systemic implications> Cardiovascular disease, heart disease, respiratory infections, diabetes, HIV, adverse pregnancy
outcomes> 91% of patients with heart disease have periodontitis, compared with 66% of people with no heart
disease.
> Systemic diseases can have an impact on oral health> Dementia> Chronic disease medications that cause xerostomia
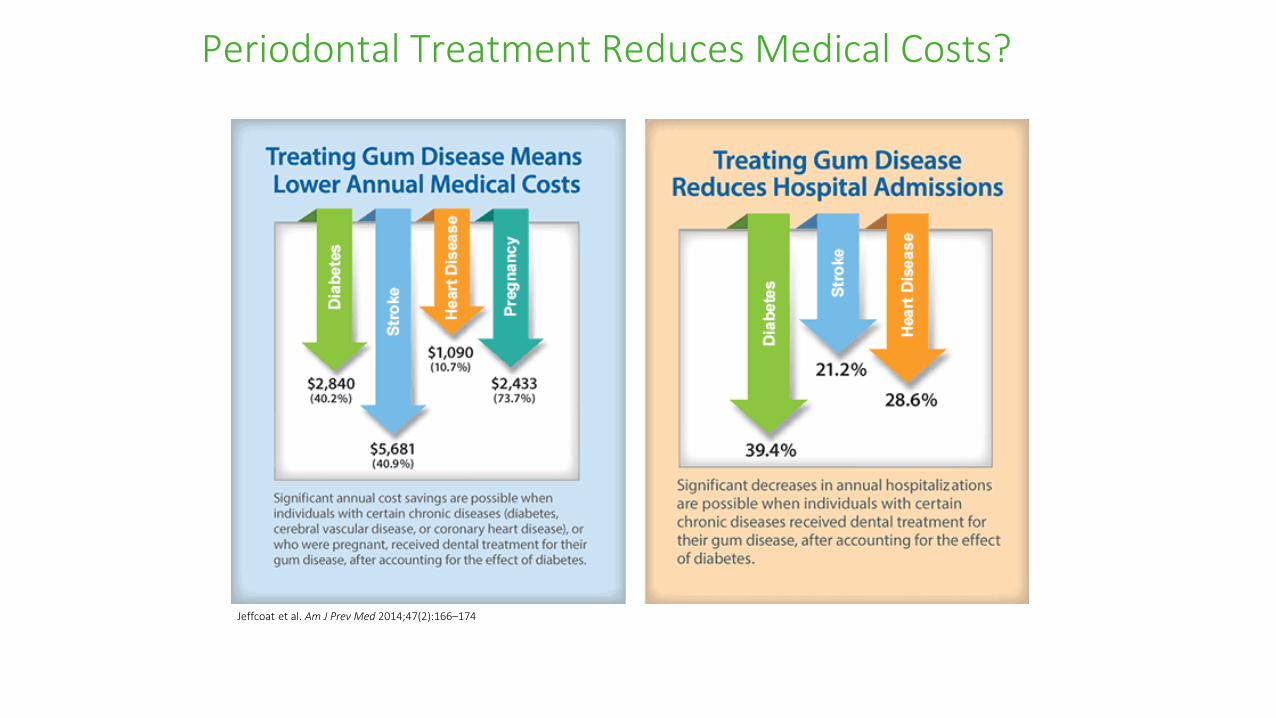
Periodontal Treatment Reduces Medical Costs?
Jeffcoat et al. Am J Prev Med 2014;47(2):166–174
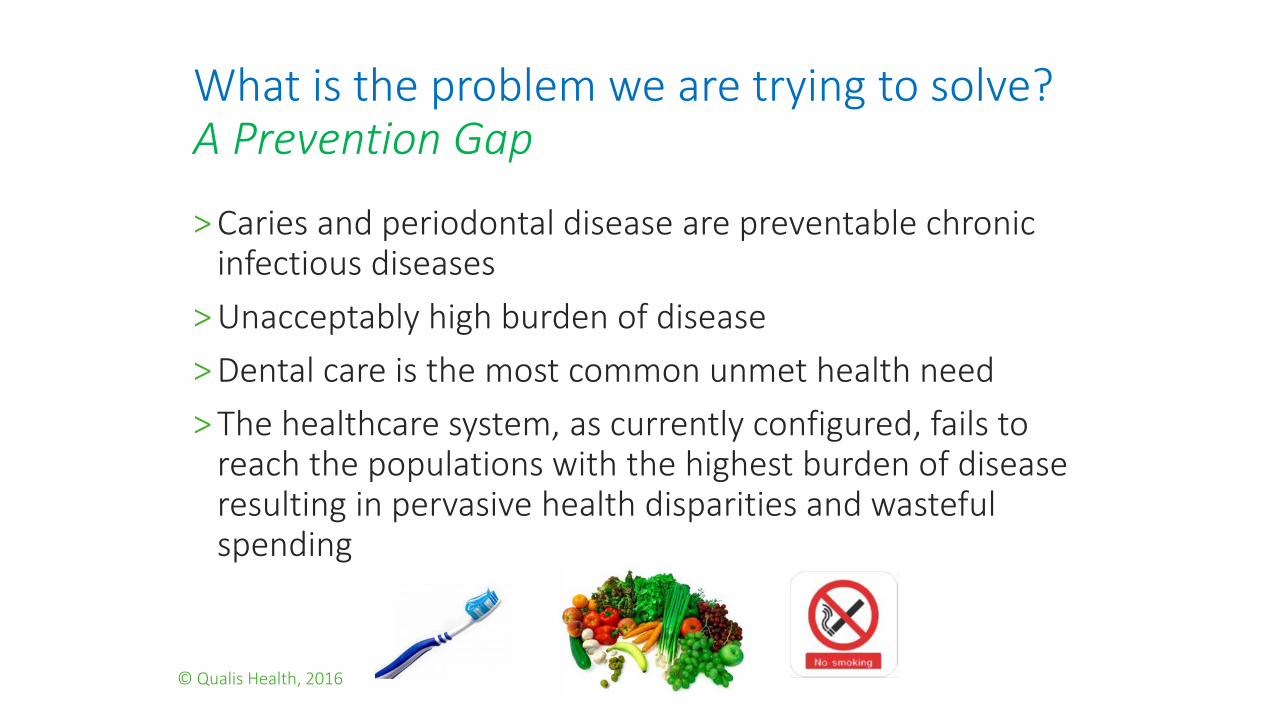
What is the problem we are trying to solve? A Prevention Gap
> Caries and periodontal disease are preventable chronic infectious diseases
> Unacceptably high burden of disease > Dental care is the most common unmet health need> The healthcare system, as currently configured, fails to
reach the populations with the highest burden of disease resulting in pervasive health disparities and wasteful spending
© Qualis Health, 2016
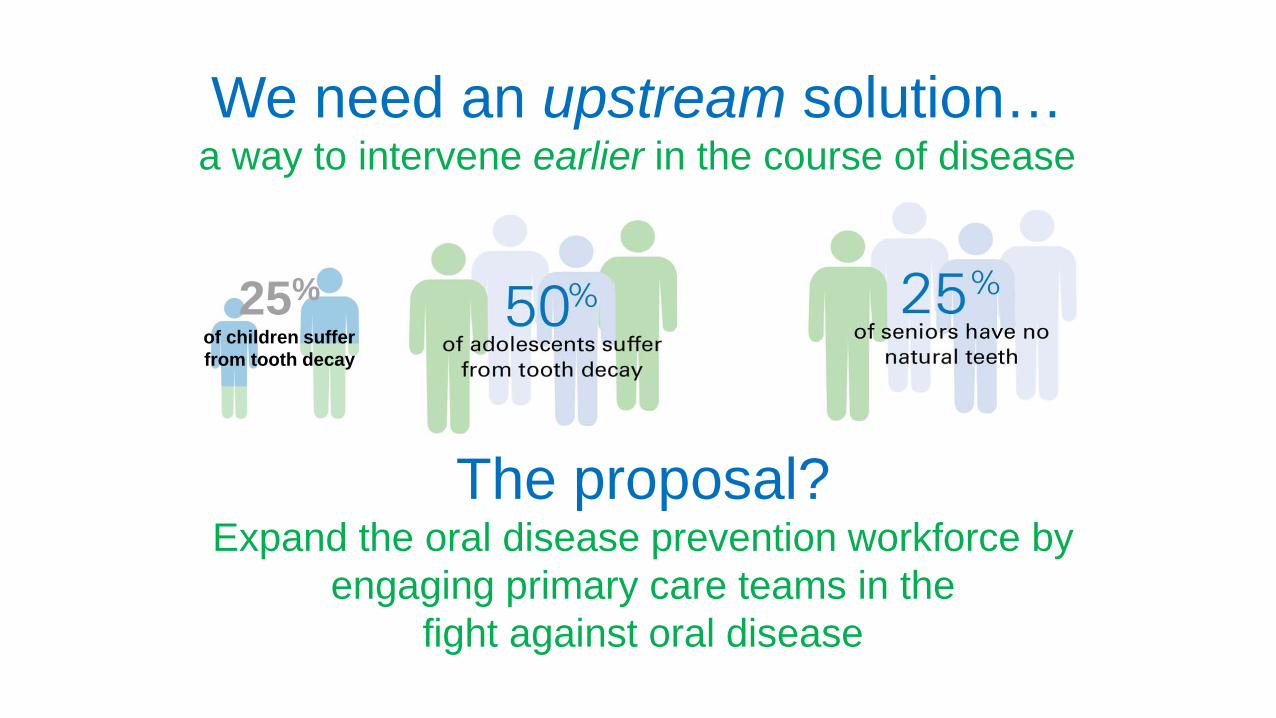
We need an upstream solution…a way to intervene earlier in the course of disease
The proposal?Expand the oral disease prevention workforce by
engaging primary care teams in the fight against oral disease
25%of children suffer from tooth decay

Population receiving regular medical care
Populationreceiving regular
dental care
Total population at risk for caries and
periodontal diseaseWhy enlist primary care teams?
Access:Frequent contact with high-risk groups:
Children, pregnant women, adults with diabetes
Skills:> Disease prevention
> Risk assessment, screening, case-finding
> Help patients navigate the healthcare system
> Engage patients in behavior change

Support for Oral Health Prevention in Primary Care
2011, Institute of Medicine (IOM) recommends expanding the role of non-dental healthcare professionals in oral health.
The U.S. Preventive Services Task Force (USPSTF) Grade B recommendation for children, “primary care providers should apply fluoride varnish to the teeth of all infants and children from the time of primary tooth eruption to age 5.”
The Health Resources and Services Administration (HRSA) issues core clinical competencies and recommendations for integrating oral health in primary care, healthcare education, and practitioner standards.
Washington State Common Measure Set includes pediatric oral health services.

Collaborative Care

Published June 2015• Case for change
• Oral Health Delivery Framework
• Supporting actions from stakeholders
• Case examples from early leaders: Confluence Health, The Child and Adolescent Clinic, Marshfield Clinic
Available at: www.QualisHealth.org/white-paper
Oral Health: An Essential Component of Primary Care
Hummel J, Phillips KE, Holt B, Hayes C. Oral Health: An Essential Component of Primary Care. Seattle, WA: Qualis Health; June 2015

19 diverse healthcare delivery organizations: Private practices, Federally Qualified Health Centers; medical only and on-site dental
Adults with diabetes (12), pediatrics (5), pregnancy (1), adult well visits (1) eCW (5), EPIC (8), NextGen (2), Centricity (2), Success EHS (2)
Direct Technical Assistance
Train-the-trainer with State PCAs
Field-Testing a Conceptual Framework
Oregon Primary Care Assoc.Kansas Assoc. Medically Underserved (*)
Massachusetts League of CHCs

“Oral Health Integration Implementation guide”Toolkit for primary care teams (Published Oct 2016)
• Workflow maps• Referral agreements• Clinical training materials• Patient engagement strategies• Patient/family education resources• EHR templates• Case examples• Impact data and more
Field-Testing Results Implementation Tools

MA reviews chart and Services Due Report to see if child has dentist noted in chart
Confirm dental insurance & name of dentist and document in chart
Provider reviews MA notes • Examines Pt• If referral to
dental necessary checks to see if already done.
• If not, fills out F/U form and alerts MA
MA checks to see if F/U order to Dental has been scheduled and schedules if needed • If Pt unable to schedule
MA sends Task to dental• MA prints Plan that
includes date of dental appointment or dental
If no dentist, receptionist routes sticky note to alert MA
MA asks OH questions, and if indicated • Fills out order for
Dental visit• Schedules dental
visit on dental schedule, which closes F/U order
Documentation of decision
Clinical information
Insurance information
Appointment information
Process information
A Workflow that Finishes the Work Before the Patient Leaves
© Qualis Health, 2017

Percent of Adults with Diabetes Assessed in past 12 Months
© Qualis Health, 2017
0%
10%
20%
30%
40%
50%
60%
70%
80%
Formal spread kickoff
“Organic spread”
Pilot Clinic

Easy to Use Primary Care Oral Health Diagnostic Terms
Clinical Concept ICD-10 CodeOral Health prevention Z29.3
Tooth decay K02.9
Gum inflammation K05.6
Oral Dryness K11.7
Unspecified lesion of oral mucosa K13.7
© Qualis Health, 2017

Standard of Care in a Protocol

What does “value” look like in dental?
Cost of care, utilization
>Procedural approach>No consistent assessment of disease severity
across population>Providers compensated for delivering services
not population health

Imagine
Dental is a valued partner in a healthcare system capable of using data and evidence to measure, finance and deliver whole person care and population health.
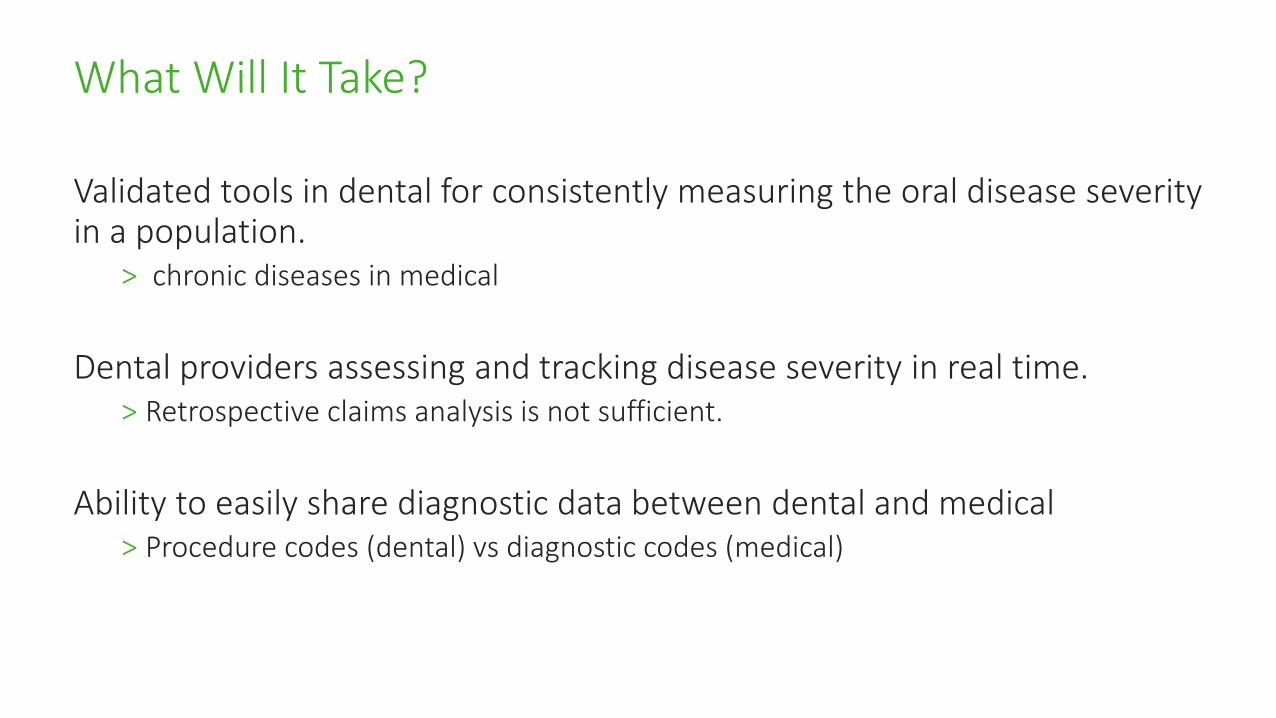
What Will It Take?
Validated tools in dental for consistently measuring the oral disease severity in a population.
> chronic diseases in medical
Dental providers assessing and tracking disease severity in real time.> Retrospective claims analysis is not sufficient.
Ability to easily share diagnostic data between dental and medical> Procedure codes (dental) vs diagnostic codes (medical)

Getting to Clinical Outcomes
> Validated 4-point scales exist that can be mapped to ICD-10 codes
> Caries: ADA Caries Classification System (CCS) > Periodontal disease AAP/CDC
> Both describe most severe tooth or tissue> No disease, mild, moderate, severe
> Both can be adapted to population health> Caries add score for involvement of pulp> Periodontal disease add score for healthy gingiva
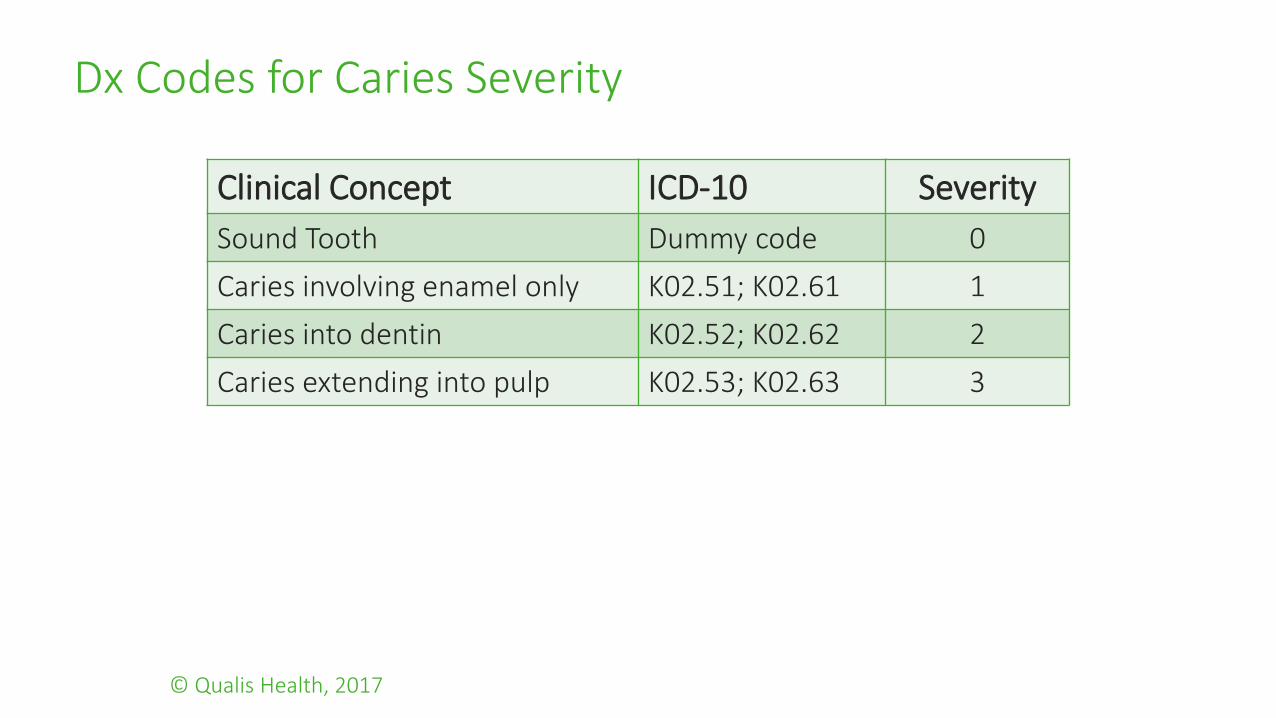
Dx Codes for Caries Severity
Clinical Concept ICD-10 Severity Sound Tooth Dummy code 0Caries involving enamel only K02.51; K02.61 1Caries into dentin K02.52; K02.62 2Caries extending into pulp K02.53; K02.63 3
© Qualis Health, 2017

Dx Codes for Periodontal Disease
Clinical Concept ICD-10 Severity Sound periodontium Dummy code 0Attachment loss with healthy periodontium
K05.30 1
Mild periodontitis K05.311; K05.321 2Moderate periodontitis K05.312; K05.322 3Severe periodontitis K05.313; K05.323 4
© Qualis Health, 2017

A Population Approach to Oral Health
Imagine 2 identical adult populations with diabetes> One receiving usual care> The other with integrated oral health
0
100
200
300
400
500
600
Sound Controlled Mild Moderate Severe0
100
200
300
400
500
600
Sound Controlled Mild Moderate Severe
Usual Care Integrated Oral Health

Enabling Pay For Performance (Value) Outcomes
> Quality of care: > Fluoride varnish for children & adults at risk> Sealants for children> Adults at greater risk screened
> Population health> Caries: severity profile> Periodontal disease: severity profile
> Utilization/Risk> ED utilization for dental disease> OR anesthesia for caries in kids

The Medicaid Waiver Project ToolkitProject 3C: Access to Oral Health Services

Oral Health Opportunities
Focus Areas
• Preventive services
• Care Integration
• Care Coordination• ED Diversion• Maternal/Child
Health• Opioids
• Using population health dental data to detect, monitor and evaluate
Populations
• Medicaid Clients
• Focus on children, pregnancy, diabetes, older adults
Outcomes
• System Outcomes• ED Diversion
• Project Outcomes• Utilization• Treatment plan
completion• Caries at recall• Completed
Referrals• Data systems
enabling population health:
•Dental diagnostic coding (ICD10)
•Disease severity Index
Evidence Based Approaches
• Fluoride Varnish(USPSTF Grade B)
• Oral health in Primary Care Framework
• Use of diagnostic coding and disease severity assessments


Medicaid Enrollees with at Least One Dental Service FY 2008 – FY 2015
> The percentage of children using dental services has risen steadily from FY 2008 to FY 2013. In FY 2014, the total number of children accessing services increased but due to more enrollees, the percentage of children using dental services decreased slightly by 0.6%. In FY 2015, the utilization rates increased back to 55.5%.
> With the restoration of adult dental program, the percent of adult enrolled using dental services increased from 13% in FY 2012 to 22% in FY 2015.
Source: Washington State Health Care Authority, Apple Health Dental Services Enrollment and Utilization Data

Non-FQHC Providers and Number of Apple Health-insured Adults Served, FY 2012 – FY 2015
> Between FY 2012 and 2014, the majority (75%-83%) of Non-Federally Qualified Health Clinic providers served 50 or less unique Apple Health-insured adults, while the remaining providers (18%-26%) served more than 50 unique Apple Health-insured adults.
> In FY 2015, the number of Non-FQHC providers who served more than 50 adults increased by 34%. Nearly two thirds of Non-FQHC providers served 50 or less adults, while one third served more than 50 Apple Health insured adults.
Source: Washington State Health Care Authority, Apple Health Dental Services Enrollment and Utilization Data
Note: Adult dental benefits were restored in January 2014. FY 2014 data reflects 6 months of services, while FY 2015 data reflects one full year of adult dental services.Non-Federally Qualified Health Clinic providers include unique individual dentists identified through Service Provider’s NPI (dentists may all be working at the same clinic)

FY 2016 Apple Health Dental Utilization by County:Adults Ages 21 and over
Statewide Utilization Total 22.1%

Apple Health FY 2016Utilization of Restorative Services
Adults Age 21 and Over Users' Region Eligibles Users % Users Greater Columbia 127,391 14,503 11.4%Better Health Together 120,610 10,896 9.0%North Central 46,728 4,036 8.6%WA State (unduplicated) 1,120,265 95,302 8.5%King 292,574 24,585 8.4%North Sound 174,185 13,596 7.8%Pierce 142,735 11,109 7.8%
SW WA Regional Health Alliance 76,473 5,450 7.1%Cascade Pacific Action Alliance 122,530 7,888 6.4%Olympic 58,428 3,518 6.0%Other/Out of State 3,694 19 0.5% Children Age 20 and Under
Users' Region Eligibles Users % Users North Central 59,948 13,970 23.3%Greater Columbia 159,253 32,487 20.4%Better Health Together 101,334 18,836 18.6%WA State (unduplicated) 994,555 179,710 18.1%Cascade Pacific Action Alliance 95,540 16,427 17.2%King 215,881 35,909 16.6%Pierce 126,201 20,728 16.4%North Sound 151,386 24,750 16.3%SW WA Regional Health Alliance 76,208 11,391 14.9%Olympic 40,656 5,554 13.7%Other/Out of State 3,909 47 1.2%

Apple Health FY 2016Utilization of Preventive Services
Adults Age 21 and Over Users' Region Eligibles Users % Users Greater Columbia 127391 13485 10.6%Better Health Together 120610 10872 9.0%King 292574 24407 8.3%WA State (unduplicated) 1,120,265 89,743 8.0%North Central 46728 3692 7.9%Pierce 142735 10458 7.3%
SW WA Regional Health Alliance 76473 5099 6.7%North Sound 174185 11456 6.6%Olympic 58428 3592 6.1%Cascade Pacific Action Alliance 122530 6722 5.5%
Other/Out of State 3694 8 0.2%
Children Age 20 and Under Users' Region Eligibles Users % Users North Central 59,948 36,452 60.8%Greater Columbia 159,253 95,842 60.2%Better Health Together 101,334 53,206 52.5%WA State (unduplicated) 994,555 513,228 51.6%King 215,881 105,128 48.7%North Sound 151,386 72,730 48.0%
SW WA Regional Health Alliance 76,208 35,227 46.2%Pierce 126,201 57,798 45.8%Cascade Pacific Action Alliance 95,540 42,994 45.0%Olympic 40,656 16,891 41.5%Other/Out of State 3,909 141 3.6%

Apple Health FY 2016Utilization of Dental Services in CPAA Region
All Ages Adults Age 21 and Over
Users' Region Eligibles Users % Users Users' Region Eligibles Users % Users Greater Columbia 286,637 134569 46.9% Greater Columbia 127391 32202 25.3%North Central 106,674 49573 46.5% Better Health Together 120610 29354 24.3%Better Health Together 221,942 87733 39.5% WA State (unduplicated) 1,120,265 247,169 22.1%WA State (unduplicated) 2,114,778 807,366 38.2% North Central 46728 9982 21.4%
SW WA Regional Health Alliance 152,678 54531 35.7% King 292574 61588 21.1%North Sound 325,566 113755 34.9% Cascade Pacific Action Alliance 122530 25414 20.7%Pierce 268,932 93603 34.8% Pierce 142735 29042 20.3%King 508,445 175619 34.5% SW WA Regional Health Alliance 76473 15283 20.0%Cascade Pacific Action Alliance 218,065 74106 34.0% North Sound 174185 34680 19.9%Olympic 99,081 29671 29.9% Olympic 58428 11057 18.9%
Other/Out of State 7,603 555 7.3% Other/Out of State 3694 361 9.8%
Children Age 20 and Under Children Age 6 and Under
Users' Region Eligibles Users % Users Users' Region Eligibles Users % Users North Central 59,948 39,591 66.0% North Central 19,608 12,341 62.9%Greater Columbia 159,253 102,369 64.3% Greater Columbia 52,209 31,110 59.6%Better Health Together 101,334 58,381 57.6% Better Health Together 33,887 18,244 53.8%WA State (unduplicated) 994,555 560,202 56.3% WA State (unduplicated) 329,820 173,530 52.6%King 215,881 114,032 52.8% Cascade Pacific Action Alliance 31,647 15,992 50.5%North Sound 151,386 79,075 52.2% SW WA Regional Health Alliance 24,656 12,308 49.9%
SW WA Regional Health Alliance 76,208 39,248 51.5% North Sound 50,676 24,393 48.1%Pierce 126,201 64,561 51.2% King 72,813 34,908 47.9%Cascade Pacific Action Alliance 95,540 48,692 51.0% Pierce 43,420 20,155 46.4%Olympic 40,656 18,614 45.8% Olympic 13,493 5,674 42.1%
Other/Out of State 3,909 194 5.0% Other/Out of State 1,654 50 3.0%

Apple Health FY 2016Dental Providers (All Providers vs Non-FQHC)
Adults Age 21 and Over Providers' Region Non-FQHC Dental Providers 1-25 Clients Served 26-50 Client Served More than 50 Client Served King 343 213 20 110Greater Columbia 166 93 14 59Better Health Together 149 74 21 54North Sound 144 99 8 37Cascade Pacific Action Alliance 132 82 11 39Pierce 117 67 10 40SW WA Regional Health Alliance 102 62 6 34Olympic 58 34 4 20Other/Out of State 30 21 4 5North Central 25 12 6 7WA State 1,266 757 104 405
Adults Age 21 and Over
Providers' Region All Providers Dental Providers Only FQHC ProvidersKing 549 507 186North Sound 268 234 84Greater Columbia 260 231 75Better Health Together 225 206 58Cascade Pacific Action Alliance 207 184 42Pierce 181 164 49SW WA Regional Health Alliance 118 107 5North Central 86 75 45Olympic 80 73 16Other/Out of State 58 32 8WA State (unduplicated) 1,930 1,717 532

Table Break-out Learning on Oral Health Please answer the following questions:
1. What strategies would be most promising in the CPAA Region?
2. If you could do one thing to improve oral health in our region what strategy would you choose?
3. What else do we need to know?
92