shared mobility simulations for helsinkiorfe.princeton.edu/~alaink/smartdrivingcars/pdfs... · can...
TRANSCRIPT

Corporate Partnership Board
CPB
Shared Mobility Simulations for Helsinki
Case-Specific Policy Analysis
Shared Mobility Simulations for Helsinki
Case-Specific Policy Analysis
The International Transport Forum
The International Transport Forum is an intergovernmental organisation with 59 member countries.
It acts as a think tank for transport policy and organises the Annual Summit of transport ministers. ITF is
the only global body that covers all transport modes. The ITF is politically autonomous and
administratively integrated with the OECD.
The ITF works for transport policies that improve peoples’ lives. Our mission is to foster a deeper
understanding of the role of transport in economic growth, environmental sustainability and social
inclusion and to raise the public profile of transport policy.
The ITF organises global dialogue for better transport. We act as a platform for discussion and pre-
negotiation of policy issues across all transport modes. We analyse trends, share knowledge and promote
exchange among transport decision-makers and civil society. The ITF’s Annual Summit is the world’s
largest gathering of transport ministers and the leading global platform for dialogue on transport policy.
The Members of the ITF are: Albania, Armenia, Argentina, Australia, Austria, Azerbaijan, Belarus,
Belgium, Bosnia and Herzegovina, Bulgaria, Canada, Chile, China (People’s Republic of), Croatia,
Czech Republic, Denmark, Estonia, Finland, France, Former Yugoslav Republic of Macedonia, Georgia,
Germany, Greece, Hungary, Iceland, India, Ireland, Israel, Italy, Japan, Kazakhstan, Korea, Latvia,
Liechtenstein, Lithuania, Luxembourg, Malta, Mexico, Republic of Moldova, Montenegro, Morocco, the
Netherlands, New Zealand, Norway, Poland, Portugal, Romania, Russian Federation, Serbia, Slovak
Republic, Slovenia, Spain, Sweden, Switzerland, Turkey, Ukraine, the United Arab Emirates, the United
Kingdom and the United States.
International Transport Forum
2, rue André Pascal
F-75775 Paris Cedex 16
www.itf-oecd.org
Case-Specific Policy Analysis Reports
The ITF’s Case-Specific Policy Analysis series presents topical studies on specific issues carried out
by the ITF in agreement with local institutions. This work is published under the responsibility of the
Secretary-General of the ITF. The opinions expressed and arguments employed herein do not necessarily
reflect the official views of ITF or OECD member countries.

ACKNOWLEDGEMENTS – 3
SHARED MOBILITY SIMULATIONS FOR HELSINKI — © OECD/ITF 2017
Acknowledgements
This report is part of an ongoing series of studies at the International Transport Forum on shared
mobility in different urban and metropolitan contexts. Funding for this specific project was provided by
Helsinki Region Transport (HSL), City of Helsinki, City of Espoo, City of Vantaa and the Finnish
Transport Agency. The local project group was led by Sini Puntanen (Director of Transport System and
Research Department, HSL Helsinki Region Transport) and included Tapani Touru (Head of Transport
System Group, HSL Helsinki Region Transport), Pekka Räty (Research Specialist, HSL Helsinki Region
Transport), Heikki Palomäki (Transport Planner, HSL Helsinki Region Transport), Heikki Hälvä (Head
of Transport System Unit, City of Helsinki), Samuel Tuovinen (Planning Manager, City of Espoo), Tiina
Hulkko (Traffic Engineer, City of Vantaa), Jukka Peura (Road and Transport Planning Specialist,
Finnish Transport Agency), Asta Tuominen (Head of Unit and Organization, Finnish Transport Agency),
Krista Huhtala-Jenks (Ministerial adviser, Ministry of Transport and Communications).
The principal author of this report was Francisco Furtado, with technical advice by Luis Martinez
and support from Olga Petrik of the International Transport Forum. The project was supervised by Jari
Kauppila. Philippe Crist provided valuable comments and Liv Gudmundson copy-edited the manuscript.


TABLE OF CONTENTS – 5
SHARED MOBILITY SIMULATIONS FOR HELSINKI — © OECD/ITF 2017
Table of contents
Executive summary ....................................................................................................................................... 7
Introduction ................................................................................................................................................. 11
Simulation modelling framework .............................................................................................................. 15
Agent-based model: Users, vehicles and dispatchers ................................................................................ 15
Characterisation of the case study ............................................................................................................. 17
Modelling current travel ............................................................................................................................. 21
Travel options ............................................................................................................................................ 21
Mode choice model .................................................................................................................................... 23
Synthetic mobility sets ............................................................................................................................... 25
Understanding preferences of potential users .......................................................................................... 31
Participants’ socio-demographic and mobility backgrounds ..................................................................... 32
Focus group ............................................................................................................................................... 34
Stated preference survey ............................................................................................................................ 35
Review of users preferences ...................................................................................................................... 43
Setting the shared mobility scenarios ........................................................................................................ 47
Car replacement ......................................................................................................................................... 48
Bus replacement ......................................................................................................................................... 50
Impacts on the city and transport system ................................................................................................. 53
Aggregate results ....................................................................................................................................... 53
Congestion ................................................................................................................................................. 59
Reductions and changes to parking requirements and infrastructure......................................................... 60
Increases in metro and rail ridership .......................................................................................................... 64
Potential changes in accessibility............................................................................................................... 67
Key findings ............................................................................................................................................... 68
Performance indicators ............................................................................................................................... 71
Quality of service ....................................................................................................................................... 71
Operational performance ........................................................................................................................... 78
Costs .......................................................................................................................................................... 80
Electric vehicle fleet .................................................................................................................................. 82
Key findings ............................................................................................................................................... 83

6 – TABLE OF CONTENTS
SHARED MOBILITY SIMULATIONS FOR HELSINKI — © OECD/ITF 2017
Conclusions .................................................................................................................................................. 85
Key findings ............................................................................................................................................... 85
Future research needs ................................................................................................................................. 87
References .................................................................................................................................................... 89
Annex 1. Depots and Taxi-Bus stops .......................................................................................................... 91
Annex 2. Example of a stated preference survey question ...................................................................... 92
Annex 3. Baseline congestion ...................................................................................................................... 93
Annex 4. Effective access ............................................................................................................................ 94
Annex 5. Costs and electric vehicles specifications ................................................................................... 95

EXECUTIVE SUMMARY – 7
SHARED MOBILITY SIMULATIONS FOR HELSINKI — © OECD/ITF 2017
Executive summary
What we did
New types of ride-sharing services have been gaining ground in recent years, especially in urban
areas. These services may be precursors to more optimised shared mobility solutions that could deliver
better outcomes for citizens. This report examines how the optimised use of new on-demand shared
transport modes can change the future of mobility in the Helsinki Metropolitan Area in Finland. To
assess the impact of these new modes the entire mobility over the course of one working day was
simulated for the Helsinki Metropolitan Area under different scenarios. These included the full
replacement of all motorised road modes (car, taxi and buses) and partial adoption of the new shared
services by targeting specific trips and users (e.g. only the 20% car trips more likely to shift to shared
mobility are replaced). The current rail-based services (rail, metro and tram) were kept operating in all
scenarios while the new shared services can be employed to feed metro and rail.
The analysis comprised three main elements: First, modelling the current personal mobility and
transport network of the Helsinki Metropolitan Area; second assessing the openness and preferences of
potential users of the new modes via a focus group meeting; and third, a micro-simulation agent-based
model where the introduction of the new shared options is simulated. The focus group meeting had two
components, a discussion part and a stated preference survey. A total of 20 citizens from the Helsinki
region with a balanced mix of socio-demographic and mobility profiles took part in that meeting. The
agent-based model reproduced personal daily mobility patterns and the interactions between users and
shared mobility. The outputs include a wide array of indicators measuring the new modes performance
regarding service quality, productive efficiency and cost competitiveness, plus the impacts on
accessibility, rail/metro ridership, required parking space, congestion and CO2 emissions for the Helsinki
Metropolitan Area. The simulation assumes current demand patterns, i.e. that there is no induced demand
due to any potential accessibility increases or reductions in travel costs.
The ultimate goal of this document is to provide an evidence base for decision makers to weight the
opportunities and challenges created by these new services. The leading questions discussed in this study
include: Are the citizens of the Helsinki Metropolitan Area open to embracing shared mobility solutions?
What are the potential users’ preferences and who will be the first movers? What aspects must be
considered when designing policies to promote a shift towards the new modes? To what extent are these
new services complementary with existing public transport offer, namely rail and metro? The
agent-based micro simulation model was previously tested on a single region, to what degree is it
transferable to other metropolitan areas? What insights from the Helsinki Metropolitan Area case study
can be generalised and are of potential use to other urban regions?
What we found
In the simulation, the shared mobility solutions tested delivered significant positive impacts to the
Helsinki Metropolitan Area. For the scenarios with lowest car replacement (20% of car trips replaced)
the CO2 emissions reduction were in the same order of magnitude as those achievable with impactful
measures such as congestion charges. Furthermore, it provides for increases in equitable access, service
quality and would mean a relevant shift away from car travel. More ambitious scenarios achieved
additional reductions of congestion and increases in freed public space currently needed for private car
parking. With an electric fleet of shared vehicles, CO2 emissions would be further reduced.

8 – EXECUTIVE SUMMARY
SHARED MOBILITY SIMULATIONS FOR HELSINKI — © OECD/ITF 2017
The simulation results indicated that access to jobs and other services becomes more equitable with
the new shared transportation options. Access improved particularly for areas further from the city centre
which are less well-serviced by public transport. For trips within the city of Helsinki the public transport
offer is already robust. There is also good service for some radial axes connecting the outer areas to the
city centre. However, in zones with lower accessibility to the trunk routes of the public transport
network, the car is the preferred mode of transport. The same is true for travel patterns that do not fit the
radial-axis logic. Here, the simulated shared mobility solutions can provide increased flexibility and
comfort that traditional public transport services alone have difficulty to achieve, thereby fostering a
modal shift away from cars.
Importantly, shared mobility solutions can act as feeder services and improve access to metro and
rail lines. This option combines the new shared modes’ flexibility with the high capacity of rail-based
transport. Most focus group participants regarded this combined offer as highly relevant. The simulation
results showed that significant increases in metro and rail ridership are possible, particularly in the more
ambitious scenarios. In addition, replacing low-occupancy and low-frequency bus services has positive
impacts on emissions reduction, which was not the case when other buses were replaced. The positive
impacts of the new shared modes are maximised when they replace car travel and are implemented in
articulation with public transport.
The focus groups showed that users prefer having new mobility services available throughout the
metropolitan area, not just the city itself. They particularly welcome them in areas with low public
transport performance. Users residing further from the centre are more likely to favour the new modes
than those living close to the centre. The evidence suggests that public transport users are more willing
than car users to adopt the new shared modes. The same was the case with users over the age of 55.
Regardless of the socio-demographic characteristics, potential users showed a pragmatic approach to
choosing a transport option, with a high sensitivity to price and service quality.
Generally, both the survey and focus group discussions indicated that citizens of the Helsinki
Metropolitan Area have a distinctly positive attitude towards the proposed forms of shared mobility.
They expressed a clear wish to see such services added to the existing offer and an expectation that they
can be a tool to improve mobility in the Helsinki Metropolitan Area.
What we recommend
Enable implementation of new shared mobility solutions in the Helsinki Metropolitan Area as an
additional policy tool
Optimised shared mobility can provide significant benefits to the Helsinki region. Replacing private
car trips in areas currently not well served by public transport and using flexible, on-demand Taxi-Bus
and Shared Taxi as feeder services for existing rail and metro lines would result in better and more
equitable access to opportunities, improved service quality and a reduction of CO2 emissions. Emissions
could be further reduced if a shared mobility approach is complemented with support for the use of
electric vehicles in the fleet. In all cases, transition will require the alignment of other policy tools, such
as pricing, regulation, land-use and infrastructure design.
Implement new shared mobility solutions at a sufficient scale to boost attractiveness and lower
costs
The benefits of on-demand shared mobility services depend on creating the right market conditions
and operational frameworks. Feedback from the focus group indicates that users in the Helsinki metro
area are open to such solutions. However, in order to be effective they need to be implemented on a large

EXECUTIVE SUMMARY – 9
SHARED MOBILITY SIMULATIONS FOR HELSINKI — © OECD/ITF 2017
scale throughout the metropolitan area and not only in parts of it. Sufficient scale is also important for
achieving manageable costs. Any business model for shared mobility should be carefully vetted in terms
of its potential for innovation, keeping prices for users low and regulation ensuring societal benefits over
all.
Design shared mobility solutions so they feed rail/metro lines and replace low-frequency,
low-occupancy bus services
Existing public transport in the city of Helsinki and on certain axes provides a good level of service
in international comparison. But new shared transport modes can complement the existing services and
improve the offer for less frequent and low-occupancy bus routes. The study shows that users
particularly value shared mobility as a first- or last-mile solution to access metro or rail trips. This
provides an opportunity to increase the modal share of metro and rail while contributing to reducing
congestion and emissions.
Target shared mobility solutions for sub-urban car users currently not well served by public
transport
Shared mobility services have maximum positive impact when they are adopted by private car
users. Policy measures, new services and information campaigns should thus target specifically the
potential early adopters among this group: Car users who travel from the outskirts of the metropolitan
area along routes not matched by the public transport network. These trips represent a large share of
current car travel. If designed well, both price and quality of the shared modes can be attractive for these
users. Focusing on this shift would leverage the most out of the added flexibility and comfort provided
by shared mobility, which combined with public transport would deliver a transport system that as a
whole is more sustainable.
Consider improvements in system capacity and access to rail and metro stations
A wide-range deployment of shared mobility would significantly reduce the parking space required
for private cars and road space taken by congestion. This space would become available for other uses.
On the other hand, large-scale use of Shared-Taxis and Taxi-Buses requires drop-off and pick-up zones,
especially at rail stations, schools or large employers. The number of boardings in some stations would
increase sharply (up to three-fold), requiring operational changes. Dynamic policies may be needed to
manage more vehicles in the access links to terminals. The rail and metro network may need additional
capacity to cope with higher number of users.


INTRODUCTION – 11
SHARED MOBILITY SIMULATIONS FOR HELSINKI — © OECD/ITF 2017
Introduction
The pace of digitalisation in transport, especially in cities, has accelerated in recent years just as
many new technologies have been introduced and as citizens have adopted new behaviours. The
conflation of technology, both within and outside of the transport sector, with evolving societal trends
and new relationships built around the production and consumption of services has been faster than
anticipated by many authorities and has outpaced the speed of regulatory adjustments. These are real
challenges for public authorities and it is likely that the kind of disruptions appearing now foreshadow
even greater ones that may come about in the future.
The arrival of new types of shared mobility services has recently gained ground, especially in urban
areas. These services may be precursors to more optimised shared mobility solutions that could deliver
better outcomes for citizens.
Previous reports at the International Transport Forum at the OECD have looked at the potential
impacts of new shared urban mobility solutions leveraged by digital connectivity in the city of Lisbon
(ITF, 2015; 2016; 2017). The results of these simulations are extremely promising in terms of a strong
reduction of the required vehicle fleet, parking space, emissions and congestion while improving equity
of access. The ITF Shared Mobility Model simulates daily travel for a hypothetical shared mobility
system. However, results from one city are never fully and directly transferable to another city and the
ITF set out to test the transferability of the model to other cities around the world. The city and
metropolitan area of Helsinki are the case study approached in this report.
Looking at the potential of new mobility services and technologies is precisely one of the key
vectors of the on-going Helsinki Region Transport System Plan (HLJ). The plan is promoted by several
stakeholders invested in the further development of the Helsinki region – 14 Municipalities, Helsinki
Regional Transport (HSL) and Government. This regional co-operation is carried out in order to strive
for regional goals. In addition to providing flexible long-term strategic guidelines, concrete actionable
measures for the near future are also expected outcomes from the planning process. Currently the biggest
challenge is to decrease CO2 emissions by 50% by 2030. The HLJ planning process has been developing
gradually and is currently done in conjunction with land-use and housing plans (MAL 2019).
Traditionally the transport plan has focused mostly on infrastructure projects. Although this is still of
concern, the current approach aims for a broader set of tools introducing digitalisation, automation and
regulatory changes to the plan.
Indeed, the Finnish capital has already experimented with innovative services that share some
similarities to the Taxi-Bus services described below, namely the on-demand buses known as Kutsuplus
(HSL, 2016a). At the moment there are several experiments underway concerning new technologies,
such as testing automated vehicles or the use of real time data for traffic monitoring. Steps are being
taken to implement Mobility as a Service (MaaS), where the whole transport system is user- and
service-oriented.
This report examines how the optimised use of new shared modes can change the future of mobility
in the Helsinki Metropolitan Area (HMA). To assess this change the entire mobility of the HMA is
simulated for one working day, including the current modes and different adoption rates of the new
shared services. The simulation provides a detailed array of indicators that allow the measurement of:
12 – INTRODUCTION
SHARED MOBILITY SIMULATIONS FOR HELSINKI — © OECD/ITF 2017
Impacts on the city and the transportation system, such as decreases in CO2 emissions, required
parking space, car use, congestion, changes to accessibility and the extent of modal shift.
New shared services performance, both from a user perspective (travel times, waiting times,
access times, number of transfers) and operator or production side (number of vehicles,
occupancy, depot location and sizes, costs).
The indicators produced for different scenarios, together with the built up knowledge obtained from
previous reports, allow for an increased understanding of the policy implications that come from the
emergence of these new services. The ultimate goal of this document is to provide governments and
other public officials with meaningful advice regarding the challenges and opportunities brought by these
new services. Some of the questions discussed are:
Are the people of HMA open to embracing shared mobility solutions in such a large scale? What
are the potential users’ preferences and who will be the first movers? Which factors should be
taken into account when managing the transition to these new services?
What should be considered when designing policies promoting the shift towards new modes?
Which parameters can help balance the sometimes conflicting aims of quality of service,
emission reductions, political feasibility and operational/cost performance?
To what extent are these services complementary to the existing offer of public transport, namely
rail and metro? In the cases of increased ridership for the latter, will changes in the infrastructure,
namely stations, be required?
The shared mobility model has been employed for a single test case, Lisbon. What new insights
can the HMA case study bring towards the model transferability and generalisation of previous
findings?
In order to get to the above outputs and insights a combination of qualitative and quantitative
approaches were employed. The main steps of the analysis include modelling the current personal
mobility and transportation network, a focus group meeting with potential users and a micro-simulation
agent-based model where the new modes were introduced.
To model the current personal mobility a “synthetic population” is generated which represents the
entire population in the metropolitan area and their respective trips. For each person all the daily trips are
recorded along with their characteristics like origin-destination, departure time, trip duration and length,
mode taken, distances for each mode and if it is the case (for public transport trips) waiting, access and
on board times, plus the number of transfers. This “synthetic population” is generated by an algorithm
that combines information from the travel survey with the land uses, transportation network, set of all
possible mode alternatives between each origin and destination, plus a discrete choice model developed
for the current situation.
The focus group meeting has two components, a discussion part and a stated preference survey. This
allows exploring the HMA transport users’ preferences regarding the proposed shared modes and
comparing them to the existing urban and metropolitan transport options. It includes identifying and
quantifying the new modes most relevant attributes that together with the users’ socio-demographic
characteristics influence their mode choice. This provides a profile for users that are potential early
adopters of the new services. It also assists in the design of the shared modes so that they are better
tailored to the potential users’ needs, thus facilitating the desired modal shift.

INTRODUCTION – 13
SHARED MOBILITY SIMULATIONS FOR HELSINKI — © OECD/ITF 2017
The micro-simulation model reproduces the daily mobility patterns and the interactions between
users and shared mobility modes in a transport network for a metropolitan context. The agent-based
simulation enables a dynamic optimisation that matches supply and demand, minimising detour distances
and travel times. The simulation provides a wide array of indicators measuring the new modes
performance regarding quality of service, productive efficiency and cost competitiveness, plus the
impacts on accessibility, current public transportation, required parking space, congestion and emissions
for the Helsinki Metropolitan Area. The results are achieved assuming current demand patterns, i.e. that
there is no induced demand due to potential accessibility increases and travel cost reduction.
The model allows testing different transport scenarios for the same time-space mobility patterns,
while preserving the citizens’ current behavioural preferences. The scenarios tested include full
replacement of road based motorised modes and partial adoption of the new shared services. In the
former the currently existing motorised transport alternatives (car, taxi, and bus) are completely
substituted by the shared modes, either from start to finish or as feeder services to heavy modes (rail,
metro). For the partial-adoption scenarios only certain motorised modes trips are substituted, depending
on utility value associated with car trip for a given user, trip location, or bus trip/services characteristics.
In all cases the rail-based modes (rail, metro and tram) are kept. The partial-adoption scenarios are
particularly relevant for investigating the impact of a gradual deployment of the services and obtaining
insights concerning different transition strategies and their feasibility.
The new shared mobility services considered are: Shared Taxi and Taxi-Bus (see Table 1).
Table 1. Shared mobility services
Mode Booking Access Vehicle type
Shared Taxi Real time Door-to-door Minivan currently seating 8
rearranged to seat only 6,
providing easy entry and exit
Taxi-Bus 30 minutes in
advance
Boarding and
alighting up to
400 m away from
door
Minibuses with 8 or 16 seats.
No standing places
These services mostly provide full start-to-finish trips that replace current motorised road transport
alternatives (car, taxi and bus), but they are also employed as feeders to heavy transport modes (metro,
rail). Both the Shared Taxi and Taxi-Bus services are on-demand and dynamically dispatched. Shared
Taxi operates a door-to-door service in spacious vehicles for up to six people. They move along real-time
optimised trajectories with small detours for boarding and alighting passengers. Taxi-Bus is a street
corner-to-street corner service that requires a 30-minute advanced reservation, providing transfer-less
trips in a minibus of 8-16 people along dynamically defined routes. The corners where the Taxi-Bus can
stop belong to a predefined set of locations across the region (see Annex 1). They are, as much as
possible, near existing bus stops. Hence, when the user reserves a service and receives a notification it
comes with information on which Taxi-Bus stop to go to and that stop – which is near a street corner and
existing bus stop – is at a given physical location that is identified.
The two services specifications are designed to minimise public transport’s negative features
compared to private car travel. The aim is to have services that offer users levels of flexibility, comfort
and availability closer to car travel than the current public transport offer.

14 – INTRODUCTION
SHARED MOBILITY SIMULATIONS FOR HELSINKI — © OECD/ITF 2017
The report is structured as follows. First the simulation modelling framework is introduced. Then
the case study is broadly described. Next it is explained how current travel is modelled. This is followed
by the presentation of the study performed in order to better understand the potential users’ preferences.
Afterward the scenarios tested in the simulation are explained. The simulation results and respective
findings are discussed, first considering their overall impacts in the Helsinki Metropolitan Area and then
the performance of the shared mobility services. The report ends with a summary of the key insights and
further topics of interest that are not explicitly addressed by the model, as well as other effects that go
beyond the transportation field.

SIMULATION MODELLING FRAMEWORK – 15
SHARED MOBILITY SIMULATIONS FOR HELSINKI — © OECD/ITF 2017
Simulation modelling framework
The general modelling framework used for the shared mobility simulation is built upon an
agent-based model that simulates the daily mobility of people in a city. This and previous work is
derived from an agent-based model that simulates the daily mobility of various urban areas – in this case
HMA.
Agent-based model: Users, vehicles and dispatchers
The model is built around three main agents that interact in a common environment: users, vehicles,
and the dispatching entity. The model works with a synthetic population of trips that serves as a plausible
proxy for every trip taken on a normal weekday. These trips occur across a spatial context where
transport networks are present (for both road and rail) and where public transport supply is represented
by existing routes (bus, tram, metro and rail). The model addresses the interaction between clients and
vehicles, simulating their connection and how, in terms of timing and location, the services are
performed. The approach is based on a static representation of the traffic environment where origin-
destination flows are allocated to a rather complete, topologically correct road network that accounts for
per-link occupancy (and thus for speeds), by time of day. Travel time is attributed to each arc and
intersection, using a dynamic traffic assignment procedure that updates travel time estimates based on
flow capacity ratio every five simulation minutes.
In the simulation for shared use services, the dispatcher system manages the centralised task of
assigning trip requests to vehicles using the location of shared vehicles, their current occupancy level and
the location of clients as its main inputs. The model estimates trip routing on the basis of an algorithm
that generates the lowest time cost and insertion cost path between any pair of nodes of the network.
The Helsinki municipality is divided in a homogeneous grid of 200 metres (m) x 200 m cells,
whereas the metropolitan area is segmented into a grid 500 m x 500 m cells. All trip origins and
destinations are linked to the closest node of the road network.
In the simulation environment, a trip is generated when a user requests a departure from a point to
another point. The model accounts for the simulation parameters (resulting from the specification of each
shared mode) and accounts for waiting time, detour time and arrival time tolerances that are defined for
the model run. The dispatcher then finds, in real time or with the pre-booking, the best possible routing
and assigns one of several available vehicle types to carry out the trip in either a Shared Taxi or Taxi-Bus
mode.
The user then waits for the vehicle or walks to a specified pick-up location and boards the vehicle.
When the vehicle arrives at its destination, the user exits the system and a set of indicators are generated
in a trip log for ex-post system evaluation.
Idle cars are located in depots spread across the city and whenever the car is empty and not
dispatched to a new trip, it relocates itself to the nearest depot. Active cars follow the shortest path and
minimise travel time for its route assignment taking into account dynamically updated link travel times
(every five minutes).
Taxi-Buses start their route at the departure stop of each generated route by relocation from the last
performed service. The location of these pop-up stops is constrained by the minimum distance between
16 – SIMULATION MODELLING FRAMEWORK
SHARED MOBILITY SIMULATIONS FOR HELSINKI — © OECD/ITF 2017
stops (400m) and the selection of the road node with greater connectivity in the neighbouring area in
order to ensure flexible routing for the vehicles (e.g. by avoiding as much as possible streets with traffic
only in one direction or left turning blocking).
The fleet of cars and minibuses is an output of the simulation by measuring the number of vehicles
that are required in the simulation and their relocation dynamics between depots during the day. The
required minibuses are differentiated between 8- or 16-seated passenger vans or minibuses.
The dispatcher defines a set of rules for matching cars to users, centralising all real-time information
required to produce and monitor these trips. The choice of which car or minibus to match with a user’s
request takes into account a time-minimisation principle that applies not just to the requesting user but
also to those already underway in the same vehicle. Several parametric constraints are defined that must
be satisfied for each trip route solution proposed by the dispatching system as described in Tables 1 and
13.
The model defines in parallel the dispatching of Taxi-Bus and Shared Taxis when both systems are
operating. Users launch their requests and preferences that are recorded in the system. Taxi-Bus requests
are processed 30 minutes in advance. The dispatcher runs a local search algorithm that tries to maximise
the number of passengers assigned complying with the users constraints at each step (the best match in
Taxi-Bus service that warrants at least 50% occupancy at least in some part of the trip and an average
per-kilometre occupancy rate greater than 25 % of the vehicle capacity). Users not assigned to Taxi-
Buses because of these constraints are then re-assigned (upgraded) to the Shared Taxi system as real-time
requests, following the Shared Taxi real-time booking system automatically performing door-to-door
services.
The dispatcher also controls the vehicle movements when idle. Vehicles do not occupy on-street
parking spaces while waiting for the next service. If a vehicle is not providing a service or re-locating to
start a new service it is moved to the closest depot. For the HMA case study there are 131 depots
available throughout the region (see Annex 1). This ensures that the shared mobility fleet is not taking
on-street space when idle, while minimising the need for empty-vehicle movements.
For more detailed information on the modelling framework, data sources and other
assumptions/parameters, see Shared Mobility Simulations: Model design (ITF, forthcoming). Further
information on the methods and data sources employed is also provided in the following sections which
cover the main steps taken in this analysis and the agent-based model set up.
In the next section the HMA case study is presented in more detail, namely its geographical
boundaries, key socio-demographic indicators, plus a brief description of the transportation network and
public transport (PT) offer.

CHARECTERISATION OF THE CASE STUDY – 17
SHARED MOBILITY SIMULATIONS FOR HELSINKI — © OECD/ITF 2017
Characterisation of the case study
The analysis was performed for the Helsinki Metropolitan region, more precisely Helsinki, Vantaa,
Espoo and Kauniainen municipalities (see Figure 1).
Figure 1. Case study area
Source: ITF, adapted from data supplied by HSL.
This corresponds to a land area of around 770 km2 and 1.089 million inhabitants, encompassing
approximately a fifth of the Finnish population. Most of the residents, plus economic and social activity,
are concentrated in Helsinki (see Table 2).
Table 2. Statistics of study area municipalities
Number of buildings
Population Employment Offices Shops Education Health Area (km2)
Espoo 263 898 105 781 349 273 195 41 312*
Helsinki 607 600 349 156 950 379 407 142 214*
Kauniainen 8 769 1 838 4 5 9 4 6
Vantaa 209 276 97 790 202 211 128 14 240
Total 1 089 543 554 565 1 505 868 739 201 772 Note: *Land areas for the Helsinki and Espoo municipalities
Source: ITF, adapted from data supplied by HSL.
Figures 2 and 3 provide additional insight into the distribution of inhabitants and employment in the
region. In fact, the Helsinki inner city presents the highest population density of the region. Still, the

18 – CHARECTERISATION OF THE CASE STUDY
SHARED MOBILITY SIMULATIONS FOR HELSINKI — © OECD/ITF 2017
inhabitants are much more evenly distributed across the territory than employment. Employment is even
more concentrated in the city centre than the population.
Figure 2. Population of Helsinki Metropolitan area, start of 2016
Source: ITF, adapted from data supplied by HSL.
Figure 3. Employment distribution in Helsinki Metropolitan area
Source: ITF, adapted from data supplied by HSL.

CHARECTERISATION OF THE CASE STUDY – 19
SHARED MOBILITY SIMULATIONS FOR HELSINKI — © OECD/ITF 2017
Inside the metropolitan area around 3.1 million trips take place on an average work day. There are
some 180 thousand additional trips generated outside this region that come into it (or vice versa), these
latter trips are considered in the analysis through the external connectors identified in Figure 4.
The most used mode is private car, corresponding to 41% of all trips. Soft modes, namely walking
and bike, are also very significant accounting for 32% of travel. Public transport (PT) options also play
an important role, with a 27% share. Indeed, for trips with origin and destination inside Helsinki
municipality PT is the first option, with 37% of the trips, followed by the soft modes with 34% and car
with 29%. Moreover, while most of the public transport trips happen inside Helsinki (54%), for private
car this number drops to 30%. A very relevant part of car trips (37%) takes place between Helsinki and
the neighbouring municipalities.
Public transport plays a relevant role in the Helsinki region’s mobility, this is particularly so for the
Helsinki municipality where it is the most used alternative. Walking and bike also play an important role,
being used for around a third of all trips. Nonetheless, the prevalent alternative at the metropolitan scale
is private car. More than a third of the car trips are between Helsinki and the neighbouring
municipalities, actually these trips correspond to more than half (52%) of car person-km (pkm) in the
region.
Figure 4. Transportation network
Source: ITF, adapted from data supplied by HSL and open HSL GTFS files.
The transportation network is represented in Figure 4. Public transport supply in the metropolitan
area is overseen by the Helsinki Regional Transport, the following modes are available:
Bus, present in the entire metropolitan area (around 5 500 stops) and with different service
types (trunk lines, feeders to heavy modes and regional).

20 – CHARECTERISATION OF THE CASE STUDY
SHARED MOBILITY SIMULATIONS FOR HELSINKI — © OECD/ITF 2017
Tram, rather dense coverage in the inner city of Helsinki (262 stops).
Metro, currently developing on an axis from the city centre to the eastern suburbs
(17 stations). The new western line connecting the southern Espoo areas to the city centre is
not yet operational and is not included in the study.
Rail, starting in the city centre two lines branch out: one goes north towards the direction of
Vantaa-Kerava and another westward to Espoo-Kirkkonummi. There is a third line that
connects the previous two and provides access to the airport located in Vantaa. This
network has 38 stations in the metropolitan area.
There are park and ride facilities at several of the metro and rail stations outside the inner city,
beyond the Helsinki ring road I (see Figure 19). The aim is to relieve the car presence on the city centre
by easing the access to the heavy modes network, namely for commuting trips between the outer areas of
the metropolitan region and inner Helsinki. Currently about 7% of all metro and rail trips are fed by car.
The existing ferry services are not included in the analysis. They offer connections to some of the
sparsely populated islands off the Helsinki peninsula and other cities in the Baltic region. Therefore, they
do not play a relevant role in urban/metropolitan mobility context.
The public transport offer is more concentrated in the areas of denser activity, with all of the tram
and current metro networks located within the Helsinki municipality. For trips in Helsinki the PT offer is
robust and it is perceived that way by the users; this was actually mentioned by the participants of the
focus group organised for this study. Hence, inside Helsinki municipality there are more trips by public
transport than car.
Nevertheless, on the metropolitan scale this is not the case. In the overall region private car is the
most used mode. This is particularly the case for trips between Helsinki and the outer municipalities,
around two-thirds of these trips are made by car. There are bus services and some of the rail axis can be
used for these types of trips, but they capture only a third of the trips (soft modes are only 5% in this
case). Improving classic forms of public transport is one way to reduce the car share for these commuting
type trips, the new west line of the metro exemplifies this. But for the wider and less dense areas outside
Helsinki it is harder to provide the same level of accessibility to public transport than in the city centre.
Furthermore, even if there is access close to a rail line - or another public transportation option - it is
harder to offer for all origin-destination combinations an overall service level comparable to private car,
which provides the user with more flexibility. In order to further induce a modal shift away from private
cars, additional tools and new type of services are required. Developments in digitalisation open new
possibilities to offer these types of services.
The next section, in addition to describing how current travel is modelled, further discusses insights
into the existing transportation system.

MODELLING CURRENT TRAVEL – 21
SHARED MOBILITY SIMULATIONS FOR HELSINKI — © OECD/ITF 2017
Modelling current travel
In order to assess with the required level of detail the impacts delivered by the new shared modes
first it is necessary to model as accurately as possible the current mobility for the HMA. To do this the
“synthetic mobility sets” are generated (also designated as “synthetic population”). These sets reproduce
the entire personal mobility for an average work day in the region. Producing these sets requires
representing the available travel options within the study area, plus the travel demand patterns and
drivers of current mode choice.
Travel options
The initial task is to create a grid based system to which census and land use data is assigned. Two
scales are employed, 500 m x 500 m that divides the area into 2 796 square cells and is used for the
analysis across the entire metropolitan area, plus a 200 m x 200 m scale that is mostly deployed for a
more detailed examination in the Helsinki municipality which is denser and concentrates more of the
travel demand (16 961 cells in total, 5 072 in the Helsinki municipality).
Table 3. Modes considered
ID Access Main mode (longest length) Egress Mode name
1 - walk - WALK
2 - bike - BIKE
3 pedestrian bus pedestrian BUS_PP
4 pedestrian bus bike BUS_PB
5 bike bus pedestrian BUS_BP
6 bike bus bike BUS_BB
7 car bus pedestrian BUS_CP
8 car bus bike BUS_CB
9 pedestrian metro pedestrian METRO_PP
10 pedestrian metro bike METRO_PB
11 bike metro pedestrian METRO_BP
12 bike metro bike METRO_BB
13 car metro pedestrian METRO_CP
14 car metro bike METRO_CB
15 pedestrian tram pedestrian TRAM_PP
16 pedestrian tram bike TRAM_PB
17 bike tram pedestrian TRAM_BP
18 bike tram bike TRAM_BB
19 car tram pedestrian TRAM_CP
20 car tram bike TRAM_CB
21 pedestrian rail pedestrian RAIL_PP
22 pedestrian rail bike RAIL_PB
23 bike rail pedestrian RAIL_BP
24 bike rail bike RAIL_BB
25 car rail pedestrian RAIL_CP
26 car rail bike RAIL_CB
27 - car - CAR
28 taxi TAXI

22 – MODELLING CURRENT TRAVEL
SHARED MOBILITY SIMULATIONS FOR HELSINKI — © OECD/ITF 2017
Defining the modes to be included in the analysis is the next critical step. The list of modes
considered is displayed in Table 3; it includes the soft modes (walk and bike), car and taxi. For public
transport the main modes considered are bus, metro, tram and rail. On a multi-modal trip, the main mode
is public transport with the longest trip leg. In order to take into account the different options of access
and egress to/from public transport, each of these main modes is sub-divided by type of access and
egress mode, walking, car or bike. Car is only an option for access because it is assumed that the return
trip will be symmetric.
The next step is to calculate the shortest paths of all modes. For car travel the shortest paths
measured in travel time are calculated between all of the cells in the grid. The road network supplied by
HSL contains information on each link and is the basis for these calculations. This requires a validation
of the network, ensuring all the nodes are connected and performing other minor corrections so that the
network can be used by the shortest path algorithm employed. Car trips that are less than 500 m long are
not added to the list of available options.
Figure 5. Percentage of jobs in Helsinki Metropolitan Area within 45 minutes by public transport
The GTFS files of the Helsinki Metropolitan Area are the main inputs for the public transport
options calculation. The shortest paths are also measured in time, but with different weights for onboard
time, waiting time, access time and penalties for transfers. These values are based on Balcombe (2004).
They can vary depending on the public transport mode, e.g. access time perception for bus users tends to
be more penalszing than for metro or rail users. These different weights for different modes are used in
the calculations so that in some cases for the same origin-destination pair different public transport
options are taken into account, e.g. one with shorter travel time but more transfers versus a longer trip
time with fewer transfers. Also, different access and egress types to/from public transportation are
considered (see Table 3) with different ranges, 1 000 m for walking, 2 500 m for bike and 35 000 m for

MODELLING CURRENT TRAVEL – 23
SHARED MOBILITY SIMULATIONS FOR HELSINKI — © OECD/ITF 2017
car (furthest distance in area to a heavy mode station). Minimum distances are also established for the
bike and car case, respectively 700 and 1 000 m. The maximum transfer distance between stops is 150 m.
The soft mode options are determined by the linear distance between the cells centroids, the
maximum distances allowed are 3 000 m for walking and 7 000 m for biking. These limits are grounded
in the travel survey data. They are close to the 90th percentile distance for each mode. For instance, in the
travel survey approximately 90% of the bike trips are for distances under seven kilometres.
The procedures employed allow saving several characteristics for each of the origin-destination path
options, namely the times (total, access, waiting and on-board), the distances (total and per each mode
taken), the number of transfers and cost for the user.
Once the travel options between grid cells are available it is possible to cross this information with
census data, e.g. employment data. This provides some indications regarding current levels of
accessibility. Figure 5 displays the percentage of total jobs in the HMA that can be reached by public
transport in less than 45 minutes for each of the cells. The areas in the city centre near the two train
stations (Pasila and Central Railway Station) present the highest accessibility levels, followed by the rest
of the city core and zones near stations along the main public transport axis (rail and metro lines, plus the
highway connecting Helsinki to southern Espoo).
Mode choice model
It is essential to understand the drivers for current mode choice, in particular the trip attributes that
condition personal decisions. To do this a Multinomial Logit discrete mode choice model is calibrated
for the current situation.
The key data employed in this analysis is the mobility survey from 2012. The survey has records for
8 063 trips (that might be multi-modal) that were taken by 2 182 persons. But not all of these trips are
considered, car trips by car passengers are excluded since it is assumed they are not the ones making the
mode choice decision. Some entries reported mode choices that are not available for the set of options
computed in the section above, e.g. if they are walk trips above 3 000 m. Also some registers contained
errors or missing information that made their use impossible in the choice model, e.g. not having
information on their origin-destination or the mode taken. After filtering the survey sample, 7 118 trips
and 2 069 persons are kept. The expansion coefficients (personal and trip) are rescaled so that the filtered
sample can deliver a population of the same size as the original.
For each of the kept records, the travel options that were not chosen for that origin-destination are
also included. In addition to the selection criteria mentioned in the previous section, individuals that do
not have a driving license also do not have the car option available.
The Multinomial Logit discrete choice model was calibrated with the above information. The
coefficients of the utility functions are identified in Table 4 and their values for each of the modes utility
functions are in Table 5.

24 – MODELLING CURRENT TRAVEL
SHARED MOBILITY SIMULATIONS FOR HELSINKI — © OECD/ITF 2017
Table 4. Utility functions coefficients description
ASC Alternative specific constant
TC Transport cost (Euros)
TT On-vehicle time (min)
AC Access time (min)
WT Waiting time (min)
NT Number of transfers
AC_bike Access by bike (dummy)
AC_car Access by car (dummy)
EG_bike Egress by bike (dummy)
Table 5. Utility function coefficients values
ASC TC TT AC WT NT AC_bike AC_car EG_bike
WALK 0 0 -0.206 0 0 0 0 0 0
BIKE -3.4 0 -0.148 0 0 0 0 0 0
BUS_PP -2.31 -0.232 -0.0417 -0.119 -0.0783 -0.465 0 0 0
BUS_PB -2.31 -0.232 -0.0417 -0.119 -0.0783 -0.465 0 0 -5.06
BUS_BP -2.31 -0.232 -0.0417 -0.119 -0.0783 -0.465 -5.01 0 0
BUS_BB -2.31 -0.232 -0.0417 -0.119 -0.0783 -0.465 -5.01 0 -5.06
BUS_CP -2.31 -0.232 -0.0417 -0.119 -0.0783 -0.465 0 -3.97 0
BUS_CB -2.31 -0.232 -0.0417 -0.119 -0.0783 -0.465 0 -3.97 -5.06
Other PT…
CAR -2.52 -0.423 -0.0824 0 0 0 0 0 0
TAXI -6.09 -0.423 -0.0824 0 0 0 0 0 0
The model presents an R2 = 0.54 with all of the estimated parameters (coefficients) statistically
significant. This indicates an overall good fit with the data and some explicative value. Furthermore, the
variables obtained allow quantifying some attitudes towards the trips attributes, for instance:
The penalty for doing a transfer is equivalent to 11 minutes on board.
1 minute waiting is equivalent to around 2 minutes on board.
1 minute in access is equivalent to around 3 minutes on board.
The value of time for car is EUR 11.69/h and public transport is EUR 10.78/h.
These are sensible values within the expected range and that reflect attitudes towards travel behavior
in line with findings from the literature (Beirao and Cabral, 2007; Litman, 2008). As for the ability to
reproduce the population mode choice behavior Table 6 provides a comparison between the survey and
the estimates produced by the discrete choice model.
The model is able to reproduce with accuracy the mode choice behavior, particularly for the modes
with higher shares. Car has the higher share with 33%, followed by walking with 30% and public
transport that adds up to 28%. It should be noted that these figures do not take into account the trips by
car passengers and other records filtered. Although excluded from the mode choice model, they are
included in the synthetic population.

MODELLING CURRENT TRAVEL – 25
SHARED MOBILITY SIMULATIONS FOR HELSINKI — © OECD/ITF 2017
Table 6. Comparison of survey and estimated mode choice
Corrected with expansion coefficient
Modes Estimated Survey
Trips % Trips %
WALK 830 162 30.18 830 163 30.18
BIKE 212 162 7.71 212 161 7.71
BUS_PP 440 352 16.01 445 198 16.18
BUS_PB 1 642 0.06 1 227 0.04
BUS_BP 1 720 0.06 1 253 0.05
BUS_BB 17 0.00 0 0.00
BUS_CP 4 827 0.18 902 0.03
BUS_CB 26 0.00 0 0.00
METRO_PP 124 554 4.53 121 927 4.43
METRO_PB 594 0.02 768 0.03
METRO_BP 577 0.02 768 0.03
METRO_BB 9 0.00 0 0.00
METRO_CP 1 796 0.07 4 080 0.15
METRO_CB 13 0.00 0 0.00
TRAM_PP 104 733 3.81 106 500 3.87
TRAM_PB 99 0.00 0 0.00
TRAM_BP 103 0.00 0 0.00
TRAM_BB 0 0.00 0 0.00
TRAM_CP 1 557 0.06 0 0.00
TRAM_CB 8 0.00 0 0.00
RAIL_PP 96 390 3.50 92 604 3.37
RAIL_PB 666 0.02 801 0.03
RAIL_BP 692 0.03 801 0.03
RAIL_BB 13 0.00 308 0.01
RAIL_CP 1 685 0.06 4 948 0.18
RAIL_CB 18 0.00 0 0.00
CAR 905 615 32.92 905 619 32.92
TAXI 21 117 0.77 21 117 0.77
Total 2 751 147 100.00 2 751 147 100.00
Synthetic mobility sets
All individuals in the metropolitan area with active mobility are simulated along with each of the
trips they make on a work day. For each of these trips several attributes are recorded. This information is
generated by combining:
travel options between each cell, for all modes available
utility functions of each mode
travel survey data, namely personal identification, plus the trip purpose, starting time,
arrival time and if it is home-based
census data assigned to the grid system, namely population and employment

26 – MODELLING CURRENT TRAVEL
SHARED MOBILITY SIMULATIONS FOR HELSINKI — © OECD/ITF 2017
land use information assigned to the grid system, specifically the areas of education, health,
shops and office related buildings.
Figure 6. Map display of some inputs for generating the synthetic mobility sets
The starting seeds of this process are the people registered in the survey. Each of the individuals is
replicated in accordance to their expansion coefficients. The structural activity pattern of habitual trips
(work and school) and discretionary trips (shopping, social visits and others) along the day is kept equal
to the original individuals/seeds. But the trips’ attributes themselves (origin-destination, start time,
distance, duration and mode), although based on the original seed also have a probabilistic component
which incorporates randomness and the influence of different factors listed in the bullet points above.
The destinations of health-related trips are more likely to be in zones with greater areas of health-
dedicated buildings. But the structure of activities is kept, once the residence is assigned any home return
trip will be to that same location. Even though there is some randomness in the mode choice, the
alternatives are limited to the options available between the origin and destination grids and very
influenced by the utility function values of those options.
In addition to the trips generated in the metropolitan area, external trips are also considered. They
are introduced to the study area through the connectors displayed in Figure 4. The trip matrix provided
also contained information regarding the modes adopted, starting times and origin-destination inside the
study area that allows adding them to the set of generated trips.
When comparing the number of trips and respective modal shares between the survey and the
synthetic mobility sets the results are closely aligned, particularly for the modes with more trips and
relevance. The options that account for less than 1% of the share have a very small sample size. Thus, the
estimates produced will have less reliable results not so adjusted to the survey values.

MODELLING CURRENT TRAVEL – 27
SHARED MOBILITY SIMULATIONS FOR HELSINKI — © OECD/ITF 2017
Table 7. Comparison of survey and synthetic mobility sets
Synthetic mobility sets Synthetic + External Survey
Modes
Trips % Trips % Trips %
WALK 810 807 26.2 810 807 24.7 849 652 27.4
BIKE 243 963 7.9 243 963 7.4 229 856 7.4
BUS_PP 472 842 15.3 488 964 14.9 457 095 14.8
BUS_PB 5 0.0 5 0.0 2 235 0.1
BUS_BP 2 0.0 2 0.0 1 927 0.1
BUS_BB 0 0.0 0 0.0 0 0.0
BUS_CP 25 0.0 25 0.0 3 464 0.1
BUS_CB 0 0.0 0 0.0 0 0.0
METRO_PP 140 372 4.5 140 545 4.3 134 976 4.4
METRO_PB 2 0.0 2 0.0 768 0.0
METRO_BP 3 0.0 3 0.0 768 0.0
METRO_BB 0 0.0 0 0.0 0 0.0
METRO_CP 3 724 0.1 3 724 0.1 6 174 0.2
METRO_CB 0 0.0 0 0.0 0 0.0
TRAM_PP 96 402 3.1 96 402 2.9 118 992 3.8
TRAM_PB 0 0.0 0 0.0 0 0.0
TRAM_BP 0 0.0 0 0.0 0 0.0
TRAM_BB 0 0.0 0 0.0 0 0.0
TRAM_CP 0 0.0 0 0.0 0 0.0
TRAM_CB 0 0.0 0 0.0 0 0.0
RAIL_PP 128 544 4.2 160 805 4.9 108 520 3.5
RAIL_PB 2 0.0 2 0.0 1 203 0.0
RAIL_BP 3 0.0 3 0.0 1 408 0.0
RAIL_BB 0 0.0 0 0.0 616 0.0
RAIL_CP 5 094 0.2 5094 0.2 11 609 0.4
RAIL_CB 0 0.0 0 0.0 0 0.0
CAR 1 194 524 38.6 1 332 056 40.6 1 146 037 37.0
TAXI 383 0.0 383 0.0 21 397 0.7
Total 3 096 697 100.0 3 282 785 100.0 3 096 697 100
To the 3 096 697 trips in the metropolitan area, 186 088 external trips are added. They are mostly
allocated to rail and private car. Hence, the share of these modes increases – car increases from 39% to
41% and rail from 4.1% to 5.1% - while the other mode shares slightly decrease.
The results with the added external trips are also compared to HSL estimates of pkm available for
three periods of the day: the morning and evening peaks plus an average hour between peaks (see Table
8).
The modal shares measured in pkms produced by the HSL model and synthetic mobility sets are
within the same order of magnitude. In both cases the values provided are estimates. They are produced
by different methodologies, but they are closely aligned. The total pkms values are also similar with the
HSL model providing slightly higher values, namely 9% more for the evening peak and between peak
hours and 2% more for the morning peak. The values of both models indicate that car, rail and bus shares
in pkms are higher than their share in trips, the opposite is true for tram shares. Metro values are similar
28 – MODELLING CURRENT TRAVEL
SHARED MOBILITY SIMULATIONS FOR HELSINKI — © OECD/ITF 2017
in both cases. The soft modes are not included in HSL (only as access to public transport), but in the
synthetic sets their pkm share is significantly lower than when measured in trips (they tend to be shorter
trips).
Table 8. HSL estimates and synthetic mobility pkms modal shares
Modes
Modal share (% of pkm)
Between peak hours Morning peak Evening peak
HSL Model Synthetic Model HSL Synthetic Model HSL Synthetic
Bus 16.7 17.8 19.5 19.1 17.4 18.5
Metro 5.0 4.6 5.9 4.2 5.2 4.2
Tram 1.2 1.4 1.1 1.0 1.2 1.1
Rail 11.2 9.3 16.0 10.5 13.8 10.5
Access Walk 3.2 3.0 3.1 2.8 2.9 2.7
Car 62.7 64.0 54.4 62.5 59.5 63.0
Total 100 100.0 100 100.0 100 100.0
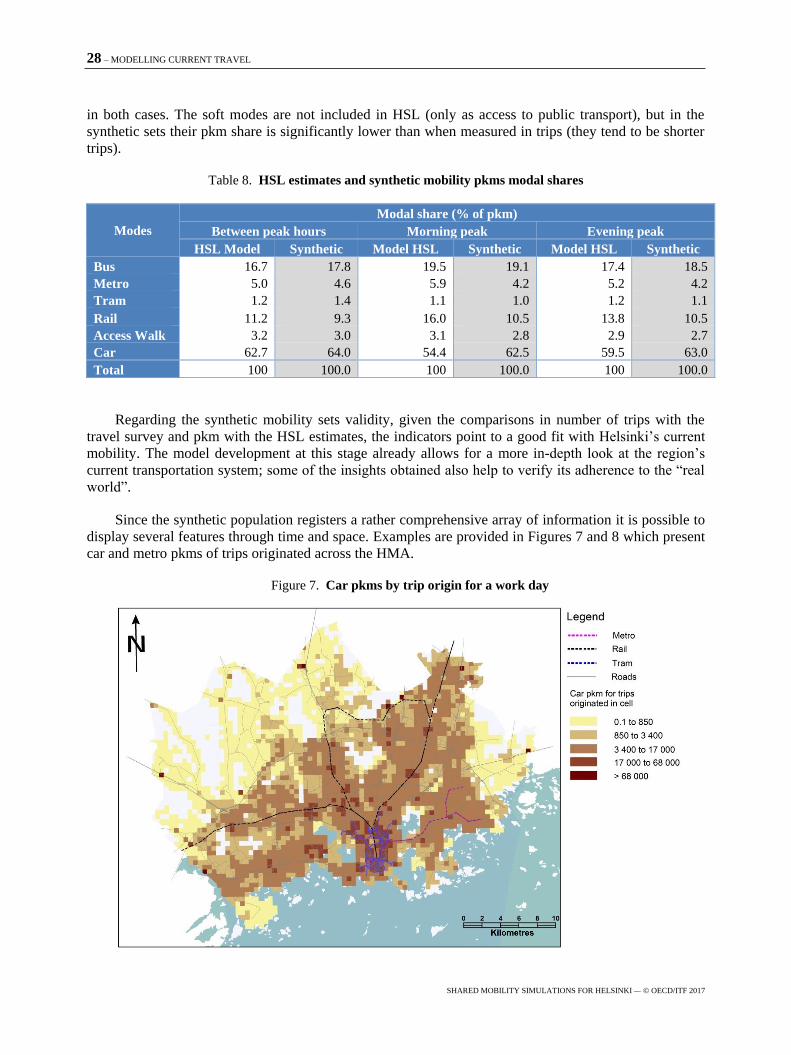
Regarding the synthetic mobility sets validity, given the comparisons in number of trips with the
travel survey and pkm with the HSL estimates, the indicators point to a good fit with Helsinki’s current
mobility. The model development at this stage already allows for a more in-depth look at the region’s
current transportation system; some of the insights obtained also help to verify its adherence to the “real
world”.
Since the synthetic population registers a rather comprehensive array of information it is possible to
display several features through time and space. Examples are provided in Figures 7 and 8 which present
car and metro pkms of trips originated across the HMA.
Figure 7. Car pkms by trip origin for a work day

MODELLING CURRENT TRAVEL – 29
SHARED MOBILITY SIMULATIONS FOR HELSINKI — © OECD/ITF 2017
Figure 8. Metro pkms by trip origin for a work day
The same scale range is employed in both figures, which shows how differently these modes are
used across the region. Car is much more evenly employed in all the HMA, with higher levels for zones
that have more population and economic activity. This includes the city core but it is not restricted to it.
In contrast, metro pkms are more concentrated in areas which combine better accessibility to the
network/line and socio-economic activity, namely the Helsinki city centre and its eastern suburbs. To a
lesser extent it is also a component for some trips that start with other modes in areas not so close to the
line, e.g. southern Espoo-Helsinki axis and around some rail stations.
Other on-track modes follow a similar pattern, rail and tram use is mainly concentrated in areas with
good access to the respective transport networks. They are also somewhat used in trips originated in
more distant zones but which are covered by other public transport modes, e.g. rail is a component for
some trips that originate near metro stations in eastern Helsinki. Bus on the other hand has a pattern of
use closer to car, since its network is road based and more accessible across the entire HMA (e.g. there
are more than 5 000 bus stops and 38 rail stations), though its use is more intertwined with the other
public transport options than car.
On a more aggregate level, the synthetic population results indicate that car trips on average are
longer than for public transport, respectively 10.8 km compared to 9.5 km. Except when rail is the main
mode where average trip length is 14.9 km, all other options have lower average trip lengths than car. For
metro the distance is the same than the PT average, 9.5 km. Tram has the shortest motorized trip lengths,
3.5 km, which is to be expected since it serves only the city core. The soft modes have the shortest trip
lengths, 2.4 km for bikes and 0.6 km for walking.
These insights point to travel patterns where public transport is mainly used in the Helsinki centre
and in the radial axis connecting the outer areas to the centre. In zones with less accessibility to the trunk
PT network, or for travel patterns that do not fit the radial-axis logic – e.g. even if there is access to a
metro/rail station but one or more transfers are required to reach the destination – then the car has a

30 – MODELLING CURRENT TRAVEL
SHARED MOBILITY SIMULATIONS FOR HELSINKI — © OECD/ITF 2017
clearer advantage over PT options. One part of the attractiveness of the new shared modes proposed is to
provide a level of flexibility and comfort that for the HMA case seems to have particular potential in
bridging this gap, which is hard to fill by “traditional” forms of public transport.
But what do the users in the HMA have to say about this? What is their view on the attractiveness of
these new shared services and to what extent would they be willing to change their travel behavior?
These questions are addressed in the next section.

UNDERSTANDING PREFERENCES OF POTENTIAL USERS – 31
SHARED MOBILITY SIMULATIONS FOR HELSINKI — © OECD/ITF 2017
Understanding preferences of potential users
Shared mobility supported by digital tools introduced on a large scale across an entire metropolitan
area is a new proposition. Although similar services are already in operation across the world (e.g
Campbell, 2017) in no case to date the scale and scope of what is simulated in this report has been
deployed. Understanding the drivers that foster the uptake of these new modes is a critical element of the
present report. This is required to adjust the design of the new modes and better grasp where, why and to
who this offer is attractive. Such knowledge helps to better comprehend the policy implications of such
change in the transportation system, identify critical issues in the adoption/transition phases and better
measure the potential impacts and performance of the new services.
No historical data is at hand to achieve a better understanding. The method adopted in this report
combines qualitative and quantitative approaches. On the qualitative side a focus group (FG) discussion
was set up regarding the current user preferences and the proposed new modes. To acquire quantitative
indicators a stated preference (SP) survey was done to calibrate a mode choice model.
Both the focus group discussion and survey were done on site in Helsinki; the meeting was hosted
in the HSL head office during the evening and lasted for approximately two hours. All the discussion,
materials and terminology were in the local language. The meeting was structured into three main
components. First, an introduction that provides information to the participants on two topics. First the
current transportation situation and development plans for the region. Second the presentation of the
shared mobility concepts, details of its main features and its potential integration in the local transport
strategy. The first part is delivered by an HSL transport planner and the second by the ITF official
leading the shared mobility team (taking around 30 minutes).Next, a discussion with participants takes
place around a structured script to ensure consistency and comparability between experiments, namely
the ones performed in other cities (Dublin and Auckland, NZL). This starts with questions to identify the
personal background of each respondent (residential location within the metropolitan area, age, gender,
work profile and workplace location, plus daily travel patterns including principal mode of transport and
trips purpose). Then questions on the main motives for current modal choice. They provide important
insights to be integrated in the new shared services design and implementation pathway. A lack of
comprehension on such issues can lead to services that are unappealing and fail to attract users. Next the
conversation moves to the conditions under which the respondents would be willing to sell their
household’s cars. Most of the questions target all participants. But some are asked only to certain user
types (private car, public transport), namely about the trade-offs between the proposed shared services
and the currently used mode. The discussion concludes with issues related to the new services
themselves, specifically what is their favoured shared mode (Shared Taxi or Taxi-Bus, see Table 1),
reasons for choosing one service over another and the number of people they would be willing to share
the vehicles with (taking about 80 minutes).
The meeting then finishes with a stated preferences survey to have more structured information on
the respondents socio-demographic and mobility backgrounds, plus quantifiable indicators of their
attitudes towards shared mobility and other modes (taking 10-15 minutes).
The selection of participants is done according to guidelines designed by the ITF that are passed on
to HSL which makes the recruitment through its social media tools. The key criteria considered are:
residence location, employment status, public transport use frequency, age, gender and car ownership.

32 – UNDERSTANDING PREFERENCES OF POTENTIAL USERS
SHARED MOBILITY SIMULATIONS FOR HELSINKI — © OECD/ITF 2017
Participants’ socio-demographic and mobility backgrounds
A total of 20 people took part in the meeting. The objective, largely achieved, is to have a balanced
mix of socio-demographic and mobility profiles. There was the same number of female and male
participants - ten each. The age distribution is also evenly distributed, as can be seen in Figure 9.
Figure 9. Participant’s age distribution, residential location and employment status
Regarding residential location, the sample of participants seems to adequately reproduce the
population distribution through the metropolitan area with 40% of respondents living far from the centre,
the higher share 45% living close but not in the centre itself and 15% in the centre. The occupation
profile of the group is diverse, with each category well represented. Still the sample seems biased
towards part-time employees, while undervaluing the number of full-time workers. For instance in the
travel survey only 8% had a part-time occupation, whereas employees made up for 54% of the recorded
answers (in the focus group they are 35%). These answers might also be affected by personal perceptions
of their occupation status.
Figure 10. Respondent’s using smartphones and mobile apps
Below 25years
26 - 35years
36 - 45years
46 - 55years
56 - 65years
Above 65years
0
1
2
3
4
5
6
7
8
0 2 4 6 8 10 12 14 16 18 20
Smartphone user
Tablet user
Uses smartphone/tablet to access real-time information (weather,news)
Uses mobile apps to request transport services (i.e. Uber, Lyft, taxi)
15%
45%
40%
City centre
Close to the centre
Far from the centre (>10 km)
35%
15%
25%
25% Full-time employee
Part-time employee
Not working
Student

UNDERSTANDING PREFERENCES OF POTENTIAL USERS – 33
SHARED MOBILITY SIMULATIONS FOR HELSINKI — © OECD/ITF 2017
Concerning the use of smartphones and applications, almost all participants used or owned a
smartphone. They also employed it to access some form of real-time information (e.g. weather or news).
Moreover, a sizable majority (70%) uses mobile apps to request transport services. This can be a bias,
but as mentioned in the introduction, in many ways Finland has pioneered the use of mobile devices and
digital innovations in the transportation field, among others. These answers indicate that the necessity to
employ mobile apps to request the proposed new shared services will not be an obstacle to their uptake in
the HMA. On the contrary, it indicates high familiarity with this technology and services which can
facilitate the adoption of the new modes.
Table 9. Participants profile according to most regularly used mode (%)
Most frequent mode All
users
By age cohort
Below
25 years
26 - 35
years
36 - 45
years
46 - 55
years
56 - 65
years
Above
65
years
Regular car user 20 0 0 5 5 5 5
Regular bus user 45 0 10 15 5 10 5
Regular rail and/or metro
user 10 0 5 5 0 0 0
Non-motorised (walk, bike) 25 10 5 10 0 0 0
As to their mobility background, most in the group replied they are regular public transport users
with 45% using mostly bus and 10% rail and/or metro. A quarter mentioned they mostly used
non-motorised modes like walking or bike. Only 20% considered their main mode to be private car.
These are the values obtained through the survey. In the discussion a higher number of participants
identified car as their most used mode (30%), whereas only 10% mentioned walking or biking as their
most frequent option.
When compared to the actual public transport mode share this sample seems biased towards public
transport use. This might be an actual mismatch between the sample and overall population, but it can
also be the result of a bias in personal mobility perceptions.
All respondents used PT at least a few times per month and a great majority said they used it more
than twice a week, 10 every day and 8 around two times per week. More than half (55%) have at least
one car in their household. Indeed, most participants choose different modes depending on the purpose
and destination of the trips. Their behavior appears more guided by a pragmatic evaluation of each travel
option’s attributes (e.g. time, comfort, price) than an emotional/cultural attachment to a particular mode.
Age seems to play a role towards mode choice, no one below 36 years old stated they are regular car
users and above 46 years there are no regular users of soft or heavy modes. Although this is a small
sample, these results are in line with other studies on travel behaviour (Heinen, van Wee, and Maat,
2010).
On average each person makes 20 trips a week and four trips a day, values similar to what is
reported in the travel survey. Commuting to work or school is the main trip purpose (40%), followed by
daily shopping (19%) and leisure activities (15%). It should be noted that the number of commuting type
trips seems underrepresented in relation to the travel survey (62%), which is consistent with the
understated number of full-time employees.

34 – UNDERSTANDING PREFERENCES OF POTENTIAL USERS
SHARED MOBILITY SIMULATIONS FOR HELSINKI — © OECD/ITF 2017
Depending on the purpose, public transport or walking are the most common modes. The former is
mostly taken for commuting, social activities and personal matters, while the latter is more employed for
purposes such as drop off/pick up children at school, daily shopping, leisure and other. Car is never the
most used mode. In this sample it is an option chosen more frequently for driving children to/from
school, shopping and leisure. Compared to the overall population there is likely to be an underestimation
of commuting trips done by car.
All and all this group was a diverse mix of people from different walks of life and with different
travel behaviors, representative of the region’s population. Although its shares of socio-economic and
mobility profiles might not exactly match the general population, they are a reasonable fit. The biases
identified, namely the underestimation of full-time employees, commuting trips and car use should be
taken into account when analysing the results presented further below.
Table 10. Travel patterns of the survey respondents
Activity Average number
of trips per week
Average trip
duration (min)
Most commonly used
modes (%)
Travel to/from work or place of study 9.35 27.8 Rail (44)
Travel to drop off/pick up children at
school 2.25 22.5
Walking (43)
Car (35)
Daily shopping (e.g. supermarket) 3.95 16.53
Walking (36)
Car (23)
Social activity (e.g. visiting friends or
family) 2.38 32.64
Rail (28)
Bus (28)
Leisure activities (e.g. sport)
3.16 31.29
Walking (22)
Car (22)
Rail (20)
Personal matters (e.g. doctor's
appointment) 1.67 18.64
Rail (23)
Bus (23)
Other 2.75 70.5
Walking (45)
Rail (36)
Focus group
A focus group is a form of qualitative research. Focus groups are interactive group settings, where
participants can feel comfortable saying what they really think and are facilitated by a moderator with a
pre-defined set of questions. Focus groups help to understand not only what transport users think, but
also how and why they think that way. While it is an exploratory rather than conclusive type of research,
it can greatly help to provide directional information and uncover issues behind user preferences and it
allows for going deeper into topics that emerge during the discussions.
In fact, several relevant insights were obtained in the course of this session. In order for the shared
mobility services to be attractive, participants stressed the importance of having services available in the
entire Helsinki Metropolitan Area, particularly outside the city centre and for travel patterns that do not
match the current main axis of public transport. The respondents said that currently the problem is not so
much accessing the city core form the outskirts, but for movements between different outer-areas.
Actually, it was mentioned that the city centre already had a very good public transport offer, hence the
attractiveness of these service types would be lower there.

UNDERSTANDING PREFERENCES OF POTENTIAL USERS – 35
SHARED MOBILITY SIMULATIONS FOR HELSINKI — © OECD/ITF 2017
Most participants prefer to share their trips with at least two or more passengers. Having more
people in the vehicle means that there is less pressure to engage in social exchanges. This was also
reflected in the answer concerning the vehicle capacity. Most participants preferred to have a capacity of
at least 8 or 16 and preferred to have “as many people as possible” to share with.
Participants showed a great degree of sensitivity to price. In order to adopt the new shared modes,
nearly all the participants mentioned the price of these services as an important factor. When asked
which of the new modes they prefer, most of the respondents answered Taxi-Bus because the price was
lower. One of the reasons that also drove the preference for higher vehicle occupancy was the perception
that more people per vehicle would imply lower costs. Overall the respondents showed great
“pragmatism” in their evaluation of different alternatives, without great emotional or cultural attachment
to a particular mode. Nonetheless, there was one person who stressed his emotional attachment to car use
as a symbol of freedom and a certain set of values. A few others associated their choice for soft modes as
part of a healthy and sustainable/green life style.
Travel time and reliability/waiting times were also factors considered important in order for the
participants to adopt the shared modes. Some participants mentioned that an important potential
advantage of these modes in comparison to public transport were the lower waiting times and increased
reliability.
For some car users there were particular motives for using the car, e.g. one owned a pet and was not
sure if the new shared modes would be able to accommodate animals. Another participant had a young
baby and would only be willing to take shared modes once the child is older.
Familiarity with digital platforms and services was evident across the group. Several people
mentioned their use of digital based mobility options and even the Kutsuplus experience which was
remembered rather positively. There were a couple of voices expressing a degree of scepticism, one
questioning the value of this offer for city core movements and another concerned with “prohibitionist”
regulation towards cars. But the predominant overall perception regarding the shared services was very
positive and welcoming to this additional mobility offer, particularly if it delivers on the factors
mentioned above (e.g. price, reliability and availability throughout HMA).
Stated preference survey
The survey developed is web based and accessible online. It was filled out by the participants
following the focus group discussion. Support was provided by the HSL and ITF personnel present. It is
organised into four different sections:
Respondent’s profile. Questions about socio-demographic characteristics of the respondent and
level of acquaintance with smartphones and applications.
Stated preferences. These questions are divided in two sets. In the first the interviewee answers
four stated preferences experiments. In each of these experiments four modal options are
available for the same trip. The options are private car, PT (bus or rail/metro), non-motorised
alternatives (walking or cycling) and shared mobility (which can be either Shared Taxi or
Taxi-Bus). Each option is associated with its relevant attributes. In the case of shared mobility,
they are access time, on board and detour time, cost and number of passengers on board. The
second set of questions is also made up of four stated preferences experiments, but the available
choices are only between the two Shared Mobility services, Shared Taxi or Taxi-Bus.
Orthogonal design was used to generate the choice scenarios, resulting in 64 scenarios split into
eight blocks, so that each respondent would face one block with eight mode choice situations.

36 – UNDERSTANDING PREFERENCES OF POTENTIAL USERS
SHARED MOBILITY SIMULATIONS FOR HELSINKI — © OECD/ITF 2017
Annex 2 shows an example of a stated preference survey question/experiment, as the respondent
would see it on the screen.
Mobility background. Respondents answer about daily trip patterns, frequency, distance and
typical mode choice by trip purpose. The respondents were also asked to characterise themselves
as regular users of: car, bus, heavy PT (rail or metro) or non-motorised modes.
Attitudes towards shared mobility attributes. The participants are asked about the main
features of the proposed shared mobility solutions. Although addressing the same shared
mobility feature, these questions can have a different configuration for car and PT users in order
to make them more comparable to their current travel experience. For most of the features an
acceptable value is asked from a given range of values (e.g. for cost, waiting time and number of
passengers on board). For other attributes (e.g. ability to use the shared modes as feeder services
to heavy PT modes) the respondents are asked to value their relevance on a scale from “not
relevant” to “highly important”. The last questions are about the household’s car ownership,
parking preferences and willingness to sell some of their cars if the shared services are
implemented on a large scale.
The answers regarding the participants socio-demographic and mobility backgrounds were already
discussed above. The attitudes toward the new modes and the discrete choice model obtained from the
stated preferences experiences are examined next.
Attitudes towards shared mobility
The features of the new modes considered for evaluation by the participants are fare/price, access
time, lost time due to detours to pick up and drop off passengers, number of passengers on board (for car
users) and number of seats available (PT users), transfers and the possibility to use shared mobility
modes as feeder services to rail and metro stations. The number of car users (5) is less than half of PT
users (11). The latter considered themselves mostly as regular bus users (9), only two said they were
regular rail/metro users. Nevertheless, it should be noted that these are the respondents most-used modes,
the majority of them use a mix of modes on their daily trips.
First, the respondents are asked about the fares of the proposed shared modes. As a reference for
evaluation the current cost per trip is employed.
Figure 11. Attitude towards fare/cost of shared mobility modes
All car users are willing to consider using shared mobility solutions, but they exhibit disparate
attitudes towards its costs. Around 40% state that they will use shared mobility if their costs are
0%
5%
10%
15%
20%
25%
30%
35%
40%
45%
1 2 3 4 5 6 7 8 9 10
Car users
Not willing to use the shared modes
The same cost as now
0%
5%
10%
15%
20%
25%
30%
1 2 3 4 5 6 7 8 9 10
PT users
Not willing to pay Willing to pay double the price

UNDERSTANDING PREFERENCES OF POTENTIAL USERS – 37
SHARED MOBILITY SIMULATIONS FOR HELSINKI — © OECD/ITF 2017
significantly lower than what they currently spend with their cars; the remaining are willing to adopt the
new modes if their cost is around half or closer to what their costs are now. PT users’ preferences are
somewhat of a mirror image of that. Most are willing to pay the same or more than what they experience
now.
Figure 12. Attitude towards accessibility/walking time to stops
The Shared Taxi offers door-to-door services, but Taxi-Bus picks up people at pre-determined stops.
Some car users stated they could walk to the stops up to 8 minutes away, while 80% accepts to walk a
maximum of 5 minutes. Most PT users accept to walk 5 minutes, which is in average what happens now.
A smaller group accepts only 3 minutes and one person is willing to walk up to 7 minutes.
Figure 13. Attitude towards shared mobility lost/detour time
Regarding the detour to pick up and drop off passengers, most car users are willing to accept
between 6 to 10 minutes of additional time. One of the respondents only accepts a 3-minute detour. This
indicates that car users are willing to accept a measure of additional travel time to their current trips.
Public transport users show less willingness to add additional time to their trips. One of the reasons can
be that their average travel time is approximately the double of car users, thus they are more skeptical
about factors that can add time to their travel. So, a great part of PT respondents (45%) answered that
their additional detour time would be 5 minutes; 27.5% said it could be lower (2 or 4 minutes) and the
other 27.5% higher (7 or 10 minutes).
0%
5%
10%
15%
20%
25%
30%
35%
40%
45%
1 2 3 4 5 6 7 8 9 10
Car users
Minutes
0%
5%
10%
15%
20%
25%
30%
35%
40%
45%
1 2 3 4 5 6 7 8 9 10
Car users
Minutes
0%
10%
20%
30%
40%
50%
60%
70%
1 2 3 4 5 6 7 8 9 10+
PT users
Minutes
0%
5%
10%
15%
20%
25%
30%
35%
40%
45%
50%
1 2 3 4 5 6 7 8 9 10
PT users
Minutes

38 – UNDERSTANDING PREFERENCES OF POTENTIAL USERS
SHARED MOBILITY SIMULATIONS FOR HELSINKI — © OECD/ITF 2017
One of the features of the new modes is that they always provide seated places. With that in mind
car users were asked how many passengers they would prefer to have on-board the vehicles. One of the
respondents wanted only two other people in the vehicle, but most preferred seven or more. The answer
with the most replies is actually between 10 and 15 additional passengers.
This topic was approached differently for PT users. They were asked how much they value having
available seats on-board. The PT users seem to be divided in two clusters regarding this question, one of
the clusters gives a high relevance to having available seating, hence a higher level of comfort. A smaller
cluster does not consider this as a very relevant feature.
Figure 14. Attitude towards number of passengers on board (car) and seats available (PT)
It should be noted that none of the respondents would like to be with only one additional passenger
and most would like to be with seven or more passengers.
Figure 15. Attitude towards number of transfers
The number of transfers, or not having to transfer, is seen as highly relevant by the majority of car
users (though not all). For PT users there is a wide range of answers. Similarly to the ride comfort/seat
availability question there seems to exist two groups of users, one that finds it somewhat relevant (five
respondents) and another that finds it very relevant (six respondents).
0%
5%
10%
15%
20%
25%
30%
35%
40%
45%
1 2 3 4 5 6 7 8 9 10-15
Car users
Number of passengers
0%
10%
20%
30%
40%
50%
60%
70%
80%
1 2 3 4 5 6 7 8 9 10
Car users
Not relevant Highly relevant
0%
5%
10%
15%
20%
25%
30%
35%
40%
1 2 3 4 5 6 7 8 9 10
PT users
Not relevant Highly relevant
0%
5%
10%
15%
20%
25%
30%
1 2 3 4 5 6 7 8 9 10
PT users
Not relevant Highly relevant

UNDERSTANDING PREFERENCES OF POTENTIAL USERS – 39
SHARED MOBILITY SIMULATIONS FOR HELSINKI — © OECD/ITF 2017
Nearly all car users and a significant part of current PT passengers consider minimising the number
of transfers very important.
Figure 16. Attitude towards shared mobility modes used as feeder service to/from rail or metro stations
Having feeder services provided by shared mobility to metro/rail stations is highly relevant for most
respondents, particularly car users. PT users have a wider range of preferences, but most still consider
this possibility to be on the very or highly relevant side of the scale.
The answers to this question stress the opportunity of articulating this new mobility offer with
existing forms of public transport. They show that from the users’ perspective of shared mobility can be
used to leverage a modal shift to metro and rail.
Figure 17. Car ownership
The last set of questions was about car ownership and shared mobility’s potential impact on the
private vehicle fleet size. Close to half of the respondents (45%) do not have a car in their households.
The remainder (55%) had only one car per household. Of those that do own a car, 27% (3 respondents)
stated their willingness to sell it if shared mobility services are implemented. During the focus group
discussion there were indeed three car users willing to sell their cars, but only in the condition that these
services were available throughout the entire Helsinki Metropolitan Area.
0%
10%
20%
30%
40%
50%
60%
70%
80%
1 2 3 4 5 6 7 8 9 10
Car users
Not relevant Highly relevant
45%
55%
No car
One car
0%
5%
10%
15%
20%
25%
30%
35%
40%
1 2 3 4 5 6 7 8 9 10
PT users
Not relevant Highly relevant

40 – UNDERSTANDING PREFERENCES OF POTENTIAL USERS
SHARED MOBILITY SIMULATIONS FOR HELSINKI — © OECD/ITF 2017
Discrete choice model development
The stated preferences experiments provide a quantitative measure of how different
social-demographic characteristics and trips attributes influence modal choice. This allowed the
development of a discrete choice model which provides additional insights towards the participants’
preferences. Moreover, this model is used to provide the simulation with the first adopters of shared
mobility through a combination of socio-demographic (age, location, previous mode choice) and trip
related (travel time, waiting time and others) attributes. This is later deployed to design different
scenarios that are tested in the simulation.
Figure 18. Mode choice in stated preference survey
Table 11. Mode choice variables/coefficients
Variable
Modes/utility
functions Description
ASC Bike, shared sobility Alternative specific constant
F PT, car, shared mobility Transport cost/fares (Euros)
Close PT Dummy variable (Person lives close to city centre)
TT PT, Car, shared
mobility, non-motorised Travel time (min)
AC PT, shared mobility Access time (min)
WT PT Waiting time (min)
SharedMode_Type Shared mobility Dummy variable (1 if Taxi-Bus, 0 if Shared Taxi)
BW_Q_H Non-motorised
Dummy variable (Availability/quality of cycle path/footpath,
none available)
BW_S_H Non-motorised Dummy variable (Ease of crossing in traffic, simple crossing)
CR_H PT
Dummy variable (Crowding on board, standing and difficult to
move)
User_Car Shared mobility Dummy variable (Person is a regular car user)
User_PT Shared mobility Dummy variable (Person is a regular PT user)
NT PT Number of transfers
Far Shared mobility Dummy variable (Person lives far from city centre)
Senior Shared mobility Dummy variable (Person in age group > 55 years old)
Young Bike Dummy variable (Person in age group < 36 years old)
LT Shared mobility Detour time
Passenger Shared mobility Logarithm of number of passengers
9%
17%
11% 63%
Non-motorised
PT
Car
Shared Mode

UNDERSTANDING PREFERENCES OF POTENTIAL USERS – 41
SHARED MOBILITY SIMULATIONS FOR HELSINKI — © OECD/ITF 2017
Each respondent answered eight stated preferences games, which provide a total of 160 experiments
for analysis. Half of these experiments compared four alternatives: car, public transport (bus or
metro/rail), non-motorised (bike or walking) and a shared mode option. The other half explored the
preferences between the two shared mobility services, Shared Taxi and Taxi-Bus.
A first critical insight provided by these experiments is the preference showed towards the proposed
shared solutions. From the 80 games that compared the four modes, a strong majority (63%) opted for
the shared mobility option. This reinforces the participants’ positive perception of the new modes that
was also evident during the focus group discussion.
All of the 160 game answers were used to calibrate a discrete choice model. The variables employed
and their respective utility functions/modes are shown in Table 11. The adjusted R2 is 0.355 which is a
value in line with this type of stated preference choices based models. Not all of the variables employed
are statistically significant, which was a particularly challenging task given the sample size. Nonetheless,
many of the coefficients are indeed significant (e.g. being a regular car user, younger, close to the city
centre, car travel time and others). Overall the coefficients do provide additional insights to the focus
group discussion, their values are provided in Table 12.
Table 12. Variables/coefficients values and ratios
Name Value p-value Ratios Modes Value
ASC_Bike -1.38 0.26
VOT (TT vs Cost)
PT 3
ASC_sm 3.02 0.06 SM 11
SharedMode_Type -1.96 0.01 CAR 33
AC -0.0428 0.38 WT vs TT PT 1.5
BW_Q_H -2.64 0.06 AC vs TT PT 2.3
BW_S_H -1.09 0.75 NT vs TT PT 15.1
CR_H -3.05 0.01 LT vs WT SM/PT 1.1
User_Car -2.67 0.02 TT vs TT SM/PT 4.6
Close 2.34 0.01 Cost vs Cost SM/PT 1.4
F_car -0.198 0.54
F_pt -0.323 0.4
F_sm -0.454 0.13
Far_sm 1.46 0.14
LT -0.0299 0.6
NT -0.283 0.16
User_PT 0.523 0.49
Passenger 1.82 0.1
Senior 1.03 0.18
TT_car -0.108 0.01
TT_nm -0.0268 0.79
TT_pt -0.0188 0.16
TT_sm -0.0862 0.01
WT -0.0283 0.16
Young 1.6 0.08
The results above indicate that shared mobility tends to be favored by people living far from the city
centre, regular PT users and seniors (above 55 years). Some of these findings match with what was stated
during the focus group, namely that this new offer is especially attractive in the wider Helsinki
Metropolitan Area, for regions where the “traditional” PT offer has more difficulties competing with

42 – UNDERSTANDING PREFERENCES OF POTENTIAL USERS
SHARED MOBILITY SIMULATIONS FOR HELSINKI — © OECD/ITF 2017
private car and its service level is lower than in the city centre. It should also be noted that all else being
equal, PT users are more willing than regular car users to adopt this service. Particular attention to the
system and policy designed is required if the bulk of the new modes passengers is to come from current
car users.
The shared modes specific alternative coefficient (ASC_sm) reiterates the respondents’ positive
perception of the shared modes when compared to the existing alternative. Between the shared modes -
all else being equal - the respondents prefer Shared Taxi to Taxi-Bus (SharedMode_Type). Interestingly
this seems to contradict the answers provided in the focus group where Taxi-Bus was favoured over the
Shared Taxi. The reason for this apparent contradiction is that in the focus group participants gave an
answer based on the overall attributes of both services (e.g. price), whereas this coefficient indicates that
when all other attributes are similar there is a preference for Shared-Taxi, a service that provides a more
direct and easily accessible offer. Another result that highlights topics discussed in the focus group is the
preference for having a higher number of passengers on-board.
Shared mobility is perceived differently than PT or car. Its value of time is higher than PT but
considerably lower than car. The shared mobility detour/lost time is perceived in a manner similar to the
PT waiting time.
As for the PT options, they are favored in locations close to the city centre and penalised by
crowdedness on-board (lack of seat availability). The relations between some of its key attributes have
sensible values, e.g. one minute spent walking to a stop is perceived in the same way as 2.3 minutes
spent on-board. For the waiting time one minute is equivalent to 1.5 on-board. Having to do one transfer
is equal to 15.1 minutes of on-board travel time. Transfers are heavily penalised. Indeed, the ability to
provide direct services not requiring transfers is a feature highly relevant for potential users, as can be
seen in Figure 15.
Although the soft modes were not discussed in the focus group, the discrete choice model calibrated
from the stated preferences survey indicates that being younger (below 36) favours the adoption of
biking. On the other hand, the absence of bike lanes and dedicated road crossing deters this option.
Production side parameters
Table 13. Production side parameters
Mode Booking Access time Max. waiting
time
Max. total time
loss Vehicle type
Shared Taxi Real time Door-to-door
5 minutes
(<= 3 km),
up to
10 minutes
(>= 12 km)
(detour time +
waiting time)
from 7 minutes
(<= 3 km), up to
15 minutes
(>=12 km)
Minivan currently seating
8 rearranged to seat only 6,
with easy entry and exit.
Taxi-Bus 30 minutes
in advance
Boarding and
alighting up to
400 m away
from door, at
points
designated in
real time
Tolerance of
10 minutes from
preferred
boarding time
(before actual
booking time
is set)
Set by a linear
speed from
origin to
destination of
15 km/h
Minibuses with
8 and 16 seats.
No standing places.
UNDERSTANDING PREFERENCES OF POTENTIAL USERS – 43
SHARED MOBILITY SIMULATIONS FOR HELSINKI — © OECD/ITF 2017
Parameters that are relevant for the production side were also discussed with local Finnish partners
(see Table 13). Some of them were also tested in the focus group, like the vehicle sizes. The participants
stated the proposed vehicle sizes were acceptable and suggested they could even be larger.
Review of users preferences
The analysis into potential users’ preferences combined a focus group discussion and a stated
preferences survey. Both these methods are grounded on the answers provided by a sample of 20 people
with diverse socio-demographic and mobility profiles that are representative of the overall HMA
population. The insights obtained are a critical component of this report. They are employed in the
agent-based simulation that evaluates the impacts of shared mobility. Moreover, these insights per se
provide governments and other public officials with valuable information on the attitudes of people in the
metropolitan area towards current mobility and this emergent offer.
Among the many findings, that the results showed that people in HMA have a very positive attitude
towards these new service types. Indeed, they are rather familiar with digital age technologies and
already existing transportation services based on mobile apps. Hence, potential users’ perceptions and
knowledge of the tools required to use shared mobility do not constitute barriers to its implementation. If
anything, there is a clear wish in seeing these new services added to the existing offer and expectation
that they can be a tool to improve mobility in the Metropolitan area.
Actually, another finding is the necessity of implementing these services across the entire HMA,
particularly in areas where PT performance is worse. It was mentioned that PT in the centre and some
radial commuting axis was quite good. The problem is for outer areas less accessible to the PT main axis
and for trip patterns that do not follow a radial logic centre-periphery. In the choice model calibrated,
being close to the centre is one of the variables that foster PT choice. In contrast, being further from the
centre favours the choice of the new modes. Especially in this areas having an on-demand, more reliable
offer, could be a major advantage over traditional bus services that in this cases tend to have lower
frequencies and less occupation.
It is important to note that beyond the total travel time, a given travel option attractiveness is very
much related to the number of transfers required, plus the access and waiting times. Users heavily
penalise trips that require transfers and they are willing to have longer travel times provided they spend
less time accessing stops and waiting for transport. These are all features that guided the design of the
shared mobility services.
Some evidence indicates that all the rest being equal (personal and trip characteristics) PT users are
more willing to adopt the new modes than car users. Though not conclusive, research done on user
profiles of app-based on-demand ride services also raises this possibility (Rayle et al., 2016). If the main
objective is to induce a modal shift away from car then special care should be put into the design of the
system so that current car users without good PT alternatives are particularly targeted. This matches the
outer areas and trip patterns previously mentioned in this report where it is harder to provide good quality
of service with “traditional” PT.
In fact, the services proposed can be used to increase the reach of heavy modes such as metro and
rail. Shared mobility can provide improved access to the heavy modes network through feeder services;
this option combines the flexibility of the new modes with the high capacity of rail-based modes. Most
respondents regarded this combined offer as highly relevant and welcomed it in the focus group
discussion.
44 – UNDERSTANDING PREFERENCES OF POTENTIAL USERS
SHARED MOBILITY SIMULATIONS FOR HELSINKI — © OECD/ITF 2017
Price is also an important concern. PT users seem willing to pay more for these services than what
they currently spend. The opposite happens with the car users. Nonetheless, in both cases this coefficient
is very relevant for their mode choice. This was revealed not only in questions explicitly addressing
costs, but on other related features such as vehicle occupancy and size (higher values are favoured in
order to lower costs). The preference for Taxi-Bus discussed in the focus group was also explained to a
great extent by its lower price.
One of the key benefits associated with shared mobility highlighted in previous studies is its
potential to eliminate the need for private car ownership at the urban and metropolitan scale. This is to
take place assuming all car trips in the metropolitan area are replaced by services provided by the shared
modes and the need to own a car disappears. But are car owners actually willing to give up their
vehicles? If shared mobility is indeed introduced at the metropolitan scale in Helsinki, almost a third of
the participants who owned a car (27%) answered that they are indeed willing to sell their cars. This
indicates that the introduction of this offer does have the potential to reduce car ownership and the
regions’ private car fleet, but only to some extent. It should be no surprise that people are not completely
willing to give up their means of mobility for a still untested offer. The actual performance of the new
modes once introduced, coupled with further policy and regulatory measures will be critical factors
influencing future car ownership rates.
In summary the key insights obtained are:
People in the HMA have a very positive attitude towards these new shared mode service
types. There is a clear wish to see these new modes added to the existing transportation
offer and an expectation that they can improve mobility in the Metropolitan area.
There is a strong preference for having these services across the entire HMA for any
origin-destination combination. Respondents stressed the importance of having shared
modes available for outer areas less accessible to the PT main axis and for trip patterns that
do not follow a radial logic centre-periphery.
Potential users showed great interest in the possibility of shared mobility being used in
combination with heavy modes as a first/last mile solution.
Public transport users seem more prone to adopting the new modes than car users. In order
to ensure that shared mobility is mostly used to replace car trips special care should be put
in the design of the system so that current car users who do not have good PT alternatives
are particularly targeted.
Price is an important concern. PT users seem willing to pay more for these services than
what they currently spend. The opposite happens with car users. The preference for
Taxi-Bus discussed in the focus group is explained to a great extent by its lower price.
Close to a third (27%) of participants that own a car stated they would sell it if the new
modes were implemented across the entire HMA.
Shared mobility tends to be favoured by people living far from the city centre, regular PT
users and seniors (above 55 years). Besides these socio-demographic characteristics their
preferences are strongly influenced by the trip option attributes themselves - issues such as
price, waiting, access and travel time, number of transfers and comfort. Actually, most
participants showed a very pragmatic attitude towards mode choice. In their current travels
they tend to use a mix of different modes depending on the trip origin-destination and
purpose.

UNDERSTANDING PREFERENCES OF POTENTIAL USERS – 45
SHARED MOBILITY SIMULATIONS FOR HELSINKI — © OECD/ITF 2017
Having examined the potential users’ preferences, the next critical step taken in the study that led to
this report was setting the different scenarios to be tested in the simulation. This is discussed in the next
section.


SETTING THE SHARED MOBILITY SCENARIOS – 47
SHARED MOBILITY SIMULATIONS FOR HELSINKI — © OECD/ITF 2017
Setting the shared mobility scenarios
Shared mobility was designed along the previous ITF studies as an instrument to replace road
motorised trips (particularly car, but also bus and taxi) at an urban and metropolitan scale. Testing the
full replacement of trips currently made by car, bus and taxi by the shared modes is key to assessing the
feasibility of the new services as an alternative to the road motorised mode. This configuration has been
tested for the Lisbon Metropolitan Area and it is included in other ongoing ITF studies (Helsinki, Dublin
and Auckland). Thus, simulating this scenario is also important because it provides a standard that
enables comparing shared mobility’s impacts on case studies with disparate characteristics; in Table 14
this corresponds to scenario 5.
But it should not be expected that such a dramatic change in mobility can happen overnight. Hence,
other intermediate scenarios are also tested. These include different replacement rates for car and bus
trips, which can be achieved by targeting trips with specific characteristics. For instance, the discrete
mode choice calibrated based on the potential users’ preferences allows to identify which car trips are
likely to shift first to the new modes. Bus trips with different attributes can be targeted, like trips that
feed rail or have very low frequencies. Other alternatives can be zone restrictions, e.g. partially or
completely limiting car trips made inside certain areas. In fact, a countless number of configurations
combining different replacement criteria can be devised.
In total eleven scenarios are tested and aggregate results obtained; from these, three scenarios are
then selected for a more in-depth analysis. This allows testing different replacement strategies and
obtaining meaningful insights into the limits and opportunities presented by shared mobility, while
balancing time and resource constraints.
Table 14. Scenarios selected for tests
Scenarios Bus Cars + Taxi Rail+Metro+Tram
1 Keep 100% of trips replaced Keep
2 Keep 50% of trips replaced Keep
3 Keep 20% of trips replaced Keep
4 Keep Inside ring road I all car trips replaced Keep
5 100% replacement 100% of trips replaced Keep
6 100% replacement 50% of trips replaced Keep
7 100% replacement 20% of trips replaced Keep
8
Replace trips where bus is feeder to
heavy modes 100% of trips replaced Keep
9
Replace trips where bus is feeder to
heavy Mmodes 20% of trips replaced Keep
10
Keep only trunk lines (trips with
headways 9 min or below) 100% of trips replaced Keep
11
Keep only trunk lines (trips with
headways 9 min or below) 20% of trips replaced Keep
The actual design of the scenarios presented in Table 14 was done in strict articulation with the
Finnish partners involved in the project, namely HSL, municipalities (Helsinki, Espoo, Vantaa and
Kauniainen) and the Finnish Transport Agency (government). The process was mostly driven by the
local partners with the ITF providing technical and policy advice.

48 – SETTING THE SHARED MOBILITY SCENARIOS
SHARED MOBILITY SIMULATIONS FOR HELSINKI — © OECD/ITF 2017
A first set of scenarios (1, 2, 3 and 4) focused on private car replacement alone. For scenarios 1, 2
and 3 different replacement rates are employed from a minimum of 20% to full replacement (100%). For
Scenario 4 a different approach is adopted with all car travel inside the Helsinki ring road I being
replaced. For the remaining scenarios different car replacement rates are combined with several bus
replacement strategies. In scenarios 5, 6 and 7 all bus trips are replaced. For scenarios 8 and 9 only bus
trips that are feeder to rail or metro are substituted. In scenarios 10 and 11 only the higher frequency bus
trips (headways below 9 minutes) are kept with all others shifting to shared mobility.
It should be noted that in all scenarios metro, rail and tram are kept since they are the backbone of
the Helsinki region transport system and represent a long-term strategic asset. If anything the metro and
rail shares can increase due to the articulation with the shared modes feeder services (see Table 18). The
number and location of available depots for the shared vehicle fleet and Taxi-Bus stops also remains the
same (see Annex 1), although some locations might not be operational in some scenarios.
Car replacement
One of the findings obtained in previous ITF studies is that marginal replacement rates have no
significant effects. Thus, the minimum replacement rate was set at 20%. This also broadly matched the
Finnish partners’ goals of achieving a significant modal shift away from car.
In the intermediate car replacement configurations (20% and 50%) the trips replaced are those with
highest likelihood of first shifting to the shared modes. This is assessed through the discrete choice
model calibrated in the potential users’ preferences examination. For each car trip a ratio is calculated
between the shared mode and car choice probability – obtained from the utility function values - for that
specific trip. Each of the probabilities depend on specific trip attributes (e.g. travel time and price) and
socio-demographic variables (e.g. individual residence location and age group). A high value for this
ratio means a higher probability of this trip mode choice shifting from car to shared mobility. So, for the
20% replacement setting the car trips with the 20% highest ratios are the ones that are replaced. The
same logic applies to the 50% replacement configuration.
Having selected which specific car trips will be replaced, then it is determined if these trips will
shift to Shared Taxi or Taxi-Bus. Again the discrete mode choice utility functions are employed. The
option with the highest probability is the one adopted.
In the cases where Taxi-Bus is the selected option there is the possibility of employing a feeder
service to the heavy modes. This happens when the combined feeder plus heavy mode option is faster
than the original car trip and there is a maximum of one transfer in the rail/metro component of the trip.
Car users that move to Shared Taxi services will never select a feeder service. Given the findings
obtained in the users’ preferences section this is a very reasonable assumption. Car users that, for a
specific trip, value more the Shared Taxi service want direct door-to-door services and a certain comfort
level that cannot be provided by a service that resembles current public transport (and in the case of
feeder services will always require one transfer). In contrast the individuals that, for a given trip, prefer
Taxi-Bus show their willingness to adopt a service more aligned with PT features.
Full car replacement inside ring road I (scenario 4)
In scenario 4 car replacement is approached differently. In this case all car travel inside the Helsinki
ring road I is replaced. Figure 19 identifies the area that will be totally free of private car trips. This
means fully replacing all car trips with origin and destination inside this zone, plus the car components of
trips originated in the outer areas going into the city core (and vice versa).

SETTING THE SHARED MOBILITY SCENARIOS – 49
SHARED MOBILITY SIMULATIONS FOR HELSINKI — © OECD/ITF 2017
Figure 19. Scenario 4: all car trips replaced inside ring road I
For the car trips that have origins and destinations inside the ring road I the replacement procedure
is like what was described above. When the car trips originate outside the ring road I (and vice versa)
they are channelled to one of the 12 park and ride facilities along the ring road I. There the cars are
parked and the individuals either take a Taxi-Bus or the metro/rail to their final destination. The heavy
modes are taken when the park and ride facility is associated with a metro or rail station and there is a
direct connection to the final destination. For all other cases the car users take a Taxi-Bus to their final
destination inside the ring road I.
The park and ride facilities’ location and number was obtained by placing them in all main road and
metro/rail accesses to the city core near to where they cross the ring road I. The objective was to
minimise any major detour from the car users’ original routes and maximise access to the heavy modes
network, while maintaining the number of park and ride facilities to a somewhat manageable number.
This selection process was done in co-ordination with HSL and trying to match the locations to existing
park and ride facilities, which was not always possible.
This approach greatly affects car travel in the overall HMA. Although no specific replacement rate
was set, around 54% of all car trips in the HMA are impacted by restricting car use inside the ring road I.
Almost 18% of all car trips in the HMA occur inside this area. Moreover, 36% of all car trips are
between the outer regions of the HMA and this core area inside the ring road I.
It should be noted that in this scenario all previous PT trips remain unaltered.

50 – SETTING THE SHARED MOBILITY SCENARIOS
SHARED MOBILITY SIMULATIONS FOR HELSINKI — © OECD/ITF 2017
Bus replacement
In the scenarios where bus trips are replaced (5 to 11) they are by default moved to Taxi-Bus, an
alternative that resembles the pre-existing mode choice. This option is combined with a heavy mode
when it is possible to feed a metro or rail station that provides a connection to the final destination with a
maximum of one transfer.
Table 15. Bus replacement scenarios
Bus statistics
Share of all bus
trips (%)
Scenarios Description pkm trips pkm trips
Replace all (5, 6 and 7) All trips that have bus component 4 392 457 656 010 100 100
Replace feeder services
(8 and 9)
Replace trips with bus plus
rail/metro 1 112 008 208 557 25 32
Keep trips only by bus or bus plus
tram 3 280 449 447 453 75 68
Keep only trunk
services (10 and 11)
Replace trips with bus headway
above 9 minutes 3 646 857 479 927 83 73
Keep trips with bus headway
9 minutes or less 745 600 176 083 17 27
Three bus replacement strategies are employed. In scenarios 5, 6 and 7 all bus trips are replaced. For
scenarios 8 and 9 only trips that feed metro or rail are replaced. This allows an evaluation of the impacts
of replacing the bus lines that are designed mainly as feeder services to the heavy modes. The last
scenarios on the list (10 and 11) are focused on assessing the impacts of keeping only high frequency bus
services that approximately match the existing Trunk lines.
As shown in Table 15, all of these approaches have a relevant impact on bus services. The one with
least impact is the replacement of bus feeder trips which still replaces 32% of all bus trips and 25% of
pkms done by bus. When only the more frequent services remain, around 73% of trips that correspond to
80% of pkms are replaced. As the pkm to trip replacement comparison suggests in scenarios 8 and 9 the
bus trips being replaced are shorter, while in scenario 10 and 11 they tend to cover longer distances on
average. More insights can be obtained by identifying the areas with higher bus replacement rates for
both these approaches.
The areas of HMA with higher rates of bus feeder trips origins tend to be on the outskirts (see
Figure 20), particularly east Helsinki, north-west Vantaa and north-west Espoo. In contrast there are
much higher replacement rates across HMA for scenarios 10 and 11 (see Figure 21). The areas that retain
more bus trips are along the southern Espoo corridor, some areas of central Helsinki and other main
accesses to the centre like the northern and eastern highways.
Having identified above the scenarios to be tested and their key features the report proceeds in the
next section with the analysis of the impacts each of these configurations has on the city mobility.

SETTING THE SHARED MOBILITY SCENARIOS – 51
SHARED MOBILITY SIMULATIONS FOR HELSINKI — © OECD/ITF 2017
Figure 20. Bus feeder trips replaced (scenarios 8 and 9)
Figure 21. Bus trips with headway above 9 minutes replaced (scenarios 10 and 11)


IMPACTS ON THE CITY AND TRANSPORT SYSTEM – 53
SHARED MOBILITY SIMULATIONS FOR HELSINKI — © OECD/ITF 2017
Impacts on the city and transport system
Throughout this chapter the simulation results are discussed with particular emphasis placed on the
impacts produced by the introduction of shared mobility on the city and transportation system. The
analysis begins with more aggregated level indicators such as CO2 emission reductions or shifts in modal
share. Besides providing some key findings this also enables the selection of three scenarios for a more
in-depth examination. Topics subjected to further analysis include congestion, parking, rail and metro
ridership, plus changes in accessibility across the HMA.
Aggregate results
Three key aggregate level indicators are presented in Table 16 for all scenarios. They measure the
percent decrease in vehicle-km (vkm), CO2 emissions and congestion between each of the scenarios and
the current situation.
Table 16. Reduction in vkm, CO2 and congestion
Reduction from baseline (%)
Scenarios vkm (weighted) CO2 Congestion
1 33 34 37
2 12 13 17
3 4 4 6
4 15 14 18
5 23 28 16
6 0 6 -5
7 -8 -3 -17
8 29 31 32
9 2 4 1
10 25 30 20
11 -7 -2 -13 Note: Values in italics take into account the reduction in car travel and the introduction of the new shared mobility modes, but
they do not include the reduction in bus vkms that occurs in scenarios 5 to 11.
In the first three scenarios - where only cars are replaced at different rates - significant impacts
occur for all indicators. In particular, scenarios 1 and 2 present high decreases in CO2 and congestion.
But even in scenario 3, with a car replacement rate of 20% the level of CO2 decrease is as big as what
can be achieved by very influential measures such as congestion charging (HSL, 2016b).
Scenario 4, where the Helsinki core inside the ring road I is car free, achieves very positive results.
Only some of the scenarios with 100% car replacement produce bigger decreases in all three indicators.
When all bus trips are replaced the impacts are lower than acting only on car trips. Actually, for
scenario 7 where only 20% of car trips are replaced the results are negative. This means that there is an
increase in motorised road vkms, emissions and congestion if all bus trips are replaced and there is not a
high shift from car to shared mobility. In contrast, acting only on bus trips that feed heavy modes
provides more positive results (scenarios 8 and 9). The CO2 emissions reduction in this case is equal to
scenario 3, when only car trips are replaced (in both cases at the same 20% rate). For the last scenarios
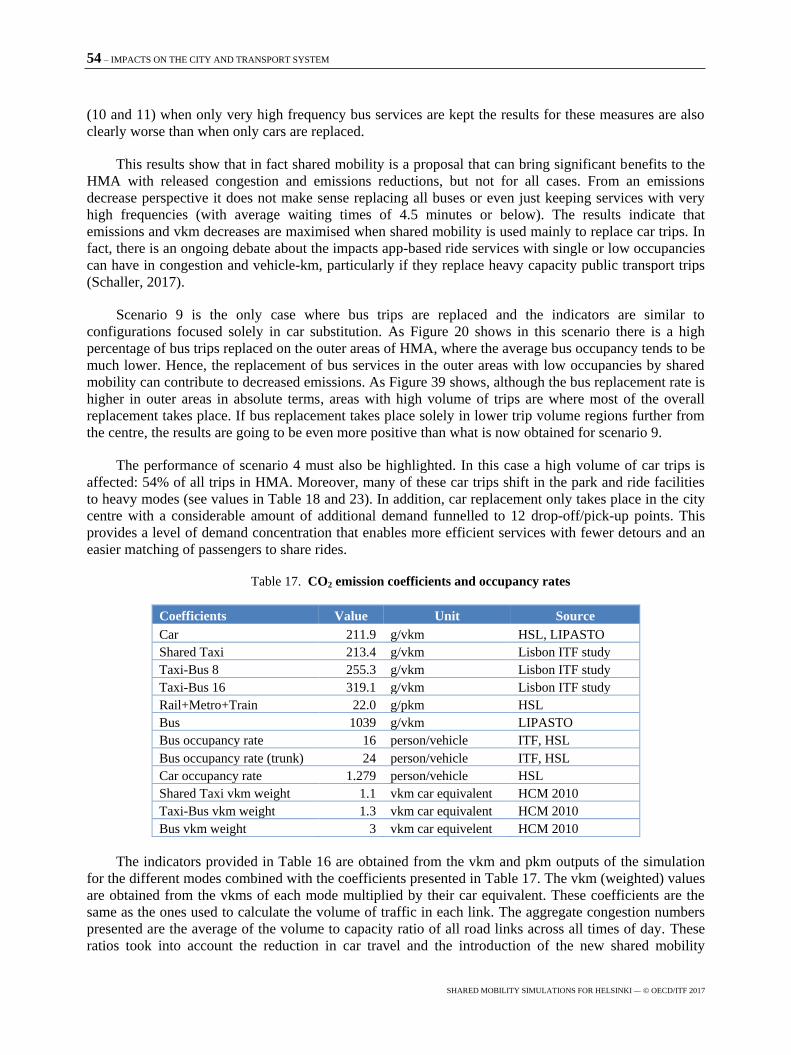
54 – IMPACTS ON THE CITY AND TRANSPORT SYSTEM
SHARED MOBILITY SIMULATIONS FOR HELSINKI — © OECD/ITF 2017
(10 and 11) when only very high frequency bus services are kept the results for these measures are also
clearly worse than when only cars are replaced.
This results show that in fact shared mobility is a proposal that can bring significant benefits to the
HMA with released congestion and emissions reductions, but not for all cases. From an emissions
decrease perspective it does not make sense replacing all buses or even just keeping services with very
high frequencies (with average waiting times of 4.5 minutes or below). The results indicate that
emissions and vkm decreases are maximised when shared mobility is used mainly to replace car trips. In
fact, there is an ongoing debate about the impacts app-based ride services with single or low occupancies
can have in congestion and vehicle-km, particularly if they replace heavy capacity public transport trips
(Schaller, 2017).
Scenario 9 is the only case where bus trips are replaced and the indicators are similar to
configurations focused solely in car substitution. As Figure 20 shows in this scenario there is a high
percentage of bus trips replaced on the outer areas of HMA, where the average bus occupancy tends to be
much lower. Hence, the replacement of bus services in the outer areas with low occupancies by shared
mobility can contribute to decreased emissions. As Figure 39 shows, although the bus replacement rate is
higher in outer areas in absolute terms, areas with high volume of trips are where most of the overall
replacement takes place. If bus replacement takes place solely in lower trip volume regions further from
the centre, the results are going to be even more positive than what is now obtained for scenario 9.
The performance of scenario 4 must also be highlighted. In this case a high volume of car trips is
affected: 54% of all trips in HMA. Moreover, many of these car trips shift in the park and ride facilities
to heavy modes (see values in Table 18 and 23). In addition, car replacement only takes place in the city
centre with a considerable amount of additional demand funnelled to 12 drop-off/pick-up points. This
provides a level of demand concentration that enables more efficient services with fewer detours and an
easier matching of passengers to share rides.
Table 17. CO2 emission coefficients and occupancy rates
Coefficients Value Unit Source
Car 211.9 g/vkm HSL, LIPASTO
Shared Taxi 213.4 g/vkm Lisbon ITF study
Taxi-Bus 8 255.3 g/vkm Lisbon ITF study
Taxi-Bus 16 319.1 g/vkm Lisbon ITF study
Rail+Metro+Train 22.0 g/pkm HSL
Bus 1039 g/vkm LIPASTO
Bus occupancy rate 16 person/vehicle ITF, HSL
Bus occupancy rate (trunk) 24 person/vehicle ITF, HSL
Car occupancy rate 1.279 person/vehicle HSL
Shared Taxi vkm weight 1.1 vkm car equivalent HCM 2010
Taxi-Bus vkm weight 1.3 vkm car equivalent HCM 2010
Bus vkm weight 3 vkm car equivelent HCM 2010
The indicators provided in Table 16 are obtained from the vkm and pkm outputs of the simulation
for the different modes combined with the coefficients presented in Table 17. The vkm (weighted) values
are obtained from the vkms of each mode multiplied by their car equivalent. These coefficients are the
same as the ones used to calculate the volume of traffic in each link. The aggregate congestion numbers
presented are the average of the volume to capacity ratio of all road links across all times of day. These
ratios took into account the reduction in car travel and the introduction of the new shared mobility

IMPACTS ON THE CITY AND TRANSPORT SYSTEM – 55
SHARED MOBILITY SIMULATIONS FOR HELSINKI — © OECD/ITF 2017
modes, but they did not include the reduction in bus vkms that occurs in scenarios 5 to 11. For the latter
the decrease in congestion will be slightly higher than what is suggested by the values shown in
Table 16. It should also be noted that in the congestion calculations neither dedicated lanes for the shared
modes were considered, nor were additional traffic disturbances which can arise from the increase in
pick-up and drop-off manoeuvres. The latter impacts are closely associated with the measures put in
place to manage this increase (or lack thereof).
Table 18. Pkm across scenarios
From baseline (pkms)
Pkms (million) Increase (%) Reduction (%)
Scenarios Shared
Taxi
Taxi-
Bus Car Bus
Metro
+Rail Metro +Rail Bus Car
1 13.58 2.74 0.00 4.36 3.62 16 0 100
2 6.56 1.18 7.76 4.36 3.36 8 0 47
3 2.87 0.36 11.77 4.36 3.21 3 0 19
4 1.89 3.69 10.37 4.36 3.56 15 0 29
5 15.30 7.76 0.00 0.00 3.72 20 100 100
6 8.66 5.90 7.76 0.00 3.47 12 100 47
7 5.25 4.67 11.77 0.00 3.32 7 100 19
8 14.03 4.22 0.00 3.26 3.53 14 25 100
9 3.28 1.65 11.77 3.26 3.12 0 25 19
10 15.18 6.62 0.00 0.74 3.70 19 83 100
11 5.14 3.61 11.77 0.74 3.29 6 83 19
In Table 18 the changes in each mode pkm are presented. In scenario 4 there are more car pkms
replaced than for the scenarios with a 20% car replacement rate. In almost all cases there is an increase in
heavy modes pkms due to the introduction of the shared mobility feeder services. The exception is
scenario 9. In this configuration some of the bus trips that were previously feeding heavy modes are
replaced with direct shared mobility services, but the car trips that shift to feeder services offset that
decrease.
Figure 22. Mode share of motorised modes (number of trips)
0%
10%
20%
30%
40%
50%
60%
70%
80%
90%
100%
Baseline 1 2 3 4 5 6 7 8 9 10 11
Car
Bus
Rail+Metro+Tram
Shared Modes

56 – IMPACTS ON THE CITY AND TRANSPORT SYSTEM
SHARED MOBILITY SIMULATIONS FOR HELSINKI — © OECD/ITF 2017
Comparing the motorised modal shares between the baseline and the scenarios tested shows how for
all cases there is a noticeable decrease in the car share (see Figure 22). For the baseline 60% of all
motorised trips are made with car, while in all of the scenarios the car share is below 50%.
Figure 23. Mode share between shared mobility services (number of trips)
One factor that also helps in explaining the different results are the shares obtained by each of the
new services in each scenario. All else being equal, a higher share of Taxi-Bus ensures higher vehicle
occupancies and lower vkms and emissions. One of the reasons for scenario 4’s good performances is its
high share of Taxi-Bus (see Figure 23). It should be remembered that this type of service was not
considered in the first ITF report (ITF, 2015). It was subsequently introduced because a service with
higher capacity than single occupancy rides or Shared Taxi was needed to deliver vkm reductions and
prevent shared mobility from causing increases in congestion.
Interestingly, in some urban areas where app-based ride services have been growing (e.g. New York
and San Francisco) there is indeed a concern that registered vkm and congestion increases are related to
the emergence of these services. Still, there is no conclusive evidence. Even in those markets these
systems have only been in operation for a relatively short amount of time and their overall modal share is
still far from the replacement rates simulated in this study. Actually, previous ITF reports results indicate
that low replacement rates can lead to increases in congestion, while a more sizable modal substitution
does have positive impacts. The elasticity between the car replacement rate and impacts on congestion
and emissions is not constant and it can even be negative for very low car replacement rates. But for
higher substitution levels the elasticity becomes positive and increases with more replacement, which is
clearly shown by the sizable reductions in emissions and congestion displayed in Table 16. One of the
reasons this happens is because with a bigger pool of users, the trips “matching probability” increases
and higher vehicle occupancies can be achieved.
This highlights some very relevant factors to take into account when designing a system with the
stated goal of reducing emissions. The amount of sharing that takes place is very relevant. The ability to
match trips and obtain higher vehicle occupancies has great influence in the vkm and emissions
reductions. The size of the market and user base is important in order to increase the likelihood of
matching trips. Focusing on specific areas where it is easier to match trips is also a possibility, e.g. see
the results for scenario 4. This also relates to the type of trips that should be targeted by the new modes.
0%
10%
20%
30%
40%
50%
60%
70%
80%
90%
100%
1 2 3 4 5 6 7 8 9 10 11
Taxi-Bus
Shared Taxi

IMPACTS ON THE CITY AND TRANSPORT SYSTEM – 57
SHARED MOBILITY SIMULATIONS FOR HELSINKI — © OECD/ITF 2017
Shared mobility can achieve much higher occupancies than private car and be more efficient than low-
occupancy bus services – they can reach similar levels of occupancy while having a much lower
emission coefficient per vkm. However, the new modes will not decrease emissions if they mostly take
users away from high capacity PT.
Table 19. Preliminary estimates for number of vehicles and occupancy
Average occupancy Number of vehicles
Scenarios Shared Taxi Taxi-Bus 8 Taxi-Bus 16 Shared Taxi Taxi-Bus 8 Taxi-Bus 16
1 2.32 3.17 8.94 14 561 2 141 3 820
2 2.18 3.09 9.04 7 217 944 2 013
3 2.03 3.00 9.09 3 225 243 604
4 2.33 3.78 8.95 1 931 1 673 1 608
5 2.35 3.33 8.88 15 771 4 829 6 732
6 2.23 3.36 8.87 9 045 3 838 5 201
7 2.18 3.38 8.95 5 183 2 778 4 152
8 2.30 3.31 8.87 15 086 2 907 4 166
9 2.04 3.56 9.08 3 617 854 1 316
10 2.35 3.36 8.94 15 743 4 215 6 291
11 2.16 3.43 9.06 5 205 2 343 3 317
In Table 19, preliminary estimates for the number of vehicles required to provide these services are
presented (see Table 29 further below for a more accurate prediction). In scenario 1 a total fleet of
around 20 000 vehicles would be sufficient to replace all car trips in the HMA. Taking into account that
nowadays there are around 500 000 private cars in HMA (Statistics Finland, 2016) this means that shared
mobility could replace all car travel in the HMA with 4% of the existing number of private cars. The car
fleet could also be affected in other scenarios. According to the focus group around 27% of car owners
would be willing to sell their cars if these services are wildly available across HMA.
From a more operational efficiency side scenario 4 stands out. It delivers some of the highest
impacts with one of the lowest vehicle fleets (scenario 3 is the only with a smaller fleet).
Comparison to previous study
A brief comparison with the previous case study in the Lisbon Metropolitan Area (LMA) is
presented in Table 20. Although the impacts in the HMA are significant, they are even higher in the
LMA.
Table 20. Impacts comparison to LMA study
Reduction to baseline (%)
Case studies vkm (weighted) CO2 emissions
Helsinki MA (scenario 5) 23 28
Lisbon MA 48 62
One of the reasons for higher impacts in the Lisbon case is its higher modal shares of car and bus.
As can be seen in Table 21, the total share of motorised road trips in LMA currently stands at 70% (50%

58 – IMPACTS ON THE CITY AND TRANSPORT SYSTEM
SHARED MOBILITY SIMULATIONS FOR HELSINKI — © OECD/ITF 2017
for car and 20% for buses), while for HMA it is 56% (41% for car and 15% for bus). This means that the
LMA starts with a much higher share of traffic that can be shifted to shared mobility.
Another reason is the higher share of Taxi-Bus achieved in the simulation, this is partly related with
differences in methodology. In the previous LMA study no discrete choice model was developed to
quantify the potential users preferences and lexicographic rules where employed. The approach adopted
in this report has greater sophistication and likely more adherence to reality.
Table 21. Modal shares in LMA and HMA (%)
Baseline Heavy capacity Bus Car Walk Bike
Helsinki MA 12 15 41 25 7
Lisbon MA 12 20 50 19 0
Full replacement Shared Taxi Taxi-Bus Heavy capacity Walk Bike
Helsinki MA 32 19 16 26 7
Lisbon MA 28 38 17 16
The efficiency of current bus operations also plays a role. The average bus occupancy rates in the
LMA case (11 person/vehicle) are lower than the HMA average (16 person/vehicle). For instance, if the
LMA results are compared to scenario 1 (100% car replaced, no bus trips changed) the results obtained
in both metropolitan areas would be closer. Thus, the higher efficiency of bus operations in Helsinki
reduces the room for improvement that can be achieved by introducing shared mobility.
Selecting scenarios for in-depth analysis
Having surveyed an array of more aggregate level results it is possible to have a more informed
decision regarding the selection of scenarios to analyse more in-depth. In addition to the indicators
obtained by the simulation, other considerations are also taken in account, e.g. political feasibility or
interest in exploring the system performance.
As discussed in the beginning of the previous section, scenario 5 (full replacement of all road
motorised trips) provides a benchmark of comparison to other case studies. It also provides indicators for
the city impacts and system performance when shared mobility is deployed at its fullest.
The positive performance of scenario 4 made it an obvious candidate for analysis. It manages to
combine high impacts with operational efficiency.
In order to better evaluate the effects of replacing bus trips scenario 9 was also selected. This case
delivered the better comparative results in relation to the scenarios which focused only on car
replacement. It is relevant to go beyond CO2 and vkm reductions and investigate how replacing certain
bus services affects the quality of service and the supply-side efficiency. Furthermore, this is a scenario
with fewer political roadblocks since it does not entail any restriction to current mobility and its 20% car
replacement rate seems more feasible than replacing all car trips in the HMA.
Taking into account all of the above the following analysis will be done for scenarios 4, 5 and 9.

IMPACTS ON THE CITY AND TRANSPORT SYSTEM – 59
SHARED MOBILITY SIMULATIONS FOR HELSINKI — © OECD/ITF 2017
Congestion
Looking in more detail at the congestion levels along the day it is possible to detect bigger decreases
in the morning and evening peaks than in the rest of the day, particularly for scenarios 4 and 5 (see
Figure 24). The highest congestion levels occur for the evening peak (around 16:00).
Figure 24. Aggregated congestion in the HMA road network throughout the day
The decrease in scenario 9 is barely noticeable. It is 1% in average throughout the day with higher
values also for the peak periods. In this case the reduction caused by the removal of bus traffic is not
accounted for, so in reality the reduction in congestion will be slightly higher.
Figure 25. Congestion for scenario 4 (evening peak)
0
0.05
0.1
0.15
0.2
0.25
0.3
0.35
0 4 8 12 16 20 24
VC
rat
io
Hours
Baseline
Scenario 4
Scenario 5
Scenario 9

60 – IMPACTS ON THE CITY AND TRANSPORT SYSTEM
SHARED MOBILITY SIMULATIONS FOR HELSINKI — © OECD/ITF 2017
The current congestion levels on the HMA road network for the evening peak are presented in
Annex 3. This baseline levels can be compared to what happens in scenario 4 in Figure 25. There is a
sharp decrease in congestion in the city centre which is currently one of the areas more under pressure. In
addition, congestion is relieved in some sections of the ring road I and main arteries that lead to .
Although there is an overall traffic relief (particularly in the centre) for some of the secondary network,
namely in the accesses to the park and ride facilities there are increases in congestion.
The congestion decrease in scenario 5 occurs more evenly throughout the region. This can be seen
in Figure 26. In this case traffic relief is more intense along the main highways and ring road I. There is
also a clear decrease in the centre, albeit not as marked as in scenario 4. Some increase occurs in
secondary roads that allow access to the shared mobility depots.
Figure 26. Congestion for scenario 5 (evening peak)
Reductions and changes to parking requirements and infrastructure
Previous studies into shared mobility found that one of its most positive impacts is the drastic
reduction in required parking places. Next we assess if this also holds true for HMA.
In scenario 4 all private car parking in the city core can be eliminated. But it is necessary to have
12 park and ride facilities around the ring road I (see Figure 27) and the shared vehicles depots that in
this case are concentrated in the city centre (see Figure 29).
Park and ride (P&R) facilities are a key element in this scenario. All car traffic coming into the city
core arrives at these points (and vice versa). They have a minimum of 880 places and a maximum around
4 600. Four of them should have capacity for more than 4 000 vehicles. In total these park and ride
facilities should accommodate around 35 000 parking spots (see Table 22).

IMPACTS ON THE CITY AND TRANSPORT SYSTEM – 61
SHARED MOBILITY SIMULATIONS FOR HELSINKI — © OECD/ITF 2017
Currently there are already P&Rs in five of these locations (represented by the numbers 4, 6, 9, 11
and 12 in Figure 27) and another is planned for location 1 (near the west metro line that opens in 2017).
The total capacity of P&Rs around this area planned for 2025 is approximately 2 500 places which is 6%
of the required capacity indicated by the agent-based model. It should be noted that there are 17
additional P&R locations near stations further from the centre. Nonetheless, considering their average
size will be similar to what is planned for 202,5 the total capacity of all these facilities will only be 20%
of what is required in the simulation. It is important to underline that the simulation numbers imply
removing all private car traffic and parking from the city core. Still, the simulation does provide a
measure of the P&R scale required in this scenario. The feasibility of drastically increasing the existing
and new P&R facilities needed was not addressed in the simulation.
Figure 27. Required capacity at park and ride facilities in scenario 4 simulation
Table 22, in addition to the parking required for each P&R, indicates the number of vehicles that
arrive and depart from each station at the respective peak times. On average during the peak period of the
day there are 882 vehicles departing these parks during a 15-minute span. In the busiest parks there will
be thousands of vehicles departing and hundreds arriving in short periods of time.
The number of vehicles arriving and departing to/from the busiest P&R location – 9, Pukinmäki – is
displayed in Figure 28. In the evening peak for a period of 15 min near 16:00 there are around
1 400 vehicles departing from and 900 vehicles arriving at the facility. Most of these vehicles are private
cars meaning that the shared mobility higher capacity can indeed remove a very significant amount of
vehicles from the roads. But there will still be considerable shared mobility traffic. In the peak period for
the busiest park there are hundreds of shared mobility vehicles picking up and dropping off passengers.

62 – IMPACTS ON THE CITY AND TRANSPORT SYSTEM
SHARED MOBILITY SIMULATIONS FOR HELSINKI — © OECD/ITF 2017
Table 22. Parking required, peak arrival and departures
Figure 28. Arriving and departing vehicles throughout the day for facility 9 (Pukinmäki)
If this scenario – or something along these lines – is to be implemented, these twelve P&R can
become major bottlenecks. Thus, special attention is required in:
design of accesses to these parks
pick-up/drop-off areas for shared vehicles
ease of parking for vehicles
ensuring an overall seamless transfer from car to the shared vehicles or heavy modes when
that is a possibility.
0
200
400
600
800
1000
1200
1400
0 4 8 12 16 20 24
Veh
icle
s
Hours
Vehicles departing
Car
SharedMobility
Peak values (15 minute periods)
Departing Arriving
Park
ID Name Parking Car
Shared
Taxi
Taxi-
Bus Car
Shared
Taxi Taxi-Bus
1 Keilaniemi 4 450 973 40 63 740 80 105
2 Tapiola West Metro 4 054 1 012 52 76 869 92 141
3 Near Leppävaara West 2 995 751 60 77 638 106 126
4 Leppävaara 2 090 644 58 38 467 88 63
5 Konala 2 022 580 35 56 450 63 109
6 Kannelmäki 1 733 625 26 43 529 35 84
7 Pohjois-Haaga 2 915 943 58 85 734 65 147
8 Pakila 4 507 939 24 77 752 37 154
9 Pukinmäki 4 616 1 272 41 96 1 108 51 153
10 Kivikko 2 288 749 25 78 672 31 154
11 Mellunmäki 881 307 11 31 274 12 60
12 Itäkeskus 2 655 543 29 71 663 34 106
Total 35 206
0
200
400
600
800
1000
1200
0 4 8 12 16 20 24
Veh
icle
s
Hours
Vehicles arriving
Car
Shared Mobility

IMPACTS ON THE CITY AND TRANSPORT SYSTEM – 63
SHARED MOBILITY SIMULATIONS FOR HELSINKI — © OECD/ITF 2017
Some of the concerns mentioned above also apply to other major pick-up and drop-off locations
such as the metro and rail stations mentioned later on and other destinations with large concentrations of
opportunities - e.g. major employers or schools.
Besides the P&R all the scenarios require depots for the shared vehicles. From the 131 available
locations only around 36 are actually used in this scenario. Their location and the size required to
accommodate the Shared Taxi fleet are displayed in Figure 29. The largest requires 180 places for Shared
Taxis. In total these depots require around 3 600 places for the shared mobility vehicles. For this scenario
the capacity required for the P&R lots plus depots is close to 39 000 places. But these could replace all of
the parking for private vehicles that now exists inside the ring road I. As a reference there are around
24 000 on-street parking places in the inner city (significantly more inside ring road I) and 6 000 places
in private facilities in the city centre alone (Kamppi and Keskusta). Thus, a very cautious estimation
indicates a significant reduction of the existing parking spaces, including all on-street parking - though
some of this space will likely be required for picking up and droping off passengers.
Figure 29. Shared Taxi parking at depots for scenario 4
All of the existing private car parking in the HMA can be eliminated in scenario 5 where all car trips
are replaced by shared mobility (alone or in combination with the heavy modes). Figure 30 displays the
locations and sizes of the depots across the HMA. In this case they are more evenly spread throughout
the region and they tend to be bigger. The largest depot would require approximately 1 200 spaces for
Shared Taxis, compared to only 9 in the smallest depot. In total the depots’ capacity is close to 25 000
places. A conservative estimate taking into account only the parking places inside ring road I leads to a
significant reduction. If all existing parking throughout the HMA is considered, then the reduction would
be even higher.

64 – IMPACTS ON THE CITY AND TRANSPORT SYSTEM
SHARED MOBILITY SIMULATIONS FOR HELSINKI — © OECD/ITF 2017
Figure 30. Shared Taxi parking at depots for scenario 5
For scenario 9 the depots require nearly 6 300 places in total. The largest would hold close to
170 Shared Taxis. These numbers are of the same order of magnitude as scenario 4, but the difference is
that the depots location is more spread out across the HMA. Their distribution resembles more closely
that of the scenario 5 pattern, albeit at a much lower capacity per depot. In this case it is not a
straightforward task to evaluate how many parking places would be released since a substantial amount
of car trips (80%) would remain in place.
Increases in metro and rail ridership
Table 18 above displays the aggregate increases in metro plus rail pkm for all scenarios. In this section
there is a more detailed look at what happens regarding metro and rail ridership for scenarios 4, 5 and 9.
Table 23 below shows the increase in boarding’s at the heavy mode stations. Additionally it also presents
the changes in access mode to the stations.
Table 23. Increase in stations’ boarding and changes in access
Access to stations (%) Increase in Boarding from
Baseline (%) Scenarios Walk Bus Car Shared Mode
Baseline 39 58 2
4 32 47 17 5 24
5 32 0 0 68 23
9 39 0 0 61 0
There is a relevant increase in boarding at stations for scenarios 4 and 5. Approximately a quarter
more than what happens now. Even though more car and bus trips are replaced in scenario 5 there is a
slightly higher increase in boarding for scenario 4. This occurs because many of the car users dropping
their cars at the P&R lots directly transfer to heavy modes when these facilities are near a rail or metro
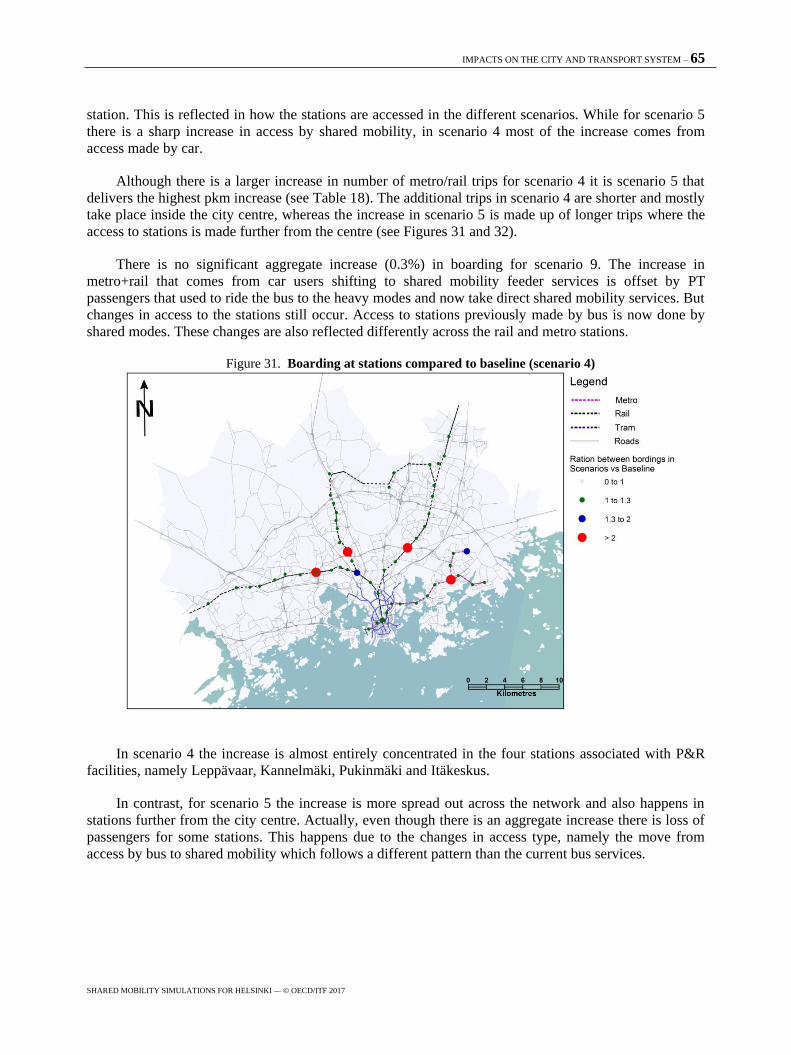
IMPACTS ON THE CITY AND TRANSPORT SYSTEM – 65
SHARED MOBILITY SIMULATIONS FOR HELSINKI — © OECD/ITF 2017
station. This is reflected in how the stations are accessed in the different scenarios. While for scenario 5
there is a sharp increase in access by shared mobility, in scenario 4 most of the increase comes from
access made by car.
Although there is a larger increase in number of metro/rail trips for scenario 4 it is scenario 5 that
delivers the highest pkm increase (see Table 18). The additional trips in scenario 4 are shorter and mostly
take place inside the city centre, whereas the increase in scenario 5 is made up of longer trips where the
access to stations is made further from the centre (see Figures 31 and 32).
There is no significant aggregate increase (0.3%) in boarding for scenario 9. The increase in
metro+rail that comes from car users shifting to shared mobility feeder services is offset by PT
passengers that used to ride the bus to the heavy modes and now take direct shared mobility services. But
changes in access to the stations still occur. Access to stations previously made by bus is now done by
shared modes. These changes are also reflected differently across the rail and metro stations.
Figure 31. Boarding at stations compared to baseline (scenario 4)
In scenario 4 the increase is almost entirely concentrated in the four stations associated with P&R
facilities, namely Leppävaar, Kannelmäki, Pukinmäki and Itäkeskus.
In contrast, for scenario 5 the increase is more spread out across the network and also happens in
stations further from the city centre. Actually, even though there is an aggregate increase there is loss of
passengers for some stations. This happens due to the changes in access type, namely the move from
access by bus to shared mobility which follows a different pattern than the current bus services.
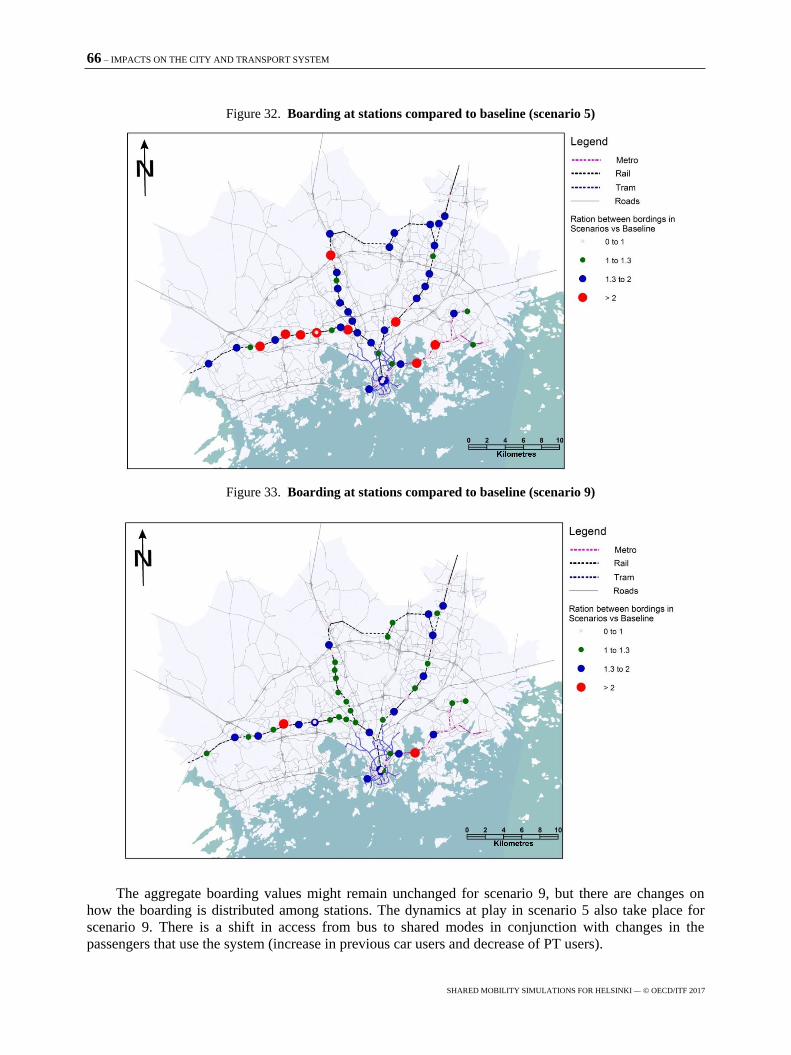
66 – IMPACTS ON THE CITY AND TRANSPORT SYSTEM
SHARED MOBILITY SIMULATIONS FOR HELSINKI — © OECD/ITF 2017
Figure 32. Boarding at stations compared to baseline (scenario 5)
Figure 33. Boarding at stations compared to baseline (scenario 9)
The aggregate boarding values might remain unchanged for scenario 9, but there are changes on
how the boarding is distributed among stations. The dynamics at play in scenario 5 also take place for
scenario 9. There is a shift in access from bus to shared modes in conjunction with changes in the
passengers that use the system (increase in previous car users and decrease of PT users).

IMPACTS ON THE CITY AND TRANSPORT SYSTEM – 67
SHARED MOBILITY SIMULATIONS FOR HELSINKI — © OECD/ITF 2017
The increases and changes to heavy modes ridership might imply changes to the system. Increases
of trips and pkm in scenarios 4 and 5 might require operational changes to cope with increased demand
and changes to the travel patterns. Moreover, sharp increases concentrated in a few stations might require
their redesign; this surely happens with accesses to stations. In all scenarios there is an increase in
vehicles picking up and dropping off passengers at the stations. Thus, for some stations this will only be
possible if there are changes to their parking and accesses.
Potential changes in accessibility
Accessibility to employment, health, cultural and other activities has a critical influence on the
quality of life offered by a metropolitan region and its economic dynamism (van Wee and Geurs, 2011).
Below it is examined how the introduction of shared mobility can change accessibility to the key
economic variable of employment.
Table 24. Accessibility to employment (PT + shared modes)
Scenarios
Employment
reached in 45
minutes (%)
Effective access of
population (%) to %
of employment
25% 50%
Baseline 40 27 1
4 56 57 16
5 52 51 14
9 55 57 18
All of the scenarios analysed show increases in accessibility to employment. In Table 24 it is
possible to compare what is the average percentage of employment currently reachable in 45 minutes by
PT by the HMA population and what are the percentages reachable with the introduction of shared
mobility, namely the Taxi-Bus services that more resemble the “traditional” bus offer. Currently 40% of
employment is reachable on average, whereas in all scenarios tested it is above 50%. Another method to
evaluate accessibility is through effective access and not a sudden cut off (see Annex 4). According to
this methodology currently 27% of the HMA population has effective access to 25% of the available
employment. Only 1% of inhabitants have access to 50% of the employment offer in HMA. These values
are always higher with the introduction of shared mobility. In all cases more than 50% of the population
has access to 25% of employment and above 10% have access to 50% of all jobs.
Figure 34 examinges how the increases in accessibility are distributed across the HMA. The
effective accessibility in scenario 5 – shared modes plus metro and rail - is compared to existent
accessibility by PT.
It is noticeable that the increase in accessibility is not uniform across HMA. The peripheries of
HMA benefit the most with the introduction of shared mobility. There is an increase in spatial equity. In
the city centre and along the main heavy modes axis the increases are reduced or non-existent. In fact,
there are areas in southern Espoo that loose accessibility. In scenario 5 all bus services are replaced. For
this specific zone the accessibility provided by bus is higher than the worst case for Taxi-Bus (defined by
design, see Table 13). It should be mentioned that this zone matches the southern Espoo corridor that will
be served by the new west metro line. Once in operation the shared modes can be offered in articulation
with the new line and it is likely that there will be no accessibility losses in this area. Nonetheless, these
results reinforce two key findings already mentioned: that the introduction of shared mobility does
deliver significant benefits for the HMA, but that it should not be deployed as a replacement for all bus
services.

68 – IMPACTS ON THE CITY AND TRANSPORT SYSTEM
SHARED MOBILITY SIMULATIONS FOR HELSINKI — © OECD/ITF 2017
Further study would be required to evaluate potential changes to land use and travel demand caused
by this increase in overall accessibility and spatial equity.
Figure 34. Accessibility to employment compared to baseline (scenario 5)
Key findings
In short, the key findings regarding impacts on the metropolitan area obtained from the simulation
results are:
Shared mobility delivers positive impacts to the HMA. At the lowest car replacement rate
(e.g. scenario 3 and 9) the CO2 emissions reduction are in line with the maximum that can
be expected from highly influential measures such as congestion charges. Furthermore, it
provides for increases in accessibility and would signify a relevant modal shift away from
car. For more ambitious scenarios (e.g. 4 and 5) there can be additional gains in decreased
congestion and release of public space currently used for private car parking.
The HMA has a robust public transport offer which is why - although relevant - the shared
mobility impacts in this case are lower than for previous case studies. This also applies to
the bus offer. Replacing low demand bus services can deliver positive impacts, but that does
not take place when other services are replaced.
Shared mobility has the potential to leverage metro and rail ridership, particularly in more
ambitious scenarios. Increases in demand, changes in the access to stations and trip patterns
will likely imply redesign of stations and associated parking/accesses. The assessment of
available capacity of the heavy modes is beyond the scope of this study, but the increase in
ridership will imply operational changes to the metro and rail operations. Further study
would be required to assess if additional investments to the infrastructure is required.
IMPACTS ON THE CITY AND TRANSPORT SYSTEM – 69
SHARED MOBILITY SIMULATIONS FOR HELSINKI — © OECD/ITF 2017
Having the Helsinki centre (inside ring road I) free of car travel delivers significant impacts
and efficient services, but it implies a sharp increase in P&R capacity which might not be
feasible. Special attention should be given to the design of these facilities and respective
accesses which might otherwise become bottlenecks.
For all scenarios there are increases in accessibility which are particularly high for areas in
the periphery that currently have less access to opportunities.
A minimum scale is required in order to take advantage of the benefits provided by shared
mobility. This is achieved for the minimum replacement rates tested (20% car trips). The
new modes’ positive impacts are maximised when car trips and low occupancy bus services
are targeted.
In the next chapter emphasis is placed in the performance indicators, both from a users’ and
supply-side perspectives.


PERFORMANCE INDICATORS – 71
SHARED MOBILITY SIMULATIONS FOR HELSINKI — © OECD/ITF 2017
Performance indicators
In the previous section more overreaching impacts of shared mobility in the HMA were addressed,
some of the topics included emissions reductions, congestion, parking space or changes in accessibility.
The simulation results examined in this section concern the system performance both from a supply and
user perspective. First to be discussed are the changes that take place in the quality of service, namely
travel, waiting and access times. This is looked at from an aggregate level but also for different areas and
user types (e.g. for current car or PT users). Next the analysis turns to production-related indicators like
vehicle fleet size and costs. In the end there is a brief discussion on the possibility of adopting electric
vehicles to equip the shared mobility fleet. All the results presented focus on the scenarios selected for
more in-depth analysis which are 4 (Helsinki city with no car trips inside the ring road I), 5 (full
replacement of car and buses) and 9 (20% car trips replaced and bus feeder trips).
Quality of service
Several indicators related to PT quality of service are presented in Table 25. The values for the
scenarios tested include the shared mode trips.
Table 25. Public transport and shared mobility indicators
In minutes (average per trip) Reduction from baseline (%)
Scenarios Transfers Waiting time Access time Transfers Waiting time Access time
Baseline 0.43 10.62 10.40
4 0.31 9.55 7.51 27 10 28
5 0.18 6.90 3.95 58 35 62
9 0.29 8.59 7.15 33 19 33
In all scenarios there are improvements on service quality for all indicators. In scenario 5 there are
drastic reductions in the number of transfers and access time. The average number of transfers is less
than half that of the baseline and access time drops to a third of the original baseline value. There is also
a 35% reduction on waiting time. Albeit not so intense, the improvements in scenarios 9 and 4 are also
quite clear. The smaller reductions occur for scenario 4, where the access time and transfers still fall by
almost a third. In contrast to scenarios 5 and 9, in 4 there is no replacement of previous PT trips. Thus,
the average improvements come only from the car trips that shift to shared mobility, heavy modes or a
combination of both.
These results reiterate that the service level offered by shared mobility is indeed an important
complement to the traditional PT offer. It is important to remember that the study of potential users’
preferences highlighted how very relevant these three indicators are for the users. The simulation applied
to the HMA indeed shows that the new shared modes offer more direct services with less transfers than
traditional PT. Hence, they can be an important instrument in shifting modal choice away from private
car. For trips within Helsinki, the PT offer is already robust. There is also a good service in the radial
axis connecting the outer areas to the centre. However, in zones with less accessibility to the trunk PT
network, or for travel patterns that do not fit the radial-axis logic, car is the preferred mode. It is
particularly difficult for “traditional” PT to provide high levels of service in these situations. The
increased flexibility and comfort provided by the shared mobility solutions are particularly suited to
attract these types of trips. Additionally, the increased level of service can also attract car users in areas
where the PT offer is good but some of its features are still a barrier – e.g. lack of comfort/seated place,

72 – PERFORMANCE INDICATORS
SHARED MOBILITY SIMULATIONS FOR HELSINKI — © OECD/ITF 2017
difficulty to have transfer-less journeys for all origin-destinations and fixed timetables. Moreover,
improved access to the heavy modes network can be provided through feeder services; this option
combines the flexibility of the new modes with the high capacity of rail based modes. Most survey
respondents regarded this combined offer as highly relevant and welcomed it in the focus group
discussion. The simulation results presented in the previous chapter show that significant increases in
metro and rail ridership are possible, particularly in more ambitious scenarios.
Table 26. Average travel times per mode
Average travel time (min) Reduction from baseline (%)
Scenarios Car PT All trips Motorised Car PT All trips Motorised
Baseline 20.65 40.78 22.41 28.68
4 10.81 33.72 21.27 27.21 48 17 5 5
5 - 37.28 27.95 37.28 - 9 -25 -30
9 12.48 39.01 20.71 26.22 40 4 8 9
The changes in average travel times are displayed in Table 26. In all scenarios there is a decrease in
the PT average travel times. This is more pronounced in scenario 4 and less apparent in scenario 9. The
car trips that remain in scenarios 4 and 9 have much lower travel times. This is not necessarily an
indication that there is an increase in performance of the trips and it’s more related with the type of trips
that are replaced. In scenario 9 many of the car trips replaced are in the outer areas of HMA (see Figure
41) and the remaining car trips tend to be for shorter distances. As for scenario 4, all of the commuting
trips between the city centre and periphery are counted as PT since they all shift to shared mobility or
heavy modes inside the ring road I.
The motorised trips average trip time decreases for scenarios 4 and 9. This means that in average PT
plus car users have lower trip times. But for scenario 5 there is an increase in motorised times, this seems
to indicate that there might be increased travel times for previous car users. In fact, the shared mobility
services make detours in order to pick up and drop off passengers and this is likely to increase the trip
times of previous car users.
In Table 27 the travel times of the current PT and car users are presented for each of the scenarios.
For the baseline the car users and PT users match the average times of the respective modes. But in the
other scenarios some or all of the car users might shift to share mobility and the same happens for the bus
users. This indicates how the travel times of current car and PT users changes with each scenario.
Table 27. Average travel times for car and PT users
Average travel time Reduction from baseline (%)
Scenarios
Current car
users
Current PT
users Car users PT users
Baseline 20.65 40.78
4 17.91 - 13 -
5 38.58 35.42 -87 13
9 17.47 39.33 15 4
PT users on average always experience travel time decreases, more so in scenario 5 with full
replacement. For people that currently use bus services changing to shared mobility decreases their
average travel time. The introduction of shared mobility not only drastically improves the PT indicators
mentioned in Table 25, but also has a positive effect on trip times.

PERFORMANCE INDICATORS – 73
SHARED MOBILITY SIMULATIONS FOR HELSINKI — © OECD/ITF 2017
In scenario 9 less PT trips shift to share mobility, hence the gains of more direct trips provided by
the shared modes are not so significant. Still, there are travel time gains for the bus feeder trips that are
now replaced by the shared modes. There are no bus users that shift to shared mobility in scenario 4, in
this scenario only car trips are replaced so the PT users’ times remain the same.
Interestingly, for car users there are average time reductions in scenario 4 and even higher decreases
for scenario 9. For scenario 4 the previous commuting trips done by car are now faster. The decrease in
congestion throughout the region enables faster car times in the outskirts. Once the users leave the cars in
the P&R facilities they take direct metro/rail trips or catch the shared modes that, due to the high
concentration of demand at the origin, do not need to make many (if any) detours inside the ring road I.
In scenario 9 the car trips are replaced according to the calibrated discrete choice model utility functions,
namely the ratio between the shared mode and car choice probabilities. Hence, the car trips that have the
worst attributes in comparison with the shared mode alternative (including better travel times) are the
ones replaced. In both these scenarios the car users on average see improvements in their travel times by
shifting from car to shared modes (and/or heavy modes).
In scenario 5 the car users experience on average an increase in travel time. In this case all car trips
are replaced and for most of them there are increased detour times compared to their previous car trips.
The following figures offer a more detailed look at how travel time changes across different regions.
Figure 35. Average travel time change for car users (scenario 4)
Figure 35 shows how in scenario 4 the car users’ trips that originated outside the ring road I have
reductions in travel time. It is faster to move into the city due the reasons already described above. On
the other hand when their origin is inside the city centre travel time tends to increase. In this case there
are increased detours for trips made entirely inside the city. These latter trips tend to have shorter travel
times, so relative increases in their time are also smaller and less penalising for the users. Moreover, in
the users’ preferences survey car users stated that they were willing to have some detour time added to
their trips.

74 – PERFORMANCE INDICATORS
SHARED MOBILITY SIMULATIONS FOR HELSINKI — © OECD/ITF 2017
Figure 36 displays the reduction in car pkm that occurs for trips originating throughout the HMA in
scenario 4. In fact, even though car travel is only restricted in the centre, there are pkm decreases in both
the city centre and entire region. An important component of the overall car pkm decrease in this
scenario comes from commuting trips originating outside the city core.
Figure 36. Car pkm reduction (scenario 4)
For PT users in scenario 5 there is an overall decrease in trip times across the entire metro area,
particularly in some areas of north Espoo and north-east Vantaa (see Figure 37). There are also, however
increases, like in southern Espoo. This is related to factors already made evident in Figure 34, namely the
bus lines that already provide a good quality of service for this region. There are scattered areas to the
north where the simulation results show increases of travel times for PT users. The road network
employed in the model was sparse in these regions. There are fewer nodes on the network, hence more
scattered Taxi-Bus stops and decreased connectivity which increases the detour times for picking up
passengers. If the secondary network that exists in this area had been used in the simulation, then travel
times for this region would decrease in the simulation.

PERFORMANCE INDICATORS – 75
SHARED MOBILITY SIMULATIONS FOR HELSINKI — © OECD/ITF 2017
Figure 37. Average travel time change for PT users (scenario 5)
Figure 38. Average travel time change for PT users (scenario 9)

76 – PERFORMANCE INDICATORS
SHARED MOBILITY SIMULATIONS FOR HELSINKI — © OECD/ITF 2017
The dynamics described for scenario 5 are also at play in scenario 9. Like for scenario 5 there is an
overall decrease in travel times for PT users. But the gains are less intense and the increases in southern
Espoo are more noticeable. This happens because there is a higher relative weight of bus trips replaced
that originated in this area.
The areas with higher bus pkm reductions (see Figure 39) broadly match the regions with travel
time decreases, the exception being the southern Espoo area. There are some increases in places further
north, but they represent a very small number of trips. Increases here are likely connected to more
circuitous routes taken by the shared modes and higher access times. These are related with the sparse
road network available in those regions which decreases routing options and force longer paths
sometimes to collect passengers that are not so far appart. This also implies a lower density of Taxi-Bus
stops and increased access times (there where more bus stops in this area than nodes on the road
network). The model is likely overestimating travel times in these more remote areas.
Figure 39. Bus pkm reduction (scenario 9)
In scenario 9 the overall trip times for car users decreases. The same happened in scenario 4, but the
areas where this is felt are reversed. In scenario 9 the trips that originated closer to the centre have shorter
travel times, while trips that originated further away see their travel time increase.
Indeed, there is a higher proportion of car pkm reduction in areas further from the centre for
scenario 9 (comparing Figures 36 and 41). The findings obtained in the focus group and stated
preferences survey pointed to an increased attractiveness of shared mobility in areas further from the
centre which were defined as zones more than 12 km from the centre and beyond the reach of the metro.
This is translated to the discrete choice model that was employed to select the car trips to replace. Car
users that live in the outer areas are more likely to prefer shared mobility even if some of its attributes are
apparently not so competitive when compared to the car option. This broadly matches the areas where
average travel time increases in Figure 40. For users that are closer to the centre the choice between
shared mode and car is more strictly related with the trip attributes, hence it is more likely that the shared

PERFORMANCE INDICATORS – 77
SHARED MOBILITY SIMULATIONS FOR HELSINKI — © OECD/ITF 2017
mode option will be faster than car for the trips replaced there - roughly corresponding to the areas where
there are average travel time decreases in the map above.
Figure 40. Average travel time change for car users (scenario 9)
Figure 41. Car pkm reduction (scenario 9)

78 – PERFORMANCE INDICATORS
SHARED MOBILITY SIMULATIONS FOR HELSINKI — © OECD/ITF 2017
Operational performance
The fleet vehicles size presented in Table 28 is obtained through a post-simulation processing
algorithm that takes into account more information than the preliminary estimates shown in Table 19.
Table 28. Average occupancy and vehicles required
Average occupancy Number of vehicles
Scenarios Shared Taxi Taxi-Bus 8 Taxi-Bus 16 Shared Taxi Taxi-Bus 8 Taxi-Bus 16
4 2.33 3.78 8.95 2 078 2 274 2 186
5 2.35 3.33 8.88 17 582 7 127 9 936
9 2.04 3.56 9.08 4 260 1 203 1 855
For scenario 4 around 6 500 vehicles are required, mostly Taxi-Buses. This would enable the
replacement of all car travel inside the Helsinki ring road I and close to 30% of all car pkm in the HMA.
The fleet required to replace all car and bus trips in the HMA (scenario 5) is close to 35 000 vehicles.
This is number corresponds to 7% of the current private car fleet in HMA. In this case the number of
Shared Taxis and Taxi-Buses would be roughly the same. Approximately 7 300 vehicles are necessary
when 20% of car and all bus feeder trips are replaced.
These fleet sizes seem high when compared with current PT operations. But this scale also opens
opportunities to engage in partnerships with third parties for its procurement, maintenance and operation.
This might include new mobility services providers, vehicle manufacturers or even other PT operators. In
addition, fleets of this size provide economies of scale that might be used as entry points for emerging
technologies such as electric powered vehicles or driverless cars.
Figure 42. Average occupancy throughout the day (scenario 4)

PERFORMANCE INDICATORS – 79
SHARED MOBILITY SIMULATIONS FOR HELSINKI — © OECD/ITF 2017
Figure 43. Vehicles in operation throughout the day (scenario 4)
As can be seen in Table 28 the average occupancy of vehicles is around 50% of their capacity. This
level of occupancy is maintained throughout the day with a slight decrease during the night (see Figure
42 for scenario 4, the same trend takes place for the other scenarios).
The number of vehicles in operation closely follows demand. There are increases in the peak
periods and a significant decrease during night time (see Figure 43). The vehicle needs throughout the
day and the total fleet required are calculated taking into account the empty movements to the depots that
happen once a vehicle finishes a service and it is not immediately assigned to a new one.
Figure 44. Shared Taxi ratio of km occupied per km empty
0
0.1
0.2
0.3
0.4
0.5
0.6
0.7
0.8
0.9
1
0 4 8 12 16 20 24
Rat
io k
m o
ccup
ied
vs e
mpt
y
Hours
Scenario4
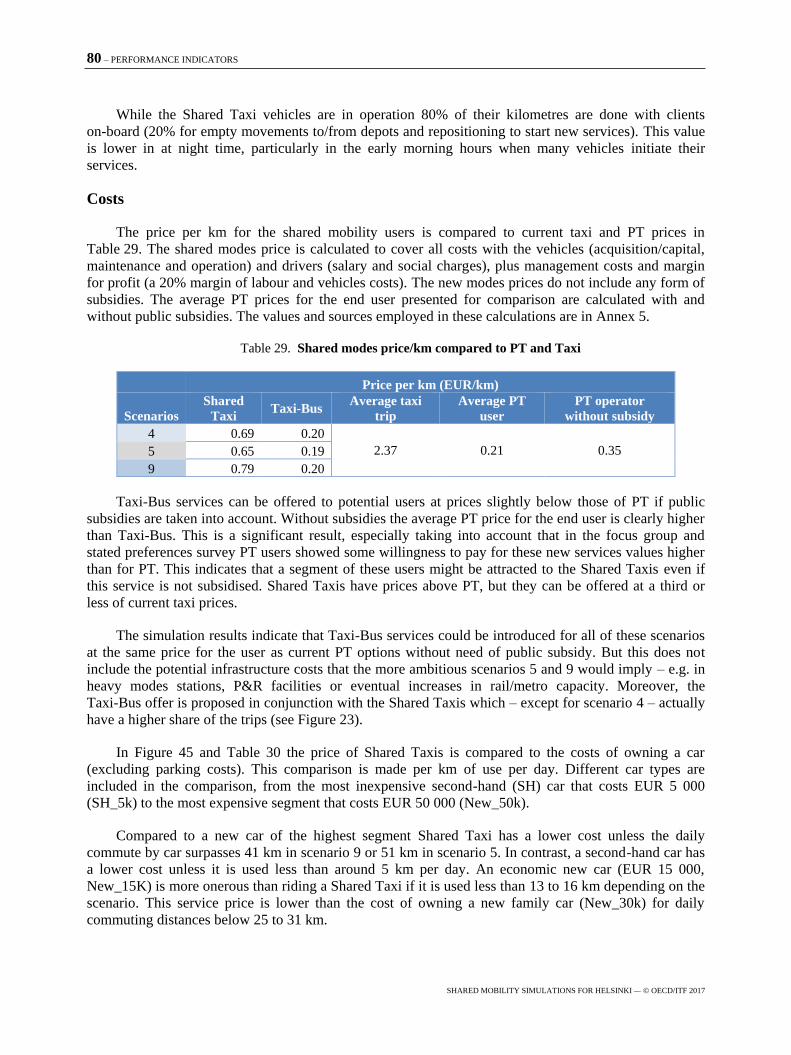
80 – PERFORMANCE INDICATORS
SHARED MOBILITY SIMULATIONS FOR HELSINKI — © OECD/ITF 2017
While the Shared Taxi vehicles are in operation 80% of their kilometres are done with clients
on-board (20% for empty movements to/from depots and repositioning to start new services). This value
is lower in at night time, particularly in the early morning hours when many vehicles initiate their
services.
Costs
The price per km for the shared mobility users is compared to current taxi and PT prices in
Table 29. The shared modes price is calculated to cover all costs with the vehicles (acquisition/capital,
maintenance and operation) and drivers (salary and social charges), plus management costs and margin
for profit (a 20% margin of labour and vehicles costs). The new modes prices do not include any form of
subsidies. The average PT prices for the end user presented for comparison are calculated with and
without public subsidies. The values and sources employed in these calculations are in Annex 5.
Table 29. Shared modes price/km compared to PT and Taxi
Price per km (EUR/km)
Scenarios
Shared
Taxi Taxi-Bus
Average taxi
trip
Average PT
user
PT operator
without subsidy
4 0.69 0.20
2.37 0.21 0.35 5 0.65 0.19
9 0.79 0.20
Taxi-Bus services can be offered to potential users at prices slightly below those of PT if public
subsidies are taken into account. Without subsidies the average PT price for the end user is clearly higher
than Taxi-Bus. This is a significant result, especially taking into account that in the focus group and
stated preferences survey PT users showed some willingness to pay for these new services values higher
than for PT. This indicates that a segment of these users might be attracted to the Shared Taxis even if
this service is not subsidised. Shared Taxis have prices above PT, but they can be offered at a third or
less of current taxi prices.
The simulation results indicate that Taxi-Bus services could be introduced for all of these scenarios
at the same price for the user as current PT options without need of public subsidy. But this does not
include the potential infrastructure costs that the more ambitious scenarios 5 and 9 would imply – e.g. in
heavy modes stations, P&R facilities or eventual increases in rail/metro capacity. Moreover, the
Taxi-Bus offer is proposed in conjunction with the Shared Taxis which – except for scenario 4 – actually
have a higher share of the trips (see Figure 23).
In Figure 45 and Table 30 the price of Shared Taxis is compared to the costs of owning a car
(excluding parking costs). This comparison is made per km of use per day. Different car types are
included in the comparison, from the most inexpensive second-hand (SH) car that costs EUR 5 000
(SH_5k) to the most expensive segment that costs EUR 50 000 (New_50k).
Compared to a new car of the highest segment Shared Taxi has a lower cost unless the daily
commute by car surpasses 41 km in scenario 9 or 51 km in scenario 5. In contrast, a second-hand car has
a lower cost unless it is used less than around 5 km per day. An economic new car (EUR 15 000,
New_15K) is more onerous than riding a Shared Taxi if it is used less than 13 to 16 km depending on the
scenario. This service price is lower than the cost of owning a new family car (New_30k) for daily
commuting distances below 25 to 31 km.

PERFORMANCE INDICATORS – 81
SHARED MOBILITY SIMULATIONS FOR HELSINKI — © OECD/ITF 2017
Figure 45. Total commuting cost per day and km of car ownership vs Shared Taxi (scenario 4)
Table 30. Break even for commuting distances vs Shared Taxi
Daily km required for car to be less expensive
Scenarios SH_5k New_15k New_30k New_50k
4 5 15 29 48
5 6 16 31 51
9 5 13 25 41
From a price perspective, Shared Taxis are especially competitive with private car for shorter
distances. But one key segment to attract is car users that live far from the centre and have longer
commuting distances. Further study would be required to evaluate if some sort of subsidy or other
economic incentives are necessary to make the new modes particularly attractive for these trips. The
effects in current PT funding from introducing the new modes is not at the core of this report analysis
and it varies for the different scenarios. There are nonetheless some overall insights concerning costs and
subsidies that can be put forward for each case:
In scenario 4 all current PT is kept and there is a significant increase in heavy modes
ridership. Shared mobility services are provided only inside ring road I for a range of
distances that, according to the simulation results, makes Shared Taxis more competitive
than private cars price wise. Hence, in this scenario there is no indication that subsidies
would be needed to cover the shared mobility operations and the increases in heavy modes
ridership would mean added fare revenues for PT. But there would be infrastructure costs
associated with P&R facilities, heavy modes stations and eventual investments to increase
capacity in the metro and rail networks.
For scenario 5 all current car and bus trips are replaced. Thus, the costs associated with
buses would be removed. The Taxi-Bus operational costs could be covered without
subsidies. But the same is not clear regarding the Shared Taxis, particularly in order to
induce a modal shift away from private car in the regions more distant from the centre.
These considerations do not take into account the investment costs required in rail/metro
stations and added capacity to the heavy modes, plus the implementation of pick-up and
drop-off locations. In addition, removing all bus services from a CO2 emissions reduction
0.00
5.00
10.00
15.00
20.00
25.00
30.00
35.00
40.00
45.00
0 10 20 30 40 50 60 70
Eur
os/d
ay
Kms/day
New_15k
New_30k
New_50k
SH_5k
Shared Taxi

82 – PERFORMANCE INDICATORS
SHARED MOBILITY SIMULATIONS FOR HELSINKI — © OECD/ITF 2017
perspective and other impacts (e.g. average travel time for some areas) is not the best
solution.
All bus feeder trips are replaced in scenario 9 together with 20% of car trips - many of them
in the outer areas, see Figure 41. The costs of providing the bus feeder services would cease
and they could be replaced with Taxi-Buses that estimates indicate do not need subsidies –
but like the impacts and performance results suggest, the effects on emissions would
probably be maximised by focusing on the lower occupancy services alone (whether they
are used to feed heavy modes or not). The car trips replaced are the 20% more likely to shift
to the new modes. So, even though the prices in this scenario are higher than for scenario 5
the users might be willing to pay higher prices for the trips that are being replaced. The
results suggest that the investment costs required would be considerably lower than for the
other scenarios.
The scenarios which might free more parking spaces for other uses – e.g. 4 and 5 – are the same
ones that will potentially require more investment. In these cases the added societal benefits brought by
the introduction of more special efficient modes can be a justification for the higher investment costs.
It should be noted that the shared mobility prices were calculated based on the current HSL driver’s
costs (more details in Annex 5). An area requiring further study is the forms of procurement of these new
services or more broadly the issues regarding who and how the new modes should be supplied. Different
concerns which are not always aligned come into play here, e.g. productive efficiency and scale
economies; flexibility and innovation; need to guide the service towards a social optimum (e.g. ensuring
service levels for certain areas or maximising emissions reduction potential); profitability or minimising
price for the users while keeping in check the need for public subsidies.
There are scale economies in the offer of these services. Scenario 5, where all car and bus trips are
replaced, delivers the lowest prices per km. The Shared Taxi prices in scenario 4 are clearly lower than
scenario 9. The operations in scenario 4 are concentrated inside the ring road I where there is a higher
density of trips which enables more efficient services. Whereas in scenario 9 the Shared Taxi services are
spread across the metropolitan area and their occupancy is lower. As for the Taxi-Bus services their price
is actually the same for both of these scenarios. This happens because in scenario 9 most Taxi-Buses
replace current bus feeder trips which are concentrated in a few destinations (the metro or rail stations).
This enables high occupancies for this type of vehicle in scenario 9.
Electric vehicle fleet
The simulation was also employed to test the adoption of an electric vehicles fleet. The electric
vehicles autonomy, required charging times and charging stations where taken into account.
Table 31. Number of electric vehicles
Number of vehicles
Scenarios Shared Taxis Taxi-Bus Total
4 2 529 4 634 7 163
5 17 033 15 453 32 486
9 4 213 3 690 7 913

PERFORMANCE INDICATORS – 83
SHARED MOBILITY SIMULATIONS FOR HELSINKI — © OECD/ITF 2017
For scenarios 4 and 9 the required vehicle fleet size increases around 10%. This solution will have
additional costs associated with the charging stations in the depots, plus vehicles acquisition costs and
increased fleet size. But the fleet size increase seems manageable and it provides shared mobility with an
electric fleet that offers the same quality of service to the users.
The reduction in CO2 emissions would amount to 25% in scenario 4, 97% in scenario 5 and 19% in
scenario 9. These are all sizable reductions. Indeed, for scenario 9 that seems more achievable, the
introduction of shared mobility services provided by electric vehicles is able to attain a very ambitious
CO2 reduction target.
Key findings
The key findings regarding system performance obtained from simulating the introduction of shared
mobility for the HMA are:
Shared mobility delivers services that, compared to the current PT offer, are on average
more direct and with shorter access and waiting times. In addition, it also brings gains in
reduced travel times. Hence, they can more easily attract private car users which otherwise
would not shift to “traditional” PT options. The new modes’ flexibility also makes them
especially suited as a first/last mile solution for metro and rail trips increasing the reach of
the heavy modes. Moreover, even for car users the average travel times are reduced in
scenarios 4 and 9. The same does not happen in scenario 5 where all car trips are replaced
and the additional detour time required by the shared modes increases travel times for car
users.
The price at which the new services can be offered is competitive for their respective
segments. Taxi-Bus services can be offered at a lower price than current PT (even though
PT users are willing to pay a bit more for it). Shared Taxi price is a third of current taxi
fares and it can compete with the cost of owning a new economic car for daily commuting
distances below 13 to 16 km. There are scale economies for this service delivery. The prices
decrease with increases in offer. All the scenarios tested replace at a minimum 20% of
current car trips.
With a fleet size equivalent to 7% of the current private car stock all car and bus trips in the
HMA can be replaced. A fleet of 6 500 vehicles can eliminate all the need for car travel
inside the Helsinki ring road I, although this solution would bring its own set of challenges
like the management and design of the P&R facilities mentioned in the previous chapter.
Shared Mobility can be provided by an electric vehicle fleet with a 10% added size. In this
case reductions of CO2 emissions of close to 20% can be obtained in a scenario where 20%
of car trips and all bus feeder trips are replaced. It increases to a 25% reduction when there
is no car travel inside the city centre and 97% reductions are achieved with full
replacement.
In the next chapter the key findings of this study are summarised. Additionally, further insights are
discussed regarding topics of interest to the implementation of shared mobility not addressed in this
report.


CONCLUSIONS – 85
SHARED MOBILITY SIMULATIONS FOR HELSINKI — © OECD/ITF 2017
Conclusions
This report examined how the optimised use of new shared modes can change the future of mobility
in the Helsinki Metropolitan Area. To assess this change the entire mobility of the HMA was simulated
for one working day. The agent-based model employed allowed testing different transport scenarios for
current demand patterns. The scenarios explored include full replacement of road motorised modes (car,
taxi and buses) and partial adoption of the new shared services by targeting specific trips and users. In all
cases the rail-based modes (rail, metro and tram) are kept and the new shared modes can be employed to
feed metro and rail.
The ultimate goal of this document is to provide governments and other public officials with
meaningful advice regarding the challenges and opportunities brought by these new services. The key
findings and further research needs are discussed below.
Key findings
The shared mobility solutions tested deliver significant positive impacts to the Helsinki
Metropolitan Area. For the lowest car replacement scenarios – e.g. with 20% of car trips replaced – the
CO2 emissions reduction are in line with what can be expected from introducing influential measures
such as congestion charges. Furthermore, it provides for increases in accessibility and quality of service,
and it would signify a relevant modal shift away from car. For more ambitious scenarios there can be
additional gains in decreased congestion and the ,release of public space currently used for private car
parking. With an electric fleet, CO2 emissions could be further reduced.
The new shared services should be implemented at a sufficient scale in order to deliver relevant
benefits to the city and be provided at manageable costs. Previous studies show that for low uptakes there
are no significant impacts to the city and there might even be increases in congestion. For the scenarios
tested the price at which the new services can be offered is competitive for their respective segments, but
under the condition that there is a relevant adoption of shared mobility - e.g. 20% of car trips shift to the
new modes. In addition, fleets of this dimension provide economies of scale that might be used as entry
points for emerging technologies such as electric powered vehicles or driverless cars.
The HMA has a robust public transport offer which is why - although relevant - the shared mobility
impacts in this case are lower than for previous case studies. This is particularly true for the Helsinki city
centre. There is also a good service in the radial axis connecting the outer areas to the core. However, in
zones with less accessibility to the trunk PT network, or for travel patterns that do not fit the radial-axis
logic, car is the preferred mode. The increased flexibility and comfort provided by the shared mobility
solutions are particularly suited to attract this type of trips. Additionally, the increased level of service
can also attract car users in areas where the PT offer is good but some of its features are still a barrier –
e.g. lack of comfort/seated place or fixed timetables. Moreover, improved access to the heavy modes
network can be provided through feeder services; this option combines the flexibility of the new modes
with the high capacity of rail-based modes. Most survey respondents regarded this combined offer as
highly relevant and welcomed it in the focus group discussion. The simulation results suggest that
significant increases in metro and rail ridership are possible, particularly in more ambitious scenarios.
Transport users in the HMA have a very positive attitude towards shared mobility. They are rather
familiar with digital age technologies and the already existing transportation services based on mobile
apps. Hence, potential users’ perceptions and knowledge of the tools required to use shared mobility do

86 – CONCLUSIONS
SHARED MOBILITY SIMULATIONS FOR HELSINKI — © OECD/ITF 2017
not constitute barriers to its implementation. If anything, there is a clear wish to see these new services
added to the existing offer and an expectation that they can be a tool to improve mobility in the
metropolitan area. Indeed, users mentioned that the attractiveness of these services would be very much
related to how much they are present throughout the entire HMA. For instance, in the focus group almost
a third of car owners (27%) were willing to sell their cars but only if shared mobility is provided in the
entire HMA. Notwithstanding the users’ demographic characteristics that favour adoption of the new
modes – living far from the centre, being a PT user and a senior – quality of service and price play a
decisive role in mode choice.
The positive impacts of shared mobility services on the HMA are maximised by targeting private
car users who are currently not well covered by public transport. Policy measures, new services and
information campaigns should target these potential early adopters, i.e. who live far from the city centre
and are carrying out trips from the outskirts of the metropolitan area with trip patterns not aligned with
existing public transport offer. These are the car users more likely to be first attracted to the new modes
and their trips represent a large share of current car passenger-km. In addition, replacing low occupancy
and frequency bus services delivers positive impacts emissions wise. But the simulation of several
scenarios indicates this does not happen when other bus types are replaced. Special care is needed when
designing the services to target these users and trips. Evidence from the focus group suggests that PT
users are more prone to adopt the new modes. Price wise the new modes are more competitive versus
private car for shorter trips. Regulation and some sort of guidance is likely to be necessary in order to
ensure that most trips replaced are car-based and that high prices in areas further from the centre are not a
barrier to modal shift from car.
A wide-range deployment of shared mobility services would result in a significant reduction in
required parking places. Together with congestion relief this would free space for other uses. However,
new mobility services will need to be accompanied by improvements in drop-off and pick-up zones
especially at rail or metro stations and at final destinations with a concentration of opportunities (such as
major employers or schools). Our results show a sharp increase in the number of boarding’s in some
stations and this implies operational changes in order to cope with increased demand. Additional system
capacity may also be required in heavy modes (particularly rail) in order to maintain current service
levels due to increased ridership.
Electric vehicles can be used to provide the new shared services. This would entail an increase of
approximately 10% to the fleet size, along with the required charging stations at depots. In this case
reductions of CO2 emissions of close to 20% can be obtained in a scenario where 20% of car trips and all
bus feeder trips are replaced. This increases to a 25% reduction when there is no car travel inside the city
centre and 97% reductions are achieved with the full replacement of current car and bus trips.
Having the Helsinki centre (inside ring road I) free of car travel delivers significant benefits to the
HMA and efficient operations at a good service level. Although in this case the shared mobility offer is
concentrated in the city centre, around 54% of all car trips in the HMA are impacted. This includes
commuting trips that occur between the outer regions and areas inside the ring road I which represent
36% of the total car trips in HMA. Nonetheless, it implies a sharp increase in P&R capacity whose
feasibility was not studied. Special attention should be given to the design of these facilities and
respective accesses which might otherwise become bottlenecks.
CONCLUSIONS – 87
SHARED MOBILITY SIMULATIONS FOR HELSINKI — © OECD/ITF 2017
Future research needs
There is a degree of uncertainty associated with any modelling exercise. In this case the main
sources of uncertainty and error are:
A total of 20 people took part in the focus group. They represented a balanced mix of
socio-demographic and mobility profiles representative of the overall HMA population.
Nonetheless, this is a small sample from which to calibrate a discrete choice model. A
larger sample would be necessary to quantify with more confidence the impact on modal
choice of factors like price or place of residence.
The road network employed in the simulation was sparse in some of the more remote areas
of the HMA. These are areas with low trip density and this issue will not have a relevant
impact on the aggregate values. But for a more spatially disaggregated analysis this can
create a bias in the results leading to increased vkm and travel times for the new services
compared to what would happen had a network more detailed in those areas been employed
in the simulation.
It is assumed that the metro/rail stations and other high trip density destinations are ready to
cope with the increase in number of vehicles performing pick-up and drop-off maneuvers. It
is also assumed that the heavy modes are able absorb the increased ridership and in scenario
4 that P&R facilities can be made with sufficient parking. The congestion results presented
are sensible to the number and type of vehicles on the links. They indeed signal increases in
traffic in some of the accesses to these potential bottlenecks. But they do not take into
account potential additional turbulences caused by vehicles stopping in circulation lanes to
pick-up/drop-off passengers or unable to find parking. If these assumptions are not met
there will also be a drop in service levels.
Beyond these issues there are topics of relevance to the implementation of shared mobility not
addressed in the simulation. The introduction of shared mobility at the scale studied in this report implies
changes to travel behaviour and the overall transportation system that are hard to grasp by any single
model or study. In addition, there are impacts to other areas beyond transportation. For instance, the
modelling framework assumes static demand patterns. The simulation employed provides a very detailed
analysis of several scenarios, but it does not take into account changes induced to travel behaviour by a
wide adoption of these services. Beyond transportation this can affect land use and value. The increases
in accessibility for currently more remote areas can increase their commercial attractiveness and even
foster urban sprawling to a certain degree.
Another example is the modelling of soft modes which have a considerable share of the HMA
modal distribution (measured in trips, not pkm). Walking and biking were considered in both discrete
choice models developed and some insights were obtained. The bicycle utility function coefficients
indicate that the absence of dedicated cycling lanes hinders the adoption of this alternative. The space
freed by the release of on-street parking and decreased congestion could be employed to this end.
Nonetheless, in the simulation there is no dynamic analysis to the effects shared mobility might have on
the soft modes.
Other policy issues raised in connection with the studied changes to mobility include the
modifications introduced to parking and road use. Significant decreases in parking spots open these
spaces to new uses, but it will also imply a loss of revenues. While parking requirements will drop, curb
use and spots for short term pick-up and drop-off will be in higher demand. This will require changes to

88 – CONCLUSIONS
SHARED MOBILITY SIMULATIONS FOR HELSINKI — © OECD/ITF 2017
the infrastructure but also to parking policies or more broadly to public surface use. A more dynamic and
flexible mobility offer will have to be accompanied by equally flexible public space policies. Sharp
decreases in congestion might also open road lanes to different use, from the already mentioned bicycle
paths to lanes dedicated to autonomous vehicles.
Finally there are a host of issues related with the organising and business models of the new
services. The required level of funding and unprecedented scale of deployment of these services points to
a collaborative effort that can involve other PT operators, ride services and taxis, vehicle manufactures
and other institutions. Apart from that, several concerns need to be balanced, for instance: service costs
and price for the end user, innovation in service provision and regulation required to avoid unintended
societal consequences (e.g. increases in congestion). All of these can have far reaching consequences in
questions such as the number and quality of employment provided. In the end a complete toolbox
including economic, infrastructure, regulatory and procurement tools is required to manage the transition
to digital age mobility services.

REFERENCES – 89
SHARED MOBILITY SIMULATIONS FOR HELSINKI — © OECD/ITF 2017
References
Balcombe, R. (2004), The demand for public transport : A practical guide, TRL Limited, Crowthorne.
Beirao, G. and J.A.S. Cabral (2007), "Understanding attitudes towards public transport and private car: A
qualitative study", Transport Policy, Vol. 14/6, pp. 478–489. https://doi.org/DOI
10.1016/j.tranpol.2007.04.009
Campbell, P. (2017), "Transport policy will give cities power over automakers".
https://www.ft.com/content/eb6cc7a0-5826-11e7-80b6-9bfa4c1f83d2 (accessed 15 September
2017).
Heinen, E., B. van Wee, and K. Maat (2010), "Commuting by Bicycle: An Overview of the Literature",
Transport Reviews, Vol. 30/1, pp. 59–96. https://doi.org/10.1080/01441640903187001
HSL (2016a), Kutsuplus – Final Report, Helsinki.
https://www.hsl.fi/sites/default/files/uploads/8_2016_kutsuplus_finalreport_english.pdf
HSL (2016b), Study on Road Pricing, Helsinki.
https://www.hsl.fi/sites/default/files/uploads/ajoneuvoliikenteen_hinnoitteluselvitys_2016_en.pdf
ITF, (2017), "Transition to Shared Mobility: How large cities can deliver inclusive transport services",
International Transport Forum Policy Papers, No. 33, OECD Publishing, Paris.
http://dx.doi.org/10.1787/b1d47e43-en
ITF (2016), "Shared Mobility: Innovation for Liveable Cities". International Transport Forum Policy
Papers, No. 21, OECD Publishing, Paris.
http://dx.doi.org/10.1787/5jlwvz8bd4mx-en
ITF (2015), "Urban Mobility System Upgrade: How shared self-driving cars could change city traffic",
International Transport Forum Policy Papers, No. 6, OECD Publishing, Paris.
http://dx.doi.org/10.1787/5jlwvzdk29g5-en
Litman, T. (2008), "Valuing transit service quality improvements", Journal of Public Transportation,
Vol. 11/2, pp. 43–64. https://doi.org/http://dx.doi.org/10.5038/2375-0901.11.2.3
Rayle, L., D. Dai, N. Chan, R. Cervero and S. Shaheen (2016), "Just a better taxi? A survey-based
comparison of taxis, transit, and ridesourcing services in San Francisco", Transport Policy, Vol. 45,
pp. 168–178. https://doi.org/10.1016/j.tranpol.2015.10.004
Schaller, B. (2017), Unsustainable? The Growth of App-based Ride Services and Traffic, Travel, and the
Future of New York City. Schaller Consulting, Brooklyn, NY.
Statistics Finland (2016),
http://pxnet2.stat.fi/PXWeb/pxweb/fi/StatFin/StatFin__lii__mkan/statfin_mkan_pxt_002_fi.px/?rx
id=050fed7f-510a-4b4f-801b-16fc823c3e2b

90 – REFERENCES
SHARED MOBILITY SIMULATIONS FOR HELSINKI — © OECD/ITF 2017
van Wee, B. and K. Geurs (2011), "Discussing equity and social exclusion in accessibility evaluations",
European Journal of Transport and Infrastructure Research, Vol. 11/4, pp. 350–367.
www.ejtir.tbm.tudelft.nl

ANNEX 1. DEPOTS AND TAXI-BUS STOPS – 91
SHARED MOBILITY SIMULATIONS FOR HELSINKI — © OECD/ITF 2017
Annex 1. Depots and Taxi-Bus stops
Figure 46. Taxi-Bus stops and shared mobility vehicles depots
In addition to the existing network of infrastructure and services (see the section Characterisation of
the case study) there is a total of 1 187 Taxi-Bus stops and 131 depots for the shared mobility vehicle
fleet. They are available in all scenarios tested (but not necessarily employed). For scenario 4 there are
also 12 park and ride locations.
The Taxi-Bus stops are located in nodes of the road network close to pre-existing bus stops and are
within 400 m of each other (as much as possible). In some of the outer areas of HMA they are further
apart (north of Espoo or further east Helsinki) since the road network used in the model is rather sparse
for those zones. There are also 131 Shared Taxi and Taxi-Bus depots where the fleet of vehicles is based.
The vehicles leave those depots once their service starts and return once they have no more service. The
depots location was optimised to minimise the vehicles’ total travel distance, while restricting their
number to a reasonable value. In the city core these depots were located in existing parking facilities.

92 – ANNEX 2. EXAMPLE OF A STATE PREFERENCE SURVEY QUESTION
SHARED MOBILITY SIMULATIONS FOR HELSINKI — © OECD/ITF 2017
Annex 2. Example of a stated preference survey question
Figure 47. Stated preference experiment example

ANNEX 3. BASELINE CONGESTION – 93
SHARED MOBILITY SIMULATIONS FOR HELSINKI — © OECD/ITF 2017
Annex 3. Baseline congestion
Figure 48. Baseline congestion for evening peak
Volume Capacity Ratio

94 – ANNEX 4. EFFECTIVE ACCESS
SHARED MOBILITY SIMULATIONS FOR HELSINKI — © OECD/ITF 2017
Annex 4. Effective access
Figure 49. Attraction decay curve
In order to calculate the effective accessibility to employment, the number of jobs in each
destination cell is multiplied by the attraction value provided by the “attraction decay curve”, given the
travel times between the origin and the destination cells. For instance, if from the origin cell a destination
cell is reached in 40 minutes, then the number of jobs existing in the destination cell is multiplied by 0.2
(which is the attraction value in the curve for a 40-minute travel distance). This enables the calculation of
accessibility levels along a continuum of perception instead of introducing sharp cut-off values.
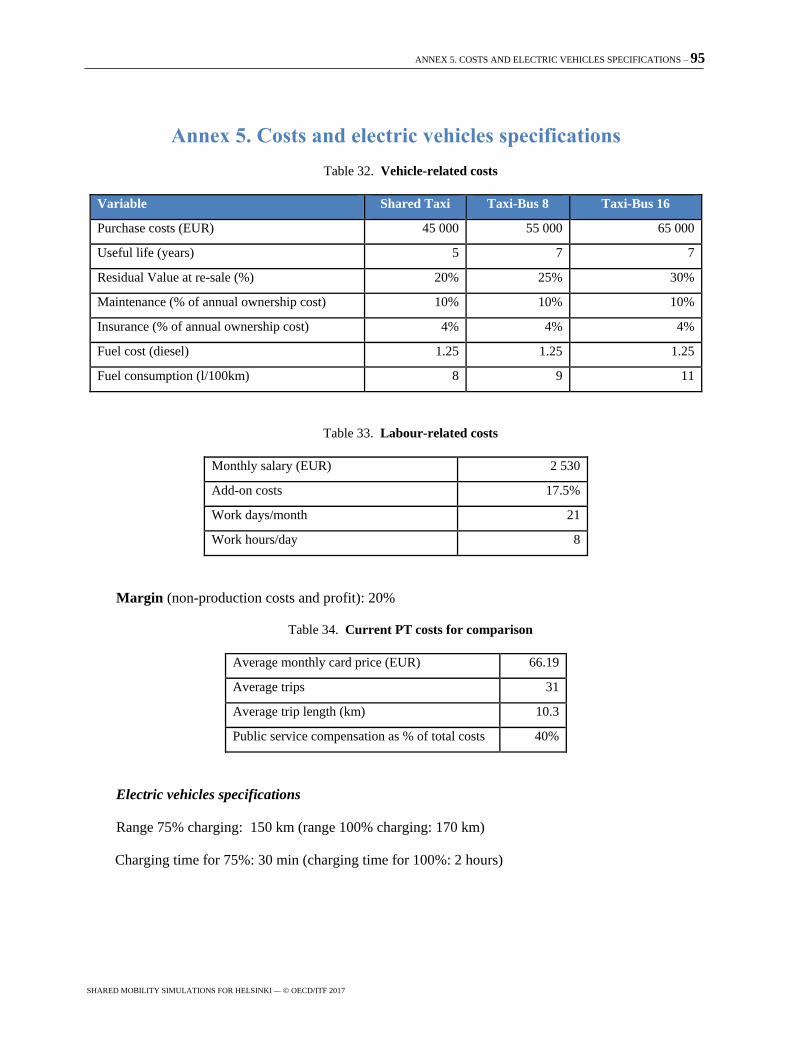
ANNEX 5. COSTS AND ELECTRIC VEHICLES SPECIFICATIONS – 95
SHARED MOBILITY SIMULATIONS FOR HELSINKI — © OECD/ITF 2017
Annex 5. Costs and electric vehicles specifications
Table 32. Vehicle-related costs
Variable Shared Taxi Taxi-Bus 8 Taxi-Bus 16
Purchase costs (EUR) 45 000 55 000 65 000
Useful life (years) 5 7 7
Residual Value at re-sale (%) 20% 25% 30%
Maintenance (% of annual ownership cost) 10% 10% 10%
Insurance (% of annual ownership cost) 4% 4% 4%
Fuel cost (diesel) 1.25 1.25 1.25
Fuel consumption (l/100km) 8 9 11
Table 33. Labour-related costs
Monthly salary (EUR) 2 530
Add-on costs 17.5%
Work days/month 21
Work hours/day 8
Margin (non-production costs and profit): 20%
Table 34. Current PT costs for comparison
Average monthly card price (EUR) 66.19
Average trips 31
Average trip length (km) 10.3
Public service compensation as % of total costs 40%
Electric vehicles specifications
Range 75% charging: 150 km (range 100% charging: 170 km)
Charging time for 75%: 30 min (charging time for 100%: 2 hours)

2017
-10/
Phot
o cr
edit:
ITF
Shared Mobility Simulations for Helsinki
This report examines how the optimised use of new on-demand shared transport modes could change the future of mobility in the Helsinki Metropolitan Area in Finland. Based on simulation, it provides indicators for the impact of shared mobility solutions on accessibility, metro/rail ridership, required parking space, congestion and CO2 emissions. The model also analyses service quality, efficiency and cost competitiveness of the shared solutions. In addition, the report explores the willingness among the citizens of the Helsinki region to adopt shared mobility solutions based on focus group analysis. The findings provide an evidence base for decision makers to weigh opportunities and challenges created by new forms of shared transport services. The work is part of a series of studies on shared mobility in different urban and metropolitan contexts. This report is part of the International Transport Forum’s Case-Specific Policy Analysis series. These are topical studies on specific issues carried out by the ITF in agreement with local institutions.
International Transport Forum 2 rue André Pascal F-75775 Paris Cedex 16 T +33 (0)1 45 24 97 10 F +33 (0)1 45 24 13 22 Email: [email protected] Web: www.itf-oecd.org