shareholders at the gate? cross-country evidence on the ... · cross-country evidence on the role...
TRANSCRIPT

Shareholders at the Gate?Cross-Country Evidence on the Role of Institutional
Investors in Mergers and Acquisitions∗
Miguel A. Ferreira†
ISCTE Business SchoolMassimo Massa‡
INSEAD
Pedro Matos§
University of Southern California
This Version: September 2007
ABSTRACT
We study how institutional investors affect the volume and pattern of mergers andacquisitions (M&A) around the world. Using a comprehensive data set of equity hold-ings from 26 countries in the 2000-2005 period, we find that institutional ownership,especially by foreign institutions, is positively associated with M&A activity worldwide.Foreign institutional ownership (unlike domestic institutional ownership) is positivelyassociated with the probability of a deal being cross-border, its success, and the prob-ability that the bidder takes full control of the target. Furthermore, abnormal returnsaround announcements are higher when institutions are present as shareholders in boththe target and acquirer firms. Our results suggest that foreign institutional investorsbuild “bridges” between firms internationally and act as facilitators in the internationalmarket for corporate control.
∗We thank Martinj Cremers, Todd Gormley, John Griffin, Andrew Karolyi, Florencio Lopez-de-Silanes,Marina Martynova, Enrico Perrotti, Jose-Luis Peydro, Michael Schill; participants at the Third McGill Con-ference on Global Asset Management Conference, the Korean Development Institute Conference on “MarketFor Corporate Control: Comparative Perspectives”, the 2007 European Finance Association meetings; andseminar participants at the Barclays Global Investors, European Central Bank, University of Amsterdam,University of Cologne, and University of Southern California for helpful comments. This research is sup-ported by a research grant from the Fundação para a Ciência e Tecnologia (FCT/POCI 2010). A previousversion of this paper was titled “What is the Role of Institutional Investors in Mergers and Acquisitions?Cross-Country Evidence”.
†Email: [email protected]‡Email: [email protected]§Email: [email protected]

Mergers and acquisitions (M&A) are an important mechanism to reallocate corporate
control. The last few years have been characterized by an M&A boom in which, for the first
time in recent history, almost half of the deals are cross-border transactions (The Economist
(2007)). The record level at which corporate control is being transferred across borders has
been hailed as evidence that financial markets today are truly global.
The literature has related the intensity, pattern and premiums of M&A around the world
to differences in legal and regulatory environments, economic development, and cultural
and geographical barriers (Rossi and Volpin (2004) and Bris and Cabolis (2007)). However,
one potential (and hitherto unexplored) explanation for the flurry of activity in M&A is
the increase in institutional ownership of corporations worldwide. Institutions have become
major players in world markets with total assets under management exceeding US$45 trillion
(including over US$20 trillion in equities, according to the International Monetary Fund
(2005) (IMF)).
In this paper, we explore whether institutional investors, as shareholders of corporations
worldwide, affect the frequency at which corporations change hands via M&A deals. In-
stitutional investors can be particularly influential in determining the outcome of control
contests.1 Evidence of this is the fact that target and bidder firm managers frequently en-
gage in substantial investor relation activities with professional money managers to influence
their merger voting or share tendering decisions. Because of lack of data, however, the role of
institutional investors in the global market for corporate control has been largely unexplored
by academic research.
In cross-border mergers, foreign institutions can act as key players. Unlike domestic
investors, foreigners have less business ties to target firms and can be less friendly to in-
cumbent management. Foreign-based money managers, focused on maximizing returns, are
1In the ABN AMRO takeover contest currently underway, TCIF, a U.K. activist hedge fund with a 1%stake is credited to have put the firm into merger talks with Barclays (U.K.) following ABN AMRO’s poorstock performance. However, many of Barclays’ top shareholders are opposed to bank increasing its bid inreaction to a competing offer from Royal Bank of Scotland and share price went up 3% on news that Atticus,an activist hedge fund, was pressuring it to abandon its bid (Financial Times (2007))
1

more likely to resist “economic patriotism”. For example, in the largest takeover battle
to date — the hostile bid by Vodafone (a U.K. company) for Mannesmann in 1999 — the
eventual success of Vodafone’s offer was attributed to the fact that Mannesmann had the
most international ownership structure of any German firm with over 60% of shares held by
foreigners.2 Resistance to the takeover in the German press was driven by the outcry over
control being taken away from German hands.3
We compare two hypotheses on the role played by institutional investors on the market
for corporate control. Our base hypothesis is that this particular class of investors acts
as a facilitator of international M&A deals. Institutional investors have a more “arms-
length” relationship with the firm and effectively behave as blockholders. This helps reduce
the bargaining and transaction costs associated with takeover bids. Among institutional
investors, foreign institutions are the ones more likely to be interested in pure value creation
as opposed to give in to local interests. Therefore, the presence of foreign institutions can
offer room for more cross-border deals to take place, by making the highest bidder prevail
over the domestic ones. By facilitating the working of the market for corporate control,
institutional investors play a governance role. Thus, shareholder activism and the market
for corporate control interact in a complementary way.
The alternative hypothesis posits that the presence of institutional shareholders and
the market for corporate control substitute for one another. Institutional investors have
been shown to play a critical role in corporate governance. Across countries, institutions
like CalPERS in the U.S. or Hermes in the U.K. have been pioneers in investor activism,
using the proxy process and other approaches to pressure corporate managers for change
(Becht, Franks, Mayer, and Rossi (2007), and Gillan and Starks (2007)). If institutions are
2Hopner and Jackson (2004) report that all Mannesmann shareholders holding stakes greater than 0.1%at the time of the takeover were institutional investors (with exception of Hutchinson Whampoa, a HongKong conglomerate). U.K. and U.S. institutional investors had 40%, while German-based ones had only13%.
3“Economic patriotism” is not the monopoly of any one nation as illustrated by resistance in the U.S. tothe bid for Unocal by a Chinese acquirer or the portrayal of Spanish banks as “new conquistadores” in theEnglish press.
2

a powerful monitoring mechanism their presence can reduce the need for the market for
corporate control. We should therefore observe less M&A transactions in the presence of a
large institutional shareholder base.
To explore these issues, we employ a comprehensive data set of institutional equity hold-
ings. This data set contains holdings at the investor-stock level by over 5,300 institutions from
26 countries, with positions totaling US$18 trillion as of December 2005. Our institutional
ownership data represents, on average, over 40% of the world stock market capitalization
in the 2000-2005 period. Institutional ownership is the highest in the U.S., but professional
money managers from other countries also control sizeable pools of assets.4
We first investigate the role played by institutional ownership in M&A activity at the
country-level using a sample of 3,329 completed transactions from 26 countries in the 2000-
2005 period. We find that the volume of M&A activity is significantly larger in countries
where institutional ownership is higher. This effect is stronger for foreign institutional own-
ership. A ten percentage point increase in total and foreign institutional ownership is asso-
ciated with an increase in the takeover frequency of publicly listed firms targeted of roughly
three percentage points. These results hold even after controlling for the other determinants
of M&A activity such as legal and regulatory environments, economic development, and cul-
tural and geographical barriers. The results are also robust when we control for the potential
endogeneity of institutional ownership.
We then examine the relation between the volume of cross-border merger transactions
and institutional ownership.5 We find that the fraction of cross-border deals increases with
the presence of foreign institutions in the country of the target firm. Even after we control
for legal environment and economic indicators, we find that foreign institutional ownership
increases the probability of being taken over by a foreign bidder. That is, foreign institutions
4These institutional investors could be a U.S.-based mutual fund manager (like Fidelity) but also adomestic bank trust or insurance company (like BNP Paribas and AXA in France), or a global non-U.S.-based pension fund (like Norway’s State Petroleum Fund).
5In our sample, cross-border deals are one-fourth of total transaction value, but over 41% of all dealsinvolving non-U.S. target firms.
3

are particularly influential in facilitating deals in which ownership is transferred to foreign
hands.
To analyze the effect of foreign institutional ownership further, we devise tests that
directly focus on the M&A deal volume between pairs of countries. This allows us to control
for the characteristics of both target and acquirer firms’ countries. We find that the frequency
of cross-border deals (i.e., involving a target firm located in a country different from that
of the acquirer) increases with the ownership by institutions from the acquirer country in
the target country. This suggests that institutions holding cross-border positions in both
the acquirer and the target facilitate deals, effectively building “bridges” between firms
internationally. For example, in the Vodafone-Mannesmann deal, a large fraction of the
foreign investors were U.K.-based institutions.
In the second part of the paper, we examine individual M&A deals, directly focusing
on the target and bidder firms’ institutional ownership (one-quarter) prior to the M&A
announcement date. In these firm-level tests, we can better account for the potential endo-
geneity of institutional ownership by using firm-specific characteristics as instruments. We
use variables that potentially drive institutional ownership but are not necessarily associated
with M&A activity.
First, we study the relation between the probability of a cross-border deal taking place
and institutional ownership. In line with the country-level tests, the firm-level tests indicate
that higher institutional ownership in the target firm (as well as in the acquirer firm) is
positively associated with the likelihood of the bid being cross-border. When we break down
the fraction of shares held by domestic and foreign institutions, we find that a ten percentage
point increase in foreign institutional ownership is associated with an increase in the likeli-
hood of the deal being cross-border of roughly twenty five percentage points. In contrast,
domestic institutional ownership does not have a similar impact. These results hold when
we control for the potential endogeneity of institutional ownership. This evidence is again
supportive of institutional shareholders building “bridges” between firms internationally.
4

Next, we focus on the probability of success of a cross-border deal. We find that foreign
institutional ownership increases the probability of success of the deal, while domestic own-
ership does not (even reduces it in some cases). Moreover, foreign ownership is positively
associated with the probability that the deal is an offer for “full control”, i.e. the bidder
takes over all the shares of the target firm, thereby most likely changing the nationality of
that firm.
Finally, we explore the incentives of common institutional shareholders. We focus directly
on institutions providing “bridges” between event firms by having a stake both in the bidder
and in the target and we study whether they are able to earn higher returns from the deals
than the rest of the market.
We find that the average cumulative abnormal return earned by common institutional
shareholders to the target and acquirer firms is higher than the combined return (all share-
holders) in cross-border mergers (2.6% versus 1.8%). No similar pattern is found in intra-
border deals. This suggests that common shareholders are able to earn better returns as
a remuneration for the “bridge-building” activity. Given that common investors may over-
weight the target firm, a higher return to common shareholders does not necessarily imply
higher combined returns for the acquirer firm. This finding is in line with recent U.S. evi-
dence in Matvos and Ostrovsky (2006) and Harford, Jenter, and Li (2007) on the importance
of taking into account cross-ownership by institutional investors.
While our paper offers new insights on the role of institutional investors in the M&A
context, the growth in institutional ownership around the world has not gone unnoticed by
the academic literature. Gillan and Starks (2007) and Ferreira and Matos (2007) highlight
the role of foreign institutional investors and argue that they can play a special governance
role in corporations worldwide. There is also a body of literature that examines the role
of institutions in M&A events for the U.S. market. Stulz, Walkling, and Song (1990) and
Ambrose andMegginson (1992)) have examined the impact of overall institutional ownership,
while more recent papers have looked at role played by different types of institutions (e.g.
5
Gaspar, Massa, and Matos (2005)), Chen, Harford, and Li (2006)).
To our knowledge, however, there have been no studies examining cross-country evidence
of the role of institutional investors on cross-country M&A. Previous literature has focused
on country-level governance standards. Rossi and Volpin (2004)) find a more active market
for corporate control in countries with strong investor protection. The authors also find
that in cross-border M&A deals, targets are on average from countries with poorer investor
protection than their acquirers’ countries, suggesting a convergence in governance standards.
Bris and Cabolis (2007) examine cross-border mergers and find a higher takeover premium
if the shareholder protection and accounting standards of the acquirer company’s country
is better than those of the target firm’s country. Our results allow us to contribute to this
literature by showing that governance motives play a second role in the M&A market in
comparison to the institutional cross-country investors.
The remainder of the paper is organized as follows. In the next section we discuss our
main hypothesis. Section II presents the institutional holdings data set and the sample of
M&A events. In section III, we conduct country-level tests of the relation between M&A
activity and institutional ownership. In section IV, we perform firm-level tests on how
institutional ownership impacts the probability of a deal being cross-border, the probability
of success of the deal, and returns for different investors. Section V concludes and discusses
the implications of our work.
I. Main Hypotheses
We argue that institutional investors facilitate the working of the international market for
corporate control by building “bridges” between target and acquirer firms. We consider sev-
eral ways in which investors can build these “bridges” and provide some testable hypotheses.
Institutional investors can reduce the bargaining costs associated with takeover bids by
acting as large blockholders. As suggested by Shleifer and Vishny (1986), blockholders facil-
6

itate takeovers by alleviating the free-rider problem when the target firm’s shareholder base
is dispersed into atomistic shareholders (Grossman and Hart (1980)). Institutional investors
can also reduce the information asymmetry in the market about the firm by decreasing the
uncertainty about the value of the bidder. This improves the possibility of success of a M&A
deal. Finally, institutional investors are more likely to have an “arms-length relationship”
with respect to the firms. This reduces their potential opposition to a value-creating deal.
All these reasons suggest a positive relationship between institutional investors’ ownership
and the volume of M&A deals. This is in line with recent evidence that shareholder ac-
tivism and the market for corporate control interact in a complementary way (Cremers and
Nair (2005)). These considerations lead us to posit that countries with a larger presence
of institutional investors should have a more vibrant market for corporate control. (H.1.
Facilitation Hypothesis”).
On the other hand, institutional investors can improve the governance of firms they invest
in (Bolton and Thadden (1998), Kahn and Winton (1998), and Maug (1998)). Institutional
investors can be “activists” and monitor the companies in which they hold shares. Across
countries, some institutions like CalPERS in the U.S. or Hermes in the U.K. have been
pioneers in investor activism (Becht et al. (2007), and Gillan and Starks (2007)). Given
that the market for corporate control is an alternative governance mechanism, there may be
a substitution effect between institutional ownership and the market for corporate control.
That is, countries with a larger presence of institutional investors should have a less active
market for corporate control (H.2. Monitoring Hypothesis).
Based on these considerations, we lay out the first broad implication of our two alternative
hypotheses:
H.1.a (Facilitation Hypothesis): Countries with higher institutional ownership are asso-
ciated with a higher frequency of M&A deals.
H.2.a (Monitoring Hypothesis): Countries with higher institutional ownership are asso-
ciated with a lower frequency of M&A deals.
7
We now turn to the core of our analysis: international M&A deals. Transaction costs
are higher for cross-border deals as these transactions involve negotiations or a tender offer
process between parties in different regulatory and corporate culture environments. Foreign
institutional investors are better able to “handle” these costs. Indeed, by their own nature,
foreign institutions can provide a fair valuation of the firm, piercing through higher infor-
mation asymmetry. They are also less anchored to “cultural-specific” values, less prone to
target incumbent management efforts to block M&A deals and better able to resist “eco-
nomic patriotism”. In contrast, domestic institutions may be more “entrenched” and prefer
that the nationality of target firm does not change or may simply be less willing to take
foreign stock as a means of payment. In this context, the Facilitation Hypothesis predicts
that the presence of foreign institutional investors increases the probability of success of the
deal and the ability to take full control (and effectively change the nationality) of the target
company.
The Monitoring Hypothesis, has a different view of the impact of foreign institutional
investors on cross-border M&A deals. Aggarwal, Erel, Stulz, andWilliamson (2006) find that
value of non-U.S. firms is positively related to the gap between their governance and that of
U.S. matching firms. If foreign institutional investors act as carriers of better governance, the
existence of foreign institutional investors, reducing the governance gap between countries,
would also decrease the improvement in the value of a firm being taken over by a foreign firm.
Given that less of governance improvements are needed, the presence of foreign institutional
investors can reduce the probability of a cross-border deals as well as the probability of
success. Also, the incentive to take over 100% of the target firm and change its nationality
should be lower in the presence of good governance.
Based on these arguments, we put down the main testable predictions of the two alter-
native hypotheses that will be the main focus of the paper.
H.1.b (Facilitation Hypothesis): A larger presence of foreign institutional investors is
associated with a higher likelihood of being targeted in a cross-border M&A deal, a higher
8

likelihood of the deal being successful, and a higher likelihood that full control is being acquired
in the deal.
H.2.b (Monitoring Hypothesis): A larger presence of foreign institutional investors is
associated with a lower likelihood of being targeted in cross-border M&A deals, a lower like-
lihood of the deal being successful, and a higher likelihood that full control is being acquired
in the deal.
Finally, we focus on the incentives for institutional investors that act as facilitators of
cross-border M&A deals and ask whether institutions make good returns around these trans-
actions. Given that facilitation is higher when there is common ownership, we focus on com-
mon shareholders (cross-owners) of both target and acquirer stock. Following Matvos and
Ostrovsky (2006) and Harford et al. (2007), we directly focus on the institutional investors’
returns for the combined holdings in the two event firms. These returns capture the gains
accruing to the common shareholders and proxy for the benefits accruing to them for their
bridge-building role.6
All these hypotheses, of course, are laid out against the null hypothesis that institutional
ownership does not impact M&A activity.
II. Data
Our sample includes all firms in the Datastream/WorldScope database for the period from
2000 to 2005. The first two columns of Table I present the number and market capitalization
of firms from each country, totaling 32,716 firms with aggregate market capitalization of
over US$32 trillion (sample period average). We draw the data for our study from several
sources. The institutional ownership data are drawn from the FactSet/LionShares database.
6Because their relative weighting on the target and acquirer firms may not coincide with both firms’market capitalizations (for example, common investors may overweight the target firm), higher returnsgoing to common shareholders do not necessarily mean higher combined returns for target plus acquirershareholders of the same amount. In fact, there can be instances where M&A deal synergies are non-existentbut common investors still gain from the M&A deal if profits on their target firm holdings exceed any losseson the acquirer shares they hold.
9

The mergers and acquisitions data are drawn from the Securities Data Corporation (SDC)
Platinum database. The firm-level control variables are from the Datastream/WorldScope
database.
A. Institutional Investors Holdings Data
The institutional investor holdings data are drawn from the FactSet/LionShares database,
a leading information source for global institutional ownership. FactSet/LionShares data
sources are public filings by investors (such as 13-F filings with the S.E.C. in the U.S.),
company annual reports, and regulatory agencies around the world. Institutions are defined
as professional money managers: mutual fund companies, pension funds, bank trusts, and
insurance companies.7 A more detailed description of this data set can be found in Ferreira
and Matos (2007).
We use the historical filings of the FactSet/LionShares database from January 2000 to
December 2005. We consider all types of stock holdings (ordinary shares, preferred shares,
ADR, GDR, and dual listings). In the case of unequal report frequency by institutions
from different countries, we consider the latest holdings update at each year-end. The data
comprises institutions located in 26 different countries (K) and stock holdings from 48 des-
tination countries stock markets (J).8 This data set offers a unique worldwide K × J panel
data (when aggregated at the country-level) for each year-end over the 2000-2005 period.
FactSet/LionShares contains holdings data by over 5,000 institutions on over 35,000 stocks
worldwide for a total market value of US$ 18 trillion as of December 2005.
Column (3) of Table I reports the fraction of each country’s stock market capitalization7U.S.-based institutions are by far the largest group of professional managers of equity assets. Some of
the leading institutions in December 2005 are fund families (Barclays Global Investors, Capital Researchand Management, and Vanguard in the U.S.). However, others are divisions of banks (Dresdner Bank InvMgt in Germany, Credit Agricole in France, UBS in Switzerland), insurance companies (AXA in France)or pension funds (Canada Pension Plan in Canada and State Petroleum Fund managed by Norges Bank inNorway). The list of top 5 institutions per country can be found in Ferreira and Matos (2007).
8For a group of 21 “other countries” (ex: Argentina, Brazil, China, and Czech Republic) Lion-Shares/FactSet does not have institutional holdings coverage but contains stock holdings from foreign insti-tutions on local stocks. We keep these foreign stock positions in our tests, but show robustness of the resultsof the paper if we include also these countries.
10

that is held by institutions (averages over the 2000-2005 period). The presence of insti-
tutional investors is the highest in the U.S., with over 73% of U.S. market value in the
hands of institutional money managers. But global institutional portfolio managers hold
large fractions of stock market capitalization in countries such as Canada (38%) or Sweden
(30%).9 Overall, institutional ownership represents over 40% of the total world stock market
capitalization over our sample period.
Columns (4) and (5) of Table I present the fraction held by domestic and foreign institu-
tions per country. In many countries, holdings by foreign institutional investors exceed those
of local money managers. The extreme case is Finland, where the market is dominated by
a very large cap, Nokia, which attracts a lot of foreign institutions. In contrast, domestic
institutions are prevalent in the U.S., Canada and Sweden.
The institutional ownership variables we use in the remainder of the paper are:
• Total Institutional Ownership is the sum of the holdings of all institutions in a firm’s
stock at the end of each calendar year divided by the end-of-year market capitalization.
• Foreign Institutional Ownership is the fraction of shares held by institutions domiciledin a country different from the one where the stock is issued.
• Domestic Institutional Ownership is the percentage of shares held by all institutionsdomiciled in the same country in which the stock is issued.
Table II presents average institutional holdings in the 2000-2005 period in matrix form
to summarize the stock holdings by destination stock market country (in rows) and country
of origin of the institution (in columns). U.S. institutional holdings concentrate the largest
pool of assets, but if we focus on non-U.S. destination stock markets, we find that domestic
and non-U.S. foreign institutions matter.
9It is important to note that not all shares issued by corporations can be held by institutions, as asignificant fraction is closely-held by large shareholders in some countries. Correcting for the aggregatepercentage of closely-held shares (available from WorldScope), institutional ownership as a percentage ofmarket float is high in countries like Canada (48%) or Sweden (44%).
11

B. Mergers and Acquisitions Data
Our sample contains mergers and acquisition announced between January 2000 and Decem-
ber 2005, drawn from the Securities Data Corporation (SDC) Platinum database. We select
only acquisitions where both target and acquirer firms are publicly listed. Following Rossi
and Volpin (2004), we select M&A deals that meet the following criteria: (1) the transaction
is for a majority of shares of the target firm (percentage sought after the deal is above 50%);
and (2) the deal is completed by the end of our sample period (December 2005). Also, as in
Bris and Cabolis (2007), we exclude leverage buyouts, spin-offs, recapitalizations, self-tender
offers, exchange offers, repurchases, minority stake purchases, and privatizations.
Columns (6) to (12) of Table I show the level of M&A activity by country of nationality
of the target firm. The total sample contains 3,329 M&A deals with target firms from
26 countries for which we have institutional ownership data. Aggregate volume of M&A
transactions adds up to US$3.6 trillion. Target firms from 21 other countries (e.g., Argentina,
Brazil, and China) for which we have no data on domestic institutional investor holdings are
grouped into the “other countries” category.
Following Rossi and Volpin (2004), we define the M&A volume per country as the per-
centage of the publicly traded firms that are targets in successful mergers and acquisitions
over the 2000-2005 sample period. Column (7) of Table I presents summary statistics broken
down by country. M&A volume is the highest in Canada (with 24% firms targeted during
our sample period) and the lowest in Hong Kong (2%). We also use an alternative measure
of M&A volume defined as the value of completed deals over market capitalization (column
(9)).
Our sample of mergers is geographically fairly diversified. We define the cross-border
ratio as the percentage of completed deals in a country in which the acquirer is from a
country different than the target. Cross-border ratios per target country are presented in
column (11) of Table I. Firms from Japan and the U.S. are among the least targeted by
foreign acquirers with cross-border ratios of 0.9% and 13%. The last row of Table I shows
12

that 683 deals are cross-border, around 21% of the overall number of completed deals in 26
sample countries. Column (13) shows that this represents close to 24% of M&A value. If one
excludes U.S. target firms, then about 28% in terms of number of deals and 42% in terms
of value of transactions are cross-border deals. Table III presents the number of completed
deals for each pair of target firm country (in row) and acquirer firm country (in column).
III. Determinants of Country-Level M&A Activity
This section studies the impact of institutional ownership on M&A activity at the country-
level using three main tests. First, we test whether institutional ownership affects the overall
volume of M&A activity. Second, we examine whether a larger presence of foreign institu-
tional investors is associated with a higher likelihood of takeovers by foreign acquirers. Third,
as an additional country-level testable implication we examine whether cross-border volume
between country pairs is higher if investors from the acquirer firm country also hold shares
of target country firms (“cross-ownership”).
A. M&A Volume
We start by testing whether the level of institutional ownership affects the country-level
volume of M&A activity. Following Rossi and Volpin (2004), we estimate the regression
equation:
(M&A Volume)i = α+ β(Institutional Ownership)i + δXi + εi, (1)
where the dependent variable is the percentage of listed firms from country i that are targeted
in completed M&A. Institutional ownership is defined as the fraction of total stock market
capitalization held by institutions. We also break down total institutional ownership into
domestic and foreign institutional ownership.
We include several control variables (X). First, following the law and finance literature,
13

we expect stronger laws and regulations to be a major determinant of the overall level of
domestic capital markets development (La Porta, Lopez-de-Silanes, Shleifer, and Vishny
(1998)). Thus, we include a common law origin dummy variable and the anti-director rights
index as indicators of the level of minority shareholder protection, and the quality of account-
ing standards. Second, we control for the level of economic development. Specifically, we
include GDP per capita and GDP average annual real growth rate as explanatory variables.
Third, because the M&A market may be linked to valuation waves (Shleifer and Vishny
(2003)) we control for the local stock market annual return. Finally, we also include the
degree of ownership concentration (Shleifer and Vishny (1986) and Rossi and Volpin (2004))
as well as a survey-based measure of product market competition to proxy for the availability
of target firms in a given country. Appendix A presents the variable definitions and data
sources.
The results of estimating regression equation (1) are reported in Table IV. Panel A
presents panel data regression estimates including year dummies. Column (1) shows that
institutional ownership is positively associated with the country-level volume of M&A.
Columns (2)-(6) include different sets of controls variables. We find that the total institu-
tional ownership coefficient is positive and significant, which is evidence that the frequency
of M&A is higher in countries in which institutions hold a bigger proportion of the stock
market.
Panel B presents cross-sectional regressions as in Rossi and Volpin (2004) where the
dependent variable is sum of M&A volume per country over the 2000-2005 period, while ex-
planatory variables are time series averages over the sample period. This estimation method-
ology addresses the potential serial correlation concerns of the panel regression estimates.
Consistent with our panel regression estimates, we find that the total institutional owner-
ship coefficient is positive and significant. This finding is illustrated in Figure 1, which plots
M&A volume by country versus total institutional ownership for our sample of 26 countries.
Overall, this evidence is consistent with the Facilitation Hypothesis (H.1.a): countries
14
with a larger presence of institutional investors should have a more active and liquid markets
for corporate control. The effect is not only statistically significant, but also economically
significant. A ten percentage points increase in total institutional ownership is associated
with an increase in the frequency of firms being targeted of roughly two percentage points.
In columns (7)-(9) we breakdown the analysis using the geographical location of the
money manager: domestic and foreign institutions. We find that both domestic and foreign
institutional ownership are positively associated with the frequency of M&A deals. The
point estimates of the coefficients of foreign and domestic institutional ownership support
the conclusion that foreign institutions seem to have a stronger effect on the market for
corporate control. In the next subsection, we further explore the role of the geography of
institutions in the frequency of cross-border deals.
With respect to the control variables, our panel regression estimates show that the fre-
quency of M&A is in general higher in countries with common law origin and strong investor
protection. The cross-sectional regression estimates of the investor protection variables, how-
ever, are usually statistically insignificant at the 5% level. When we control for institutional
ownership, we find weak evidence that country-level governance as captured by investor pro-
tection is a significant determinant of the volume of M&A. These results differ from Rossi and
Volpin (2004) that, without controlling for institutional ownership, find a role of country-
level governance in explaining the country-level volume of M&A. Furthermore, stock market
return is positively linked to M&A volume, while the degree of product market competition
is negatively related to it. In Section III.D, we will discuss several robustness checks of the
relation between the overall M&A volume and institutional ownership.
B. Cross-Border M&A
In this subsection we focus on M&A involving firms from different countries. We believe
that institutional ownership, and especially foreign ownership, plays a particular important
role in cross-border deals. We test whether institutional ownership increases the probability
15
that firms from a given country are taken over by foreign firms by estimating:
(M&A Cross-Border Ratio)i = α+ β(Institutional Ownership)i + δXi + εi, (2)
where the dependent variable is the cross-border ratio, i.e. the percentage of completed M&A
deals that involve a foreign acquirer over all deals targeting firms of country i. Institutional
ownership is defined as the fraction of total stock market capitalization held by institutions
in the target country. As before, we break down total institutional ownership into domestic
and foreign institutional ownership. The other control variables are defined as in Section 4.1
above. We also include a survey-based measure of the attitude towards cross-border deals
(Openness) as in Rossi and Volpin (2004).
The results of estimating regression equation (2) are reported in Table V. We present
results for panel data regressions in Panel A and cross-sectional regressions in Panel B. Col-
umn (1) shows that institutional ownership is negatively associated with cross-border deals,
although the relation is not significant at the 5% level. Column (2) shows that this negative
relation is driven by domestic institutional ownership. That is, a strong presence of domes-
tic institutions decreases the likelihood of a firm being targeted by a foreign bidder. This
is not the case for foreign institutions. Columns (3)-(9) show strong evidence of a positive
relationship between foreign institutional ownership and the probability of the deal being
cross-border. These findings suggest that foreign institutions, unlike domestic institutions,
act as facilitators of cross-border deals. This is consistent with the Facilitation Hypothesis
(H.1-b): foreign-based institutions build “bridges” between firms of different countries. A
more pictorial view is provided by Figure 2, which plots the ratio of cross-border M&A vol-
ume by country versus foreign institutional holdings for our sample of 26 countries. There
is a clear positive relation between foreign institutional ownership and cross-border M&A
volume.
It is important to notice that when we account for institutional ownership, there is weak
evidence that country-level governance helps to explain the cross-border M&A volume. Un-
16

like Rossi and Volpin (2004), we do not find evidence that the quality of external governance
directly attracts foreign bidders.
C. Cross-Border M&A: Country-Pairs Analysis
To explore further the special role that foreign institutions play in cross-border M&A activity,
we examine whether firms from a country are more likely to target a foreign firm if their
home country institutional investors are already present as shareholders in the foreign firm
country. For example, in the case of the Mannesmann takeover, 40% of Mannesmann shares
were held by U.K. and U.S. investors (Hopner and Jackson (2004)). Do we expect Vodafone
(a U.K. firm) to find it easier to target Mannesmann (a German firm) if its home investors
are already shareholders in that foreign market (Germany)?
To test this hypothesis, we exploit the full power of our country-level data set and combine
the worldwide matrix of (26x26) pairs of cross-country M&A deals (see Table III) with the
corresponding cross-border portfolio investment of institutions (see Table II). The country-
pairs regression equation is
(Cross-border M&A)i,j = α+ β(Institutional Ownership)i,j + δXi,j + εi,j, (3)
where the dependent variable is the number of deals in which the target is from country
i and the acquirer is from country j as a percentage of the total number of deals with
target in country i (sum of row). Institutional Ownershipi,j is the percentage of the market
capitalization of the country of the target firm i that is held by institutions based in the
same country as that of the acquirer firm j.
The Facilitation Hypothesis posits that higher institutional ownership by country j (in-
stitution origin) in country i (destination market) increases cross-border deals between the
two countries, i.e. it is more likely that a firm from country i is targeted by a firm from
country j. Following Rossi and Volpin (2004), we also include other regressors such as the
17

difference in economic development, investor protection, accounting standards, and stock
market annual returns between country j and country i. We also add two dummy variables
to control for proximity and familiarity motives in cross-border deals. These are a dummy
variable that equals one when target and acquirer firm’s country share a common language,
and a dummy variable that equals one when the target and acquirer firm’s country belong
to the same geographical region. We take into account the difference in industry structures
between countries by using the sum of squared differences in stock market weights of one-
digit SIC industries between country i and country j and the degree of economic integration
by using the level of bilateral trade (imports by country i from country j as a percentage of
the total imports by country i).
Table VI presents the results of the country-pairs analysis. We find that the country-
pair institutional ownership coefficient is positive and significant. A one percentage point
increase in institutional ownership between a country-pair is associated with an increase in
the frequency of cross-border deals between a country-pair of roughly 1.3 percentage points.
This evidence supports our hypothesis that cross-border volume between country pairs is
higher if investors from the acquirer firm country already hold shares in firms of the target
firm country.
Specifications in columns (2)-(6) control for other factors that may explain the volume
of M&A activity between two countries. There is some evidence that M&A activity is
enhanced between countries that belong to the same geographical region and that have
similar industrial structures (when the country-pair industry structure variable is low). The
level of economic integration (as proxied by bilateral trade) between the two countries is
positively related to the level of M&A between the two countries, but it is only statistically
significant in the cross-sectional regressions (Panel B). It is important to note that the level
of cross-country institutional ownership is positive and significant in all the specifications.
18

D. Robustness Checks of Country-Level Results
We conduct several robustness checks to the country-level tests presented in Tables 4-6.
A first concern we want to address is the potential endogeneity of institutional ownership.
Indeed, it may be the case that a more active market for corporate control increases in-
stitutional ownership. This would introduce an endogeneity bias in our previous ordinary
least squares estimates. To control for this bias we employ instrumental variables estimation
(2SLS).
We need instruments that are correlated with the level of institutional ownership in a
country but do not directly impact the volume of M&A. We therefore use as instruments
for institutional ownership in country i: (1) the percentage of firms from country i with
shares included in the MSCI World index; (2) the percentage of firms from country i with
shares cross-listed on U.S. exchanges (via ordinary listings or level 2 and 3 ADRs); (3)
stock market trading volume as a percentage of GDP of country i; (4) dividend yield of
country i (value-weighted average across stocks in the country); (5) a dummy variable equal
to one if there are short selling restrictions in country i (Bris, Goetzmann, and Zhu (2007));
and (6) the statutory dividend tax rate of country i. These variables have been shown to
increase firm visibility abroad and to drive foreign institutional holdings (Ferreira and Matos
(2007)). Hansen’s overidentification tests confirm that these variables do not directly impact
the volume of M&A through a channel different from their impact on institutional ownership.
Results of the 2SLS estimation are reported in column (1) of Table VII. They confirm
that our findings are robust to potential endogeneity of institutional ownership. The overall
volume of M&A is positively associated with total institutional ownership, while foreign
institutional ownership play a special role in explaining the incidence of cross-border deals.
As additional robustness check, we also check the sensitivity of our findings to the de-
finition of the sample of countries under examination. Column (2) excludes M&As where
the target firm is from the U.S., while column (3) extends the sample to include 21 other
countries where data coverage is limited to foreign institutional holdings. The results are
19

again consistent with the previously reported ones.
Finally, we conduct some econometric robustness checks. In column (4), we use the
value of M&A deals (as a percentage of market capitalization) as the dependent variable
instead of the number of deals (as a percentage of the number of listed companies). In
column (5), we cluster the standard errors at the country level to correct for within-country
correlation. Finally, in column (6), we estimate a Tobit model that takes into account that
the dependent variable is bounded between zero and one. The results are again consistent
with the previously reported ones.
IV. Firm-level Evidence
In this section we use firm-level data to test our hypotheses. We focus on individual M&A
transactions to explore in more detail whether institutional ownership in the target and ac-
quirer firms is an important factor in the international market for corporate control. For this
purpose, we merge the sample of M&A transactions from SDC with the FactSet/LionShares
database to obtain firm-level institutional ownership. The resulting sample consists of 2,602
events which have target institutional ownership data, and 1,491 events which have both
target and acquirer institutional ownership data. Firm-level accounting and financial vari-
ables are drawn from the Datastream/WorldScope database. Table VIII presents summary
statistics of the firm-level variables. Appendix B offers details on the variable definitions
and data sources.
To investigate our hypotheses, we run several tests. First, we focus on the probability of
a firm being targeted in a cross-border M&A deal and we test how this probability is related
to institutional ownership and foreign institutional ownership, in particular. Next, we see
how institutional ownership facilitates cross-border deals, by increasing the probability of
success of a bid and the probability that the bidder takes full control of the target firm.
Finally, we examine the announcement returns obtained by institutional shareholders.
20

A. Probability of Cross-Border M&A
To study how the probability of an international M&A is affected by the presence of insti-
tutions as shareholders in the target firm we estimate the following probit regression:
Pr ob(Deal is Cross-Border)i = α+ β(Institutional Ownership)i + δXi + εi, (4)
where the dependent variable is a dummy that takes the value of one if the M&A deal is
cross-border, and zero if it is intra-border. We first estimate regression equation (4) using
only target firm explanatory variables. The focus explanatory variable is the percentage of
shares held by institutions in the target firm one-quarter prior to the deal announcement.
We consider both the percentage of shares held by money managers domiciled in the same
country as the target (domestic institutional ownership) and foreign institutions (foreign
institutional ownership).
We control for other characteristics of the target firm that could be correlated with
the probability of being target in a cross-border deal. We include firm size, growth and
investment opportunities (as proxied by book-to-market and annual sales growth), annual
stock returns, profitability (as proxied by return on equity), leverage (proxied by the ratio of
long-term debt to total assets), cash holdings, foreign sales (as a proportion of total sales),
closely held shares (as a proportion of shares outstanding), and governance score (from
Institutional Shareholder Services). Following Kang and Kim (2007), we also control for
the potential level of economic synergies using a dummy variable equal to one if target and
acquire firms share the same one-digit SIC code (intra-industry M&A). The regression also
includes year, country, and industry dummies.
Panel A of Table IX presents the results. Columns (1)-(3) examine the effect of total,
foreign and domestic institutional ownership on the cross-border deal probability. We start
by controlling just for target firm size and intra-industry M&A dummy. This allows us to
maximize the number of events. We find that total institutional ownership is not linked
21

to the likelihood of a firm being targeted by a foreign bidder. If, however, we break down
institutional ownership into its components, we find that the fraction held by foreign investors
positively affects the probability of a cross-border transaction taking place. In contrast, the
presence of domestic investors seems to reduce the chances of a foreign bid, but the coefficient
is only significant at the 10% level. These findings are consistent with the Facilitation
Hypothesis (H.1.b) and confirm the country-level evidence presented in the previous section.
Columns (4)-(7) examine the effect of foreign institutional ownership on the probability of
a cross-border deal controlling for additional firm characteristics. The evidence supports the
finding that the presence of foreign institutions as shareholders of the target firm spurs the
probability of a cross-border deal taking place. The presence of domestic institutions, instead,
seems to drive away foreign bidders, although the negative coefficient is only significant in
some specifications. In terms of control variables, we find that larger firms and firms with
operations abroad (foreign sales) attract more attention of foreign bidders. In general, the
other firm characteristics seem to play little role in affecting the probability of the bid being
cross-border.
The effect of foreign institutional ownership on the cross-border probability is not only
statistically significant, but also economically relevant. If we consider the estimate of the
foreign institutional ownership coefficient in column (4), a ten percentage point increase in
foreign institutional ownership is associated with an increase in the likelihood of the deal
being cross-border of twenty five percentage points.
As we have mentioned before, a major concern with our results is endogeneity. We
address this concern using instrumental variables estimation (2SLS). The instruments are:
(1) a dummy variable that takes the value of one if the firm’s shares are included in the
MSCI World index; (2) a dummy variable that takes the value of one if a firm’s stock is
cross-listed on U.S. exchanges (via ordinary listings or level 2 and 3 ADRs); (3) the share
turnover defined as trading volume (defined as number of shares traded divided by the
number of shares outstanding); (4) the firm’s dividend yield; (5) a dummy variables that
22

equals one if there are short selling restrictions in a firm’s country (Bris et al. (2007)); (6) the
statutory dividend tax rate in a firm’s country; and (7) the number of tax treaties linking
the firm’s country with other countries. Unlike the country-level regressions in Section 4,
we can directly use firm-level characteristics as instruments. The results are presented in
column (8) of Table IX. They confirm the previous findings. The likelihood of a cross-border
deal is positively related to the presence of foreign institutions and negatively related to the
presence of domestic ones.
As of now, we have restricted ourselves to focusing just on the target firm institutional
ownership. We now expand the analysis and consider also the impact of the acquirer firm
institutional ownership. We therefore reestimate regression equation (4) including both
target and acquirer characteristics.
The results are reported in Panel B of Table IX. They show that the presence of foreign
institutional ownership on both target and acquirer firms increases the likelihood of cross-
border deal, consistent with hypothesis that these investors make “bridges” between firms
internationally. There is no similar evidence for total or domestic institutional ownership.
Furthermore, domestic institutional ownership, especially in the acquirer firm, seems to
decrease the likelihood of a cross-border deal.
Consistent with the evidence in Panel A, we also find that other firm characteristics have
little explanatory power for the likelihood of a cross-border deal taking place. A notable
exception is firm size as there is some evidence that a cross-border deal is more likely to
take place when the target firm is smaller and the acquirer firm is larger. The instrumental
variables estimation in column (8) is also consistent with a positive relation between the
likelihood of a cross-border deal and target and acquirer firm institutional ownership.10
10We use the same set of instruments used in Panel A but include both target and acquirer firm instruments.
23

B. Success of Cross-Border M&A
We now move on to test whether foreign institutions make it more likely that a cross-
border deal is completed (H.1.b). To test whether foreign institutions facilitate the successful
completion of the deal we estimate the following probit regression:
Pr ob(Deal is Completed)i = α+ β(Institutional Ownership)i + δXi + εi, (5)
where the dependent variable is a dummy that takes the value of one if the M&A cross-
border deal is completed, and zero otherwise. We focus on cross-border deals in which
foreign institutions have a special role as facilitators. The main explanatory variable is
the percentage of shares held by institutions in the target and acquirer firm prior (one-
quarter) to the deal announcement. We consider both the percentage of shares held by
money managers domiciled in the same country as the target and acquirer firms (domestic
institutional ownership) and the percentage of shares held by money managers domiciled in
different countries (foreign institutional ownership). The control variables are the same ones
used in regression equation (4). The regression also includes year, country, and industry
dummies.
Columns (1)-(3) of Table X present the results. In column (1), we focus on total institu-
tional ownership. Total institutional ownership is insignificantly related to the probability
of success of the deal. In columns (2) and (3), we consider foreign and domestic institutional
ownership separately. Here, the geography of institutions matters. The holdings by foreign
institutional investors in both the target and acquirer firm are positively associated with the
probability of a cross-border deal being completed. This provides further support for the
Facilitation Hypothesis (H.1.b). In contrast, domestic institutional ownership, especially in
the target, seems to decrease the likelihood of the deal being completed. With respect to the
other variables, the probability of success is positively related with the size of the acquirer
firm, but negatively related with the size of the target firm.
24

A second test examines whether the decision of the bidder to take full control in a cross-
border deal is related to institutional ownership. We estimate the following probit regression:
Pr ob(Full Control)i = α+ β(Institutional Ownership)i + δXi + εi, (6)
where the dependent variable is a dummy that takes the value of one if the bidder makes
a bid for 100% of the target firm shares in a cross-border deal, and zero otherwise. We
estimate equation (6) using the same specifications used to estimate equation (5).
Columns (4)-(6) of Table X present the results. We find that total institutional ownership
is positively and significantly related to the probability of full control (column (4)). This is
consistent with our Facilitation Hypothesis. The presence of institutions facilitates deals in
which the bidder takes full control of the target firm and presumably changes its nationality.
Columns (5) and (6) break down the effect of institutional ownership into foreign and do-
mestic institutions. Again, it clearly shows that the result is driven by foreign institutions,
rather than domestic institutions. Holdings by foreign institutional are positively associated
with the likelihood of full shares being acquired in a cross-border deal. We interpret this
evidence as foreign institutions facilitating deals in which the nationality of the target firm
changes as the bidder buys 100% of the target firm shares.
C. Is Bridge-Building Profitable?
Finally, we examine whether institutional investors providing “bridges” between merging
firms stand to gain from these transactions. This is an important consistency check for the
quality of our results as we claim that foreign institutions are more suited to favor cross-
border deals as they care the profitability of the deal and less of other “cultural” motivations.
We therefore examine the returns earned by institutions around the deals announcement.
We estimate abnormal returns using as benchmark model a two-factor international market
model (e.g. Griffin (2002)). The factors are the local market return and the world market
25

return. The model is estimated using daily return data in U.S. dollars from the 260 business
days prior to the deal announcement.
Table XI presents the average combined premiums earned for the M&A deals in our
sample. In Panel A, we estimate separately target and acquirer firm cumulative abnormal
return for (-5,+5) trading days around the deal announcement. In Panels B and C, we show
the results by using alternative longer trading days window of (-10,+10) and (-63,+63 or
until delisting) around the deal announcement date (Schwert (2000)).
To examine the returns accruing to the investors, we compare three figures. In the first
row of each panel, we present the combined premiums accruing to an average shareholder
that held stock of target and acquirer firm in proportion to the market capitalization of each
firm prior to the deal. Panel A shows that average abnormal returns are 1.96% for all deals
in our sample and about 1.82% for cross-border deals.
In the second row of each panel, we compute combined returns earned by foreign target
and acquirer firm shareholders. Panel A shows that returns are higher (albeit only slightly)
for foreign investors in cross-border deals. Finally, in the third row of each panel, we compute
combined returns earned by common target and acquirer firm shareholders (these are defined
as “cross-owners” in Matvos and Ostrovsky (2006) and Harford et al. (2007)). The average
return earned by common shareholders to both firms is higher is higher than the combined
return (all shareholders) in cross-border mergers (2.6% versus 1.8%).. This pattern is not
found for intra-border deals.
These findings suggest that common shareholders make positive returns in cross-border
M&A deals from their combined holdings in the target and acquirer firms. Returns to
common investors exceed those of combined target plus acquirer firm as common investors
seem to be overweight on the target firms. Therefore, common investors still gain from the
M&A deals that provide no economic synergies if profits on their target firm holdings exceed
any losses on the acquirer shares they hold.
26

V. Conclusion
We study the role of institutional investors in the volume and pattern of mergers and acquisi-
tions around the world. Using a comprehensive ownership data set of worldwide institutional
investors’ stock holdings, we examine a large sample of M&A deals from 26 countries in the
2000-2005 period. We find that institutional ownership, especially foreign, is associated with
higher M&A activity within and across countries. We provide also firm-level evidence that
(especially foreign) institutions provide “bridges” between firms for more cross-border M&A
deals to take place and bigger takeover returns accrue to shareholders of both target and ac-
quirer firms. We conclude that governance motives in M&A are of second order importance
to financial integration worldwide as captured by institutional cross-country ownership.
We establish a link between the market for corporate control and the ownership structure
of firms worldwide. Our findings indicate that foreign institutions play a central role in
international M&A activity, especially in cross-border deals. In a way, companies that have
more institutional investors — especially foreign ones — are experiencing their shareholders at
the “gates”, which can act as “Trojan horses” to facilitate changes of control. Overall, our
paper shows how institutional ownership facilitates the workings of the international market
for corporate control.
27

References
Aggarwal, Reena, Isil Erel, René Stulz, and Rohan Williamson, 2006, Do U.S. firms have
the best corporate governance? A cross-country examination of the relation between
corporate governance and shareholder wealth, working paper, Georgetown University.
Ambrose, Brent, and William Megginson, 1992, The role of asset structure, ownership struc-
ture and takeover defenses in determining acquisition likelihood, Journal of Financial
and Quantitative Analysis 27, 575—589.
Becht, Marco, Julian Franks, Colin Mayer, and Stefano Rossi, 2007, Returns to shareholder
activism evidence from a clinical study of the Hermes U.K. focus fund, working paper,
London Business School.
Bolton, Patrick, and Ernst-Ludwig Von Thadden, 1998, Blocks, liquidity, and corporate
control, Journal of Finance 53, 1—25.
Bris, Arturo, and Christos Cabolis, 2007, The value of investor protection: Firm evidence
from cross.border mergers, Review of Financial Studies, forthcoming.
Bris, Arturo, William Goetzmann, and Ning Zhu, 2007, Efficiency and the bear: Short sales
and markets around the world, Journal of Finance forthcoming.
Chen, Xia, Jarrad Harford, and Kai Li, 2006, Monitoring: Which institutions matter?,
Journal of Financial Economics, forthcoming.
Cremers, K. J. Martinj, and Vinay Nair, 2005, Governance mechanisms and equity prices,
Journal of Finance 60, 2859—2894.
Ferreira, Miguel, and Pedro Matos, 2007, The colors of investors’ money: The role of insti-
tutional investors around the world?, Journal of Financial Economics, forthcoming.
Financial Times, 2007, Tangled Relationships Make Choices Tough.
28

Gaspar, José-Miguel, Massimo Massa, and Pedro Matos, 2005, Shareholder investment hori-
zons and the market for corporate control, Journal of Financial Economics 76, 135—165.
Gillan, Stuart, and Laura Starks, 2007, The evolution of shareholder activism in the United
States, Journal of Applied Corporate Finance 19, 55—73.
Griffin, John M., 2002, Are the Fama and French factors global or country specific?, Review
of Financial Studies 15, 783—803.
Grossman, Sanford, and Oliver Hart, 1980, Takeover bids, the free-rider problem, and the
theory of the corporation, Bell Journal of Economics 11, 42—64.
Harford, Jarrad, Dirk Jenter, and Kai Li, 2007, Conflicts of interests among shareholders:
The case of corporate acquisitions, working paper, University of Washington.
Hopner, Martin, and Gregory Jackson, 2004, An emerging market for corporate control? The
Mannesmann takeover and german corporate governance, MPIfG Discussion Paper.
International Monetary Fund, 2005, Global Financial Stability Report: Market Developments
and Issues.
Kahn, Charles, and AndrewWinton, 1998, Ownership structure, speculation and shareholder
intervention, Journal of Finance 53, 99—129.
Kang, Jun-Koo, and Jin-Mo Kim, 2007, Geography of corporate governance and source of
target gains in block acquisitions, Journal of Finance, forthcoming.
La Porta, Rafael, Florencio Lopez-de-Silanes, Andrei Shleifer, and Robert Vishny, 1998, Law
and finance, Journal of Political Economy 106, 1113—1155.
Matvos, Gregor, and Michael Ostrovsky, 2006, Cross-ownership, returns, and voting in merg-
ers, working paper, Harvard Business School.
29

Maug, Ernst, 1998, Large shareholders as monitors: Is there a tradeoff between liquidity and
control?, Journal of Finance 53, 65—98.
Rossi, Stefano, and Paolo Volpin, 2004, Cross-country determinants of mergers and acquisi-
tions, Journal of Financial Economics 74, 277—304.
Schwert, G.William, 2000, Hostility in takeovers: In the eyes of the beholder?, Journal of
Finance 55, 2599—2640.
Shleifer, Andrei, and Robert Vishny, 1986, Large shareholders and corporate control, Journal
of Political Economy 94, 461—488.
Shleifer, Andrei, and Robert Vishny, 2003, Stock market driven acquisitions, Journal of
Financial Economics 70, 295—311.
Stulz, Rene, Ralph Walkling, and Moon Song, 1990, The distribution of target ownership
and the division of gains in successful takeovers, Journal of Finance 45, 817—833.
The Economist, 2007, The Global Merger Boom - The Beat Goes on.
30

Table IInstitutional Ownership and Mergers and Acquisitions by Target Country
Columns (1) and (2) present the average number of firms and market capitalization (in million of US dollars) in our sample. Columns (3)-(5) present the average country-level of total,domestic, and foreign institutional ownership as a percentage of market capitalization (end-of-year values). Columns (6)-(9) present the number of completed merger and acquisition deals,the percentage of listed firms targeted in deals, the transaction value of deals (in million of US dollars), and the transaction value of deals as a percentage of total market capitalization.Columns (10)-(13) show the number of completed cross-border deals, the number of cross-border deals as a percentage of the total number of deals, the transaction value of cross-borderdeals (in million of US dollars), and the transaction value of cross-border deals as a percentage of the total transaction value. The sample period is from 2000 to 2005.
(1) (2) (3) (4) (5) (6) (7) (8) (9) (10) (11) (12) (13)Sample of Firms Institutional Ownership (%) All M&A Deals Cross-Border M&A Deals
Number Market Total Domestic Foreign Number of Deals Value of Deals Number of Deals Value of Dealsof firms capitalization Number % of firms Value % of market Number % of deals Value % of deals
cap valueAustralia (AU) 1,753 584,469 6.40 0.86 5.54 195 11.12 77,389 13.24 35 17.95 18,484 23.88Austria (AT) 180 62,072 8.70 0.68 8.02 6 3.33 8,821 14.21 3 50.00 8,309 94.20Belgium (BE) 259 219,469 10.54 3.30 7.24 13 5.02 30,959 14.11 4 30.77 1,027 3.32Canada (CA) 1,746 888,813 38.39 20.64 17.75 425 24.34 188,967 21.26 115 27.06 107,353 56.81Denmark (DK) 314 109,511 18.70 7.35 11.34 17 5.41 16,930 15.46 4 23.53 2,977 17.59Finland (FI) 223 202,065 35.52 3.33 32.19 12 5.38 13,788 6.82 5 41.67 10,390 75.35France (FR) 1,491 1,556,741 18.33 5.85 12.49 85 5.70 125,561 8.07 31 36.47 30,113 23.98Germany (DE) 1,308 1,122,865 17.51 7.05 10.46 73 5.58 57,110 5.09 42 57.53 28,666 50.19Greece (GR) 371 108,190 5.54 0.26 5.27 15 4.04 2,742 2.53 3 20.00 842 30.69Hong Kong (HK) 1,074 519,263 8.72 1.47 7.26 24 2.23 45,111 8.69 6 25.00 6,356 14.09India (IN) 393 218,769 10.27 1.57 8.71 39 9.92 2,861 1.31 8 20.51 770 26.91Ireland (IE) 127 89,732 30.39 0.63 29.75 4 3.15 1,858 2.07 4 100.00 1,858 100.00Italy (IT) 456 676,377 12.24 2.47 9.77 20 4.39 19,685 2.91 6 30.00 1,241 6.30Japan (JP) 4,070 3,414,759 7.68 1.52 6.16 251 6.17 148,564 4.35 9 3.59 1,259 0.85Luxembourg (LU) 54 47,110 16.87 0.71 16.16 3 5.56 4,723 10.03 3 100.00 4,723 100.00Netherlands (NL) 372 748,685 22.44 1.24 21.20 28 7.53 38,176 5.10 20 71.43 30,864 80.85Norway (NO) 330 111,425 18.21 6.58 11.64 27 8.18 8,829 7.92 18 66.67 4,750 53.80Poland (PL) 104 40,035 12.36 2.23 10.13 14 13.46 1,189 2.97 11 78.57 1,111 93.38Portugal (PT) 137 66,648 9.29 1.24 8.05 7 5.11 828 1.24 5 71.43 349 42.18Singapore (SG) 617 168,734 8.76 1.05 7.71 25 4.05 16,773 9.94 6 24.00 3,904 23.28South Africa (ZA) 772 220,671 9.47 2.33 7.14 34 4.40 9,603 4.35 7 20.59 5,999 62.47Spain (ES) 278 493,337 15.03 1.87 13.16 18 6.47 15,070 3.05 6 33.33 5,067 33.62Sweden (SE) 550 295,888 29.16 16.32 12.83 35 6.36 10,436 3.53 17 48.57 4,816 46.15Switzerland (CH) 392 781,184 17.80 3.00 14.80 17 4.34 9,556 1.22 9 52.94 6,572 68.77UK 3,592 3,047,705 18.78 7.51 11.28 228 6.35 433,782 14.23 82 35.96 250,091 57.65US 11,753 13,992,086 73.33 67.91 5.41 1,714 14.58 2,311,874 16.52 224 13.07 314,021 13.58All countries 32,716 29,786,605 42.98 34.58 8.40 3,329 10.18 3,601,183 12.09 683 20.52 851,910 23.66All countries (ex-US) 20,963 15,794,519 16.10 5.04 11.05 1,615 7.70 1,289,310 8.16 459 28.42 537,889 41.72Other countries 7,340 2,333,791 16.98 0.13 16.85 302 4.11 140,430 6.02 106 35.10 97,973 69.77
31
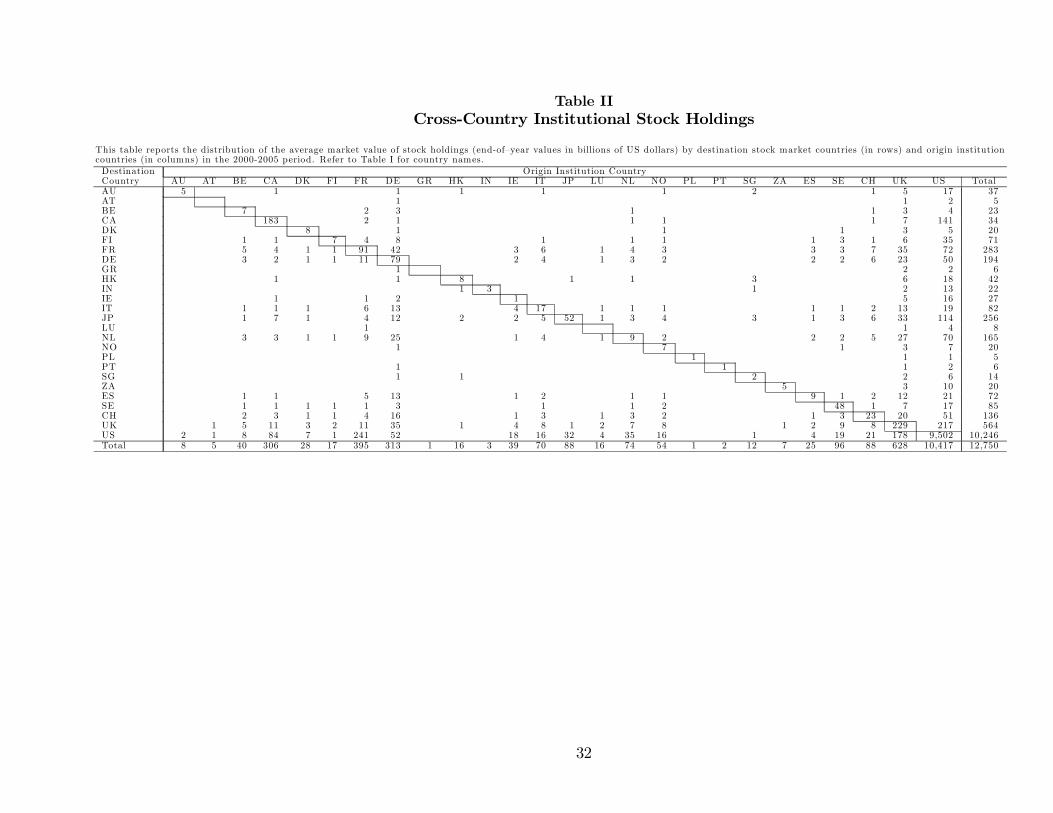
Table IICross-Country Institutional Stock Holdings
This table reports the distribution of the average market value of stock holdings (end-of—year values in billions of US dollars) by destination stock market countries (in rows) and origin institutioncountries (in columns) in the 2000-2005 period. Refer to Table I for country names.Destination Origin Institution CountryCountry AU AT BE CA DK FI FR DE GR HK IN IE IT JP LU NL NO PL PT SG ZA ES SE CH UK US TotalAU 5 1 1 1 1 1 2 1 5 17 37AT 1 1 2 5BE 7 2 3 1 1 3 4 23CA 183 2 1 1 1 1 7 141 34DK 8 1 1 1 3 5 20FI 1 1 7 4 8 1 1 1 1 3 1 6 35 71FR 5 4 1 1 91 42 3 6 1 4 3 3 3 7 35 72 283DE 3 2 1 1 11 79 2 4 1 3 2 2 2 6 23 50 194GR 1 2 2 6HK 1 1 8 1 1 3 6 18 42IN 1 3 1 2 13 22IE 1 1 2 1 5 16 27IT 1 1 1 6 13 4 17 1 1 1 1 1 2 13 19 82JP 1 7 1 4 12 2 2 5 52 1 3 4 3 1 3 6 33 114 256LU 1 1 4 8NL 3 3 1 1 9 25 1 4 1 9 2 2 2 5 27 70 165NO 1 7 1 3 7 20PL 1 1 1 5PT 1 1 1 2 6SG 1 1 2 2 6 14ZA 5 3 10 20ES 1 1 5 13 1 2 1 1 9 1 2 12 21 72SE 1 1 1 1 1 3 1 1 2 48 1 7 17 85CH 2 3 1 1 4 16 1 3 1 3 2 1 3 23 20 51 136UK 1 5 11 3 2 11 35 1 4 8 1 2 7 8 1 2 9 8 229 217 564US 2 1 8 84 7 1 241 52 18 16 32 4 35 16 1 4 19 21 178 9,502 10,246Total 8 5 40 306 28 17 395 313 1 16 3 39 70 88 16 74 54 1 2 12 7 25 96 88 628 10,417 12,750
32

Table IIICross-Country Number of Mergers and Acquisitions
This table reports the distribution of the number of merger and acquisitions deals by target firm countries (in rows) and acquirer firm countries (in columns) in the 2000-2005 period. Refer to TableI for country names.Target Acquiror CountryCountry AU AT BE CA DK FI FR DE GR HK IN IE IT JP LU NL NO PL PT SG ZA ES SE CH UK US Other TotalAU 160 7 1 1 1 5 2 5 9 4 195AT 3 1 2 6BE 9 1 1 1 1 13CA 3 310 1 1 4 2 1 1 2 1 2 16 75 6 425DK 1 13 2 1 17FI 7 1 2 1 1 12FR 2 1 1 54 5 3 2 1 2 2 1 3 2 6 85DE 3 1 1 1 2 31 3 1 2 1 1 3 6 16 1 73GR 1 12 1 1 15HK 18 1 1 1 3 24IN 1 31 1 1 1 2 2 39IE 2 2 4IT 2 14 3 1 20JP 2 1 1 242 3 2 251LU 1 2 3NL 1 4 2 1 1 8 3 1 2 1 4 28NO 1 2 1 1 9 5 1 2 5 27PL 1 1 2 1 3 3 3 14PT 1 2 4 7SG 1 1 1 1 1 19 1 25ZA 1 2 27 4 34ES 1 1 1 12 1 2 18SE 2 1 1 1 1 18 1 2 7 1 35CH 1 2 1 1 1 8 1 2 17UK 6 1 3 3 7 9 2 1 3 3 2 2 1 4 146 32 3 228US 9 3 52 2 6 13 18 3 3 6 4 14 2 1 1 3 6 6 44 1,490 28 1,714Other 8 1 2 6 3 1 11 4 3 1 4 1 1 2 3 1 2 4 2 6 4 2 11 23 196 302Total 187 10 26 385 26 17 101 78 15 24 37 0 37 253 4 37 16 5 4 30 39 33 47 34 250 1,684 252 3,631
33

Table IVInstitutional Ownership and the Volume of Mergers and Acquisitions across
Countries
Panel A presents the estimates of panel regressions of the volume of mergers and acquisitions by country and year. Thedependent variable is the percentage of listed firms targeted in completed merger and acquisition deals. Panel B presents theestimates of cross-sectional regressions of the total volume of mergers and acquisitions by country over our sample period.The explanatory variables in Panel B are sample period averages. Refer to Appendix A for variables definition. The sampleperiod is from 2000 to 2005. Robust t-statistics are in parentheses.
(1) (2) (3) (4) (5) (6) (7) (8) (9)Panel A: Panel Regression
Total institutional ownership 0.0274 0.0273 0.0260 0.0205 0.0321 0.0291(5.11) (5.47) (5.28) (3.59) (6.80) (4.68)
Domestic institutional ownership 0.0203 0.0254(4.14) (5.31)
Foreign institutional ownership 0.0466 0.0573(2.47) (3.06)
GDP per capita (log) -0.0026 -0.0025 -0.0009 -0.0003 0.0010 0.0005 0.0021 0.0018(-2.85) (-2.87) (-1.28) (-0.33) (1.06) (0.47) (1.80) (1.65)
GDP growth -0.0979 -0.0996 -0.0380 -0.1099 -0.0494 -0.0518 -0.0438 -0.0457(-2.79) (-3.10) (-1.08) (-3.18) (-1.40) (-1.47) (-1.09) (-1.22)
Common law 0.0034 0.0056 0.0031 0.0051 0.0041 0.0098 0.0075(1.68) (2.70) (1.84) (2.96) (2.12) (3.63) (3.28)
Anti-director rights 0.0015(2.69)
Accounting standards -0.0001 -0.0001 0.0000 -0.0002 -0.0002(-1.78) (-1.19) (-0.40) (-2.55) (-2.11)
Ownership concentration -0.0002 -0.0001 -0.0001 -0.0002 -0.0001(-4.11) (-1.23) (-2.46) (-3.68) (-1.09)
Market return 0.0119 0.0104 0.0087 0.0099 0.0115(2.11) (1.94) (1.59) (1.81) (2.12)
Market competition -0.0081 -0.0064 -0.0050 -0.0052 -0.0071(-5.17) (-3.89) (-3.04) (-2.87) (-4.17)
Year dummies Yes Yes Yes Yes Yes Yes Yes Yes YesObservations 162 156 156 138 150 138 138 138 138R-squared 0.27 0.34 0.35 0.44 0.49 0.54 0.47 0.48 0.56
Panel B: Cross-Sectional RegressionTotal institutional ownership 0.1592 0.1658 0.1583 0.1275 0.1840 0.1886
(2.75) (2.69) (2.58) (1.92) (3.07) (3.07)Domestic institutional ownership 0.1350 0.1674
(1.89) (2.77)Foreign institutional ownership 0.3014 0.3775
(1.82) (2.71)GDP per capita (log) -0.0166 -0.0157 -0.0056 -0.0150 0.0097 0.0050 0.0171 0.0159
(-1.70) (-1.63) (-0.42) (-1.51) (0.75) (0.33) (1.08) (1.22)GDP growth -1.0085 -0.9719 -0.4169 -1.4682 -0.2867 -0.3868 -0.2132 -0.1819
(-1.36) (-1.43) (-0.41) (-1.92) (-0.32) (-0.37) (-0.20) (-0.21)Common law 0.0285 0.0373 0.0369 0.0312 0.0256 0.0613 0.0460
(1.25) (1.47) (1.63) (1.42) (0.96) (2.23) (1.98)Anti-director rights 0.0108
(1.50)Accounting standards -0.0007 -0.0005 -0.0001 -0.0015 -0.0012
(-0.57) (-0.49) (-0.10) (-1.15) (-1.08)Ownership concentration -0.0009 -0.0003 -0.0007 -0.0011 -0.0003
(-1.26) (-0.46) (-0.89) (-1.55) (-0.44)Market return 0.1260 0.1462 0.1131 0.1448 0.1722
(1.06) (1.37) (0.93) (1.15) (1.66)Market competition -0.0105 -0.0391 -0.0305 -0.0306 -0.0432
(-1.67) (-2.22) (-1.54) (-1.53) (-2.53)Constant 0.0407 0.2242 0.1908 0.1804 0.2691 0.2133 0.2261 0.1710 0.1887
(3.03) (2.17) (1.82) (1.36) (2.20) (1.60) (1.46) (1.09) (1.46)Observations 26 26 26 23 26 23 23 23 23R-squared 0.24 0.39 0.41 0.53 0.50 0.69 0.59 0.59 0.74
34
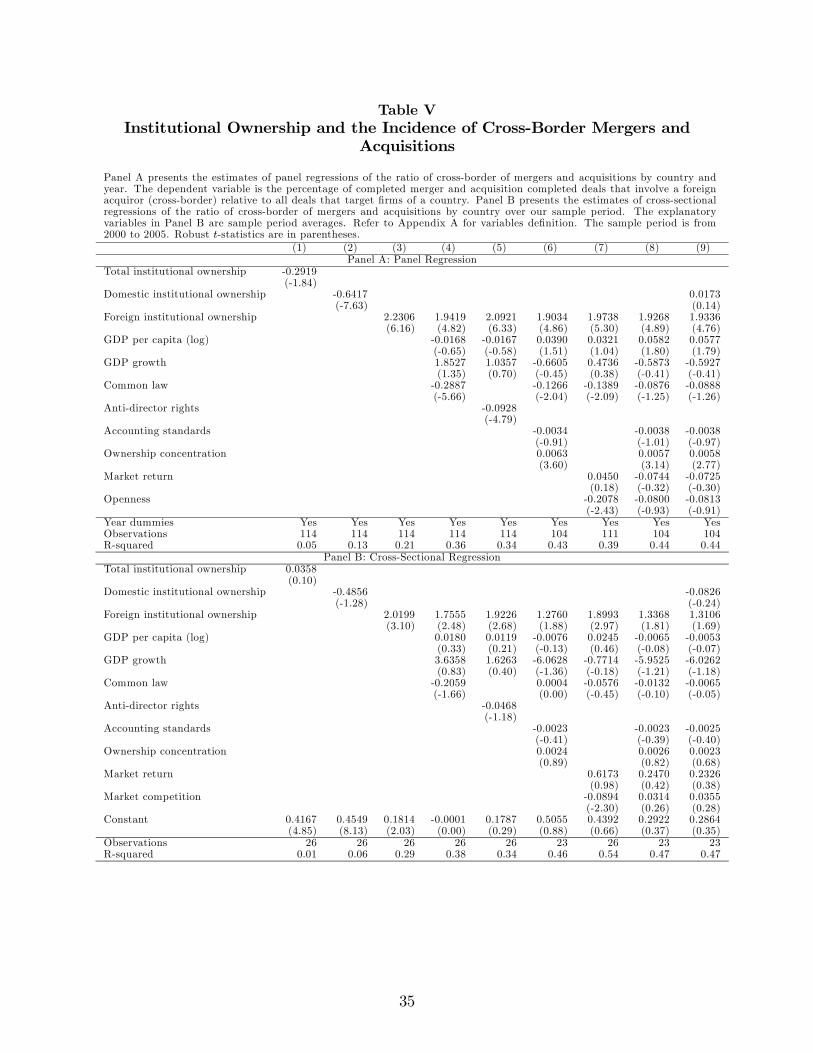
Table VInstitutional Ownership and the Incidence of Cross-Border Mergers and
Acquisitions
Panel A presents the estimates of panel regressions of the ratio of cross-border of mergers and acquisitions by country andyear. The dependent variable is the percentage of completed merger and acquisition completed deals that involve a foreignacquiror (cross-border) relative to all deals that target firms of a country. Panel B presents the estimates of cross-sectionalregressions of the ratio of cross-border of mergers and acquisitions by country over our sample period. The explanatoryvariables in Panel B are sample period averages. Refer to Appendix A for variables definition. The sample period is from2000 to 2005. Robust t-statistics are in parentheses.
(1) (2) (3) (4) (5) (6) (7) (8) (9)Panel A: Panel Regression
Total institutional ownership -0.2919(-1.84)
Domestic institutional ownership -0.6417 0.0173(-7.63) (0.14)
Foreign institutional ownership 2.2306 1.9419 2.0921 1.9034 1.9738 1.9268 1.9336(6.16) (4.82) (6.33) (4.86) (5.30) (4.89) (4.76)
GDP per capita (log) -0.0168 -0.0167 0.0390 0.0321 0.0582 0.0577(-0.65) (-0.58) (1.51) (1.04) (1.80) (1.79)
GDP growth 1.8527 1.0357 -0.6605 0.4736 -0.5873 -0.5927(1.35) (0.70) (-0.45) (0.38) (-0.41) (-0.41)
Common law -0.2887 -0.1266 -0.1389 -0.0876 -0.0888(-5.66) (-2.04) (-2.09) (-1.25) (-1.26)
Anti-director rights -0.0928(-4.79)
Accounting standards -0.0034 -0.0038 -0.0038(-0.91) (-1.01) (-0.97)
Ownership concentration 0.0063 0.0057 0.0058(3.60) (3.14) (2.77)
Market return 0.0450 -0.0744 -0.0725(0.18) (-0.32) (-0.30)
Openness -0.2078 -0.0800 -0.0813(-2.43) (-0.93) (-0.91)
Year dummies Yes Yes Yes Yes Yes Yes Yes Yes YesObservations 114 114 114 114 114 104 111 104 104R-squared 0.05 0.13 0.21 0.36 0.34 0.43 0.39 0.44 0.44
Panel B: Cross-Sectional RegressionTotal institutional ownership 0.0358
(0.10)Domestic institutional ownership -0.4856 -0.0826
(-1.28) (-0.24)Foreign institutional ownership 2.0199 1.7555 1.9226 1.2760 1.8993 1.3368 1.3106
(3.10) (2.48) (2.68) (1.88) (2.97) (1.81) (1.69)GDP per capita (log) 0.0180 0.0119 -0.0076 0.0245 -0.0065 -0.0053
(0.33) (0.21) (-0.13) (0.46) (-0.08) (-0.07)GDP growth 3.6358 1.6263 -6.0628 -0.7714 -5.9525 -6.0262
(0.83) (0.40) (-1.36) (-0.18) (-1.21) (-1.18)Common law -0.2059 0.0004 -0.0576 -0.0132 -0.0065
(-1.66) (0.00) (-0.45) (-0.10) (-0.05)Anti-director rights -0.0468
(-1.18)Accounting standards -0.0023 -0.0023 -0.0025
(-0.41) (-0.39) (-0.40)Ownership concentration 0.0024 0.0026 0.0023
(0.89) (0.82) (0.68)Market return 0.6173 0.2470 0.2326
(0.98) (0.42) (0.38)Market competition -0.0894 0.0314 0.0355
(-2.30) (0.26) (0.28)Constant 0.4167 0.4549 0.1814 -0.0001 0.1787 0.5055 0.4392 0.2922 0.2864
(4.85) (8.13) (2.03) (0.00) (0.29) (0.88) (0.66) (0.37) (0.35)Observations 26 26 26 26 26 23 26 23 23R-squared 0.01 0.06 0.29 0.38 0.34 0.46 0.54 0.47 0.47
35

Table VICross-Country Institutional Holdings and Cross-Border Mergers and
Acquisitions: Country Pairs
Panel A presents the estimates of panel regressions of cross-border mergers and acquisitions between matchedcountry pairs in each year. The dependent variable is the number of cross-border deals between target firms fromcountry i and acquiror firms from country j as a percentage of the total of number of deals with target firm fromcountry i. Panel B presents the estimates of cross-sectional regressions of cross-border mergers and acquisitionsbetween matched country pairs over our sample period. The explanatory variables in Panel B are sample periodaverages. Refer to Appendix A for variables definition. The sample period is from 2000 to 2005. Robust t-statisticsare in parentheses.
(1) (2) (3) (4) (5) (6)Panel A: Panel Regression
Instititutional ownershipi,j 1.3135 1.2605 1.4609 1.4703 1.4638 1.4301(5.26) (5.07) (6.97) (7.01) (6.96) (4.44)
GDP per capitaj - GDP per capitai (log) 0.0018 0.0012 0.0014 0.0013 0.0014(2.01) (1.02) (1.16) (1.08) (1.14)
Same language 0.0047 0.0031 0.0029 0.0027 0.0024(1.18) (0.80) (0.72) (0.67) (0.64)
Same geographical region 0.0051 0.0055 0.0056 0.0060 0.0055(1.85) (1.59) (1.60) (1.65) (1.49)
Anti-director rightsj− Anti-director rightsi 0.0012 0.0007 0.0007 0.0006 0.0006(1.85) (0.96) (0.96) (0.83) (0.98)
Accounting standardsj − Accounting standardsi 0.0001 0.0001 0.0001 0.0001(0.71) (0.73) (0.87) (0.85)
Market returnj − Market returni 0.0075 0.0068 0.0070(0.93) (0.84) (0.88)
Industry structurei,j -0.0017 -0.0016(-2.64) (-2.65)
Bilateral tradei,j (0.01)(0.19)
Year dummies Yes Yes Yes Yes Yes YesObservations 2,236 2,150 1,826 1,826 1,826 1,826R-squared 0.10 0.10 0.12 0.12 0.12 0.12
Panel B: Cross-Sectional RegressionInstititutional ownershipi,j 1.4791 1.4232 1.1803 1.1688 1.1805 0.5777
(2.92) (2.79) (4.99) (4.98) (5.26) (1.71)GDP per capitaj - GDP per capitai (log) 0.0011 -0.0007 -0.0012 -0.0012 -0.0003
(1.05) (-0.68) (-1.01) (-1.06) (-0.23)Same language 0.0071 0.0073 0.0073 0.0065 0.0004
(1.14) (1.65) (1.66) (1.41) (0.07)Same geographical region 0.0101 0.0121 0.0121 0.0129 0.0019
(2.65) (3.32) (3.32) (3.40) (0.47)Anti-director rightsj− Anti-director rightsi 0.0016 0.0003 0.0003 0.0003 0.0016
(2.03) (0.40) (0.39) (0.37) (2.12)Accounting standardsj − Accounting standardsi 0.0003 0.0003 0.0003 0.0002
(1.40) (1.36) (1.37) (1.31)Market returnj − Market returni -0.0153 -0.0149 0.0046
(-0.76) (-0.74) (0.20)Industry structurei,j -0.0033 -0.0014
(-2.30) (-1.16)Bilateral tradei,j 0.3313
(2.12)Constant 0.0081 0.0024 0.0027 0.0027 0.0038 0.0019
(4.32) (1.12) (2.08) (2.11) (2.46) (0.97)Observations 676 650 506 506 506 506R-squared 0.18 0.19 0.21 0.21 0.21 0.31
36

Table VIIRobustness Checks of Country-Level Tests
This table presents robustness checks of country-level tests: panel regressions of the volume of mergers and acquisitions by countryand year (Panel A); panel regressions of the ratio of cross-border of mergers and acquisitions by country and year (Panel B); andpanel regressions of cross-border mergers and acquisitions between matched country pairs in each year (Panel C). Column (1) uses2SLS estimation with the percentage of firms from a country with shares included in the MSCI World index, the percentage of firmsfrom a country with shares cross-listed on U.S. exchanges, stock market trading volume as a percentage of GDP, dividend yield(value-weighted average across stocks in a country), a dummy variable equal to one if there are short selling restrictions in a country,and the statutory dividend tax rate of a country used as instruments for institutional ownership. Column (2) excludes mergers andacquisitions deals that involve a target firms from the U.S. Column (2) extends the sample to include 21 additional countries “othercountries” where data coverage is limited to foreign institutional holdings. Column (4) the uses the value of mergers and acquisitionsdeals (relative to market capitalization in Panel A, and total transaction value in Panels B and C) as dependent variable. Column(5) uses standard errors adjusted for country-level clustering. Column (6) presents estimates of a Tobit model. Refer to Appendix Afor variables definition. The sample period is from 2000 to 2005. Robust t-statistics are in parentheses.
(1) (2) (3) (4) (5) (6)2SLS Excluding Extended Value of Country Tobit
US Sample of Deals ClusteredCountries Std Errors
Panel A: Panel Regression of Volume of Mergers and AcquisitionsTotal institutional ownership 0.0230 0.0609 0.0169 0.0105 0.0291 0.0289
(4.36) (4.96) (3.63) (0.76) (2.42) (5.76)GDP per capita (log) -0.0079 0.0022 0.0009 0.0072 0.0010 0.0010
(-2.93) (2.27) (1.25) (2.72) (0.67) (1.06)GDP growth -0.0948 -0.0256 -0.0676 -0.0704 -0.0494 -0.0459
(-1.63) (-0.71) (-2.86) (-0.50) (-1.67) (-1.16)Common law 0.0076 0.0087 0.0088 0.0161 0.0051 0.0052
(3.71) (4.16) (5.27) (2.96) (1.75) (3.11)Accounting standards 0.0002 -0.0003 -0.0002 -0.0003 -0.0001 -0.0001
(2.04) (-3.06) (-2.56) (-0.88) (-0.98) (-0.94)Ownership concentration 0.0000 0.0000 -0.0001 -0.0001 -0.0001 -0.0001
(-0.25) (-0.92) (-3.18) (-0.55) (-0.82) (-1.20)Market return 0.0224 0.0088 0.0035 0.0369 0.0104 0.0100
(4.07) (1.86) (1.20) (2.43) (1.50) (2.16)Market competition -0.0063 -0.0073 0.0004 0.0031 -0.0064 -0.0065
(-3.84) (-4.86) (0.51) (0.61) (-2.15) (-4.42)Year dummies Yes Yes Yes Yes Yes YesObservations 114 132 192 138 138 138R-squared 0.58 0.41 0.21 0.54
Panel B: Panel Regression of Incidence of Cross-Border Mergers and AcquisitionsForeign institutional ownership 2.3743 1.9567 0.8655 2.5792 1.9268 1.9268
(3.98) (4.73) (3.26) (5.13) (2.99) (4.16)GDP per capita (log) 0.2779 0.0570 0.0306 0.0137 0.0582 0.0582
(1.93) (1.76) (1.04) (0.19) (2.11) (1.60)GDP growth -1.0509 -0.5861 0.8996 0.7085 -0.5873 -0.5873
(-0.39) (-0.40) (0.79) (0.27) (-0.46) (-0.38)Common law 0.0227 -0.0916 -0.2176 -0.0997 -0.0876 -0.0876
(0.29) (-1.30) (-4.10) (-0.88) (-0.85) (-1.20)Accounting standards -0.0069 -0.0035 -0.0043 -0.0022 -0.0038 -0.0038
(-1.49) (-0.87) (-1.37) (-0.37) (-0.93) (-1.15)Ownership concentration 0.0075 0.0059 0.0018 0.0051 0.0057 0.0057
(2.75) (2.87) (1.03) (1.77) (2.34) (3.31)Market return -0.2718 -0.0741 0.0698 -0.2433 -0.0744 -0.0744
(-1.09) (-0.29) (0.45) (-0.67) (-0.40) (-0.34)Openness -0.1120 -0.0853 -0.0946 0.0230 -0.0800 -0.0800
(-1.16) (-0.95) (-1.74) (0.19) (-1.04) (-1.11)Year dummies Yes Yes Yes Yes Yes YesObservations 87 98 137 99 104 104R-squared 0.39 0.39 0.28 0.44
Panel C: Panel Regression of Country-PairsInstititutional ownershipi,j 1.4532 1.4418 1.4198 1.6793 1.4301 4.1376
(4.50) (4.32) (4.48) (3.34) (4.64) (5.94)GDP per capitaj - GDP per capitai (log) 0.0019 0.0013 0.0017 0.0011 0.0014 0.0336
(1.70) (1.05) (2.48) (0.63) (1.03) (2.33)Same language 0.0030 0.0026 0.0028 0.0007 0.0024 0.0853
(0.78) (0.62) (0.84) (0.10) (0.61) (3.79)Same geographical region 0.0062 0.0051 0.0048 0.0064 0.0055 -0.0136
(1.63) (1.33) (1.78) (1.31) (1.55) (-0.64)Anti-director rightsj− Anti-director rightsi 0.0007 0.0005 0.0007 0.0000 0.0006 -0.0176
(1.03) (0.71) (1.66) (-0.02) (0.87) (-3.15)Accounting standardsj − Accounting standardsi 0.0001 0.0002 0.0001 0.0003 0.0001 0.0028
(0.87) (0.90) (0.89) (1.04) (0.83) (2.51)Market returnj − Market returni 0.0051 0.0072 0.0009 -0.0076 0.0070 0.0604
(0.62) (0.85) (0.31) (-0.61) (0.92) (0.96)Industry structurei,j -0.0017 -0.0017 -0.0013 -0.0028 -0.0016 (-0.01)
(-2.82) (-2.69) (-2.56) (-3.02) (-2.67) (-1.07)Bilateral tradei,j 0.0043 0.0109 0.0207 0.0155 0.0142 (0.19)
(0.06) (0.14) (0.29) (0.15) (0.19) (0.95)Year dummies Yes Yes Yes Yes Yes YesObservations 1,757 1,694 2,656 1,804 1,826 1,826R-squared 0.11 0.13 0.07 0.12
37

Table VIIISummary Statistics of Firm-Level Sample
This table presents the summary statistics for firm-level variables for the sample of target and acquirer firms withinstitutional ownership data. Panel A includes firm characteristics for our sample of all mergers and acquisitionsevents. Panel B includes firm characteristics for our sample of cross-border mergers and acquisitions. Refer toAppendix B for variables definition. The sample period is from 2000 to 2005.
Mean Std Dev 10% Median 90% ObservationsPanel A: All M&A Deals
Cross-border dummy variable 0.239 0.427 0.000 0.000 1.000 2,602Total institutional ownership - target 0.134 0.190 0.001 0.054 0.371 2,602Foreign institutional ownership - target 0.032 0.085 0.000 0.004 0.094 2,602Domestic institutional ownership - target 0.104 0.174 0.000 0.026 0.315 2,602Total institutional ownership - acquirer 0.408 0.345 0.019 0.297 0.988 1,491Foreign institutional ownership - acquirer 0.069 0.109 0.001 0.034 0.167 1,491Domestic institutional ownership - acquirer 0.345 0.347 0.003 0.207 0.918 1,491Size - target 11.729 2.076 9.303 11.632 14.387 2,602Book-to-market - target -0.396 0.972 -1.476 -0.397 0.704 2,338Investment opportunities - target 0.147 0.417 -0.165 0.060 0.528 2,298Stock return - target -0.145 0.681 -1.099 0.000 0.538 2,509ROE - target -0.047 0.466 -0.455 0.063 0.254 2,167Leverage - target 0.262 0.225 0.011 0.226 0.576 2,109Cash - target 0.204 0.226 0.010 0.106 0.568 2,109Foreign sales - target 0.116 0.223 0.000 0.000 0.476 2,602Closely held shares - target 0.352 0.243 0.041 0.329 0.691 1,941Governance score - target 54.902 29.424 11.900 57.600 92.400 846Size - acquirer 14.150 2.313 11.199 14.235 17.077 1,514Book-to-market - acquirer -0.803 0.854 -1.822 -0.781 0.178 1,482Investment opportunities - acquirer 0.201 0.395 -0.086 0.103 0.583 1,444Stock return - acquirer 0.037 0.535 -0.544 0.107 0.575 1,497ROE - acquirer 0.090 0.330 -0.154 0.124 0.313 1,424Leverage - acquirer 0.231 0.169 0.024 0.213 0.466 1,381Cash - acquirer 0.186 0.201 0.014 0.107 0.507 1,253Foreign sales - acquirer 0.104 0.207 0.000 0.000 0.438 2,602Closely held shares - acquirer 0.244 0.308 0.004 0.172 0.603 1,351Governance score - acquirer 54.001 28.631 13.300 54.700 92.300 1,018Intra-industry M&A 0.198 0.399 0.000 0.000 1.000 2,602
Panel B: Cross-Border M&A DealsSuccess dummy variable 0.700 0.460 0.000 1.000 1.000 180Full control dummy variable 0.744 0.437 0.000 1.000 1.000 180Total institutional ownership - target 0.196 0.209 0.004 0.133 0.460 180Foreign institutional ownership - target 0.087 0.149 0.001 0.035 0.209 180Domestic institutional ownership - target 0.119 0.174 0.000 0.050 0.348 180Total institutional ownership - acquirer 0.390 0.322 0.071 0.283 0.971 180Foreign institutional ownership - acquirer 0.129 0.157 0.008 0.081 0.273 180Domestic institutional ownership - acquirer 0.269 0.327 0.006 0.106 0.845 180Size - target 12.866 1.930 10.482 12.813 15.381 180Book-to-market - target -0.531 0.751 -1.336 -0.560 0.327 180Investment opportunities - target 0.186 0.446 -0.114 0.094 0.588 180Stock return - target -0.082 0.573 -0.912 0.034 0.430 180ROE - target 0.015 0.284 -0.361 0.088 0.262 180Leverage - target 0.233 0.177 0.012 0.217 0.481 180Cash - target 0.131 0.151 0.012 0.071 0.342 180Size - acquirer 15.130 2.137 12.290 15.376 18.040 180Book-to-market - acquirer -0.834 0.794 -1.651 -0.886 0.035 180Investment opportunities - acquirer 0.159 0.347 -0.077 0.077 0.498 180Stock return - acquirer 0.007 0.471 -0.477 0.048 0.521 180ROE - acquirer 0.125 0.256 -0.131 0.148 0.298 180Leverage - acquirer 0.251 0.158 0.035 0.224 0.488 180Cash - acquirer 0.125 0.144 0.012 0.076 0.282 180Intra-industry M&A 0.317 0.466 0.000 0.000 1.000 180
38

Table IXInstitutional Ownership and the Probability of Being Targeted in a
Cross-Border Merger and Acquisition
This table presents the estimates of a probit model on a dummy variable that equals one if the merger and acquisition dealis cross-border, and zero otherwise. Panel A includes only target firm explanatory variables. Panel B includes target andacquirer firm explanatory variables. Column (8) presents estimates of a 2-step probit model using a dummy variable thattakes the value of one if the firm’s shares are included in the MSCI World index, a dummy variable that takes the value ofone if a firm’s stock is cross-listed on U.S. exchanges, share turnover, dividend yield, a dummy variables that equals one ifthere are short selling restrictions in a firm’s country, statutory dividend tax rate in a firm’s country, and the number of taxtreaties linking the firm’s country with other countries as instruments for institutional ownership. The sample period is from2000 to 2005. Robust t-statistics are in parentheses.
(1) (2) (3) (4) (5) (6) (7) (8)2SLS
Panel A: Only Target Explanatory VariablesTotal institutional ownership - target 0.0284
(0.17)Foreign institutional ownership - target 1.1532 1.2230 2.3562 2.4538 2.3387 3.9988 16.8156
(3.35) (3.45) (4.59) (4.75) (4.06) (3.35) (7.50)Domestic institutional ownership - target -0.3654 -0.4863 -0.3307 -0.9442 -2.0592
(-1.83) (-1.82) (-1.16) (-2.50) (-2.21)Size - target 0.1034 0.0941 0.0981 0.0649 0.0730 0.0170 0.0830 -0.0643
(6.31) (6.01) (6.02) (2.57) (2.80) (0.56) (1.89) (-1.50)Book-to-market - target -0.0504 -0.0518 -0.0669 -0.0586 -0.1634
(-0.90) (-0.93) (-1.04) (-0.58) (-2.40)Investment opportunities - target 0.0066 0.0150 -0.0017 -0.4457 -0.1833
(0.06) (0.14) (-0.01) (-1.53) (-1.31)Stock return - target 0.0515 0.0425 0.1735 0.2573 0.0626
(0.65) (0.54) (1.94) (1.83) (0.63)Return on equity - target -0.0849 -0.0819 -0.0783 -0.2237 0.1626
(-0.87) (-0.84) (-0.69) (-1.31) (1.10)Leverage - target -0.0452 -0.0373 0.0835 -0.7855 -0.0671
(-0.19) (-0.16) (0.31) (-2.03) (-0.23)Cash - target 0.2727 0.2791 0.3734 -0.9914 0.2694
(1.08) (1.11) (1.30) (-2.08) (0.82)Foreign sales - target 0.8315
(4.54)Closely held shares - target -0.1305
(-0.64)Governance score - target 0.0015
(0.62)Intra-industry M&A -0.0421 -0.0482 -0.0523 -0.0221 -0.0237 0.0648 -0.0743 -0.2252
(-0.56) (-0.63) (-0.69) (-0.21) (-0.23) (0.57) (-0.43) (-1.75)Year dummies Yes Yes Yes Yes Yes Yes YesCountry dummies Yes Yes Yes Yes Yes Yes YesIndustry dummies Yes Yes Yes Yes Yes Yes YesObservations 2,588 2,588 2,588 1,408 1,408 1,144 471 1,319
39

Table IX: continued(1) (2) (3) (4) (5) (6) (7) (8)
2SLSPanel B: Target and Acquirer Explanatory Variables
Total institutional ownership - target 0.3966(1.63)
Foreign institutional ownership - target 1.5264 1.4707 4.0148 4.1628 5.3236 5.2054 13.8549(2.79) (2.72) (3.13) (3.18) (2.89) (2.47) (6.64)
Domestic institutional ownership - target 0.0513 -0.0309 0.4407 -0.0651 -0.7476(0.19) (-0.06) (0.85) (-0.10) (-1.47)
Total institutional ownership - acquirer -0.2631(-1.42)
Foreign institutional ownership - acquirer 1.7058 1.7511 1.9131 2.2892 3.2462 6.0853 3.0789(3.26) (3.32) (1.88) (2.29) (2.42) (3.04) (1.99)
Domestic institutional ownership - acquirer -0.6774 -1.3984 -1.2656 -0.8570 -0.3951(-3.69) (-4.68) (-3.52) (-1.88) (-1.59)
Size - target -0.0316 -0.0465 -0.0462 -0.1379 -0.1547 -0.2290 -0.2590 -0.1840(-0.99) (-1.57) (-1.46) (-2.70) (-2.76) (-3.13) (-2.37) (-3.19)
Book-to-market - target -0.1309 -0.1906 0.0139 -0.2490 -0.2431(-1.21) (-1.74) (0.09) (-1.00) (-2.18)
Investment opportunities - target 0.2662 0.2300 0.2469 -1.4676 -0.1271(1.29) (1.13) (1.05) (-2.16) (-0.56)
Stock return - target 0.1919 0.1806 0.4211 0.1889 0.1032(1.19) (1.10) (2.08) (0.56) (0.62)
Return on equity - target -0.0694 -0.0922 0.0475 0.1705 0.2133(-0.34) (-0.45) (0.16) (0.30) (0.96)
Leverage - target -0.0707 -0.2015 -0.1231 -1.0448 -0.5945(-0.15) (-0.42) (-0.20) (-1.28) (-1.30)
Cash - target 0.0675 -0.0609 0.4862 -2.0929 0.1670(0.14) (-0.12) (0.72) (-2.04) (0.30)
Foreign sales - target 0.5570(1.18)
Closely held shares - target 0.0598(0.13)
Governance score - target 0.0059(1.33)
Size - acquirer 0.1880 0.1437 0.1611 0.2100 0.2268 0.2269 0.3085 0.0561(6.33) (4.89) (5.39) (3.96) (4.25) (3.66) (2.82) (1.01)
Book-to-market - acquirer -0.0167 -0.0162 -0.0936 -0.0958 -0.0623(-0.15) (-0.15) (-0.72) (-0.32) (-0.52)
Investment opportunities - acquirer -0.1782 -0.2400 -0.1061 -1.7129 -0.0871(-0.80) (-1.10) (-0.43) (-1.41) (-0.36)
Stock return - acquirer -0.3934 -0.3356 -0.1174 0.2049 -0.1904(-2.02) (-1.70) (-0.50) (0.45) (-1.02)
Return on equity - acquirer -0.2672 -0.1618 -0.4690 0.6727 0.1884(-0.87) (-0.52) (-1.24) (0.62) (0.52)
Leverage - acquirer 0.1985 0.2492 0.5449 -0.8932 0.9212(0.40) (0.49) (0.97) (-1.00) (1.84)
Cash - acquirer -1.2261 -1.2049 -1.5980 -0.3609 -0.7581(-2.14) (-2.06) (-2.27) (-0.28) (-1.16)
Foreign sales - acquirer 0.3061(0.68)
Closely held shares - acquirer 0.2693(0.53)
Governance score - acquirer -0.0043(-0.90)
Intra-industry M&A 0.1145 0.0564 0.0477 0.5036 0.4326 0.7105 -0.1396 -0.0015(1.13) (0.55) (0.46) (3.30) (2.79) (3.72) (-0.49) (-0.01)
Year dummies Yes Yes Yes Yes Yes Yes YesCountry dummies Yes Yes Yes Yes Yes Yes YesIndustry dummies Yes Yes Yes Yes Yes Yes YesObservations 1,432 1,432 1,432 617 617 468 205 623
40
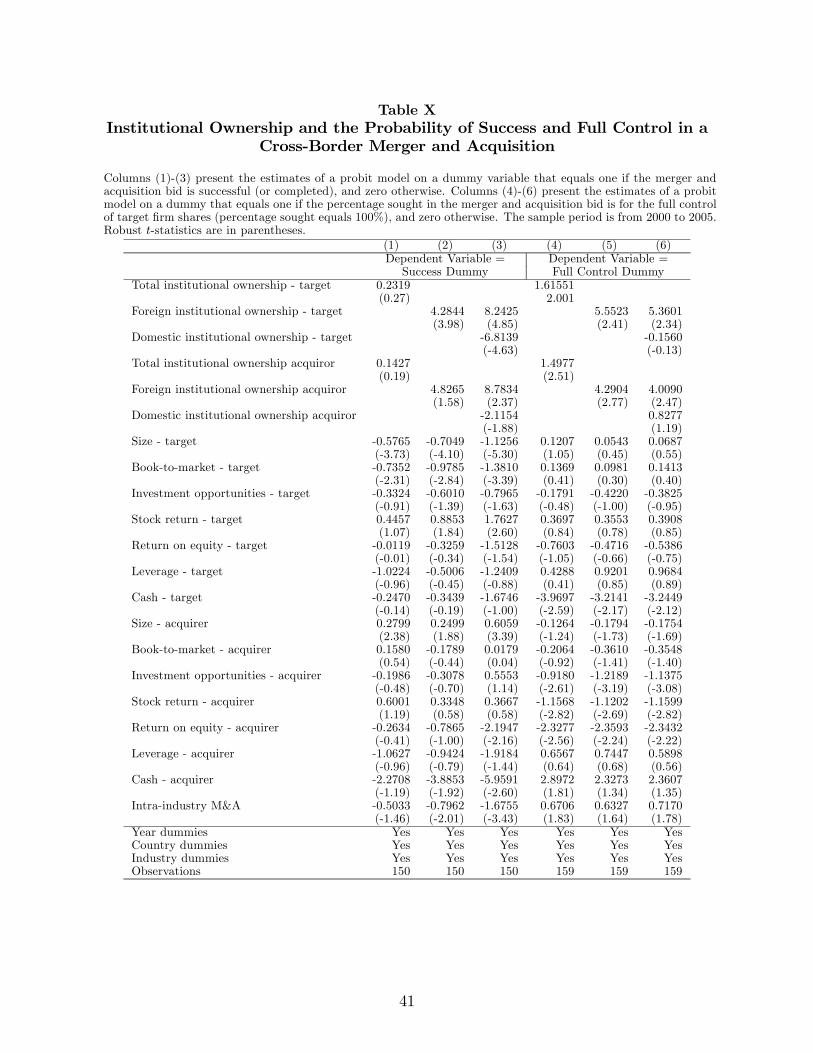
Table XInstitutional Ownership and the Probability of Success and Full Control in a
Cross-Border Merger and Acquisition
Columns (1)-(3) present the estimates of a probit model on a dummy variable that equals one if the merger andacquisition bid is successful (or completed), and zero otherwise. Columns (4)-(6) present the estimates of a probitmodel on a dummy that equals one if the percentage sought in the merger and acquisition bid is for the full controlof target firm shares (percentage sought equals 100%), and zero otherwise. The sample period is from 2000 to 2005.Robust t-statistics are in parentheses.
(1) (2) (3) (4) (5) (6)Dependent Variable = Dependent Variable =Success Dummy Full Control Dummy
Total institutional ownership - target 0.2319 1.61551(0.27) 2.001
Foreign institutional ownership - target 4.2844 8.2425 5.5523 5.3601(3.98) (4.85) (2.41) (2.34)
Domestic institutional ownership - target -6.8139 -0.1560(-4.63) (-0.13)
Total institutional ownership acquiror 0.1427 1.4977(0.19) (2.51)
Foreign institutional ownership acquiror 4.8265 8.7834 4.2904 4.0090(1.58) (2.37) (2.77) (2.47)
Domestic institutional ownership acquiror -2.1154 0.8277(-1.88) (1.19)
Size - target -0.5765 -0.7049 -1.1256 0.1207 0.0543 0.0687(-3.73) (-4.10) (-5.30) (1.05) (0.45) (0.55)
Book-to-market - target -0.7352 -0.9785 -1.3810 0.1369 0.0981 0.1413(-2.31) (-2.84) (-3.39) (0.41) (0.30) (0.40)
Investment opportunities - target -0.3324 -0.6010 -0.7965 -0.1791 -0.4220 -0.3825(-0.91) (-1.39) (-1.63) (-0.48) (-1.00) (-0.95)
Stock return - target 0.4457 0.8853 1.7627 0.3697 0.3553 0.3908(1.07) (1.84) (2.60) (0.84) (0.78) (0.85)
Return on equity - target -0.0119 -0.3259 -1.5128 -0.7603 -0.4716 -0.5386(-0.01) (-0.34) (-1.54) (-1.05) (-0.66) (-0.75)
Leverage - target -1.0224 -0.5006 -1.2409 0.4288 0.9201 0.9684(-0.96) (-0.45) (-0.88) (0.41) (0.85) (0.89)
Cash - target -0.2470 -0.3439 -1.6746 -3.9697 -3.2141 -3.2449(-0.14) (-0.19) (-1.00) (-2.59) (-2.17) (-2.12)
Size - acquirer 0.2799 0.2499 0.6059 -0.1264 -0.1794 -0.1754(2.38) (1.88) (3.39) (-1.24) (-1.73) (-1.69)
Book-to-market - acquirer 0.1580 -0.1789 0.0179 -0.2064 -0.3610 -0.3548(0.54) (-0.44) (0.04) (-0.92) (-1.41) (-1.40)
Investment opportunities - acquirer -0.1986 -0.3078 0.5553 -0.9180 -1.2189 -1.1375(-0.48) (-0.70) (1.14) (-2.61) (-3.19) (-3.08)
Stock return - acquirer 0.6001 0.3348 0.3667 -1.1568 -1.1202 -1.1599(1.19) (0.58) (0.58) (-2.82) (-2.69) (-2.82)
Return on equity - acquirer -0.2634 -0.7865 -2.1947 -2.3277 -2.3593 -2.3432(-0.41) (-1.00) (-2.16) (-2.56) (-2.24) (-2.22)
Leverage - acquirer -1.0627 -0.9424 -1.9184 0.6567 0.7447 0.5898(-0.96) (-0.79) (-1.44) (0.64) (0.68) (0.56)
Cash - acquirer -2.2708 -3.8853 -5.9591 2.8972 2.3273 2.3607(-1.19) (-1.92) (-2.60) (1.81) (1.34) (1.35)
Intra-industry M&A -0.5033 -0.7962 -1.6755 0.6706 0.6327 0.7170(-1.46) (-2.01) (-3.43) (1.83) (1.64) (1.78)
Year dummies Yes Yes Yes Yes Yes YesCountry dummies Yes Yes Yes Yes Yes YesIndustry dummies Yes Yes Yes Yes Yes YesObservations 150 150 150 159 159 159
41

Table XIAbnormal Returns Obtained by Investors Holding Stock of Firms Involved in
Mergers and Acquisitions
This table presents the average combined premiums earned in mergers and acquisitions in our sample.Panel A shows separately target and acquirer firm cumulative abnormal returns in US dollars for a windowof (-5,+5) trading days around the deal announcement day measured using as benchmark model a two-factor international market model with parameters estimates on one year of prior daily data. Panel B uses(-10,+10) trading days event window. Panel B uses (-63,+63 or delist) trading days event window. Thefirst row of each panel presents the combined returns earned by all target and acquirer firm shareholdersusing market capitalizations capitalization as weights. The second row of each panel presents the combinedreturns earned by foreign target and acquirer firm shareholders. The third row of each panel presents thecombined returns earned by the common target and acquirer firm shareholders (cross-owners). Averagesare presented separately for the sample all deals and for the sample of cross-border deals.
All M&A Deals Cross-border M&A DealsObservations Average Observations Average
Panel A: Cumulative Abnormal Return (-5,+5)All shareholders (combined premium) 654 0.0196 177 0.0182Foreign shareholders in target and acquirer 637 0.0121 176 0.0190Common shareholders in target and acquirer 408 0.0169 125 0.0256
Panel A: Cumulative Abnormal Return (-10,+10)All shareholders (combined premium) 654 0.0228 177 0.0193Foreign shareholders in target and acquirer 637 0.0167 176 0.0227Common shareholders in target and acquirer 408 0.0214 125 0.0302
Panel A: Cumulative Abnormal Return (-63,+63 or until delisting)All shareholders (combined premium) 655 0.0380 177 0.0268Foreign shareholders in target and acquirer 638 0.0246 176 0.0323Common shareholders in target and acquirer 408 0.0376 125 0.0630
42

Figure 1. Institutional Ownership and the Volume of Mergers and Acquisitionsacross Countries. This figure plots the volume of mergers and acquisitions versus the averagetotal institutional ownership from 26 countries in the 2000-2005 period.
43

Figure 2. Institutional Ownership and the Incidence of Cross-Border Mergersand Acquisitions across Countries. This figure plots the number of cross-border mergersand acquisitions deals as a percentage of the total number of deals versus the average foreigninstitutional ownership from 26 countries in the 2000-2005 period.
44

Appendix A: Country-Level Variables Definition
Variables DefinitionPanel A: Country-Level M&A Variables
Volume of M&A Annual percentage of listed firms targeted in a completed M&A deal (SDC).Cross-border M&A ratio Annual percentage of completed M&A deals relative to the total number of deals with a foreign acquirer (SDC).Cross-border M&A pair Annual number of deals in which the target is from country i and the acquirer is from country j as a percentage of the total number
of deals with target in country i (SDC).Panel B: Country-Level Institutional Ownership Variables
Total institutional ownership Holdings (end-of-year) of all institutions in stocks of country i divided by the market capitalization of country i (FactSet/LionShares).Domestic institutional ownership Holdings (end-of-year) by all institutions domiciled in the same country i in which the stock is issued as a percentage of the market
capitalization of country i (FactSet/LionShares).Foreign institutional ownership Holdings (end-of-year) by all institutions domiciled in a different country from the country i where the stock is issued as a percentage
of the market capitalization of country i (FactSet/LionShares).Cross-country institutional holding Holdings (end-of-year) by institutions from country j (acquirer firm country) in stocks of firms from country i (country of target firm)
as a percentage of market capitalization of country i (FactSet/LionShares).Panel C: Country-Level Control Variables
GDP per capita Annual gross domestic product per capita in US dollars (WDI).GDP growth Annual growth rate of gross domestic product (WDI).Common law Dummy variable that equals one when a country has an English common law origin, zero otherwise (La Porta et al. (1998)).Anti-director rights Index of the level of protection of minority shareholders (La Porta et al. (1998)).Accounting standards Index of the quality of accounting standards (La Porta et al. (1998)).Ownership concentration Average equity stake owned by the 3 largest shareholders in the 10 largest non-financial firms (La Porta et al. (1998)).Market return Average annual stock market return (Datastream).Market competition Survey-based measure of the level of competition in product markets (Global Competitiveness Report).Openness Survey-based measure of openness of the market of corporate control to foreign investors trying to acquire control of a domestic
firm (Global Competitiveness Report).Same language Dummy variable that equals one when target and acquirer countries share the same official language, zero otherwise (World Factbook).Same geographical region Dummy variable that equals one when target and acquirer countries are from the same geographical region (America, Africa, Asia,
or Europe), zero otherwise (World Factbook).Industry structure Measure of industrial structure overlap between target and acquirer firm countries, defined as the sum of the squared differences
in industry (stock market) weights between country pairs (Datastream).Bilateral trade Value of imports by country i from country j as a percentage of total imports by country (Comstat).
Panel D: Country-Level Instrumental Variables for Institutional OwnershipMSCI percentage Percentage of firms from a country with shares included in the MSCI World index (MSCI).Cross-listing percentage Percentage of firms from a country with shares cross-listed on U.S. exchanges (ordinary listings and level 2 and 3 ADRs)
(Depositary institutions and stock exchanges).Share turnover Annual stock market trading volume as a percentage of GDP (WDI).Dividend yield Annual dividend yield (value-weighted average across stocks in a country) (Datastream).Short-selling restrictions Dummy variable that equals one if there are short selling restrictions in a country (Bris et al. (2007)).Statutory dividend tax rate Annual statutory dividend tax rate (OECD).
45

Appendix B: Firm-Level Variables Definition
Variables DefinitionPanel A: M&A Deal-Level Variables
Cross-border target dummy variable Dummy variable that equals one if na M&A deal is cross-border, and zero otherwise (SDC).Success dummy variable Dummy variable that equals one if an M&A cross-border bid is successful (status completed), and zero otherwise (SDC).Full control dummy variable Dummy variable that equals one if an M&A cross-border bid is for 100% of target firm shares, and zero otherwise (SDC).Abnormal premium target Cumulative abnormal return in US dollars in na event window around the deal announcement day measured relative to a two-factor
international market model estimated using a year of prior daily data (Datastream).Intra-Industry M&A Dummy variable that equals one if acquirer and target firms are in same one-digit SIC industry (SDC).
Panel B: Firm-Level Institutional Ownership VariablesTotal institutional ownership Holdings (end-of-year) of all institutions divided by the market capitalization (FactSet/LionShares).Domestic institutional ownership Holdings (end-of-year) of all institutions domiciled in the same country in which the stock is issued as a percentage of the market
capitalization (FactSet/LionShares).Foreign institutional ownership Holdings (end-of-year) of all institutions domiciled in a different country from the where the stock is issued as a percentage of the
market capitalization (FactSet/LionShares).Panel C: Firm-Level Control Variables
Size (log) Annual (end-of-year) market capitalization in US dollars (WorldScope item 02999).Book-to-market (log) Book-to-market equity ratio defined as end-of-year market value of equity (WorldScope 02999) dividided by book value of
equity (WorldScope item 03501).Investment opportunities Two-year geometric average of annual growth rate in net sales in US dollars (WorldScope 01001).Annual stock return Annual stock return (Datastream item RI).Return-on-equity Return-on-equity (WorldScope item 08301).Leverage Ratio of total debt (WorldScope item 03255) to total assets (WorldScope item 02999).Cash Ratio of cash and short term investments (WorldScope item 02001) to total assets (WorldScope item 02999).Foreign sales Foreign net sales (WorldScope item 07101) as a proportion of total net sales (WorldScope 01001).Closely held shares Number of shares held by insiders as a proportion of the number of shares outstanding (WorldScope item 08021).Governance score Corporate governance score (ISS).
Panel D: Firm-Level Instrumental Variables for Institutional OwnershipMCSI dummy variable Dummy variable that equals one if a firm’s shares are included in the MSCI World index (MSCI).Cross-listing dummy variable Dummy variable that equals one if a firm’s shares is cross-listed on U.S. exchanges (ordinary listings and level 2 and 3 ADRs)
(Depositary institutions and stock exchanges).Share turnover Annual stock market trading volume defined as number of shares traded (Datastream item UVO) divided by number of shares
outstanding (Datastream item NOSH).Dividend yield Annual dividend yield (WorldScope item 09404).Short selling restrictions Dummy variable that equals one if there are short selling restrictions in a firm’s country (Bris et al. (2007)).Dividend tax rate Annual statutory dividend tax rate of a firm’s country (OECD).Number of tax treaties Number of dividend tax treaties of a firm’s country with all other countries (Tax Analysts).
46