sharing and communication around household energy consumption tawanna dillahunt advisor: jennifer...
TRANSCRIPT

Sharing and Communication around Household Energy Consumption
Tawanna DillahuntAdvisor: Jennifer MankoffHCI InstituteCarnegie Mellon University

U.S. households consume over 21.7% of total U.S. energy and generate over 21.1% of total U.S.
carbon emissions [Gardner, et. al, 2008]
Photo Missing

3
Low-Income Households
• 30% of U.S. households make < $30K/year [US Census, 2009]
• Spend greater percentages of income on energy than affluent households [Cooper et al., 1983]
• Median consumption almost as much as affluent households [Shui 2002]
Photo Missing

4
Opportunity
• Low-income individuals are among those more likely to live in rental housing [Belsky and Drew, 2007; McArdle, 2009]
• Renters constitute 30% of U.S. households [Current Housing Reports, 2008]
• Few studies (at the time) targeted low-income households and renters [Chetty, et. al, 2008]

5
Device Limitations
• Will household electricity monitoring devices work within the dynamics of a low-income household?
• What are the dynamics of low-income households in terms of energy consumption?

6
Previous Work

7
Qualitative Studies + Field Deployment
Study 1Energy Use in Low-Income Households [Dillahunt, et. al, Ubicomp 2009]
Study 2Conflicts Between Landlords and Tenants [Dillahunt, et. al, Ubicomp 2010]
Field deployment Sharing and Communication around Household
Energy Consumption

8
• Qualitative study to explore energy consumption in low-income households–Do prior findings generalize to this
community?–Motivations for saving energy?–Existing barriers?
• How can we enhance technology to serve low-income communities?
Study 1

9
Photo-elicitation study
[Clark-IbáÑez, 2004]– Camera– Pen and Notebook
to write about experiences
“Take pictures of objects and/or scenarios that make you think about personal energy use or anything that makes you think
about energy”
Study Design

10
• 26 participants across two locations– 15 NC participants– 11 PA participants
• Diverse payment structures- Pay energy in full- Receive stipend- Pay no energy- Receive allocation
Study Design

11
Findings• Participants received
very little feedback• Saving energy occurred
even if participants did not pay for energy (prior habits)
• Key factors leading to environmental behaviors in low-income households– External barriers– Future generations– Religious beliefs
• Conflict between landlords and tenants around energy consumption

“The faster it [energy meter] spins, the more it costs. The more energy you’re using, the higher your bill is.”
-Angela
Existing Feedback
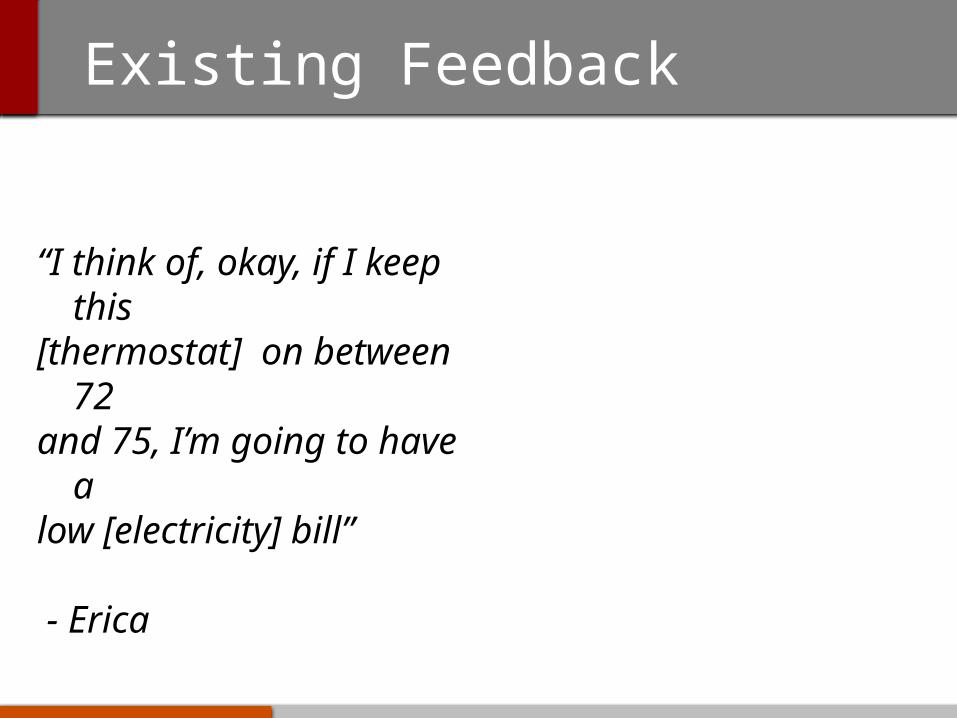
“I think of, okay, if I keep this
[thermostat] on between 72
and 75, I’m going to have a
low [electricity] bill”
- Erica
Existing Feedback

“This is what they call in our apartments ‘energysavers’. The green light is fine. The red light is what you worry about when that comes on in your
apartment.That means you’re getting alight bill because you are
over. <laughs> And it helps a lot.” - Jacqueline
Existing Feedback

15
Findings• Participants received
very little feedback• Saving energy occurred
even if participants did not pay for energy (prior habits)
• Key factors leading to environmental behaviors in low-income households– External barriers– Future generations– Religious beliefs
• Conflict between landlords and tenants around energy consumption

16
Findings• Participants received
very little feedback• Saving energy occurred
even if participants did not pay for energy (prior habits)
• Key factors leading to environmental behaviors in low-income households– External barriers– Future generations– Religious beliefs
• Conflict exists between landlords and tenants around energy consumption

External Barriers
All photos taken by: Brian
Photos Missing

18
Study 2
• Interviewed landlords to get a balanced perspective
• Story-telling and role play sessions to understand both perspectives
Photos Missing

Sources of Conflict
TENANTS 1PHOTOS +
INTERVIEWS
LANDLORDSINTERVIEWS
TENANTS 2ROLE-PLAYING
Expectations ✔
Money ✔ ✔
Power Imbalance
✔ ✔

Sources of Conflict
TENANTS 1PHOTOS +
INTERVIEWS
LANDLORDSINTERVIEWS
TENANTS 2ROLE-PLAYING
Expectations ✔
Money ✔ ✔
Power Imbalance
✔ ✔

Sources of Conflict
TENANTS 1PHOTOS +
INTERVIEWS
LANDLORDSINTERVIEWS
TENANTS 2ROLE-PLAYING
Expectations ✔
Money ✔ ✔
Power Imbalance
✔ ✔

Sources of Conflict Summary
TENANTS 1PHOTOS +
INTERVIEWS
LANDLORDSINTERVIEWS
TENANTS 2ROLE-PLAYING
Expectations ✔
Money ✔ ✔
Power Imbalance
✔ ✔

Conflict Resolution
TENANTS (1&2)PHOTOS + INTERVIEWS, ROLE-
PLAYING
LANDLORDSINTERVIEWS
Knowledge ✔ ✔
Communication/Negotiation
✔ ✔
Community Action ✔

Conflict Resolution
TENANTS (1&2)PHOTOS + INTERVIEWS, ROLE-
PLAYING
LANDLORDSINTERVIEWS
Knowledge ✔ ✔
Communication/Negotiation
✔ ✔
Community Action ✔

Conflict Resolution
TENANTS (1&2)PHOTOS + INTERVIEWS,
ROLE-PLAYING
LANDLORDS
INTERVIEWS
Knowledge ✔ ✔
Communication/Negotiation
✔ ✔
Community Action
✔

26
Conflict Resolution
STUDIES 1&2TENANTS
STUDY 2LANDLO
RDS
Knowledge ✔ ✔
Communication/Negotiation
✔ ✔
Community Action
✔

27
Solution
Sensing technologies and social computing
can play a role in conflict resolution because of their
abilities to provide new information and better
communication of information

Opportunities
• Sensing technologies produce new information
• Social technologies facilitate sharing• Both technologies influence action
Photos Missing

29
Proposed Work

30
Key Focus Factors
• Sharing led to community action• Better communication helps to
resolve energy-related issues between landlords and tenants
• Negotiation helps to resolve energy-related issues between landlords and tenants

31
Thesis Statement
Eco-visualizations designed to allow individuals tocompare their consumption with others and to actively engage around actions that affect energy consumption will:
• encourage social interaction• raise awareness of energy conservative
behaviors • help residents to negotiate energy use issues
with stakeholders (landlords, housemates, community members)

32
Research Goals
To develop a tool for supporting comparisons and social collaboration
Identify how sharing and collaboration affect energy consumption and communication within communities?
Longitudinal deployment across low-income households of real-time energy monitoring devices

33
Method
34
Speed Dating
• Flesh out usability details

35
Speed Dating Results
• Flesh out usability details

36
Website Design

37
Proposed Study
Longitudinal Deployment

38
Timing
• One year deployment• Checkpoints every 2-4 weeks

39
Thesis Statement
Eco-visualizations designed to allow individuals tocompare their consumption with others and to actively engage around actions that affect energy consumption will:
• encourage social interaction• raise awareness of energy conservative
behaviors • help residents to negotiate energy use issues
with stakeholders (landlords, housemates, community members)

40
Family vs. Community (Option 1)
Website Features Household/Stakeholder Type
Families/Internal(pc/family)
Community/External(kiosk/floor)
Comparison ✓
Social/Discussion ✓
Alerts ✓ ✓
Current Consumption
✓ ✓
Consumption History
✓ ✓
Suggested Actions ✓ ✓
41
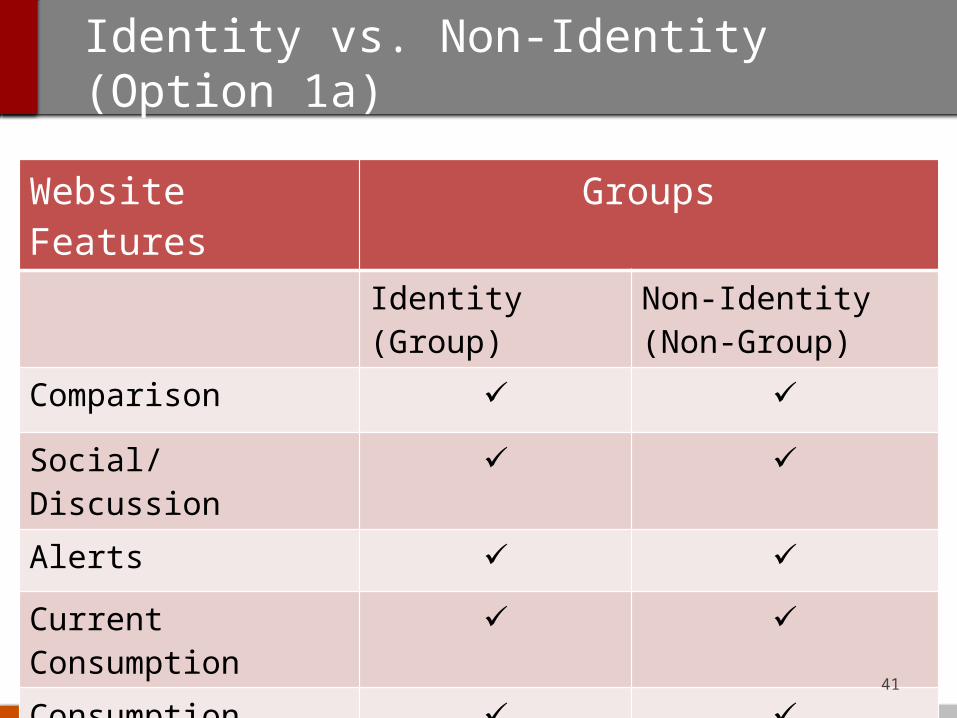
Identity vs. Non-Identity (Option 1a)
Website Features Groups
Identity (Group)
Non-Identity (Non-Group)
Comparison ✓ ✓
Social/Discussion ✓ ✓
Alerts ✓ ✓
Current Consumption
✓ ✓
Consumption History
✓ ✓
Suggested Actions ✓ ✓

42
Social vs. Non-Social (Option 2)
Website Features
Targeted Group
Single family household
Single family household
Comparison ✓
Social/Discussion ✓
Alerts ✓ ✓
Current Consumption
✓ ✓
Consumption History
✓ ✓
Suggested Actions
✓ ✓

43
Personal vs. Group Incentive (Option 3)
Website Features Household/Stakeholder Type
Group Individual
Comparison ✓ ✓
Group Incentive ✓
Individual Incentive ✓
Social/Discussion ✓ ✓
Alerts ✓ ✓
. . .

44
Quantitative Measures
• Total energy consumption each month• Number of actions “done” or committed to• Website interaction– How frequently do participants access the
kiosk/pcs?– How long do participants spend interacting with
the kiosk/their pcs?–When do participants access the kiosk/pc?
• Issues reported/issues addressed over time

45
Qualitative Measures
• Pre/Post– Environmental attitudes– Environmental awareness– Attended education event– Did you interact with household
members, neighbors, landlords about the data?

46
Main Contributions
• A tool for supporting comparison and collaboration across households
• Design recommendations for encouraging social engagement around energy consumption across multiple stakeholders
• Demonstrate the usefulness of social computing for ubiquitous computing around energy consumption
• An algorithm for predicting energy consumption based on community or individual conditions ?

47
Schedule
APR FEB MAR APR MAY JUN JUL AUG SEP OCT NOV DEC
- Sample Text
- Sample Text
- Sample Text
On time!

48
Discussion
• Feasibility• What’s more interesting (Option I or
Option II)?• What if no one interacts with the
interventions?• Do I need to add incentives?
