shear behavior of circular concrete members … behavior of circular concrete members reinforced...
TRANSCRIPT
Shear Behavior of Circular Concrete Members Reinforcedwith GFRP Bars and Spirals at Shear Span-to-Depth
Ratios between 1.5 and 3.0Ahmed H. Ali1; Hamdy M. Mohamed2; and Brahim Benmokrane3
Abstract: In the last decade, the shear strength of concrete members with rectangular cross sections reinforced with fiber-reinforced poly-mers (FRPs) has received considerable attention. Yet no research seems to have investigated circular concrete members reinforced with FRPreinforcement under shear loads. This paper presents the results of an investigation of the shear strength and behavior of six circular concretespecimens reinforced with glass-FRP (GFRP) bars and spirals. The specimens, which measured 3,000 mm in length by 500 mm in diameter,were tested under four-point bending. The test parameters included the shear span-to-depth ratio (a=d) ranging from 1.5 to 3.0 and the GFRPspiral reinforcement ratio with different spiral spacings (100, 150, and 200 mm) and spiral diameters (13 and 15 mm). As designed, thespecimens failed in shear due to GFRP spiral rupture or flexural-shear failure for the specimens with a=d > 2.5 and strut crushing combinedwith spiral rupture for the specimens with a=d < 2.5. The experimental results were compared to the current sectional models and the strut-and-tie model in codes and design guidelines as well as to the available analytical approach, which is based on the modified compression fieldtheory. The comparison indicates that the shear capacity of FRP-reinforced concrete members with circular cross sections may be determinedwith the shear design provisions developed for rectangular sections within a variable degree of conservativeness. DOI: 10.1061/(ASCE)CC.1943-5614.0000707. © 2016 American Society of Civil Engineers.
Author keywords: Circular concrete members; Shear span-to-depth ratio; Shear; Fiber-reinforced polymer (FRP) bars and spirals.
Introduction
Circular reinforced concrete (RC) members are extensively used aspiers and piles in bridges and as fender piling in marine environ-ments because they are easy to build and provide equal strength inall directions under lateral loads. These members have limited ser-vice lives and high maintenance costs when used in harsh environ-ments due to the corrosion of the steel reinforcement. In NorthAmerica, it has been estimated that the repair and replacementof piling systems costs billions of dollars annually (Benmokraneet al. 2016; Mohamed et al. 2014). In the last decade, the useof fiber-reinforced polymer (FRP) as an alternative reinforcingmaterial in RC structures has emerged as an innovative solutionto the corrosion problem [ACI 440.1R-15 (ACI 2015)]. Today,glass-FRP (GFRP) bars are becoming more attractive to theconstruction industry because they cost less than other types ofFRP materials. Moreover, the cost of GFRP bars has been droppingin recent years, primarily due to a larger market and greater com-petition. GFRP bars have been used successfully as the main
reinforcement in concrete bridges, parking garages, tunnels, andsoft-eyes (Nanni and Faza 2002; Mohamed and Benmokrane2014). Therefore, the development of reinforced concrete withGFRP bars and their application in infrastructure is gaining consid-erable interest in the civil engineering community.
Extensive research programs have been conducted to investigatethe shear behavior of concrete members reinforced with GFRP barsand stirrups with rectangular cross sections (Razaqpur and Spadea2015; Alam and Hussein 2012; Bentz et al. 2010; Ahmed et al.2010; Fico et al. 2008; El-Sayed and Benmokrane 2008; El-Sayedet al. 2006; Shehata et al. 2000; Alkhrdaji et al. 2001; Guadagniniet al. 2006; Tottori and Wakui 1993). These studies specificallyhave assessed and compared the shear strength predictions ofFRP-RC specimens with rectangular sections based on various co-des of practice. As a result, several guidelines and code standardshave been published, including design equations for assessing totalshear resistance (Vr): ACI 440.1R-15, CSA S806-12 (CSA 2012),CSA S6-14 (CSA 2014a), and the Japan Society of Civil Engineers(JSCE 1997). They all follow the traditional (Vcf þ Vsf) philoso-phy but significantly differ in the manner in which theyestimate the contributions of concrete (Vcf) and diagonal tensionreinforcement (Vsf) to the Vr. Recently, Thomas and Ramadass(2015) proposed a model to assess the shear strength of FRP-RC beams. The proposed model accounts for the compressivestrength of concrete, the bar modulus of elasticity, the longitudinalreinforcement ratio, the shear span-to-depth ratio, and the beamsize effect. The proposed model provided conservative predictions.In contrast, studies on the shear behavior of circular concrete mem-bers that can be reinforced with GFRP bars and spirals have not yetbeen introduced. Moreover, none of the preceding FRP design stan-dards have incorporated specific formulae for circular RC mem-bers. In general, FRP shear design provisions can be applied tocircular members by using an equivalent rectangular cross section.The accuracy of such an approach should, however, be assessed
1Ph.D. Candidate, Dept. of Civil Engineering, Univ. of Sherbrooke, QC,Canada J1K 2R1. E-mail: [email protected]
2Postdoctoral Fellow, Dept. of Civil Engineering, Univ. of Sherbrooke,QC, Canada J1K 2R1; Assistant Professor, Helwan Univ., Egypt. E-mail:[email protected]
3Professor of Civil Engineering and Tier-1 Canada Research Chair inAdvanced Composite Materials for Civil Structures and NSERC Chair inFRP Reinforcement for Concrete Structures, Dept. of Civil Engineering,Univ. of Sherbrooke, QC, Canada J1K 2R1 (corresponding author). E-mail:[email protected]
Note. This manuscript was submitted on November 20, 2015; approvedon February 24, 2016; published online on May 17, 2016. Discussionperiod open until October 17, 2016; separate discussions must be submittedfor individual papers. This paper is part of the Journal of Composites forConstruction, © ASCE, ISSN 1090-0268.
© ASCE 04016055-1 J. Compos. Constr.
J. Compos. Constr., 04016055
Dow
nloa
ded
from
asc
elib
rary
.org
by
Uni
vers
ite D
e Sh
erbr
ooke
on
05/3
1/16
. Cop
yrig
ht A
SCE
. For
per
sona
l use
onl
y; a
ll ri
ghts
res
erve
d.

because circular GFRP spirals may not contribute to shear strengthin the same way as rectangularly bent stirrups. That being said,limited research has been carried out during the last decade onthe shear behavior of circular steel-reinforced concrete members(Jensen et al. 2010; Khalifa and Collins 1981; Clarke and Birjandi1993; Priestley et al. 1994; Collins et al. 2008; Felthem 2004;Merta and Kolbitsch 2006; Turmo et al. 2009).
The calculation of the shear strength (Vsf) of FRP-RC membersuses the same basic relationship as steel RC members, with themain difference being the tensile strength limitation of FRP stirrupsversus steel stirrups. This limitation arises from the fact that bend-ing FRP bars to form stirrups significantly reduces tensile strengthat the bend location (Shehata et al. 2000; Ahmed et al. 2010). Re-cently, a number of studies have been carried out on the bendstrength capacity of FRP stirrups using a B.5 test method [ACI440.3R-04 (ACI 2004)], indicating that the tensile strength ofthe bent part of the FRP bar is significantly lower than that of thestraight part (Ahmed et al. 2010; Ishihara et al. 1997). Nonetheless,the behavior or a standard test method for FRP spirals under tensileaxial loading has not yet been reported.
In reinforced concrete members, the shear span-to-effective depthratio (a=d) is sometimes less than 2.5 (deep beams) or greater than2.5 (slender beams). There is a consensus that members with a=d ≥2.5 resist the applied load primarily by beam action and that archaction makes an insignificant contribution to the strength and behav-ior of such beams. Sectional models are included in the codes anddesign guidelines to predict the shear strength of slender FRP-RCmembers. Appendix I presents a summary of these models forACI 440.1R-15,CSAS806-12, CSAS6-14, and JSCE.Among thesestandards, CSAS806-12 provides a factor (ka) to bemultiplied byVcto account for arch effect enhancing shear resistance.Moreover, valu-able research has been conducted to investigate the effect of a=d onthe behavior of FRP-RC beams (Alam and Hussein 2012; Sherwoodand Noghreh Khaja 2012). In beams with low a=d values (less than2.5), shear failure is governed by strut-and-tie behavior. Therefore,the strut-and-tie model (STM) will generate more accurate predic-tions of shear strength with failure governed by crushing of a diago-nal strut (Kani et al. 1979; Collins et al. 2007, 2008). Strut-and-tiemodels are included in ACI 318-14 (ACI 2014) for steel reinforce-ment and in CSA S806-12 (CSA 2012) for FRP reinforcement usingthe same equations as CSA A23.3-14 (CSA 2014b), CSA S6-14(CSA 2014a), and AASHTO LRFD Bridge Design Specifications(AASHTO 2012) for steel reinforcement. Appendix I shows thestrut-and-tie design provisions according to CSA S806-12 (CSA2012). Recently, these provisions were assessed to predict the shearstrength of FRP-RC deep beams (Farghaly and Benmokrane 2014).The applicability of these provisions to FRP-RC members withcircular sections and low a=d values needs to be investigated.
The following sections provide details of experimental work onthe beam action versus the arch action of full-scale circular concretemembers reinforced with GFRP bars and spirals tested under shearloading. A theoretical study was also conducted to verify the ac-curacy of the available design provisions in predicting the shearstrength of specimens with a=d between 1.5 and 3.0.
Experimental Investigation
Material
GFRP bars and spirals were used to reinforce six circular concretespecimens in the longitudinal and transverse directions, respec-tively (Fig. 1). The GFRP longitudinal bars were pultruded whilethe transverse reinforcement was fabricated with a bending process
(BP Composites 2014). The reinforcement was made of continuousglass fiber rovings impregnated in a high-performance vinyl esterresin, additives, and fillers. The GFRP reinforcement had a sand-coated surface to enhance bond performance between the bars andthe surrounding concrete. High-modulus (HM) GFRP bars [CSAS807-10 Grade III (CSA 2010)] with a bar size of #6 were usedas a longitudinal reinforcement. Numbers 4 and 5 GFRP spiralswere used as shear reinforcement. Table 1 provides the guaranteedproperties of these bars and spirals as reported by the manufacturer.In addition, the bent tensile strength (ffu;bent) of the #4 and #5 barswas calculated according to ACI 440.1R-15 and CSA S6-14 designequations for the bend strength of FRP bent bars. All beam spec-imens were cast on the same day with normal weight, ready-mixedconcrete with an average compressive strength of 49.5 MPa. Theactual compressive strength was determined based on the averagetest results of 10 concrete cylinders (150 × 300 mm) tested on thesame day at the start of testing of the beam specimens.
Details of Test Specimens
A total of six full-scale circular RC specimens totally reinforcedwith GFRP bars and spirals were constructed and tested undermonotonically increasing the shear load. The test matrix was ar-ranged to assess the influence of the a=d and the GFRP spiralreinforcement ratio (spiral spacing and size) on the shear strengthand behavior of circular concrete members. Each specimen wassimply supported over a variable span and had a total length of3,000 mm, an equivalent effective flexural depth (d) of 377 mm,an equivalent effective shear depth (dv ¼ 0.9d) of 340 mm, and a
Fig. 1. GFRP bars and spirals
© ASCE 04016055-2 J. Compos. Constr.
J. Compos. Constr., 04016055
Dow
nloa
ded
from
asc
elib
rary
.org
by
Uni
vers
ite D
e Sh
erbr
ooke
on
05/3
1/16
. Cop
yrig
ht A
SCE
. For
per
sona
l use
onl
y; a
ll ri
ghts
res
erve
d.

diameter of 500 mm. The equivalent effective depths were esti-mated based on the shear provisions (Clause 5.8.2.9) in the2012 edition of the AASHTO LRFD Bridge Design Specifications.Table 2 provides the test matrix and reinforcement details of thebeam specimens. Each specimen was identified with a codeconsisting of two letters (B and S) and two numbers. The letters Band S refer to beam specimen and spiral, respectively. The firstnumber refers to the shear span-to-depth ratio of the test specimen(a=d between 1.5 and 3). The second number represents the spiralreinforcement ratio. As shown in Table 2, the effect of the GFRPspiral reinforcement ratio was investigated using #4 spirals at aspacing of 150 and 200 mm and using #5 spirals at a spacingof 150 mm. The effect of the a=d was investigated using four spec-imens with a=d equal to 1.5, 2.0, 2.6, and 3.0. These specimenswere reinforced with 10 #6 GFRP bars and #4 GFRP spirals of150 mm. Fig. 2 shows the dimensions, various configurations,and reinforcement details of the test specimens.
GFRP cages were assembled for the various beam configura-tions. The clear concrete cover was kept constant at 40 mm. Thecircular specimens were prepared for casting in very stiff Sonotube(Givesco, Montreal, Québec, Canada) concrete forms. Woodenplugs were used to seal the ends. The Sonotube concrete formswere placed in an inclined position and the concrete was cast fromthe top. External and internal vibration were used. Fig. 3 illustratesthe fabrication process before and after casting.
Table 1.Mechanical Properties of the GFRP Bars and Spirals according tothe Manufacturer
Barsize
Designateddiameter(mm)
Nominalarea(mm2)
Area byimmersion
tests(mm2)
Elastictensilemodulus(GPa)
Guaranteedtensilestrength(MPa)
GFRP bars#6 20 285 341 62.8 ffu ¼ 1,103
GFRP spirals#4 13 127 135 47.0 fftu ¼ 1,050
ffu bent ¼ 615a
ffu bent ¼ 1,019b
ffu bent ¼ 765c
#5 15 198 211 49.5 fftu ¼ 1,003
ffu bent ¼ 567a
ffu bent ¼ 962b
ffu bent ¼ 641c
Note: fftu = guaranteed tensile strength of the straight portion of the bentbars; ffu bent = guaranteed tensile strength at the bent portion.aManufacturer according to ACI 440.1R-15 (B-5 test method).bManufacturer according to ACI 440.1R-15.cManufacturer according to CSA S6-14.
Table 2. Details of Beam Specimens and Test Results
Beamidentifier
Shear reinforcement Ultimate shearVu exp (kN)
Load at failure(kN) (θ°)
Stiffness(kN=mm) Mode of
failurea=d Spiral ρfv (%) Kcr Ku
B3.0-S0.35 3.0 #4@150 mm 0.35 406 812 — 135.3 19.0 FSB2.6-S0.35 2.6 #4@150 mm 0.35 419 837 46.5 138.1 24.2 GRB2.0-S0.35 2.0 #4@150 mm 0.35 508 1,016 37.0 139.9 50.4 CSþ GRB1.5-S0.35 1.5 #4@150 mm 0.35 921 1,842 40.1 141.7 87.7 CSþ GRB2.6-S0.26 2.6 #4@200 mm 0.26 385 769 47.8 137.7 22.2 GRB2.6-S0.53 2.6 #5@150 mm 0.53 503 1,005 59.6 139.5 25.5 GR
Note: CS = compression strut failure; FS = Flexural-shear failure; GR = GRFP spiral rupture; Kcr = initial stiffness; Ku = postcracking stiffness;Vu exp ¼ 0.5 × failure load; θ° = angle of major shear crack.
Fig. 2. Dimensions and reinforcement details of the tested circularspecimens
Fig. 3. Fabrication and preparation of the load beam specimens:(a) overview of the assembled GFRP cages; (b) circular beamspecimens
© ASCE 04016055-3 J. Compos. Constr.
J. Compos. Constr., 04016055
Dow
nloa
ded
from
asc
elib
rary
.org
by
Uni
vers
ite D
e Sh
erbr
ooke
on
05/3
1/16
. Cop
yrig
ht A
SCE
. For
per
sona
l use
onl
y; a
ll ri
ghts
res
erve
d.

Instrumentation and Test Setup
Strains in the longitudinal reinforcing bars and spirals were mea-sured using electrical resistance strain gauges with gauge lengths of6 mm. In addition, three strain gauges with a gauge length of60 mm were mounted on the concrete top surface at three differentlevels (D, D/8, and D/4) at the midspan to measure compressivestrains. Beam deflection was measured with linear variable differ-ential transformer (LVDT) transducers placed at the midspan, underthe point loads, and at the midshear span. Crack widths were moni-tored at each load increment by visual inspection using a hand-heldmicrometer with an accuracy of 0.01 mm. Fig. 4 presents a typicaltest arrangement, including the external instrumentation.
The test setup was designed and fabricated at the University ofSherbrooke’s structural laboratory. The specimens were loadedunder four-point bending as shown in Fig. 4. During the test,the load was monotonically applied at a stroke-controlled rate of0.6 mm=min. An automatic data-acquisition system monitoredby a computer was used to record the readings of the LVDTs,the load cells, and the strain gauges.
Experimental Results and Discussion
Table 2 provides a summary of the beam test results, including thefailure load, ultimate shear load, initial and postcracking flexuralstiffness, and modes of failure. It should be noted that each beamwas symmetrically loaded with two concentrated loads and conse-quently, the failure load is the sum of the two concentrated loads. Thefollowing sections provide the test results, including the effect of thetest parameters on the shear strength behavior of beam specimens.
Effect of Spiral Reinforcement Ratio on Load–Deflection Behavior
Fig. 5 shows the shear behavior of three circular RC specimens(B2.6-S0.26, B2.6-S0.35, and B2.6-S0.53) that were reinforcedwith different spiral reinforcement ratios (0.26, 0.35, and 0.53, re-spectively). These specimens had a constant shear span-to-depthratio of 2.6. The spiral spacing (s) for these specimens was withinthe CSA S806-12 maximum spacing limit for transverse reinforce-ment (0.6dv cot θ or 400 mm), where dv is the effective shear depth,taken as the greater of 0.9d (flexural depth) or 0.72h (overall thick-ness). In general, the behavior of these specimens can be dividedinto two stages. In the first stage, the “prior-to-flexural-crackingstage,” all the specimens behaved similarly and approximatelylinearly. Specimen stiffness at this stage was almost identical re-gardless of spiral reinforcement ratio, representing the behavior ofthe uncracked specimen with the gross moment of inertia of theconcrete cross section. After cracking, the beams behaved nearlylinearly with reduced stiffness up to failure. This is attributed tothe linear-elastic characteristics of the GFRP reinforcement. Speci-men stiffness in this stage was insignificantly dependent on the spi-ral reinforcement ratio as well as the stiffness of the flexuralreinforcement, which was constant for the three specimens. Fig. 5and Table 2 indicate that the ultimate shear strength increased as thespiral reinforcement ratio increased. Increasing the shear reinforce-ment from 0.26 to 0.35 and 0.53 increased the shear capacity of thetested beams by 9 and 30.7%, respectively. Moreover, B2.6-S0.35and B2.6-S0.53 evidenced enhanced stiffness when the majordiagonal shear crack was compared to B2.6-S0.26, which had alower shear reinforcement ratio. This can be attributed to the higherspiral reinforcement ratio that tends to control crack opening andpropagation. Increasing the shear reinforcement ratio in B2.6-S0.35and B2.6-S0.53 helped redistribute internal stresses, forming a truss
action in which the reinforcement acts as tensile links and the con-crete acts as compression diagonals.
Effect of Shear Span-to-Depth Ratio onLoad–Deflection Behavior
Fig. 6 shows the shear behavior of four circular RC specimens(B3.0-S0.35, B2.6-S0.35, B2.0-S0.35, and B1.5-S0.35) that weretested with different shear span-to-effective depth ratios (3.0, 2.6,2.0, and 1.5, respectively). The figure shows that the a=d signifi-cantly influenced the load–deflection behavior. The figure indicatesthat the shear strength increased with reducing a=d from 3.0 to 2.0,then exhibited a considerable increment as the a=d reached 1.5. Allspecimens exhibited a nearly bilinear response up to failure exceptfor the beam with the a=d of 1.5, which had nearly linear load–deflection behavior. The specimen with the a=d of less than 2.5
Fig. 4. Test setup
Fig. 5. Load–deflection response at midspan for the effect of the spiralreinforcement ratio
© ASCE 04016055-4 J. Compos. Constr.
J. Compos. Constr., 04016055
Dow
nloa
ded
from
asc
elib
rary
.org
by
Uni
vers
ite D
e Sh
erbr
ooke
on
05/3
1/16
. Cop
yrig
ht A
SCE
. For
per
sona
l use
onl
y; a
ll ri
ghts
res
erve
d.

had no postpeak response because the failure was explosive.Evident in the figure is the initial stiffness (before cracking) andthe postcracking flexural stiffness that were significantly affectedwhen the a=d ratio decreased from 3.0 to 1.5. A noticeable en-hancement in the initial stiffness was observed as the a=d decreasedfrom 2.6 to 1.5, representing the shear behavior of the short beam.However, the initial stiffness of the beam with the a=d of 3.0 wassimilar to that of the beam with the a=d of 2.6, representing theshear behavior of the slender beam. On the other hand, decreasingthe a=d from 3.0 to 2.0 gradually increased the postcracking flexu-ral stiffness of the tested specimens then decreased the a=d from2.0 to 1.5 and exhibited a remarkable steeper load–deflection re-sponse. This is evident since the flexural stiffness of B1.5-S0.35(ku ¼ 87.65 kN=m) and B2-S0.35 (ku ¼ 50.43 kN=m) wasapproximately 3.6 and 2.0 times that of B2.6-S0.35 (ku ¼24.24 kN=m), respectively. This is attributed to the fact that, sincethe a=d was less than 2.5, their shear behavior and performancetakes the shape of an arch action.
Crack Patterns and Modes of Failure
In this study, different failure modes associated with combinedbending and shear were observed. Shear–compression failures(crushing of compression struts) accompanied by spiral rupturewere observed for specimens of with span-to-depth ratios of 2and 1.5, while diagonal shear failure accompanied by GFRP spiralrupture and flexural-shear failure were the dominant failure modesfor specimens with span-to-depth ratios of 2.6 and 3, respectively.Fig. 7 provides the crack patterns and measured values of shearcrack angles for each major crack in each specimen. In all the spec-imens, flexural cracks occurred first, irrespective of span-to-depthratio or spiral spacing. As the load increased, additional verticalcracks appeared on the beam surface followed by the formationof diagonal cracks. A diagonal tension crack is generally definedas an inclined crack in the shear span that intersects the tensilereinforcement at an angle of approximately 45°. In the specimenswith a=d equal to 3 and 2.6, these diagonal tension cracks generallyoriginated as vertical flexural cracks that extended from the tensileside of the beam to slightly the top and then became inclined andprogressed toward the loading point.
For the beam with a=d ¼ 3, with increasing the load, morecracks appeared along the shear span. After a load level corre-sponding to approximately 72% of the failure load, no more cracksappeared, and only a widening of the existing cracks was observed.Although the shear span-to-depth ratio was 3, i.e., for this beam, theshear, and tensile stresses governed the cracking pattern. In this
case, the flexural cracks under the loading point and the diagonaltension crack in the shear span simultaneously grew excessivelywide. The final failure was found to depend on the widening ofthe diagonal cracks relative to that of the flexural cracks. The testwas halted when one of the diagonal cracks near the loading pointhad opened significantly (Fig. 8), leading to excessive beam defor-mation and the GFRP tensile reinforcement reached a strain level ofover 10,000 microstrains.
For a beam with a span-to-depth ratio of 2.6, the formation ofdiagonal cracks did not immediately lead to a final collapse. In-stead, these cracks continued to develop with each increment ofthe applied load, and the ultimate loads sustained by the beam were,in general, considerably higher than the load at which the diagonaltension cracks first formed. The initial flexural cracks at the purebending moment zone remained narrow throughout the tests. Fail-ure occurred after the formation of two or more significant diagonalshear cracks near the midshear span that propagated through thecompressive zone, leading to diagonal tension failure combinedwith the rupture of the GFRP spirals. Removing the concrete coverrevealed the rupture of the GFRP spirals, with at least two of theGFRP spirals crossing a diagonal crack. The concrete cover underthe layer of longitudinal reinforcement at the bottom of the beamwas lost. The main difference in the final crack patterns of the threespecimens (a=d ¼ 2.6) was the number and spacing of the diagonalcracks that developed in the shear span: the higher the failure load,the greater the number of induced shear cracks. Fig. 9 shows thetypical failure mode of the beam specimens with the a=d of 2.6. Onthe other hand, the two specimens with a=d less than 2.5 (2 and 1.5)exhibited major cracking that developed from the loading pointto the support. Limited flexural cracks were observed. Diagonaltension cracks originated at about beam mid-depth and then pro-gressed toward the nearer concentrated load and the supports. Thiseliminated the shear flow completely and the specimens had anarch action behavior. Because the arch action developed at an earlyloading stage, the initial cracks remained narrow throughout thetests. The number of vertical and inclined cracks was significantlylower for these specimens, however, due to arch action. At a loadlevel of 45–55% of the failure load, a major diagonal crack formed,defining the concrete compression strut. Afterward, no more cracksdeveloped and only widening of the former diagonal cracks couldbe observed. The crack progression in B1.5-S0.35 and B2.0-S0.35supports the notion of the formation of a direct compressive-strutmechanism.
Fig. 10 shows the crack propagation and the final state of theshear–compression failure (crushing of the compression strut) ac-companied by spiral rupture for the beam with the a=d of 2. Inaddition, Fig. 11 shows the crack propagation and final state ofthe strut-compression failure and rupture of a spiral in the beamwith the a=d of 1.5. The failure crack extended diagonally fromthe load plate to the support plate. Failure of the two specimenswas very brittle accompanied by an explosive sound. No prematurefailure due to anchorage failure of the tension reinforcement or dueto bearing failure at the supports or at the loading points was ob-served. These figures show that the inclined crack pattern was morelinear than curvilinear, as observed in the other specimens withspan-to-depth ratios over 2. B1.5-S0.35 had only a single diagonalcrack in each shear span.
Load-Flexural Tension Strain Relationship
Fig. 12 shows the measured applied load on the specimens versusthe strain relationships for the GFRP longitudinal bars. In this fig-ure, the strain was minimal until the concrete section cracked. Thespecimens exhibited similar strain behaviors up to this stage, except
Fig. 6. Load–deflection response at midspan for the effect of the shearspan-to-depth ratio
© ASCE 04016055-5 J. Compos. Constr.
J. Compos. Constr., 04016055
Dow
nloa
ded
from
asc
elib
rary
.org
by
Uni
vers
ite D
e Sh
erbr
ooke
on
05/3
1/16
. Cop
yrig
ht A
SCE
. For
per
sona
l use
onl
y; a
ll ri
ghts
res
erve
d.

the specimens with a=d ≤ 2.5. The figure indicates that the specimenwith the higher shear span-to-depth ratio (a=d ¼ 3) exhibited crack-ing at a lower load level (79 kN) compared to the other specimens. Incontrast, the beam with the lowest a=d (1.5) evidenced a highercracking load (approximately 187 kN). After cracking, the specimenwith the lowest a=d (1.5) exhibited less bar strain than the specimenswith the higher a=d (2.0, 2.6, and 3.0) at the same load level because
the former had arch action, compared to the slender beam behaviorof the latter. This can be attributed to the arch action for the beamwith the a=d of 1.5, which is capable of transferring the load directlyto the supports. After cracking, however, in the beam with the a=d of3.0, the concrete stress was transferred to the reinforcement, whichcould result in a higher strain. The development of GFRP flexuralstrains in specimens with a=d ¼ 2.6 was similar to the beam witha=d ¼ 2.0. The maximum strains in the GFRP bars for specimenswith a constant a=d (2.6) were approximately 8,130, 7,340, and9,670 microstrains for B2.6-S0.26, B2.6-S0.35, and B2.6-S0.53, re-spectively. On the other hand, the measured strains in the GFRP barsfor specimens with different shear span-to-depth ratios (3.0, 2.6, 2.0,and 1.5) were 11,800, 7,340, 6,737, and 10,969 microstrains, respec-tively. In general, this strain at the ultimate load shows that shearfailure was not triggered by the GFRP bars rupturing.
Concrete Strains
Fig. 13 provides the measured compressive concrete strains at themidspan at three different levels from the top (D, D/8, and D/4).
Fig. 7. Crack patterns of tested specimens
Fig. 8. Failure mode of specimen B3.0-S0.35 (a=d ¼ 3)
© ASCE 04016055-6 J. Compos. Constr.
J. Compos. Constr., 04016055
Dow
nloa
ded
from
asc
elib
rary
.org
by
Uni
vers
ite D
e Sh
erbr
ooke
on
05/3
1/16
. Cop
yrig
ht A
SCE
. For
per
sona
l use
onl
y; a
ll ri
ghts
res
erve
d.

The figure indicates that prior to cracking, the concrete strains wereinsignificant in all of the specimens and ranged from 110 to 200microstrains. After cracking occurred, the strains differed almostlinearly with increasing load up to failure. As shown in Fig. 13,the maximum recorded concrete strain before failure ranged from2,840 to 3,800 microstrains. The higher strain was recorded forthe specimen with the highest a=d (3.0). The recorded strainsfor B2.6-S0.26, B2.6-S0.35, and B2.6-S0.53 were similar and
Fig. 9. Crack propagation and failure mechanism (a=d ¼ 2.6): (a and b) crack pattern at a load level of 75% of failure, front and back view; (c andd) at a load level of 85%; (e) rupture of the GFRP spirals
(a)
(b) (c)
Fig. 10.Crack propagation and failure mechanism (a=d ¼ 2): (a) crackpattern at a load level of 65% of failure; (b) crack pattern at a loadlevel of 90% of failure; (c) crushing of the compression strut and spiralrupture
(a) (b)
Fig. 11. Crack propagation and failure mechanism (a=d ¼ 1.5): (a) crack pattern at a load level of 75% of failure; (b) crushing of compression strutand rupture of spiral
Fig. 12. Load–strain relationship for longitudinal reinforcement
© ASCE 04016055-7 J. Compos. Constr.
J. Compos. Constr., 04016055
Dow
nloa
ded
from
asc
elib
rary
.org
by
Uni
vers
ite D
e Sh
erbr
ooke
on
05/3
1/16
. Cop
yrig
ht A
SCE
. For
per
sona
l use
onl
y; a
ll ri
ghts
res
erve
d.

approximately close to the limit of the concrete crushing strain of3,500 microstrains specified in the CSA standards (CSA S806-12).The propagation of cracks at the shear span implies that the majordiagonal tension–shear crack governed the failure mode of thesespecimens with no signs of crushing at the midspan. After cracking,the concrete beam with the lowest a=d (1.5) exhibited less concretestrain than the specimens with higher shear span-to-depth ratios(2.0, 2.6, and 3.0) at the same load level. Figs. 13(b and c) showthe measured concrete strains at level D/8 and D/4 for all testedspecimens. Fig. 13(b) shows that at all loading stages, the strainat level D/8 was less than that at level D, reaching no more than2,600 microstrains. This indicates that the maximum strain wasreached at the top surface of the beams. Fig. 13(c) also revealedthat the strains at level D/4 were insignificant up to the ultimatefailure load. This implies that the flexural cracks at the midspandid not penetrate into the compression zone.
Strain in GFRP Spirals
Spiral strains were measured using strain gauges attached to theGFRP spiral reinforcement at the midshear span. However, someof the strain data were unreliable because of the difficulties in meas-uring strains over the curved or twisted surface of the spirals.Besides, test observations revealed that the major diagonal crackdid not always cross the spirals at the location of the strain gauges,which means that the effective strains measured in the spirals didnot necessarily represent the maximum strain. Fig. 14 shows theapplied load–spiral strain relationship. The figure indicates that
prior to cracking, all the specimens showed the same behavior withinsignificant spiral strain. Subsequent to diagonal shear crackingand with increasing loads, the spiral strain slowly and steadily in-creased. This indicates the transfer of internal forces from the con-crete to the spirals. The figure indicates that in B1.5-S0.35, theGFRP spiral strain was activated at a higher load level than inthe other specimens. This is attributed to the arch action in thisbeam, which delayed the load transfer to the GFRP spirals. Afterformation of the major diagonal cracking at a load level of1,195 kN, however, the strain in the spiral for this beam increasedprogressively and recorded 3,135 microstrains before failure.On the other hand, the GFRP spiral in B2.6-S0.26 reached tothe highest strain level (3,300 microstrains) compared to the otherspecimens.
Effectiveness of GFRP Spirals
In this study, the effective stress of the GFRP spirals at failure (ffv)of the test specimens was assessed based on the difference betweenthe measured shear strength (Vexp) and the shear force contributedby the concrete as measured at the initiation of the first diagonalshear crack (Vcr), which is reported in Appendix I. Based on theconventional truss model, the stress in the spirals at ffv was deter-mined as follows:
ffv ¼ðVexp − VcrÞs
λ1λ2Afvdvðcot θþ cotαÞ sinα ð1Þ
where Afv = area of the GFRP spiral; s = spiral spacing; dv =effective shear depth of the beam; θ and α are, respectively, theangles of the observed diagonal shear cracks, or of the diagonalstruts, and the inclination of the spiral to the beam axis (Felthem2004) (Fig. 15); and λ1 and λ2 are two factors taking into account
(a) (b) (c)
Fig. 13. Load–strain relationship for concrete: (a) at the top concrete surface; (b) at D/4; and (c) at D/8
Fig. 14. Load–stirrup strain relationship at shear span Fig. 15. Shear across a circular section
© ASCE 04016055-8 J. Compos. Constr.
J. Compos. Constr., 04016055
Dow
nloa
ded
from
asc
elib
rary
.org
by
Uni
vers
ite D
e Sh
erbr
ooke
on
05/3
1/16
. Cop
yrig
ht A
SCE
. For
per
sona
l use
onl
y; a
ll ri
ghts
res
erve
d.
the effect of the spiral curvature (the inclination of the spiral withrespect to the transverse axis) and the spiral inclination with respectto the longitudinal axis, respectively (Turmo et al. 2009; Clarke andBirjandi 1993). In the calculation, λ1 ¼ 0.85 and λ2 ¼ 1.0 wereconsidered (Turmo et al. 2009).
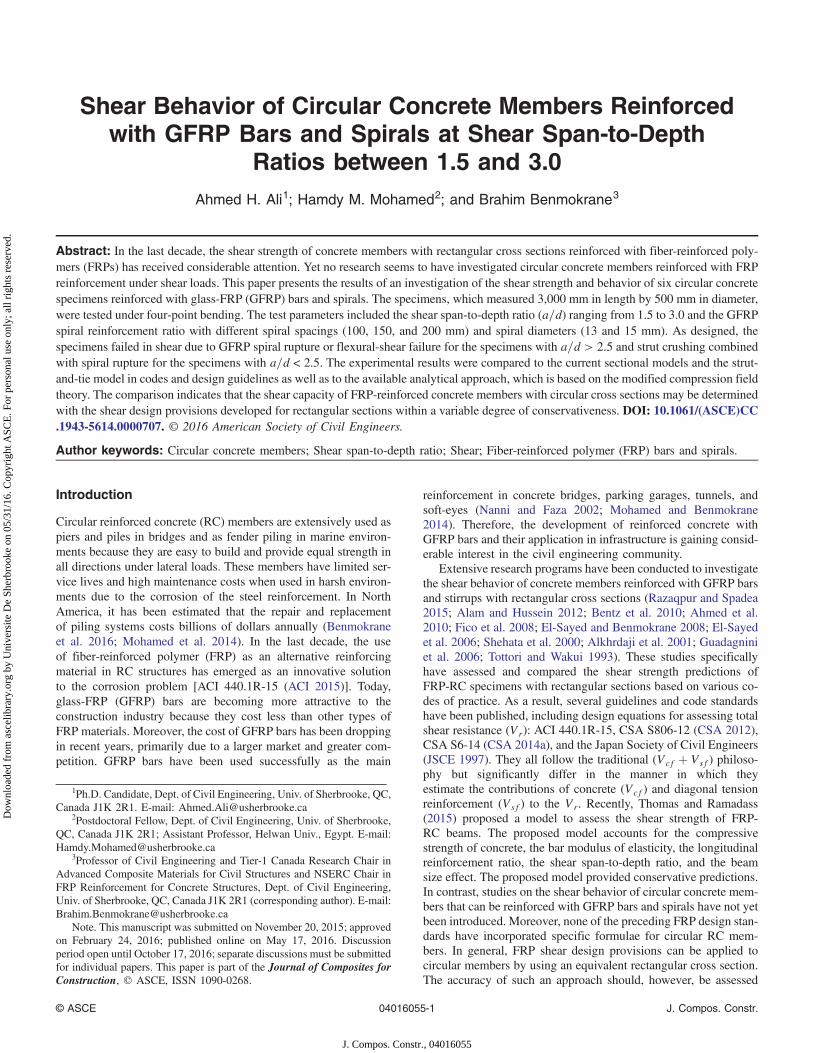
Test results of shear strength for specimens with a=d ¼ 2.6were used to assess the contribution of the GFRP spiral becausethe failure of these specimens resulted from spiral rupture. Fig. 16shows that ffv at failure normalized to the tensile strength of theGFRP straight bar. The ffv at failure ranged from 33 to 57% withan average value equal to 45% of the tensile strength of the GFRPstraight bar. The reduced strength of the spirals could be attributedto localized stress concentration due to spiral curvature, spiral in-clination, and the effect of the spiral stretching process. On theother hand, the test results indicate that the higher the GFRP spiralratio, the lower the effective spiral stress. This is attributed to thereduction in the average spiral strain, which resulted from the dis-tribution of the shear force on a larger number of spirals inter-sected by the diagonal shear cracks. Fig. 16 shows the CSAS806-12 stirrup stress and strain limits (0.4fftu and 0.005Ev, re-spectively) and the ACI 440.1R-15 strain limit (0.004Ev) com-pared to the effective spiral stress for all the specimens. Thefigure indicates that the 0.4fftu stress limit is closer to the averagetest results, and 0.005Ev provides the lower limit for the attainedstress in the spirals. Therefore, the circular specimens design usingCSA S806-12 resulted in failure governed by the 0.4fftu limit,and the capacity of the straight portions of the GFRP spirals couldnot be used. Consequently, using a value of less than 0.005Ev indesign seems unnecessarily restrictive. This agrees well with therecommendation in the recent comparative study on the shearstrength of FRP-RC members with stirrups (Razaqpur and Spadea2015).
Beam Action versus Arch Action
Shear transfer mechanisms in reinforced concrete depend onthe shear span-to-depth ratio. It has been well established that con-crete beams with a rectangular cross section can be consideredas slender or deep if a=d is greater or less than 2.0, respectively(ACI 318-14). This definition is not yet applicable to circular con-crete members. Members with large a=d are dominated by beamaction, in which the tension in the longitudinal reinforcementchanges along the length of the beam. For such beams, shearis resisted by uncracked concrete in the compression zone, theinterlocking action of aggregates, and the dowel action of the
longitudinal reinforcement. For deep beams, however, afterthe breakdown of beam action, shear force is resisted mainly byarch action. In this mechanism, the longitudinal reinforcementhas almost constant force from support to support, and the shearis carried by inclined struts (Kim and Park 1996; Mihaylovet al. 2010).
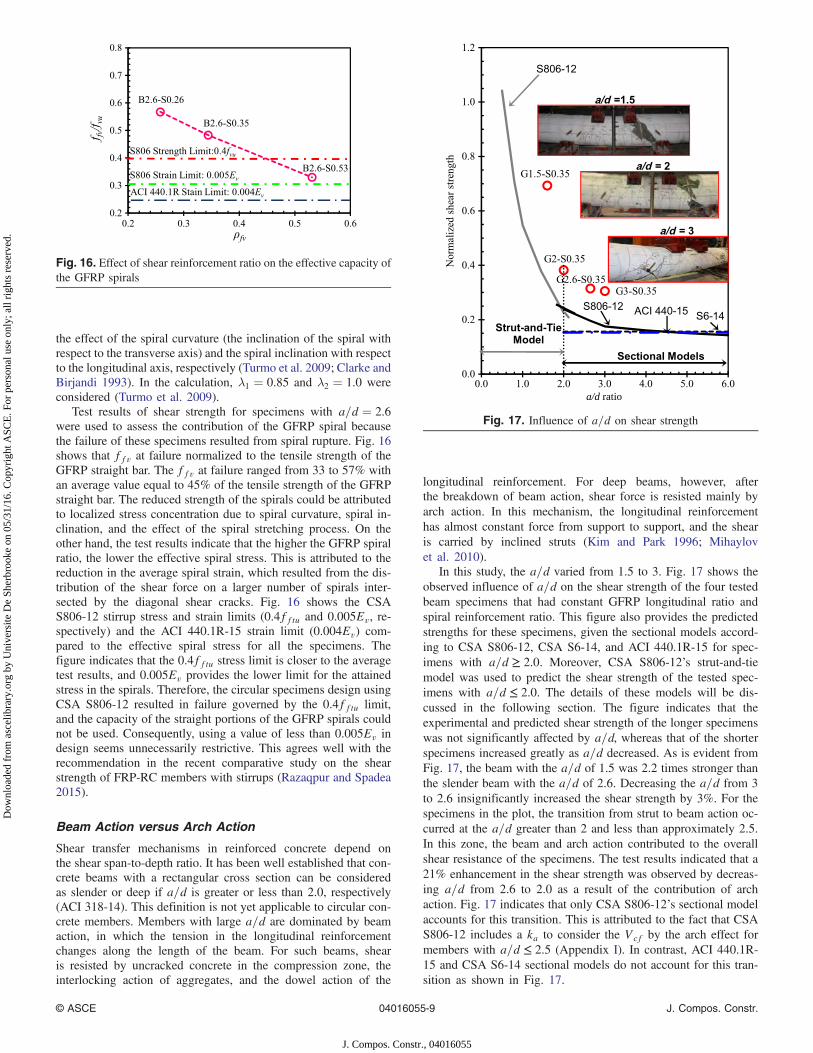
In this study, the a=d varied from 1.5 to 3. Fig. 17 shows theobserved influence of a=d on the shear strength of the four testedbeam specimens that had constant GFRP longitudinal ratio andspiral reinforcement ratio. This figure also provides the predictedstrengths for these specimens, given the sectional models accord-ing to CSA S806-12, CSA S6-14, and ACI 440.1R-15 for spec-imens with a=d ≥ 2.0. Moreover, CSA S806-12’s strut-and-tiemodel was used to predict the shear strength of the tested spec-imens with a=d ≤ 2.0. The details of these models will be dis-cussed in the following section. The figure indicates that theexperimental and predicted shear strength of the longer specimenswas not significantly affected by a=d, whereas that of the shorterspecimens increased greatly as a=d decreased. As is evident fromFig. 17, the beam with the a=d of 1.5 was 2.2 times stronger thanthe slender beam with the a=d of 2.6. Decreasing the a=d from 3to 2.6 insignificantly increased the shear strength by 3%. For thespecimens in the plot, the transition from strut to beam action oc-curred at the a=d greater than 2 and less than approximately 2.5.In this zone, the beam and arch action contributed to the overallshear resistance of the specimens. The test results indicated that a21% enhancement in the shear strength was observed by decreas-ing a=d from 2.6 to 2.0 as a result of the contribution of archaction. Fig. 17 indicates that only CSA S806-12’s sectional modelaccounts for this transition. This is attributed to the fact that CSAS806-12 includes a ka to consider the Vcf by the arch effect formembers with a=d ≤ 2.5 (Appendix I). In contrast, ACI 440.1R-15 and CSA S6-14 sectional models do not account for this tran-sition as shown in Fig. 17.
Fig. 16. Effect of shear reinforcement ratio on the effective capacity ofthe GFRP spirals
a/d ratio
Fig. 17. Influence of a=d on shear strength
© ASCE 04016055-9 J. Compos. Constr.
J. Compos. Constr., 04016055
Dow
nloa
ded
from
asc
elib
rary
.org
by
Uni
vers
ite D
e Sh
erbr
ooke
on
05/3
1/16
. Cop
yrig
ht A
SCE
. For
per
sona
l use
onl
y; a
ll ri
ghts
res
erve
d.

Theoretical Shear Strength
In this section, the available FRP shear design provisions for slen-der and deep flexural members are assessed for the nominal shearstrength of the tested circular concrete specimens with shear span-to-depth ratios between 1.5 and 3. The sectional models and strut-and-tie model were applied to determine the expected Vr for thetested specimens with a=d > 2.5 and a=d < 2.5, respectively.
Sectional Models
For flexural members with a=d > 2.5, the FRP design codes andstandards consider that a portion of the Vr, is carried by Vcf, withthe remainder Vsf carried by truss mechanisms involving trans-verse reinforcement (the reinforcement contribution). To investi-gate the effect of the GFRP spiral reinforcement ratio on thedesign equation, the shear capacities of the tested specimens wereassessed theoretically using the sectional models in ACI 440.1R-15, CSA S806-12, CSA S6-14, and JSCE (Appendix II). Thesemodels were developed based on the experimental work on therectangular concrete members reinforced with FRP bars and bentFRP stirrups. Appendix I summarizes the shear design provisionsof each code and design guideline. ACI 440.1R-15 and CSA S6-14recommend that the effective strain in FRP shear reinforcementdoes not exceed 0.004, nor should the design strength exceedthe strength of the bent portion of the stirrup (ffb). The valueof 0.004 is justified as the strain that prevents degradation ofthe aggregate interlock and the corresponding concrete shear(Priestley et al. 1994). ACI 440.1R-15, CSA S6-14, and JSCEprovide design equations for the bend capacity of the FRP stirrup,which is a function of the ratio of the bend radius (rb) to bardiameter (db). CSA S806-12 limits the maximum tensile stressin FRP shear reinforcement to be taken as the smaller of0.005Efv, 40% of the ultimate longitudinal tensile strength ofthe FRP stirrup (0.4ffu), or 1,200 MPa, irrespective of rb=db.None of the previously mentioned codes or guidelines specifi-cally address the assessment of circular elements reinforced withFRP spirals. The shear design parameters such as effective sheardepth and width and the strength and strain limitation for FRPspirals are not defined. In the calculation, the approach proposedin AASHTO LRFD Bridge Design Specifications (AASHTO 2012)has been used to estimate the effective shear area of circularmembers, where the depth (d) was taken as equal to d [Eq. (2)],then dv ¼ 0.9d, and bw was taken as the diameter of the circularcross section
d ¼ D2þDr
πð2Þ
Table 3 presents the statistical results related to the ratio be-tween the experimental and the theoretical ultimate shear force(Vexp=Vpred). The average of Vexp=Vpred is directly related to accu-racy. The analysis results indicate that the four methods investi-gated provided average ratios greater than 1.0. Table 3 indicatesthat Vexp=Vpred is higher for specimens with low shear reinforce-ment ratios than with high values. The CSA S806-12 method pro-vided the closest predictions with a mean value equal to 1.61,followed by CSA S6-14 and ACI 440.1R-15 with mean valuesequal to 1.96 and 2.02, respectively. On the other hand, the JSCEmethod greatly underestimated the shear strength of the test spec-imens with an average Vexp=Vpred closer to 3.0. This excessive levelof conservatism is relevant to the concept of calculating the FRPstirrup strain (εfv) at ultimate, which is limited to the lesser of theFRP stirrup bend strength or the value obtained from the JSCEstrain design equation. This equation provides very low strain val-ues at ultimate ranging between 0.0007 and 0.001 with an averagevalue of 0.0009. On the other hand, the analysis results indicate thatthe ACI440.1R-15, CSA S6-14, and the JSCE design equations forbend strength are not appropriate for representing the strength ofGFRP spirals. This was evident because these equations signifi-cantly overestimated the effective spiral stresses at failure. As men-tioned previously, the 0.4fftu stress limit was closer to the averagetest results, and the 0.005Ev provides the lower limit for the at-tained stress in the spirals.
On the other hand, Table 3 confirms the unsuitability of the sec-tional models in predicting the nominal shear capacities for shearspan-to-depth ratios less than 2.5, except for CSA S806-12, whichconservatively predicted the strength of specimens with a=d of 2and 1.5. As mentioned previously, this can be attributed to theincluded ka that takes arch action into consideration.
Strut-and-Tie Model
Strut-and-tie modeling is a generalization of the truss analogy, inwhich a structural continuum is transformed into a discrete trusswith compressive forces being resisted by the concrete and tensileforces by the reinforcement. The method is based on the lowerbound theorem of plasticity providing capacity less than or equalto the structure’s capacity. Over the last two decades, several re-searchers have conducted studies aimed at assessing the strengthof concrete struts for use in strut-and-tie models. Generally, the
Table 3. Predicted Shear Strength of Test Specimens
Beamidentifier
ACI 440.1R CSA S6-14 CSA S806-12 JSCE Response-2000Strut-and-tie model
CSA S806-12Proposedmethod
Vexp=Vpred Vexp=Vpred Vexp=Vpred Vexp=Vpred Vexp=Vpred Vexp=Vpred Vexp=Vpred
B3.0-S0.35 1.99 1.9 1.74 2.88 1.17 — —B2.6-S0.26 2.23 2.1 1.58 2.79 1.01 — —B2.6-S0.35 2.06 2.0 1.60 2.97 1.03 — —B2.6-S0.53 1.82 1.8 1.55 3.35 1.18 — —Average 2.02 1.96 1.61 2.99 1.09 — —SD 0.17 0.12 0.08 0.25 0.09 — —COV 8.38 6.6 5.2 8.2 8.20 — —B2.0-0.35 2.50 2.4 1.60 3.60 0.99 1.69 1.32B1.5-0.35 4.53 4.4 1.80 6.53 1.26 1.82 1.56Average 3.51 3.4 1.70 5.06 1.12 1.75 1.44SD 1.43 1.42 0.14 2.10 0.20 0.10 0.17COV 40.8 41.6 8.30 40.9 17.0 5.24 11.8
Note: COV = coefficient of variation; SD = standard deviation.
© ASCE 04016055-10 J. Compos. Constr.
J. Compos. Constr., 04016055
Dow
nloa
ded
from
asc
elib
rary
.org
by
Uni
vers
ite D
e Sh
erbr
ooke
on
05/3
1/16
. Cop
yrig
ht A
SCE
. For
per
sona
l use
onl
y; a
ll ri
ghts
res
erve
d.

approach has been to lump the effect of strut stress and strain con-ditions, reinforcement details, concrete strength, and uncertaintiesin the truss model into a single factor commonly referred to as theefficiency factor or, more recently, as the strength reduction factorfor the concrete strut. ACI 318-14 (Building Code Requirements forStructural Concrete and Commentary) and bridge design specifi-cations [AASHTO LRFD Bridge Design Specifications (AASHTO2012)], adopted the use of strut-and-tie modeling in 2002 and 1994,respectively.
Based on the lower bound theory of plasticity, the capacity of anSTM is always less than or equal to the capacity of the structureprovided that (1) the truss model is in equilibrium, (2) sufficientdeformation capacity exists to distribute forces within the assumedtruss model, and (3) stresses applied to elements do not exceed theiryield capacity. The yield capacity of a strut or node is equal to theeffective compressive strength of the concrete within the strut or atthe interface between the strut and node. A tie’s yield capacity isequal to the lesser of the reinforcement tensile strength or the forcethat causes a loss of anchorage.
Although the application of the plasticity theory to materialsof limited ductility, such as concrete, are limited in terms ofplastic idealization, current STMs successfully predict the ultimatestrength of concrete members reinforced with either steel or FRPbars (Andermatt and Lubell 2013a, b; Farghaly and Benmokrane2014; Kim et al. 2014) by adopting the concept of the effectivestrength of concrete for a strut and node in the strut-and-tie model[Hong and Ha 2012; ACI 318-14; CSA S806-12; AASHTO LRFD(AASHTO 2012)]. The plastic distribution of stresses in the con-crete requires that the tie is able to resist the concomitant tensionand allow sufficient deformation for the plastic state of stress todevelop in the concrete. In general, large deformations will not de-velop before the yielding of the steel bars. In the case of the GFRPbars, which can easily undergo a maximum strain from six to ninetimes greater than the steel’s yield strain, the concrete can easilyreach its plastic state before failure. In fact, the maximum strainin the GFRP tie may be larger than the maximum strain in the steelat failure. Consequently, the notion that the tie material experiencesplastic deformation is not essential to satisfy the lower bound theo-rem of plasticity. Moreover, arch action was reported to be moreefficient in the specimens reinforced with FRP than with steel.More bond slippage could occur with FRP reinforcement comparedto steel because the FRP was sand-coated, producing a more effi-cient arch mechanism (El-Sayed 2006; Andermatt and Lubell2010). Andermatt and Lubell (2013b) presented test data for 12large-scale deep beams with internal FRP reinforcement that con-firmed the presence of arch action. Then, a strut-and-tie modelingapproach was developed for use in predicting the capacity of FRP-reinforced deep beams through mechanic-based modifications toexisting STMs applicable to steel-reinforced concrete construction(Andermatt and Lubell 2013b). Recently, the strut-and-tie modelwas implemented in CSA S806-12 for designing FRP-RC memberswith low a=d values. This method is similar to the provisions inCSA A23.3-14 (CSA 2014b), CSA S6-14 (CSA 2014a), andAASHTO LRFD Bridge Design Specifications (AASHTO 2012)for steel reinforcement. A strength reduction factor (v ≤ 1.0) forthe strength of a concrete strut is introduced. Designing with theCSA S806-12 strut-and-tie model requires an orthogonal grid ofreinforcing bars near each face for deep flexural members. ForGFRP, the ratio of reinforcement area to gross concrete area shallnot be less than 0.004 in each direction. The spacing of thisreinforcement shall not exceed 200 mm for GFRP bars. If locatedwithin the tie, the crack control reinforcement may also be consid-ered as tie reinforcement.
The strut-and-tie model of CSA S806-12 was used to predict thenominal shear strength for the two specimens that were tested witha=d of 1.5 and 2.0 (Appendix II). The ratio and spacing of GFRPorthogonal reinforcement (longitudinal and spiral) for both speci-mens are within the CSA S806-12’s strut-and-tie design require-ments (Clause 8.5.5: crack control reinforcement). The predictedcapacity was based on the achieved stresses of (1) tensile stressof tie (longitudinal bars), (2) nodal stress at support andloading point, and (3) stress in the diagonal strut. An iterative pro-cess was conducted to determine the critical stress of the precedingthree limit stresses. Once one of those three stresses was achieved,the assumed load was considered to be the predicted ultimate loadcapacity. So, the predicted loads are representing the lower boundsolution (as the stresses on the other two items did not reach theirlimits). The lower bound theorem only requires the assumption ofa statically admissible stress field and, in that sense, the conven-tional elastic analysis satisfies the lower bound theorem. In thecase of the deep beams herein, the concrete stresses assumed tobe in the nodal zones, the upper chord, and the diagonal struts willbe achieved in GFRP-reinforced deep beams due to the large straincapacity of GFRP reinforcement. Finally, it is important to empha-size that CSA S806-12 assumes that the assumed plastic stress dis-tribution in the case of the FRP-reinforced concrete deep beamscan only be satisfied if failure is not initiated by the FRP tie(longitudinal reinforcement), and this is the case in the test resultsfor the two beams with a=d ≤ 2. Appendix I includes the strut-and-tie design equations from CSA S806-12. Moreover, Fig. 18describes the strut-and-tie model using a simple idealization of thestrut shape.
The analysis results indicate that the strut-and-tie model predic-tions (VSTM) are quite conservative for a=d < 2.5 with an averageVexp=Vpred closer to 1.75. The high degree of conservatism does notjustify the accuracy. This could be attributed to the fact that theCSA S806-12 strut-and-tie predictions do not consider the shearstrength contributed by the shear reinforcement (GFRP spirals),whereas the observed failure modes of these specimens were acombination of strut crushing and rupture of GFRP spirals. Thenominal capacities were re-estimated considering the GFRP spiralcontribution using the CSA S806-12 design equation (Appendix I)as follows:
Vr ¼ VSTM þ Vsf ð3Þ
Table 3 presents the Vexp=Vpred values for CSA S806-12 usingthe proposed design equation [Eq. (3)]. The proposed equationseems to give better predictions than the strut-and-tie equation.Table 3 indicates that Vexp=Vpred is higher for specimens with
Fig. 18. Description of the strut-and-tie model using a simple idealiza-tion of the strut shape
© ASCE 04016055-11 J. Compos. Constr.
J. Compos. Constr., 04016055
Dow
nloa
ded
from
asc
elib
rary
.org
by
Uni
vers
ite D
e Sh
erbr
ooke
on
05/3
1/16
. Cop
yrig
ht A
SCE
. For
per
sona
l use
onl
y; a
ll ri
ghts
res
erve
d.

low a=d ratios (1.5) rather than high (2). This modification yields amore reasonable estimate of the shear capacity and yet wasconservative for both specimens tested in this investigation becausethe average experimental shear strength over the predicted valuewas 1.4 with a coefficient of variation of 11.8% and a standarddeviation of 0.17 when using Eq. (3).
Shear Strength Predication Using the ModifiedComparison Field Theory
A shear model based on the modified compression field theory wasapplied with Response-2000 version 0.7.8 (R2K) software, whichcan be used to assess the shear strength of concrete cross sectionswith a wide range of geometries (Bentz 2000). Response-2000 canmake shear-strength predictions for sections that cannot be easilymodeled with such traditional methods such as circular membersand columns with spirals. Furthermore, it provides detailed outputor results, including concrete and reinforcement stresses andstrains, shear on cracks, concrete angle of principle compression,crack spacing at all layers, load deformation plots, and shear-moment interaction diagrams.
In this study, the full-member response method in Response-2000 was implemented to predict the behavior of the tested circularmembers. When the FRP spiral reinforcement was defined inResponse-2000, ffv was defined as the governing spiral stress,which was taken as 0.4ffuv. Table 3 provides the comparison be-tween the experimental and predicted values. The average value ofVexp=Vpred for specimens with a=d > 2.5 is 1.09 with a standarddeviation and a coefficient of variation equal to 0.09 and 8.2%, re-spectively. The corresponding values for specimens with a=d < 2.5were 1.12, 0.2, and 17.0, respectively. The predicted shear strengthsof the tested specimens are reasonably accurate but less conservativefor the design issue.
Fig. 19 shows the predicted shear strain distribution along theshear span at the mid-depth of the cross section of the tested spec-imens. It can be seen that the average strain over the length of shearspan is not uniform, and the strain increased linearly from the left(at support). The strain would be constant because the shear dia-gram is linear, but this was not the case due to concrete nonlinearity.The maximum shear strain at different a=d occurred at a distancefrom the support such as 0.5D, 0.71D, 0.96D, and 1.34D for spec-imens B1.5-S0.35, B2.0-S0.35, B2.6-S0.35, and B3.0-S0.35,respectively. These distances are approximately close to the mid-shear span. In addition, the results of the modified comparison fieldtheory (MCFT) analysis indicate that the higher shear strainoccurred in B1.5-S0.35 and B2.0-S0.35. This can be attributed
to tension developing in the compression chord due to the compres-sion force in the strut. Fig. 19 also shows that B2.6-S0.26, with alower shear reinforcement ratio, exhibited higher shear strain thanthe specimens with higher shear reinforcement (B2.6-S0.35 andB2.6-S0.53). This can be attributed to the fact that increasingthe spiral reinforcement ratio constrained the cracked concrete coreand enhanced the shear capacity by confining the concrete crosssection.
Conclusions
This paper presented tests that were performed to investigate theshear behavior of circular concrete members reinforced with GFRPbars and spirals. A total of six full-scale RC specimens were pre-pared to study the effect of the spiral reinforcement ratio and theshear span-to-depth ratio. Based on the experimental test resultsand analysis presented in this paper, the following conclusionscan be drawn:1. The mode of failure was mainly affected by the shear span-
to-depth ratio, rather than the GFRP spiral reinforcementratio; flexural-shear failure for specimens with a=d ¼ 3,GFRP spiral rupture shear for specimens with a=d ¼ 2.6,and strut crushing combined with spiral rupture for specimenswith a=d < 2.5.
2. The shear strength of the GFRP-RC circular specimens witha=d ≤ 2.0 was significantly dependent on arch action. In con-trast, specimens with a=d ≥ 2.5 were dominated by beamaction and the effect of a=d was insignificant.
3. For GFRP-RC circular specimens, the transition from strut tobeam action occurred at the a=d greater than 2 and less thanapproximately 2.5. In this zone, the beam and arch action con-tributed to the overall shear resistance of the beams.
4. The presence of GFRP spirals in the circular specimens en-hanced the concrete contribution after the formation of the firstshear crack. Moreover, increasing the spiral reinforcement ra-tio from 0.26 to 0.53% increased the shear resistance by 30.7%due to the spirals confining the concrete, which controls shearcracks and improves aggregate interlocking.
5. The results of this study indicate that the shear strengthincreased significantly with decreasing a=d ratio, where theshear strength increased by 21.4 and 120% with decreasinga=d by 25 and 42%, respectively.
6. While the sectional shear models in ACI 440.1R-15, CSAS806-12, CSA S6-14, and JSCE (1997) can be used to predictthe shear strength of GFRP-RC circular specimens ata=d > 2.5, these equations provided overly conservative pre-dictions. The CSA S806-12 model provided the most accuratepredictions.
7. The test results reveal that the 0.4ffuv spiral stress limit wascloser to the test results for circular specimens and that0.004Efv or 0.005Efv strain limit provides the lower limitfor the attained stress in spirals.
8. The CSA S806-12 sectional model accounts for the transitionin shear mechanism from beam to arch action for specimenswith a 2.0 ≤ a=d ≤ 2.5.
9. The CSA S806-12 strut-and-tie predictions underestimate thebeneficial effect of adding GFRP spiral for circular specimenswith the a=d < 2.0. A proposed modification was introducedto consider Vsf in the design equation.
10. Response-2000 software, which is based on the MCFT, pro-vided good predictions of the shear strength with an averagevalue of Vexp=Vpred equal to 1.09 and 1.12 for specimens witha=d > 2.5 and a=d ≤ 2.0, respectively.Fig. 19. Shear strain along the shear span by Response-2000
© ASCE 04016055-12 J. Compos. Constr.
J. Compos. Constr., 04016055
Dow
nloa
ded
from
asc
elib
rary
.org
by
Uni
vers
ite D
e Sh
erbr
ooke
on
05/3
1/16
. Cop
yrig
ht A
SCE
. For
per
sona
l use
onl
y; a
ll ri
ghts
res
erve
d.
Appendix I. Shear Design Provisions
ACI 440.1R-15
Vcf ¼ ð2=5Þkffiffiffiffiffif 0c
pbwd ð4Þ
Vsf ¼ ðAfvffvd=sÞ sinα ð5Þ
k ¼ffiffiffiffiffiffiffiffiffiffiffiffiffiffiffiffiffiffiffiffiffiffiffiffiffiffiffiffiffiffiffiffiffi2ρfnf þ ðρfnfÞ2
q− ρfnf ð6Þ
ffv ¼ 0.004Efv ≤ ffu bent ð7Þ
ffu bent ¼ ð0.05rb=db þ 0.3Þffu ≤ ffu ð8Þ
CSA S806-12
Vcf ¼ 0.05λϕcKmKrðf 0cÞ1=3bwdv ð9Þ
Vsf ¼ ðϕfAfvffvdv=sÞ cot θ ð10Þ
Vr ¼ Vcf þ Vsf ≤ 0.22ϕcf 0cbwdv ð11Þ
km ¼ffiffiffiffiffiffiffiffiffiffiffiffiffiffiffiffiffiffiffiffiffiVf · d=Mf
q≤ 1.0 ð12Þ
kr ¼ 1þ ðEfρfÞ1=3 ð13Þ
ks ¼ 750=ð450þ dÞ ≤ 1.0 ð14Þ
2.5 ≥ ka ¼ 2.5=ðMf=VfdÞ ≥ 1.0 ð15Þ
ffv ¼ 0.005Ef ≤ 0.4ffu ð16Þ
θ ¼ 30þ 7,000εx ð17Þ
For dv = geater value of 0.72D or 0.9dCSA S6-14
Vcf ¼ 2.5
�0.4
ð1þ 1,500εxÞ·
1,300
ð1,000þ szeÞ�fcrbwdv ð18Þ
Vsf ¼ ϕfAfvffvdvðcot θþ cotαÞ sinα=s ð19Þ
ffv ¼ 0.004Efv ≤ ffu bent ð20Þ
ffu bent ¼ ð0.05rb=db þ 0.3Þffu=1.5 ð21Þ
εx ¼ðMf=dvÞ þ Vf þ 0.5Nf
2ðEfAfÞ≤ 0.003 ð22Þ
sze ¼ 300 mm
θ ¼ ð30þ 7,000εxÞ�0.88þ sze
2,500
�ð23Þ
For dv = geater value of 0.72D or 0.9d
JSCE (1997)
Vcf ¼ βdβpβnfvcdbwd=γb ð24Þ
Vsf ¼ ½AfvEfvεfvðsinαþ cosαÞ=s�z=γb ð25Þ
εfv ¼ 0.0001
ffiffiffiffiffiffiffiffiffiffiffiffiffiffiffiffiffiffiffiffiffiffiffiffiffiffiffiffiffiffiffiffiffiffiffiffiffiffiffiffiffiffiffiffiffiffiffiffi�h300
�−1=10· f 0
cd
ρfEf
ρfvEfv
sð26Þ
Efvεfv ≤ ffu bent
ffu bent ¼ ð0.05rb=db þ 0.3Þffu=1.3 ð27Þ
fvcd ¼ 0.2ðf 0cÞ1=3 ≤ 0.72 N=mm2 ð28Þ
βd ¼ ð1,000=dÞ1=4 ≤ 1.5 ð29Þ
βp ¼ ð100ρfEf=EsÞ1=3 ≤ 1.5 ð30Þ
βn ¼ 1þMo=Md ≤ 2 for N 0d ≥ 0 ð31Þ
βn ¼ 1þ 2Mo=Md ≥ 0 for N 0d < 0 ð32Þ
Strut-and-tie model, CSA S806-12
fcu ¼ νf 0c ≤ 0.85f 0
c ð33Þ
Strut force ¼ ϕcfcuAcs ð34Þ
ν ¼ 1=0.8þ 170ε1 ð35Þ
ε1 ¼ εf þ ðεf þ 0.002Þcot2θs ð36Þ
Acs ¼ Wst · b ð37Þ
Wst ¼ ha cos θs þ lb sin θs ð38Þ
Appendix II. Shear Design Example(Beam B2.6-S0.35)
f 0c ¼ 49.5MPa, Ef ¼ 62.8GPa, Efv ¼ 47 GPa, s ¼ 150 mm, D ¼
500 mm, Afv ¼ 2×127¼ 254mm2, rb ¼ 210mm, db ¼ 12.7 mm,ffu ¼ 1,050 MPa (shear reinforcement), Ec ¼ 31.63 GPa, λ ¼∅c ¼ ∅f ¼ 1.0
d ¼ ðD=2Þ þ ðDr=πÞ ¼ ð500=2Þ þ ð397.3=3.14Þ ¼ 377 mm
ACI 440.1R-15
ρf ¼ Afrp
bxd¼ 5 × 285
500 × 377¼ 0.00756
nf ¼ Ef
Ec¼ 62.8
31.63¼ 1.98
k ¼ffiffiffiffiffiffiffiffiffiffiffiffiffiffiffiffiffiffiffiffiffiffiffiffiffiffiffiffiffiffiffiffiffi2ρfnf þ ðρfnfÞ2
q− ρfnf
¼ffiffiffiffiffiffiffiffiffiffiffiffiffiffiffiffiffiffiffiffiffiffiffiffiffiffiffiffiffiffiffiffiffiffiffiffiffiffiffiffiffiffiffiffiffiffiffiffiffi2ð0.01497Þ þ ð0.01497Þ2
q− 0.01497 ¼ 0.158
© ASCE 04016055-13 J. Compos. Constr.
J. Compos. Constr., 04016055
Dow
nloa
ded
from
asc
elib
rary
.org
by
Uni
vers
ite D
e Sh
erbr
ooke
on
05/3
1/16
. Cop
yrig
ht A
SCE
. For
per
sona
l use
onl
y; a
ll ri
ghts
res
erve
d.
Vcf ¼ ð2=5Þkffiffiffiffiffif 0c
pbwd
¼ ð2=5Þ × 0.158 ×ffiffiffiffiffiffiffiffiffi49.5
p× 500 × 377=1,000 ¼ 83.81 kN
ffu bent ¼ ð0.05rb=db þ 0.3Þffu¼ ð0.05 × 210=12.7þ 0.3Þ × 1,050 ¼ 1,183 MPa > ffu
¼ 1,050 MPa
Take ffu bent ¼ ffu ¼ 1,050 MPa
ffv ¼ 0.004Efv ¼ 0.004 × 47,000 ¼ 188 MPa ≤ ffu bent
Vsf ¼ ðAfvffvd=sÞ sinα ¼ ð254 × 188 × 377=150Þ sin 80.3¼ 118,265 N ¼ 118.3 kN
Vpred ¼ Vcf þ Vsf ¼ 83.81þ 118.27 ¼ 202.1 kN
CSA S806-12
km ¼ffiffiffiffiffiffiffiffiffiffiffiffiffiffiffiffiffiffiffiffiffiVf · d=Mf
q¼
ffiffiffiffiffiffiffiffid=a
p¼
ffiffiffiffiffiffiffiffiffiffiffiffiffiffiffiffiffi377=980
p¼ 0.62 ≤ 1.0
kr ¼ 1þ ðEfρfÞ1=3 ¼ 1þ ð62.8 × 1000 × 0.00756Þ1=3 ¼ 8.80
For dv = greater value of 0.72D or 0.9d ¼ 360 mm
Asmin ¼ 0.07ffiffiffiffiffif 0c
p bws0.4ffu
¼ 392.9 mm2
ks ¼ 750=ð450þ dÞ ¼ 750=ð450þ 377Þ ¼ 0.907 ≤ 1.0
Vcf ¼ 0.05λϕcKmKrðf 0cÞ1=3bwdvKs
¼ 0.05 × 1 × 1 × 0.62 × 8.80 × ð49.5Þ1=3× 500 × 360 × 0.907=1000 ¼ 163.7 kN
0.22ffiffiffiffiffif 0c
pbwdv ¼ 291.77 kN ≥ Vcf ≥ 0.11
ffiffiffiffiffif 0c
pbwdv ¼ 146 kN ok
Vsf ¼ ðϕfAfvffvdv=sÞ cot θ
ffv ¼ 0.005Efv ¼ 0.005 × 47,000 ¼ 235 MPa ≤ 0.4ffu
εx ¼Vfða=dþ 1Þ
2EfAf¼ 0.0037
θ ¼ 30þ 7,000εx ¼ 30þ 7,000 × 0.0037 ¼ 55.9°
Vsf ¼ ð1 × 254 × 235 × 360=150Þ cot 55.9 ¼ 97 kN
Vpred ¼ Vcf þ Vsf ¼ 163.7þ 96.99 ¼ 261 kN
CSA S6-14
Vcf ¼ 2.5
�0.4
ð1þ 1,500εxÞ·
1,300
ð1,000þ szeÞ�fcrbwdv
fcr ¼ 0.4ffiffiffiffiffiffiffiffiffi49.5
p¼ 2.84 MPa
sze ¼ 300 mm
εx ¼Vfða=dþ 1Þ
2EfAf¼ 0.003
Vcf ¼ 2.5
�0.4
ð1þ 1,500 × 0.003Þ ·1300
ð1,000þ 300Þ�2.814
× 500 × 360=1,000 ¼ 92.1 kN
θ ¼ ð30þ 7,000εxÞð0.88þ sze=2,500Þ¼ ð30þ 7,000 × 0.003Þð0.88þ 300=2,500Þ ¼ 50°
Vsf ¼ ϕfAfvffvdvðcot θþ cotαÞ sinα=s¼ 1 × 254 × 188 × 360ðcot 50þ cot 80.3Þ sin 80.3=150¼ 114.3 MPa
Vpred ¼ Vcf þ Vsf ¼ 92.06þ 114.3 ¼ 206 kN
Acknowledgments
The authors would like to express their special thanks and gratitudeto the Natural Science and Engineering Research Council ofCanada (NSERC), NSERC and Industry Research Chair in Inno-vative FRP Reinforcement for Concrete Structures and the Fondsde la recherche du Quebec–Nature et Technologie (FRQ-NT) fortheir financial support and for the technical help provided bythe staff of the structural lab of the Department of Civil Engineeringat the University of Sherbrooke.
Notation
The following symbols are used in this paper:Acs = effective cross-sectional area of strut (mm2);Af = total cross-sectional area of longitudinal tension
reinforcement (mm2);Afv = total cross-sectional area of spiral reinforcement (mm2);bw = beam width (mm);D = total diameter of circular member (mm);Dr = diameter of the circle passing through the centers of the
longitudinal reinforcement (mm);d = effective depth of tensile reinforcement (mm);db = bar diameter (mm);dv = effective shear depth (mm);Ef = modulus of elasticity of FRP reinforcing bars (MPa);Efv = modulus of elasticity of FRP spirals (MPa);Es = modulus of elasticity of steel reinforcing bars (MPa);f 0c = specified compressive strength of concrete (MPa);
fcr = cracking strength of concrete (MPa);fcu = compressive stress in struts (MPa);ffu = tensile strength of straight portion of spirals (MPa);
ffu bent = strength of bent portion of FRP bar (MPa);ffv = stress in FRP spirals (MPa);
f 0mcd = design compressive strength of concrete allowing for
size effect (MPa);
k =ffiffiffiffiffiffiffiffiffiffiffiffiffiffiffiffiffiffiffiffiffiffiffiffiffiffiffiffiffiffiffiffiffi2ρfnf þ ðρfnfÞ2
q− ρfnf;
Md = design bending moment (N · mm);Mf = factored moment (N · mm);Mo = decompression moment (N · mm);N 0
d = design axial force (N);
© ASCE 04016055-14 J. Compos. Constr.
J. Compos. Constr., 04016055
Dow
nloa
ded
from
asc
elib
rary
.org
by
Uni
vers
ite D
e Sh
erbr
ooke
on
05/3
1/16
. Cop
yrig
ht A
SCE
. For
per
sona
l use
onl
y; a
ll ri
ghts
res
erve
d.

Nf = factored axial force (N);nf = ratio of modulus of elasticity of reinforcing bars to
modulus of elasticity of concrete;rb = internal bend radius of the FRP spirals (mm);S = spacing of spirals (mm);
Sze = effective crack spacing for members without stirrups;Vcf = FRP concrete shear strength (N);Vcr = first diagonal shear crack (N);Vexp = experimental shear strength (N);Vf = factored shear load (N);
Vpred = predicted shear strength (N);Vsf = spirals shear strength (N);
z = distance between points of action of tensile andcompressive resultant forces; equal to d=1.15 (mm);
α = angle of inclination of the spiral (in degrees);γb = safety factor (is taken as 1.3);εf = tensile strain in the tie bar located closest to the tension
face of the beam and inclined at θs to the strut;εx = longitudinal strain at midheight of the cross section;θ = angle of inclination of the principle diagonal
compressive stress (in degrees);θs = the smallest angle between the strut and the adjoining
ties;λ = factor accounting for concrete density;λ1 = effectiveness factor for circular section (is taken as
0.85);λ2 = factor accounting for spiral reinforcement (is taken as
1.0);λ3 = factor accounting for manufacturing of spirals (is taken
0.9);ρf = FRP longitudinal reinforcement ratio;ϕc = resistance factor for concrete; andϕf = resistance factor for FRP reinforcement.
References
AASHTO. (2012). AASHTO LRFD bridge design guide specifications,Washington, DC.
ACI (American Concrete Institute). (2004). “Guide test methods for fiber-reinforced polymers (FRPs) for reinforcing or strengthening concretestructures.” ACI 440.3R-04, Farmington Hills, MI.
ACI (American Concrete Institute). (2014). “Building code requirementsfor structural concrete and commentary.” ACI 318-14, Farmington Hills,MI.
ACI (American Concrete Institute). (2015). “Guide for the design and con-struction of structural concrete reinforced with fiber-reinforced polymer(FRP) bars.” ACI 440.1R-15, Farmington Hills, MI.
Ahmed, E. A., El-Salakawy, E. F., and Benmokrane, B. (2010). “Perfor-mance evaluation of glass fiber-reinforced polymer shear reinforcementfor concrete beams.” ACI Struct. J., 107(1), 53–62.
Alam, M., and Hussein, A. (2012). “Effect of member depth on shearstrength of high-strength fiber-reinforced polymer-reinforced concretebeams.” J. Compos. Constr., 10.1061/(ASCE)CC.1943-5614.0000248,119–126.
Alkhrdaji, T., Wideman, M., Belarbi, A., and Nanni, A. (2001). Shearstrength of RC beams and slabs, J. Figueiras, L. Juvandes, and R. Faria,eds., A. A. Balkema Publishers, Netherlands, 409–414.
Andermatt, M. F., and Lubell, A. S. (2010). “Concrete deep beam rein-forced with internal FRP.” Structural Engineering Rep. No. 291, Dept.of Civil Engineering, Univ. of Alberta, Edmonton, AB, Canada.
Andermatt, M. F., and Lubell, A. S. (2013a). “Behavior of concrete deepbeams reinforced with internal fiber-reinforced polymer—Experimentalstudy.” ACI Struct. J., 110(4), 585–594.
Andermatt, M. F., and Lubell, A. S. (2013b). “Strength modeling of con-crete deep beams reinforced with internal fiber-reinforced polymer.”ACI Struct. J., 110(4), 595–605.
Benmokrane, B., Ali, A. H., Mohamed, H. M., Robert, M., and ElSafty, A.(2016). “Durability performance and service life of CFCC tendonsexposed to elevated temperature and alkaline environment.” J. Compos.Constr., 04015043.
Bentz, E. C. (2000). “Sectional analysis of reinforced concrete members.”Ph.D. thesis, Dept. of Civil Engineering, Univ. of Toronto, Toronto.
Bentz, E. C., Massam, L., and Collins, M. P. (2010). “Shear strength oflarge concrete members with FRP reinforcement.” J. Compos. Constr.,10.1061/(ASCE)CC.1943-5614.0000108, 637–646.
BP Composites. (2014). “Product technical specifications.” Edmonton, AB,Canada.
Clarke, J. L., and Birjandi, F. K. (1993). “The behaviour of reinforced con-crete circular section in shear.” J. Struct. Eng., 71(5), 73–78, 81.
Collins, M. P., Bentz, E. C., and Sherwood, E. G. (2008). “Where is shearreinforcement required? A review of research results and design proce-dures.” ACI Struct. J., 105(6), 590–600.
Collins, M. P., Bentz, E. C., Sherwood, E. G., and Xie, L. (2007). “Anadequate theory for the shear strength of reinforced concrete structures.”Morley Symp. on Concrete Plasticity and its Applications, Univ. ofCambridge, Cambridge, U.K., 75–93.
CSA. (Canadian Standards Association). (2010). “Specification for fibre-reinforced polymers.” CAN/CSA S807-10, Rexdale, ON, Canada.
CSA. (Canadian Standards Association). (2012). “Design and constructionof building components with fibre-reinforced polymers.” CAN/CSAS806-12, Rexdale, ON, Canada.
CSA. (Canadian Standards Association). (2014a). “Canadian highwaybridge design code.” CAN/CSA S6-14, Rexdale, ON, Canada.
CSA. (Canadian Standards Association). (2014b). “Design of concretestructures for buildings.” CAN/CSA A23.3-04, Rexdale, ON, Canada.
El-Sayed, A. K. (2006). “Concrete contribution to the shear resistance ofFRP-reinforced concrete beams.” Ph.D. dissertation, Univ. de Sherbrooke,QC, Canada.
El-Sayed, A. K., and Benmokrane, B. (2008). “Evaluation of the newCanadian highway bridge design code shear provisions for concretebeams with fiber-reinforced polymer reinforcement.” Can. J. Civ. Eng.,35(6), 609–623.
El-Sayed, A. K., El-Salakawy, E. F., and Benmokrane, B. (2006). “Shearstrength of FRP-reinforced concrete beams without transversereinforcement.” ACI Struct. J., 103(2), 235–243.
Farghaly, A., and Benmokrane, B. (2014). “Shear behavior ofFRP-reinforced concrete deep beams without web reinforcement.”J. Compos. Constr., 10.1061/(ASCE)CC.1943-5614.0000385, 04013015.
Felthem, I. (2004). “Shear in reinforced concrete piles and circularcolumns.” Struct. Eng., 82(11), 27–31.
Fico, R., Prota, A., and Manfredi, G., (2008). “Assessment of eurocode-likedesign equations for the shear capacity of FRP RC members.” Compos.Eng. Part B, 39(5), 792–806.
Guadagnini, M., Pilakoutas, K., and Waldron, P. (2006). “Shear resistanceof FRP RC beams: Experimental study.” J. Compos. Constr., 10.1061/(ASCE)1090-0268(2006)10:6(464), 464–473.
Hong, S., and Ha, T. (2012). “Effective capacity of diagonal strut for shearstrength of reinforced concrete beams without shear reinforcement.”ACI Struct. J., 109(2), 139–148.
Ishihara, K., Obara, T., Sato, Y., Ueda, T., and Kakuta, Y. (1997). “Evalu-ation of ultimate strength of FRP rods at bent-up portion.” Proc.,3rd Int. Symp. on Nonmetallic (FRP) Reinforcement for ConcreteStructures, Vol. 2, Japan Concrete Institute (JCI), Sapporo, Japan,27–34.
Jensen, U. G., Hoang, L. C., Joergensen, H. B., and Fabrin, L. S. (2010).“Shear strength of heavily reinforced concrete members with circularcross section.” J. Eng. Struct., 32(3), 617–626.
JSCE (Japan Society of Civil Engineers). (1997). “Recommendation fordesign and construction of concrete structures using continuous fiberreinforcing materials.” Tokyo.
Kani, M. W., Huggins, M. W., andWittkopp, R. R. (1979). Kani on shear inreinforced concrete, University of Toronto Press, Toronto.
Khalifa, J. U., and Collins, M. P. (1981). “Circular reinforced concretemembers subjected to shear.” Dept. of Civil Engineering, Univ. ofToronto, Toronto.
© ASCE 04016055-15 J. Compos. Constr.
J. Compos. Constr., 04016055
Dow
nloa
ded
from
asc
elib
rary
.org
by
Uni
vers
ite D
e Sh
erbr
ooke
on
05/3
1/16
. Cop
yrig
ht A
SCE
. For
per
sona
l use
onl
y; a
ll ri
ghts
res
erve
d.

Kim, D. J., Lee, J., and Lee, Y. H. (2014). “Effectiveness factor of strut-and-tie model for concrete deep beams reinforced with FRP rebars.”Compos. Part B, 56, 117–125.
Kim, J. K., and Park, Y. D. (1996). “Prediction of shear strength ofreinforced concrete beams without web reinforcement.” ACI Mater.J., 93(3), 213–222.
Merta, I., and Kolbitsch, A. (2006). “Shear area of RC circular cross sectionmembers.” 31st Conf. on our World in Concrete and Structures,Concrete Institute, CI-Premier, Singapore.
Mihaylov, B. I., Bentz, E. C., and Collins, M. P. (2010). “Behavior of largedeep beams subjected to monotonic and reversed cyclic shear.” ACIStruct. J., 107(6), 726–734.
Mohamed, H. M., Afifi, M. Z., and Benmokrane, B. (2014). “Performanceevaluation of concrete columns reinforced longitudinally with FRP barsand confined with FRP hoops and spirals under axial load.” J. BridgeEng., 10.1061/(ASCE)BE.1943-5592.0000590, 04014020.
Mohamed, H. M., and Benmokrane, B. (2014). “Design and performanceof reinforced concrete water chlorination tank totally reinforced withGFRP bars: Case study.” J. Compos. Constr., 10.1061/(ASCE)CC.1943-5614.0000429, 05013001.
Nanni, A., and Faza, S. (2002). “Designing and constructing with FRP bars:An emerging technology.” ACI Concr. Int., 24(11), 53–58.
Priestley, M. J. N., Verma, R., and Xiao, Y. (1994). “Seismic shear strengthof reinforced concrete columns.” J. Struct. Eng., 10.1061/(ASCE)0733-9445(1994)120:8(2310), 2310–2329.
Razaqpur, A., and Spadea, S. (2015). “Shear strength of FRP reinforcedconcrete members with stirrups.” J. Compos. Constr., 10.1061/(ASCE)CC.1943-5614.0000483, 04014025.
Response-2000 version 0.7.8 [Computer software]. Univ. of Toronto,Toronto, ⟨http://www.ecf.utoronto.ca/~bentz/r2k.htm⟩.
Shehata, E., Morphy, R., and Rizkalla, S. (2000). “Fibre reinforced polymershear reinforcement for concrete members: Behaviour and designguidelines.” Can. J. Civ. Eng., 27(5), 859–872.
Sherwood, E. G., and Noghreh Khaja, M. (2012). “The strain effect in FRP-reinforced structures.” 6th Conf. in Advanced Composite Materials inBridges and Structures (ACMBS-VI), ISIS Canada Network Associa-tion, Queen’s Univ., Kingston, ON, Canada.
Thomas, J., and Ramadass, S. (2015). “Design for shear strength of con-crete beams longitudinally reinforced with GFRP bars.” Struct. Eng.Mech., 53(1), 41–55.
Tottori, S., and Wakui, H. (1993). “Shear capacity of RC and PC beamsusing FRP reinforcement.” ACI Struct. J., 138, 615–632.
Turmo, J., Ramos, G., and Aparicio, A. C. (2009). “Shear truss analogy forconcrete members of solid and hollow circular cross section.” J. Eng.Struct., 31(2), 455–465.
© ASCE 04016055-16 J. Compos. Constr.
J. Compos. Constr., 04016055
Dow
nloa
ded
from
asc
elib
rary
.org
by
Uni
vers
ite D
e Sh
erbr
ooke
on
05/3
1/16
. Cop
yrig
ht A
SCE
. For
per
sona
l use
onl
y; a
ll ri
ghts
res
erve
d.