shear behavior of high strength concrete · pdf fileshear behavior of high strength concrete...
TRANSCRIPT
- Technical Paper -
SHEAR BEHAVIOR OF HIGH STRENGTH CONCRETE BEAMS
S.V.T. Janaka PERERA*1, Hiroshi MUTSUYOSHI *2, Ryosuke TAKEDA*3, and Shingo ASAMOTO*4
ABSTRACT High strength concrete (HSC) over 100 N/mm2 beams have led to some concerns about their shear capacity because it produces high brittleness, smooth failure surface, and high early age shrinkage. In this study five HSC beams without shear reinforcement were tested. Test results indicated that the surface roughness of the specimen with concrete strength 138 N/mm2 was 10% lower than the specimen with concrete strength 52 N/mm2. Also the normalized shear strength of HSC beams was more dependent on the brittleness of the concrete than the roughness index, or the shrinkage. Keywords: brittleness, concrete, roughness, shear strength, shrinkage
1. INTRODUCTION High-strength concrete (HSC) is being increasingly used in buildings and bridges because it enables the use of smaller cross-sections, longer spans, reduction in girder height and improved durability [1]. Presently the target compressive strength of concrete easily exceeds 100 N/mm2. However, the diagonal shear capacity of HSC beams does not increase as expected with the increase in the compressive strength of concrete [2]. Also, an increase in the concrete compressive strength produces an increase in its brittleness, smoothness of shear failure surface, and shrinkage due to self-desiccation at early ages. These limitations have led to some concerns about diagonal shear capacity of HSC beams. The diagonal shear force in reinforced concrete (RC) members is transferred in various ways. After development of flexural cracks, shear force acting on a cracked section is carried by: 1) the shear resistance of un-cracked concrete in the compression zone; 2) the interlocking action of aggregates along the rough concrete surfaces on each side of the crack; and 3) the dowel action of the longitudinal reinforcement as shown in Fig.1. For rectangular beams, approximately 53-90% of the vertical shear is carried by aggregate interlocking and un-cracked concrete in the compression zone [3]. According to past studies the effect of HSC on shear transfer mechanism is as follows. The shear resistance of un-cracked concrete in the compression zone is reduced due to the brittleness of HSC [4]. The crack surface of HSC beams is relatively smoother than normal strength concrete (NSC) because cracks penetrate through aggregates. This smooth crack surface reduces the aggregate interlock and the shear strength of HSC beams [2]. Until now, little previous work has attempted to quantitatively evaluate the
roughness of concrete fracture surfaces. Also, early age shrinkage causes deterioration in shear strength at diagonal cracking of reinforced HSC beams. Maruyama et al. [5] detected cracking around reinforcing bars due to early age shrinkage (autogenous shrinkage) of HSC, and from the comparison of self-induced stress in RC prisms with different early age shrinkages, concluded that this crack degrades bond stiffness. Therefore, the dowel action of the longitudinal reinforcement is affected by early age shrinkage. Most of above studies have been done for concrete with strength of less than 100 N/mm2 due to design limitations [2]. Based on such a background, the objectives of this study are: 1) to explain effect of brittleness, failure surface roughness, and early age shrinkage on the shear behavior of HSC beams quantitatively; and 2) to determine the shear capacity of HSC beams using available prediction model. In this study concrete strengths of 120 and 160 N/mm2 were used. 2. SHEAR CAPACITY PREDICTION In order to get a high accuracy for shear capacity prediction the modified compression field theory (MCFT) was adopted in this study [6]. For ease of understanding the theory of MCFT is described using simplified MCFT [7]. The fundamental relationship in the simplified MCFT relates the shear stress, which can be transmitted across cracked concrete [7]. The equation is, Vc = βf’c0.5bw dv (1) where, Vc: concrete contribution to shear strength (kN); f ’c: characteristic compressive strength of concrete (N/mm2); dv: the effective shear depth can be taken as 0.9d, d is effective depth of the beam (mm); bw: width of the beam (mm). The term β in Eq. (1) is a parameter
*1 Graduate Student, Graduate School of Science and Engineering, Saitama University, JCI Member *2 Professor, Graduate School of Science and Engineering, Saitama University, JCI Member *3 Graduate Student, Graduate School of Science and Engineering, Saitama University, JCI Member *4 Asst. Professor, Graduate School of Science and Engineering, Saitama University, JCI Member
コンクリート工学年次論文集,Vol.32,No.2,2010
-685-

that models the ability of cracked concrete to transfer shear (see Eq. (2)). It is a function of: 1) the longitudinal strain at the mid-depth of the member εx (see Eq. (3)); 2) the crack spacing at the mid-depth (see Eq. (4)); and 3) the maximum coarse aggregate size ag. β = 0.4 . 1300 (2) (1 + 1500εx) (1000 + sxe)
The longitudinal strain at mid height εx is conservatively assumed to be equal to ½ the strain in the longitudinal tensile reinforcing steel. For sections that are not subjected to axial loads, εx is calculated as εx = (M/dv+V)/(2EsAs) (3) where, M: moment (kNmm); V: shear force (kN); Es: Young’s modulus of steel (kN/mm2); As: area of longitudinal tensile steel (mm2). To account for the effect of maximum aggregate size on shear behavior, an equivalent crack spacing factor sxe (mm) is used. sxe = 35sx/(16+ag) (4) where, sx can be taken as dv [7]. Aggregate size does not influence aggregate interlock capacity in HSC because of smooth fracture surface. To account for this, it is suggested that an effective maximum aggregate size be calculated by linearly reducing ag to zero as f ’c increases from 50 to 100 N/mm2 [2]. In calculating Vc, the f ’c
0.5 is limited to a maximum of 8.3 N/mm2 [8].
Figure 1: Shear transfer mechanism of slender
beams 3. TEST PROGRAMS 3.1 Details of materials and specimens The concrete mix proportions are tabulated in Table 1. The properties of aggregates and steel bars used in the experiment are listed in Tables 2 and 3. As tabulated in Table 4, five identical beams without web reinforcement were used in this study. The cross sections and layout of test beams are shown in Fig. 2. Three high strength steel bars (fy = 750 N/mm2) were
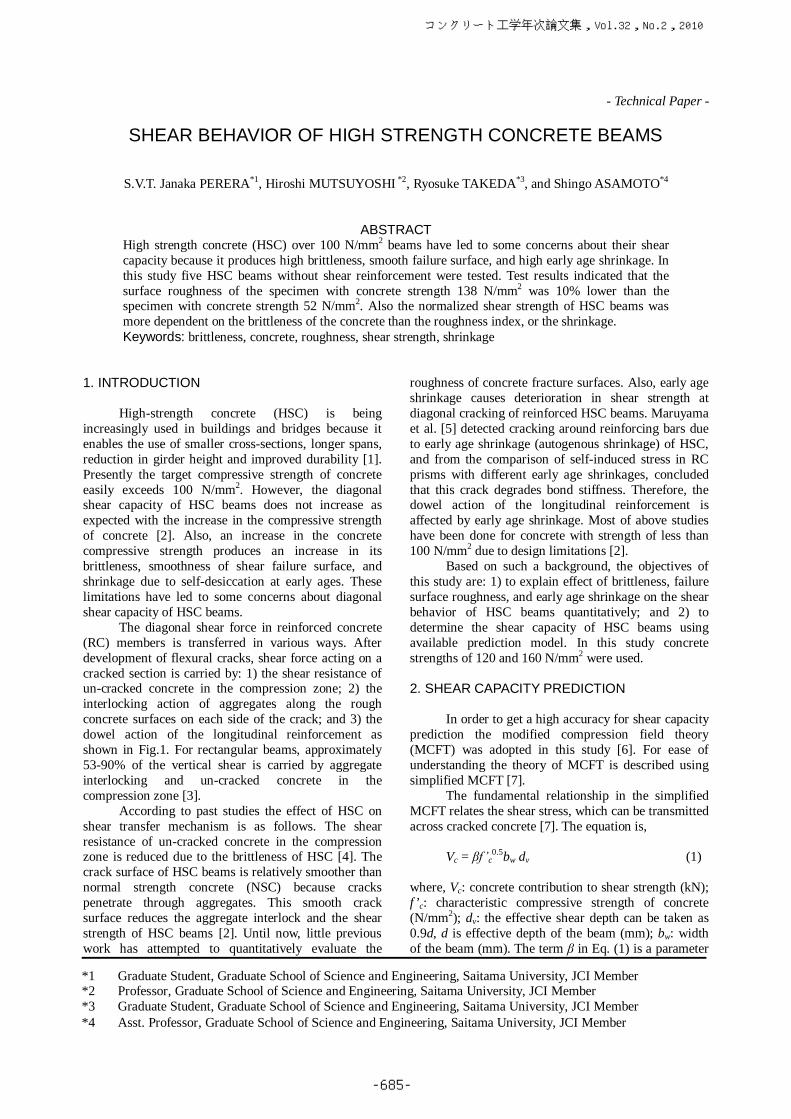
laid at the bottom of the section so shear failure would precede flexural failure. The test variables were compressive strength of concrete, early age shrinkage and aggregate type which are shown in Table 4. The shear span to effective depth (a/d) ratio was 4.0 for all beams. All specimens including RC beams, compressive strength specimens (Φ100x200mm), splitting tensile strength specimens (Φ150x300mm), and fracture energy specimens (100x100x400mm) were cured up to the loading test age, to exclude the drying effects. 3.2 Instrumentation and measurements (1) Beam test The four point symmetrical loading with distance of 300 mm between the loading points was statically applied to all specimens (Fig.2). Vertical deflections at the center, shear span and support of the RC beam were measured by displacement transducers. Electrical-resistance strain gauges were used to record the strain in concrete at the mid span of the beam. All cracks, which developed during the loading were observed and marked in detail. The test was stopped when the crushing of the concrete in compression and considerable loss of load carrying capacity was observed. (2) Early age shrinkage test The early age shrinkage of concrete was started to measure just after concrete placement. A strain gauge was embedded at the middle height of the center of the prism (100x100x400mm, shown in Fig.3). The expansion/ shrinkage strain and the temperature of concrete were measured using the embedded gauge. (3) Surface roughness index test For surface roughness test, fractured splitting tensile strength test specimens were tested because it was used to measure tensile capacity of concrete. A laser light confocal microscope was used to scan the fractured surface three dimensionally (Fig. 4). A 100mmx100mm (at the center of the specimen) area of fractured surface was scanned with a 250µm pixel size and resolution of 0.01µm. The compressive strength, splitting tensile strength, and fracture energy of concrete were measured according to Japanese Industrial Standard (JIS, 2005) on the same day as the RC beam test. 3.3 Roughness index of the fracture surface (Rs) This section describes the process of fracture using important postmortem evidence, the fracture surface. It is commonly recognized that the roughness of the fracture surface of concrete can vary depending on mix design. HSC will often exhibit brittle behavior,
Figure 2: Details of RC beam (unit: mm)
-686-
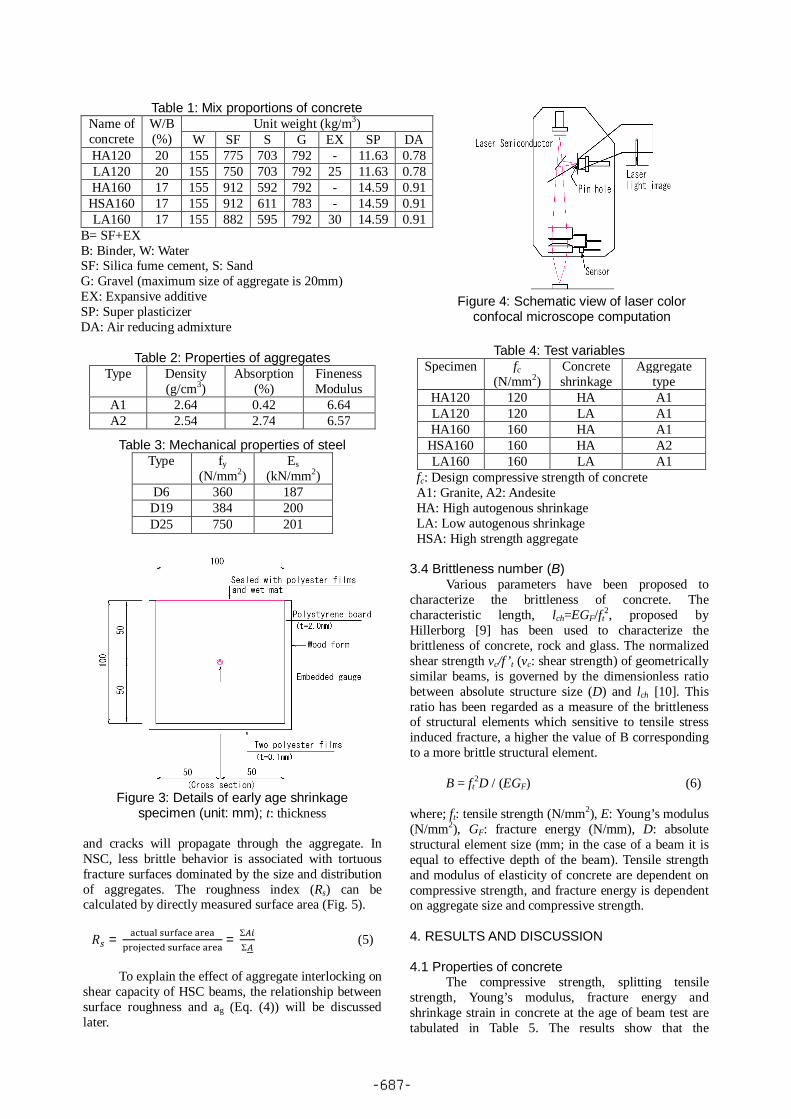
Table 2: Properties of aggregates
Type Density (g/cm3)
Absorption (%)
Fineness Modulus
A1 2.64 0.42 6.64 A2 2.54 2.74 6.57
Table 3: Mechanical properties of steel Type fy
(N/mm2) Es
(kN/mm2) D6 360 187 D19 384 200 D25 750 201
Figure 3: Details of early age shrinkage
specimen (unit: mm); t: thickness
and cracks will propagate through the aggregate. In NSC, less brittle behavior is associated with tortuous fracture surfaces dominated by the size and distribution of aggregates. The roughness index (Rs) can be calculated by directly measured surface area (Fig. 5). ܴ௦ = ୟୡ୲୳ୟ୪ ୱ୳୰ୟୡୣ ୟ୰ୣୟ
୮୰୭୨ୣୡ୲ୣୢ ୱ୳୰ୟୡୣ ୟ୰ୣୟ= Σ
Σ (5)
To explain the effect of aggregate interlocking on shear capacity of HSC beams, the relationship between surface roughness and ag (Eq. (4)) will be discussed later.
Table 4: Test variables Specimen fc
(N/mm2) Concrete shrinkage
Aggregate type
HA120 120 HA A1 LA120 120 LA A1 HA160 160 HA A1
HSA160 160 HA A2 LA160 160 LA A1
fc: Design compressive strength of concrete A1: Granite, A2: Andesite HA: High autogenous shrinkage LA: Low autogenous shrinkage HSA: High strength aggregate 3.4 Brittleness number (B)
Various parameters have been proposed to characterize the brittleness of concrete. The characteristic length, lch=EGF/ft
2, proposed by Hillerborg [9] has been used to characterize the brittleness of concrete, rock and glass. The normalized shear strength vc/f ’t (vc: shear strength) of geometrically similar beams, is governed by the dimensionless ratio between absolute structure size (D) and lch [10]. This ratio has been regarded as a measure of the brittleness of structural elements which sensitive to tensile stress induced fracture, a higher the value of B corresponding to a more brittle structural element. B = ft
2D / (EGF) (6) where; ft: tensile strength (N/mm2), E: Young’s modulus (N/mm2), GF: fracture energy (N/mm), D: absolute structural element size (mm; in the case of a beam it is equal to effective depth of the beam). Tensile strength and modulus of elasticity of concrete are dependent on compressive strength, and fracture energy is dependent on aggregate size and compressive strength. 4. RESULTS AND DISCUSSION 4.1 Properties of concrete The compressive strength, splitting tensile strength, Young’s modulus, fracture energy and shrinkage strain in concrete at the age of beam test are tabulated in Table 5. The results show that the
Table 1: Mix proportions of concrete Name of concrete
W/B (%)
Unit weight (kg/m3) W SF S G EX SP DA
HA120 20 155 775 703 792 - 11.63 0.78 LA120 20 155 750 703 792 25 11.63 0.78 HA160 17 155 912 592 792 - 14.59 0.91
HSA160 17 155 912 611 783 - 14.59 0.91 LA160 17 155 882 595 792 30 14.59 0.91
B= SF+EX B: Binder, W: Water SF: Silica fume cement, S: Sand G: Gravel (maximum size of aggregate is 20mm) EX: Expansive additive SP: Super plasticizer DA: Air reducing admixture
Figure 4: Schematic view of laser color
confocal microscope computation
-687-

compressive strength, splitting tensile strength, Young’s modulus, fracture energy and shrinkage strain were 138-183 N/mm2, 7.2-8.5 N/mm2, 39.4-44.7 kN/mm2, 0.195-0.280 N/mm, and (-114)-(-484) microns respectively. According to test results, a 15% increase in f’t was observed in low autogenous (LA) concrete beams compared with high autogenous (HA) and high strength aggregate (HSA) concrete beams. But Ec and Gf of LA concrete beams were not significantly higher than HA and HSA concrete beams. In other words, the effect of early age shrinkage on mechanical properties of concrete was not noticeable other than f’t. 4.2 Deformation of HSC beams Fig. 6 shows the load-deflection response for tested beams. The explanation of the behavior of response curves is done with LA120 beam. In the LA120 response curve, flexural cracks first appeared at the early stage of loading. The load slightly dropped after the formation of the first flexural crack, and it continued to increase. Then, a diagonal crack occurred in the shear span and the load dropped sharply. However, soon after that, the load continued to increase, slightly dropping again with the formation of another
crack. Even though diagonal cracking took place, the beam was still able to resist the applied load through arch action, as expected in HSC beams [2]. Finally beam failed in shear compression where the diagonal cracks in the shear span were widened and the concrete near the crack tip in the compression zone crushed. Beams LA120, HA160 and LA160 failed in shear compression and beams HA120 and HSA160 failed in diagonal tension. The diagonal tension failure occurred just after the critical diagonal cracking. According to test results, flexural cracks were developed to a greater extent in HA beams (including HSA160 beam) than in LA beams before critical diagonal cracking. This was due to the shrinkage, as expected (Fig. 7) [11]. Also, those load-deflection relationships of all beams were similar up to diagonal cracking load. LA beams tended to fail at higher loads in shear compression after forming an arch mechanism compared with HA beams. This behavior was mainly due the strength of compression strut and it is closely related to compressive strength of concrete. Also, reduced early age shrinkage in LA beams improved the bond stiffness of reinforcement and concrete [5].
Figure 5: Schematic view of
roughness parameter (Rs= Σ Ai/ Σ A)
Figure 6: Comparison of load –deflection relationship of RC
beams
Table 5: Outline of test results Name of specimen
At the age of loading Vc (kN)
Vu (kN)
Failure mode
Rs f ’c
(N/mm2) f ’t
(N/mm2) Ec
(kN/mm2) Gf
(N/mm) εsh
(x10-6) HA120 138 7.2 39.4 0.234 -412 165 165 DT 1.073 LA120 155 8.3 41.0 0.280 -114 170 241 SC 1.060 HA160 183 7.4 43.5 0.271 -454 150 211 SC 1.047
HSA160 164 7.6 44.2 0.195 -484 127 135 DT 1.076 LA160 175 8.5 44.7 0.259 -182 134 306 SC 1.056
S-40-3-4.0 [2]*
(52) (4.2) (32.1) (0.200) - 153 153 DT (1.193)
S-100-3-4.0 [2]*
(114) (6.2) (42.9) (0.220) - 170 170 DT -
f ’c: Compressive strength of concrete, f ’t: Splitting tensile strength of concrete, Ec: Young’s modulus of concrete Gf: Fracture energy, εsh: Shrinkage strain, Vc: Shear force at critical diagonal cracking, Vu: Shear force at failure DT: Diagonal tension failure, SC: Shear compression failure, Rs: Surface roughness index *: Beam details which are similar to Fig.2, ( ): Author’s previously unpublished data
020406080
100120140160180200
0 2 4 6 8 10
HA120LA120HA160HSA160LA160
Load
(kN
)
Deflection (mm)
Diagonal cracking
Formation of first flexural crack
-688-
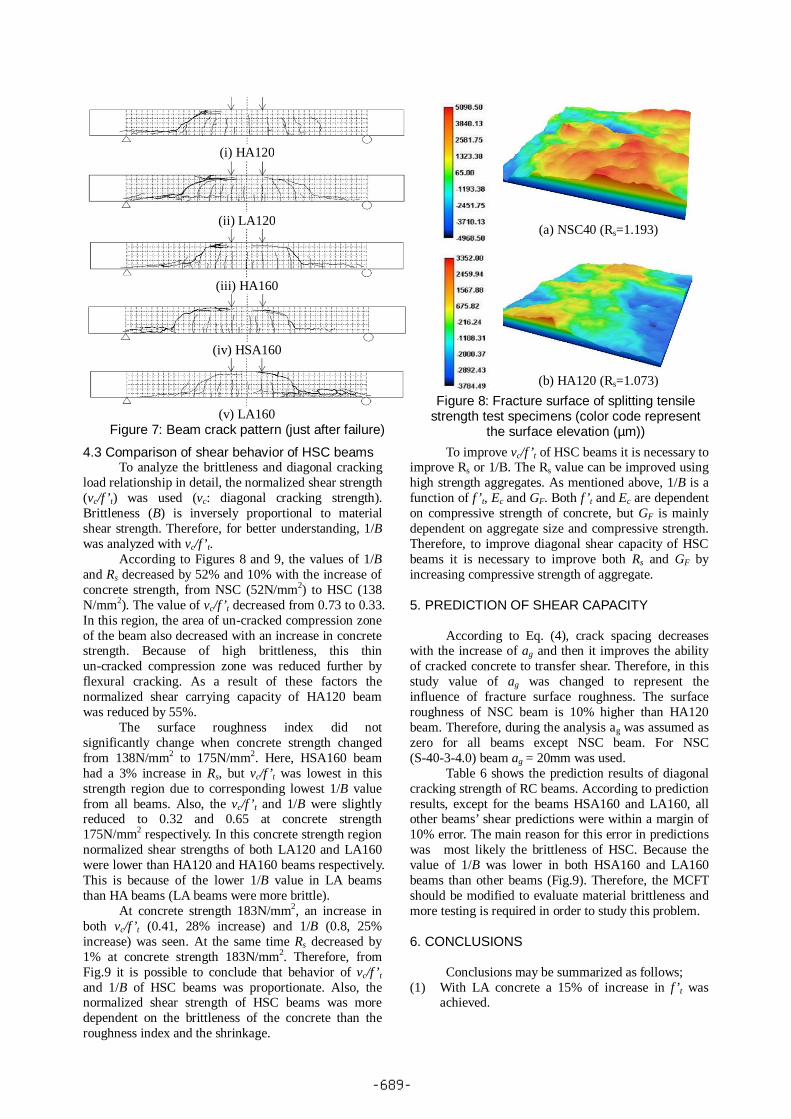
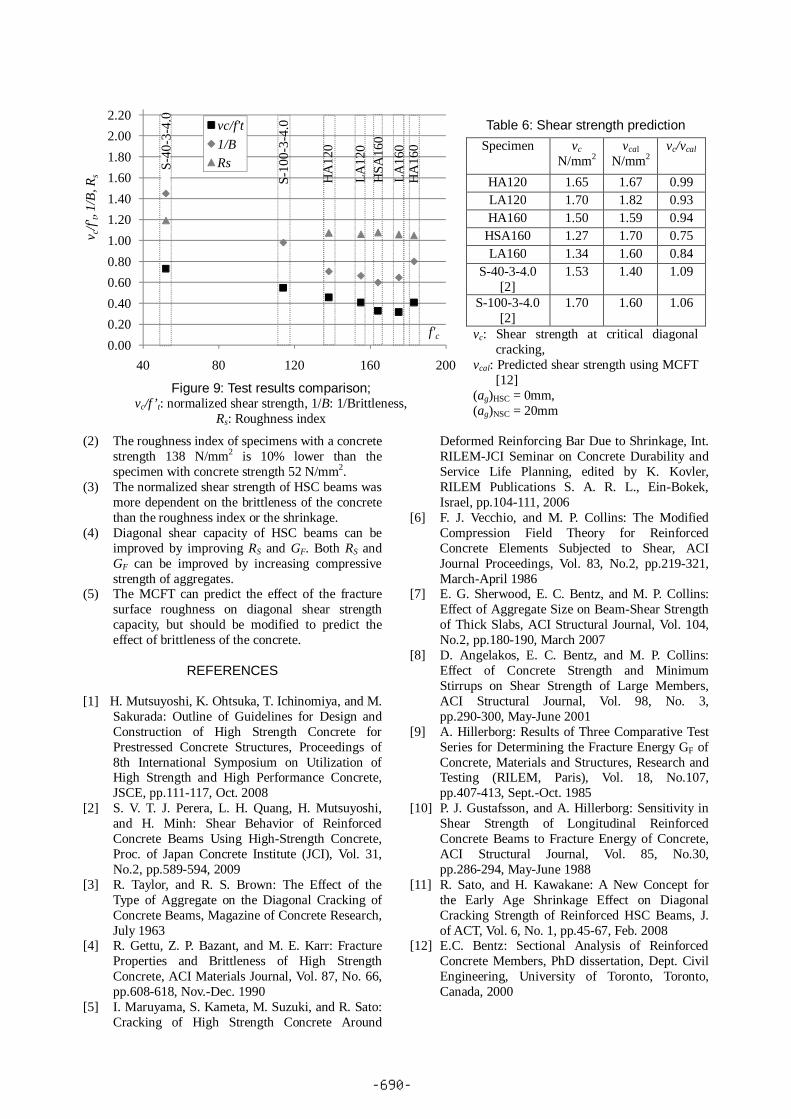
4.3 Comparison of shear behavior of HSC beams To analyze the brittleness and diagonal cracking load relationship in detail, the normalized shear strength (vc/f ’t) was used (vc: diagonal cracking strength). Brittleness (B) is inversely proportional to material shear strength. Therefore, for better understanding, 1/B was analyzed with vc/f’t. According to Figures 8 and 9, the values of 1/B and Rs decreased by 52% and 10% with the increase of concrete strength, from NSC (52N/mm2) to HSC (138 N/mm2). The value of vc/f ’t decreased from 0.73 to 0.33. In this region, the area of un-cracked compression zone of the beam also decreased with an increase in concrete strength. Because of high brittleness, this thin un-cracked compression zone was reduced further by flexural cracking. As a result of these factors the normalized shear carrying capacity of HA120 beam was reduced by 55%. The surface roughness index did not significantly change when concrete strength changed from 138N/mm2 to 175N/mm2. Here, HSA160 beam had a 3% increase in Rs, but vc/f ’t was lowest in this strength region due to corresponding lowest 1/B value from all beams. Also, the vc/f ’t and 1/B were slightly reduced to 0.32 and 0.65 at concrete strength 175N/mm2 respectively. In this concrete strength region normalized shear strengths of both LA120 and LA160 were lower than HA120 and HA160 beams respectively. This is because of the lower 1/B value in LA beams than HA beams (LA beams were more brittle). At concrete strength 183N/mm2, an increase in both vc/f ’t (0.41, 28% increase) and 1/B (0.8, 25% increase) was seen. At the same time Rs decreased by 1% at concrete strength 183N/mm2. Therefore, from Fig.9 it is possible to conclude that behavior of vc/f ’t and 1/B of HSC beams was proportionate. Also, the normalized shear strength of HSC beams was more dependent on the brittleness of the concrete than the roughness index and the shrinkage.
To improve vc/f ’t of HSC beams it is necessary to improve Rs or 1/B. The Rs value can be improved using high strength aggregates. As mentioned above, 1/B is a function of f ’t, Ec and GF. Both f ’t and Ec are dependent on compressive strength of concrete, but GF is mainly dependent on aggregate size and compressive strength. Therefore, to improve diagonal shear capacity of HSC beams it is necessary to improve both Rs and GF by increasing compressive strength of aggregate. 5. PREDICTION OF SHEAR CAPACITY According to Eq. (4), crack spacing decreases with the increase of ag and then it improves the ability of cracked concrete to transfer shear. Therefore, in this study value of ag was changed to represent the influence of fracture surface roughness. The surface roughness of NSC beam is 10% higher than HA120 beam. Therefore, during the analysis ag was assumed as zero for all beams except NSC beam. For NSC (S-40-3-4.0) beam ag = 20mm was used. Table 6 shows the prediction results of diagonal cracking strength of RC beams. According to prediction results, except for the beams HSA160 and LA160, all other beams’ shear predictions were within a margin of 10% error. The main reason for this error in predictions was most likely the brittleness of HSC. Because the value of 1/B was lower in both HSA160 and LA160 beams than other beams (Fig.9). Therefore, the MCFT should be modified to evaluate material brittleness and more testing is required in order to study this problem. 6. CONCLUSIONS Conclusions may be summarized as follows; (1) With LA concrete a 15% of increase in f’t was
achieved.
(i) HA120
(ii) LA120
(iii) HA160
(iv) HSA160
(v) LA160
Figure 7: Beam crack pattern (just after failure)
(a) NSC40 (Rs=1.193)
(b) HA120 (Rs=1.073) Figure 8: Fracture surface of splitting tensile
strength test specimens (color code represent the surface elevation (µm))
-689-
(2) The roughness index of specimens with a concrete strength 138 N/mm2 is 10% lower than the specimen with concrete strength 52 N/mm2.
(3) The normalized shear strength of HSC beams was more dependent on the brittleness of the concrete than the roughness index or the shrinkage.
(4) Diagonal shear capacity of HSC beams can be improved by improving RS and GF. Both RS and GF can be improved by increasing compressive strength of aggregates.
(5) The MCFT can predict the effect of the fracture surface roughness on diagonal shear strength capacity, but should be modified to predict the effect of brittleness of the concrete.
REFERENCES
[1] H. Mutsuyoshi, K. Ohtsuka, T. Ichinomiya, and M.
Sakurada: Outline of Guidelines for Design and Construction of High Strength Concrete for Prestressed Concrete Structures, Proceedings of 8th International Symposium on Utilization of High Strength and High Performance Concrete, JSCE, pp.111-117, Oct. 2008
[2] S. V. T. J. Perera, L. H. Quang, H. Mutsuyoshi, and H. Minh: Shear Behavior of Reinforced Concrete Beams Using High-Strength Concrete, Proc. of Japan Concrete Institute (JCI), Vol. 31, No.2, pp.589-594, 2009
[3] R. Taylor, and R. S. Brown: The Effect of the Type of Aggregate on the Diagonal Cracking of Concrete Beams, Magazine of Concrete Research, July 1963
[4] R. Gettu, Z. P. Bazant, and M. E. Karr: Fracture Properties and Brittleness of High Strength Concrete, ACI Materials Journal, Vol. 87, No. 66, pp.608-618, Nov.-Dec. 1990
[5] I. Maruyama, S. Kameta, M. Suzuki, and R. Sato: Cracking of High Strength Concrete Around
Deformed Reinforcing Bar Due to Shrinkage, Int. RILEM-JCI Seminar on Concrete Durability and Service Life Planning, edited by K. Kovler, RILEM Publications S. A. R. L., Ein-Bokek, Israel, pp.104-111, 2006
[6] F. J. Vecchio, and M. P. Collins: The Modified Compression Field Theory for Reinforced Concrete Elements Subjected to Shear, ACI Journal Proceedings, Vol. 83, No.2, pp.219-321, March-April 1986
[7] E. G. Sherwood, E. C. Bentz, and M. P. Collins: Effect of Aggregate Size on Beam-Shear Strength of Thick Slabs, ACI Structural Journal, Vol. 104, No.2, pp.180-190, March 2007
[8] D. Angelakos, E. C. Bentz, and M. P. Collins: Effect of Concrete Strength and Minimum Stirrups on Shear Strength of Large Members, ACI Structural Journal, Vol. 98, No. 3, pp.290-300, May-June 2001
[9] A. Hillerborg: Results of Three Comparative Test Series for Determining the Fracture Energy GF of Concrete, Materials and Structures, Research and Testing (RILEM, Paris), Vol. 18, No.107, pp.407-413, Sept.-Oct. 1985
[10] P. J. Gustafsson, and A. Hillerborg: Sensitivity in Shear Strength of Longitudinal Reinforced Concrete Beams to Fracture Energy of Concrete, ACI Structural Journal, Vol. 85, No.30, pp.286-294, May-June 1988
[11] R. Sato, and H. Kawakane: A New Concept for the Early Age Shrinkage Effect on Diagonal Cracking Strength of Reinforced HSC Beams, J. of ACT, Vol. 6, No. 1, pp.45-67, Feb. 2008
[12] E.C. Bentz: Sectional Analysis of Reinforced Concrete Members, PhD dissertation, Dept. Civil Engineering, University of Toronto, Toronto, Canada, 2000
Figure 9: Test results comparison; vc/f ’t: normalized shear strength, 1/B: 1/Brittleness,
Rs: Roughness index
Specimen vc N/mm2
vcal N/mm2
vc/vcal
HA120 1.65 1.67 0.99 LA120 1.70 1.82 0.93 HA160 1.50 1.59 0.94
HSA160 1.27 1.70 0.75 LA160 1.34 1.60 0.84
S-40-3-4.0 [2]
1.53 1.40 1.09
S-100-3-4.0 [2]
1.70 1.60 1.06
Table 6: Shear strength prediction
vc: Shear strength at critical diagonal cracking,
vcal: Predicted shear strength using MCFT [12]
(ag)HSC = 0mm, (ag)NSC = 20mm
0.000.200.400.600.801.001.201.401.601.802.002.20
40 80 120 160 200
vc/f't1/BRs
HA
120
LA12
0H
SA16
0LA
160
HA
160
S-10
0-3-
4.0
S-40
-3-4
.0
v c/f'
t, 1/B
, Rs
f'c
-690-