shear localization and chemical reaction in high-strain, high-strain-rate deformation of ti–si...
TRANSCRIPT
SHEAR LOCALIZATION AND CHEMICAL REACTION IN
HIGH-STRAIN, HIGH-STRAIN-RATE DEFORMATION OF
Ti±Si POWDER MIXTURES
H. C. CHEN, J. C. LASALVIA, V. F. NESTERENKO and M. A. MEYERS
Department of Applied Mechanics and Engineering Sciences, University of California, San Diego,La Jolla, CA 92093, U.S.A.
(Received 19 June 1997; accepted 19 December 1997)
AbstractÐTi±Si mixtures were subjected to high-strain-rate deformation at a pressure below the thresholdfor shock-wave initiation. Whereas the collapse of interparticle pores did not initiate reaction, regions oflocalized macro-deformation initiated reaction inside shear bands at su�ciently high strains (g010), andpropagation of the reaction through the entire specimen at higher strains (g020±40). This study demon-strates that temperature increases in shear localization regions can initiate chemical reaction inside a reac-tive powder mixture. The shear band spacing was 00.6±1 mm. Thermodynamic and kinetic calculationsyield the reaction rate outside the shear bands, in the homogeneously deformed material, which has amaximum value of 20 sÿ1 at 1685 K. # 1998 Acta Metallurgica Inc.
1. INTRODUCTION
There has been considerable interest, in the past
thirty years, on mechanically induced chemical
reactions [1±3]. The most striking development
has been the shock induced synthesis of diamond
from graphite, by DeCarli and Jamieson [4].
Two schools-of-thought developed, regarding the
initiation of chemical reactions during shock com-
pression: (a) the solid-state approach, according to
which the high density of defects produced in
shock compression, in combination with high
pressures and temperatures, produced a solid-state
reaction [2, 5, 6]; (b) the solid±liquid approach,
according to which melting of one of the com-
ponents of a reactive mixture was a prerequisite to
initiate the reaction [7±13].
Shock-induced chemical reactions in silicide
systems have been investigated in recent years.
Vreeland and coworkers [7±10] proposed that
chemical reactions were initiated under shock com-
pression, when the shock energy was of su�cient
amplitude to melt one of the mixture components.
Meyers and coworkers [11±13] observed that small
spherical NbSi2 products form at the interface
between Nb and Si, and are expelled into the mol-
ten silicon. Similar results can also be observed in
the Mo + Si mixture [14, 15]. Vreeland and
coworkers [16] applied shock energies slightly lower
than the threshold energy on the Ti±Si mixture, and
observed solid-Ti/molten-Si interfaces in small loca-
lized regions. Spherical reaction products (TiSi2)
were also formed at the Ti particle/Si liquid
interface. Recent observations con®rm the reaction
mechanism not only for Nb + Si and Mo+ Si
systems, but also for other metal + Si systems.
The importance of shear deformation on
chemical reactions was ®rst demonstrated by
Bridgman [17±20]; he showed that shear defor-
mation, superimposed on hydrostatic loading,
decreases the critical pressure for initiating chemical
reactions. Vereshchagin and coworkers [21, 22]
applied this technique and made the following
observations: pressure combined with shear defor-
mation can accelerate polymorphic transformations,
lower the temperature for phase transitions, and
decompose some compounds. Teller [23] hypo-
thesized that shear deformation at high pressures
can play a decisive role in accelerating chemical
reactions, particularly, converting an exothermicreaction into an explosive process. Enikolopyan and
coworkers [24±26] used a Bridgman anvil cell to
study organic and inorganic chemical reactions
under high pressures with shear deformation.
Complete reactions in some materials only occurred
with superimposed shear deformation, whereas in
other materials reactions stopped after shear defor-
mation was interrupted. These studies con®rmed
the earlier work by Bridgman [17±20].
Under shock compression, the combination of
high pressure and temperature can cause powders
to undergo plastic deformation, ¯uid-like ¯ow, andmechanical mixing which can speed chemical reac-
tions. The in¯uence of post shock-shear defor-
mation on chemical reaction under dynamic loading
was accidentally observed by Yu [27] and Yu et
Acta mater. Vol. 46, No. 9, pp. 3033±3046, 1998# 1998 Acta Metallurgica Inc.
Published by Elsevier Science Ltd. All rights reservedPrinted in Great Britain
1359-6454/98 $19.00+0.00PII: S1359-6454(98)00016-0
3033
al. [28] in shock experiments carried out in thecylindrical geometry and in a gas gun. Potter and
Ahrens [29] observed chemical reaction in obliqueimpact experiments between Al2O3 and MgO, withthe formation of MgAl2O4. Recent results by
Nesterenko et al. [30±33] show that chemical reac-tions in Ti + Si and Nb + Si powder mixtures canoccur in a narrow band (width05±20 mm) produced
by shear localization without essential in¯uence ofshock loading.Krueger and Vreeland [8] proposed that a shock
threshold energy is needed to initiate the reaction.This criterion was generalized to incorporate thee�ect of localized plastic deformation by Meyerset al. [15]; the total energy (shock energy plus
energy inside shear localization area after passageof shock wave) was used in the computation, andinitiation of reaction was consistent with the energy
to melt Si.The principal objectives of this paper are: (a) to
investigate the behavior of Ti±Si mixture below
the deformation threshold for chemical reactionin conditions of high-strain, high-strain-rate defor-mation and (b) to establish whether reaction,
initiating at shear bands, could propagate into themixture.
2. EXPERIMENTAL TECHNIQUES
A Ti±Si (74 wt%±26 wt%) powder mixture in itsstoichiometric composition of compound Ti5Si3,was used in this research. This compound had beeninvestigated in earlier shock experiments [27, 7±10]
and it was therefore thought that it was a good in-itial composition for comparison purposes.Nevertheless, the Ti±Si phase diagram indicates a
number of additional compounds. The enthalpy ofreaction DH is [34]:
5Ti� 3Si ÿ4Ti5Si3 DH � ÿ580 kJ=mol:
The powders (from CERAC) had sizes of ÿ325mesh (<44 mm), high purity (>99.5%) and irregu-lar shape. Meyers et al. [12] and Yu [27] calculated
the threshold pressure for reaction at 65% initialdensity and obtained a value of 1.5 GPa for Ti5Si3.This calculation is based on the Krueger±Vreelandcriterion [8].
The thick-walled cylinder method, which wasdeveloped by Nesterenko et al. [35, 36] for the inves-tigation of high-strain, high-strain-rate deformation
of solid materials and modi®ed for the study ofinert and reactive porous powder mixtures [30, 31]was used in this investigation. The schematic of
the set-up is presented in [30, 31]. Detonation isinitiated at the top of the charge and propagatesalong the cylinder axis. The powder is ®rst consoli-
dated by a low amplitude explosive charge. Anori®ce is then drilled along the cylinder axis and asecond explosive event is carried out. This secondexplosive produces signi®cant plastic deformation in
the densi®ed powder layer. The velocity of the
inner cylinder surface and the collapse time
were measured by a non-contact electromagnetic
method [36].
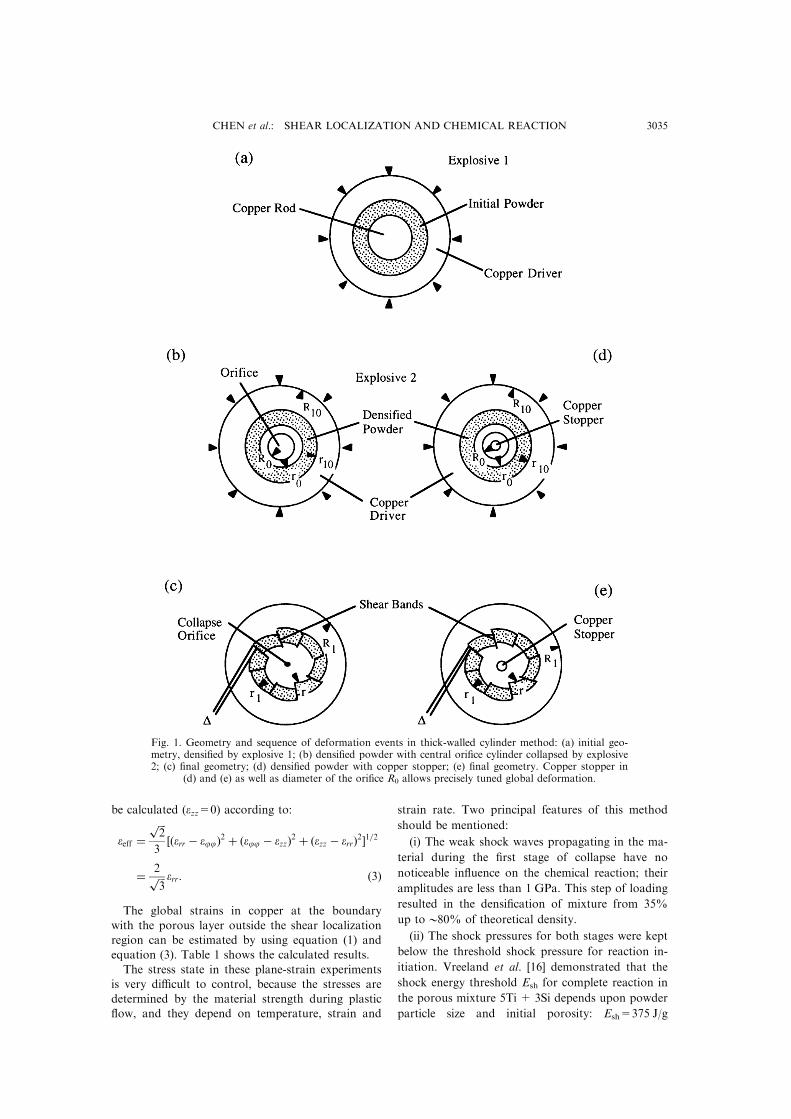
Figure 1 shows the details or the set-up. A
porous powder (initial density of Ti±Si mixture was
035% of theoretical density) was initially placed
in a tubular cavity between a central copper rod
(diameter of 16 mm) and an outer copper tube
(inner diameter of 20 mm and outer diameter of
31 mm). Explosive 1 (mixture of ammonite and
sand in 3:1 volume ratio, Fig. 1(a)) with low deto-
nation velocity (2.8±3 km/s) was used to densify the
powder. After densi®cation, the density of mixture
became 080% of theoretical value. No signi®cant
shear localization or chemical reaction was observed
after this stage because the global deformation is
su�ciently small (®nal diameter of inner surface of
driving copper cylinder is equal to 18±19 mm). This
stage produced mainly the densi®cation of the
powder. A cylindrical hole with diameter 11 mm
was drilled along the longitudinal axis of the copper
rod and this composite cylinder was collapsed by
the detonation of a second cylindrical explosive
charge (ammonite, Fig. 1(b)) with a detonation
velocity of 4±4.2 km/s, an initial density of 1 g/cm3,
and an outer diameter of 60 mm. This second
explosive loading produced signi®cant plastic defor-
mation in densi®ed porous layer which was highly
localized in shear bands and not homogeneously
distributed (Fig. 1(c)). To precisely tune the global
strains, a cylindrical copper rod was inserted in
the central ori®ce after Explosive 1 (Fig. 1(d)). This
was intended to provide the critical initiation and
propagation condition for shear localization and
chemical reaction.
The global material strain can be obtained quan-
titatively from the strains in the incompressible cop-
per shell driving the collapse process. The strain
state in the uniformly deformed incompressible ma-
terial is pure shear [31, 37]. The radial and tangen-
tial true strains (err and ejj) for the copper shell,
before the onset of localization, can be estimated by
knowing the initial and ®nal radii, ri and rf, at a
general point:
err � ÿejj � ln
�rirf
�: �1�
The true strains in the inner and outer surfaces of
the initial porous tubular layer can be found from
equation (1). The ®nal radii R (or R1) and initial
radius R0 (or R10) (Fig. 1) are experimentally
measured and the value of ri, which corresponds to
a preselected value of rf, can be calculated by using
the conservation of mass:
r2i � r2f � R20 ÿ R2 � r2f � R2
10 ÿ R21 �2�
where R and R1 are the ®nal radii of the inner hole
and outer cylinder surface. The e�ective strains can
CHEN et al.: SHEAR LOCALIZATION AND CHEMICAL REACTION3034
be calculated (ezz=0) according to:
eeff ����2p
3��err ÿ ejj�2 � �ejj ÿ ezz�2 � �ezz ÿ err�2�1=2
� 2���3p err: �3�
The global strains in copper at the boundary
with the porous layer outside the shear localization
region can be estimated by using equation (1) and
equation (3). Table 1 shows the calculated results.
The stress state in these plane-strain experiments
is very di�cult to control, because the stresses are
determined by the material strength during plastic
¯ow, and they depend on temperature, strain and
strain rate. Two principal features of this method
should be mentioned:
(i) The weak shock waves propagating in the ma-
terial during the ®rst stage of collapse have no
noticeable in¯uence on the chemical reaction; their
amplitudes are less than 1 GPa. This step of loading
resulted in the densi®cation of mixture from 35%
up to080% of theoretical density.
(ii) The shock pressures for both stages were kept
below the threshold shock pressure for reaction in-
itiation. Vreeland et al. [16] demonstrated that the
shock energy threshold Esh for complete reaction in
the porous mixture 5Ti + 3Si depends upon powder
particle size and initial porosity: Esh=375 J/g
Fig. 1. Geometry and sequence of deformation events in thick-walled cylinder method: (a) initial geo-metry, densi®ed by explosive 1; (b) densi®ed powder with central ori®ce cylinder collapsed by explosive2; (c) ®nal geometry; (d) densi®ed powder with copper stopper; (e) ®nal geometry. Copper stopper in
(d) and (e) as well as diameter of the ori®ce R0 allows precisely tuned global deformation.
CHEN et al.: SHEAR LOCALIZATION AND CHEMICAL REACTION 3035
(shock pressure 2.65 GPa) for larger particles (ÿ150mesh) is 80% larger than for smaller particles at
the same porosity (0.49) and a decrease in initial
porosity from 0.49 to 0.4 resulted in 75% increase
of Esh for both powders. A constant threshold
energy of Esh=100 J/g was assumed for mixture
5Ti + 3Si resulting in a range of critical shock
pressures to initiate reaction from 1 GPa at porosity
0.5 to 3 GPa at porosity 0.2 [33]. A separate exper-
iment was conducted for Stage 2 with the same type
of explosive loading but without global plastic
deformation. There was no evidence of reaction.
Thus it can be concluded that pressure e�ects can
be neglected to a ®rst approximation and chemical
processes are mainly strain controlled.
3. RESULTS AND DISCUSSION
Four di�erent deformation conditions were
applied to Ti±Si mixtures. The global strains in the
inner layer were 0.24, 0.33, 0.35, 0.38 by using cop-
per stopper diameters, D, equal to 6, 3, 1.5, and
0 mm, respectively. The details are shown in
Table 1. The global strain rates are calculated
by [31] and the average values are very close and
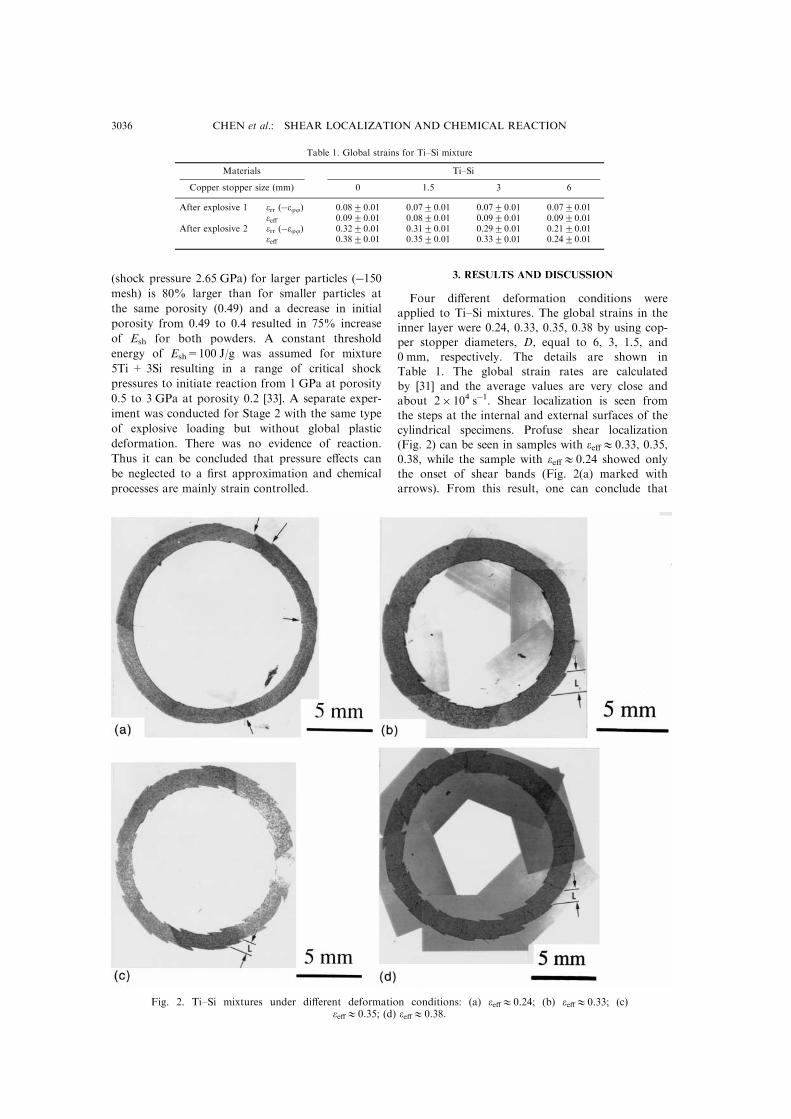
about 2� 104 sÿ1. Shear localization is seen from
the steps at the internal and external surfaces of the
cylindrical specimens. Profuse shear localization
(Fig. 2) can be seen in samples with ee�10.33, 0.35,
0.38, while the sample with ee�10.24 showed only
the onset of shear bands (Fig. 2(a) marked with
arrows). From this result, one can conclude that
Table 1. Global strains for Ti±Si mixture
Materials Ti±Si
Copper stopper size (mm) 0 1.5 3 6
After explosive 1 err (ÿejj) 0.0820.01 0.0720.01 0.0720.01 0.0720.01ee� 0.0920.01 0.0820.01 0.0920.01 0.0920.01
After explosive 2 err (ÿejj) 0.3220.01 0.3120.01 0.2920.01 0.2120.01ee� 0.3820.01 0.3520.01 0.3320.01 0.2420.01
Fig. 2. Ti±Si mixtures under di�erent deformation conditions: (a) ee�10.24; (b) ee�10.33; (c)ee�10.35; (d) ee�10.38.
CHEN et al.: SHEAR LOCALIZATION AND CHEMICAL REACTION3036
shear localization developed at a global e�ective
strain between 0.2 and 0.3. The angle between the
shear localization regions and the radial direction is
close to 458, the same as in alumina samples [38].
This demonstrates that plastic ¯ow in these
materials is rather pressure insensitive. Two orien-
tations, either clockwise or counterclockwise spirals,
are observed.
Using the ratio of the displacement, D, and the
thickness of the shear bands, d, one can evaluate
the shear strain inside shear localization regions,
which are deforming in simple shear. The shear dis-
placements, D, shear band thicknesses, d, local
shear strains, g, and local shear strain rates, _g, arelisted in Table 2. The local shear strain rate is
calculated by:
_g � gt
where t is the time of the deformation process and
is equal to08 ms [35, 36]. The total global tangential
strain, et, homogeneous strain, eh, and inhomo-
geneous strain due to shear localization, es, are cal-
culated by [38]. The calculated values are listed in
Table 2.
The microstructural observations for the Ti±Si
system are shown in Figs 3±6. There is no signi®-
cant di�erence after the densi®cation stage (explo-
sive event 1) among all sets of specimens and the
densities are 65±90% of the theoretical value. After
explosive event 2 with varying diameters of the
central copper stopper (varying global strain con-
ditions), the structures are quite di�erent. Only the
beginning of shear localization was found for global
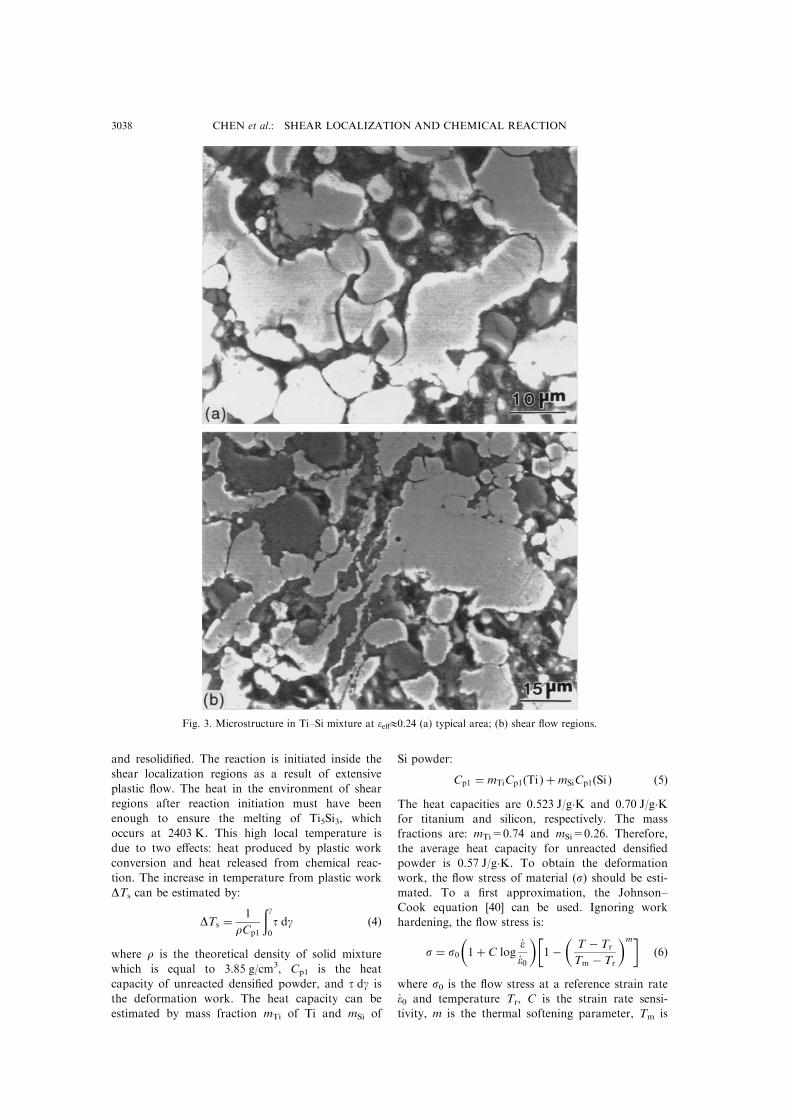
strain, ee�00.24 (Fig. 3). Although there are no
well developed shear bands at ee�00.24, small loca-
lized regions of shear concentration were observed
(Fig. 3(b)). This phenomenon is probably due to
material non-uniformity initiated, for example, by
the fracture of Si particles. When the global strain
increases to 00.33 and 0.35, shear localization
becomes evident (Fig. 4(a) and Fig. 5(a)). At
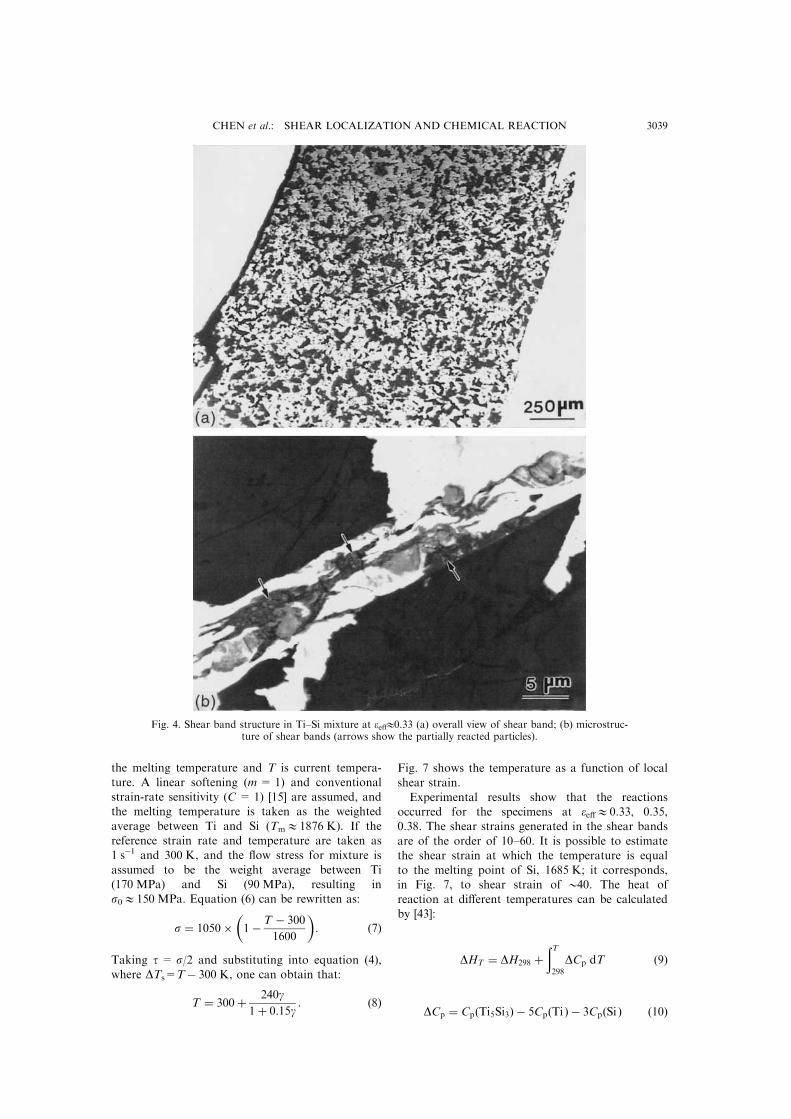
ee�00.33, fracturing and extensive plastic ¯ow of
Ti particles are observed inside shear localization
regions (Fig. 4(b)). This implies that material ¯ow
is unstable during deformation. Spherical partially
reacted products were observed only inside shear
localization regions (shown by arrows in Fig. 4(b)).
These reacted products were Ti-rich compounds
as determined by EDS analysis. These reaction
products are similar to the spherules observed after
shock compression of powders by Vecchio et al. [13]
and Vreeland et al. [16].
At ee�00.35, the reactions inside shear localiz-
ation regions are completed, as shown in Fig. 5(b).
At the reaction interface, which is quenched by the
surrounding medium, small spherules (00.2±0.5 mmdiameter) can be seen (Fig. 5(c)) and are marked by
arrows. These spherules are evidence that the reac-
tion propagation mechanism is similar to the one
observed by Yu and Meyers [11] under shock com-
pression and to the one discussed by LaSalvia et
al. [39] under conventional SHS. The voids and
cracks in the reaction products are due to solidi®ca-
tion shrinkage. This can be explained by the liquid
state of the products after reaction. At ee�00.38, in
some experiments, the reaction propagated through-
out the whole specimen, except in the triangular
areas produced by discontinuity in displacement
due to shear localization (Fig. 6(a)). Only cracks
were left as the main feature of shear localization
(Fig. 6(b)), as a result of solidi®cation and shrink-
age of molten reacted products. The unreacted tri-
angular areas are due to rapid heat extraction by
the copper walls at an angle of 458. These fully
reacted products were identi®ed by X-ray di�rac-
tion analysis and the results coincide with the major
peaks for Ti5Si3. The d spacings for the two stron-
gest peaks were 2.204 A (for (211)) and 2.124 A
(for (112)), with corresponding lattice parameters of
a= 7.35 A and c = 5.49 A. In comparison the
JCPDS reports data of 2.202 A (for (211)) and
2.116 A (for (112)), with corresponding lattice par-
ameters of a= 7.44 A and c = 5.143 A(hexagonal
structure; P63/mcm). It is therefore concluded that
the reaction product is indeed Ti5Si3. In accordance
with this, the microhardness for densi®ed Ti±Si
mixtures is 180 VHN, whereas for shear deformed
and reacted Ti±Si mixtures, it is 910 VHN. This
result additionally con®rms that the structures after
shear deformation are quite di�erent from the den-
si®ed one, and that a new compound was formed.
The second explosive loading event was also con-
ducted without creating a central ori®ce. After this
shock loading without collapse process, no shear
localization and chemical reaction were observed.
This con®rms that the chemical reaction are truly
strain controlled in our experiments.
The voids and microcracks, shown in Fig. 6(b),
indicate that the reacted product Ti5Si3 has melted
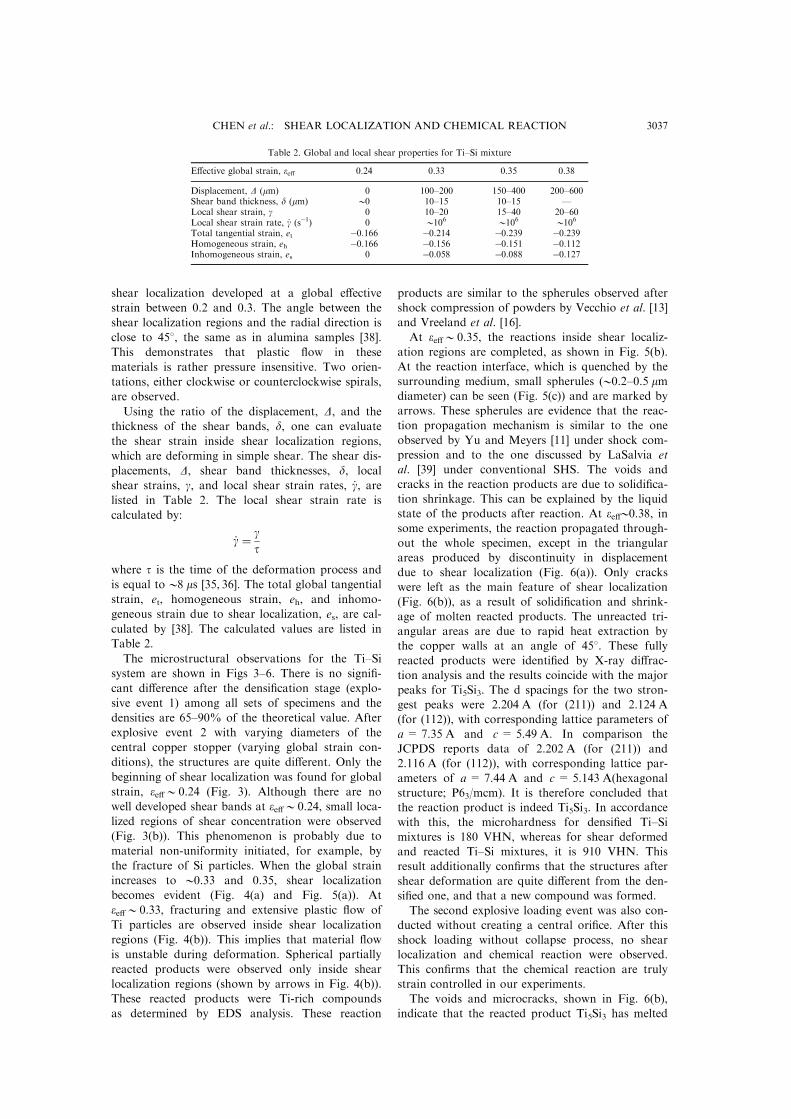
Table 2. Global and local shear properties for Ti±Si mixture
E�ective global strain, ee� 0.24 0.33 0.35 0.38
Displacement, D (mm) 0 100±200 150±400 200±600Shear band thickness, d (mm) 00 10±15 10±15 ÐLocal shear strain, g 0 10±20 15±40 20±60Local shear strain rate, _g (sÿ1) 0 0106 0106 0106
Total tangential strain, et ÿ0.166 ÿ0.214 ÿ0.239 ÿ0.239Homogeneous strain, eh ÿ0.166 ÿ0.156 ÿ0.151 ÿ0.112Inhomogeneous strain, es 0 ÿ0.058 ÿ0.088 ÿ0.127
CHEN et al.: SHEAR LOCALIZATION AND CHEMICAL REACTION 3037
and resolidi®ed. The reaction is initiated inside the
shear localization regions as a result of extensive
plastic ¯ow. The heat in the environment of shear
regions after reaction initiation must have been
enough to ensure the melting of Ti5Si3, which
occurs at 2403 K. This high local temperature is
due to two e�ects: heat produced by plastic work
conversion and heat released from chemical reac-
tion. The increase in temperature from plastic work
DTs can be estimated by:
DTs � 1
rCp1
�g0
t dg �4�
where r is the theoretical density of solid mixture
which is equal to 3.85 g/cm3, Cp1 is the heat
capacity of unreacted densi®ed powder, and t dg is
the deformation work. The heat capacity can be
estimated by mass fraction mTi of Ti and mSi of
Si powder:
Cp1 � mTiCp1�Ti � �mSiCp1�Si � �5�The heat capacities are 0.523 J/g�K and 0.70 J/g�Kfor titanium and silicon, respectively. The mass
fractions are: mTi=0.74 and mSi=0.26. Therefore,
the average heat capacity for unreacted densi®ed
powder is 0.57 J/g�K. To obtain the deformation
work, the ¯ow stress of material (s) should be esti-
mated. To a ®rst approximation, the Johnson±
Cook equation [40] can be used. Ignoring work
hardening, the ¯ow stress is:
s � s0
�1� C log
_e_e0
��1ÿ
�T ÿ Tr
Tm ÿ Tr
�m��6�
where s0 is the ¯ow stress at a reference strain rate_e0 and temperature Tr, C is the strain rate sensi-
tivity, m is the thermal softening parameter, Tm is
Fig. 3. Microstructure in Ti±Si mixture at ee�10.24 (a) typical area; (b) shear ¯ow regions.
CHEN et al.: SHEAR LOCALIZATION AND CHEMICAL REACTION3038
the melting temperature and T is current tempera-ture. A linear softening (m = 1) and conventionalstrain-rate sensitivity (C = 1) [15] are assumed, andthe melting temperature is taken as the weighted
average between Ti and Si (Tm11876 K). If thereference strain rate and temperature are taken as1 sÿ1 and 300 K, and the ¯ow stress for mixture is
assumed to be the weight average between Ti(170 MPa) and Si (90 MPa), resulting ins01150 MPa. Equation (6) can be rewritten as:
s � 1050��1ÿ T ÿ 300
1600
�: �7�
Taking t = s/2 and substituting into equation (4),where DTs=Tÿ 300 K, one can obtain that:
T � 300� 240g1� 0:15g
: �8�
Fig. 4. Shear band structure in Ti±Si mixture at ee�10.33 (a) overall view of shear band; (b) microstruc-ture of shear bands (arrows show the partially reacted particles).
Fig. 7 shows the temperature as a function of localshear strain.
Experimental results show that the reactionsoccurred for the specimens at ee�10.33, 0.35,0.38. The shear strains generated in the shear bands
are of the order of 10±60. It is possible to estimatethe shear strain at which the temperature is equalto the melting point of Si, 1685 K; it corresponds,in Fig. 7, to shear strain of 040. The heat of
reaction at di�erent temperatures can be calculatedby [43]:
DHT � DH298 ��T298
DCp dT �9�
DCp � Cp�Ti5Si3� ÿ 5Cp�Ti � ÿ 3Cp�Si � �10�
CHEN et al.: SHEAR LOCALIZATION AND CHEMICAL REACTION 3039
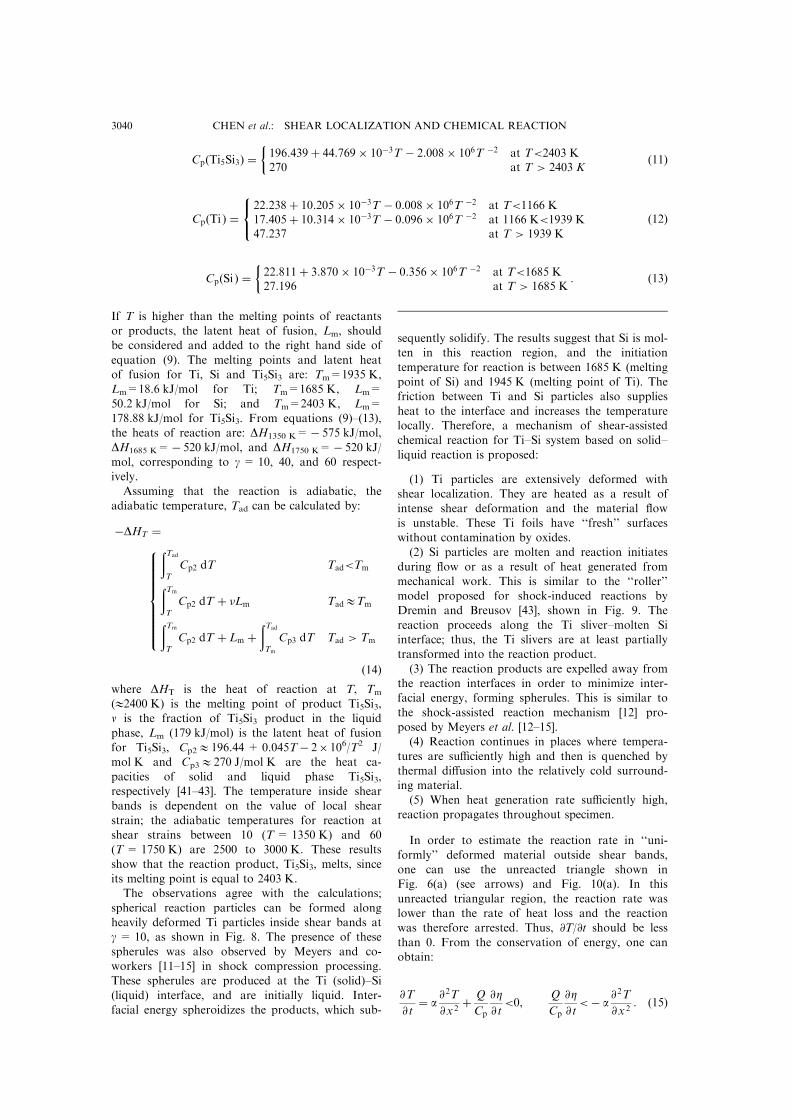
Cp�Ti5Si3� ��196:439� 44:769� 10ÿ3T ÿ 2:008� 106T ÿ2 at T<2403 K270 at T > 2403 K
�11�
Cp�Ti � �22:238� 10:205� 10ÿ3T ÿ 0:008� 106T ÿ2 at T<1166 K17:405� 10:314� 10ÿ3T ÿ 0:096� 106T ÿ2 at 1166 K<1939 K47:237 at T > 1939 K
8<: �12�
Cp�Si � ��22:811� 3:870� 10ÿ3T ÿ 0:356� 106T ÿ2 at T<1685 K27:196 at T > 1685 K
: �13�
If T is higher than the melting points of reactantsor products, the latent heat of fusion, Lm, shouldbe considered and added to the right hand side of
equation (9). The melting points and latent heatof fusion for Ti, Si and Ti5Si3 are: Tm=1935 K,Lm=18.6 kJ/mol for Ti; Tm=1685 K, Lm=
50.2 kJ/mol for Si; and Tm=2403 K, Lm=178.88 kJ/mol for Ti5Si3. From equations (9)±(13),the heats of reaction are: DH1350 K=ÿ 575 kJ/mol,
DH1685 K=ÿ 520 kJ/mol, and DH1750 K=ÿ 520 kJ/mol, corresponding to g = 10, 40, and 60 respect-ively.
Assuming that the reaction is adiabatic, theadiabatic temperature, Tad can be calculated by:
ÿDHT ��Tad
T
Cp2 dT Tad<Tm�Tm
T
Cp2 dT � �Lm Tad1Tm�Tm
T
Cp2 dT � Lm ��Tad
Tm
Cp3 dT Tad > Tm
8>>>>>>>><>>>>>>>>:�14�
where DHT is the heat of reaction at T, Tm
(12400 K) is the melting point of product Ti5Si3,n is the fraction of Ti5Si3 product in the liquid
phase, Lm (179 kJ/mol) is the latent heat of fusionfor Ti5Si3, Cp21196.44 + 0.045Tÿ 2�106/T2 J/mol K and Cp31270 J/mol K are the heat ca-
pacities of solid and liquid phase Ti5Si3,respectively [41±43]. The temperature inside shearbands is dependent on the value of local shear
strain; the adiabatic temperatures for reaction atshear strains between 10 (T= 1350 K) and 60(T = 1750 K) are 2500 to 3000 K. These results
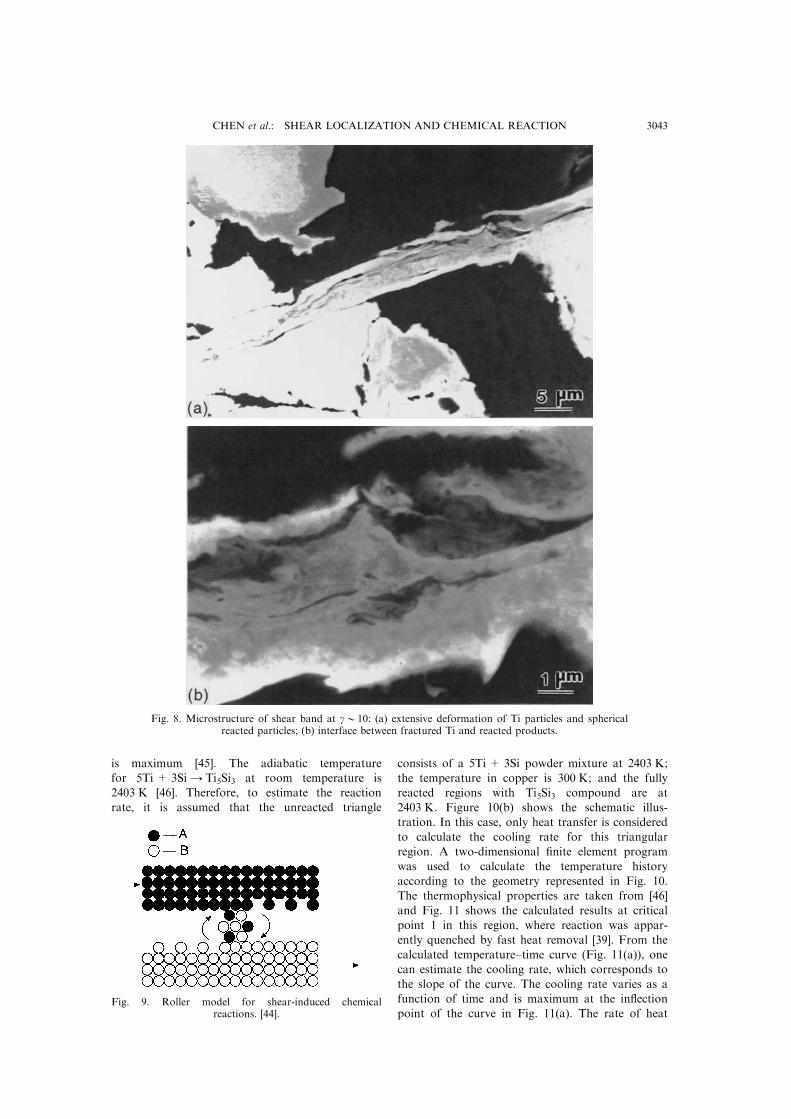
show that the reaction product, Ti5Si3, melts, sinceits melting point is equal to 2403 K.The observations agree with the calculations;
spherical reaction particles can be formed alongheavily deformed Ti particles inside shear bands atg = 10, as shown in Fig. 8. The presence of these
spherules was also observed by Meyers and co-workers [11±15] in shock compression processing.These spherules are produced at the Ti (solid)±Si
(liquid) interface, and are initially liquid. Inter-facial energy spheroidizes the products, which sub-
sequently solidify. The results suggest that Si is mol-ten in this reaction region, and the initiation
temperature for reaction is between 1685 K (meltingpoint of Si) and 1945 K (melting point of Ti). Thefriction between Ti and Si particles also supplies
heat to the interface and increases the temperaturelocally. Therefore, a mechanism of shear-assistedchemical reaction for Ti±Si system based on solid±
liquid reaction is proposed:
(1) Ti particles are extensively deformed withshear localization. They are heated as a result ofintense shear deformation and the material ¯ow
is unstable. These Ti foils have ``fresh'' surfaceswithout contamination by oxides.(2) Si particles are molten and reaction initiates
during ¯ow or as a result of heat generated frommechanical work. This is similar to the ``roller''model proposed for shock-induced reactions byDremin and Breusov [43], shown in Fig. 9. The
reaction proceeds along the Ti sliver±molten Siinterface; thus, the Ti slivers are at least partiallytransformed into the reaction product.
(3) The reaction products are expelled away fromthe reaction interfaces in order to minimize inter-facial energy, forming spherules. This is similar to
the shock-assisted reaction mechanism [12] pro-posed by Meyers et al. [12±15].(4) Reaction continues in places where tempera-
tures are su�ciently high and then is quenched bythermal di�usion into the relatively cold surround-ing material.(5) When heat generation rate su�ciently high,
reaction propagates throughout specimen.
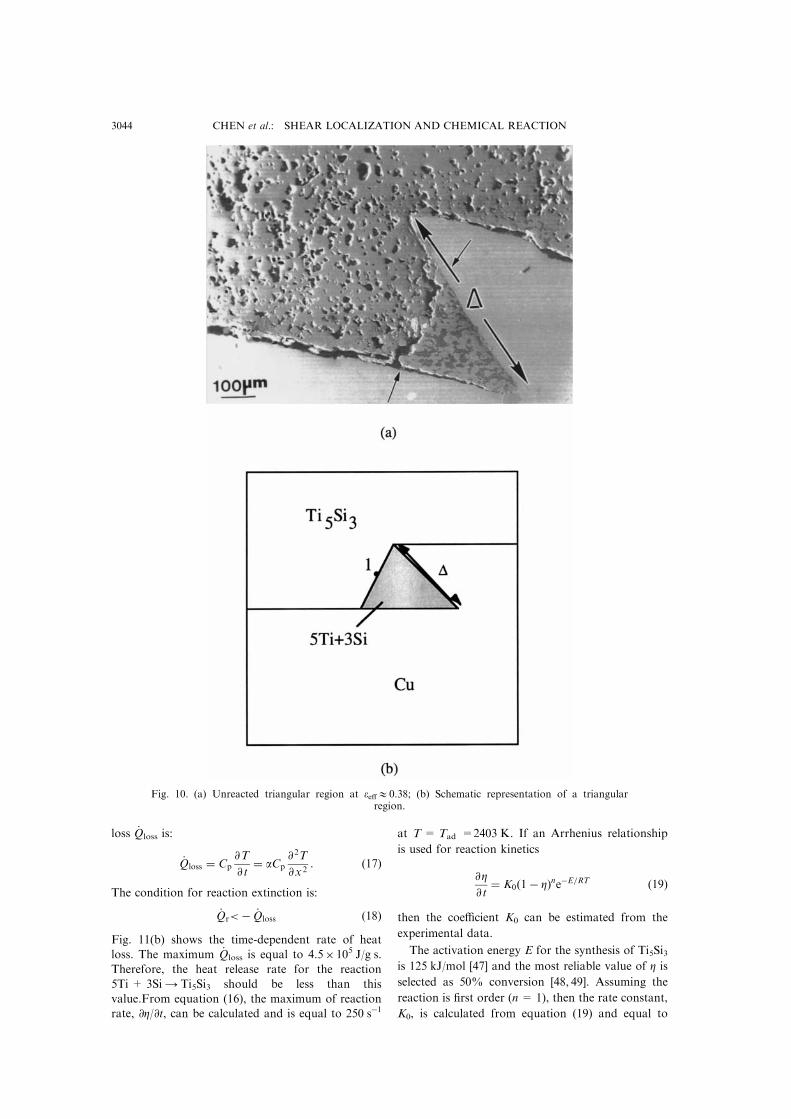
In order to estimate the reaction rate in ``uni-
formly'' deformed material outside shear bands,one can use the unreacted triangle shown inFig. 6(a) (see arrows) and Fig. 10(a). In this
unreacted triangular region, the reaction rate waslower than the rate of heat loss and the reactionwas therefore arrested. Thus, @T/@t should be less
than 0. From the conservation of energy, one canobtain:
@T
@ t� a
@ 2T
@x 2� Q
Cp
@Z@ t<0,
Q
Cp
@Z@ t<ÿ a
@ 2T
@x 2: �15�
CHEN et al.: SHEAR LOCALIZATION AND CHEMICAL REACTION3040
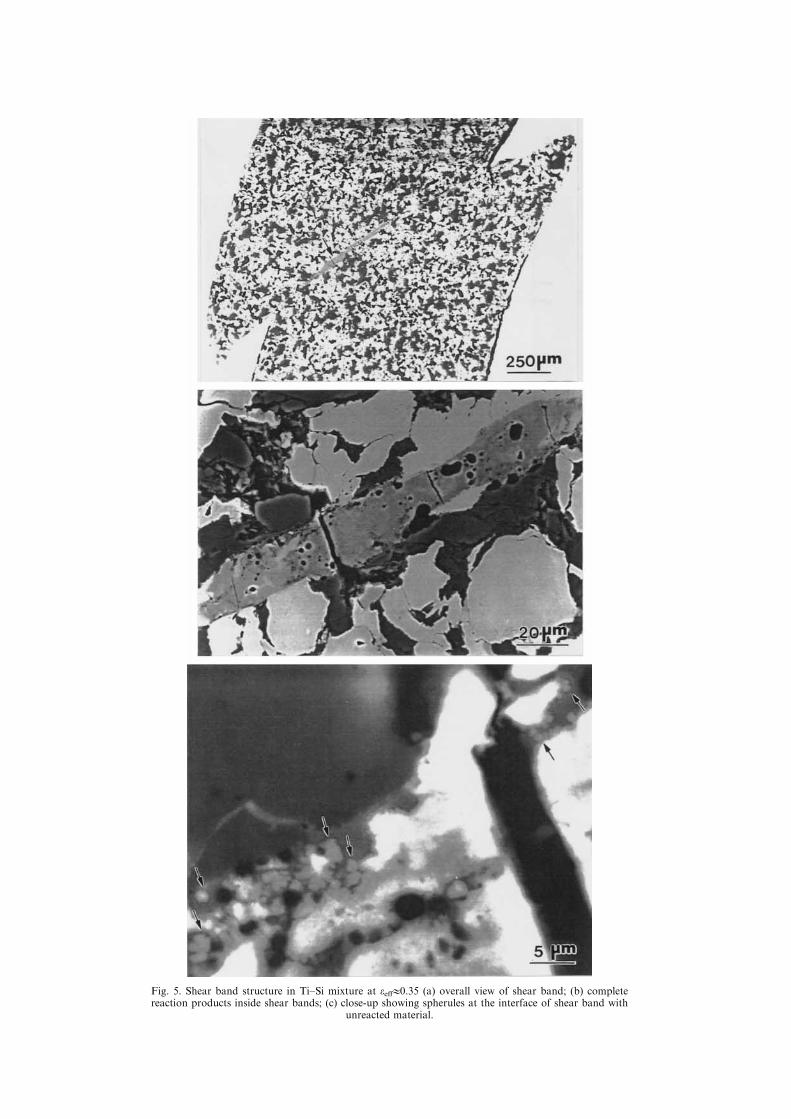
Fig. 5. Shear band structure in Ti±Si mixture at ee�10.35 (a) overall view of shear band; (b) completereaction products inside shear bands; (c) close-up showing spherules at the interface of shear band with
unreacted material.
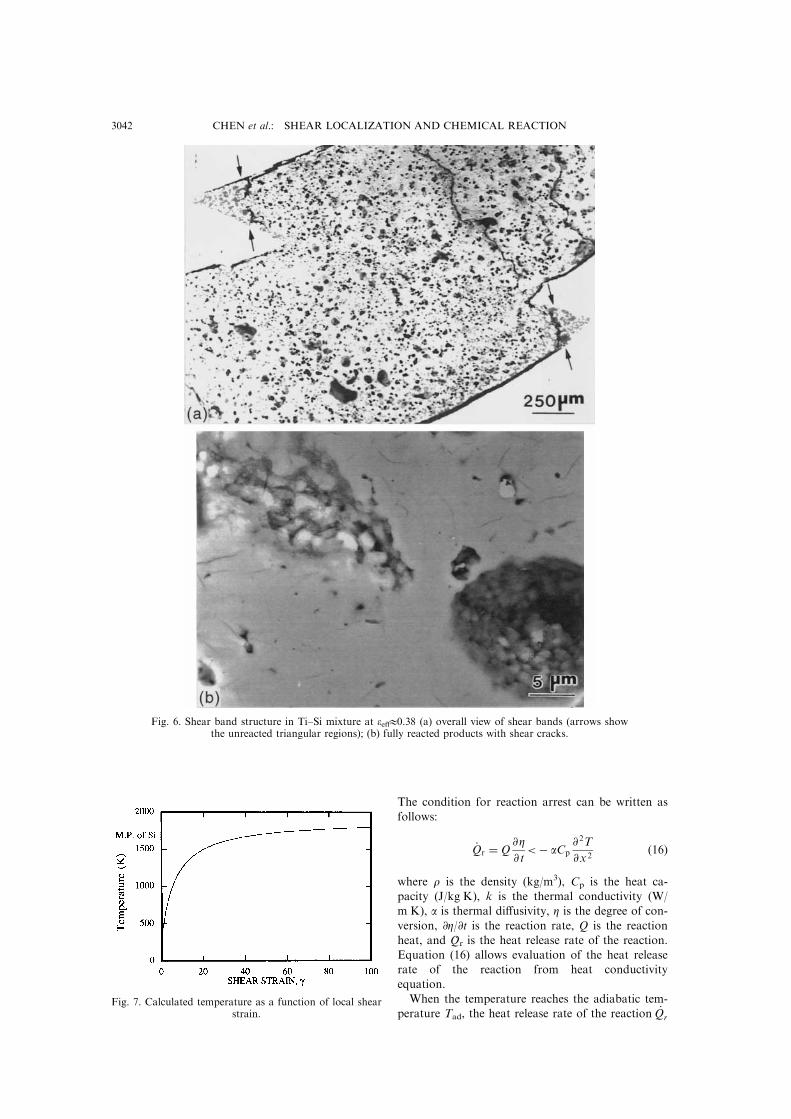
The condition for reaction arrest can be written as
follows:
_Qr � Q@Z@ t<ÿ aCp
@ 2T
@x 2�16�
where r is the density (kg/m3), Cp is the heat ca-
pacity (J/kg K), k is the thermal conductivity (W/
m K), a is thermal di�usivity, Z is the degree of con-
version, @Z/@t is the reaction rate, Q is the reaction
heat, and QÇ r is the heat release rate of the reaction.
Equation (16) allows evaluation of the heat release
rate of the reaction from heat conductivity
equation.
When the temperature reaches the adiabatic tem-
perature Tad, the heat release rate of the reaction _Qr
Fig. 6. Shear band structure in Ti±Si mixture at ee�10.38 (a) overall view of shear bands (arrows showthe unreacted triangular regions); (b) fully reacted products with shear cracks.
Fig. 7. Calculated temperature as a function of local shearstrain.
CHEN et al.: SHEAR LOCALIZATION AND CHEMICAL REACTION3042
is maximum [45]. The adiabatic temperature
for 5Ti + 3Si 4 Ti5Si3 at room temperature is
2403 K [46]. Therefore, to estimate the reaction
rate, it is assumed that the unreacted triangle
consists of a 5Ti + 3Si powder mixture at 2403 K;
the temperature in copper is 300 K; and the fully
reacted regions with Ti5Si3 compound are at
2403 K. Figure 10(b) shows the schematic illus-
tration. In this case, only heat transfer is considered
to calculate the cooling rate for this triangular
region. A two-dimensional ®nite element program
was used to calculate the temperature history
according to the geometry represented in Fig. 10.
The thermophysical properties are taken from [46]
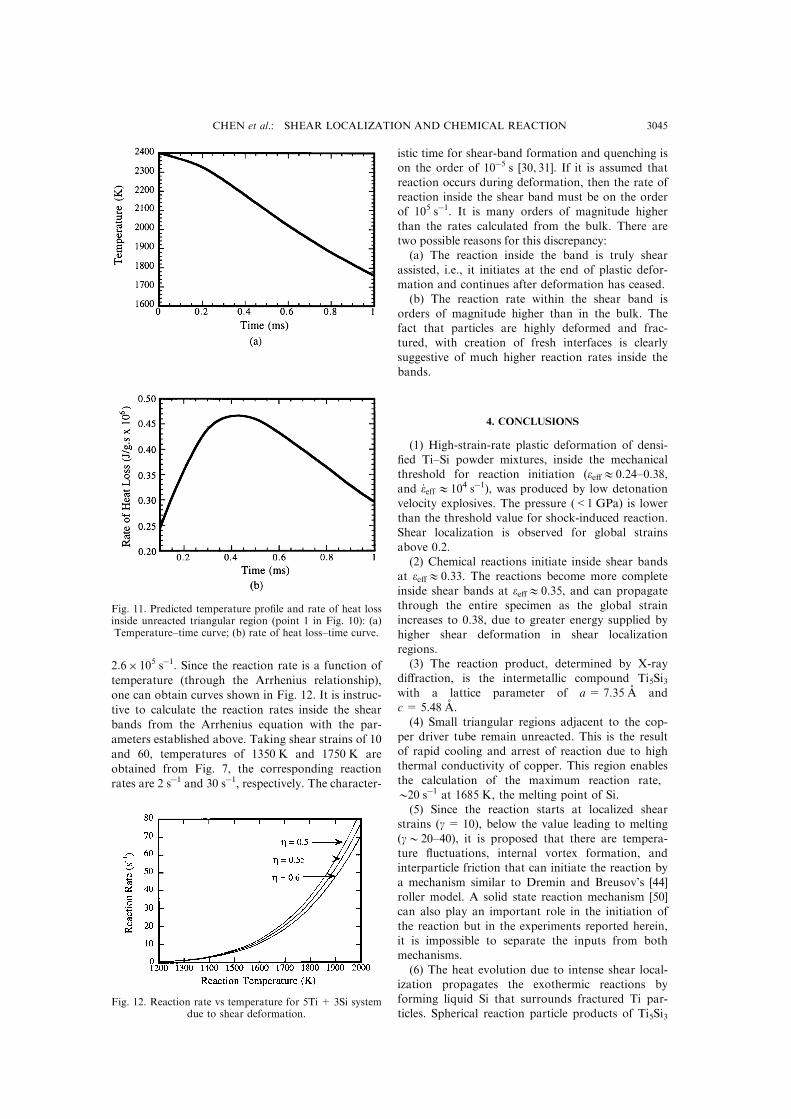
and Fig. 11 shows the calculated results at critical
point 1 in this region, where reaction was appar-
ently quenched by fast heat removal [39]. From the
calculated temperature±time curve (Fig. 11(a)), one
can estimate the cooling rate, which corresponds to
the slope of the curve. The cooling rate varies as a
function of time and is maximum at the in¯ection
point of the curve in Fig. 11(a). The rate of heat
Fig. 8. Microstructure of shear band at g010: (a) extensive deformation of Ti particles and sphericalreacted particles; (b) interface between fractured Ti and reacted products.
Fig. 9. Roller model for shear-induced chemicalreactions. [44].
CHEN et al.: SHEAR LOCALIZATION AND CHEMICAL REACTION 3043
loss _Qloss is:
_Qloss � Cp@T
@ t� aCp
@ 2T
@x 2: �17�
The condition for reaction extinction is:
_Qr<ÿ _Qloss �18�Fig. 11(b) shows the time-dependent rate of heat
loss. The maximum _Qloss is equal to 4.5�105 J/g s.
Therefore, the heat release rate for the reaction
5Ti + 3Si4 Ti5Si3 should be less than this
value.From equation (16), the maximum of reaction
rate, @Z/@t, can be calculated and is equal to 250 sÿ1
at T = Tad =2403 K. If an Arrhenius relationship
is used for reaction kinetics
@Z@ t� K0�1ÿ Z�neÿE=RT �19�
then the coe�cient K0 can be estimated from the
experimental data.
The activation energy E for the synthesis of Ti5Si3is 125 kJ/mol [47] and the most reliable value of Z is
selected as 50% conversion [48, 49]. Assuming the
reaction is ®rst order (n= 1), then the rate constant,
K0, is calculated from equation (19) and equal to
Fig. 10. (a) Unreacted triangular region at ee�10.38; (b) Schematic representation of a triangularregion.
CHEN et al.: SHEAR LOCALIZATION AND CHEMICAL REACTION3044
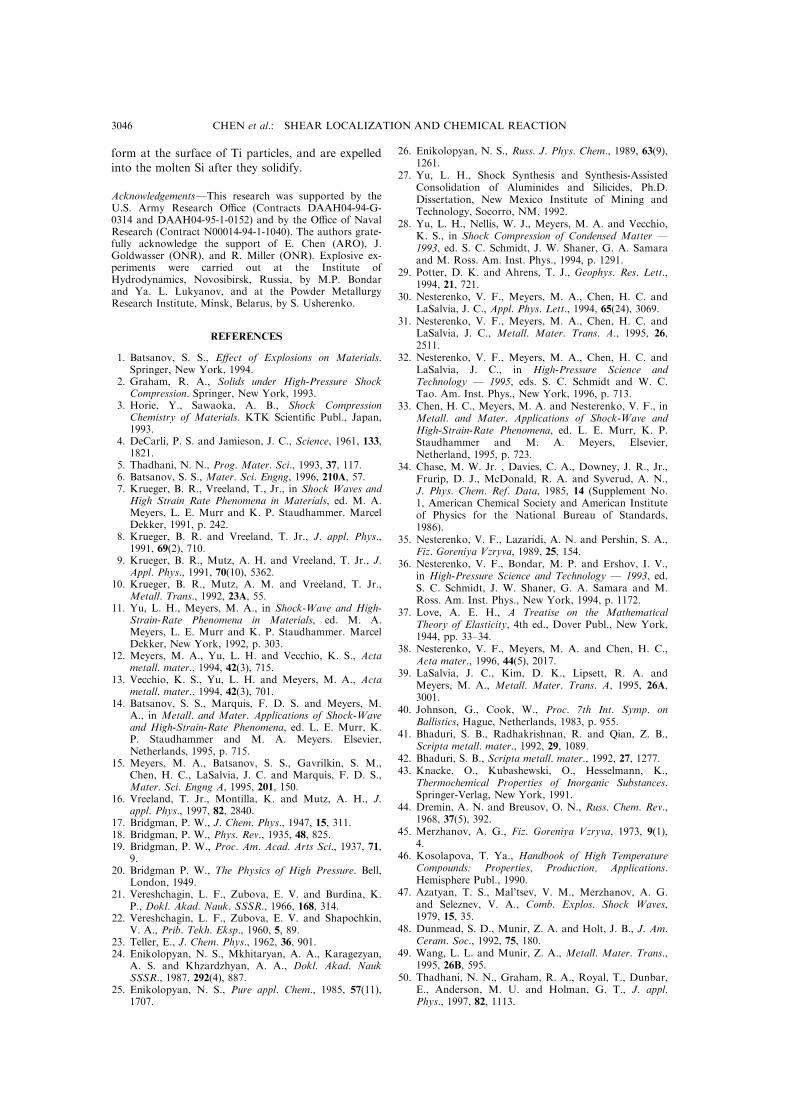
2.6�105 sÿ1. Since the reaction rate is a function of
temperature (through the Arrhenius relationship),
one can obtain curves shown in Fig. 12. It is instruc-
tive to calculate the reaction rates inside the shear
bands from the Arrhenius equation with the par-
ameters established above. Taking shear strains of 10
and 60, temperatures of 1350 K and 1750 K are
obtained from Fig. 7, the corresponding reaction
rates are 2 sÿ1 and 30 sÿ1, respectively. The character-
istic time for shear-band formation and quenching ison the order of 10ÿ5 s [30, 31]. If it is assumed that
reaction occurs during deformation, then the rate ofreaction inside the shear band must be on the orderof 105 sÿ1. It is many orders of magnitude higher
than the rates calculated from the bulk. There aretwo possible reasons for this discrepancy:(a) The reaction inside the band is truly shear
assisted, i.e., it initiates at the end of plastic defor-mation and continues after deformation has ceased.(b) The reaction rate within the shear band is
orders of magnitude higher than in the bulk. Thefact that particles are highly deformed and frac-tured, with creation of fresh interfaces is clearlysuggestive of much higher reaction rates inside the
bands.
4. CONCLUSIONS
(1) High-strain-rate plastic deformation of densi-®ed Ti±Si powder mixtures, inside the mechanicalthreshold for reaction initiation (ee�10.24±0.38,and _eeff 1104 sÿ1), was produced by low detonation
velocity explosives. The pressure (<1 GPa) is lowerthan the threshold value for shock-induced reaction.Shear localization is observed for global strains
above 0.2.(2) Chemical reactions initiate inside shear bands
at ee�10.33. The reactions become more complete
inside shear bands at ee�10.35, and can propagatethrough the entire specimen as the global strainincreases to 0.38, due to greater energy supplied by
higher shear deformation in shear localizationregions.(3) The reaction product, determined by X-ray
di�raction, is the intermetallic compound Ti5Si3with a lattice parameter of a = 7.35 AÊ andc = 5.48 AÊ .(4) Small triangular regions adjacent to the cop-
per driver tube remain unreacted. This is the resultof rapid cooling and arrest of reaction due to highthermal conductivity of copper. This region enables
the calculation of the maximum reaction rate,020 sÿ1 at 1685 K, the melting point of Si.(5) Since the reaction starts at localized shear
strains (g= 10), below the value leading to melting
(g020±40), it is proposed that there are tempera-ture ¯uctuations, internal vortex formation, andinterparticle friction that can initiate the reaction by
a mechanism similar to Dremin and Breusov's [44]roller model. A solid state reaction mechanism [50]can also play an important role in the initiation of
the reaction but in the experiments reported herein,it is impossible to separate the inputs from bothmechanisms.
(6) The heat evolution due to intense shear local-ization propagates the exothermic reactions byforming liquid Si that surrounds fractured Ti par-ticles. Spherical reaction particle products of Ti5Si3
Fig. 11. Predicted temperature pro®le and rate of heat lossinside unreacted triangular region (point 1 in Fig. 10): (a)Temperature±time curve; (b) rate of heat loss±time curve.
Fig. 12. Reaction rate vs temperature for 5Ti + 3Si systemdue to shear deformation.
CHEN et al.: SHEAR LOCALIZATION AND CHEMICAL REACTION 3045
form at the surface of Ti particles, and are expelledinto the molten Si after they solidify.
AcknowledgementsÐThis research was supported by theU.S. Army Research O�ce (Contracts DAAH04-94-G-0314 and DAAH04-95-1-0152) and by the O�ce of NavalResearch (Contract N00014-94-1-1040). The authors grate-fully acknowledge the support of E. Chen (ARO), J.Goldwasser (ONR), and R. Miller (ONR). Explosive ex-periments were carried out at the Institute ofHydrodynamics, Novosibirsk, Russia, by M.P. Bondarand Ya. L. Lukyanov, and at the Powder MetallurgyResearch Institute, Minsk, Belarus, by S. Usherenko.
REFERENCES
1. Batsanov, S. S., E�ect of Explosions on Materials.Springer, New York, 1994.
2. Graham, R. A., Solids under High-Pressure ShockCompression. Springer, New York, 1993.
3. Horie, Y., Sawaoka, A. B., Shock CompressionChemistry of Materials. KTK Scienti®c Publ., Japan,1993.
4. DeCarli, P. S. and Jamieson, J. C., Science, 1961, 133,1821.
5. Thadhani, N. N., Prog. Mater. Sci., 1993, 37, 117.6. Batsanov, S. S., Mater. Sci. Engng, 1996, 210A, 57.7. Krueger, B. R., Vreeland, T., Jr., in Shock Waves and
High Strain Rate Phenomena in Materials, ed. M. A.Meyers, L. E. Murr and K. P. Staudhammer. MarcelDekker, 1991, p. 242.
8. Krueger, B. R. and Vreeland, T. Jr., J. appl. Phys.,1991, 69(2), 710.
9. Krueger, B. R., Mutz, A. H. and Vreeland, T. Jr., J.Appl. Phys., 1991, 70(10), 5362.
10. Krueger, B. R., Mutz, A. M. and Vreeland, T. Jr.,Metall. Trans., 1992, 23A, 55.
11. Yu, L. H., Meyers, M. A., in Shock-Wave and High-Strain-Rate Phenomena in Materials, ed. M. A.Meyers, L. E. Murr and K. P. Staudhammer. MarcelDekker, New York, 1992, p. 303.
12. Meyers, M. A., Yu, L. H. and Vecchio, K. S., Actametall. mater., 1994, 42(3), 715.
13. Vecchio, K. S., Yu, L. H. and Meyers, M. A., Actametall. mater., 1994, 42(3), 701.
14. Batsanov, S. S., Marquis, F. D. S. and Meyers, M.A., in Metall. and Mater. Applications of Shock-Waveand High-Strain-Rate Phenomena, ed. L. E. Murr, K.P. Staudhammer and M. A. Meyers. Elsevier,Netherlands, 1995, p. 715.
15. Meyers, M. A., Batsanov, S. S., Gavrilkin, S. M.,Chen, H. C., LaSalvia, J. C. and Marquis, F. D. S.,Mater. Sci. Engng A, 1995, 201, 150.
16. Vreeland, T. Jr., Montilla, K. and Mutz, A. H., J.appl. Phys., 1997, 82, 2840.
17. Bridgman, P. W., J. Chem. Phys., 1947, 15, 311.18. Bridgman, P. W., Phys. Rev., 1935, 48, 825.19. Bridgman, P. W., Proc. Am. Acad. Arts Sci., 1937, 71,
9.20. Bridgman P. W., The Physics of High Pressure. Bell,
London, 1949.21. Vereshchagin, L. F., Zubova, E. V. and Burdina, K.
P., Dokl. Akad. Nauk. SSSR., 1966, 168, 314.22. Vereshchagin, L. F., Zubova, E. V. and Shapochkin,
V. A., Prib. Tekh. Eksp., 1960, 5, 89.23. Teller, E., J. Chem. Phys., 1962, 36, 901.24. Enikolopyan, N. S., Mkhitaryan, A. A., Karagezyan,
A. S. and Khzardzhyan, A. A., Dokl. Akad. NaukSSSR., 1987, 292(4), 887.
25. Enikolopyan, N. S., Pure appl. Chem., 1985, 57(11),1707.
26. Enikolopyan, N. S., Russ. J. Phys. Chem., 1989, 63(9),1261.
27. Yu, L. H., Shock Synthesis and Synthesis-AssistedConsolidation of Aluminides and Silicides, Ph.D.Dissertation, New Mexico Institute of Mining andTechnology, Socorro, NM, 1992.
28. Yu, L. H., Nellis, W. J., Meyers, M. A. and Vecchio,K. S., in Shock Compression of Condensed Matter Ð1993, ed. S. C. Schmidt, J. W. Shaner, G. A. Samaraand M. Ross. Am. Inst. Phys., 1994, p. 1291.
29. Potter, D. K. and Ahrens, T. J., Geophys. Res. Lett.,1994, 21, 721.
30. Nesterenko, V. F., Meyers, M. A., Chen, H. C. andLaSalvia, J. C., Appl. Phys. Lett., 1994, 65(24), 3069.
31. Nesterenko, V. F., Meyers, M. A., Chen, H. C. andLaSalvia, J. C., Metall. Mater. Trans. A., 1995, 26,2511.
32. Nesterenko, V. F., Meyers, M. A., Chen, H. C. andLaSalvia, J. C., in High-Pressure Science andTechnology Ð 1995, eds. S. C. Schmidt and W. C.Tao. Am. Inst. Phys., New York, 1996, p. 713.
33. Chen, H. C., Meyers, M. A. and Nesterenko, V. F., inMetall. and Mater. Applications of Shock-Wave andHigh-Strain-Rate Phenomena, ed. L. E. Murr, K. P.Staudhammer and M. A. Meyers, Elsevier,Netherland, 1995, p. 723.
34. Chase, M. W. Jr. , Davies, C. A., Downey, J. R., Jr.,Frurip, D. J., McDonald, R. A. and Syverud, A. N.,J. Phys. Chem. Ref. Data, 1985, 14 (Supplement No.1, American Chemical Society and American Instituteof Physics for the National Bureau of Standards,1986).
35. Nesterenko, V. F., Lazaridi, A. N. and Pershin, S. A.,Fiz. Goreniya Vzryva, 1989, 25, 154.
36. Nesterenko, V. F., Bondar, M. P. and Ershov, I. V.,in High-Pressure Science and Technology Ð 1993, ed.S. C. Schmidt, J. W. Shaner, G. A. Samara and M.Ross. Am. Inst. Phys., New York, 1994, p. 1172.
37. Love, A. E. H., A Treatise on the MathematicalTheory of Elasticity, 4th ed., Dover Publ., New York,1944, pp. 33±34.
38. Nesterenko, V. F., Meyers, M. A. and Chen, H. C.,Acta mater., 1996, 44(5), 2017.
39. LaSalvia, J. C., Kim, D. K., Lipsett, R. A. andMeyers, M. A., Metall. Mater. Trans. A, 1995, 26A,3001.
40. Johnson, G., Cook, W., Proc. 7th Int. Symp. onBallistics, Hague, Netherlands, 1983, p. 955.
41. Bhaduri, S. B., Radhakrishnan, R. and Qian, Z. B.,Scripta metall. mater., 1992, 29, 1089.
42. Bhaduri, S. B., Scripta metall. mater., 1992, 27, 1277.43. Knacke, O., Kubashewski, O., Hesselmann, K.,
Thermochemical Properties of Inorganic Substances.Springer-Verlag, New York, 1991.
44. Dremin, A. N. and Breusov, O. N., Russ. Chem. Rev.,1968, 37(5), 392.
45. Merzhanov, A. G., Fiz. Goreniya Vzryva, 1973, 9(1),4.
46. Kosolapova, T. Ya., Handbook of High TemperatureCompounds: Properties, Production, Applications.Hemisphere Publ., 1990.
47. Azatyan, T. S., Mal'tsev, V. M., Merzhanov, A. G.and Seleznev, V. A., Comb. Explos. Shock Waves,1979, 15, 35.
48. Dunmead, S. D., Munir, Z. A. and Holt, J. B., J. Am.Ceram. Soc., 1992, 75, 180.
49. Wang, L. L. and Munir, Z. A., Metall. Mater. Trans.,1995, 26B, 595.
50. Thadhani, N. N., Graham, R. A., Royal, T., Dunbar,E., Anderson, M. U. and Holman, G. T., J. appl.Phys., 1997, 82, 1113.
CHEN et al.: SHEAR LOCALIZATION AND CHEMICAL REACTION3046