sheela foam limited · overviewof the indian mattress and pu foam industries iii.investment thesis...
TRANSCRIPT

Sheela Foam Limited

2
I. Introduction to Sheela Foam Limited
II. Overview of the Indian mattress and PU Foam industries
III.Investment thesis
V. Strategy and outlook
Appendix
IV. Operational and financial performance

3
Australia BusinessIndia Business
Overview of Sheela Foam Limited
1Net revenue from operations; 2EBITDA = Profit before tax + Finance costs + Depreciation & amortization
expenses – Other income; 3Includes sale of technical foam manufactured in India and PU foam manufactured in Australia
Background: Established in 1971, Sheela Foam Limited (“Sheela Foam” or
the “Company”) manufactures mattresses, other foam-based home comfort
products and technical grades of PU Foam
Products: Mattresses, furniture-cushioning material, pillows, bolsters
cushions, sofa-cum beds, and other products
Manufacturing facilities:
• Owns and operates 11 manufacturing facilities in India
• All facilities manufacture home comfort products, while five of these
facilities also manufacture PU Foam with a total capacity of 123,000 TPA
Distribution network: 110+ exclusive distributors, 2,600+ exclusive retail
dealers and 3,500+ multi-brand outlets, as on June 30, 2017
• 315 Sleepwell Worlds,436 Sleepwell Galleries and 1037 Sleepwell Shoppes
and 860 Exclusive Mattress Dealers as at June 30, 2017
• Exports of technical foam to Middle East, South Asia, Europe, United States,
Brazil and Argentina
10.4 11.5 12.7 14.2 15.5 17.5
5.3%7.1% 6.7% 6.4%
11.4% 11.1%
0.7%2.7% 2.2% 3.0%
6.8% 7.1%
2011-12 2012-13 2013-14 2014-15 2015-16 2016-17
Revenue¹
EBITDA² margin
Net profit margin
Net debt
Net worth
2.28
1.38
1.82
1.70
1.11
1.97
0.29
2.45
(1.02)
3.38
Background: Sheela Foam has a strong presence in Australia through its
wholly owned subsidiary, Joyce Foam Pty Ltd (“Joyce Foam”)
• Acquired the business of manufacture of PU Foam and polystyrene products
of three Australian companies, namely, Joyce Corporation Limited, Joyce
Indpac Limited and Marfoam Pty Limited through Joyce Foam in 2005
Manufacturing facilities:
• Owns and operates five manufacturing facilities in Australia
• Facility in Sydney is engaged in manufacture and processing of PU Foam,
while the others are engaged in processing of PU Foam (sourced from
Sydney unit)
• Installed capacity of 10,500 TPA of foam manufacturing in fiscal year 2017
Distribution network: Sells its products to manufacturers of comfort
products, furniture and automotive components in Australia and New Zealand
83%
17%
Geographical segments
India
OutsideIndia 66%
34%
Product segments
Homecomfort
Foam³
Key restated consolidated financials (INR bn) Revenue break-up (fiscal year 2017)
(1.62)
4.63

4
Evolution of Sheela Foam as the leading manufacturer of mattresses and PU Foam in India
1971: Incorporation of the Company
1997: Start of rubberized coir production in Pondicherry and Sahibabad
1996-97: Set up manufacturing facilities at Silvassa and Hyderabad
2001: Set up of manufacturing facility in Greater Noida
2005:• Incorporation of Joyce
• Acquisition of the business of Joyce Corporation, Joyce Indpac and Marfoam by Joyce
2003: • Acquisition of Auora Foams
• Merger with Feather Foam Enterprises, Soft Foam Industries and Pallavi Foam Industries
2011: Set up of manufacturing facility in Erode
2013: Merger with SNB Bedding International, RG Pillow (India), Kanpav Overseas and Auora Foams
2003:Set-up of manufacturing facility at Sikkim
2011: Merger with Serta India
New business initiatives
Capital expenditure
Merger / Acquisition / JV / Listing
2015: Launch of My Mattress line
1972: • Start of manufacturing at Sahibabad plant
• Launch of
1994:• Launch of
Sheela Foam gets Listed in 2016
Launches economy model “STARLITE” to increase market share after GST – July 2017

5
Product portfolio
Sheela Foam can leverage the existing suite of products and manufacturing capabilities to produce niche, more
sophisticated and higher-margin products
Product Product lines End-use industries
Automotive foams
Poly-ester foam, Poly-ether foam
Seat covers, Sound absorption systems, Sun visors, Headliners, Door trims, Lamination systems
Reticulated foam
Ester-based foam, Ether-based foam
Filtration systems, Ceramic foam filters, Outdoor furniture, Microphones and headphones, Safety fuel tanks, Ink cartridges
Ultra Violet Stable foam
-Sportswear, Innerwear and lingerie, Clothing, Swimwear, Comfort accessories for shoes
Silentech foam
Ester based PU Foam
Automotive, Diesel generator canopies, Theatres, auditoriums, indoor stadiums, Broadcasting rooms and recording studios, Industrial silencers, Acoustic enclosures, Engine testing rooms
Product Product lines
MattressesMy Mattress, Spring range, Technology range, Back support range, Flexi PUF range, Showroom range, Economy Range
Furniture-cushioning material
Sleepwell Resitec, Sleepwell Cool Gel, Primo, Feather Foam
Pillows Fibre range, Flexi PUF range, Premium range
Bolsters and cushions
-
Sofa-cum beds Sofa and Bed
Other products Comfort range accessories
Home comfort products Technical foam products
6
I. Introduction to Sheela Foam Limited
II. Overview of the Indian mattress and PU Foam industries
III.Investment thesis
V. Strategy and outlook
Appendix
IV. Operational and financial performance
7
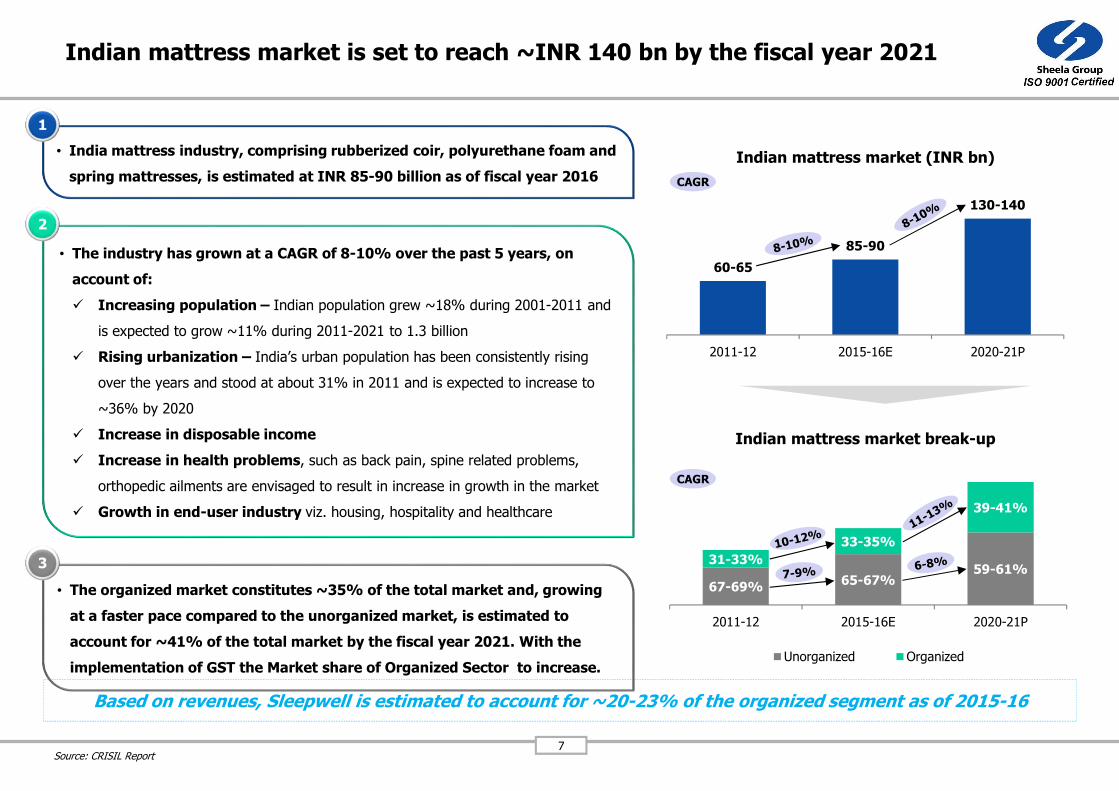
Indian mattress market is set to reach ~INR 140 bn by the fiscal year 2021
Source: CRISIL Report
• India mattress industry, comprising rubberized coir, polyurethane foam and
spring mattresses, is estimated at INR 85-90 billion as of fiscal year 2016
1
• The industry has grown at a CAGR of 8-10% over the past 5 years, on
account of:
� Increasing population – Indian population grew ~18% during 2001-2011 and
is expected to grow ~11% during 2011-2021 to 1.3 billion
� Rising urbanization – India’s urban population has been consistently rising
over the years and stood at about 31% in 2011 and is expected to increase to
~36% by 2020
� Increase in disposable income
� Increase in health problems, such as back pain, spine related problems,
orthopedic ailments are envisaged to result in increase in growth in the market
� Growth in end-user industry viz. housing, hospitality and healthcare
2
• The organized market constitutes ~35% of the total market and, growing
at a faster pace compared to the unorganized market, is estimated to
account for ~41% of the total market by the fiscal year 2021. With the
implementation of GST the Market share of Organized Sector to increase.
3
67-69%65-67%
59-61%31-33%
33-35%
39-41%
2011-12 2015-16E 2020-21P
Indian mattress market break-up
Unorganized Organized
Based on revenues, Sleepwell is estimated to account for ~20-23% of the organized segment as of 2015-16
60-65
85-90
130-140
2011-12 2015-16E 2020-21P
Indian mattress market (INR bn)
CAGR
CAGR

8
Organized mattress market in India is placed favorably for PU Foam mattresses
Source: CRISIL Report
• PU Foam mattresses account for 49-51% share of the organized market
• The dominant market share of PU Foam mattresses can be attributed to the
following:
� Inherent quality, durability and comparable pricing of PU Foam mattresses
� Falling demand for rubberized coir mattresses due to increasing price of rubber and
inherent quality issues such as premature sagging
� While the demand for spring mattresses has increased significantly over the last few
years, they are more popular in urban regions, given their high pricing
• While share of rubberized coir mattresses will continue to decline over next 5
years, PU Foam segment will maintain its share in the organized market
Indian organized mattress market by type
of mattress
PU Foam Rubberized coir Spring
49-51%
29-31%
19-21%
49-51%
20-22%
28-30%
2015-16E 2020-21E
PU Foam mattresses account for the highest (~50%) share of the organized mattress market in India
Other key attributes of the organized mattress market in India
Market classification based on distribution channel
87-89%
9-11%Less than 3%
Distributors and dealers
Owned / franchisee stores
Online sales
Market classification based on usage
Residential80-85%
Institutional15-20%
Comprises of hotels, hospitals and
educational institutions

9
25-30 32-3753-58
10-15
17-22
33-38
35-45
50-60
85-95
2011-12 2015-16E 2020-21P
Indian flexible PU Foam market (INR bn)
Slabstock Moulded
CAGR
Indian flexible PU foam market is set to reach ~INR 90 bn by the fiscal year 2021
Source: CRISIL Report
Types of polyurethane foam Key applications
Polyurethane foam
Flexible PU foam
Rigid PU foam
Slabstock
Moulded
• Mattress
• Furniture
• Bedding
• Carpetunderlay
• Garments
• Footwear
• Acoustic insulation
• Automotive seating
• Refrigeration
• Thermo-ware
• Industrial insulation
• Furniture
Indian flexible PU Foam market
Indian flexible PU Foam market break-up (fiscal year 2016)
67-72%
10-15%
9-14%3-8%
Mattress & furniture Automotive
Footwear Others
80-90%
10-20%
Automotive Others
Moulded30-35%
Slabstock65-70%

10
I. Introduction to Sheela Foam Limited
II. Overview of the Indian mattress and PU Foam industries
III.Investment thesis
V. Strategy and outlook
Appendix
IV. Operational and financial performance

11
Key competitive strengths
Well recognized and established brand built over consistent quality and innovationWell recognized and established brand built over consistent quality and innovation1
Extensive and well developed pan-India sales and distribution networkExtensive and well developed pan-India sales and distribution network2
Well qualified and professional managementWell qualified and professional management5
Quality manufacturing capabilities and technological innovationQuality manufacturing capabilities and technological innovation3
Integrated operations and economies of scaleIntegrated operations and economies of scale4

12
Well recognized and established brand built over consistent quality and innovation
20 – 23%Share of branded mattresses in the Indian
organized mattress market for the fiscal year 2016
Launched in 1994
Developed through “innovation”… …and personalization / customization…
Radio frequency identification (“RFID”) chips in mattresseshelps check counterfeits and ensures tracking of Sleepwell sales andcurtailing of unauthorized sales
“Zero Turn” technology ensures that mattresses do not requireperiodic turning to avoid sagging
“Breathable visco-elastic” or “Memory foam” reduces stress,ensures correct sleep posture and improves blood circulation; Alsoinduces faster recovery of the mattresses to original shape
“Health Fresh” technology designed to preserve hygiene andeliminate odour
“SANtech” technology maintains improved air-flow, therebyenhancing the firmness and durability of the upholstery material
An initiative whereby mattresses are suggested that arebest suited to an individual’s body structure, weight andpressure distribution, based on diagnostic and statisticalsleep measurements recorded on a senso-bed
Available in multiple variants:
…and supported by significant ad spends
278 322 365 493 681 760
2.7% 2.8% 2.9% 3.5% 4.4% 4.3%
2011-12 2012-13 2013-14 2014-15 2015-16 2016-17
Consolidated AdEx (INR mn)
Consolidated AdEx (% of consolidated net revenue from operations)
1
Firmtec
Supportec
Softec

13
Extensive and well developed pan-India sales and distribution network
1. As on 30.6.2017
1101+ exclusive
distributors
More than 26001
exclusive retail dealers+
More than 3,5001
multi brand outlets
Pan-India network of exclusive distributors and retail dealers for home-comfort products
Most distributors have been associated with the Company for over 20 years Long term association
Exclusive distributors are typically engaged in strategic proximity to the manufacturing
facilities, which helps reduce carriage expenses and minimize product damage
Strategic proximity
The distribution network is well integrated with the Company’s IT platforms, that
enables tracking secondary sales made by the distributors and dealers in real time
IT integration
Around 150 sales personnel who actively engage with key distributorsContinuous
engagement
10371 Sleepwell Shoppes
Average size ~200 sq. ft.
4361 Sleepwell Galleries
Average size ~600 sq. ft.
3151 Sleepwell Worlds
Average size ~1,000 sq. ft.
Exclusive Sleepwell outlets
across 3 formats
Dedicated distribution network for technical foam products
• Technical foam grades are sold to finished products manufacturers in India, Middle East, South Asia, Europe, Australia, USA, Brazil and Argentina
• The Company has a dedicated sales team which handles business development and relationship management the technical foam manufacturing business
2

14
Quality manufacturing capabilities and technological innovation
1For the fiscal year 2016
Sahibabad (UP)
Kala Amb (HP)Rajpura (Punjab)
Surajpur (UP)
Greater Noida (UP)
Jalpaiguri (WB)
Talwada (Gujarat)
Silvassa (D&N Haveli)
Hyderabad (Telangana)
Erode (Tamil Nadu)PU Foam manufacturing and processing
PU Foam processing
• 11 manufacturing facilities in India
• All facilities manufacture home comfort products, while five of these also
manufacture PU Foam with a total capacity of 123,000 TPA
Large productioncapacity
Four units located in the North, three units in the West, two units in the
South and two units in the Eastern regions of India
Geographically dispersed
Four facilities are located in close proximity to major Indian ports which
facilitates cost-effective import of raw materials as well export of
technical foam to overseas manufacturers
Proximity to major ports
• Hennecke foaming machines in most of the foam manufacturing units
• Three of the facilities are ISO:9001 certified
Advanced technology
• Introduced polyester foam in 2009, which are characterized by open
cellular structures enabling greater compressibility and flexibility
• Also introduced economic HR foams that provide high resilience and
Silentech foam which provides high noise reduction
Extensive R&D
The Company’s Australian subsidiary, Joyce, further enhances the manufacturing prowess of the Company
• 5 manufacturing facilities in Australia
• Sydney facility is engaged in manufacture and processing of PU Foam
with an installed capacity of 10,5001 TPA of foam
• The other four facilities are engaged in processing of PU Foam
Productioncapacity
• Compression technology that enables transport of higher volumes
• Variable pressure foaming which involves foaming in an air-tight
environment enabling production of more flexible and durable foam
Production expertise
3
Sydney+
4 other PU foam processing facilities

15
Integrated operations and economies of scale
The Company benefits from synergized business operations through the manufacture of home comfort products as well as
the underlying foam; As a result of this, the Company does not source PU Foam from external suppliersBackward integration
Six of the manufacturing units (five in India and one in Australia) are capable of producing both PU Foam and finished
home comfort products thereby enabling better production planning and executionManufacturing synergies
The Company typically utilizes logistics infrastructure hired for supply of raw materials to the manufacturing facilities for
onward supply of finished products and foams to the distributorsReverse logistics benefits
Such business synergies effect reduction in the Company’s operating expenses and enables upscale operations in an
efficient and seamless manner
The Company benefits from the technical expertise of its Australian subsidiary, Joyce
Joyce has provided the Company with access to cutting edge technologies such as “Variable Pressure Foaming” etc.
Benefits due to presence in multiple geographies
The Company has successfully leveraged its expertise in manufacture of home-comfort products to effectively consolidate
the other business of manufacture of technical foam
Benefits of wide product bouquet
4

16
Well qualified and professional management
Board of Directors Key management personnel
Sheela GautamChairperson Emeritus
Over 45 years of experience in the business of manufacture of home comfort products and polyurethane foam
Holds a bachelor’s degree in education and a bachelor’s degree in arts from Lucknow University
Was a member of the Lok Sabha from 1991 to 2004
Rahul GautamManaging Director
Managing Director since April 1, 1996
Over 40 years of experience in the industry
B.Tech, IIT Kanpur; Masters in Science (Chemical Engineering), Polytechnic Institute of New York
Namita GautamWhole-time Director
Whole-time Director since 2003
Heads CSR initiative through Sleepwell Foundation
Rakesh ChaharWhole-time Director
Whole-time director since 2003
Chairman of the Indian Sleep Products Federation
Tushaar GautamWhole-time Director
Whole-time Director since 2007
Oversees the subsidiary Joyce Foam
Ravindra DhariwalIndependent Director
Associated with the Company since 2016
On the board of Varun Beverages
Vijay Kumar ChopraIndependent Director
Associated with the Company since 2016
Has been the Chairman and Managing Director of Corporation Bank and SIDBI
Som MittalIndependent Director
Associated with the Company since 2016
Held leadership roles in Digital, HP and Compaq
Anil TandonIndependent Director
Associated with the Company since 2016
Has been the Managing Director of Tex Corp Ltd.
Mahesh N. GopalasamudramCOO
Associated with the Company since 2015
Was previously associated with Dow Chemical International and Manali Petrochemicals Limited
Dhruv Chandra MathurCFO
Associated with the Company since 2012
Was previously associated with Holostik India, Hotline Glass and Hotline Teletube and Components
Pertisth MankotiaCIO and CHRO
Associated with the Company since 1995
Has over 20 years of experience in the IT sector
Md. Iquebal AhmadCompany Secretary and Compliance Officer
Associated with the Company since 2008
Was previously associated with Golden Overseas and AVA Associates
Frank Joseph van GoghCEO - Joyce Foam
Associated with the Joyce group since 2000
Was previously associated with Rotoflow Corporation, Atlas Copco and Lightnin Mixers
Edward John DoddsFinancial Controller -Joyce Foam
Associated with the Joyce group since 2000
An associate of the Australian Society of Certified Practicing Accountants
5

17
I. Introduction to Sheela Foam Limited
II. Overview of the Indian mattress and PU Foam industries
III.Investment thesis
V. Strategy and outlook
Appendix
IV. Operational and financial performance
18
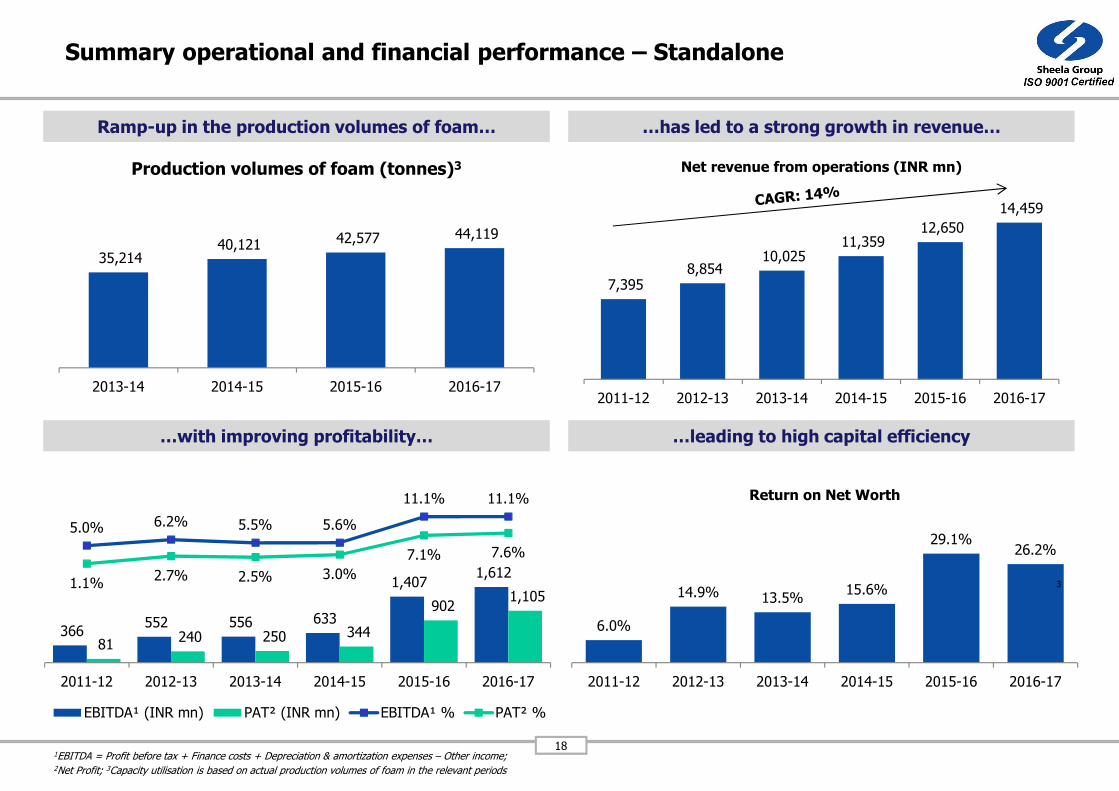
Summary operational and financial performance – Standalone
1EBITDA = Profit before tax + Finance costs + Depreciation & amortization expenses – Other income; 2Net Profit; 3Capacity utilisation is based on actual production volumes of foam in the relevant periods
Ramp-up in the production volumes of foam… …has led to a strong growth in revenue…
35,214 40,121 42,577 44,119
2013-14 2014-15 2015-16 2016-17
Production volumes of foam (tonnes)3
7,395 8,854
10,025 11,359
12,650
14,459
2011-12 2012-13 2013-14 2014-15 2015-16 2016-17
Net revenue from operations (INR mn)
…with improving profitability… …leading to high capital efficiency
366 552 556 633
1,407 1,612
81 240 250 344
902 1,105
5.0% 6.2% 5.5% 5.6%
11.1% 11.1%
1.1%2.7% 2.5% 3.0%
7.1% 7.6%
2011-12 2012-13 2013-14 2014-15 2015-16 2016-17
EBITDA¹ (INR mn) PAT² (INR mn) EBITDA¹ % PAT² %
6.0%
14.9% 13.5%15.6%
29.1%26.2%
2011-12 2012-13 2013-14 2014-15 2015-16 2016-17
Return on Net Worth
3
19
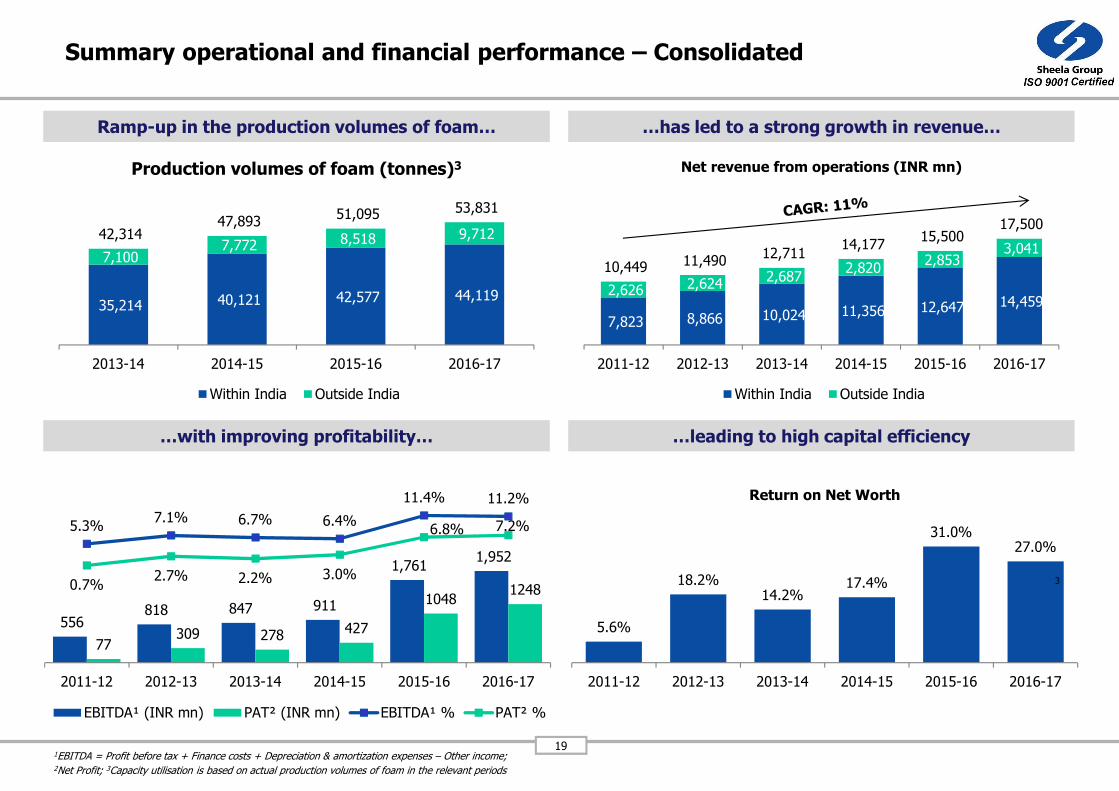
Summary operational and financial performance – Consolidated
1EBITDA = Profit before tax + Finance costs + Depreciation & amortization expenses – Other income; 2Net Profit; 3Capacity utilisation is based on actual production volumes of foam in the relevant periods
Ramp-up in the production volumes of foam… …has led to a strong growth in revenue…
35,214 40,121 42,577 44,119
7,100 7,772 8,518 9,712 42,314 47,893
51,095 53,831
2013-14 2014-15 2015-16 2016-17
Production volumes of foam (tonnes)3
Within India Outside India
7,823 8,866 10,024 11,356 12,647 14,459 2,626 2,624
2,687 2,820
2,853 3,041
10,449 11,490 12,711
14,177 15,500
17,500
2011-12 2012-13 2013-14 2014-15 2015-16 2016-17
Net revenue from operations (INR mn)
Within India Outside India
…with improving profitability… …leading to high capital efficiency
556 818 847 911
1,761 1,952
77309 278 427
10481248
5.3%7.1% 6.7% 6.4%
11.4% 11.2%
0.7%2.7% 2.2% 3.0%
6.8% 7.2%
2011-12 2012-13 2013-14 2014-15 2015-16 2016-17
EBITDA¹ (INR mn) PAT² (INR mn) EBITDA¹ % PAT² %
5.6%
18.2%14.2%
17.4%
31.0%27.0%
2011-12 2012-13 2013-14 2014-15 2015-16 2016-17
Return on Net Worth
3

20
I. Introduction to Sheela Foam Limited
II. Overview of the Indian mattress and PU Foam industries
III.Investment thesis
V. Strategy and outlook
Appendix
IV. Operational and financial performance

21
Strategy going forward (1 of 2)
Continue to develop the brand
Continue building brand leadership in core home comfort products, such as mattresses and bedding material, as well as
higher-grade technical PU Foam lines which represents a significant opportunity for our future growth
Consolidate customer recall of various customized product sub-brands under Sleepwell such as My Mattress and
initiatives such as Perfect Match
Intend to accomplish this by: Promoting the brands through different forms of marketing, increasing retail presence,
capitalizing on the strength of distribution network and developing “Sleepedia” website
Continue to focus on development of
personalized products
Due to rising disposable incomes and the evolving perception of mattresses as health investments, the demand for
premium segment mattresses is expected to grow at a faster pace than those in the economy and mid-range segment
(Source: CRISIL Report)
To this end, the Company intends to manufacture higher volumes of customized products as well as develop newer
lines of personalized home-comfort products to improve operating margins
Expand product portfolio to cater to
consumer preferences
Leverage existing suite of products, knowhow and manufacturing capabilities to produce niche and higher-margin
products including more sophisticated grades of technical PU Foam
Enter into new product lines and target new consumer segments
• Create a new range of base-line comfort products at lower price points specifically aimed at rural retail customers

22
Strategy going forward (2 of 2)
Expand distribution network and export
sales
Further develop the domestic sales network in two types of territories:
• Characterized by lower transportation costs
• Significant demand of the Company’s products, where price-points can effectively offset higher transportation costs
Intends to upscale export operations to sell higher volumes of technical foam to manufacturers located in SAARC nations
Expand domestic retail presence and launch Sleepwell branded ultra-premium showrooms titled “Sleepwell Emporios” on
a franchisee basis
Adoption of advanced
production technology
Intends to successfully implement vertical variable foaming technology, a production technology that the Company has
innovated in manufacturing operations
Intends to introduce “polyol recycling” technology that will assist to produce polyol, one of the key raw materials, by
using foam scrap, fresh polyol and other chemicals
Expand distributed manufacturing
initiative
Has outsourced the production of lower density commercial PU foam cores to independent manufacturers
• Outsourcing their production has led to increase in the production volumes of higher density premium foams
As at September 30, 2016, the Company has entered into arrangements with independent manufacturers, some of
whom are required to exclusively supply to the Company, to produce lower density PU foam at six facilities
Intends to progressively increase the scale of such distributed manufacturing

23
I. Introduction to Sheela Foam Limited
II. Overview of the Indian mattress and PU Foam industries
III.Investment thesis
V. Strategy and outlook
Appendix
IV. Operational and financial performance

24
Appendix I: Shareholding pattern as of June 30, 2017
1Held jointly with Mr. Tushaar Gautam; 2Mr. Tushaar Gautam also holds 17,561,880 Equity Shares jointly with Ms. Sheela Gautam
S.N. Name of shareholder # Equity shares % shareholding
Promoters
Ms. Sheela Gautam 17,561,8801 36.00
Mr. Rahul Gautam 9,955,419 20.41
Polyflex Marketing Private Limited 65,51,373 13.43
Promoter Group
Ms. Namita Gautam 5,715,879 11.72
Mr. Tushaar Gautam 1,987,9202 4.08
Rangoli Resorts Private Limited 12,018 0.02
Core Mouldings Private Limited 12,018 0.02
Promoter & Promoter Group 41,796,507 85.68
Public 6,986,301 14.32
Total 48,782,808 100.00

25
Appendix II: Organization structure
Managing Director
Director CSRDirector
Sales &Marketing
Director
Busi. & Tech. Development
CIO
CHROCOO CFO
Head MarketingHOS
Bedding
HOS
Furniture Cushioning
HOS
Industrial Grade
HOS
Tech & Export
Head Fire
Safety
HOD - EZ
HOD - WZ
HOD - SZ
HOD - NZ
Head SCM
Head Projects
Head R&D

26
Appendix III: Major awards
Year Award
2008 CNBC-NASSCOM IT User award for ‘Best IT adoption in manufacturing – SME Sector’
2009 EDGE award for usage of IT for maximizing business impact
2010
CIO Green Edge award
CIO 100 Honouree award for excellence in strategic enterprise IT deployment
EDGE award for usage of IT for maximizing business impact
2011
CIO 100 Honouree award for excellence in strategic enterprise IT deployment
Indian Express Intelligent Enterprise award for manufacturing
2012
EDGE award usage of IT for maximizing business impact
Skoch Digital Inclusion Award for controlling unauthorized dealer selling using RFID
2014 EDGE award for usage of IT
2015Dataquest Business Technology award for excellence in implementation and use of technology for business benefits in the category of ‘mobility’

27
Appendix IV: Financial Statements (Restated Consolidated)Select Balance Sheet Items
Particulars (INR mn) As at March 31
2017 2016 2015 2014 2013 2012
I. Equity and Liabilities
Shareholder’s funds (A) 4,633.92 3,384.35 2,450.39 1,965.65 1,695.19 1,377.53
Minority Interest (B) -- -- -- -- -- 12.80
Non-current liabilities
Long-term borrowings 219.82 346.28 726.44 866.32 1,122.36 1,235.33
Others 527.64 467.96 400.98 321.59 251.21 163.19
Total (C) 767.46 814.24 1,127.42 1,187.91 1,373.57 1,398.52
Current liabilities
Short-term borrowings 259.06 788.27 538.74 828.83 943.81 1,206.64
Trade payables 1,604.77 1,126.21 1,139.62 988.51 810.15 802.23
Others 1,918.29 1,769.99 1,538.77 1,280.96 841.69 603.51
Total (D) 3,782.12 3,684.47 3,217.13 3,098.30 2,595.65 2,612.38
Total (A+B+C+D) 9,183.50 7,883.06 6,794.94 6,251.86 5,664.41 5,401.23
II. Assets
Non-current assets
Fixed assets
Tangible assets 3,102.41 2,807.23 2,790.73 2,518.93 2,672.72 2,278.62
Goodwill 81.79 71.06 71.92 3.38 3.44 3.23
Capital work-in-progress 362.08 97.00 83.26 167.80 14.57 410.48
Non-current investments 0.01 100.04 0.04 0.04 76.39 54.24
Others 175.12 160.40 122.98 78.14 77.80 73.14
Total (E) 3,721.41 3,235.72 3,068.93 2,768.29 2,844.92 2,819.71
Current assets
Inventories 1,465.27 1,046.13 1,181.59 1,241.24 1,161.93 917.36
Trade receivables 1,388.13 1,170.69 1,144.99 1,200.83 1,044.43 1,153.55
Cash and bank balances 2,093.89 2,171.60 1,169.84 768.43 322.10 205.86
Others 514.80 258.92 229.59 273.07 291.03 304.75
Total (F) 5,462.09 4,647.34 3,726.01 3,483.57 2,819.49 2,581.52
Total (E+F) 9,183.50 7,883.06 6,794.94 6,251.86 5,664.41 5,401.23

28
Appendix IV: Financial Statements (Restated Consolidated)Select Income Statement Items
1of finished goods, stock-in-process and stock-in-trade
ParticularsFor the year ended March 31 (in INR mn)
2017 2016 2015 2014 2013 2012
Income
Revenue from operations 19,116.47 16,961.87 15,533.10 13,964.43 12,644.84 11,282.55
Less: Excise duty 1,616.52 1,461.97 1,356.42 1,253.49 1,154.69 833.57
Net revenue from operations 17,499.95 15,499.90 14,176.68 12,710.94 11,490.15 10,448.98
Other income 218.85 168.13 105.75 5.59 124.39 59.09
Total Revenue 17,718.80 15,668.03 14,282.43 12,716.53 11,614.54 10,508.07
Expenses
Cost of materials consumed 9,330.40 8,088.75 8,550.08 7,693.17 6,962.32 6,555.34
Purchase of stock-in-trade 354.33 143.17 116.39 94.59 67.99 66.47
Other manufacturing expenses 774.39 742.10 630.30 473.96 384.91 356.34
Changes in inventories1 (138.91) 43.82 44.72 (35.00) (92.63) (136.34)
Employee benefits expenses 1,540.43 1,394.09 1,284.91 1,193.81 1,031.59 925.46
Finance costs 98.69 116.69 161.93 191.60 231.20 242.65
Depreciation & amortization expenses 303.90 292.68 279.54 300.00 314.48 252.02
Other expenses 3,686.97 3,326.51 2,639.44 2,443.03 2,318.39 2,126.16
Total expenses 15,950.20 14,147.81 13,707.31 12,355.16 11,218.25 10,388.11
Profit before tax 1,768.60 1,520.22 575.12 361.37 396.29 119.96
Net Tax expense 520.24 472.36 148.39 82.97 87.79 41.76
Profit after tax, before extraordinary items 1,248.36 1,047.86 426.73 278.40 308.50 78.20
Loss of Subsidiary on amalgamation - - - - - 0.09
Profit for the year before adjusting Minority
Interest1,248.36 1,047.86 426.73 278.40 308.50 78.11
Share of Profit transferred to Minority Interest - - - - - 0.74
Net Profit for the years 1,248.36 1,047.86 426.73 278.40 308.50 77.37

29
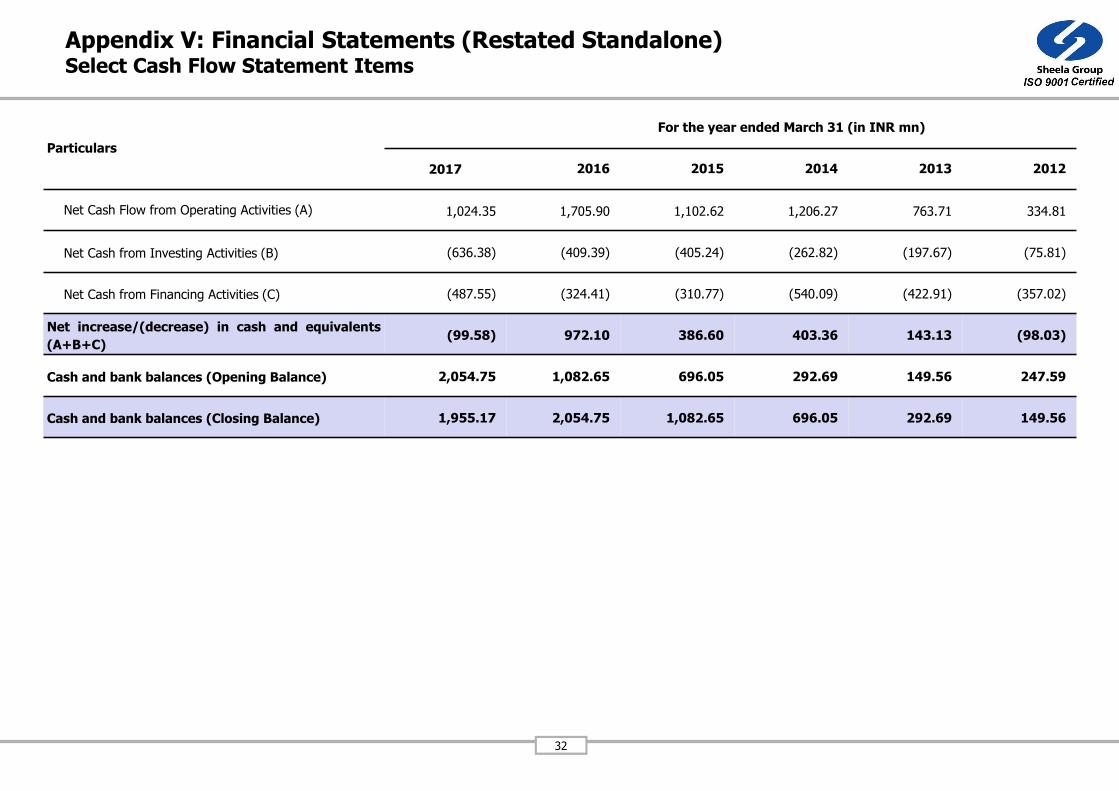
Appendix IV: Financial Statements (Restated Consolidated)Select Cash Flow Statement Items
Particulars
For the year ended March 31 (in INR mn)
2017 2016 2015 2014 2013 2012
Net Cash Flow from Operating Activities (A) 1,216.13 1,763.59 1,473.09 1,244.27 972.52 597.91
Net Cash from Investing Activities (B) (637.39) (336.63) (486.29) (269.32) (298.18) (38.34)
Net Cash from Financing Activities (C) (656.45) (425.20) (585.39) (528.62) (558.10) (636.93)
Net increase/(decrease) in cash and equivalents
(A+B+C)(77.71) 1,001.76 401.41 446.33 116.24 (77.36)
Cash and bank balances (Opening Balance) 2,171.60 1,169.84 768.43 322.10 205.86 283.22
Cash and bank balances (Closing Balance) 2,093.89 2,171.60 1,169.84 768.43 322.10 205.86

30
Appendix V: Financial Statements (Restated Standalone)Select Balance Sheet Items
Particulars (in INR mn)As at March 31
2017 2016 2015 2014 2013 2012
I. Equity and Liabilities
Shareholder’s funds (A) 4,210.14 3,105.34 2,203.14 1,858.74 1,608.68 1,347.15
Non-current liabilities
Long-term borrowings 35.32 39.02 175.84 386.17 616.20 760.32
Others 571.29 496.35 399.31 345.86 292.62 187.13
Total (B) 606.61 535.37 575.15 732.03 908.82 947.45
Current liabilities
Short-term borrowings 2.32 408.38 350.41 344.52 534.36 610.92
Trade payables 1,344.44 896.3 935.59 708.76 562.2 547.85
Others 1,590.92 1,514.69 1,332.42 1,061.97 661.66 390.55
Total (C) 2,937.68 2,819.37 2,618.42 2,115.25 1,758.22 1,549.32
Total (A+B+C) 7,754.43 6,460.08 5,396.71 4,706.02 4,275.72 3,843.92
II. Assets
Non-current assets
Fixed assets
Tangible assets 2,334.62 2,008.33 1,903.53 1,646.55 1,705.80 1,190.84
Capital work-in-progress 28.49 22.08 81.50 167.79 14.57 410.49
Non-current investments 729.72 525.62 298.84 230.74 307.08 315.91
Others 125.91 133.29 102.65 69.04 72.24 47.40
Total (D) 3,218.74 2,689.32 2,386.52 2,114.12 2,099.69 1,964.64
Current assets
Inventories 1,102.26 735.33 911.73 862.09 853.42 577.90
Trade receivables 994.41 749.65 782.43 807.68 758.78 815.94
Cash and bank balances 1,955.18 2,054.75 1,082.65 696.05 292.69 149.56
Others 483.84 231.03 233.38 226.08 271.14 335.88
Total (E) 4,535.69 3,770.76 3,010.19 2,591.90 2,176.03 1,879.28
Total (D+E) 7,754.43 6,460.08 5,396.71 4,706.02 4,275.72 3,843.92

31
Appendix V: Financial Statements (Restated Standalone)Select Income Statement Items
1of finished goods, stock-in-process and stock-in-trade
ParticularsFor the year ended March 31 (in INR mn)
2017 2016 2015 2014 2013 2012
Income
Revenue from operations 16,075.10 14,112.46 12,715.14 11,278.92 10,008.58 8,167.76
Less: Excise duty 1,616.52 1,461.98 1,356.42 1,253.49 1,154.69 772.32
Net revenue from operations 14,458.58 12,650.48 11,358.72 10,025.43 8,853.89 7,395.44
Other income 249.00 212.23 142.64 80.76 124.02 57.45
Total Revenue 14,707.58 12,862.71 11,501.36 10,106.19 8,977.91 7,452.89
Expenses
Cost of materials consumed 8,001.53 6,793.10 7,291.92 6,474.02 5,862.92 5,021.72
Purchase of stock-in-trade 354.33 143.17 116.39 94.59 67.99 94.22
Other manufacturing expenses 644.34 639.74 532.22 368.29 275.74 236.57
Changes in inventories1 (152.22) 87.44 (1.62) (27.24) (108.01) (85.55)
Employee benefits expenses 914.25 807.15 678.00 604.30 442.59 310.66
Finance costs 63.04 67.68 104.71 118.19 150.45 162.56
Depreciation & amortization expenses 235.81 227.76 215.06 202.20 193.02 141.17
Other expenses 3,083.97 2,772.94 2,108.61 1,955.39 1,760.52 1,451.42
Total expenses 13,145.05 11,538.96 11,045.29 9,789.74 8,645.22 7,332.77
Profit before tax 1,562.53 1,323.75 456.08 316.45 332.69 120.13
Net Tax expense 457.72 421.55 111.68 66.40 92.36 38.93
Profit after tax, before extraordinary items 1,104.81 902.20 344.40 250.05 240.33 81.20
Loss of Subsidiary on amalgamation - - - - - 0.08
Net Profit for the year 1,104.81 902.20 344.40 250.05 240.33 81.12
32
Appendix V: Financial Statements (Restated Standalone)Select Cash Flow Statement Items
Particulars
For the year ended March 31 (in INR mn)
2017 2016 2015 2014 2013 2012
Net Cash Flow from Operating Activities (A) 1,024.35 1,705.90 1,102.62 1,206.27 763.71 334.81
Net Cash from Investing Activities (B) (636.38) (409.39) (405.24) (262.82) (197.67) (75.81)
Net Cash from Financing Activities (C) (487.55) (324.41) (310.77) (540.09) (422.91) (357.02)
Net increase/(decrease) in cash and equivalents
(A+B+C)(99.58) 972.10 386.60 403.36 143.13 (98.03)
Cash and bank balances (Opening Balance) 2,054.75 1,082.65 696.05 292.69 149.56 247.59
Cash and bank balances (Closing Balance) 1,955.17 2,054.75 1,082.65 696.05 292.69 149.56