sheetlines - amazon s3
TRANSCRIPT

SheetlinesThe journal of
THE CHARLES CLOSE SOCIETYfor the Study of Ordnance Survey Maps
This edition of Sheetlines was publishedin 2005 and the articles may have been
superseded by later research.Please check the index at
http://www.charlesclosesociety.org/sheetlinesindexfor the most up-to-date references
This article is provided for personal, non-commercial use only.Please contact the Society regarding any other use of this work.
Published byTHE CHARLES CLOSE SOCIETY
for the Study of Ordnance Survey Mapswww.CharlesCloseSociety.org
The Charles Close Society was founded in 1980 to bring together all those withan interest in the maps and history of the Ordnance Survey of Great Britain andits counterparts in the island of Ireland. The Society takes its name from ColonelSir Charles Arden-Close, OS Director General from 1911 to 1922, and initiator ofmany of the maps now sought after by collectors.
The Society publishes a wide range of books and booklets on historic OS mapseries and its journal, Sheetlines, is recognised internationally for its specialistarticles on Ordnance Survey-related topics.

,661����������
SHEETLINESNumber 72 April 2005
7+(�&+
$5/(
6�&/2
6(�62
&,(7
<fo
r the
Stu
dy o
f Ord
nanc
e Su
rvey
Map
s
&KULVWRSKHU�%RDUG�2%( <R�+RGVRQ �)RUWKFRPLQJ�PHHWLQJV �/LVWV�RI�PDS�GHDOHUV�DQG�PHPEHUV �2UGQDQFH�6XUYH\�SXEOLF�FRQVXOWDWLRQ 5�&�:KHHOHU �([SORULQJ�PLVVLQJ�WHUULWRU\ �6KDS�PHHWLQJ��������2FWREHU����� 5�&�:KHHOHU �9LVLW�WR�26�+HDGTXDUWHUV�DW�6RXWKDPSWRQ 'HV�+LOO �7KH�5R\DO�*HRJUDSKLFDO�6RFLHW\��/RQGRQ .�6�$QGUHZV �7KH�5HLFKVDPW�I�U�/DQGHVDXIQDKPH DQG�
WKH�2UGQDQFH�6XUYH\��SDUW�,�-�/�&UXLFNVKDQN �
5HWXUQ�WR�/DUNKLOO ��&DQQLEDOLVP�DQG�XQVDYRXU\�DGGLWLYHV� /DQJGRQ�5RZH ��8QFOH�-RH�NQHZ�ZKHUH�\RX�OLYHG��SDUW�,� -RKQ�'DYLHV ��$�9LNLQJ�VDJD 3HWHU�:DUEXUWRQ ��*UDVVKROP�,VODQG�DQG�7KH�6PDOOV .�6�$QGUHZV ��7HVWLQJ�WKH�HQKDQFHPHQW -RKQ�&ROH ��7KH�WUHDWPHQW�RI�ZRUNV�SURMHFWHG�RU�LQ�
SURJUHVV5�&�:KHHOHU ��
)ROORZLQJ�$ODQ�WR�/RRH -RKQ�&ROH ��3RHWLF�OLFHQFH 5LFKDUG�7�3RUWHU ��1HZ�RQH�LQFK�VHULHV 'DYLG�$UFKHU ��5HYLHZV ��.HUU\�PXVLQJV 'DYLG�$UFKHU ��/HWWHUV ��1HZ�PDSV -RQ�5LVE\ ��

Sheetlines3XEOLVKHG�E\�7+(�&+$5/(6�&/26(�62&,(7<
IRU�WKH�6WXG\�RI�2UGQDQFH�6XUYH\�0DSV
Sheetlines 72 April 2005
%&$�)LOPV��:RNLQJKDP
&KULVWRSKHU�%RDUG�2%(7KH�DSSRLQWPHQW�RI�'U�&KULVWRSKHU�%RDUG�DV�DQ�2IILFHU�RI�WKH�2UGHU�RI�WKH�%ULWLVK�(PSLUH��IRU�VHUYLFHV�WR�&DUWRJUDSK\��ZDV�DQQRXQFHG�LQ�WKH�1HZ�<HDU�+RQRXUV�OLVW�The mark of a man’s merit can surely be measured in the pleasure which his achievements and awards give to others. Our Chairman’s recent accolades of the British Cartographic Society Medal (awarded in September 2004) and the Order of the British Empire (bestowed in January this year) are cause for celebration in this Society, of which he was a founder member nearly twenty-five years ago, and to which he has dedicated himself as Chairman for nearly ten years. We owe him much, but his part in this Society’s success is only a fraction of the contributions he has made to a wide range of cartographic activities in the last forty years, all of which have earned him his OBE.
Chris is widely known and respected at both national and international levels. He played an influential role as a member (from 1972) and then Chairman (from 1984) of the Royal Society sub-committee, and served as President of the UK Society of Cartographers (1985-1990), following this with the Presidency of the British Cartographic Society from 1990-1994. At the same time, Chris was involved at a high level in the activities of the International Cartographic Society, chairing its Commission on the History of Cartography.
His great enjoyment of his personal interests: maps, stamps and South Africa (not necessarily in that order) is very infectious, and is the keystone of his success as a cartographic communicator at many levels. We are privileged to have you as our Chairman, Chris, and we send you our warmest congratulations on your well-deserved honour.
<R�+RGVRQ

2
)RUWKFRPLQJ�PHHWLQJVThe details of the Society’s programme for 2005 were given in the last issue of 6KHHWOLQHV. Since then, the RGS visit has taken place and a report appears below.• The agenda and further information for the Annual General Meeting on 14 May at
Southampton have recently been sent to members in a separate mailing.• The trip to Belfast will take the same form as last year’s very successful expedition to
Dublin and at least four separate visits to various sites are being arranged for 6 - 8 June.• The season will culminate in the Society’s 25th anniversary celebration, to be held on
Saturday, 19 November at the British Library. This will be a memorable event for which the final details are still to be arranged. Bookings are now invited for the late summer and autumn events listed in 6KHHWOLQHV���.
Places are limited and are allocated on a ‘first come’ basis. Contact Gerry Jarvis, Rulow House, Buxton Old Road, Macclesfield, SK11 0AG, telephone 01625 611594, or email YLVLWV#FKDUOHVFORVHVRFLHW\�RUJ�XN.
The Midlands Group of the Charles Close Society will hold meetings on Thursday, 12 May and Thursday, 8 September at 19:30 at the Voluntary Services Centre, Union Street Car Park, Union Street, Burton upon Trent (SK 246229). More information from Lez Watson at 54 King Street, Burton upon Trent, DE14 3AF, OHVOLH#ZDWVRQ�DV, (01283) 541303.
Society members are also welcome to attend the next Oxford Seminar in Cartography on Thursday 2 June at 17:00 in the School of Geography and the Environment, Mansfield Road, Oxford. Rob Watts (Bournemouth University / Digi-Data Technologies) will speak on ‘Paper to pixels: the digital manipulation of The Gough Map’. Contact Nick Millea, Map Librarian, Bodleian Library, Broad Street, Oxford, OX1 3BG, tel: 01865 287119, fax: 01865 277139, QDP#ERGOH\�R[�DF�XN.
/LVWV�RI�PDS�GHDOHUV�DQG�PHPEHUV�LQ�WKH������$OPDQDFNThe Society has for several years published in the $OPDQDFN a ‘List of dealers in second-hand Ordnance Survey maps’. Could those members whose details are included in the 2004 $OPDQDFN kindly note that they will be contacted individually during May / June to confirm that they wish their details to be included in future editions of the $OPDQDFN and to update the details published. Should any other colleagues wish their details to be included they should contact the Chairman of the Publications Sub-Committee. Full contact details and a summary of the information included in the listing may be found on page 29 of the 2004 $OPDQDFN.
3URIHVVRU�'DYLG�3DUVRQV&KDLUPDQ��3XEOLFDWLRQV�6XE�&RPPLWWHH
A membership list is sent to every member, including those overseas, in the $OPDQDFN, published in August, and updates are printed in 6KHHWOLQHV. This list is purely for the use of members and is not made available to other organisations. However, if you would prefer your name or address not to be listed, and have not already done so, please notify the Membership Secretary, Rodney Leary (CCS), 18 Downton View, Ludlow, Shropshire, SY8 1JF.

3
2UGQDQFH�6XUYH\�SXEOLF�FRQVXOWDWLRQOrdnance Survey is proposing two minor changes to large-scale plans:1. At present, where plans are produced to standard 1 km squares or quarters thereof, names
which straddle the margin are continued in the margin and areas (constituencies, wards etc) whose centres fall outside the square are named in the margin. OS propose to drop this. The consultation document notes that ‘production of customised mapping will normally ensure that all information required by the user – including distinctive and descriptive names – is included within the boundary of the map required.’ (I believe thiscan only mean that if you ask for a map of Harmston parish, you get the name ‘Harmston CP’ within the map, but not necessarily the names of adjoining parishes.)
2. The OS MasterMap Topography Layer (a digital product) will no longer show trig points and bench marks. Other large-scale products will continue to show them. ‘The OS has made a commitment to continue to offer traditional control information to surveyors [using non-GPS methods]. Future access to traditional control information will be free, via ZZZ�JSV�JRY�XN, where a IUR]HQ dataset of the basic information will be available.’The full document, which adds little to the above, is available from the OS website at
RUGQDQFHVXUYH\�FR�XN�RVZHEVLWH�DERXWXV�UHSRUWV�FKDQJHV�WR�ODUJH�VFDOH�PDSSLQJ�SGI. The Committee considered the proposals on 5 March and saw no major problems; the Hon. Sec. has sent a formal response to the OS. Any members who find that these changes have an effect on their own activities may wish to respond separately; the deadline is 3 May.
5�&�:KHHOHU5LFKDUG�2OLYHU�QRWHV�WKDW�FRQVXOWDWLRQ�LV�DOVR�WDNLQJ�SODFH�RQ�DQ�26�SURSRVDO�WR�FHDVH�VDOHV�RI�IODW��DV�RSSRVHG�WR�IROGHG��FRSLHV�RI�VPDOO�VFDOH PDSV�
([SORULQJ�PLVVLQJ�WHUULWRU\David Purchase has successfully persuaded Ordnance Survey to add Thairteamul1 and Erisgeir2 to the appropriate ([SORUHU sheets ‘at the earliest convenient opportunity’.
In their letter,3 OS go on to say ‘Whilst Thairteamul was omitted in error when the sheet lines were put together … Erisgeir has never been shown on even the 3DWKILQGHU map … which preceded the Explorer. The old sheet lines of the 3DWKILQGHU did not cover this km square and that is the reason it was not shown when we converted the 3DWKILQGHU mapping to ([SORUHU maps – no-one realised it was missing. Of course a quick comparison with the relevant /DQGUDQJHU maps would have shown up our mistakes but hindsight is wonderful!’
In reporting this news, David remarks on a medical officer of his acquaintance who claimed that his most valuable instrument was a ‘retrospectroscope’. Having just converted the illustrations in Richard Oliver’s &RQFLVH�*XLGH to digital form for the new edition and having almost lost a vital bench mark in the process, your editor is also most sympathetic!
1 6KHHWOLQHV���, 54.2 6KHHWOLQHV���, 67.3 Steven Carroll to David Purchase, 30 November 2004.

4
6KDS�PHHWLQJ��������2FWREHU�����5�&�:KHHOHU
Some eighteen members braved the half-term traffic and the weather to gather at Shap Wells for a programme focused on military maps.
Chris Board gave an account of the mapping of Cape Colony from the (second) Boer War onwards. The principal map series concerned was the ‘Imperial Map’, which first appeared in 1900 as a sketchy and roughly-drawn map in black and white but which, by its third edition, was a neat and serviceable map with vastly more detail, lithographed in, typically, four colours. There was much variability within this overall scheme and Chris suggested a name for one of the draughtsmen concerned whose lettering was of a particularly high quality.
From 1907, the series was replaced in part by GSGS 1764, although only some twenty sheets of the latter were published. The new series is memorable for its marginal diagrams of the more important GULIWV or river crossings. Chris demonstrated that this information was confined to the military editions, being omitted from their civilian counterparts. With this series, the mapping of Cape Colony effectively ended, nothing more being done until the 1940s, when a Union of South Africa series, UDF 400/43, superseded it.
After lunch, Dave Watt reviewed recent 1:50,000 maps from across Europe. For Western Europe a number of themes were apparent. First there was the varying divergence between military and civil versions, strikingly in the case of Spain (where an elegant hill-shaded map was contrasted with a military layered version) and for Greece (where no military or civil version is released but where the official contour data is used to good effect by a couple of commercial map publishers). Secondly, there was the variation in specifications within a country: the German /lQGHU� have recently brought their maps into line whilst in Spain Catalunya now has its own splendidly drawn series. Thirdly, there was the influence of NATO specifications, albeit far from prescriptive.
In Eastern Europe, the last of these themes was again apparent. Conforming to a specification was nothing new: all the states had previously followed the practice laid down in great detail by the 1956 Sofia Conference. However, the manner of conversion to the new standard varied from a whole-hearted recasting on western (or Scandinavian) models to the simple addition of WGS84 grid and corner coordinates. There was a somewhat grudging release of data by certain nations whose mind-sets may hark back to the ‘good old days’. A further theme was the dropping of the PLOLWDU\� JHRJUDSKLF LQIRUPDWLRQ – numerical characteristics of roads, rivers, bridges and woodland – which certainly makes for more elegant maps but has caused some in the East to question how a Western army can operate without such data.
Finally, Russia stood alone for the sheer size of its cartographic establishment and the amazing number of sheets produced – some 73,000 to cover the former Soviet Union at the 1:50,000 scale. The de-coding of Russian sheet numbers was explained.1 Finally the former Soviet mapping of the UK was discussed and questions were raised about the sources of hydrographic data and spot heights on these products.
1 In C-40-102-A, the first letter counts in 4-degree bands northwards from the equator, the next figure counts in 6 degree gores eastwards starting at 180° from Greenwich. The second figure gives the number of the 1:100 000 sheet within this zone – they are arranged in a 12 × 12 pattern – and the final letter gives the quadrant of the 1:50 000 sheet.
5
All in all, the audience found itself quite overwhelmed by such a WRXU�GH�IRUFH.The following morning saw talks given by four volunteers. Ken Hollamby explained the
statutory basis for investigating the archaeological impact of planning applications and of other major projects. The latter included the decommissioning of plants such as the Calder Hall reactor and this had led to Ken conducting an investigation which included tracing the site back through successive editions of OS (and earlier) maps. This is apparently known as 0DS� 5HJUHVVLRQ� $QDO\VLV. Ken linked this to a short history of the early nuclear power programme and observed that much of the technology employed was at the limits of what was then achievable and so the site is important for the history of technology in general, not just as a nuclear plant.
Gerry Zierler showed a selection of London maps ranging from specials of Hampstead Heath to a map produced for the Royal Commission on London Traffic in 1905 showing SLSH�VXEZD\V. This seems to have been regarded as the solution to the perpetual digging up of roads by statutory undertakers. Perhaps it is an idea whose time has at last come! Gerry finished with a map of Clifford’s Bottom. No one knew who Clifford was, but inspection of the print code yielded the information that it had been produced by the 1999 Army Survey Course.
John Davies raised concerns at the way in which the OS was endangering its reputation by including unchecked information from outside bodies that failed to meet its own standards. National Cycle Route 13 on /DQGUDQJHU sheet 177 served as an example. The inverse process, whereby OS data (and its logo) appeared on a commercial product, also posed risks. John presented a Focus Map with mis-spelt street names, grossly outdated information, and a wholly spurious street which the publishers had brazenly introduced as a ‘finger-print’ in case anyone should be so ill-advised as to copy their product.
Rod Leary rounded the morning off by bringing out a number of discoveries including the early (1820s) version of Old Series sheet 37 which had not previously been thought to have survived.
By then the rain had ceased, the sun had appeared, and least two members donned walking gear and found time to tackle a modest hill before heading home. We are grateful to all our speakers, to John Seeley and Gerry Jarvis for organizing everything, and to Steve Simpson for hosting another superb Shap Weekend.
9LVLW�WR�26�+HDGTXDUWHUV�DW�6RXWKDPSWRQ���1RYHPEHU�����
'HV�+LOOThis was my first visit to Ordnance Survey, having long harboured a wish to look behind the doors, so to speak. I had no particular sphere of interest, and no preconceived list of things to see. I do recall from previous such reports that time invariably went too quickly, and so it proved on this day as well.

6
Steve Erskine (Director of Programme and Projects) set the scene for the day in his introduction, and touched upon the trading and commercial activities which had generated an annual turnover of £116m. The burgeoning customer base, with varying requirements and uses for maps and/or data (including, especially, the ability to customise and add their own data) has driven a need to invest in new products, solutions and technologies.
Central to all of the current activities appears to be the development of the ‘Master-Map’ database, together with its continuing maintenance and updating. The use of modern production methods, together with advances in surveying (incorporating GPS technology, for example), plays its part here.
Bob Lilley (Cartography Manager) acknowledged that there had been a consequent reduction in the number of cartographers as a result of these efficiencies, and yet countered this trend by revealing that recruitment of a new generation of cartographers had commenced. It was clear that the role had changed to the extent that far from being a ‘journeyman draughtsman’, these people were now expected to contribute to all aspects of map production – such as design, visualisation, development and consideration of new technologies (those words again), even down to the sourcing and specification of the paper base.
The acceptance that cartography is essentially a communication tool, and that the technology is a catalyst for new opportunities and avenues of lateral thought is manifest insofar that there is encouragement to question the very necessity of paper (see below) to represent the map data.
Bob felt that the current range of ‘mainstream products’ – at 1:25,000, 1:50,000, 1:100,000, and 1:250,000, was in balance, and envisaged that the ultimately the /DQGUDQJHUwould be usurped by the 1:100,000 in day to day use, as car journey length has increased to the extent that many sheets are required for an average journey. This mirrors the need for a detailed walking map, once one’s destination has been reached; this in turn being manifest in the ongoing success and profitability of the ([SORUHU series. The recent change of cover design including ‘action’, rather than static, photography mirroring this trend further.
The quality of information at 1:100,000 is the key issue that will determine the longevity of the /DQGUDQJHU, and here Bob drew a deep breath before acknowledging that the use of raster data from smaller scale maps, as distinct from Master-Map data from the larger, has imposed something of a limitation to the detail available to these products … so far. On a personal note I find the Philips Navigator series (1:100,000) ideal in the car, and yet having the literal representation of roads, in complex areas, on the /DQGUDQJHU is equally valuable. The overheard fear that /DQGUDQJHU¶V demise may be sooner rather than later may prove unfounded, I suspect.
There then followed a demonstration of the possibilities of the aforementioned use of web, mobile phone, PDA, and GPS technologies in the presentation of data, or indeed, a ‘map’. Research was presented which combines the use of Master-Map data, with, for example, a virtual image of reality (as through a looking glass, webcam, etc), and further with any type of user provided data (underground services, building types, access information, navigation channels, danger areas etc, etc, etc … ). A visual picture of such data can be presented, which can change as the viewer moves, GPS providing information of the viewer’s location, and orientation.
Back to the here and now on the Print Floor. An impressive, and fascinating spectacle. Impressive output (up to 6000 maps per hour) from two presses. The retention of in-house

7
printing in the face of the economic imperative to outsource was notable, benefits of control and flexibility being the key factors. It was also apparent that the whole process has been geared to minimise wastage – down to the use of only two paper sizes for the whole product range. The printing process and the production of the plates were explained – most informative, including the direct production of the plates from computer data, as distinct from a photographic process. An analogy might be the difference between a traditional photographic darkroom, and a digital print, one might say. The consequent savings in time, space, and wastage from all these improvements have been embraced with enthusiasm and used to good effect. For example it was apparent that the space occupied by the conference rooms and display areas was once a part of the print floor, in earlier less automated times.
Two separate speakers then gave a glimpse into initiatives or activities which ran parallel with the core business of map publishing. Elaine Owen (Senior Education Manager) expounded upon the ‘maps for schools’ project, in which every 11 year-old child is being given an ([SORUHU map of their locality. Additionally a programme of research (to identify the benefits, and effects of this initiative) is taking place concurrently. This feedback has proved extremely positive insofar as the majority of children value and have been inspired by these maps. Many of these children live in households which might otherwise have no maps at all. Further, some parents have been astonished to find that such maps existed, and have been equally inspired. As a long term ‘marketing strategy’, this not inconsiderable investment may yield riches: as a short term educational initiative, it has clearly injected life and reality into a subject which does not normally generate enthusiasm in today’s youth. If only such an initiative existed in 1966!!
Rick Morris (Cartographic Design Manager) gave an update on the inclusion of ‘access land’ on the ([SORUHU maps. This is defined as common land, or areas of open and unrestricted access, as distinct from rights of way. The Countryside Agency, in conjunction with local agencies and interests, having invited and considered comments from interested bodies or individuals, has been responsible for presentation of information of the extent of such lands, to OS. Ordnance Survey in turn is incorporating such data onto the Explorer maps as they are revised. The means of representation of this land has been tossed around to a certain extent, and now consists of a yellow tone, with orange edge; lending, it must be said, a rather vivid effect to areas of woodlands. The representation of these lands by the OS has (predictably??) drawn comment and criticism from those who disagree with what is shown, or the manner in which the data was collected, quite apart from what constitutes ‘open access’. All of which must surely be directed towards the Countryside Agency rather than the OS (who are only acting as messenger in this instance), one would imagine. The ongoing discussion and exchange of strongly held views from the audience ultimately elicited an invitation for a contribution for a forthcoming 6KHHWOLQHV, from those with strong feelings and/or experience of these issues.
A very enjoyable day was had; the clock did run too fast. Agreeable hospitality was provided, and the mad dash around the shop (wish I had had my wants list) completed the day. Much appreciation to those at the OS for their time and infectious enthusiasm. Appreciation also to Gerry and John for organising, and enabling the visit to take place.

8
7KH�5R\DO�*HRJUDSKLFDO�6RFLHW\��/RQGRQ�����0DUFK������.�6�$QGUHZV
The Royal Geographical Society (RGS) is on the corner of Kensington Gore and Exhibition Road in Kensington. The premises were once Lowther Lodge, built as a private house in 1874 by the advanced Late Victorian architect Norman Shaw (1831-1912) with Queen Anne-style windows and Dutch gables; the internal architectural features have mostly survived the process of institutionalisation. The red brick house is now dwarfed by two extensions erected by the RGS, one sympathetic to Shaw’s external design housing a lecture theatre and the latest one in concrete and glass housing the exhibition gallery and the Foyle reading room.
The CCS fielded eleven intrepid explorers who were met by Francis Herbert, the RGS librarian and our cicerone. We learned of the foundation of the society in 1830, the third-oldest geographical society in Europe and we were pleased to hear that the first meeting was about a map – the 0DSSD� 0XQGL was brought down from Hereford for the occasion. A facsimile was then produced for the society which may currently be seen at the Design Museum. From 1854 a map collector was appointed who gathered maps new and old. The collection now stands at 1,000,000 maps, 3,000 atlases, 40 globes and 1,000 gazetteers.
Francis showed us some of their map treasures including their copy of Ptolomey’s &RVPRJUDSKLD, 1482 edition, bound in boards, which once belonged to William Morris. Its map of the British Isles is famous for showing the north of Scotland leaning eastwards as if the Gulf Stream was flowing much more strongly in times past. We also admired the first facsimile globe of 1847, made directly on wood from two originals of 1515 without using gores. Choice selections from the map collection were laid out for our delight in the Foyle reading room, where we were free to pursue our own interests.
The map library was enriched by collections from Michael Corbett Andrews (no relation) on UK and Ireland, Fordham on post-road books of the seventeenth to nineteenth centuries, Greenough on topographical maps of Europe, and many others.
The rich collections of the RGS would warrant a follow-up visit when those interested in geography and exploration could learn about the society’s holdings: the Livingstone, Stanley and polar exploration documents and equipment, cultural objects from around the world, the library of 150,000 volumes and the picture library of over 500,000 images.
%LOO�%DWFKHORU&&6�0HPEHUV�LQ�HDUQHVW�VWXG\�DW�WKH�5R\DO�*HRJUDSKLFDO�6RFLHW\

9
7KH�Reichsamt für Landesaufnahme DQG�WKH�2UGQDQFH�6XUYH\�D�FRPSDULVRQ�RI�WZR�PDSSLQJ�RUJDQLVDWLRQV�EHWZHHQ�����
DQG�WKH�6HFRQG�:RUOG�:DU��SDUW�,�-�/�&UXLFNVKDQN
In a previous article in 6KHHWOLQHV� I noted that the German military maps of Britain (and several other areas of WWII military action) were not initially gridded. Indeed gridding was only very belatedly applied, if at all. I suggested that this appeared to reflect a failure to absorb the lessons of the First World War.1 Further study has however revealed this to be an over-simplistic analysis. The present pair of articles began as an attempt to explain the delays (and inconsistencies) in gridding of German Second World War maps by comparing the national mapping organisations in Britain and Germany and their evolution during the inter-war period. The comparisons however allow us to view the Ordnance Survey itself in a different light.2
A detailed comparison of all aspects of the 5HLFKVDPW and Ordnance Survey during the 1920s and 1930s would of course be a very major task indeed. This account will therefore be limited to a few broad areas in which clear differences appear. Several of these differences were to be important during the Second World War and afterwards. Some wartime consequences will therefore be mentioned, but it must be emphasised that the sources used for this study can only indirectly illuminate German military mapping activity and its evolution during the war.
Since the history of the mapping of Germany may be unfamiliar to many members, in this first article I shall outline the development of the principal official mapping and survey body in Germany between the wars. This was the 5HLFKVDPW� I�U� /DQGHVDXIQDKPH� (Reich Office for State Survey). This had originally been established as the 3UHX�LVFKH�/DQGHVDXIQDKPH�(Prussian State Survey)��a military survey organisation within the Prussian General Staff. As such it became the predominant survey organisation in the aftermath of the creation of a unified German 5HLFK in 1871. Nevertheless it is important to appreciate that each of the component states of the 5HLFK also had its own survey organisation with its own maps, history and traditions. While Prussia was the largest state within the 5HLFK, and included most of northern Germany, it was by no means the best mapped. Würtemberg, in particular, had long maintained a large-scale survey that had no equivalent in Prussia.Bavaria’s General Staff Map at 1:50,000 was not only complete, but had completed its first revision. The General Staff Map of Prussia, and of the 5HLFK as a whole, was at 1:100,000, half this scale. Across the 5HLFK the usual scale of topographic survey was 1:25,000, producing maps that were still officially referred to as 0H�WLVFKEOlWWHU�(plane-table sheets). Large-scale survey was performed for land registration and taxation, but was generally the
1 J L Cruickshank, ‘German Military Maps of the UK and Ireland of World War II’, 6KHHWOLQHV 69, 15-19.2 The comparative historical study of different national military mapping agencies is (at least in English) in its infancy.
Peter Chasseaud has drawn attention to this, but with the very important exception of his own studies of the development of British, French and German mapping of the Western Front, there has been no recent published work comparing British and foreign practice during any part of the nineteenth or twentieth centuries. See Peter Chasseaud, ‘Guest Editorial’, 7KH�&DUWRJUDSKLF�-RXUQDO, �� (2001), 117-118. See also Peter Chasseaud’s recent PhD thesis: $Q�DQDO\VLV� DQG� HYDOXDWLRQ�RI�%ULWLVK��)UHQFK�DQG�*HUPDQ�PLOLWDU\� ILHOG� VXUYH\� DQG�PDSSLQJ� LQ� WKH�)LUVW�:RUOG�:DU��:KLFK�FRXQWU\�SURGXFHG�WKH�EHVW�VXUYH\�DQG�PDSSLQJ�RI� WKH�:HVWHUQ�)URQW", Dept of Earth Sciences, University of Greenwich, 2003.

10
responsibility of the local authority, not the state or the 5HLFK. Major cities like Berlin and Hamburg maintained independent survey organisations that often used projections, scales and sheet lines unrelated to each other, or to the national ones. Smaller towns and rural areas commissioned private survey firms to map them as they felt the need.
The 5HLFKVDPW� like its predecessor, had a very clearly defined internal structure. It was divided into $EWHLOXQJHQ�(departments), one for trigonometrical survey (including levelling), one for topographic detail surveying and fair-drawing, and one for cartography (which included everything concerned with map production, including preparing reproduction material from fair-drawings, and printing the maps themselves). A 3KRWRJUDPPHWULVFKH�*UXSSH (Photogrammetry Group) had also been formed. Although originally within the 7RSRJUDSKLVFKH�$EWHLOXQJ, for most purposes this group formed an independent department within the 5HLFKVDPW. These different departments had little contact with each other, and less experience of each other’s work. Rigid specialisation of skills was the norm. Under routine circumstances cross-posting of staff seldom, if ever, occurred, whether at craftsman or at officer level. Traditionally, serving military officers posted to the survey would be assigned to one $EWHLOXQJ, and would stay there for several years until they returned to other staff or regimental duties. Traditionally also, service with the 7ULJRQRPHWULVFKH�$EWHLOXQJ was a route to high rank not only within the 5HLFKVDPW� but also within the German General Staff as a whole.
During the late nineteenth century Helmuth, Graf von Moltke, as Chief of the General Staff, strongly promoted the Prussian military survey and set the standards for the Reich as a whole. Moltke was even caricatured with ‘his’ General Staff Map.3 The 3UHX�LVFKH�/DQGHVDXIQDKPH�became the coordinating cartographic body for the Reich, and in particular was concerned with the linking and standardising of the various triangulation nets. Nevertheless coordination and standardisation remained far from complete.
Peter Chasseaud has shown that during the First World War the development of German survey and mapping of the Western Front closely paralleled that of the Allies. In particular, gridded maps with a sound trigonometrical base became an essential tool for artillery fire control. However, just as the British and French surveys were never unified, the separate state military survey organisations within the German army produced maps with un-coordinated sheets and grid systems.4
The Treaty of Versailles that followed the war (28 June 1919) profoundly altered the German survey organisations. Article 160 laid down that the total effective strength of officers within the post-war German army, including the personnel of staffs, must not exceed four thousand. It also laid down that the Great German General Staff (which was essentially the Prussian General Staff) should be dissolved and not reconstituted in any form. Article 161 laid down that army administrative services consisting of civilian personnel should have such personnel reduced to one-tenth of those in 1913.5 The 3UHX�LVFKH�/DQGHVDXIQDKPH�was in particular a military body containing a large number of officers and civilian personnel. In 1919, like all the other German military survey bodies� it was therefore civilianised, and in 1921 it was reconstituted as the 5HLFKVDPW� I�U� /DQGHVDXIQDKPH� a civil office within the Interior Ministry. In the process it was merged with the 6lFKVLVFKHV�7RSRJUDSKLVFKHV�%�UR,
3 See David Kahn, +LWOHU¶V�VSLHV��*HUPDQ�PLOLWDU\�LQWHOOLJHQFH�LQ�:RUOG�:DU�,,�London, 1978, 334 Peter Chasseaud, ‘German maps and surveys on the Western Front, 1914-1918’, 7KH�&DUWRJUDSKLF�-RXUQDO� �� (2001),
119-134. 5 7KH� WUHDW\�RI�SHDFH�EHWZHHQ� WKH�DOOLHG�DQG�DVVRFLDWHG�SRZHUV�DQG*HUPDQ\��«�DQG� WKH� WUHDW\�EHWZHHQ�)UDQFH�DQG�*UHDW�%ULWDLQ�UHVSHFWLQJ�DVVLVWDQFH�WR�)UDQFH�LQ�WKH�HYHQW�RI�XQSURYRNHG�DJJUHVVLRQ�E\�*HUPDQ\�HMSO, 1919.

11
the formerly military survey organisation for Saxony. The former military &KHI (Chief) was re-designated as 3UlVLGHQW�(President) of the new body.6 Even these changes required careful interpretation of Article 162, which decreed that the number of employees or officials of the (individual) German States should not exceed the numbers in their capacities in 1913. In any case the draconian restrictions on government expenditure, due both to the expense of the war and of the subsequent reparations, severely limited activity. In particular there was little money for the expenses of field survey work, and there was a bar on new recruitment that led to a very skewed age profile within the staff of the 5HLFKVDPW� and a profound loss of overall manpower�7
Nevertheless the 5HLFKVDPW� I�U� /DQGHVDXIQDKPH� responded to its new civil status. In particular, after the death of its first President in 1924, the new President, Richard von Müller (previously head of the .DUWRJUDSKLVFKH�$EWHLOXQJ), began a campaign to publicise the maps of the 5HLFKVDPW to potential civilian users. In 1925 a quarterly journal, 0LWWKHLOXQJHQ�GHV�5HLFKVDPWV�I�U�/DQGHVDXIQDKPH� was launched. This replaced an earlier annual publication, the -DKUHVEHULFKW� GHV� 5HLFKVDPWV� I�U� /DQGHVDXIQDKPH� which had been published for five years but (as its title indicates) had been no more than an annual report. The new publication was very clearly targeted at a wide circulation, and in particular at geography and local-studies (+HLPDWNXQGH) teachers. Early issues were distributed free to a wide range of individuals and institutions. When, after a short period, the cover price had to be charged, educational discounts were available. The journal included an official section that included unsigned notices concerning the 5HLFKVDPW, publication reports and (initially in instalments) the Annual Report of the 5HLFKVDPW� It also included a non-official section containing a range of signed articles, many of which were clearly commissioned for the journal from staff members, or from others with links to the 5HLFKVDPW. These included articles describing and explaining the various products of the survey and their uses, and articles on the history, development, and activities of the 5HLFKVDPW and other official survey bodies. A very large group of articles were devoted to ideas for the use of maps for school work, while the use of the maps as :DQGHUNDUWH (walking maps) was also promoted. Finally the journal contained lists of library accessions of non-5HLFKVDPW�maps and books, a review of cartographical literature, and reviews of publications (including the 5HLFKVDPW¶V�own).8 This campaign to educate the public culminated in the publication of a substantial book describing and illustrating the survey and its maps.9 Although contemporary with the two well-known pamphlets describing the Ordnance Survey maps� this was a much more substantial tome that should rather be compared to Brian Harley’s much later compendium.10
6 For an account of the stages in this transition see Oskar Albrecht, 'DV� .ULHJVYHUPHVVXQJVZHVHQ� ZlKUHQG� GHV�:HOWNULHJHV��������, München: Bayerische Akademie der Wissenschaften, 1969, 48-50.
7 ‘Das Reichsamt für Landesaufnahme’, 0LWWKHLOXQJHQ�GHV�5HLFKVDPWV�I�U�/DQGHVDXIQDKPH, ��� (1925), 3-19, esp. p 3. ‘Jahresbericht des Reichsamts für Landesaufnahme’, 0LWWKHLOXQJHQ�GHV�5HLFKVDPWV�I�U�/DQGHVDXIQDKPH, ��� (1925), 1-19, esp. pp 1-3, and 0LWWKHLOXQJHQ�GHV�5HLFKVDPWV�I�U�/DQGHVDXIQDKPH, ��� (1925), 1-8.
8 0LWWHLOXQJHQ�GHV�5HLFKVDPWV� I�U�/DQGHVDXIQDKPH�was published quarterly from 1925. In 1936 the number of issues rose to six per year. In 1941 the journal was renamed 1DFKULFKWHQ�DXV�GHP�5HLFKVYHUPHVVXQJVGLHQVW� retaining the old title as a subsidiary title and continuing the sequence of volume numbers. Publication continued until October 1944, but the set used for the present account is incomplete after August 1943. Henceforth the abbreviation 0G5I/ will be used for citations of this journal under either title.
9 'DV�5HLFKVDPW�I�U�/DQGHVDXIQDKPH�XQG�VHLQH�.DUWHQZHUNH�Berlin, 1931. An elaborate illustrated prospectus for this book was also published the previous year.
10 The OS pamphlets $�GHVFULSWLRQ�RI�2UGQDQFH�6XUYH\�ODUJH�VFDOH�PDSV� and $�GHVFULSWLRQ�RI�2UGQDQFH�6XUYH\�VPDOO�VFDOH�PDSV both went through multiple editions during the 1920s. Brian Harley, 2UGQDQFH�6XUYH\�PDSV��D�GHVFULSWLYH�PDQXDO� Southampton, 1975.

12
The survey organisations in both Britain and Germany experienced severe limits on expenditure at this time.11 The effects were rather different in the two countries because their remits, their problems, and their accumulated backlogs of work were different. In Britain the system of cyclical revision of the Ordnance Survey large-scale plans collapsed. In Germany the 5HLFKVDPW�I�U�/DQGHVDXIQDKPH did not have any similar large scale surveys. What it did have was over three thousand 1:25,000 maps, which were its basic survey.12 A programme of cyclical revision had existed for these, but also collapsed during and after the war. The maps had been made to rather variable standards of accuracy by the different survey bodies of each /DQG. At the junctions between areas surveyed by different authorities there were frequent mismatches due in part to their being plotted from uncoordinated triangulation networks. The triangulation framework of the 5HLFK had accumulated by the merging of the existing smaller networks originally established by the individual /lQGHU� (States). These had been made to different standards and had not originally been intended as the basis of a continuous series of maps extending from the Netherlands to the Ukraine. At 1:25,000 and even at 1:100,000 there were frequent significant inaccuracies. The framework certainly did not have the precision and accuracy required for larger scale mapping. In the post-war period the 5HLFKVDPW devoted much of its limited resources to overhauling its triangulation network. The quality of its height data was even weaker. The measuring or re-measuring of geodetic levelling chains thus also absorbed resources. In doing this many old benchmarks were found to have disappeared; not only did this increase the expense, but relating new levelling to old was frequently difficult.
Following the war the 5HLFKVDPW�I�U�/DQGHVDXIQDKPH started the process of overhauling and gridding all its 1:25,000 maps. Although slow, progress was steady. Since the map projection did not match the grid projection the grid had to be established individually for each sheet.13 Even when grid values for the sheet corners had been established it proved impossible simply to draw lines on the existing maps.14 In view of the known weakness of the original trigonometrical data, the 5HLFKVDPW� I�U�/DQGHVDXIQDKPH�decided to recalculate the positions of all the trigonometrical points on each map, expressing their positions in terms of the grid, rather than as the geographical coordinates previously used. The positions of many points on the maps had to be changed, and the surrounding detail redrawn to reflect the new positions. The substantial alterations to lithographic stones involved in this process delayed progress. Nevertheless by March 1934 1,633 sheets out of a then total of 2,979 had been gridded, 276 having been done that year.
Although the impetus to grid these maps had been military, the practical needs of the time meant that civilian uses of gridded maps had to be emphasised and explained. This was done, for example, in an article in the 0LWWHLOXQJHQ� that has a very similar flavour to the
11 For a retrospective evaluation of the situation of the 5HLFKVDPW at this period, written by the recently retired President of the organisation, see: R von Müller, ‘Die Entwicklung der Kartographie beim Reichsamt für Landesaufnahme nach dem Weltkrieg bis Frühjahr 1934’, 0G5I/, �� (1935), 235-259.
12 The losses of territory following plebiscites reduced the number to 2,979.13 All the pre-WWI German series had been plotted on a polyhedric projection based on the meridian of Ferro. While this
meant that the series could be extended indefinitely across meridians, groups of sheets did not form a flat surface. Following the First World War a series of rectangular ‘Gauß-Krüger’ grids at 3o intervals, based on meridians counted from Greenwich, were established to cover the whole country. Only the post-war Deutsche Grundkarte 1:5000 was plotted (and had its sheet lines) on this projection.
14 R von Müller, RS�FLW��(1935), esp. p 239. Nevertheless tables of the corner values of sheets were published, and it was suggested that users could use these values to grid their own copies of the maps. See Th. Siewke, ‘Wie trage ich mir das Gitternetz in mein Kartenblatt ein?’, 0G5I/, � (1928), 15-25.

13
publications written in Britain after the Second World War to promote the OS National Grid.15
Similar problems affected the smaller scale maps. Although the need for a nationwide 1:50,000 map to replace the 1:100,000 series had been agreed before the war, only the long-established Bavarian series and a block of small sheets around Berlin had been completed. After the war a new specification and further pilot sheets were produced by the 5HLFKVDPWbut further progress became stalled, although Bavaria and Würtemberg did produce some sheets to the new specification.16 In 1935 mapping at the 1:50,000 scale, including all the existing sheets, was decreed to be the business of the 5HLFKVDPW rather than of the /lQGHU. Despite much preparatory work, this marked the end of progress at this scale.17
The German flagship product remained the .DUWH� GHV� 'HXWVFKHQ� 5HLFKHV 1:100,000, commonly called the *HQHUDOVWDENDUWH (General Staff Map). This had much in common with the Ordnance Survey Old Series one-inch maps.18 It was a map engraved on copper showing heights by black hachures and occasional spot-heights. Although impressions from the copper plates were available, prints from transfers to lithographic stones were the usual form sold. Some of the sheets were available with up to four lithographic colour overprints emphasising woods (brown or dark green), meadows (light green), water (blue), and roads (red). The colours added no extra topographic information to that on the black plate, although they did cheer up the appearance of sheets that, without colour, carried such a dense mat of fine black detail that they could be intimidating to read. Rather like the Old Series one-inch maps, the artistic qualities of General Staff Map, particularly in the form printed directly from copper, were a source of great pride to the 5HLFKVDPW. Although the absence of contours did attract external criticism, the Reichsamt only very occasionally acknowledged this. Nonetheless, even within the Reichsamt, the map was recognised to be old-fashioned. The series was maintained, and the black edition was slowly but steadily gridded. The series-sheets were very small, and the imperative to generate income led to a large number of (mostly) un-gridded district and tourist derivatives being produced for sale. An important group of these derivatives were the so-called (LQKHLWVEOlWWHU� sheets combining (usually) four of the small series-sheets into more practical larger sheets. The (LQKHLWVEOlWWHU and some other tourist sheets were sold in cream book-fold card covers with striking black lettering and a large German eagle on the front.
15 Th. Siewke, ‘Die Anwendung des Planzeigers für die Punktbestimmung auf neueren Karten des Reichsamt für Landesaufnahme’, 0G5I/, ��� (1925), 31-37. Compare with $�EULHI�GHVFULSWLRQ�RI� WKH�1DWLRQDO�*ULG�DQG� UHIHUHQFH�V\VWHP� Ordnance Survey Booklet no. 1/45, HMSO, 1946.
16 Descriptions of a few examples of these new small-scale maps are given in A R Hinks, 0DSV�DQG�6XUYH\, third, fourth and fifth editions, Cambridge, 1933-1947, 96-99, but the absence of contextual description makes it difficult to appreciate their relative significance.
17 For the 1935 1HXRUGQXQJ decrees, see below. For a description of work at 1:50,000 see Otto H Krause, 1HXH�:HJH�GHU�.DUWHQKHUVWHOOXQJ�LP�5HLFKVDPW�I�U�/DQGHVDXIQDKPH�Sonderheft 9 zu den 0G5I/, second edition, Berlin, 1936, 46-57. The British Library’s copy of this booklet provides an analogy for the tangle of inter-relationships in the history of twentieth-century Central European mapping: while its title page was annotated by a German institution in 1942, its uncatalogued cover, applied by a later owner, the Polish Survey College, is made from part of a cloth-backed British GSGS 1:50,000 map of France. A (now itself historical) British Library bookplate has subsequently been used to stick the cover and the booklet together.
18 It should be noted that none of the supposed example plates in Charles Close, 7H[WERRN�RI� WRSRJUDSKLFDO�VXUYH\LQJ, first edition, 1905, or second edition, 1913, HMSO, and in the War Office 0DQXDO�RI�PDS�UHDGLQJ��ILHOG�VNHWFKLQJ, 1906 ed., 1912 ed., or 1912 ed. with additions 1914, are representative of the normal appearance of German (or Swiss) maps. They all should purely be seen as examples of Charles Close’s experiments in the colour printing of maps. The third edition of the 7H[WERRN, 1925, includes a reasonably representative plate of the monochrome style of the Prussian 1:25,000 map.

14

15
&RYHU�IURP�(LQKHLWVEODWW������Saarburg i. Rhld. – Birkenfeld – Saarlouis��������PXFK�UHGXFHG�$Q�H[WUDFW�IURP�WKH�PDS�LWVHOI�LV�VKRZQ�RQ�WKH�SUHYLRXV�SDJH��DSSUR[LPDWHO\�WR�VL]H�
Smaller scales fared particularly poorly. Development, and even maintenance, of the 1:200,000 WRSRJUDSKLVFKHU� %EHUVLFKWVNDUWH� GHV� 'HXWVFKHQ� 5HLFKHV came to a complete halt.19 The older 1:300,000 %EHUVLFKWVNDUWH� YRQ�0LWWHOHXURSD�was slowly updated, and by April 1934, of the 105 sheets available, 69 were gridded. Only two of these, however, had been gridded in the previous year.20 The 1:800,000 series of Europe and the Near East, in 80 small sheets, also came to a halt and was eventually deemed to be superseded by the sheets of the International 1:1 Million Map of the World.21 The 5HLFKVDPW�was allocated as many as
19 In origin this map was the early-nineteenth-century Reymann map that had later been bought by the Prussian government. An entirely new specification for the map had been developed in the 1890s. This new form with contours was supposed to have been the future small-scale map of the Reich, and as such was to have replaced the 1:300,000 map. The individual sheets were however very small, covering only a quarter of the land area of a 1:300,000 sheet. This enabled colour printing directly from copper plates, but made the series too fragmented for practical use in the 1920s and 1930s.
20 The 1:300,000 map had been engraved on stones, with a graticule ruled on the black outline stone. Gridding the map involved removal of this graticule (which passed through much fine detail) before the grid could be added. The process was slow and tedious.
21 The 1:800,000 map was however used as the topographical base for a group of two-sheet maps of the Reich. These included the 1929 ‘Bürokarte des Deutschen Reiches’ (Office Map of Germany), and a 1930 map showing the new official road-numbering system.

16
five sheets of this map. The first two of these were produced in 1928, with the remaining three appearing at intervals between then and 1932.
In the mid-1930s a number of important changes in the organisation of the 5HLFKVDPWtook place. Of immediate importance in April 1934 was the retirement, on reaching 65, of Generalmajor Richard von Müller as President, and his replacement by Generalleutnant Vollmar. Although Vollmar had remained a serving military officer until immediately before his appointment, his career had been closely linked to the 5HLFKVDPW and its predecessors. He was a former head of the trigonometrical department, and had been the liaison officer between the 5HLFKVDPW and 5HLFKVZHKUPLQLVWHULXP�(Ministry of Defence). As such he was an entirely traditional candidate for the vacant post. Of greater long-term importance was the seizure of power in the previous year by Adolf Hitler and his NSDAP (1DWLRQDOVR]LDOLVWLVFKH�'HXWVFKH�$UEHLWHUSDUWHL; the Nazi Party). Already at von Müller’s retirement ceremony the rituals of Nazi rhetoric had appeared, with greetings of ‘6LHJ�+HLO�’ and ‘+HLO�+LWOHU�’, and formalised praise for the Nazi party, its policies, and its leader.22
In fact Nazi penetration of the organisation had begun before the seizure of power. In 1936 Vollmar, as President of the 5HLFKVDPW� had to host a commemoration of the foundation five years previously (in December 1931) of an 16� )DFKJUXSSH� (Nazi technical group) within the 5HLFKVDPW by three named (and possibly fairly junior) employees. Vollmar produced the then politically correct rhetoric, alongside the representative of Joseph Goebbels who produced more, but except in death notices the 5HLFKVDPW� had never previously named any junior employees in the 0LWWHLOXQJHQ� far less celebrated anything they had done. Furthermore in 1931 such covert political organisation within a once-military civil-service office would have been seen as improper, if not illegal. Vollmar must have found it profoundly uncomfortable to praise and publicise such insubordination.23
The Nazi seizure of power was the trigger for extensive organisational change, not just within the 5HLFKVDPW, but throughout the German civil and military services. A clear reflection of this is seen in the ‘official’ section of the 0LWWHLOXQJHQ. Publication was initiated there of what became a steady flow of new laws, rules and regulations. These eventually came to dominate the section; by 1942, when publication of the Annual Report and Publication Reports had ceased, they became its only component. Another striking change in the 0LWWHLOXQJHQ is that the formerly numerous advertisements by private-sector firms, selling all sorts of map-making instruments and supplies, disappear. The last two appear in the 1934-5 volume. Thereafter the only advertisements are for 5HLFKVDPW products. Other signs of the times include the appearance in August 1935 of an article for geography teachers, triggered by the introduction of compulsory military service, which discusses the use of maps in para-military training (:HKUVSRUW). Thereafter, however, articles aimed at schoolteachers disappeared altogether. By 1936 the journal had became completely focussed on professional cartographers and their trainees. From 1936 the journal’s cover was redesigned. The 5HLFKVDPW’s own logo showing a map of Germany overlaid with a grid disappeared, and after one issue on which the previous (rather un-military) German eagle was replaced with a new harder-edged (but still non-political) eagle, this too was replaced with the well-known eagle-logo incorporating the Nazi swastika within a wreath.
22 ‘Wechsel im Präsidium des Reichsamts für Landesaufnahme’, 0G5I/, �� (1934-5), 1-9. Vollmar’s final military posting had been as *HQHUDOOHXWQDQW in Stettin; see 0G5I/, �� (1940), 41.
23 ‘Feierstunde im Reichsamd für Landesaufnahme’, 0G5I/, �� (1937), 1-4. It should be noted that party membership was forbidden to serving members of the German Army until 1944.

17
7KH�RULJLQDO�HDJOH��IURP�D����� Mitteilungen FRYHU��DQG�LWV������UHSODFHPHQW�
The first new law printed was the ‘*HVHW]��EHU�GLH�1HXRUGQXQJ�GHV�9HUPHVVXQJVZHVHQV�YRP� ��� -XOL� ����¶� (Decree on the new arrangement of surveying matters), printed in May 1935�24 With its subsidiary ordinances of May and June 1935 this profoundly changed the balance of power between the central government, the 5HLFKVDPW� and the survey departments of the /lQGHU� The Interior Minister, Wilhelm Frick, was given sole power to order all arrangements for survey and mapping matters throughout the 5HLFK, in both the official and private sectors. The ordinances established that the 5HLFKVDPW was to have sole responsibility for the first and second order triangulation of the 5HLFK and sole charge of official map production at 1:50,000 and all smaller scales. All personnel within the survey bodies of the /lQGHU involved with mapping on these scales became subject to the orders of the President of the 5HLFKVDPW. The June ordinance peremptorily abolished the %HLUDW�I�U�GDV�9HUPHVVXQJVZHVHQ� an independent advisory council on surveying set up by 5HLFKVSUlVLGHQWHindenburg in 1920 with a broad remit to review surveying and mapping matters, to comment and make suggestions on them, and to issue guidelines that aimed to ensure that the otherwise independent survey authorities did follow a common practice. Although it thus had a unifying role, the %HLUDW had also been set up as an important brake on the ability of any one person or body to impose policy on all the different survey authorities. Its abolition left Frick, and through him Hitler, without any practical restrictions on his authority over the mapping of Germany.25
Nonetheless, there was an immediate benefit to the survey from the Nazi power-seizure. The resources and manpower that had been denied to the 5HLFKVDPW all through the 1920ssuddenly increased, and continued to increase.26 From 1934 onwards the revision of maps and the issue of gridded maps both increased rapidly. The priorities of the 5HLFKVDPW did not change, but many of the backlogs of work were sharply reduced. Projects that had been shelved after the First World War, like the renewal of the 1:200,000 map, were resumed. Surveying and production of the 1:5000 'HXWVFKH�*UXQGNDUWH accelerated. The gridding of the 1:25,000 maps in particular made rapid progress, peaking at 370 newly gridded sheets in 1934-5 and continuing at around 250 per year thereafter. It was at long last completed during
24 ‘Gesetz über die Neuordnung des Vermessungswesens. Vom 3. Juli 1934’, 0G5I/, �� (1935), 1-2. The supplementary regulations implementing this were also printed: ‘Begründung zum Gesetz über die Neuordnung des Vermessungswesens vom 3. Juli 1934’, 0G5I/, �� (1935), 2-4; and ‘Zusammensluß der Landesvermessungen’,0G5I/, �� (1935), 5-6.
25 The formalities of abolition of the %HLUDW�seem only belatedly to have been observed, suggesting that the abolition was not achieved as smoothly as it might have been: see 0G5I/, �� (1935), 53-57.
26 Total personnel increased from 539 in 1935, to 1030 in 1936 and 1325 in 1937: see ‘Die Reichsamt für Landesaufnahme auf der Ausstellung "Gebt mir vier Jahre Zeit"’, 0G5I/, �� (1937), 226. For comparison the OS establishment had been reduced from 2077 before the First World War to 1462 in 1920, and 1000 in 1922. By 1936 it had risen again to 1334. The Davidson Report envisaged an establishment of 4000 by 1944. Sources: W A Seymour, $�KLVWRU\�RI�WKH�2UGQDQFH�6XUYH\, Folkestone: Dawson, 1980, 230, 235, 265.
18
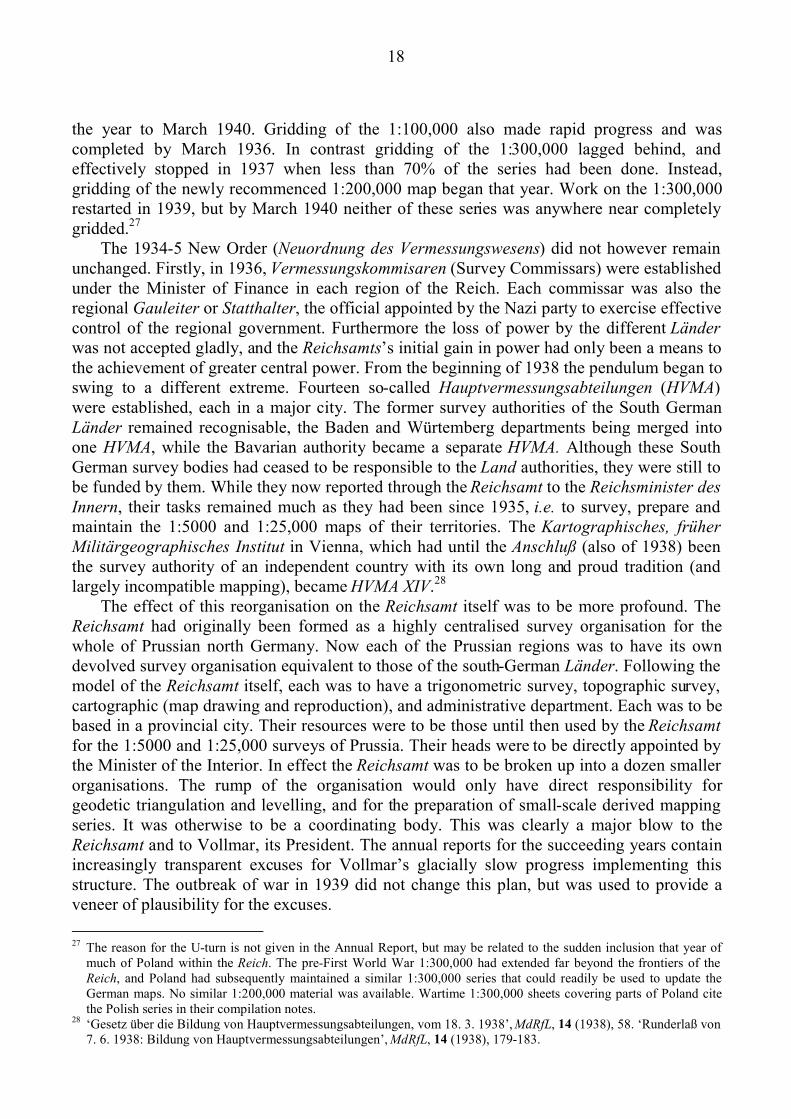
the year to March 1940. Gridding of the 1:100,000 also made rapid progress and was completed by March 1936. In contrast gridding of the 1:300,000 lagged behind, and effectively stopped in 1937 when less than 70% of the series had been done. Instead, gridding of the newly recommenced 1:200,000 map began that year. Work on the 1:300,000 restarted in 1939, but by March 1940 neither of these series was anywhere near completely gridded.27
The 1934-5 New Order (1HXRUGQXQJ�GHV�9HUPHVVXQJVZHVHQV) did not however remain unchanged. Firstly, in 1936, 9HUPHVVXQJVNRPPLVDUHQ (Survey Commissars) were established under the Minister of Finance in each region of the Reich. Each commissar was also the regional *DXOHLWHU or 6WDWWKDOWHU, the official appointed by the Nazi party to exercise effective control of the regional government. Furthermore the loss of power by the different /lQGHUwas not accepted gladly, and the 5HLFKVDPWV’s initial gain in power had only been a means to the achievement of greater central power. From the beginning of 1938 the pendulum began to swing to a different extreme. Fourteen so-called +DXSWYHUPHVVXQJVDEWHLOXQJHQ (+90$) were established, each in a major city. The former survey authorities of the South German /lQGHU remained recognisable, the Baden and Würtemberg departments being merged into one +90$, while the Bavarian authority became a separate +90$� Although these South German survey bodies had ceased to be responsible to the /DQG authorities, they were still to be funded by them. While they now reported through the 5HLFKVDPW to the 5HLFKVPLQLVWHU�GHV�,QQHUQ, their tasks remained much as they had been since 1935, L�H�� to survey, prepare and maintain the 1:5000 and 1:25,000 maps of their territories. The .DUWRJUDSKLVFKHV�� IU�KHU�0LOLWlUJHRJUDSKLVFKHV�,QVWLWXW in Vienna, which had until the $QVFKOX� (also of 1938) been the survey authority of an independent country with its own long and proud tradition (and largely incompatible mapping), became +90$�;,9.28
The effect of this reorganisation on the 5HLFKVDPW itself was to be more profound. The 5HLFKVDPW� had originally been formed as a highly centralised survey organisation for the whole of Prussian north Germany. Now each of the Prussian regions was to have its own devolved survey organisation equivalent to those of the south-German /lQGHU. Following the model of the 5HLFKVDPW itself, each was to have a trigonometric survey, topographic survey, cartographic (map drawing and reproduction), and administrative department. Each was to be based in a provincial city. Their resources were to be those until then used by the 5HLFKVDPWfor the 1:5000 and 1:25,000 surveys of Prussia. Their heads were to be directly appointed by the Minister of the Interior. In effect the 5HLFKVDPW was to be broken up into a dozen smaller organisations. The rump of the organisation would only have direct responsibility for geodetic triangulation and levelling, and for the preparation of small-scale derived mapping series. It was otherwise to be a coordinating body. This was clearly a major blow to the 5HLFKVDPW and to Vollmar, its President. The annual reports for the succeeding years contain increasingly transparent excuses for Vollmar’s glacially slow progress implementing this structure. The outbreak of war in 1939 did not change this plan, but was used to provide a veneer of plausibility for the excuses.
27 The reason for the U-turn is not given in the Annual Report, but may be related to the sudden inclusion that year of much of Poland within the 5HLFK. The pre-First World War 1:300,000 had extended far beyond the frontiers of the 5HLFK, and Poland had subsequently maintained a similar 1:300,000 series that could readily be used to update the German maps. No similar 1:200,000 material was available. Wartime 1:300,000 sheets covering parts of Poland cite the Polish series in their compilation notes.
28 ‘Gesetz über die Bildung von Hauptvermessungsabteilungen, vom 18. 3. 1938’, 0G5I/, �� (1938), 58. ‘Runderlaß von 7. 6. 1938: Bildung von Hauptvermessungsabteilungen’, 0G5I/, �� (1938), 179-183.

19
The rapid successive annexations of territory to the Reich from 1938 onwards made the mapping of Germany into a greater and more complicated task. Political considerations meant that the annexation of the Sudetenland in October 1938 had rapidly to be followed by the publication of maps showing the complex new boundary. The existing Czech mapping was at 1:75,000, since it derived ultimately from the Austro-Hungarian survey of 1870-1886. It was thus incompatible with German standards, but derived maps at 1:75,000 were hurriedly produced. These then had to be replaced with further derived maps on which the Czech names had been replaced with official German ones (which were not necessarily those that had appeared on the original Austro-Hungarian mapping). Administration of the Sudetenland (which formed a rim around three sides of Bohemia) was however split between the adjacent parts of Germany. Surveying and mapping of the annexed area was thus divided between the four adjacent +90$s, those of Breslau, Dresden, Munich and also Vienna (itself newly incorporated into the Reich). In March 1939, six months after the annexation of the Sudetenland, the remainder of Czechoslovakia was occupied, and partitioned between Germany and Hungary. The former Czech survey organisation in Prague was taken over as part of the German ‘Protectorate of Bohemia and Moravia’ (using staff transferred from the 5HLFKVDPW). This could have simplified things, but for political reasons the Sudetenland areas still had to remain within the surrounding German administrations.
During 1939 there were also successive boundary changes in the east. Memel was joined to the Reich in March 1939, and roughly half of Poland was annexed in September 1939.29
Much of this territory had been part of pre-war Germany. A framework of old German mapping therefore existed of these areas, but revising these maps from more recent Polish surveys was nevertheless a substantial job. Mapping those areas not previously German was more difficult. For much of this area there was out-dated German mapping derived from pre-World War I Russian surveys at 1:42,000.30 In southern Poland the territory of the former Austro-Hungarian Kingdom of Galicia had originally been mapped at 1:75,000. There was no existing German mapping of this area. There was a strong political imperative to bring the mapping of all these areas rapidly into line with that of the rest of Germany. One expedient was the production of 47 ‘Germanised’ (YHUGHXWVFKWH) sheets of the existing Polish 1:100,000 map.31 The process was however disrupted by the piecemeal introduction of a large number of changes in the official names and boundaries of administrative areas within the region. Each change had to be incorporated onto the maps, leading to repeated needs to revise sheets.32 The magnitude of this task was enormous; between March 1938 and March 1941 the number of 1:25,000 sheets required to cover the 5HLFK rose by 524 (from 2979 to 3503),
29 The complexities (and brutalities) of the German administration of different areas within the parts of Poland annexed in 1939 are analysed in C Madajczyk (trans. B Puchert), 'LH�2NNXSDWLRQVSROLWLN� 1D]LGHXWVFKODQGV� LQ� 3ROHQ� ���������, Köln: Pahl-Rugenstein, 1988. The administration of the areas conquered from the Soviet Union from 1941 was different again: see A Dallin, *HUPDQ� UXOH� LQ� 5XVVLD� ���������, second edition, London, 1981. Neither account mentions policies on mapping these territories, although both contain useful sketch-maps of the respective German administrative divisions.
30 The 5HLFKVDPW had old, but contoured, 1:100,000 maps of almost all of Poland (north of former Austrian territory), all of Lithuania, and much of Latvia. These had been derived before and during the First World War from captured Russian maps. Existing derived 1:300,000 mapping extended further east to a line Viborg – Moscow – Kiev, but also did not cover former Austrian territory in Poland, or most of the Ukraine. See 'DV�5HLFKVDPW�I�U�/DQGHVDXIQDKPH�XQG�VHLQH�.DUWHQZHUNH, Berlin, 1931, 260-265 & 279-290.
31 Annual Report to 31. 3. 1941, 0G5I/, �� (1941), 230-247, esp. 245.32 A consolidated list of revisions to the official 1939 list of local authority names appears as ‘Die Kreisnamen in den
eingegliederten Ostgebieten’, 0G5I/, �� (1941), 269-270. Subsequent revisions are listed in 0G5I/, �� (1942), 56-57; also 0G5I/, �� (1943), 58-59; also 0G5I/, �� (1943), 211-212.

20
of which 250 remained to be published. The number of 1:100,000 sheets rose from 529 to 719, of which 45 had yet to be produced. Derived maps of local government areas had also to be produced.33 Not only did the topography of these areas have to be surveyed, revised and mapped, but most of the trigonometrical framework was inadequate. The published 1941 annual report details many areas of the east that had been re-triangulated. By implication, more were outstanding.34
The expansion of the Reich not only expanded the task of mapping at medium and small scales. In 1942 the 0LWWHLOXQJHQ printed an account of how aerial survey was being used rapidly to produce entirely new 1:5000 mapping of the parts of Poland previously only covered by small-scale Russian mapping. Although the account attempts to justify the civilian need for such mapping (of sparsely settled country), it does concede that publication at 1:10,000 or even smaller scales might be needed in practice. While the account probably describes surveying for military rather than civilian purposes, that extensive mapping of the east at such scales could be considered (or even be discussed) over a year after the opening of the Russian Front beggars belief.35
The expansion of the workload of the 5HLFKVDPW led to severe shortages of skilled technical staff, most particularly of cartographic draughtsmen, copper-engravers and lithographers. Between 1925 and 1933 only 36 technical staff had completed their training, and by 1938 only five of these remained with the 5HLFKVDPW.36 After attempts to recruit unemployed adults with drawing or drafting skills (who were found to be unsatisfactory), the Reichsamt resigned itself to expanding the traditional process of recruiting school-leavers as apprentices for four years. These then had leave to perform two and a half years of compulsory military and labour service before returning as fully trained craftsmen. In October 1938 there were said to be a hundred and ten apprentices in training, plus sixty more doing their military service. The first of these were due to return in the autumn of 1940.37 For a time, recruitment of trained staff from the private sector also took place, but this was perceived by the leaders of the industry as poaching, and produced a backlash. What took place behind the scenes does not appear in the 0LWWHLOXQJHQ (and the regulations were only belatedly printed there), but in 1937-8 a series of decrees were made which effectively made it impossible for cartographic craftsmen to move between employers within the industry, or
33 Unrevised copies of a large number of these sheets, covering the whole of pre-Versailles Germany east of the Oder, remain available from the %XQGHVDPW� I�U� .DUWRJUDSKLH� DQG� *HRGlVLH. For details, see their website ZZZ�LIDJ�GH�*,�VKRS�LQGH[�KWPO. The index shows that most 1:25,000 sheets covering the boundary between the Soviet ‘Sphere of Interest’ (under the terms of the German-Soviet non-aggression pact of August 1939) and the Memelland and East Prussia are only complete to the boundary of the (then) 5HLFK. Those shown of most areas of inter-war Poland within the German ‘sphere’ are complete to the sheet margins, the exceptions being along the southern boundary of East Prussia. I infer firstly that wider, but still incomplete, coverage of German-occupied Poland was once available, and secondly that the 5HLFKVDPW (as opposed to the military mapping organisations) did not extend its 1:25,000 mapping into the Soviet sphere of interest, even after the attack on the USSR in 1941. Note that even during the First World War German military 1:25,000 mapping had been made of battle zones well beyond these frontiers both by 9HUPHVVXQJVDEWHLOXQJHQ and by the predecessor of the 5HLFKVDPW.
34 For an account of the complex of incompatible triangulation values that had accumulated within the former Danzig corridor and adjacent areas see: B Huber, ‘Die Festpunkte und ihre Koordinaten im Reichsgau Danzig-Westpreußen’, 0G5I/, �� (1943), 21-30. This was of course the annexed area with the best existing 5HLFKVDPW mapping.
35 F Nowatsky, ‘Die schnelle Herstellung der Deutschen Grundkarte 1:5,000 in den Ostgebieten’, 0G5I/, �� (1942), 225-232.
36 A breakdown of the numbers in each of the 21 trades in the .DUWRJUDSKLVFKH�$EWHLOXQJ in April 1937 is given in ‘Die Reichsamt für Landesaufnahme auf der Ausstellung “Gebt mir vier Jahre Zeit”’, 0G5I/, �� (1937), 227.
37 Speech by Direktor von Loeschebrand to the 'HXWVFKH� .DUWRJUDSKLVFKH� *HVHOOVFKDIW meeting of October 1938, ‘Gegenwartsforderungen in der Kartographie’, (printed in) 0G5I/, �� (1938), 324-329, see especially p. 328.

21
to leave it. It was also made illegal to entice workers to another employer by ‘inappropriate means’, like offering higher wages or other advantages.38
In the early part of the 1938-9 reporting year, the 5HLFKVDPW was presented with another new task that was to exacerbate the shortage of skilled technical personnel. The .DUWRJUDSKLVFKH� $EWHLOXQJ was divided into two separate $EWHLOXQJHQ (imaginatively designated as .DUW�� , and .DUW�� ,,). While .DUW�� , continued the routine civilian output of maps, .DUW�� ,, was devoted entirely to 6RQGHUDXIJDEHQ (special projects).39 The ‘special projects’ were in fact the production of maps of areas outside Germany in preparation for the coming war. It should be noted that only one $EWHLOXQJ of the 5HLFKVDPW�was duplicated. Neither triangulation nor compilation staff were allocated to the preparation of these maps. This was to have a profound effect on the maps produced. While the staff of the new department had great (if rather old-fashioned) skills in the reproduction and printing of maps, computational and compilational skills were the prerogative of others. It was therefore almost inevitable that the maps produced by the new department would be technically-good copies of existing maps, rather than new derived maps incorporating additional material. Only if a grid (or other form of squaring) was already present on the original map would it appear on the copies. There was no mechanism within the new department for calculating grid values for maps outside Germany. Indeed the routine that had been established for the German 1:25,000 maps, which required the renewal of the trigonometrical framework as part of the process of gridding a map sheet, was inapplicable to maps for which original trigonometrical data was unavailable. No other system or routine was in place to be used.
The maps produced of Britain exemplify the results. The 1:100,000 series of ‘Englandund Wales’ and of ‘Schottland’, produced between 1938 and 1940, are meticulous copies of the corresponding 1:126,720 Ordnance Survey maps. In fact, as a result of redrawing or re-engraving, the line-work is finer than on the originals, despite the enlarged scale. The only substantive change in the content of the maps was that contours and spot-heights were given metric values.40 Even this was a sufficiently novel task to .DUW��,, that in December 1939 it was thought worthwhile for the 5HLFKVDPW to print instructions and tables for the conversion of imperial to metric measures in the 0LWWHLOXQJHQ.41 The maps were produced to a very high standard, but being un-gridded, would have been useless for artillery purposes, and sub-optimal for many other military uses.
The production of these maps was, of course, at the time secret. The use of a civilian body to produce such maps had likewise to be kept secret. Accordingly, and contrary to usual practice, the maps bore no indication of the agency that had produced them. Once the war had started, secrecy about the body producing them became less important. Furthermore within the torrent of legislation pouring from German government bodies was an Order of February 1940.42 This largely concerned increasing the level of secrecy of maps, and in particular it required that all recently surveyed detail of economic or military importance,
38 ‘Bekanntgabe des Präsident der Reichsanstalt für Arbeitsvermittlung und Arbeitslosenversicherung betreffend den Arbeitseinsatz von Kartographen, Lithographen, Kupferstechern und Druckern’, 0G5I/, �� (1938), 273-274.
39 ‘Jahresbericht des Reichsamt für Landesaufnahme vom 1.4.1938 bis 31.3.1939’, 0G5I/, �� (1939), 178. ‘Jahresbericht des Reichsamt für Landesaufnahme vom 1.4.1939 bis 31.3.1940’, 0G5I/, �� (1940), 166.
40 J L Cruickshank, ‘German Military Maps of UK & Ireland of World War II’, 6KHHWOLQHV �� (2004), 15-19.41 ‘Hilfstabellen zur Verwendung englischer Maße in metrische. Maßtäblisches, Erddimensionen und Berichterstattung’, 0G5I/, �� (1939), 317-324.
42 ‘Verordnung über die Veröffentlichung kartographischer Darstellung vom 6. Februar 1940’, and ‘Erste Durchführungsbestimmungen zur Verordnungen … vom 6. Februar 1940’, 0G5I/, �� (1940), 42-45.

22
such as railway stations and yards, and new roads, should be omitted or falsified. However, to enable policing of the measure, it also enacted that all maps had to bear the name and address of a publisher, printer or maker. Thereafter .DUW��,, did use an imprint identifying it as the maker of its maps.
There was a German military mapping authority, the $EWHLOXQJ� I�U� .ULHJVNDUWHQ� XQG�9HUPHVVXQJVZHVHQ, a department within the rear echelon of the *HQHUDOVWDE�GHV�+HHUHV (the Army General Staff).43 In 1940 its Chief was Generalmajor Hemmerich, who in his official capacity attended a formal celebration for Vollmar, the President of the 5HLFKVDPW� on his reaching forty years service.44 A small but important indication of the relative status of the two bodies in 1940 is that Generalleutnant Vollmar thus outranked the Chief of the military mapping and survey department.45 While the publications of the 5HLFKVDPW make no comment about the organisation’s military counterpart, it is seems that during the build up to war the General Staff’s department did not have the capability or capacity to produce the huge number of maps required. Given that the 5HLFKVDPW was the successor to the military body of the First World War, and that until Hitler’s rearmament of Germany the country was supposed not to have any General Staff, this might hardly be surprising. Although the $EWHLOXQJ� I�U�.ULHJVNDUWHQ� XQG� 9HUPHVVXQJVZHVHQ produced the intelligence booklets for the invasions of the Low Countries, France, Denmark and Norway, and for the planned invasions of Britain and Ireland, the 5HLFKVDPW�produced the maps. Despite the explicitly military tasks of .DUW��,,, it remained a civilian department within a civilian organisation. It continued to produce war maps until February 1941, when it was once more merged with .DUW�� ,� This may mark the point when the $EWHLOXQJ� I�U� .ULHJVNDUWHQ� XQG�9HUPHVVXQJVZHVHQ became able to produce its own maps, but may simply be the point when the 5HLFKVDPW ceased to differentiate between its war work and its civilian tasks.46
The differences in the history and development of the Reichsamt and the Ordnance Survey left them with very different strengths and weaknesses. In the second article of this pair I shall explore the implications and results of some of these.
43 Initially called the $EWHLOXQJ� I�U� +HHUHVYHUPHVVXQJVZHVHQ� XQG� 0LOLWlUJHRJUDSKLH (��� $EW.), this department was established in October 1936. Until mobilisation for war it formed part of the =HQWUDODEWHLOXQJ of *HQHUDO� 6WDE�GHV�+HHUHV� under 2EHUTXDUWLHUPHLVWHU� ,, but on mobilisation of the Field General Staff, it remained in Berlin under 2EHUTXDUWLHUPHLVWHU� 9. The &KHI� GHV� .ULHJVNDUWHQ� XQG� 9HUPHVVXQJVZHVHQV thus became an officer within *HQHUDOVWDE GHV� +HHUHV� ��� 6WDIIHO. Stephen E Ambrose (ed.), US War Department handbook on German military forces, Washington, 1945, reprinted Baton Rouge, 1990, 24. Rudolf Absolon, 'LH� :HKUPDFKW� LP� 'ULWWHQ� 5HLFK, Schriften des Bundesarchivs 16, Boppard: Harald Boldt Verlag, 1975-88, 16/III 152, 16/IV 178, 16/V 58-9. There was also an equivalent officer and body within the /XIWZDIIH General Staff. The status of the /XIWZDIIH�body progressively increased from 1934 onwards, as did the rank of Ernst Drechsel, its leader during this time (Fliegerkommandant 1934, Oberstleutnant 1935, Oberst 1937, Generalmajor 1942).
44 0G5I/, �� (1940), 41. 45 When it had been a military body, the &KHI of the 3UHX�LVFKH� /DQGHVDXIQDKPH had traditionally held the rank of *HQHUDOOHXWQDQW. General von Bertrab, the penultimate &KHI had been promoted to full *HQHUDO�GHU�,QIDQWHULH during the war. Weidner, the last &KHI and first President, had been a *HQHUDOOHXWQDQW. His successor, Richard von Müller, had left the army in 1919 as a *HQHUDOPDMRU. When he was subsequently promoted to the Presidency his military rank on the retired list remained unchanged. Vollmar’s appointment restored the status of the Presidency. A useful list of the names of those prominent in German surveying and mapping in 1940, with their military or civil ranks and appointments, is given in ‘Eröffnungstagung und 1. Fachsitzung des Forschungsbeirats für Vermessungstechnik und Kartographie’, 0G5I/ 16 (1940), pp 93-109.
46 The bald statement in the 1941 Annual Report that Kart. I and Kart. II had been merged makes no comment about what the implications for their respective workloads or personnel were to be.

23
5HWXUQ�WR�/DUNKLOO�
Preparing the map on page 6 of 6KHHWOLQHV��� for publication caused the editor1 to wonder whether the Larkhill Military Railway was shown on contemporary one-inch mapping. Paul Laming kindly searched his comprehensive collection and found that although the line is not shown on any printing of Popular Edition sheet 122, 6DOLVEXU\��%XOIRUG, it does appear in fine detail on the 6DOLVEXU\�3ODLQ Popular Edition District map of 1920 (DERYH).2
Early printings of regular sheet 122 are based on 1913 revision, before the railway was constructed. Given the detail with which railway and camp are shown on the one-inch district sheet, one can understand the need to tighten security in the 1920s.3 It would be reasonable to conjecture that this new policy, rather than any disuse, led to the omission of the railway track and other military data from the 1927 and subsequent printings of the regular sheet.
Meanwhile Rodney Leary was checking his half-inch maps and found the railway shown on the 1926 edition of sheet 33. This is marked as ‘revised 1912-14’ and shows the line terminating at the buildings4 just north of Fargo Plantation, with all the track south of that
1 Who apologises to all concerned for not being able to spell ‘hangar’.2 For another example of information shown only on a district map see 6KHHWOLQHV���, 52.3 Yolande Hodson, 3RSXODU�PDSV, London: Charles Close Society, 1999, 157-168.4 Annotated ‘HOSPITAL’ on the map in 6KHHWOLQHV���.

24
point omitted. The %ULWLVK� $VVRFLDWLRQ� WRSRJUDSKLFDO� PDS� IRU� WKH� %ULVWRO� PHHWLQJ� ����(compiled from parts of half-inch sheets 27, 28, 32 and 33) shows the railway in the same form, but on Rodney’s 1935 printing of sheet 33, the railway, the words ‘Rollestone Camp’ and the camp roads, but not buildings, have been removed.
Again we see the effect of the change in security policy for Rodney notes the suppression of other military information elsewhere on the sheet and, as Gerry Jarvis remarks, “I am a little surprised to see the words Rollestone Camp omitted. I camped there in the 60s and you will have noticed the substantial camp still there.”
Roger Eckersley had also been studying the one-inch district map and adds that the line to Bulford was railway owned (London and South Western), as was the branch from Ludgershall to Tidworth (Midland and South Western Junction) and both had scheduled passenger services. He points out, for future visitors to Larkhill, that between Stonehenge and Amesbury there is a series of copses which were planted by the then landowner, a retired Admiral, to portray the disposition of Nelson’s fleet at the Battle of the Nile in 1798.
Roger Eckersley’s letter to Gerry Jarvis concludes with information about other military sites which Midlands members may like to follow up:
I recently did some research for an article on the Ashby to Derby Branch of the Midland Railway, which was on my boyhood stamping ground. During the 1939-45 war this was handed over to the War Department and operated as the Melbourne Military Railway. Many thousands of British and American troops were trained there for railway operations in the Middle East and Europe. Extensive warehousing, accommodation and sidings were built in the north of Melbourne, but I discovered that the New Popular and Seventh Series OS maps (sheet 121) are not accurate in portraying what happened. The 1946 map just reproduces what was on the 1921 Popular map (sheet 53), namely a tiny engineering siding (SK 389280), though this had completely disappeared by that time. I have three editions of the Seventh Series, 1954, 1962 and 1971, and these show in some detail the growth and subsequent demolition of the barracks at Weston-upon-Trent and the extensive sidings at Kings Newton, south of the River Trent. None of them shows the development of sidings north of the Trent, between the two railway lines, known as Chellaston Quarry. This consisted of up to twenty tracks and had its own signal box; it certainly survived until the 1960s, when steam locomotives were stored there awaiting scrapping. Its ‘disappearance’ from the one-inch is the more remarkable because it is featured in the contemporary six-inch map. It set me wondering how many other instances there might be of selective omission? Elsewhere other large depots are shown in some detail, for instance Donnington (Shropshire) and Bicester, but one wonders how accurately?
Another railway-based American depot was constructed not far from Melbourne at Marchington, near Uttoxeter, and this appears on maps right up to /DQGUDQJHU, though I have not checked the latest edition. There is an unusual wartime feature south-east of here at Fauld (SK 183277). There was a large underground ammunition depot here in a former gypsum mine. Towards the end of the war this blew up (I heard the explosion). There was loss of life and several buildings on the surface disappeared. I have never heard an explanation of the cause but a crater was left several hundred metres across. This has appeared on Seventh Series and /DQGUDQJHU maps without any caption or explanation. &XUUHQW����������PDSSLQJ
��&URZQ�&RS\ULJKW�1&��������

25
&DQQLEDOLVP�DQG�XQVDYRXU\�DGGLWLYHV��/DQJGRQ�5RZH
In 1960, during revision of the 1:2500 Ordnance Survey maps, I had to survey a large pig farm in the New Forest, Hampshire. As usual before entering on to private property I had to get permission from the owner. Every field surveyor carried an authority card and in some areas of the British Isles these were supplemented with a card printed in Urdu, Hindi and Punjabi. Although the Ordnance Survey had certain rights of access which if necessary could be backed by a surveyor’s warrant, permission was always sought and refusal was very rare.
On this occasion the owner was a friendly, weather-beaten farmer, wearing old rubber boots, threadbare clothes and a distinctive navy blue peaked cap, complete with colourful shipping line badge. I set about taking measurements for plotting new buildings on the map.
My first task was to measure a pen that housed a large aggressive looking boar. I had always been very wary of large male pigs after hearing some tales from farmers who had been knocked over and bitten by hungry animals in their rush for the trough. Even average sized pigs are very heavy; a full size boar on the move is like a mini bulldozer. I decided that it would be safer if I didn’t enter the pen, so I threw the tape over from one side to the other and then read the distance. Before I could wind the tape back in its box, the boar, who had been watching me with great interest, jumped up onto the wall and started to ‘eat’ the tape.
In no time at all he had about a metre of the tape in his slavering mouth. I tried in vain to pull it away from him from outside the pen. It was to no avail. I reluctantly climbed into the pen, edged my way round the wall ready for a very fast retreat and gave him a few sharp clouts across the snout. The beast eventually disgorged my mangled tape. If he had decided to push me against the wall I could have ended up looking like the tape.
There were numerous concrete pens of noisy animals and one building which had a chimney belching out black smoke. I decided to look inside and was surprised to see large vats of boiling swill. I was even more surprised to see that the mixture contained the bodies of several piglets which were being ‘recycled’ along with bread, cakes, and other unidentifiable flotsam and jetsam.
When I’d completed the survey the owner made some tea for us. We sat down on an old bench and chatted. I told him about my adventure with the boar and he assured me that I was in no danger but the tape could have choked the animal if it had swallowed the full twenty metres! He handed me a cup of tea and I noticed that the cup was printed with the same badge as his sailor’s cap and the words ‘Bibby Line’. This rang a bell for me because I sailed to Egypt from Southampton on a troop ship called the (PSLUH�.HQ, owned by the Bibby Line shipping company. The cap, and the cup, both having the same logo convinced me that my host must have been a seaman at sometime. I was wrong, he told me that he collected ingredients for his swill from Southampton docks. He regularly discovered crockery and cutlery in with the food when he poured it into the vats. “I even found this cap one day”, he said. I nearly choked when I realised that the cup had been in swill, probably with dead piglets! Even more unpalatable, he went on to say that sometimes rats and mice fell into the mixture! The pigs certainly had a varied diet, but one that I would rather not have known about in the circumstances! 7KH�DXWKRU�UHWLUHG�IURP�WKH�2UGQDQFH�6XUYH\�LQ������DIWHU����\HDUV�VHUYLFH��+H�VWDUWHG�DV�D�GUDXJKWVPDQ�DW�&UDEZRRG�LQ�������HQGLQJ�XS�DV�&KLHI�6XUYH\RU�RI�6RXWK�<RUNVKLUH�

26
8QFOH�-RH�NQHZ�ZKHUH�\RX�OLYHG7KH�VWRU\�RI�6RYLHW�PDSSLQJ�RI�%ULWDLQ��SDUW�, � 1
-RKQ�'DYLHVIt is a spine-chilling fact. Every Soviet president from Stalin to Gorbachev, and all their high-ranking officers, knew not only where you lived but how to get there by tank. They knew the width of the roads, the height of the bridges, the depth of the rivers, the names of the streets. And they knew the exact location and purpose of every building of possible strategic importance, even those which were omitted from OS maps.
For over fifty years, before during and after the cold war, the Soviet military undertook the most comprehensive global survey ever attempted and created detailed, accurate maps of practically every country in the world. For many African and Asian countries these maps are, even today, the most reliable or only open source of good quality topographical information.
This top secret enterprise was on a vast scale, driven by military imperatives and executed to the highest technical standards. Today, very little is known about how the organisation was structured and how such incredible results were achieved. The achievement is particularly astonishing when compared with the regime’s inability to fulfil industrial and agricultural production targets and its failure to feed the people.
Almost the only information available is the evidence of the surviving maps themselves, supplemented by the stories of those who became involved after the collapse of USSR. The present account has been compiled from such sources and is therefore inevitably incomplete and somewhat tentative. No doubt more information will come to light in due course. However, no history of Soviet military mapping has yet appeared in print in English and this represents an attempt to establish some of the facts. Part one comprises a general description of the maps and the circumstances of their production. Part two will tell the story of their emergence in 1993 and provide a closer look at the map content and the probable sources of information.
:RUOG�PDSSLQJThe scope of the Soviet mapping initiative is staggering:
• the whole world2 was mapped at scales of 1:1 million, 1:500,000 and 1:200,000;3
• most of Asia, Europe, northern Africa and North America was mapped at 1:100,000;• USSR and much of Europe, the Far and Near East at 1:50,000;• USSR and eastern Europe at 1:25,000;• about a quarter of USSR at 1:10,000.In addition plans at 1:25,000 and 1:10,000 were produced of thousands of towns and
cities around the world. These latter are particularly interesting for the level of detail shown, much of which could only have been gathered by having a local presence; easier in friendly countries than elsewhere.
The military machine realised the importance of accurate topographic mapping for military, economic and political purposes almost immediately after the Russian revolution. A
1 The Web links may be followed from the text to be posted on the CCS website. Part II will appear in 6KHHWOLQHV���.2 Taken from ZZZ�FDUWRJUDSKLF�FRP�GRFXPHQWV�UXVVLDQ�SGI.3 Western military surveys used 1:250,000 for medium scale planning maps, but communist countries preferred 1:200,000.

27
military cartographic administration was created in 1919 and began to make geodetic and cadastral surveys of significant parts of the new Soviet Union.
The earliest British map example seen so far is dated 1938,4 indicating that the global project was under way before World War II. In the mid-fifties a new ‘Sofia’ standard was established and worldwide mapping activity intensified during the cold war. The latest maps seen date from as recently as 1990.5
The most striking feature of the maps is that all text and place names are printed in Cyrillic script, causing familiar places to look quite unfamiliar. Foreign names are transliterated phonetically so that a Russian speaker could easily read and pronounce them. London appears as EHG>HG, Paris as I:JB@. This is particularly helpful with places having non-obvious pronunciation. Gloucester, Leicester and Dun Laoghaire appear as =EHKL?J (‘Gloster’), E?KL?J (‘Lester’) and >:G-EAJ? (‘Dun Leary’) respectively.
One standard global sheet numbering system is used, the International Map of the World system, which provides a simple and comprehensive indexing method. The globe is divided into latitudinal bands four degrees deep and longitudinal zones six degrees wide. The bands are coded A-U working north from the equator and the zones are numbered 1-60 working east from longitude 180° (the date line). Thus, grid square M30 lies between latitude 48° and 52° north and between longitude 0 and 6° west (S.W. England). M31 contains S.E. England, northern France and Belgium, whilst most of Ireland lies in N29 (lat. 52°-56°N; long. 6°-12°W). The band letters are repeated south of the equator, with a prefix.
NomenclatureThe 1:1 million map sheets each cover a single grid square (except in the far north) and are named accordingly (M30, N29 etc). Larger scale sheets are numbered as divisions of these:
• there are four 1:500,000 sheets per grid square, with suffix :, ;, <, = (the first four letters of the Russian alphabet). The suffix is applied from top left to bottom right,
• there are 36 1:200,000 sheets per grid square, with suffix I to XXXVI,• there are 144 1:100,000 sheets per grid square, with suffix 1-144, • there are four 1:50,000 sheets for each 1:100,000 sheet, with suffix :, ;, <, =,• there are four 1:25,000 sheets for each 1:50,000 sheet, with suffix 1-4. Thus, for example, 1:50,000 sheet M-31-1-A occupies the top left hand corner of sheet
M-31-1, the 1:100,000 sheet which itself occupies the top left hand corner of grid M31. Sheet lines rigidly adhere to the graticule; no exceptions are made for bits of land jutting
off the edge. Sheet sizes vary but those of UK are typically about 450-600 mm high by 300-500 mm wide (paper size). Town plans, however, are positioned regardless of graticule lines and may comprise several sheets, each of much larger size.
This graticule is also the basis of the projection, Gauss-Krüger, a version of the UTM system. This can be best explained by starting with the familiar Mercator projection. In the Mercator projection, the globe is mapped as if a cylindrical sheet of paper touches the globe all round the equator. This provides low distortion near the equator, but poor representation further away where most populated places lie. This problem is overcome by Universal Transverse Mercator (UTM) whereby the cylinder is rotated so that the tangent is along a line
4 1:1 million sheet M30 dated 1938.5 Town plans of Bradford, Bournemouth and Brighton are all dated 1990.

28
of longitude instead of the equator. In fact UTM has 60 such tangents, each along the central meridian of the 60 longitudinal zones. This preserves the linear scale along the central meridian with low distortion within each zone, but it is difficult to combine maps of different zones. The Soviet implementation of Gauss-Krüger is based on Pulkovo 1942 datum on Krassovsky 1940 ellipsoid.6
Specifications of style, colour, typography and content are standard throughout, and there is an exceptionally detailed and comprehensive manual of symbols to identify topographic features, places, buildings, industrial works, type of agriculture, soils, vegetation, hydrography and so on.7
0DSV�RI�WKH�%ULWLVK�,VOHVThe small scale maps (1:1 million, 1:500,000, 1:200,000, 1:100,000) cover the entire British Isles. Examples have been seen of particular sheets8 having dates of both 1960s and 1980s indicating that there was at least one complete revision of each series. Printing is in six colours.
The 1:1million sheets and 1:500,000 sheets have contours at 50m intervals and show roads, railways, canals, rivers, reservoirs, forests, shipping routes, spot heights and features such as airfields, lighthouses and monuments. Places are named in different size of script according to population size. Both have small ancillary diagrams showing county boundaries and disposition of adjacent sheets. The 1:1 million map also has hill shading.
The 1:200,000 sheets are similar but with more detail, such as pylon lines, arrows to show direction of river flow and 40m contours. Major roads are annotated with information about width, clearance and carrying capacity of bridges. On the back of most 1:200,000 sheets is a full written description of the territory under the headings ‘Population Centres’, ‘Transport Network’, ‘Relief’, ‘Hydrography’, ‘Vegetation’, and ‘Climate’, with a geological diagram.
The style of the 1:100,000 sheets is again similar but with much more detail. Contour interval is 20m, submarine contours are at 2m, 5m and 10m depths, roads are labelled with national and European road numbers, urban areas are coloured salmon and smaller built-up areas black. Additional details include quarries, footpaths, embankments, cuttings and frequent spot heights and depths. No paper sheets at 1:100,000 seem to exist of Ireland, but reprographic material did exist and raster copies are available.9
1:50,000 seriesPaper sheets at 1:50,000 scale, dated 1980-82, exist for the southern part of England and Wales.10 It is believed that much of the rest of the country was mapped at this scale and reprographic material produced ready for printing. It is also likely that an earlier series was produced in 1960s, but if so, no examples have been seen.11 General appearance and standards are as 1:100,000 but the contour interval is 10m. Railway station symbols indicate the position of the station buildings, and county boundaries are shown.
6 For more about the Pulkovo Observatory see ZZZ�FRQIOXHQFH�RUJ�FRQIOXHQFH�SKS"YLVLWLG ����.7 See ZZZ�UNNDZZ��DUPFKDLUJHQHUDO�FRP�PDSV�NH\PDS�PDSNH\�KWP for a translation of the 1958 manual. The 1983
manual, translated by East View Cartographic, 1997, is in the British Library map room at shelfmark B3b(10).8 These are 1:1 million N-29 ,UHODQG dated 1969 and 1987; 1:500,000 N-31-B 1RUZLFK dated 1970 and 1985; 1:200,000 N-
30-XXIX 1RWWLQJKDP dated 1967 and 1986; 1:100,000 sheet M-31-1 and others east of Greenwich dated 1964 and 1982.9 Eastnor (see below) offer them on CD.10 Known sheets cover land areas of M30 and M31 plus a few odd sheets in N31 and N30.11 See under ‘Compilation Information and Print Codes’ for evidence.

29
Town plansAt least 80 British urban areas were mapped at 1:25,000 or 1:10,000 scale between 1950 and 1990. A list of known sheets and dates is appended.
Some towns occupy a single sheet, but many extend to two, three or even four. All have a comprehensive street gazetteer, extensive text description of the locality12 and a numbered list of important buildings. In most cases this information is printed on the sheet itself, but in the case of Liverpool, London and Portsmouth a separate booklet was issued.
Town plans produced after 1970 are printed in ten colours; earlier ones are in four colours. Most plans are printed on large sheets, typically 900mm high by 1200mm wide and contain a staggering amount of detail. Contours are at 2.5m or 5m intervals with grid of 500m or 1km squares. Spot heights are shown to tenths of a metre. Most streets and localities are named, dimensions and paving material of major roads specified, tube stations are differentiated from railway stations and streams and rivers are annotated with their width.
However, the most striking feature is the attention given to buildings of potential strategic significance. These are depicted in great detail, colour coded, numbered and listed. Military establishments are coloured green, administrative buildings purple and industrial plants black. In some cases an asterisk is used to denote ‘unknown type of production’. The Chatham, Gillingham and Rochester sheet shows details of the naval dockyard which were omitted from OS maps.13
Interestingly, the vertical grid lines on the part of the London sheet east of Greenwich, in grid square M31, are offset from those on the equivalent smaller scale maps by some 250m. This is because the grid is based on the datum for M30 (west of Greenwich).
The London and Glasgow maps have supplementary diagrams of the respective underground railway systems. The London diagram contains one of the few errors so far detected in the entire map series; a non-existent line is shown linking Barbican and Angel.14
The Dublin map is dated 1970 but, oddly, shows street tramways, although the city tramway system was abandoned in 1949. The same sheet shows the altitude of the summit of Howth Head as 169.2m whereas the 1:200,000 map indicates a height of 171m. OSI maps do not give a height.
One intriguing question concerns the towns missing from the list of known sheets. Surely places like Carlisle, Cork, Derby, Dundee, Hull, Limerick, Norwich, Perth, Peterborough, Reading, Slough and Stirling would have been of just as much interest to the Soviets. Did they simply not get round to them or could there have been many more maps than we currently know?
&RPSLODWLRQ�LQIRUPDWLRQ�DQG�SULQW�FRGHVAll maps carry some compilation information in the bottom right hand corner of the sheet. This sometimes consists simply of the year of production, but in many cases specifies scales and dates of declared source material. For example, 1:100,000 sheet M-31-13, London East, 1964 edition shows that it was partly derived from 1:50,000 material dated 1963 and partly from 1:63,360 material dated 1960-62. Presumably the former was an existing Soviet map (suggesting that a 1960s series did exist) and presumably the latter was the OS one-inch map. See below for more about source material.
12 See example for Birmingham at ZZZ�IRXURQH�FRP�PFS���KWP.13 More about map content and sources will appear in part II.14 Thanks to Alan Cubitt for pointing this out.
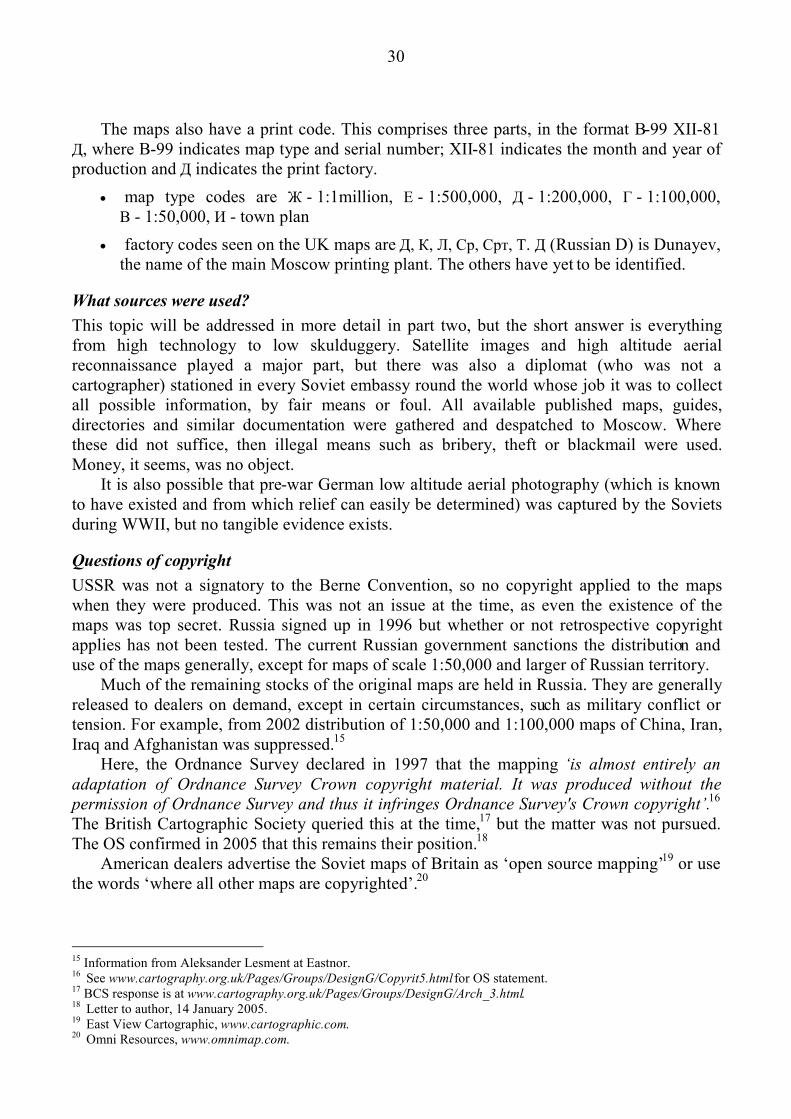
30
The maps also have a print code. This comprises three parts, in the format B-99 XII-81 >, where B-99 indicates map type and serial number; XII-81 indicates the month and year of production and > indicates the print factory.
• map type codes are @ - 1:1million, ? - 1:500,000, > - 1:200,000, = - 1:100,000, < - 1:50,000, B - town plan
• factory codes seen on the UK maps are >, D, E, Kj, Kjl, L. > (Russian D) is Dunayev, the name of the main Moscow printing plant. The others have yet to be identified.
:KDW�VRXUFHV�ZHUH�XVHG"This topic will be addressed in more detail in part two, but the short answer is everything from high technology to low skulduggery. Satellite images and high altitude aerial reconnaissance played a major part, but there was also a diplomat (who was not a cartographer) stationed in every Soviet embassy round the world whose job it was to collect all possible information, by fair means or foul. All available published maps, guides, directories and similar documentation were gathered and despatched to Moscow. Where these did not suffice, then illegal means such as bribery, theft or blackmail were used. Money, it seems, was no object.
It is also possible that pre-war German low altitude aerial photography (which is known to have existed and from which relief can easily be determined) was captured by the Soviets during WWII, but no tangible evidence exists.
4XHVWLRQV�RI�FRS\ULJKWUSSR was not a signatory to the Berne Convention, so no copyright applied to the maps when they were produced. This was not an issue at the time, as even the existence of the maps was top secret. Russia signed up in 1996 but whether or not retrospective copyright applies has not been tested. The current Russian government sanctions the distribution and use of the maps generally, except for maps of scale 1:50,000 and larger of Russian territory.
Much of the remaining stocks of the original maps are held in Russia. They are generally released to dealers on demand, except in certain circumstances, such as military conflict or tension. For example, from 2002 distribution of 1:50,000 and 1:100,000 maps of China, Iran, Iraq and Afghanistan was suppressed.15
Here, the Ordnance Survey declared in 1997 that the mapping µLV� DOPRVW� HQWLUHO\� DQ�DGDSWDWLRQ� RI� 2UGQDQFH� 6XUYH\� &URZQ� FRS\ULJKW� PDWHULDO�� ,W� ZDV� SURGXFHG� ZLWKRXW� WKH�SHUPLVVLRQ�RI�2UGQDQFH�6XUYH\�DQG�WKXV�LW�LQIULQJHV�2UGQDQFH�6XUYH\V�&URZQ�FRS\ULJKW¶�16
The British Cartographic Society queried this at the time,17 but the matter was not pursued. The OS confirmed in 2005 that this remains their position.18
American dealers advertise the Soviet maps of Britain as ‘open source mapping’19 or use the words ‘where all other maps are copyrighted’.20
15 Information from Aleksander Lesment at Eastnor.16 See ZZZ�FDUWRJUDSK\�RUJ�XN�3DJHV�*URXSV�'HVLJQ*�&RS\ULW��KWPOfor OS statement.17 BCS response is at ZZZ�FDUWRJUDSK\�RUJ�XN�3DJHV�*URXSV�'HVLJQ*�$UFKB��KWPO.18 Letter to author, 14 January 2005.19 East View Cartographic, ZZZ�FDUWRJUDSKLF�FRP.20 Omni Resources, ZZZ�RPQLPDS�FRP.

31
:KHUH�FDQ�\RX�VHH�WKHP"The British Library Map Library, Cambridge University Library Map Department and the Bodleian Library Map Room in Oxford all have examples of British and foreign maps and town plans. For all three libraries a reader’s ticket is required to gain admission.21 A summary of their holdings is appended.22
Several dealers offer these maps on their websites,23 some as paper sheets but mainly in raster form. Most offer only complete sets of the smaller scale maps of whole countries at prices of several thousands of dollars. At least three map shops in former eastern Europe offer the maps: TopKart in Warsaw, Eastnor in Tallinn and Jana Seta in Riga.24 The latter has stocks of paper sheets, including UK town plans, for sale at €2 each.
+RZ�ZHUH�WKH�PDSV�SURGXFHG"The establishment responsible for Soviet mapping was =M=D (GUGK, Chief Administration of Geodesy and Cartography). This vast organisation controlled map production factories throughout USSR producing military, topographic, economic and civil mapping.
Military mapping was produced by staff with very high security clearance at dedicated military cartographic printing factories including Moscow, Kiev, Tashkent, Leningrad, Irkutsk and Khabarovsk. The source material gathered by espionage or agents was collected in Moscow, where (usually) the maps were drawn and the printing plates created. Seven copies of the printing plates were distributed for security.
Although some factories did appear to concentrate on particular regions, it is probable that printing was undertaken at whichever factory had capacity at the time. The print runs were huge and the printed maps were distributed and stored at depots throughout the USSR (one in each of the 25 military regions). The depot for Kaliningrad, which included the entire Baltic region, was in C�sis in Latvia. On occasions when capacity problems occurred, print production was carried out at the civil =M=D plants, one of which (factory number 5) was in Riga in Latvia. As a matter of policy, a factory did not print maps of its own locality.
Civil maps produced by =M=D for public use were drastically simplified and poorly pro-duced on cheap paper. Surviving examples can be bought for a few pence in the Jana Seta shop.
&RQFOXVLRQThe Soviet military mapping project was evidently an enormously expensive and well controlled operation and it achieved spectacular results. Ultimately, futile, of course, if the purpose was world domination, but leaving a fascinating legacy for enthusiasts. 7KH�DXWKRU�LV�GHHSO\�LQGHEWHG�WR�WKH�IROORZLQJ�IRU�YDOXDEOH�DGYLFH�DQG�LQIRUPDWLRQ��IRU�ZKLFK�KH� LV� YHU\� JUDWHIXO�� 'DYLG� :DWW� DQG� VWDII� DW� '*,$�� 'DYLG� $UFKHU�� $SULO� &DUOXFFL� RI� 7KH�%ULWLVK� /LEUDU\�� $QQH� 7D\ORU� RI� &DPEULGJH� 8QLYHUVLW\� /LEUDU\�� $OHNVDQGHU� /HVPHQW� RI�(DVWQRU�/WG��7DOOLQQ��$LYDUV�%HOGDYV�RI�-DQD�6HWD�0DS�6KRS� 5LJD�DQG�-�QLV�7XUODMV�RI�-DQD�6HWD�0DS�3XEOLVKHUV��5LJD�21 BL: ZZZ�EO�XN�FROOHFWLRQV�PDSV�KWPO, CUL: ZZZ�OLE�FDP�DF�XN�PDSV�+RPH�KWP,
Bodleian Library: ZZZ�ERGOH\�R[�DF�XN�JXLGHV�PDSV�.22 Each of the three libraries holds all the known British 1:50,000 sheets as well as the town plans noted in the appendix.
BL and CUL both have complete coverage of UK at the four smaller scales. All three also have a collection of foreign maps and town plans.
23 As well as East View Cartographic and Omni Resources, see ZZZ�JHRSXEV�FR�XN and ZZZ�IRXURQH�FRP�24 For TopKart see ZZZ�WRSNDUW�FRP�SO; for Eastnor, contact Aleksander Lesment on ODK#KRW�HH; for Jana Seta ZZZ�NDUWHV�OY�HQJ�����BQHZV�SKS or contact Aivars Beldavs on DLYDUVE#NDUWHV�OY.

32
1RUWK�ZHVWHUQ�FRUQHU�RI�����PLOOLRQ�VKHHW�0���DW����1���:���7KLV�LV�GDWHG������DQG�LV�SULQWHG�LQ�WKUHH�FRORXUV�ZLWK�RUQDWH VFULSW�IRU�PDULQH�IHDWXUHV�DQG�QDPHV��7KH�PDS�ERXQGDU\�LV�QRW�SDUDOOHO�ZLWK�WKH�VKHHW�HGJHV�RQ�PDSV�RI�WKLV�VFDOH�GXH�WR�WKH�FXUYDWXUH�RI�WKH�HDUWK��$Q�XQGHUVHD�FDEOH�OLQNV�&UR\GH�ZLWK�/XQG\�,VODQG�DQG�D WUDQVDWODQWLF�FDEOH�UXQV�IURP�:HVWRQ�VXSHU�0DUH��7KH�VKLSSLQJ�URXWH�LV�ODEHOOHG�&RUN�%ULVWRO���&RXQW\�ERXQGDULHV�DUH�VKRZQ�

33
3DUW�RI����������SODQ�RI�6RXWKHQG�RQ�6HD��7KH�$����GXDO�FDUULDJHZD\�URDG�LV�QDPHG�DV�����DQG�(�����ZLWK�/RQGRQ�VKRZQ�DV���NP�GLVWDQW��6SRW�KHLJKW�RI������LV�VKRZQ�MXVW�QRUWK�RI� WKH�URXQGDERXW �DQG WKH�EXLOGLQJ�HDVW�RI�WKH�URXQGDERXW��FRORXUHG�SXUSOH�DQG�QXPEHUHG����LV�OLVWHG�LQ�WKH�NH\�DV�D�SROLFH�VWDWLRQ��-XVW�HDVW�RI�WKLV�DQG�QRUWK�RI�$����D�EOXH�DUURZ�LQGLFDWHV�VWUHDP�GLUHFWLRQ��&RQWRXUV�DUH�DW����P�LQWHUYDOV�DQG�WKH�JULG�VTXDUHV�DUH����P��/HJHQG�DORQJ�WKH�WRS�UHDGV�µ6\VWHP�&R�RUGLQDWHV�����¶��WKLV�UHIHUV�WR�WKH�3XONRYR������GDWXP�XVHG�DV�D�EDVH� IRU� WKH�*DXVV�.U�JHU�SURMHFWLRQ���%HORZ� WKDW� LV� µ*W��%ULWDLQ�(QJODQG�FRXQW\�(VVH[¶���$SSUR[������DFWXDO�VL]H��

34
3DUW�RI����������SODQ�RI�/RQGRQ��K?DJ?LGH LV�µ6HFUHW¶��$UURZV�LQ�VTXDUH���N LQGLFDWH�WKDW�WKH�ULYHU�IORZV�QRUWK�DQG�KDV�WLGDO�IORZ�IURP�WKH�QRUWK��6XEPDULQH�FRQWRXUV�DQG�ORZ�ZDWHU�PDUNLQJV�DUH�VKRZQ��$PRQJ�WKH�PDQ\� DQQRWDWHG� EXLOGLQJV� DUH�+RXVHV� RI� 3DUOLDPHQW� �SXUSOH� ������ %DWWHUVHD� SRZHU VWDWLRQ� �EODFN� ���� DQG�&KHOVHD�EDUUDFNV��JUHHQ�������7KH�0�V\PERO�E\�9LFWRULD�VWDWLRQ�LQGLFDWHV�PHWUR��WXEH��VWDWLRQ���$SSUR[������DFWXDO�VL]H��

35
3DUW� RI� 0�������$�� ��������� PDS� RI� HDVW� /RQGRQ� VKRZLQJ� WKH� VL[� FRORXU� SULQW� UHJLVWUDWLRQ� EORFNV�� � 7KH�UDLOZD\� VWDWLRQ� MXVW� EHORZ� WKH� QDPH�MAKL�OAF �:HVW�+DP�� DW� JULG� UHI�� ������� KDV� WKH� VWDWLRQ� EXLOGLQJV�SRVLWLRQHG� WR� WKH� QRUWK� VLGH� RI� WKH� OLQH�� 7KH� VWDU� V\PEROV� E\� WKH� ULYHU� DUH�QDYLJDWLRQ� OLJKWV�� �$SSUR[�� ����DFWXDO�VL]H��

36
3DUW�RI�0������������������PDS�RI�ZHVW�/RQGRQ�VKRZLQJ�SULQW�FRGH�=������I��� >��LQGLFDWLQJ��SURGXFWLRQ�LQ�)HE������DW�WKH�'XQD\HY�IDFWRU\��%HORZ�WKDW�LV�µ&RPSLOHG�IURP�PDS�VFDOH����������SXEOLVKHG�������XSGDWHG�IURP� PDS� VFDOH� ��������� SXEOLVKHG� �������¶�� 7KH� VSRW� KHLJKW� ���� RQ� WKH� JUHHQ� KLOO� EHORZ� WKH� QDPH�DJ2B>HG �&UR\GRQ��LV�LQ�ODUJH�W\SH�DV�LW�LV�DW�D�KLJKHVW�SRLQW�

37
3DUW�RI� WKH�GLDJUDP�WLWOHG�µ3ODQ�RI�VXEZD\�OLQHV¶�ZKLFK� LV� LQFOXGHG�DV�D� IROG �RXW�VKHHW��VL]H�DERXW���FP�E\���FP�LQ� WKH�JD]HWWHHU�ERRNOHW�SURYLGHG�DV�SDUW�RI� WKH����������/RQGRQ�SODQ��$Q� LQVHW� WDEOH� OLV WV� WKH�VWDWLRQ�QDPHV�ZKLFK�DSSHDU�KHUH�DV�QXPEHUV��7KLV�ZURQJO\�VKRZV�D�OLQH�FRQQHFWLQJ�$QJHO�DQG�%DUELFDQ�VWDWLRQV�

38
$SSHQGL[�± /LVW�RI�NQRZQ�WRZQ�SODQV7RZQ 6F <U 7RZQ 6F <UAberdeen 10 81 E F Harwich 10 64 FBarrow in Furness 10 75 F Hastings 10 76 FBedford 10 71 E F Havant 25 83 FBelfast 10 51 Huddersfield 10 84 E F RBelfast 10 64 E F Ipswich 10 84 E FBirmingham etc 25 77 E F Kilmarnock 10 58 E FBlackburn 10 74 E F Lancaster, Morecambe 10 83 FBlackpool 10 76 F Leeds 10 72 E FBlyth 10 71 E F Leicester 10 74 E FBournemouth & Poole 10 74 F Lincoln 10 89 FBournemouth & Poole 25 90 E F Liverpool 10 74 E FBradford 10 90 E F London 25 85 E FBrighton & Hove 10 90 E F Londonderry 10 81 FBristol 10 72 E F Luton 10 86 E FBurnley & Padiham 10 76 E F Manchester etc 25 75 E FCambridge 10 89 F R Newcastle upon Tyne 25 77 E FCardiff 10 82 F Newport (Gwent) 10 83 E FChatham etc 10 84 E F R Northampton 10 79 E FChester 10 73 E F R Nottingham 10 75 FColchester 10 75 E F Oxford 10 73 E F RCoventry 10 72 F Pembroke 10 50 FCoventry 10 84 Plymouth 10 81 FCrewe 10 57 F Portland 10 72 FDarlington 10 76 E F R Portsmouth, etc 10 88 FDewsbury, Batley, etc 10 83 E F R Preston 10 76 E FDoncaster & Bentley 10 76 E F R Rhondda 10 78Dover 10 74 E F R St Helens, Haydock,etc 10 84 E F RDublin 10 80 E F Sheffield, Rotherham 25 77 FDunfermline 10 79 E F R Southampton 10 86 FEdinburgh 10 83 E F R Southend-on-Sea 10 85 E F RExeter 10 82 E F R Sunderland 10 76 E F RGainsborough 10 75 E F R Swansea 10 76 E RGlasgow & Paisley 25 81 E F Swindon 10 88 E F RGloucester 10 89 F Teesside 10 75 E F RGt Yarmouth 10 72 E F R Thurrock, Gravesend 10 77 E F RGreenock 10 79 E F R Torbay 10 76 E RGrimsby 10 86 E F R Warrington 10 84 E F RGuildford 10 79 F Wigan 10 79 E F RHalifax & Sowerby Br 10 89 F Wolverhampton 10 50Hartlepool 10 78 E F R Wolverhampton 10 63 EHarwich 10 57 York 10 80 F6F: Scale 1:10,000 or 1:25,000. <U: Year of production as print code. E, F, R indicate holdings by The British Library, Cambridge University Library and Bodleian Library Oxford.This list has been compiled from various sources and verified as far as possible by visual inspection, but errors and omissions are likely.
$Q\�FRUUHFWLRQV�RU�DGGLWLRQDO�LQIRUPDWLRQ�IRU�LQFOXVLRQ�LQ�SDUW�WZR�ZRXOG�EH�YHU\�ZHOFRPH��3OHDVH�FRQWDFW�WKH�DXWKRU�RQ�[email protected]��

39
$ 9LNLQJ�VDJD3HWHU�:DUEXUWRQ
Among the Second War Revision dependent issues catalogued by Roger Hellyer are several items connected with Exercise Viking, 1949.1 These laconic listings totally neglect the human interest factor. This contribution is offered on the improbable premise that there is a demand for the situation to be remedied. If that is so, then I am your man. I remember it well, as somebody or other used to sing.
Exercise Viking was an Eastern Command production contrived at Command HQ at Hounslow barracks, not a notably oriental location but so much handier for Town than military outposts such as Colchester. The chief planner was Lt Col R. and his assistant was Maj. B. One of the bit players was conscript Private Warburton. The Major was rather a nice man, but a simple soul who assumed that conscripts would be enthusiastically committed to whatever military enterprise was in hand. The Colonel, a man of few words and no smiles, was immune to any such naivety. Uniquely in my experience, he pronounced the first syllable of ‘Warburton’ to rhyme with ‘car’ rather than ‘war’ and showed signs of relishing the resultant dissonance. I had a full share of the intolerance of youth, was opposed to peacetime conscription and made little attempt to conceal my disdain for military attitudes and practices. Like many others, I found limited consolation for the wasted months in the quiet appreciation of their ludicrous side.
If I had ever had to embellish my part in Viking for inclusion in a c.v., I suppose the job description would have been ‘confidential clerk’. Essentially I was charged with the clerical implementation of decisions affecting the maps and plans issued to the participants. The Colonel’s spacious office easily accommodated the long trestle table at which I carried out my secret duties. His desk was installed on a dais a reasonable distance away, the silence was rarely broken and, although the defacing of maps is an intrinsically reprehensible activity, the days passed comfortably enough. From time to time the Major and the Colonel would refine
1 Roger Hellyer, 2UGQDQFH� 6XUYH\� VPDOO�VFDOH� PDSV�� LQGH[HV� ���������, Kerry: David Archer, 1999, 35 and 141. Roger Hellyer and Richard Oliver, 0LOLWDU\� PDSV�� WKH� RQH�LQFK� VHULHV� RI� *UHDW� %ULWDLQ� DQG� ,UHODQG, London: The Charles Close Society, 2004, l69 (extract giving details of sheet content and marginalia shown above).
GSGS Misc.363 ([HUFLVH�9LNLQJ 27 by 18 miles2WR 1949 sheet 121. 900/12/49 1942 N P 5 C DGC 12WR 1949 sheet 121. 900/12/49 1942 N P 5 C DGC 22WR 1949 sheet 121. no code 1942 N P 5 C DGC 3Sheet 121, with three different overprints: 1. GSGS Misc.363/1 ��� &RUSV� 3ODQ� 2. GSGS Misc.363/2 ��&RUSV�3ODQ��3. GSGS Misc.363/3, untitled.
GSGS Misc.364 ([HUFLVH�9LNLQJ 27 by 18 miles2WR 1949 sheet 122. 900/12/49 - N P 5 C DGC 12WR 1949 sheet 122. 900/12/49 - N P 5 C DGC 2Sheet 122, with two recorded overprints: 1. GSGS Misc.364/1 ��� &RUSV� 3ODQ�� 2. GSGS Misc.364/2 ��&RUSV�3ODQ. Map colours are subdued, with an overprint in red and brown.

40
their tactical thinking. This usually involved my starting again with the arrows, symbolic labels and notations in various colours. I took all their changes of mind in good part.
Fortunately for all concerned, Exercise Viking was a paper operation designed to test the skills of staff officers quite untrammelled by the presence of the soldiery. The opposing forces were those of the invaders codenamed Redland – no surprise there – and the defenders, Greenland (slightly ambiguous?). Each was supplied with a different set of documents, which gave a dissident the opportunity to indulge in a little sabotage, a temptation resisted as the Colonel had his eye on me and was apt to sample check my output in an ungentlemanly way. The duplicating of narrative documents also fell to me. On these occasions I adjourned to a small, hot attic room which housed a temperamental machine to which, with luck, stencils could be attached. Everyone else was excluded while I was in occupation and my instructions were to lock myself in. The key was missing, confiscated by a staff sergeant who, quite illogically, resented the loss of my services. On one particularly hot, still day I opened the lower half of the casement window and was dreamily turning the handle of the machine when an unexpected breeze blew a score of finished sheets out into Eastern Command airspace. They floated gently down, bearing their secrets past the windows of the second, first and ground floors to land in an enclosed courtyard. Torn between delight and alarm, I hastened down, and, with an air of studied nonchalance, as a man picking up litter, managed to retrieve them all. Happily, it was the hour of the traditional Hounslow siesta and the hyperactive RSM in the facing office block was absorbed in the task of perfecting his innovative coloured card index system designed to record the declared religious affiliations by faith and sect of everyone on the strength. The snag, so my gleeful informant, a project assistant, told me was that there were more sects than available colours. I digress: enough evocative background colour.
One Friday afternoon the Colonel said that he had a ticket for Wimbledon and inquirers were to be told that he was seeing his dentist. In his absence, I was to abandon the trestle table and work at his desk. In mid-afternoon the door burst open to admit an expensively tweeded elderly man. I looked at him coolly; he had not knocked. He grew visibly choleric and shouted “Don’t stand there sitting up when I come into the room”. Analysing this statement, I thought it prudent to rise and to bury my novel under Viking material. “Where is Colonel R?” “He has a dental appointment.” “Bring me a full set of Viking papers.” Off he went, noisily, still steaming.
It will be seen from this verbatim account that the visitor had not introduced himself. This discourtesy left me in some difficulty as there were at least two generals on the premises and a wrong choice would endear me to neither. A cautious approach to General X’s aide de camp met with a friendly reception; I had been expected. Such adventures.
Exercise Viking, at which my presence was required, took place at the School of Infantry, Warminster. For those of us devoted to the maintenance of civilian values in all circumstances this was bad news, a fate worse than Aldershot. However, it was only for three nights. The driver had no idea of the route and was happy to leave me to navigate. There being several more or less legitimate ways of getting from Hounslow to Warminster, I was able to steer us through country that was new to me. The Colonel spoke only twice. The first words from the back seat were “Warburton, is this the right way to Warminster?” I noticed that he pronounced Warminster in orthodox fashion but did not comment. I had supposed that what the Army called an ablutions halt would be in order at some stage and that it should be possible to organise a stop somewhere of scenic or architectural interest. It did not happen.

41
When I discreetly indicated a public convenience as we drove slowly through a pretty village somewhat off the main traffic routes, the Colonel barked “Drive on” in his usual lapidary style.
At the School of Infantry I fell foul of the hazard that always faced members of the Intelligence Corps when separated from their own. We were not popular and we were easily spotted. It was not only our characteristically unmilitary demeanour or even the shoulder flashes that gave us away, it was the cap badge. Abroad, the flashes had to be removed ‘for security reasons’ but not the badge because without it, worn one and a half inches above the left eyebrow, a man was deemed naked. This badge was readily recognised and had a certain notoriety. It consisted of two distinct botanical specimens of different species which were interpreted by prejudiced critics as representing a pansy resting on its laurels. At Warminster the Quarter Master, having weighed me up and displaying obvious pleasure in the deed, allocated me to sleeping quarters a good five hundred yards distant, to which I was instructed to carry a mattress, two blankets and a pillow in addition to military impedimenta and personal baggage. When I suggested that two trips would be needed and that I should like to leave some items with him for a few minutes the request was refused on the spurious grounds that the stores were about to close.
At this point the tables were turned by a deus ex machina device or, as non-I Corps types would say, a stroke of luck. The General’s driver drew up in a very smart limousine with a small flag in place on the bonnet. He had unloaded his passenger and, to the QM’s chagrin, gave me a lift. A most enjoyable short ride it was. The resident infantrymen, instinctively playing safe, halted in their tracks and saluted. One gnarled warrior on a bicycle even took his hands from the bars, sat to attention and saluted. Relying on the brevity of my stay, I acknowledged them all with languid grace from the safety of the back seat. 6HUYLWXGH� HW�JUDQGHXU�PLOLWDULHV2 indeed. Thank you, PRQ�JpQpUDO. There was no opportunity to renew acquaintance with the great man himself as I was not invited to his combined briefing and pep talk on the eve of battle.
My modest contribution during Viking was to man a stand from which I dispensed documentation and supplementary material as the exercise progressed. The majority of the participants seemed rather subdued, possibly anxious about the effects of blunders on their career prospects. The minority, on the smug side of confident, were the umpires and assessors who decided who was dead, who taken prisoner, which units had been wiped out, which battalion HQs had been hit by artillery fire and so on. I never found out how many of the Redlanders and Greenlanders failed to notice that some units had been positioned in potential Charge of the Light Brigade situations.
The gradual reduction in the number of my customers appeared to be evenly divided between the Reds and the Greens, suggesting battlefield stalemate. Probably this would be considered a satisfactory outcome, reflecting equal levels of competence among those involved. The Colonel no doubt produced a full report analysing performance levels and distilling lessons for the future, but that is speculation for I was almost immediately posted abroad, there to perform duties of equal value to the nation and, sadly, we did not keep in touch. The General died a few years later, before the era of frank newspaper obituaries.
2 Alfred de Vigny (1835). Not many Privates know that. Readers will recognise another example of Intelligence Corps showing off.

42
*UDVVKROP�,VODQG�DQG 7KH�6PDOOV�RQ�1HZ�3RSXODU�VKHHW����

43
*UDVVKROP�,VODQG�DQG�7KH�6PDOOV��&DVVLQL�UHOLFV.�6�$QGUHZV
It is surprising that in 6KHHWOLQHV there has been no report on the unusual treatment given to the mapping of Grassholm Island and The Smalls on one-inch and quarter-inch maps. CCS publications are also silent.1 This article probes the evidence available on the maps and concludes that the Cassini projection of the islands in the one-inch Popular Edition became a rogue element in the New Popular Edition and Seventh Series. Treatment at the quarter-inch scale was also unorthodox.2QH�LQFK�PDSVThese islands, the westernmost fragments of Wales, and the shallow waters between them named Hats and Barrels, when they appear on maps at all, were often included as an inset. This was in order to permit the sheet lines to enclose the optimum extent of Welsh mainland. Therefore, at the one-inch scale, this area was inset on the Popular Edition sheet 99, 3HPEURNH�DQG�7HQE\, using the Cassini projection then in vogue.
In the New Popular Edition sheet 151, 3HPEURNH, there is a very similar inset for Grassholm Island and The Smalls. The New Popular being a Transverse Mercator projection with National Grid, the main body of the map was reworked from Cassini material in order to change the projection and be square with the sheet lines. This was also done with the other sheets of the series where Fifth Edition material was not available. However, for some reason the inset on this sheet was not squared up, so the grid lines were skewed, giving a strange effect unique on the sheets of the New Popular Edition (see illustration). The submarine contours were included in updated form with the exception of the ten fathom line around Grassholm Island, which, oddly, was omitted and never again shown at the one-inch scale.
When the Seventh Series was launched, these anachronisms were not corrected on sheet 151, 3HPEURNH, the skewed grid inset being retained. The Scottish Popular Edition latterly also had a skewed grid but that edition was phased out when the Seventh Series Scottish coverage was completed in 1961. Thus the skewed grid of Grassholm Island and The Smalls became a nostalgic relic of a bygone age. When sheets 138 and 151 were combined in 1965, the inset was reduced in scope and squared up to give just Grassholme Island (with a new spelling to mark the occasion.) The ten fathom contour was still omitted.
The National Grid is skewed in the insets of the New Popular and Seventh Series because, following the arrangement of the Popular inset, the longitude marks show that the orientation, though varying, is close to north-south. Readers will know that the National Grid is N-S only at 2�W. Because the National Grid is skewed, it is tempting to jump to the conclusion that the inset has retained Cassini projection. It is obviously important to differentiate between map projection and orientation on the paper; tilting the map does not, of course, change the projection. By the test of comparing the lengths of the northing lines and the easting lines, the New Popular inset grid cells are not squares; the northings are marginally shorter than the eastings, making them rectangles. This test is passed by the Seventh Series editions 4009 and A, making the cells of the grids squares. Therefore the New Popular inset is not quite Transverse Mercator and could be Cassini projection.
1 R Hellyer, 2UGQDQFH�6XUYH\�6PDOO�6FDOH�0DSV�� ,QGH[HV�����������, Kerry: David Archer, 1999, records insets but not their idiosyncrasies.
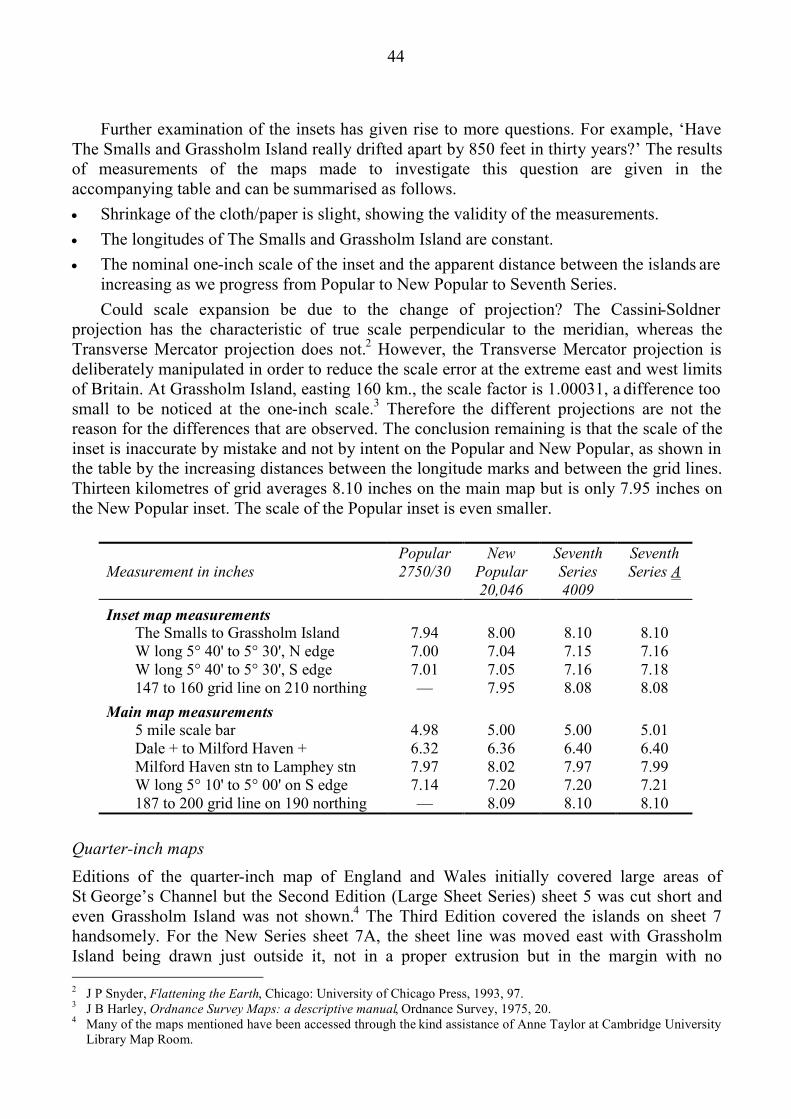
44
Further examination of the insets has given rise to more questions. For example, ‘Have The Smalls and Grassholm Island really drifted apart by 850 feet in thirty years?’ The results of measurements of the maps made to investigate this question are given in the accompanying table and can be summarised as follows.• Shrinkage of the cloth/paper is slight, showing the validity of the measurements.• The longitudes of The Smalls and Grassholm Island are constant.• The nominal one-inch scale of the inset and the apparent distance between the islands are
increasing as we progress from Popular to New Popular to Seventh Series.Could scale expansion be due to the change of projection? The Cassini-Soldner
projection has the characteristic of true scale perpendicular to the meridian, whereas the Transverse Mercator projection does not.2 However, the Transverse Mercator projection is deliberately manipulated in order to reduce the scale error at the extreme east and west limits of Britain. At Grassholm Island, easting 160 km., the scale factor is 1.00031, a difference too small to be noticed at the one-inch scale.3 Therefore the different projections are not the reason for the differences that are observed. The conclusion remaining is that the scale of the inset is inaccurate by mistake and not by intent on the Popular and New Popular, as shown in the table by the increasing distances between the longitude marks and between the grid lines. Thirteen kilometres of grid averages 8.10 inches on the main map but is only 7.95 inches on the New Popular inset. The scale of the Popular inset is even smaller.
0HDVXUHPHQW�LQ�LQFKHV3RSXODU��������
1HZ�3RSXODU�������
6HYHQWK�6HULHV�����
6HYHQWK�6HULHV�$
,QVHW�PDS�PHDVXUHPHQWVThe Smalls to Grassholm Island 7.94 8.00 8.10 8.10W long 5° 40' to 5° 30', N edge 7.00 7.04 7.15 7.16W long 5° 40' to 5° 30', S edge 7.01 7.05 7.16 7.18147 to 160 grid line on 210 northing — 7.95 8.08 8.08
0DLQ�PDS�PHDVXUHPHQWV5 mile scale bar 4.98 5.00 5.00 5.01Dale + to Milford Haven + 6.32 6.36 6.40 6.40Milford Haven stn to Lamphey stn 7.97 8.02 7.97 7.99W long 5° 10' to 5° 00' on S edge 7.14 7.20 7.20 7.21187 to 200 grid line on 190 northing — 8.09 8.10 8.10
4XDUWHU�LQFK�PDSVEditions of the quarter-inch map of England and Wales initially covered large areas of St George’s Channel but the Second Edition (Large Sheet Series) sheet 5 was cut short and even Grassholm Island was not shown.4 The Third Edition covered the islands on sheet 7 handsomely. For the New Series sheet 7A, the sheet line was moved east with Grassholm Island being drawn just outside it, not in a proper extrusion but in the margin with no
2 J P Snyder, )ODWWHQLQJ�WKH�(DUWK, Chicago: University of Chicago Press, 1993, 97.3 J B Harley, 2UGQDQFH�6XUYH\�0DSV��D�GHVFULSWLYH�PDQXDO, Ordnance Survey, 1975, 20.4 Many of the maps mentioned have been accessed through the kind assistance of Anne Taylor at Cambridge University
Library Map Room.

45
surrounding sea tint and with a blue submarine contour, ten fathoms. In the coloured edition with layers, the island’s submarine contour was repeated in brown, displaced slightly south of the blue one, but the outline edition eschewed this singularity.
*UDVVKROP�,VODQG�PDUJLQDOL]HG�RQ�)RXUWK�(GLWLRQ�TXDUWHU �LQFK�:DU�5HYLVLRQ�����
The Fourth Edition at quarter-inch scale with National Yard Grid, sheet 7, has the sheet line slightly further east, so Grassholm Island is even more marginalised but at least its submarine contour is only in blue (printing 2534; the printings in 1937 and 1939 omit its contour.) The Military Edition, War Revision 1940, GSGS 3957, also omits the contour (see illustration) and the later National Grid version of this map is the same.
The Fifth Edition, 1:250,000 sheet 12, 6RXWK�:DOHV, and the special sheet :DOHV�DQG�7KH�0DUFKHV has an inset for all the islands, squared up and fully contoured in blue. This demolishes the theory that freak currents had selectively scoured the seabed around Grassholm Island, a SULPD� IDFLH interpretation of the absence of the ten fathom contour on the New Popular and Seventh Series one-inch maps.
$�IHZ�KROP�WUXWKV�DERXW�VSHOOLQJOn one-inch maps prior to the publication of the Seventh Series combined sheet 138/151, the spelling used is ‘Grassholm Island’, as it is on all the quarter-inch maps noted above. The new spelling ‘Grassholme Island’ adopted on the Seventh Series from 1965 is ignored on the Fifth Edition 1:250,000 revision C of 1973. The 1:50,000 First Series was issued with ‘Grassholme Island’ on the map but ‘Grassholm Island’ on the cover (later corrected). The Landranger has reverted to ‘Grassholm Island’.
Since holm / holme means islet, the name ‘Grassholm Island’ would appear to be tautologous, a grammatical affliction that, mercifully, has not infected Flat Holm and Steep Holme in the Bristol Channel. Steep Holme, however, having survived intact until 1973, underwent typographical amputation on later revisions of the Fifth Edition 1:250,000 to ‘Steep Holm’. The 1:50,000 First Series and Landranger also have ‘Steep Holm’. The spelling of ‘Flat Holm’, as befits a geographical feature under the vigilant gaze of the 6KHHWOLQHV editor, has remained thoroughly consistent.

46
7HVWLQJ�WKH�HQKDQFHPHQW-RKQ�&ROH
In May 2004 the opportunity arose to compare for linear accuracy an overhauled 1:2500 map last revised in 1985, with the 2004 version produced in accordance with Ordnance Survey’s accuracy improvement policy announced in January 2001.
My qualification for undertaking such an examination was that I had been the 1985 reviser and, in spite of considerable effort before and during that revision, would have been the first to admit that the standard of the map, even if it met the overhaul accuracy criterion, left much to be desired. However I had saved the resulting plastic continuous revision document from destruction when the local office ceased to use such – as a souvenir, if nothing else.
Although enhancement is used in the title and was used by Ordnance Survey in 2001, the map concerned is in fact one of the original 2252 km2 comprising minor town and peri-urban (again the OS term) areas. These were programmed for resurvey to bring them to 1:1250 accuracy standards.
The new map is on a superior paper, smooth on the face; slightly roughened on the reverse. My initial action was to compare the grid of the plastic document concerned with others I hold and then with the 2004 map: a slight but not serious discrepancy was apparent overall. I lacked the means to test the National Grid re-positioning, but an overall comparison with the 1985 map indicated differences of between one and two metres which is very similar to ‘shifts’ observed between two 1:1250 upgrades and the original overhauled 1:2500.
Next came a rigorous comparison of the detail positions and note taken of discrepancies which could be easily checked by tape measure without needing to visit private property. These ranged from one to three and a half metres. At the same time various other aspects of map content were looked at, including certain things recalled from 1985 when neither the time nor opportunity facilitated improvement – an example being shapes of detail which dated from the 1906 revision.
Visits were made on two afternoons about a week apart, in the course of which about two thirds of the map was inspected and confidence very quickly built up in favour of the 2004 version. Every linear discrepancy proved the 1985 map wrong and indeed it was a case of the 2004 map scaling exactly, as far as it was possible for me to read a 1:2500 scale, to just under half a metre. In the older part of the town’s main street not only had poor shapes all been corrected but such items as bay windows abutting the right of way shown dimensionally correct. In my experience, if and when these were shown on the original 1:2500, they were usually exaggerated. It was also possible to inspect a certain amount of ‘back garden detail’ from the road or other vantage point. My expectation had been that there would be generalisation or mis-identification (on air photos). Not only did this prove unfounded but in one instance undersized (according to the rules as I understood them) detail had been accurately depicted.
Lest this should appear that I viewed the 2004 map through very rose-tinted spectacles certain problems did come to light. Two of these affecting digitising were of some importance, which led me to make a report to OS. One spelling error (correct on 1985 map) was noted whilst the detail errors perceived seemed relatively trivial and pointed to a minimum of ground validation.
47
7KH�WUHDWPHQW�RI�ZRUNV�SURMHFWHG�RU�LQ�SURJUHVV5�&�:KHHOHU
Ten years ago, John King asked whether the OS ever showed SURSRVHG constructions. A range of responses1 resulted: in particular, Roger Hellyer noted the inclusion of railways in the first half of the nineteenth century on the basis of Parliamentary sanction, while I remarked on the almost pedantic manner in which the works of the London extension of the Great Central Railway were excluded from the Revised New Series sheets 156 and 170.
I have recently encountered three pieces of evidence from around 1820 that seem to throw some light on how the OS viewed the matter. The first is the 0XGJH�&LUFXODU of 1816, whose prohibition on the use of privately-produced local surveys is well known, but whose exception clause has not received the notice it justifies. The prohibition reads:
Sixthly ... Nor are local surveys of any kind to be had recourse to except for the insertion of alterations and improvements whilst in progress.2
The implication is clearly that works in hand ZHUH to be inserted and on the basis of ‘local surveys’, which in this context can only mean the plans of the responsible engineer or surveyor.
Colby clarified the position in a letter to Charles Budgen of 10 August 1820, ‘Respecting the insertion of Alterations which are now making in the Country’:3
If the alterations making in your present district are according to regular plans, which are likely to be acted upon with Steadiness and without vacillation or the introduction of Whimsical alterations in their progress, you had better insert them from those plans in your work.
The district in question was the fenland north of Boston and Sir Joseph Banks was involved in some way in most of the improvements. It would be a brave surveyor who accused the President of the Royal Society of doing anything whatsoever in a whimsical manner, so Budgen was effectively being instructed to include all drainage improvements that had been commenced on the basis of their published plans.
Nor was the ruling limited to drainage improvements. The hill sketches for sheet 70 include a number of corrections: one is for a covert near Temple Bruer that had been added since the initial survey. In the margin it is noted that a further extension to the covert is planned and direction is given that this planned extension had better be shown too. The covert was on the estate of Charles Chaplin, who virtually ran Kesteven at the time and again was not a man to be accused lightly of whimsical conduct or vacillation. Note that in this case the plans concerned will have been neither published nor deposited with the Clerk of the Peace.
The inclusion of railways, once sanctioned, on the basis of deposited plans, is entirely consistent with these instructions. I suggest that what altered the policy was the change to the six-inch scale when survey re-started in Lancashire and Yorkshire. Plans which would enable a railway (for example) to be shown with tolerable accuracy at the one-inch scale would be inadequate at the larger scale. Indeed, for railways the plans specifically included limits
1 6KHHWOLQHV 39, 44-45.2 PRO OS 3/260 (Ordnance Survey Letter Book (OSLB)) p226. The quotation of this in the essays with the Margary
reproductions reads VLWXDWLRQ for LQVHUWLRQ. The hand is not entirely clear but does not support the former reading.3 OSLB p99.

48
within which deviation was permissible so predicting how a line would fit into the pattern of field boundaries was utterly impossible.
A change to the rules governing new surveys does not necessarily imply a change to the rules for revision at the one-inch scale. So perhaps John King’s original question should be refined as: ‘What is the latest date at which railway revision appeared on the one-inch map on the basis of plans alone?’
$�PDS�LQ�P\�FROOHFWLRQ��IROORZLQJ�$ODQ�WR�/RRH-RKQ�&ROH
I admit to a hefty collection of Godfrey Edition maps widespread over England, Ireland, Scotland and Wales. Certain cities are extremely well covered, all the major ones plus central London, and certain areas such as the Black Country. So the map chosen, the 1907 second edition of 1:2500 scale Cornwall LIII.2 depicting the twin ‘towns’ of East and West Looe as they were at the time of the 1905 revision, may not figure in a ‘top ten’ – about three quarters being fields and sea, but it does have the following in its favour: it is the only Godfrey Edition I have actually taken with me on a visit. Alan himself has written the notes (so much for his claim that colleagues send him to the back streets of industrial towns!1) and the location itself has been a firm favourite of mine since childhood.
I’m certainly a little biased if Alan has written the notes himself. He did the honours on the very first map I obtained, that for Hanley. So, whether it be the former smoke and grime of the Potteries or the delights of the Cornish coast, his style makes any map come alive and even in Looe’s case, where I was reasonably well informed, there was, as usual, a lot to learn from the Godfrey Edition history.
Although I did not revise either East or West Looe, I attended to much of the surrounding area: Portlooe and the Trenant Wood area (NW area of Godfrey Edition) in 1968; Looe Island and eastern half of the Godfrey Edition in 1971. But my very first visits would have been in the late 1940s as a passenger in an uncle’s Morris Eight. In 1950 came my first, and what is still my favourite, approach by railway – one of Cornwall’s still surviving (if precariously) branch lines. Geographically Looe has not been easy to reach from the Plymouth direction. The main roads are not exactly ‘fast’ and until 1961 necessitated a ferry crossing, whilst railway meant a change of train (and even station, albeit a short walk) at Liskeard. The 1939-45 war put paid to an intended more direct line which would have included two viaducts and three tunnels, and a less convenient station on the high ground at East Looe.
My modern approach is from the west and roadwise this again is hardly straightforward. Possibly I make it harder still by using miles of twisting, narrow country lanes between Lostwithiel and West Looe. But summer visitors seem to like that, so it was something of an afterthought that I shoved the Godfrey Edition in with my swimming kit on such a visit last summer.
Visiting vehicles are rightly not encouraged south of East Looe Bridge. There is restricted parking on Buller Quay but alas no sign of the railway sidings where once cargoes
1 Alan Godfrey Newsletter, November 2001.

49
of stone from the Cheesewring on Bodmin Moor were loaded into windjammers. However little of the building detail has altered dramatically and I was reminded of the accuracy of the 1905 map being praised by the 1968 reviser. On his version the names do appear in the narrow streets: the sole advantage (apart from house names and numbers, of which few could be included) over the Godfrey Edition.
Whilst the womenfolk secured our obligatory lunchtime pasties, my old school friend and myself had opportunity for a fairly heated discussion over the value of the bench mark on the Guildhall. He likes to take issue with me over most things OS – a throwback to a 1950s holiday when I navigated him over highly unsuitable Devonshire lanes with the aid of the New Popular.
Tempted by warm sunshine to spend much of the afternoon on the beach or in the sea, there was not time to examine the older part of West Looe but I made sure we returned that way taking the long, steep, cottage lined street to Portlooe.
The 1968 and subsequent revisions, not least the low tide line, were greatly assisted by air photography. Not so the original 1881 survey, or the 1905 revision, and one cannot but marvel, as is the case with all Godfrey reprints, at the work effort in production. The added value that Alan brings to these maps is well worthy of the original.
3RHWLF�OLFHQFH5LFKDUG�7�3RUWHU
‘Nimble spirits may, of course, entertain themselves as pleasantly with Mercator’s Projection as with an Ordnance Survey imprint of six inches to the mile, in which one’s neighbouring haystack and brook make as fair a show as Baghdad and the Amazon’, wrote Walter de la Mare.1
In a revised and expanded version (not used for the 1953 reprint) he enlarged his scale and modified his topography: ‘… an Ordnance Survey imprint of twenty inches to the mile, in which one’s neighbour’s haystacks and duckpond make as fair a show …’.2
While OS has occasionally shown some non-permanent detail, such as fences around an archaeological excavation,3 where they replaced established features but were never intended to ‘remain in position for at least 10 years’,4 the only circumstance that occurs to me where a haystack might inadvertently appear on a printed map is on a photomap, where incomplete field checking might cause it to appear as a hut or shed. And a scale of 20 inches to 1 mile or 1 inch to 4 chains (1:3168) is more for estate maps, or even town plans,5 than for ‘Ordnance Survey imprints’, I fancy?
1 Leading article: ‘Maps in fact and fiction’, 7LPHV�/LWHUDU\�6XSSOHPHQW, ��� (30 July 1914), 361-2. Reprinted with a few minor differences in Walter de la Mare, 3ULYDWH�9LHZ, London: Faber and Faber, 1953, 59-66.
2 ‘Maps actual and imaginary’ in Walter de la Mare, 3OHDVXUHV�DQG�VSHFXODWLRQV, London: Faber and Faber, 1940, 335-347.
3 For example at SE 8582 6417 and 8584 6425 on Ordnance Survey National Grid plans, scale 1:2500, Plan SE 8464-8564, revised July 1976, Edition A, 1977.
4 2UGQDQFH� 6XUYH\� 7HFKQLFDO� 0DQXDO� PRGXOH� �, Surveyors Instructions, section A, 1:1250 and 1:2500 scale maps: paragraphs 1009, 1014 (Amendment No. 12, March 1989).
5 e.g. Lincoln by J S Padley; cf. 6KHHWOLQHV���, 3.

50
1HZ�RQH�LQFK�VHULHV�'DYLG�$UFKHU
Sometimes, a contemporary review captures perfectly how future generations are to view a map or book. The following unidentified newspaper cutting, from the autumn of 1931, which was discovered by John Coombes, sets the scene for the birth of a new map series, and reflects the feelings of most subsequent users.
Similar in tone to an earlier, 1922 review of tourist maps (6KHHWOLQHV���, 63), statements in the first paragraph are echoed seventy years later in David Kimber’s review of ([SORUHU���� (6KHHWOLQHV���, 36). The OS has usually pleased the public despite, it appears, constant handicaps.
ORDNANCE SURVEY MAPS
NEW ONE-INCH SERIESFROM A CORRESPONDENT
The One-Inch series of the Ordnance Survey has always ranked as the finest set of topographical maps made. Few people have found reason to criticize either the accuracy or the style of production of these sheets. For various reasons, however, the revision has been somewhat irregular and behindhand. Reductions of the staff at Southampton, and the general disorgan-ization in the work caused by the War, necessitated the adoption of stopgap measures for some years. But at last it has been possible to start afresh. The formal designation of the new series is the Fifth (Relief) Edition, and the first sheet is 144, Plymouth District. Sheet by sheet, at the rate of about 10 a year, it will replace the Popular Edition, now so familiar to a nation of map-users.
The Plymouth sheet, covering part of Dartmoor as well as the Sound, displays exceptionally well the beauties of the new edition. The first glance over it can give nothing but pleasure. The map lies com-fortably on the paper, properly placed above the centre of the sheet and surrounded by an ample margin. The lettering about the sheet, the “boxes” for
the legend, and the key map for adjacent sheets all form part of a composed whole. The representation of the topography recalls much earlier styles of mapping. In the recent Popular Edition contours alone were used to represent hill-features; a. thoroughly practised map-reader, it is true, requires no more. But in the new style a combination of hachuring, hill-shading, and contours has been employed to give an impression of relief that can be immediately grasped by the most un-practised beginner. A light-ochre tint covers the whole land-area of the sheet. A light-brown hachuring shades the north-west slopes, a darker shade is used for the hachures of the south-east slopes. The blend of colours is very delicate, and the suggestion of shape most pleasing. The exquisitely drawn hachurings from the old engraved copper plates have thus been found to be still useful. The contours, which are also printed in a brown, have, however, been re-drawn.
On such maps as these roads must be artificially stressed; the broadest road would only be represented as a very thin line if this were not so. But to-day’s problem of satisfying a critical public’s demands for the representation of the exact class of road is difficult to settle without upsetting the balance of the sheet. Fortunately, it has been found possible to
51
dispense with the former vermilion stripe on first-class roads. The principal and secondary roads make up a network that is at once grasped by the eye; the Ministry of Transport classification numbers are written alongside the roads where they are applicable.
It is not to cartographical improve-ments alone, however, that the new map owes its efficiency and pleasing appearance. The lettering and presentation have been much revised, and care taken over the arrangement of headings and references, which now stand out in good black Roman lettering. New methods of direct reproduction have made it possible to design a completely new calligraphic alphabet. By the time the old alphabet had been transferred from the original copper to a helio-zinc plate, it was very often only with difficulty legible. It argues much for the new alphabet that it is very much more
legible even against a background of coloured detail than was the old lettering on the white sheet. The new alphabet depends for its form upon the natural strokes of the pen; it is beautiful because of its suitability to this medium.
Two well-chosen alphabets, Roman and italic, varied only by a light-face type used occasionally for indicating districts, provide all the necessary topographical differentiation. The familiar Gothic is retained for the sites of certain types of antiquities. The Roman lettering is based on the classic Trajan alphabet; the italic, a pure pen form, is clear even in its smallest sizes. Numerals are written in “old style”, pleasing and readable, though the fineness of the upper stroke of the 6 might lead to confusion with the zero. But this is a trifling flaw in a fine piece of work which sets a new standard of excellence in Ordnance Survey map-making.
5HYLHZV7KH�7UDIDOJDU�:D\, Southampton: Ordnance Survey, 2005. ISBN 0-319-29034-4, £6.25This is a commemorative map of the 1805 post-chaise journey from Falmouth to London by Lieutenant John Richards Lapenotiere when he returned from Trafalgar with the news of thenaval victory over the French and of the death of Lord Horatio Nelson. The cover of the map is in the current OS style, with a blue panel top left, and a large portrait of Nelson. At the bottom is a grey panel with the logos of The National Trust and The New Trafalgar Trust.
The map inside is single sided. The main feature is a 1:330,000 scale map showing the area from the West Country to London. The background of the map is a pale yellow and shows relief, with features such as roads in white, and settlements in pale grey. Marked on the map are two routes. The first, in red, shows the route that Nelson took from his home in Merton on 13 September 1805 to get to Portsmouth and HMS Victory upon hearing the news that the French and Spanish fleet was at Cadiz. The other route is marked in red, and is that taken from Falmouth to the Admiralty in London by Lieutenant Lapenotiere on his return from battle. He brought news of the great victory, and of Nelson’s tragic death. Also on the map are the locations and names of several National Trust properties which have links with various parts of the story of Nelson, Trafalgar and Lapenotiere. Around the map are boxes with excellent sketches of the properties and a brief description of their link to the story. Also

52
around the map are extensive notes telling the story of the battle and the Lapenotiere journey and several large-scale plans (which appear to be based on modern 1:10,000 mapping) showing the route Lapenotiere took through Falmouth, Exeter, Salisbury, Basingstoke and London, and an even larger scale map showing Nelson’s route through Portsmouth. There is also a map showing the route that Lapenotiere’s ship, HMS Pickle, took from Trafalgar to Falmouth. Along the bottom of the map is a chronology of Nelson’s life and times, and brief biographies of Vice Admiral Collingwood and Lapenotiere.
I particularly liked the degree of detail, for instance the exact route is indicated despite the fact that the base map is modern. This is a very well produced publication with animpressive amount of interesting detail.
-RQ�5LVE\
0LOLWDU\� PDSV� ± WKH� RQH�LQFK� VHULHV� RI� *UHDW� %ULWDLQ� DQG� ,UHODQG, by Roger Hellyer and Richard Oliver, London: The Charles Close Society, 2004. ISBN 1-870-59822-9, hardback, 294 + x pages, 16 colour plates, £30. Price to members: £22.50.We confront the history of twentieth century one-inch military mapping with several crucial questions, among them the following: what was a military map considered to be, and was it for administration, training or war? What (if any) was the consultation process and how was a specification arrived at? Why, when there was an excellent new (Third Edition) contoured one-inch large-sheet map of the UK, did most training in the decade before 1914 utilise the half-inch map? The answer to this last at least can be found in two words: South Africa. Michael Glover stated: ‘The lessons learned in South Africa bore little relation to war in Europe. The phenomenon of a small but highly-mobile force manoeuvring at will in a vast area was not to be seen again until the desert campaigns of 1940-3.’1 Prior to 1914, the British Army was, as usual, preparing with insufficient funding for the last war, not the next. In the nineteenth and twentieth centuries, and even today, the British Army is not sure whether it has to prepare for colonial policing, ‘bushfire’ wars or for a huge campaign on the continent of Europe (or elsewhere?).
The half-inch map, the crude improvised solution to a specific imperial problem, had proved adequate for mobile operations on the veldt, but the ominous portents of the Russo-Japanese and Balkan wars had shown that a rather different type of operations was likely to arise from the encounter of mass armies, equipped with aircraft and modern light and heavy weapons, in the western European theatre. Luckily wise men at the War Office had perceived the pressing need for larger scale maps appropriate for modern warfare. Six-inch contoured maps of the Thames Valley had been prepared for manoeuvres, and the prototype of the modern 1:25,000 artillery map, the contoured and squared 2½-inch map of East Anglia (later GSGS 3036), in the immediate pre-war period. By 1914, experiments were being made with square-reference systems but not with a grid (the French were already using a theatre grid, extending across sheet lines); the grid proper would not be adopted by the BEF in France until the end of 1918.
1 :DUIDUH�IURP�:DWHUORR�WR�0RQV, Cassell, 1980.

53
The Royal Garrison Artillery had for years recognised that for the fixed and mobile defences of fortresses, naval bases and ports, large-scale squared or gridded contoured plans and maps were crucial. The Royal Field Artillery were also, in the years prior to 1914, increasingly coming to believe that large-scale maps were necessary for field guns and howitzers. The increasing range, mobility, rate-of-fire and accuracy of such weapons provided by advances in metallurgy, propellants, hydraulic buffer and recuperation systems, sighting and survey systems and air observation meant that indirect fire became the training norm before 1914 (a good lesson learned in South Africa was that artillery had to fire from defiladed positions to prevent the gunners from being shot down by rifle and machine-gun fire). Indirect fire worked best when an accurate, large-scale map was available. It followed that, as artillery was a crucial component of every infantry division, training for war should include the use of large-scale maps – for the artillery the artillery-chart (French FDQHYDV�GH�WLU, German %DWWHULHSODQ). It is worth noting that a simple version of this was being used by some British battery commanders prior to 1914.
It goes without saying that the Royal Engineers required large-scale plans for their fortification and defence works, and where these did not already exist, they made them themselves. It also goes without saying that the Royal Engineers were the backbone of the Ordnance Survey, and that the Geographical Section of the General Staff was largely staffed by them, with an admixture of officers of the Royal Artillery (and occasionally infantry). They knew what was needed, but had to face the economic reality that funds were usually not forthcoming. But enough has been said to make it clear that the half-inch map was not the only consideration in the pre-1914 period.
This long-awaited book opens with a most appropriate dedication ‘for Ian and Peter’, to whom many of us who have endeavoured to unravel the complexities of Military Survey and Ordnance Survey mapping owe an inestimable debt. Because of the understandable constraints of security classification, military mapping has had to remain the last closed book, but the march of time has pulled the ‘thirty-year rule’ along behind it, and has enabled a firm view to be formed of developments up to the end of one-inch mapping – well within the lifetimes and memories of most members. This reviewer, like many other members of the Charles Close Society, has used several of these military products within their originally designated context.
The balance of the book may be problematic, and it suffers from the lack of an introduction and an index. While it is hardly designed to attract the general reader, this was probably not a consideration in the minds of the authors, who seem to have envisaged it primarily as a cartobibliography. While only 54 of the 294 pages of the book comprise the main text (I would have liked this to be much more developed), and 31 pages contain illustrations, the remaining 210 or so pages are crammed with essential cartobibliographical notes and details of the minutest kind, which throw much light on military cartographic and organisational developments. Such cartobibliographies are absolutely vital research tools, but who are they for in a publication such as this? Are they for map curators and collectors, or for those conducting further research? Probably all of these, and it is to be hoped that the very fact of such a cartobibliography being published will bring to light much more material and enable new interpretations. It is to be hoped that, the fundamentals having beenestablished in this book, the story of the military one-inch (indeed general military mapping of the UK) will now be told, perhaps by the same authors, at greater length.

54
Some questions clearly need more research, and remain to be clarified. The reason for the changeover from half-inch to one-inch scale for the military map after the First World War is inadequately explained, and perhaps many of the archival records no longer exist. It certainly seems to have been delayed by the post-war economies of the Geddes Axe, and by the fact that stocks of the half-inch remained to be used up. Indeed the number of unanswered questions emphasises the importance of the preservation of military survey records (DGIA and National Archives please note). The half-inch was in fact a temporary aberration – a hangover from the Boer War – which the Great War killed off immediately as a tactical map.
The experience of the war made it clear that a map of at least one-inch scale (preferably 1:50,000 or 1:40,000) was required for movement and administration, and one at 1:25,000 or 1:20,000 for artillery. This conclusion was made very clear by Col. E M Jack (MI4) in 1920 in his introduction to 5HSRUW�RQ�VXUYH\�RQ�WKH�:HVWHUQ�)URQW (War Office, 1920), in which he stated: ‘For European warfare, while a map on 1/100,000 scale is sufficient for marching, a map on the scale of at least 1/50,000 is required for fighting.’ He also stated (p139): ‘Without large scale maps the accurate reproducing of points, the interchange of information between aircraft and artillery, and the measurement of reliable initial elements of fire are not possible. Without good large scale maps also, accurate map shooting, which is so essential to secrecy of operations and surprise attacks, is not possible.’ He went on to say of large scale maps that ‘the reasons which necessitate their use in stationary warfare apply with equal force to a war of movement,’ and that scales of c. 1:25,000 (and larger) were essential for position warfare.
The 1921 0DQXDO�RI�0DS�5HDGLQJ (p70) echoed Jack, stating that the 1:50,000 scale ‘is considered the smallest practicable for tactical purposes in modern European warfare.’ All inter-war experience reinforced these conclusions, and Jack’s forecasts proved to be absolutely true for the Second World War. These scales were the ones used by the BEF in 1939-40 and, indeed, by British forces for the rest of the Second World War. Small-scale maps were required, of course, for rapidly moving armoured forces and for the RAF. The Popular and Fifth Edition one-inch, and the 1:20,000 series GSGS 2748 (a 1914-18 product), all with the new kilometre grid which the war had proved essential, fulfilled most of these requirements. The one-inch was a good, general map which at a pinch could be used for artillery work when no larger-scale map was available. When war again broke out, and Britain was threatened with invasion in 1940-41, Home Forces trained and prepared to fight the invaders on the one-inch map, the ‘War Revisions’ which are well covered in the book. One of the users of the map, the gunner Shelford Bidwell, called it ‘excellent.’ MacLeod, realising that the whole country had also to be covered with a 1:25,000 artillery map, pressed ahead with reductions to this scale from the six-inch. The war period is perhaps the most fascinating (at least to this reader) in the book.
Some of the authors’ interpretations need to be re-examined. Surely it is wrong to say that the importance of the orthomorphic projection was not understood in 1918. Jack, Winterbotham, Close, MacLeod and other military surveyors perfectly understood its value to surveyors and for artillery work, and were very aware that the French had adopted the Lambert grid in 1915 for precisely the reason that it eliminated angular distortions, thus enabling the use of a true theatre grid for calculating artillery firing data. The Germans introduced the Gauss Conformal projection (essentially the Transverse Mercator) at the end of the First World War for the same reason. The War Office presumably persisted with the Cassini grid on the existing map on the Cassini projection because within the east-west

55
parameters of the UK the distortions were considered acceptable, given the great cost at that stage of converting to an orthomorphic projection. This could not have been done with the fourth, Popular edition, which was based on existing ‘New Series’ copper plates. It would have to wait for a completely new edition, with all values recomputed on the new projection.
The British Western Front nonsense of a yard squaring system on a metric map was perpetuated in reverse by MacLeod (MI4) and Winterbotham (DGOS) in the 1930s, when the metric WO Cassini Grid was used on the newly introduced fifth edition orthomorphic (Gauss Conformal/Transverse Mercator) one-inch map. This resulted in an excellent orthomorphic map, the civil edition of which bore Winterbotham’s (orthomorphic) yard grid (which the military did not use) and the military edition of which carried the non-orthomorphic Cassini grid. Clearly heads needed to be banged together. It was not until 1947 that the introduction of the National Grid (Military System) on the New Popular Military Edition ended this anachronism.
The various appendices to the book are of particular value, providing a crucial framework for the understanding of military mapping development. Not least, the Chronology 1905 - 1985 is a vital timeline which gives important information about many aspects of military mapping policy and organisation, as does the Organisational chronology on the last page.
A few niggles concerning the glossary. This reviewer’s (limited) military education led him to believe that TEWTs were ‘Tactical Exercises Without Troops’, that PTAs were ‘Permanent Training Areas’ and that BAOR was ‘British Army on the Rhine’, but he stands to be corrected on all these points. Last, and very much least, the publisher of my $UWLOOHU\¶V�$VWURORJHUV is Mapbooks of Lewes (Sussex), not Lewis (off the west coast of Scotland). The Royal Navy made the same mistake when it awarded to the destroyer HMS Lewes the arms of the Isle of Lewis as the ship’s badge. You can check this over a pint of Harvey’s bitter by studying the badge and associated material in the Lewes Arms in Lewes (Sussex).
Readers can only be awed by the vast amount of painstaking work that has gone into this book. Roger Hellyer and Richard Oliver are to be congratulated on a most impressive achievement, which helps to complete the historical picture of UK mapping which they and other Charles Close Society members (not least ‘Ian and Peter’) have built up over the last few decades. Luckily there are those within DGIA who are aware of the need for such serious historical study, and who have been generous with their cooperation. In these disturbing days when public service has merely become a matter of ‘business units’, and corporate history and memory are discounted, such a view is enlightened indeed.
3HWHU�&KDVVHDXG3HWHU� &KDVVHDXG� LV� WKH� DXWKRU� RI� Topography of Armageddon ������� DQG� Artillery’s Astrologers – A History of British Survey and Mapping on the Western Front 1914-1918 ��������)RUWKFRPLQJ�ERRNV�DUH�RQ�*DOOLSROL��DQG�RQ�WUHQFK�QDPLQJ�LQ�WKH�)LUVW�:RUOG�:DU�
7KH�UDLOZD\V�RI�*UHDW�%ULWDLQ��D�KLVWRULFDO�DWODV, Colonel M H Cobb (Late RE) FRICS, MA.
This two-volume atlas was reviewed by Lionel Hooper in 6KHHWOLQHV��� and was the subject of a letter from David Milbank Challis in 6KHHWOLQHV���. The first printing has now sold out. A reprint is being prepared by Ian Allan, for which the price will increase to £120.

56
.HUU\�PXVLQJV'DYLG�$UFKHU
Many years ago, before Mr Wilson made New Year’s Day a bank holiday south of the border, our art master was forever complaining about car designers. They created wonderful, sleek, expensive models, which were delivered to local show rooms, where a cretin (his word, not mine) would randomly drill two holes front and rear and bolt a rectangular number plate on to the vehicle. He bore no malice towards the cretins, only towards the designers, who did not allow for the inevitable number plates in their design, and offended his eye tremendously.
Although cars now have little niches for the offending rectangle, designers in other areas appear to ignore similar inevitable occurrences. When bar codes were first introduced, the white rectangle and black bars design was just dumped onto a piece of attractive packaging, almost at random, obscuring part of the design, as if a square had been cut out. Over time, things have got a little better, in that most designers now leave a space for the bar code, making no attempt to incorporate it into their work. Alas, the Ordnance Survey follows the crowd with this. Even on the latest maps, the bar code is shunted into the corner of the back cover, and text is fitted around it. In fact, the rear covers appear not to have been considered by designers at all, with text and graphics placed anyhow. Turn the map over, and the front cover is wonderful. A brilliant design, based on rectangles and top class photographs, with a superb range of colours and shaded lettering. For the first time in over fifty years, the OS have a very strong and distinctive house style for map covers. Not since 1951, when maps such as the New Populars, ten-mile and quarter-inch had covers with wavy lines around the edge, has there been such a feeling of tidy togetherness in OS cover design. Compared to front covers of even ten years ago, they have advanced so far that it is unbelievable. But don’t mention the back.
Wondering what other map publishers do, I looked in our local Smith’s and found that the Philip’s range of maps and atlases have a neat house style whereby the bar code is surrounded by a box with the company name above and website address beneath it. Other useful information, such as the price and map series is around the outside of the box. The bar code is still there on a rectangular white background, and has been taken into the artwork, rather than the artwork being surprised by it, as on OS maps. A far superior design appears on the back of the 5RXJK�*XLGHV. This is as classy and satisfying as the front covers on current OS maps, and is again based on a rectangle divided into smaller rectangles, one containing the bar code, and the others having various bits of consumer detail tidied into them.
Another form of near vandalism that offends the eye is the prominent use of the symbols ®, © and ™ in both artwork and text. Like number plates, they are simply bolted on to the end of a word or grafted to the right of a logo that has probably cost a lot of money to ‘develop’. Just like cars of old. The Ordnance Survey is forever telling us that “Ordnance Survey, the OS symbol and Landranger are registered trademarks and OS is a trademark of Ordnance Survey, the national mapping…”. Not only telling us on the rear cover, it also welds the ® symbol onto its name. A series of symbols in the middle of a phrase is even worse, Dell™ recommends Microsoft® Windows® XP Professional, making it almost impossible to understand a sentence. Ugly beyond belief, even to those of us who are not art

57
masters. The Ordnance Survey doesn’t do this very often, you ask? ‘Fraid so. Look at the OS website and in addition to Ordnance Survey®, we find Get-A-Map™, Code-Point® Polygons, OSCAR Traffic-Manager®, Siteplan® Data, Boundary-Line™, Integrated Transport Network™ Layer, OS Street View™, and Haenen Topograffig OS MasterMap® yw’r data a ddangosir. Yes, they even vandalise in Welsh. The Crown Copyright Reserved statement is similar, but not so upsetting. It is the aggressive use of a symbol saying mine, mine, mine that irritates, especially when well known organisations do it. Surely the Ordnance Survey does not need to disfigure everything with Ordnance Survey®. Nobody is going to try passing themselves off as our beloved OS.
Not wishing to be thought restricted in my prejudices, I shall confess to my other pet hate in this vein, which is the even bigger lack of feeling for words, shown by the popularity for using one word when two would do fine. My biggest hate used to be ‘sweat shirt’ (the phrase, not the garment) which made me cringe and which I saw as being akin to smelly socks and bad breath. But worse has arrived. Look in the shops and these comfortable jumpers are now called sweats (I feel sick typing it), so I assume that current party talk includes “I like your sweat”, or “That’s Fred with the green sweat”. Pulls were once pullovers, whilst my Xmas pyjamas had a label saying “Matching gown available”, making me think of Harry Potter and French masters, not dressing gowns.
Having reduced its name from three to two words by dropping the definite article a few years ago, Survey wouldn’t partake in this name shortening silliness, would it? It certainly would. In the 2001 OS Trade Catalogue (the latest I have), we find products called 7RXULQJ�PDSV, 5RDG�PDSV and 5RXWHSODQQHU�PDSV. By 2004, these have received the wonderful new style front covers, but down the right side, all three series are called 7UDYHO�PDSV, and above this, the individual series are given as 7RXU, 5RDG and 5RXWH. When I first saw this, the words 7RXU and 5RDG caught my eye and I started steaming from the ears with this certification that the end of the world had arrived. But glancing at other map covers, I realised that I have accepted the single words ([SORUHU and /DQGUDQJHU to mean ([SORUHU�PDSV and /DQGUDQJHU�PDSV since they came out, with no irritation at all. So why object to 7RXU and 5RDG as if they were in the same category as sweats and pulls? Probably because these words seem meaningless in isolation. I cannot imagine anyone being understood if they say “Look on a 7RXU” or “Look on a 5RDG”, but I often say “Look on a /DQGUDQJHU”. Thus, besides being prejudiced, I am also inconsistent, or selectively prejudiced. I like to pick and choose what annoys me. And the thing that would probably annoy me most is if the OS were to shorten its name to either Ordnance or Survey or OS. Worse still, if it were to adopt an entirely new one, as did the Post Office for a short while, a couple of years ago. Memorable, wasn’t it?
&-+

58
/HWWHUV$HULDO�VHFUHWV
I was pleasantly surprised to see photographs of the former Hawker Aircraft factory at Langley, Berks. (née Bucks.) featured in Chris Broad’s extensive story behind the post-war air photo mosaics and the inevitable security problems. Apart from my interest in aviation and Hawker in particular, the history of the factory is a pet project of mine (my street is just off camera on the left). I already have an extensive range of vertical photographs (and maps) mostly obtained from the NMRC, Swindon, covering the area prior to the decision to develop the area to the present day, although the factory and airfield have since succumbed to the urban sprawl that is characteristic of the South East. As it is reasonable to assume that any potential enemy, real or imagined, would already know the existence of such developments (the Germans certainly knew) it is further assumed that the concern of the security services would be any changes that may reveal the latest military secrets. The problem I have with that thinking is that unless the military are careless it would be best to let things ride as any attempt to obscure a particular area would surely draw one’s attention to it and may cause a ‘third secretary’ from a foreign embassy to don his tourist guise and jump in his car and investigate further, providing he can shake off those tailing him!
To illustrate my point I need to explain that I have an obsession with aerial photographs, mostly those of aeroplanes that feature a landscape below that initially defies recognition; which then becomes a challenge I cannot resist no matter how long it takes! I have on many an occasion felt extremely pleased with myself, sometimes following hours pouring over 1:25,000 series maps, when I finally identify the location of many an obscure background, especially when there is a distinct lack of clues such as roads, rail-tracks, rivers and buildings. Other times, of course, it’s very easy, especially if one is familiar with the area –which returns me to the point. In early 1957 the Air Ministry released a series of photographs, albeit oblique, showing off the latest RAF equipment in the shape of the Mark 6 Hawker Hunter (most of which were, coincidently, assembled at their Langley factory), aerobatting over a mostly snow-covered landscape. Using personal knowledge of the subject and a familiarity with the topography it was obvious that they were taken near the east coast of Yorkshire not far from the squadron’s base at Linton-on-Ouse (or, possibly, Middleton St George where it moved to around that time).
Naturally my gaze settled on the landscape below that showed quite clearly the coastline stretching from an area south of Bridlington and taking in most of Flamborough Head. But what took me aback was the sight of fields and hedgerows in the foreground that appeared to have replaced Carnaby, the massive wartime diversion airfield that normally stood out like a sore thumb!1 Being a member of the Airfield Research Group I presented my findings to them but the only thing they could suggest was the knowledge that it was earmarked for use as a missile base. However, this answer lost some of its reasoning when another photo in the group showed RAF Station Catfoss, located a bit further south, proudly standing out against the snow that had also been considered for the same purpose!
1 Coincidently, during my National Service as an Airframe Fitter on Vampire two-seat jet trainers at RAF Driffield circa 1957 I cadged a flight with a visiting, temporarily desk-bound pilot, who flew towards Carnaby and he explained to me that to check the accuracy of a loop he would face the direction of the runway centreline, perform the manoeuvre and if the aircraft came out of it still lined up he had ‘passed the test’! Consequently, I can attest to the obvious and unmistakeable presence of Carnaby from the air at that time.

59
Now, if I noticed the disappearance of Carnaby surely the ‘third secretary’ would also, and prompt him to ‘look into it’. In other words the very omission drew my, and possibly his, attention to it which in turn may have created a suspicion that may not have occurred if the Air Ministry had only followed the dictum of ‘leaving well alone’. Surely the answer should have been to use experts, who were undoubtedly available, to ‘doctor’ any changes instead of altering or obscuring whole areas. By chance I found a 1948 Provisional Edition 1:25,000 Series map of the area which, as expected, still showed the area as it was pre-war. A close study of the map and the photograph shows that the person responsible was indeed an expertas he/she copied the original features on the photo so accurately as to be virtually undetectable to the naked eye – but why bother if one’s attention has already been drawn to the area by the omission of the airfield in the first place?
Of course, this can be explained by the ‘forger’s’ pride in his/her undoubted talent but it still does not address the question that remains: why tempt providence by publishing a doctored photograph in the first place when it could have been replaced by another of the many, surely, taken at the same time? Perhaps we will never know what went on in the minds of the Whitehall censors at that time.
-RKQ�.HQGULFN
7ZR�SLOODUV�RQ�D�UHVHUYRLUIn answer to Barbara Jones’s query,2 the pillar with the spider and the flush bracket is the proper trig point. The other pillar is a dummy erected by the OS at the request of the Water Authority to ‘balance it up’!
Someone thought it would look odd with just one pillar on one side so they requested another. It was cast in the same way but without a spider or a flush bracket so that it could not be confused with the real trig.
This is an example of how the OS always tried to accommodate the wishes of landowners, especially a large one like a water authority. Permission to erect a pillar had tobe obtained from the landowner in writing, usually on a pro-forma which explained the purpose of the retriangulation and included an illustration of what the pillar would look like. In most cases owners readily cooperated but there were a small number who raised objections or even refused to allow the pillar to be built. The final paragraph at the end of the pro-forma request added that the survey was authorised under the Ordnance Survey act of 1841 which carried penalties for non-compliance.
It is interesting to read the wording of the Act as published in 6KHHWOLQHV,3 where the Act authorises ‘ … fixing any Mark or Object to be used in the Survey, or any Post, Stone or Boundary Mark … and to dig up any Ground for the purpose’. The Act did not specify a four-foot high concrete pillar with a three-foot cube concrete base, but the original wording was considered sufficient. However if any landowner did raise objections, his wishes were accommodated as far as possible. The trig reconnaissance surveyor either had to move the site to an acceptable position or devise an alternative scheme. The OS never tested the Act by taking anyone to court. The possibility of losing in such a case would have been unthinkable.
3KLO�%URRPILHOG2 6KHHWOLQHV���, 60.3 6KHHWOLQHV���, 46.

60
%XW�IRU�WKH�JUDFH�RI�*RG�«Langdon Rowe’s harrowing account of Ordnance Survey work in the grounds of a mental hospital4 prompts me to add the following letters which appeared in an OS )LHOG�%XOOHWLQ of 1949.
September 19496XEMHFW��(UURUV�LQ�'HWDLO�6XUYH\
Sir,
I wish to express regret and admit responsibility for some errors in the detail survey of Detail Block ;;;;.
The block covers the ;�WRZQ Private Asylum where trouble was expected from time to time with the inmates, one instance being when my field book was stolen for a period of four days. The individual concerned, I discovered, had been a Colonial Surveyor.
I could not report the incident because I knew the book could never be recovered from a mental case who would fear punishment on admission of guilt. I therefore had to bribe another inmate with tobacco who eventually recovered the book for me.
During the loss I continued to chain lines and booked in notebook. Unfortunately I made some mistakes in transcribing figures, consequently the plotting of detail was out. It was my intention to go back over the ground and check points but I was sent off on detachment to <�WRZQ.
6XEMHFW��([FHVVLYH�ILQDOOLQJ�WLPHSir,
My finalling time on Km ;;;; has been questioned locally. I therefore submit my explanation.
The larger portion of the map is the house and grounds of ;�WRZQ Private Asylum which is not the best place to be in, from a work point of view. Both the Examiner and myself were being constantly hampered by the inmates, both in the grounds and courtyards of the building. Here are a few of the instances which happened during my visits as detail surveyor and finaller: my field content book was stolen, my metric chain was carved up by an inmate with a motor mower, my linen tape was torn in half, I had drill orders bellowed at me for an hour by an ex-ATS Commander. I was continually being shadowed about the grounds and shrubs. I have been threatened with violence on several occasions and generally delayed in the performance of my duties.
Taking everything into consideration I do not think that in this instance my time is excessive.
On first joining the Department I was in lodgings with an experienced surveyor who had just commenced work at such an establishment and I recall that he was in a state of deep depression at the end of the day during the time that he spent there. Some thirty years later I had occasion to do some revision at such an institution but, apart from conditions having apparently improved, my experience could in no way be compared with any of the preceding.
-RKQ�&ROH4 6KHHWOLQHV���, 44.

61
$�P\VWHU\�DWODVA couple of years ago I picked up in a second-hand bookshop two A4-sized street atlases whose origin, even though recent, remains elusive. Nicely printed and strongly bound in black covers, they bear no indication whatever of a publisher or date, being entitled simply &HQWUDO� /RQGRQ� $WODV� ������� and 6RXWK� (DVW� $UHD� $WODV� �������. The central London volume has 384 pages of maps covering a 48 × 48 km area bounded by Hemel Hempstead, Epping, Cobham and Sevenoaks; its companion with 390 pages extends this coverage out to Gillingham, Hawkhurst and Balcombe. The key maps in the endpapers indicate that there were similar volumes for the NW, NE and SW quadrants.
Two unusual features are that the page numbering for both volumes is based on an origin at page 2000, whose NW corner is at Horse Guards Parade; and that the mapping appears to have been computer-generated, since inspection reveals that all curves consist of a series of short straight lines. This leads to some curious results at complex road and railway junctions! Colour is used only for classified roads, ‘vegetation’ (woods and parks), ‘drainage’ (lakes and watercourses), and certain symbols, and there is no direct indication of built-up areas; their existence can be inferred only from the absence of ‘vegetation’ and the presence of symbols for schools, post offices, churches, police stations, ‘large buildings’ and ‘general buildings’ (the last two categories, strangely, are otherwise unidentified). There are further symbols for traffic-related features such as vehicular barriers, traffic lights, banned turns and one-way streets. However the M2 is rather quaintly labelled the ‘Medway Towns Motor Road’ and some surprising typographical errors appear, such as ‘Chistlehurst’ and ‘Brondsbury’.
The SW corner of each page quotes the corresponding OS grid reference (this being my excuse for raising the matter in 6KHHWOLQHV!) – thus page 2000 refers to TQ3077. Each 3 km × 2 km page is divided into � km squares, labelled with eastings and northings. No index to streets or places is included, but in the introductory notes to the &HQWUDO�/RQGRQ volume there is a reference to ‘the Gazetteer published with the previous 10K edition’. To use this, one needs to consult an ‘old/new atlas page conversion table’, showing that pages 1556 to 2389 (non-consecutive) correspond to pages 1 to 384 in the ‘old’ (consecutively-numbered) atlas. The example given is ‘Kelmscott Road 227 42 16 54 SW’. Using the conversion table, page 227 in the ‘old’ edition is seen to refer to page 2052 in the current one; ‘42 16’ is the grid reference on that page; and ‘54 SW’ refers to ‘the SW quadrant of Map 54 in the 20K volume’. In the 6RXWK� (DVW atlas, however, the example given is simply ‘Frythe Crescent 2779 54 18’, suggesting that a new edition of the gazetteer may have been produced and the 20K volume discontinued.
As well as the maps, the &HQWUDO� /RQGRQ volume (only) contains a selection of information such as is often found in London street atlases, e.g. lists of town halls, hospitals, theatres, embassies etc. British Rail and Underground maps, dating from about 1986, are also included.
The origin of these intriguing (and expensive) volumes seems likely to be governmental, but their somewhat basic style of mapping does not resemble anything published by OS. Given that they contain little if any information which could not have been readily obtained from commercially-produced street atlases, can any reader suggest which department would have produced them, and for what purpose?
*UDKDP�%LUG�

62
$�PRUH�SX]]OLQJ�WULJ�SRLQWJohn Andrews (6KHHWOLQHV� ��) asks about the trig point by the Little Ouse at a height of -1 metre, TL617898, and wonders whether the river water has an uphill struggle to get to the sea, or if the surveyors had problem seeing anything. While on a mountain bike holiday in the Fens last summer I visited the spot.
The trig point is at the foot of the bank. From the top of the bank there is a small drop to the surface of the river and a much bigger one, 20 or 30 feet, to the trig point. So the river is above minus one. In any case, the waters of the river have to pass Denver Sluice and possibly only flow out at low tide.
From the trig point you can see nothing but the bank and some treetops to the south and west, but to the north and east there is an extensive view across about 12 kilometres of flat fen to the highlands (all of 23 metres) around Stoke Ferry. On the evening of my visit it was like looking from my childhood home on the Isle of Wight across to the mainland, only further.
This part of the Fens feels very remote. The river is navigable, but I only saw one boat –on which the nude-sunbathing occupant hurriedly covered up as I appeared. The land is very fertile; the lush vegetation between the top of the bank and the pillar was chest high. The placenames, Brandon Bank, Little Ouse (both settlements) and Feltwell Anchor, do not sound like hamlets or tracts of country.
There is a bridge just upstream. The railings are falling off but the notice saying you use it at your own risk disappeared long ago and mapmakers cannot agree whether this is a through route or not. In fact, it is on the shortest road route from Norwich to Ely (via Feltwell and Poppylot Farm, 665924) and if one cycles to the Fens by that way, it is a happy objective to make it the first stop for a bite, and to sit with feet dangling over the side of the bridge, sun sparkling on the water, knowing the bulk of the miles have been done.
)HUJXV�0XLU�
/DQGUDQJHU�FRYHUVThis is an appeal to readers for additions and corrections to the work-in-progress copy of the /DQGUDQJHU covers list that I took to the last Midland group meeting. It is posted on the Internet at ZZZ�ZDWVRQOY�DGGU�FRP�P\BKRVWLQJ�ODQGUDQJHUBFRYHUV�KWP.
/H]�:DWVRQ
$XWKHQWLF�0DS�'LUHFWRULHV�Further to earlier correspondence on this subject in 6KHHWOLQHV���, �� and ��, I understand that the $XWKHQWLF� 0DS� 'LUHFWRU\� RI� /RQGRQ� DQG� 6XEXUEV (First Edition, 1924) is now available in CD format from JiGrah Resources, whose website is ZZZ�MLJUDK�FR�XN
*UDKDP�%LUG7KH�ZHEVLWH� DOVR� DGYHUWLVHV�The Authentic Map Directory of South West Yorkshire 1938��DQG�ROG�PDSV�RI�D�QXPEHU�RI�RWKHU 8.�FLWLHV�RQ�&'�DW�YHU\�UHDVRQDEOH�SULFHV��± &-+

63
1HZ�PDSV-RQ�5LVE\
This list covers small scale maps published between 17 November 2004 and 16 March 2005. They are listed by series, and in sheet number order. The columns are as follows: Sheet No. / Title / Edition / Copyright date / Full revision date / Latest revision date / Date of publication. There is also a list of those maps due for publication by OS (by series and in order of their proposed publication).
After the list of OS maps is a résumé of maps published by Alan Godfrey between November 2004 and March 2005.
26*%�PDSVNew editions noted 1 in column 6 are ‘Reprinted with minor change’New editions noted 2 in column 6 are ‘Revised with selected change’New editions noted 3 in column 6 are ‘Revised for significant change’New editions noted 4 in column 6 are ‘Major roads revised’Where details are shown in italics I have not been able to confirm the details by seeing the
map itself, and therefore information is based on Ordnance Survey’s list of new publications. I hope that I shall be able to confirm information in the next edition of 6KHHWOLQHV.Landranger – new editions
41 Ben Nevis, Fort William & Glen Coe D 2005 2001 20041 27/01/0570 Ayr, Kilmarnock & Troon B1 2004 ���� ���� 16/11/0493 Middlesbrough, Darlington & Hartlepool C2 2004 1999 20042 04/11/04
102 Preston, Blackpool & Lytham St Anne’s C2 2004 1998 20041 16/11/04112 Scunthorpe & Gainsborough C1 2005 1998 20041 26/01/05152 Northampton, Milton Keynes, Buckingham & Daventry D1 2004 1999 20041 06/01/05158 Tenby & Pembroke B1 2004 1998 20041 16/11/04173 Swindon, Devizes, Marlborough & Trowbridge D 2005 2001 20051 26/01/05178 Thames Estuary, Rochester & Southend-on-Sea D2 2004 2000 20041 09/12/04175 Reading & Windsor, Henley-on-Thames & Bracknell C1 2002 1999 20053 11/01/05179 Canterbury, East Kent, Dover & Margate D2 2004 2001 20042 25/11/04197 Chichester & The South Downs D 2005 2002 20041 10/01/05
The Landranger maps below were those whose details were listed in italics in 6KHHWOLQHV���. These details are now confirmed, with the exception of sheet 33, which remains unconfirmed.
33 Loch Alsh, Glen Shiel & Loch Hourn C1 2004 ���� 20041 26/08/0444 Ballater, Glen Cova C1 2004 2000 20041 20/10/0453 Blairgowrie & Forest of Alyth B1 2004 1998 20041 24/08/0459 St Andrews, Kirkaldy & Glenrothes C1 2004 2000 20041 28/07/0467 Duns, Dunbar & Eyemouth B2 2004 2000 20042 07/10/04
100 Malton, Pickering, Helmsley & Easingwold C2 2004 1996 20041 12/10/04104 Leeds, Bradford, Harrogate & Ilkley C2 2004 1997 20042 25/10/04128 Derby & Burton upon Trent D2 2004 2000 20042 28/10/04134 Norwich & The Broads, Great Yarmouth D 2004 2001 20041 13/09/04143 Ely, Wisbech & Downham Market D 2004 2000 20041 05/10/04153 Bedford, Huntingdon, St Neots & Biggleswade C2 2004 1998 20041 27/09/04

64
Explorer – new editions
These are all noted as ‘Revised with selected change 2004’ and show Access Land. No full revision date is given. They are published in the new style ([SORUHU cover.
OL15 Purbeck & South Dorset B1 2004 - 2004 29/11/04OL22 New Forest B1 2004 - 2004 29/11/04OL29 Isle of Wight B1 2004 - 2004 29/11/04
117 Cerne Abbas & Bere Regis B1 2004 - 2004 29/11/04118 Shaftesbury & Cranborne Chase A1 2004 - 2004 29/11/04119 Meon Valey, Portsmouth, Gosport & Fareham A1 2004 - 2004 29/11/04120 Chichester, South Harting & Selsey B1 2004 - 2004 29/11/04129 Yeovil & Sherborne B1 2004 - 2004 29/11/04130 Salisbury & Stonehenge A1 2004 - 2004 29/11/04131 Romsey, Andover & Test Valley B1 2004 - 2004 29/11/04132 Winchester, New Alresford & East Meon B1 2004 - 2004 29/11/04133 Haslemere & Petersfield B1 2004 - 2004 29/11/04141 Cheddar Gorge & Mendip Hills West B1 2004 - 2004 29/11/04142 Shepton Mallet & Mendip Hills East B2 2004 - 2004 29/11/04143 Warminster & Trowbridge B1 2004 - 2004 29/11/04144 Basingstoke, Alton & Whitchurch B1 2004 - 2004 29/11/04153 Weston-super-Mare & Bleadon Hill B1 2004 - 2004 29/11/04154 Bristol West & Portishead A1 2004 - 2004 29/11/04155 Bristol & Bath A1 2004 - 2004 29/11/04156 Chippenham & Bradford-on-Avon A1 2004 - 2004 29/11/04157 Marlborough & Senernake Forest A1 2004 - 2004 29/11/04158 Newbury & Hungerford A1 2004 - 2004 29/11/04159 Reading, Wokingham & Pangbourne A1 2004 - 2004 29/11/04160 Windsor, Weybridge & Bracknell A1 2004 - 2004 29/11/04
The maps below are noted ‘Reprinted with minor change’.
OL1 The Peak District – Dark Peak District A1 2004 - 20041 01/11/04OL21 South Pennines A1 2004 - 20041 07/12/04
122 Brighton & Hove B1 2005 - 20051 17/01/05135 Ashdown Forest B1 2004 - 20041 25/01/05145 Guildford & Farnham B1 2004 - 20041 29/11/04
Tour Map series – new editions
1 Cornwall C 2004 - 20043 29/11/045 Devon & Somerset West C 2004 - 20043 29/11/04
13 Oxfordshire & Berkshire B 2004 - 20043 29/11/0414 Northumberland B 2004 - 20043 22/12/04

65
,ULVK�PDSVDiscoverer maps – new editions
7 Londonderry C edition 2004 Nov 2004
Discovery maps – new editions38 Galway, Mayo, Roscommon 2nd 2003 Dec 2004
Irish street maps – new editionsKilkenny 2004 Dec 2004Limerick 2004 Dec 2004Dublin Street Guide (spiral) 2005 12/01/05
Irish 1:25,000 scale maps – new editionsMacgillycuddy Reeks 2004 Feb 2005
)RUWKFRPLQJ�26*%�PDSVThe following maps have been announced for publication.
Landranger – new editions109 Manchester, Bolton & Warrington C2 28/03/05183 Yeovil & Frome D2 04/04/05184 Salisbury, The Plain & Amesbury C2 04/04/05182 Weston-super-Mare, Bridgwater & Wells C2 11/04/05185 Winchester, Basingstoke, Andover & Romsey D2 18/04/05174 Newbury, Wantage, Hungerford & Didcot D1 25/04/05
Explorer – new editionsOL2 Yorkshire Dales – Southern & Western areas A1 28/05/05OL4 The English Lakes – North Western area A1 28/05/05OL5 The English Lakes – North Eastern area A1 28/05/05OL6 The English Lakes – South Western area A1 28/05/05OL7 The English Lakes – South Eastern area A1 28/05/05OL12 Brecon Beacons National Park – Western & Central areas A1 16/05/05OL13 Brecon Beacons National Park – Eastern area A1 16/05/05OL17 Snowdon & Conwy Valley A1 16/05/05OL18 Harlech, Porthmadog & Bala A1 16/05/05OL19 Howgill Fells & Upper Eden Valley A1 28/05/05OL23 Cadair Idris & Llyn Tegid A1 16/05/05OL30 Yorkshire Dales – Northern & Central areas A1 28/05/05OL31 North Pennines A1 28/05/05OL35 North Pembrokeshire A1 16/05/05OL36 South Pembrokeshire A1 16/05/05
151 Cardiff & Brigend A1 16/05/05152 Newport & Pontypool A1 16/05/05154 Bristol West & Portishead A2 16/05/05164 Gower, Llanelli A1 16/05/05165 Swansea, Neath & Port Talbot A1 16/05/05166 Rhondda & Merthyr Tydfil A1 16/05/05

66
177 Carmarthen & Kidwelly A1 16/05/05178 Llanelli & Ammanford A1 16/05/05185 Newcastle Emlyn, Llandysul & Cynwyl Elfed A1 16/05/05186 Llandeilo & Brechfa Forest A1 16/05/05187 Llandovery, Llanwrtyd Wells & Llyn Brianne A1 16/05/05188 Builth Wells, Painscastle & Talgarth A1 16/05/05198 Cardigan & New Quay, Aberaeron A1 16/05/05199 Lampeter, Tregoran & Llannon A1 16/05/05200 Llandrindod Wells, Elan Valley, Rhayader A1 16/05/05201 Knighton & Presteigne A1 16/05/05213 Aberystwyth & Cwm Rheidol A1 16/05/05214 Llanidloes & Newtown A1 16/05/05215 Newtown, Llanfair Caereinion A1 16/05/05216 Welshpool & Montgomery, Bishop’s Castle A1 16/05/05239 Lake Vyrnwy & Llanfyllin, Tanat Valley A1 16/05/05240 Oswestry, Chirk, Ellesmere & Pant A1 16/05/05253 Lleyn Penisula West A2 16/05/05254 Lleyn Penisula East A2 16/05/05255 Llangollen & Berwyn A1 16/05/05256 Wrexham A1 16/05/05262 Anglesey West A1 16/05/05263 Anglesey East A1 16/05/05264 Vale of Clwyd, Rhyl, Denbigh & Ruthin A1 16/05/05265 Clwydian Range, Prestatyn, Mold & Ruthin A1 16/05/05266 Wirral & Chester A 28/05/05297 Lower Wharfedale & Washburn Valley B1 28/05/05298 Nidderdale B1 28/05/05303 Whitehaven & Workington A1 28/05/05307 Consett & Derwent Reservoir A1 28/05/05314 Solway Firth A1 28/05/05
All of the above Explorer maps are being reprinted with the inclusion of Access Land. The anticipated timetable for the republication of the remaining Explorer maps for England is as follows:
South West – August 2005West – October 2005East – November 2005
More information can be found on the Ordnance Survey website (via the 0DS�6KRS pages) or at KWWS���ZZZ�FRXQWU\VLGHDFFHVV�JRY�XN.OS Travel Map – Road Map
These maps were apparently to be published on 28 February 2005, but at the time of writing did not appear to have been published. Details will be confirmed in 6KHHWOLQHV���.
1 Northern Scotland, Orkney & Shetland C 2005 - ���� 28/02/052 Western Scotland and the Western Isles C 2005 - ���� 28/02/053 Southern Scotland and Northumberland C 2005 - ���� 28/02/054 Northern England C 2005 - ���� 28/02/055 East Midlands & East Anglia including London C 2005 - ���� 28/02/056 Wales and West Midlands C 2005 - ���� 28/02/057 South West England and South Wales C 2005 - ���� 28/02/058 South East England including London C 2005 - ���� 28/02/05

67
)RUWKFRPLQJ�,ULVK�PDSV
Discoverer maps12 Strabane C 07/03/0518 Enniskillen C 07/03/0221 Strangford Lough C 28/02/0528 Monaghan C 07/03/0529 The Mournes C 28/02/05
Discovery maps1 Donegal (NW) 3rd March 20052 Donegal (N & Central) 3rd March 20053 Donegal (NE), Derry 3rd March 20056 Donegal (Central) 3rd March 2005
10 Donegal (SW) 3rd March 200511 Donegal (South) 3rd March 200516 Donegal, Fermanagh, Leitrim & Sligo 3rd March 200523 Mayo 3rd March 200525 Sligo (East), Leitrim, Roscommon 3rd March 200526 Cavan Fermanagh, Leitrim, Roscommon, Sligo 2nd March 200530 Mayo (West & Central) 2nd March 200531 Mayo 3rd March 200537 Mayo (SW), Galway 3rd March 200538 Galway, Mayo (South & Central) 3rd March 200543 Dublin. Louth, Meath & Wicklow 3rd March 200550 Dublin, Kildare, Meath & Wicklow 3rd March 200578 Kerry 3rd March 2005
$ODQ�*RGIUH\�0DSVDetails of Alan Godfrey’s reprints of old OS maps are available from Alan Godfrey Maps, Prospect Business Park, Leadgate, Consett, DH8 7PW, tel. 01207 583388, fax 01207 583399, or from their website at KWWS���ZZZ�DODQJRGIUH\PDSV�FR�XN�. Maps may now be ordered directly from the website.
The columns are as follows: County / Sheet number / Title / Date of map / Month of issue.
Aberdeenshire 75.03 Aberdeen (Bridge of Dee) 1899 02/05Cheshire 9.14 Sale (NW) 1908 02/05Cheshire 27.09 Knutsford (North) 1908 02/05Co. Durham 12.01 Hobson & Tantobie 1895 12/04Co. Durham 37.11 West Hartlepool (new edition) 1914 11/04Cornwall 76.10 Helston 1906 01/05Devon 45.07 Tiverton 1903 03/05Essex (New Series) 69.16 Chigwell Row & Grange Hill 1914 12/04Essex (Old Series) 37.02 Wivenhoe 1896 12/04Fife 36.05 North Kirkcaldy & Dysart 1894 03/05Flintshire 6.09 Holywell 1910 12/04Isle of Wight 95.02 Newport 1907 01/05Kent 34.10 Faversham (SE) 1906 01/05

68
Lancashire 69.06 Lostock Hall & Farington (North) 1909 02/05Lancashire 69.10 Farington (South) & Leyland (North) 1909 02/05Lancashire 69.14 Leyland 1909 02/05Lancashire 77.12 Chorley (New Edition) 1909 03/05Lancashire 87.04 Tottington 1908 11/04Lancashire 96.09 Prestwich 1915 11/04Lancashire 103.16 Trafford Park (South) 1937 11/04Liverpool (large scale) 25 Liverpool (London Road) 1848-64 01/05London 26 Cricklewood & Child’s Hill 1912 12/04London 58 East Acton & Wormwood Scrubbs 1871 02/05London (large scale) 7.21 The Zoo 1870 12/04Merioneth 4.09 Blaenau Ffestiniog 1914 03/05Middlesex 15.13 Hayes (South) 1935 12/04Northamptonshire 40.09 Rushden (West) 1923 03/05Northamptonshire 40.09 Rushden (East) 1923 03/05Oxfordshire 54.09 Henley-on-Thames (North) 1910 11/04Oxfordshire 54.13 Henley-on-Thames (South) 1910 11/04Staffordshire 18.06 Fenton 1922 12/04Staffordshire 57.12 Shire Oak & Catshill 1901 02/05Staffordshire 62.02 Wolverhampton (Bushbury) 1914 01/05Suffolk 9.11 Beccles 1926 11/04Sussex 13.08 Horsham (North) 1932 12/04Sussex 13.12 Horsham (South) 1938 12/04Worcestershire 40.09 Great Malvern (East) 1926 02/05Yorkshire 17.01 Eston 1927 12/04Yorkshire 65.08 Hawes 1910 11/04Yorkshire 110.11 Hunmanby 1926 01/05Yorkshire 216.03 Bradford (Girlington) 1906 01/05Yorkshire 232.04 Heckmondwike 1905 03/05Yorkshire 275.02 Grimethorpe 1929 03/05Yorkshire 300.01 Kiveton Park & Wales 1901 03/05
England and Wales one-inch14 Morpeth, Gosforth & Matfen (includes map of Matfen) 1902-14 12/0494 Beaumaris & Llandudno (includes map of Beaumaris) 1903 12/04
100 Sheffield & District (includes map of Laughton en le Morthen) 1907 02/05119 Snowdonia (includes map of Penrhyndeudraeth) 1903 02/05168 Birmingham & District (includes map of Olton) 1910 12/04
2UGQDQFH�6XUYH\�PDSV��D�FRQFLVH�JXLGH�IRU�KLVWRULDQVAs we go to press, the second, hardback edition of Richard Oliver’s &RQFLVH�*XLGHhas arrived from the printers. The newly expanded version of this invaluable handbook on the interpretation and study of Ordnance Survey maps will be launched at the AGM on 14 May and copies will be available at the meeting. A form to enable CCS members to order pre-publication copies is enclosed with this issue of 6KHHWOLQHV. The published price of this 256 page work is £17.50; copies are available to Society members at £13.50.