shelby county early childhood education compendium...
TRANSCRIPT

PeopleFirst Partnership
December 2015
Shelby County Early Childhood EducationFactbase compendium

1Draft—for discussion only
Factbase overview
Context
0-3 year olds
4-year olds
K-3rd
Continuum
2-6
8-50
52-61
63-88
90-123
Pages
2Draft—for discussion only
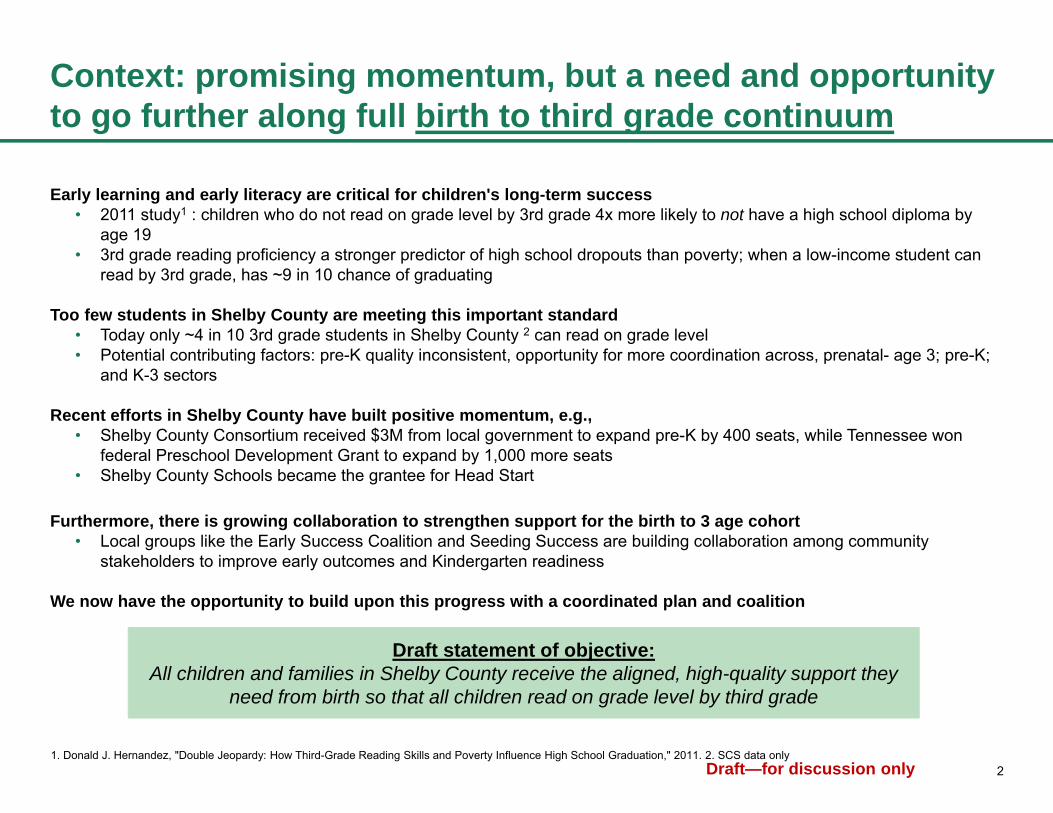
Context: promising momentum, but a need and opportunity to go further along full birth to third grade continuum
Early learning and early literacy are critical for children's long-term success• 2011 study1 : children who do not read on grade level by 3rd grade 4x more likely to not have a high school diploma by
age 19• 3rd grade reading proficiency a stronger predictor of high school dropouts than poverty; when a low-income student can
read by 3rd grade, has ~9 in 10 chance of graduating
Too few students in Shelby County are meeting this important standard• Today only ~4 in 10 3rd grade students in Shelby County 2 can read on grade level• Potential contributing factors: pre-K quality inconsistent, opportunity for more coordination across, prenatal- age 3; pre-K;
and K-3 sectors
Recent efforts in Shelby County have built positive momentum, e.g., • Shelby County Consortium received $3M from local government to expand pre-K by 400 seats, while Tennessee won
federal Preschool Development Grant to expand by 1,000 more seats• Shelby County Schools became the grantee for Head Start
Furthermore, there is growing collaboration to strengthen support for the birth to 3 age cohort• Local groups like the Early Success Coalition and Seeding Success are building collaboration among community
stakeholders to improve early outcomes and Kindergarten readiness
We now have the opportunity to build upon this progress with a coordinated plan and coalition
1. Donald J. Hernandez, "Double Jeopardy: How Third-Grade Reading Skills and Poverty Influence High School Graduation," 2011. 2. SCS data only
Draft statement of objective:All children and families in Shelby County receive the aligned, high-quality support they
need from birth so that all children read on grade level by third grade
3Draft—for discussion only
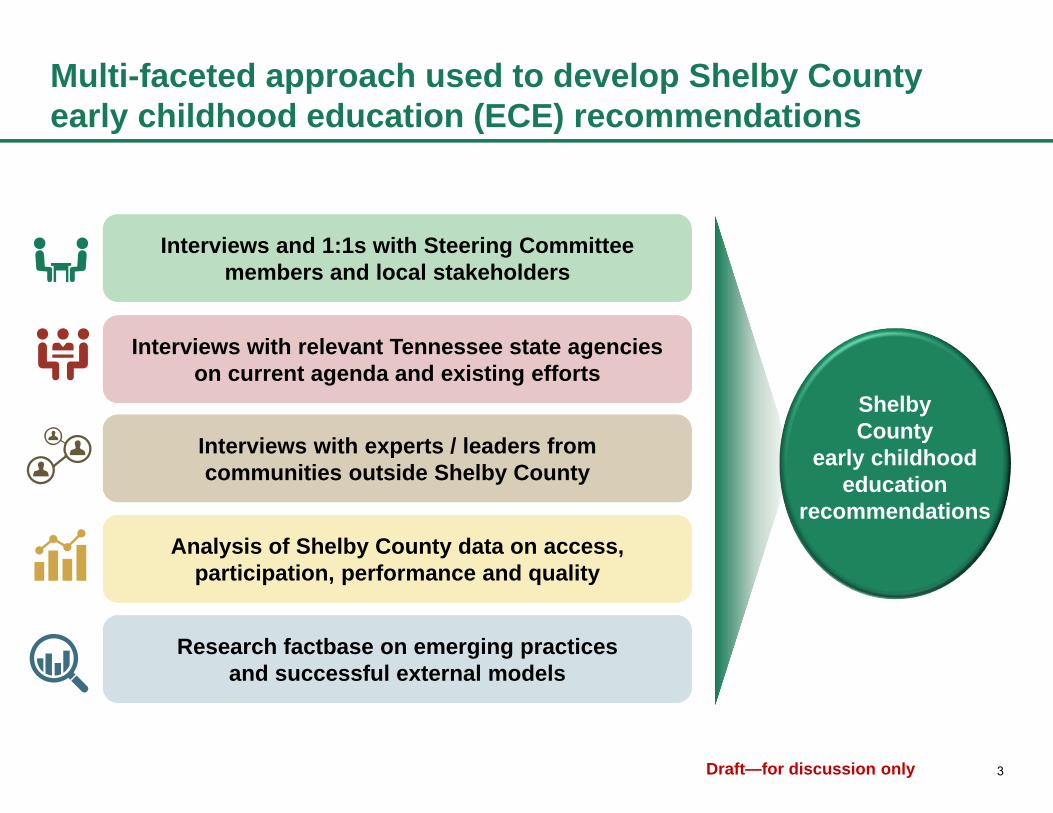
Multi-faceted approach used to develop Shelby County early childhood education (ECE) recommendations
Interviews and 1:1s with Steering Committee members and local stakeholders
Interviews with experts / leaders from communities outside Shelby County
Research factbase on emerging practices and successful external models
Interviews with relevant Tennessee state agencies on current agenda and existing efforts
Analysis of Shelby County data on access, participation, performance and quality
Shelby County
early childhood education
recommendations

4Draft—for discussion only
Diverse coalition of stakeholders on the Shelby County Early Childhood Steering Committee
Sandra Allen, LeBonheur Children’s Hospital/Early Success Coalition Malika Anderson, Achievement School DistrictJessica Ball, Hyde Family FoundationsJim Boyd, Pyramid Peak FoundationKathy Buckman-Gibson, Chamber of Commerce/Chairman's CircleKristi Ford, Bartlett City SchoolsTrina Gilliam, LeBonheur Children's Hospital/ Early Success Coalition Sandy Guntharp, Ready Set Grow/MAEYCKaren Harrell, Porter-Leath Joey Hassel, TN Department of EducationDr. Hank Herrod, The Urban Child InstituteMartha Jackson, Jesse Mahan Child Care CenterJerri Jackson, Millington Municipal Schools
Lora Jobe, PeopleFirst Partnership
Cate Joyce, Seeding Success
Sean Lee, Porter-Leath Mayor Mark Luttrell, Shelby County GovernmentDr. Deanna McClendon, Shelby County SchoolsKatie McPherson, Achievement School District Misty Moody, TN Department of EducationDr. Mary Palmer, Southwest Tennessee Community CollegeChris Peck, ACE FoundationDianne Polly, Shelby County Education FoundationDr. Barbara Prescott, PeopleFirst PartnershipDr. Heidi Ramirez, Shelby County SchoolsDr. Loretta Rudd, University of Memphis Channel Sallie, Shelby County SchoolsMark Sturgis, Seeding SuccessBlair Taylor, Memphis TomorrowCathy Thompson, Achievement School DistrictPaul Young, Shelby County GovernmentKeisha Walker, Shelby County Government/Early Success Coalition

5Draft—for discussion only
Recommendations developed with input from several additional stakeholders, experts, and leaders in ECE
Within Shelby County
• Peter Abell, Books from Birth• Michael Collins, Germanshire Elementary• Shelly Counsell, University of Memphis• ZB Davis, TFA Memphis• Taylor DeMagistris, Teacher Town• Tosha Downey, Teacher Town• Betty Dupont, Hope House• Nate Ferguson, Where We Live Mid-South• Anasa Franklin, SCS Performance Management• Rorie Harris, SCS Performance Management• Sutton Mora Hayes, Where We Live Mid-South• Dottie Jones, CoactionNet• David Jordan, Agape• Catherine Monaco, Impact America – TN• Bob Nardo, Libertas• Alicia Norman, Perea School• Jason Ogle, SCS Assessment and Accountability• Lindsey Osborne, ,SCS Talent Acquisition• Courtney Robertson, Knowledge Quest• Principal Strickland, Manor Lake Elementary• Mrs. Thomas, Joyland Academy• Greg Thompson, Pyramid Peak• Athena Turner, TFA Memphis• Ashley Walton, SCS Talent Acquisition• Elizabeth Wilson, TECTA• Brian Wright, University of Memphis
Outside Tennessee
• Julie Asher, Harvard University• Susan Bales, Frameworks Institute• Steve Barnett, NIEER• Madeleine Bayard, Rodel Foundation of Delaware• Charles Carter, Harvard University • Alan Cohen, Dallas ISD• Ann Cook, Salt Lake City Community Learning
Center• Kim Day, Drew Charter School• Alex Hales, TFA Dallas• Cynthia Kuhlman, CF Foundation• Derek Little, Louisiana Dept of Education• Jaime Meyers, Commit• Jessica Pizarek, Policy Link• Al Race, Harvard University• Sara Remington, Rhode Island Dept of Health• Julie Sweetland, Frameworks Institute• Todd Williams, Commit
Within Tennessee
• Connie Casha, Tennessee Dept of Education• Katari Coleman, Dept of Human Services• Misty Moody, Tennessee Dept of Education• Gary Smith, Tennessee Dept of Education• Lisa Wiltshire, Tennessee Dept of Education
6Draft—for discussion only
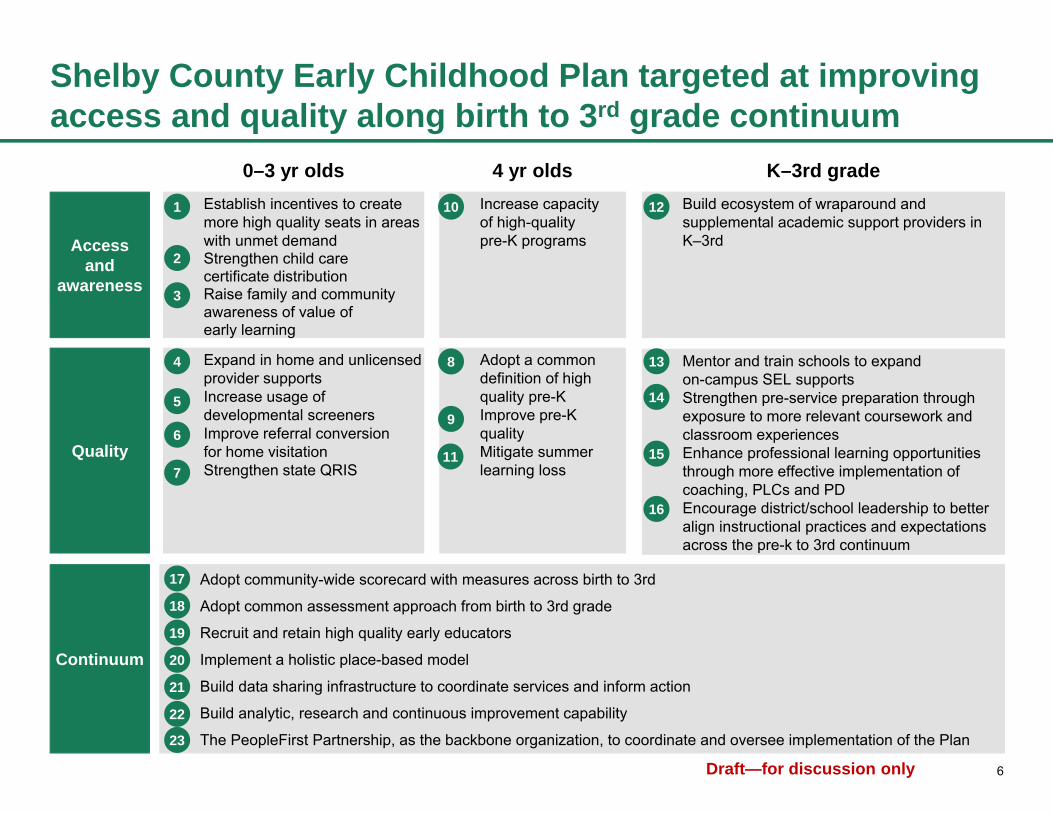
Shelby County Early Childhood Plan targeted at improving access and quality along birth to 3rd grade continuum
4 yr olds0–3 yr olds K–3rd grade
Adopt community-wide scorecard with measures across birth to 3rd
Adopt common assessment approach from birth to 3rd grade
Recruit and retain high quality early educators
Implement a holistic place-based model
Build data sharing infrastructure to coordinate services and inform action
Build analytic, research and continuous improvement capability
The PeopleFirst Partnership, as the backbone organization, to coordinate and oversee implementation of the Plan
Continuum
17
18
19
20
21
22
Increase capacityof high-qualitypre-K programs
Establish incentives to create more high quality seats in areas with unmet demandStrengthen child carecertificate distributionRaise family and community awareness of value ofearly learning
Build ecosystem of wraparound and supplemental academic support providers in K–3rdAccess
and awareness 3
1
2
10 12
Adopt a common definition of high quality pre-KImprove pre-K quality Mitigate summer learning loss
Expand in home and unlicensed provider supportsIncrease usage ofdevelopmental screenersImprove referral conversionfor home visitationStrengthen state QRIS
Mentor and train schools to expandon-campus SEL supportsStrengthen pre-service preparation through exposure to more relevant coursework and classroom experiencesEnhance professional learning opportunities through more effective implementation of coaching, PLCs and PDEncourage district/school leadership to better align instructional practices and expectations across the pre-k to 3rd continuum
Quality
4
5
6
7
9
11
13
14
15
16
23
8

0-3 year olds
8Draft—for discussion only
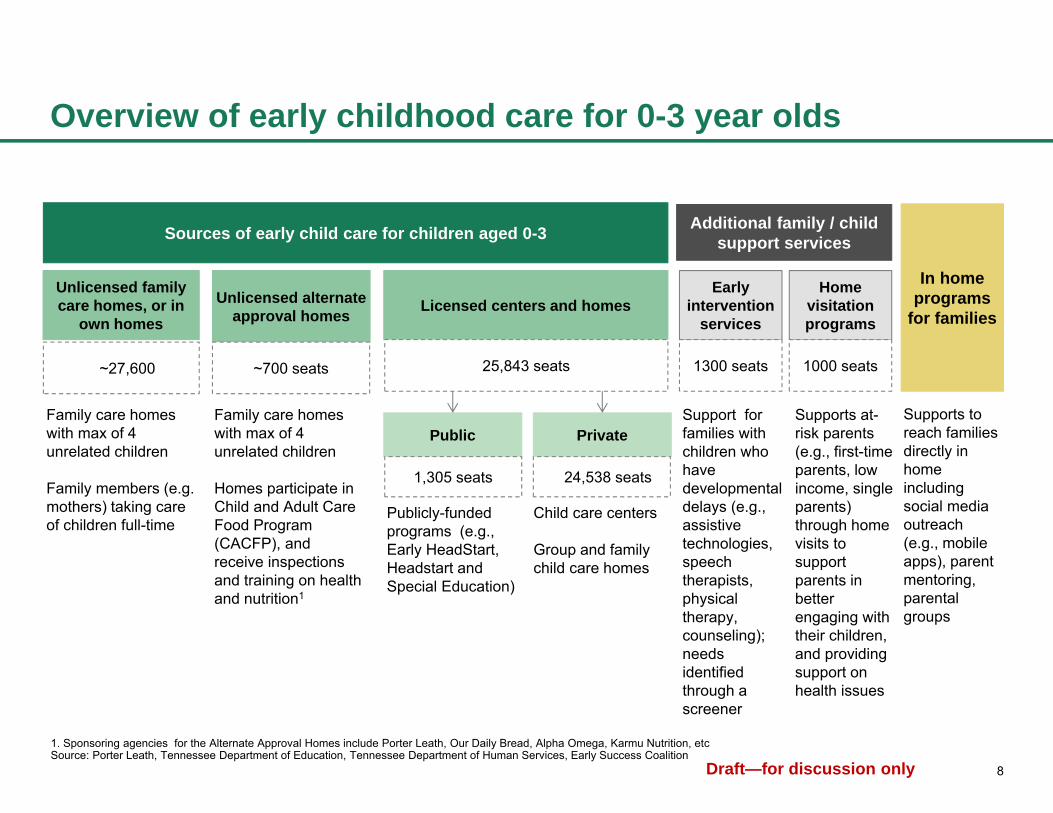
Overview of early childhood care for 0-3 year olds
Licensed centers and homes
Sources of early child care for children aged 0-3
Unlicensed family care homes, or in
own homes
Private
Publicly-funded programs (e.g., Early HeadStart, Headstart and Special Education)
Child care centers
Group and family child care homes
Public
Unlicensed alternate approval homes
Family care homes with max of 4 unrelated children
Homes participate in Child and Adult Care Food Program (CACFP), and receive inspections and training on healthand nutrition1
Early intervention
services
Support for families with children who have developmental delays (e.g., assistive technologies, speech therapists, physical therapy, counseling); needs identified through a screener
Home visitation programs
Supports at-risk parents (e.g., first-time parents, low income, single parents) through home visits to support parents in better engaging with their children, and providing support on health issues
Family care homes with max of 4 unrelated children
Family members (e.g. mothers) taking care of children full-time
1. Sponsoring agencies for the Alternate Approval Homes include Porter Leath, Our Daily Bread, Alpha Omega, Karmu Nutrition, etcSource: Porter Leath, Tennessee Department of Education, Tennessee Department of Human Services, Early Success Coalition
~27,600 ~700 seats 25,843 seats
Additional family / child support services
1300 seats 1000 seats
1,305 seats 24,538 seats
Supports to reach families directly in home including social media outreach (e.g., mobile apps), parent mentoring, parental groups
In home programs
for families
9Draft—for discussion only
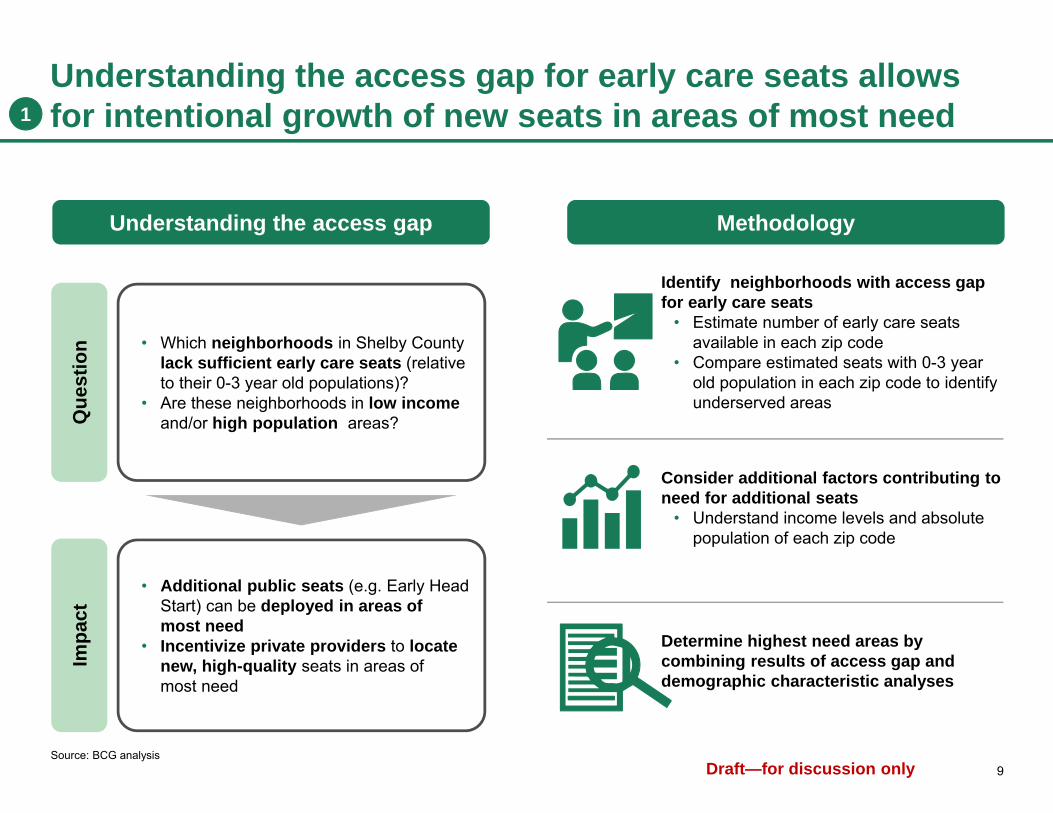
Understanding the access gap for early care seats allows for intentional growth of new seats in areas of most need
Header HeaderUnderstanding the access gap Methodology
Que
stio
nIm
pact
• Which neighborhoods in Shelby County lack sufficient early care seats (relative to their 0-3 year old populations)?
• Are these neighborhoods in low income and/or high population areas?
• Additional public seats (e.g. Early Head Start) can be deployed in areas of most need
• Incentivize private providers to locate new, high-quality seats in areas of most need
Identify neighborhoods with access gap for early care seats
• Estimate number of early care seats available in each zip code
• Compare estimated seats with 0-3 year old population in each zip code to identify underserved areas
Consider additional factors contributing to need for additional seats
• Understand income levels and absolute population of each zip code
Determine highest need areas by combining results of access gap and demographic characteristic analyses
Source: BCG analysis
1

10Draft—for discussion only
Two-thirds of zip-codes in Shelby County have less than 50% coverage by licensed early care providers
38002
38016
38017
38018
38028
38053
38103
38104
38105
38106
3810738108
38109
38111
38112
38114
38115
38116
38117
38118
38119
38120
38122
38125
38126
38127
38128
38133
38134
38135
3813838139
38141
<50%50-75%>75%
Share of 0-3 year olds in Shelby County served by licensed early care providers
Source: US Census Bureau, 2013 American Community Survey, National Association for the Education of Young Children, Urban Child Institute
38132
38152
1

11Draft—for discussion only
Access gap most prevalent in five zip codes that have larger 0-3 populations and lower median household income
0
50,000
100,000
150,000
0 25 50 75 100
38126
38016
38139
3811438115
38120
38116
38106
38125
3805338112
38117
38028
Annual median household income ($)
38018138109
38105
3810338119
38017
38122
38141
38108
3810438128
38138
38134
38107
38002
3811138118
38127
38133
38135
% of 0-3 year olds served by licensed private providers
% served vs. median household income % served vs. population
1. Percentage served more than 100% likely due to families bringing children to neighborhoods where jobs are locatedSource: US Census Bureau, National Association for the Education of Young Children, Urban Child Institute
0
1,000
2,000
3,000
4,000
0 25 50 75 100
38117
38138
38106
38115
38016
38017
380181
38109
38122 38141
3812538134
3812838116
3810438139
3811438112
38108
38053
38107
38120
38127
0-3 year old total population
% of 0-3 year olds served by licensed private providers
38028
3810538103
38119
3813338135
38126
3800238111
38118
Zip codes that overlap in both plotsLeast served and highest population Least served and lowest income
Median Shelby County household income
1

12Draft—for discussion onlySource: U.S. Census Bureau, 2009–2013 5-Year American Community Survey
Zip-code
Child under 6 in single-
parent home (%)
Children under 18 living in
rental housing (%)
Population that did not complete high school (%)
Non-institutionalized
population with no health insurance
coverage (%)
Unemployed population over 16 (%)
Overall Shelby County 70.1 49.0 14.0 15.8 7.8
Frayser (38127) 83.0 71.8 25.3 18.5 12.6
Hickory Hill(38115) 90.1 70.4 16.8 24.1 10.5
Oakhaven/Parkway Village
(38118)65.0 64.9 24.4 24.7 12.4
Raleigh(38128) 71.5 60.6 18.5 22.1 8.7
White Haven (38116) 70.6 64.1 14.8 18.0 11.0
Additional characteristic of families in five zip codes with most prevalent access gap
Up to 20% more single-
parent homes
~10-20% more families in
rental housing
Up to 11% higher population that
did not complete high school
Up to 10% more families with no health insurance coverage
Up to 5% points higher
unemployment
Comparison of target zip codes
to Shelby County overall
1
Backup

13Draft—for discussion only
Increasing coverage to 50-75% in these zip codes would require ~2400-6500 additional early care seats
38002
38016
38017
38018
38028
38053
38103
38104
38105
38106
3810738108
38109
38111
38112
38114
38115
38116
38117
38118
38119
38120
38122
38125
38126
38127
38128
38133
38134
38135
3813838139
38141
Source: US Census Bureau, 2013 American Community Survey, National Association for the Education of Young Children, Urban Child Institute
38132
38152
~2,400-6,500 additional seats needed to get 50-75% coverage of the 0-3 year old population
with access to licensed seats in the highest need zip codes
1

14Draft—for discussion only
Access gap supporting detail by zip codeNeighborhood Zip code 0-3 year old population Served (%) Household income ($)
Downtown38103 273 73 56,38838104 968 74 36,39838105 419 21 17,348
Cordova38016 2,689 34 66,84538018 1,052 177 31,979
East Memphis38117 1,611 49 62,58038119 1,204 63 58,27638120 585 62 83,396
Frayser 38127 3,858 29 25,592
Hickory Hill38115 3,604 37 29,23038125 2,236 31 65,46538141 1,635 20 51,228
Jackson Berclair38108 1,052 32 22,49738122 1,539 16 34,735
Midtown/Chickasaw Gardens38111 2,134 65 35,55838112 1,076 39 30,418
North Memphis/Uptown 38107 1,043 39 27,151Oakhaven/Parkway Village 38118 3,206 34 31,979
Raleigh38128 2,857 31 35,053381341 2,423 61 47,529
South Memphis
38106 1,344 74 22,37438109 2,312 42 31,06738114 1,377 58 24,01938126 494 74 14,889
White Haven 38116 2,689 47 37,714Arlington 380022 2,179 38 90,327
Bartlett38133 1,304 33 63,18438134 2,423 61 47,52938135 1,223 15 77,880
Collierville 38017 2,062 70 99,256
Germantown38138 920 92 97,64938139 965 47 131,948
Lakeland 38002 2,179 38 90,327Millington 38053 1,739 20 51,513
Other 38028 154 37 91,2091. Repeated in two neighborhoods. 2. Repeated in two neighborhoodsSource: Greater Memphis Chamber
1
Backup
15Draft—for discussion only
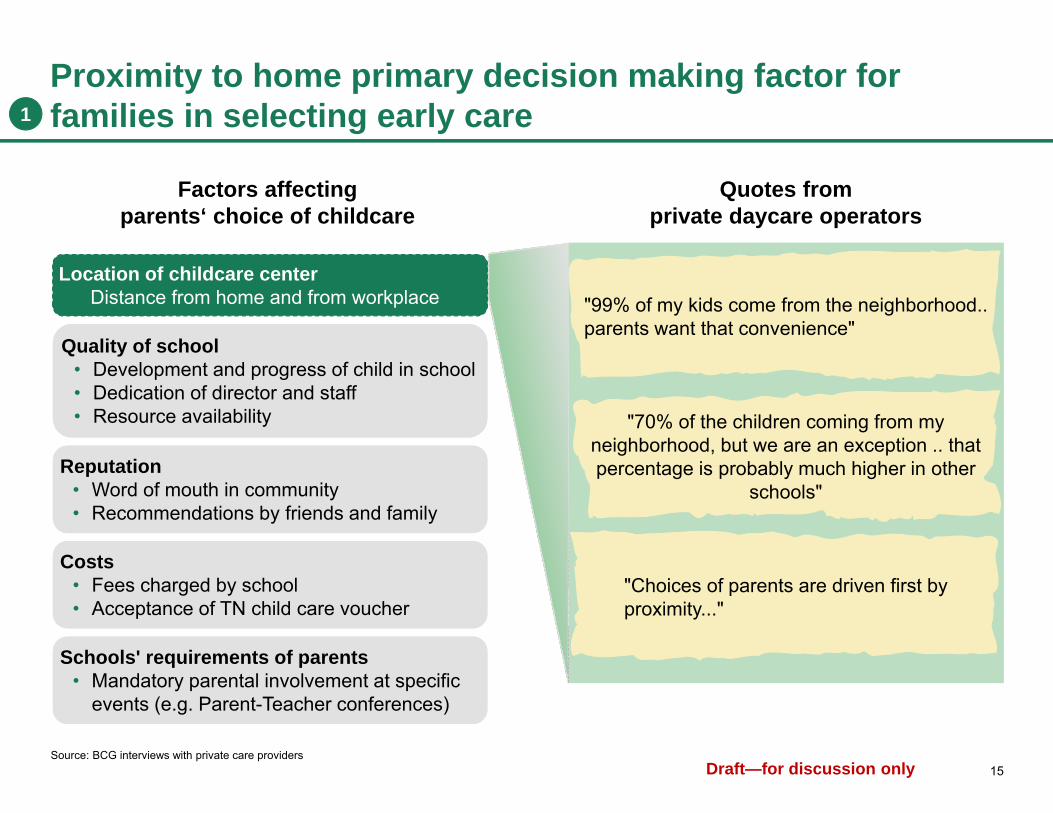
Proximity to home primary decision making factor for families in selecting early care
Factors affectingparents‘ choice of childcare
Quotes fromprivate daycare operators
Location of childcare center• Distance from home and from workplace
Quality of school • Development and progress of child in school• Dedication of director and staff • Resource availability
Quality of school • Development and progress of child in school• Dedication of director and staff • Resource availability
Reputation • Word of mouth in community • Recommendations by friends and family
Reputation • Word of mouth in community • Recommendations by friends and family
Costs • Fees charged by school• Acceptance of TN child care voucher
Costs • Fees charged by school• Acceptance of TN child care voucher
Schools' requirements of parents• Mandatory parental involvement at specific
events (e.g. Parent-Teacher conferences)
Schools' requirements of parents• Mandatory parental involvement at specific
events (e.g. Parent-Teacher conferences)
"70% of the children coming from my neighborhood, but we are an exception .. that percentage is probably much higher in other
schools"
"99% of my kids come from the neighborhood.. parents want that convenience"
"Choices of parents are driven first by proximity..."
Source: BCG interviews with private care providers
1
16Draft—for discussion only
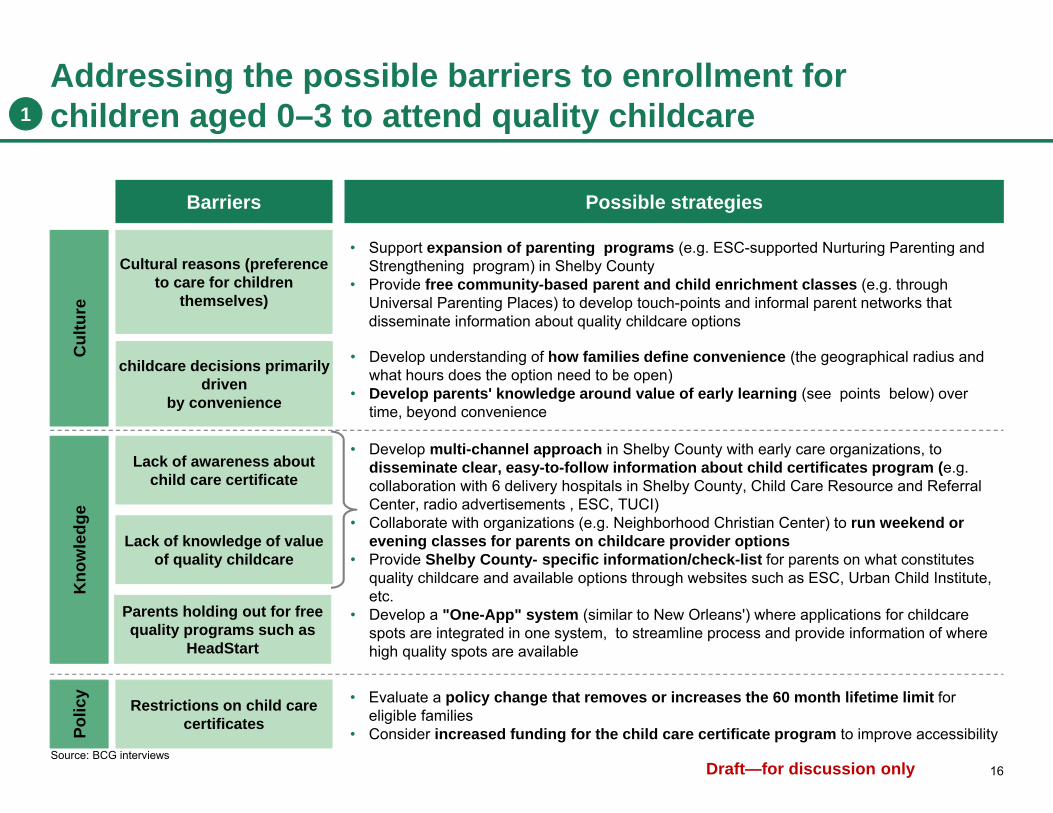
Addressing the possible barriers to enrollment for children aged 0–3 to attend quality childcare
Barriers Possible strategies
Cultural reasons (preference to care for children
themselves)
• Support expansion of parenting programs (e.g. ESC-supported Nurturing Parenting and Strengthening program) in Shelby County
• Provide free community-based parent and child enrichment classes (e.g. through Universal Parenting Places) to develop touch-points and informal parent networks that disseminate information about quality childcare options
Restrictions on child care certificates
Lack of awareness about child care certificate
Lack of knowledge of value of quality childcare
Parents holding out for free quality programs such as
HeadStart
• Develop multi-channel approach in Shelby County with early care organizations, to disseminate clear, easy-to-follow information about child certificates program (e.g. collaboration with 6 delivery hospitals in Shelby County, Child Care Resource and Referral Center, radio advertisements , ESC, TUCI)
• Collaborate with organizations (e.g. Neighborhood Christian Center) to run weekend or evening classes for parents on childcare provider options
• Provide Shelby County- specific information/check-list for parents on what constitutes quality childcare and available options through websites such as ESC, Urban Child Institute, etc.
• Develop a "One-App" system (similar to New Orleans') where applications for childcare spots are integrated in one system, to streamline process and provide information of where high quality spots are available
• Evaluate a policy change that removes or increases the 60 month lifetime limit for eligible families
• Consider increased funding for the child care certificate program to improve accessibility
childcare decisions primarily driven
by convenience
• Develop understanding of how families define convenience (the geographical radius and what hours does the option need to be open)
• Develop parents' knowledge around value of early learning (see points below) over time, beyond convenience
Kno
wle
dge
Po
licy
C
ultu
re
Source: BCG interviews
1
17Draft—for discussion only
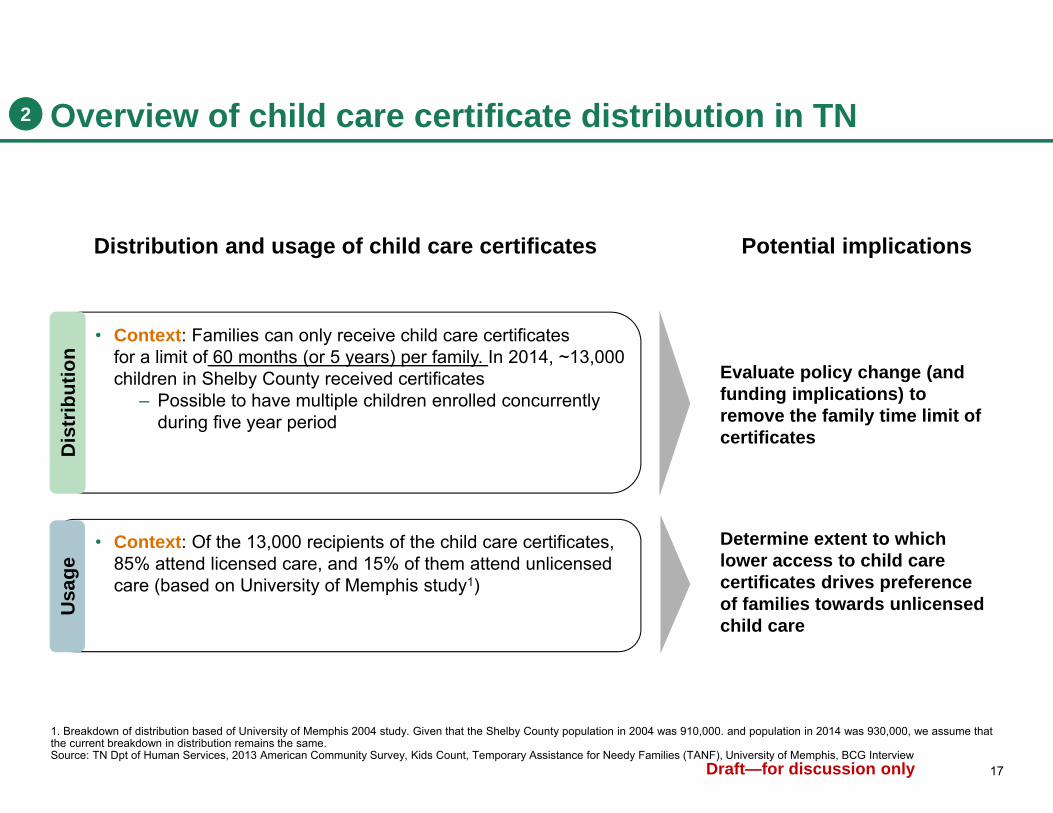
Distribution and usage of child care certificates Potential implications
Evaluate policy change (and funding implications) to remove the family time limit of certificates
• Context: Families can only receive child care certificatesfor a limit of 60 months (or 5 years) per family. In 2014, ~13,000 children in Shelby County received certificates
– Possible to have multiple children enrolled concurrently during five year period
1. Breakdown of distribution based of University of Memphis 2004 study. Given that the Shelby County population in 2004 was 910,000. and population in 2014 was 930,000, we assume that the current breakdown in distribution remains the same. Source: TN Dpt of Human Services, 2013 American Community Survey, Kids Count, Temporary Assistance for Needy Families (TANF), University of Memphis, BCG Interview
Overview of child care certificate distribution in TN
Determine extent to which lower access to child care certificates drives preference of families towards unlicensed child care
• Context: Of the 13,000 recipients of the child care certificates, 85% attend licensed care, and 15% of them attend unlicensed care (based on University of Memphis study1)
Dis
trib
utio
n U
sage
2
18Draft—for discussion only
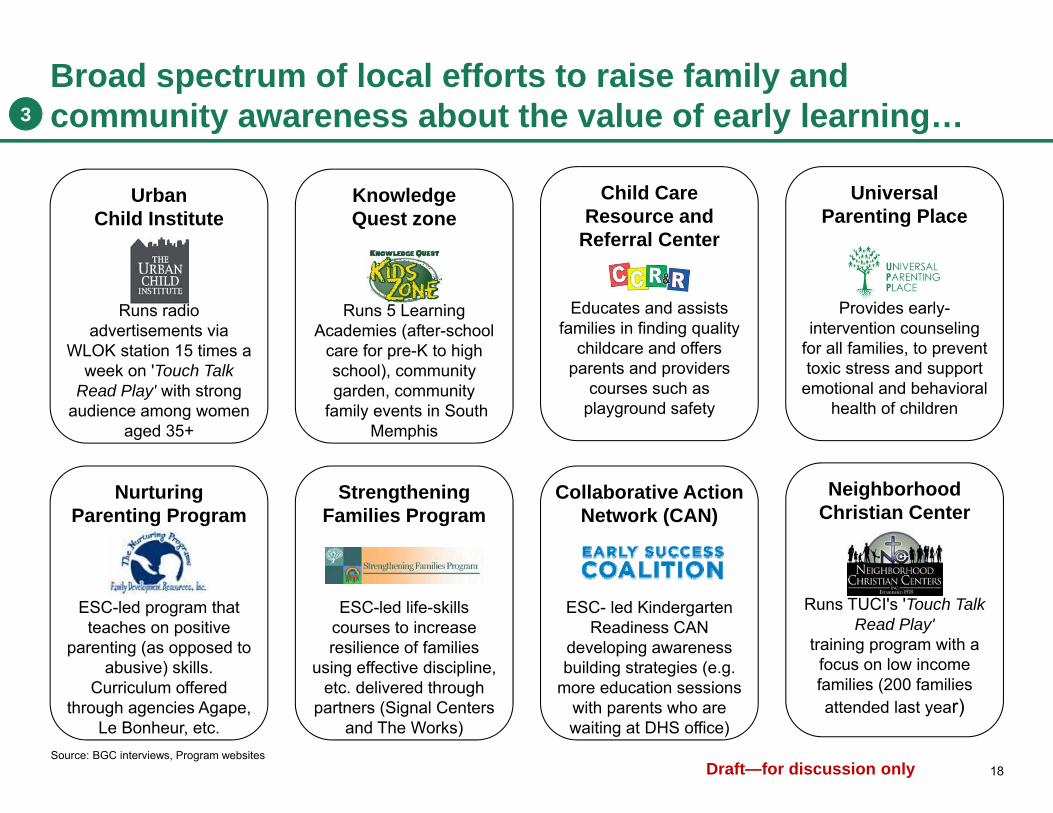
Broad spectrum of local efforts to raise family and community awareness about the value of early learning…
Child Care Resource and
Referral Center
Educates and assists families in finding quality
childcare and offers parents and providers
courses such as playground safety
Knowledge Quest zone
Runs 5 Learning Academies (after-school
care for pre-K to high school), community garden, community
family events in South Memphis
Urban Child Institute
Runs radio advertisements via
WLOK station 15 times a week on 'Touch Talk
Read Play' with strong audience among women
aged 35+
Nurturing Parenting Program
ESC-led program that teaches on positive
parenting (as opposed to abusive) skills.
Curriculum offered through agencies Agape,
Le Bonheur, etc.
Neighborhood Christian Center
Runs TUCI's 'Touch Talk Read Play'
training program with a focus on low income families (200 families attended last year)
Strengthening Families Program
ESC-led life-skills courses to increase resilience of families
using effective discipline, etc. delivered through
partners (Signal Centers and The Works)
Universal Parenting Place
Provides early-intervention counseling
for all families, to prevent toxic stress and support
emotional and behavioral health of children
Collaborative Action Network (CAN)
ESC- led Kindergarten Readiness CAN
developing awareness building strategies (e.g.
more education sessions with parents who are waiting at DHS office)
Source: BGC interviews, Program websites
3
19Draft—for discussion only
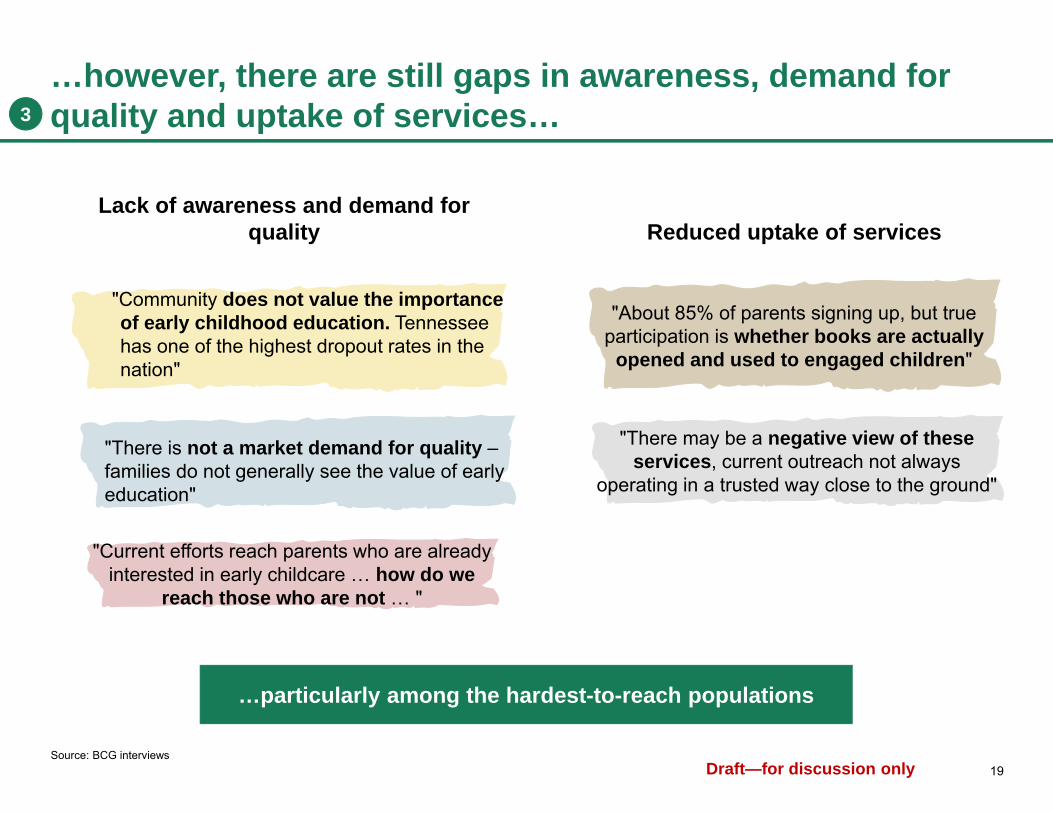
…however, there are still gaps in awareness, demand for quality and uptake of services…
Lack of awareness and demand for quality Reduced uptake of services
…particularly among the hardest-to-reach populations
"About 85% of parents signing up, but true participation is whether books are actually
opened and used to engaged children"
"There may be a negative view of these services, current outreach not always
operating in a trusted way close to the ground"
"Current efforts reach parents who are already interested in early childcare … how do we
reach those who are not … "
"Community does not value the importance of early childhood education. Tennessee has one of the highest dropout rates in the nation"
"There is not a market demand for quality –families do not generally see the value of early education"
3
Source: BCG interviews
20Draft—for discussion only
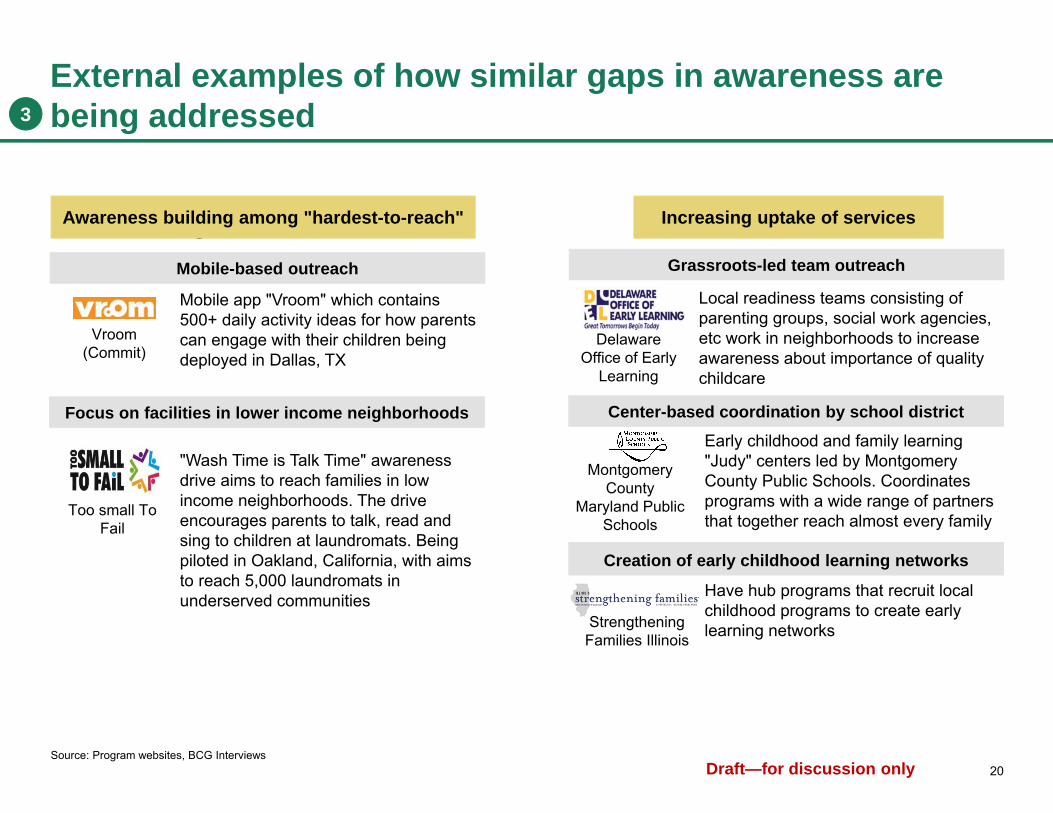
External examples of how similar gaps in awareness are being addressed
Center-based coordination by school districtEarly childhood and family learning "Judy" centers led by Montgomery County Public Schools. Coordinates programs with a wide range of partners that together reach almost every family
Source: Program websites, BCG Interviews
Mobile-based outreach
Mobile app "Vroom" which contains 500+ daily activity ideas for how parents can engage with their children being deployed in Dallas, TX
"Wash Time is Talk Time" awareness drive aims to reach families in low income neighborhoods. The drive encourages parents to talk, read and sing to children at laundromats. Being piloted in Oakland, California, with aims to reach 5,000 laundromats in underserved communities
Vroom (Commit)
Too small To Fail
Grassroots-led team outreach
Local readiness teams consisting of parenting groups, social work agencies, etc work in neighborhoods to increase awareness about importance of quality childcare
Delaware Office of Early
Learning
Montgomery County
Maryland Public Schools
Creation of early childhood learning networks
Have hub programs that recruit local childhood programs to create early learning networksStrengthening
Families Illinois
Reaching the "hardest-to-reach" Increasing uptake of services
Focus on facilities in lower income neighborhoods
Awareness building among "hardest-to-reach" Increasing uptake of services
3
21Draft—for discussion only
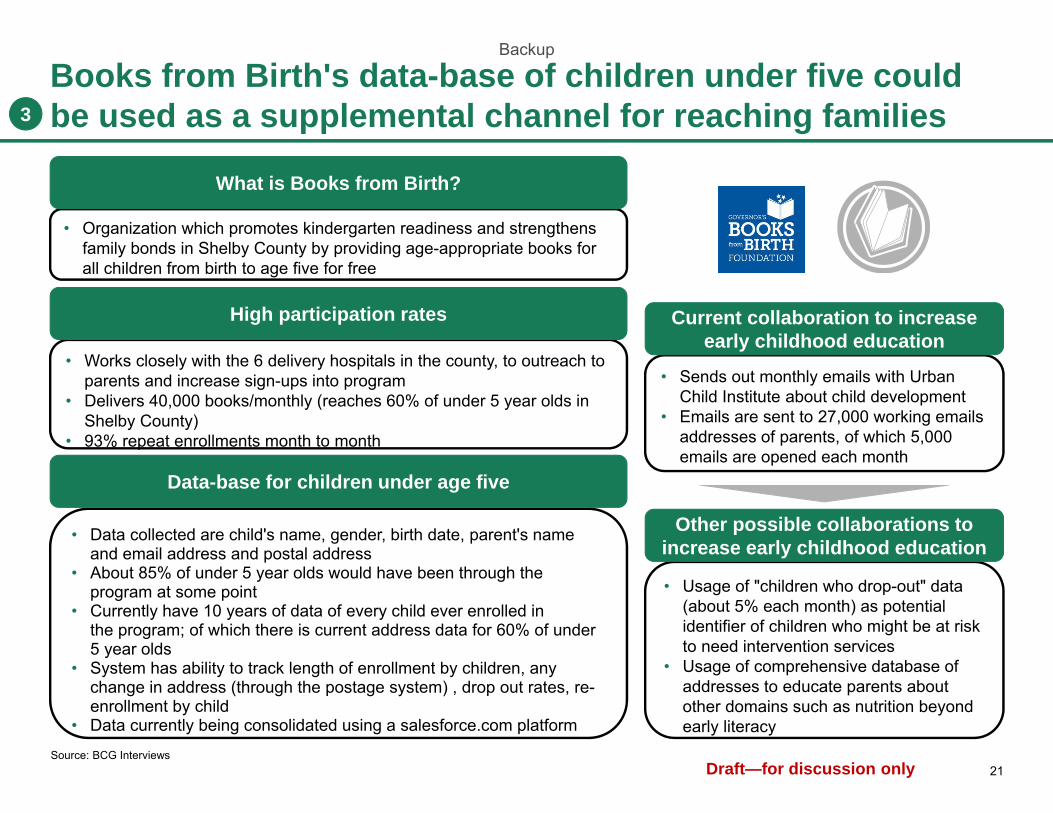
Books from Birth's data-base of children under five could be used as a supplemental channel for reaching families
• Works closely with the 6 delivery hospitals in the county, to outreach to parents and increase sign-ups into program
• Delivers 40,000 books/monthly (reaches 60% of under 5 year olds in Shelby County)
• 93% repeat enrollments month to month
High participation rates
• Data collected are child's name, gender, birth date, parent's name and email address and postal address
• About 85% of under 5 year olds would have been through the program at some point
• Currently have 10 years of data of every child ever enrolled in the program; of which there is current address data for 60% of under 5 year olds
• System has ability to track length of enrollment by children, any change in address (through the postage system) , drop out rates, re-enrollment by child
• Data currently being consolidated using a salesforce.com platform
Data-base for children under age five
• Organization which promotes kindergarten readiness and strengthens family bonds in Shelby County by providing age-appropriate books for all children from birth to age five for free
What is Books from Birth?
• Sends out monthly emails with Urban Child Institute about child development
• Emails are sent to 27,000 working emails addresses of parents, of which 5,000 emails are opened each month
Current collaboration to increase early childhood education
• Usage of "children who drop-out" data (about 5% each month) as potential identifier of children who might be at risk to need intervention services
• Usage of comprehensive database of addresses to educate parents about other domains such as nutrition beyond early literacy
Other possible collaborations to increase early childhood education
Source: BCG Interviews
3
Backup

22Draft—for discussion only
Versame's Starling is an innovative wearable word tracking device aimed at increasing word exposure for 0–4 year olds
Starling is an educational wearable …
• Tracks the number of words a child hears and says each day
• For use with 0–4 year olds• Paired with a smart phone
app that provides analytics and suggestive activities
• Priced at ~$130 per device
… based on research that shows correlation between
words learned and IQ Potential use in Shelby County
Could be a more innovative way of reaching parents in homes and getting them more actively engaged in interacting with their children
Can also be used by childcare givers in early care education centers
Aggregating analytic data across individual users can give community-level data on language exposure to children
Source: Versame.com; The Early Catastrophe : The 30 Million Word Gap by Age 3 (1993); A Longitudinal Investigation of the Role of Quantity and Quality of Child Directed Speech in Vocabulary Development (2012)
0
10
20
30
40
50
Cumulative words spoken to child (M)
0 12 24 36 48
Child's age in months
IQ of 79
IQ of 117IQ of 107
4
23Draft—for discussion only
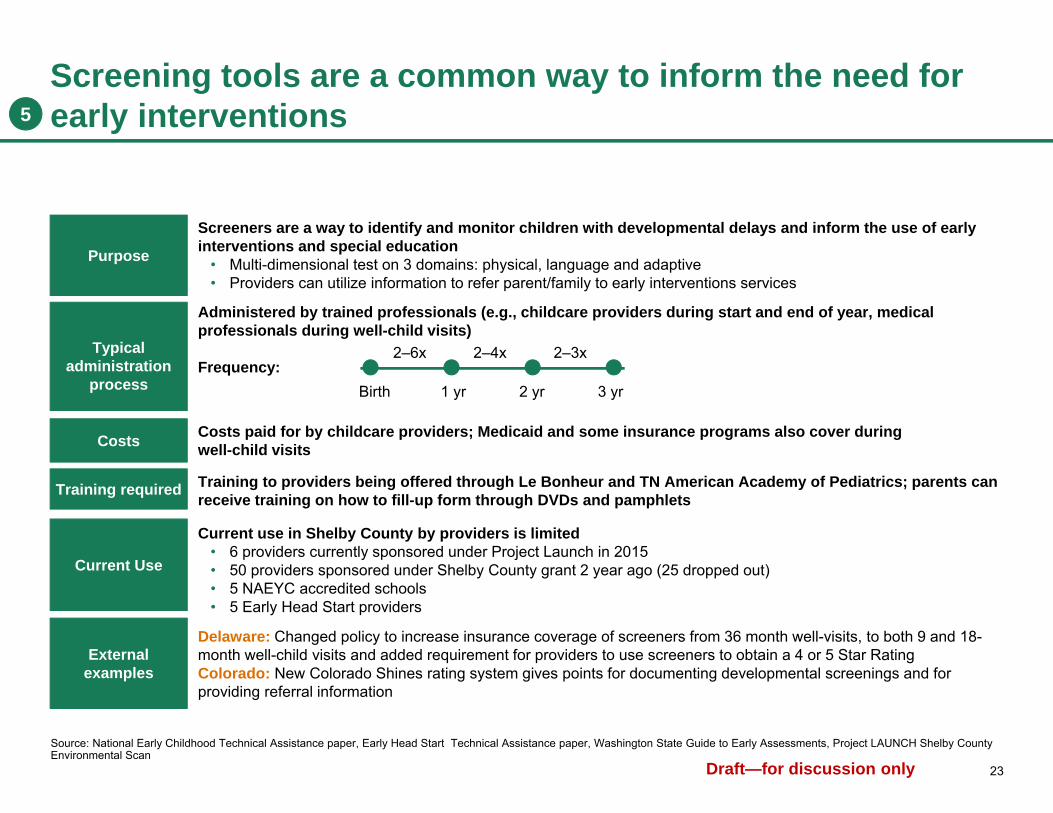
Screening tools are a common way to inform the need for early interventions
Screeners are a way to identify and monitor children with developmental delays and inform the use of early interventions and special education
• Multi-dimensional test on 3 domains: physical, language and adaptive• Providers can utilize information to refer parent/family to early interventions services
Purpose
Source: National Early Childhood Technical Assistance paper, Early Head Start Technical Assistance paper, Washington State Guide to Early Assessments, Project LAUNCH Shelby County Environmental Scan
Typical administration
process
Administered by trained professionals (e.g., childcare providers during start and end of year, medical professionals during well-child visits)
Frequency:
Costs Costs paid for by childcare providers; Medicaid and some insurance programs also cover duringwell-child visits
Training required Training to providers being offered through Le Bonheur and TN American Academy of Pediatrics; parents can receive training on how to fill-up form through DVDs and pamphlets
Current Use
Current use in Shelby County by providers is limited • 6 providers currently sponsored under Project Launch in 2015 • 50 providers sponsored under Shelby County grant 2 year ago (25 dropped out)• 5 NAEYC accredited schools• 5 Early Head Start providers
External examples
Delaware: Changed policy to increase insurance coverage of screeners from 36 month well-visits, to both 9 and 18-month well-child visits and added requirement for providers to use screeners to obtain a 4 or 5 Star RatingColorado: New Colorado Shines rating system gives points for documenting developmental screenings and for providing referral information
Birth 1 yr 2 yr 3 yr
2–6x 2–4x 2–3x
5
24Draft—for discussion only
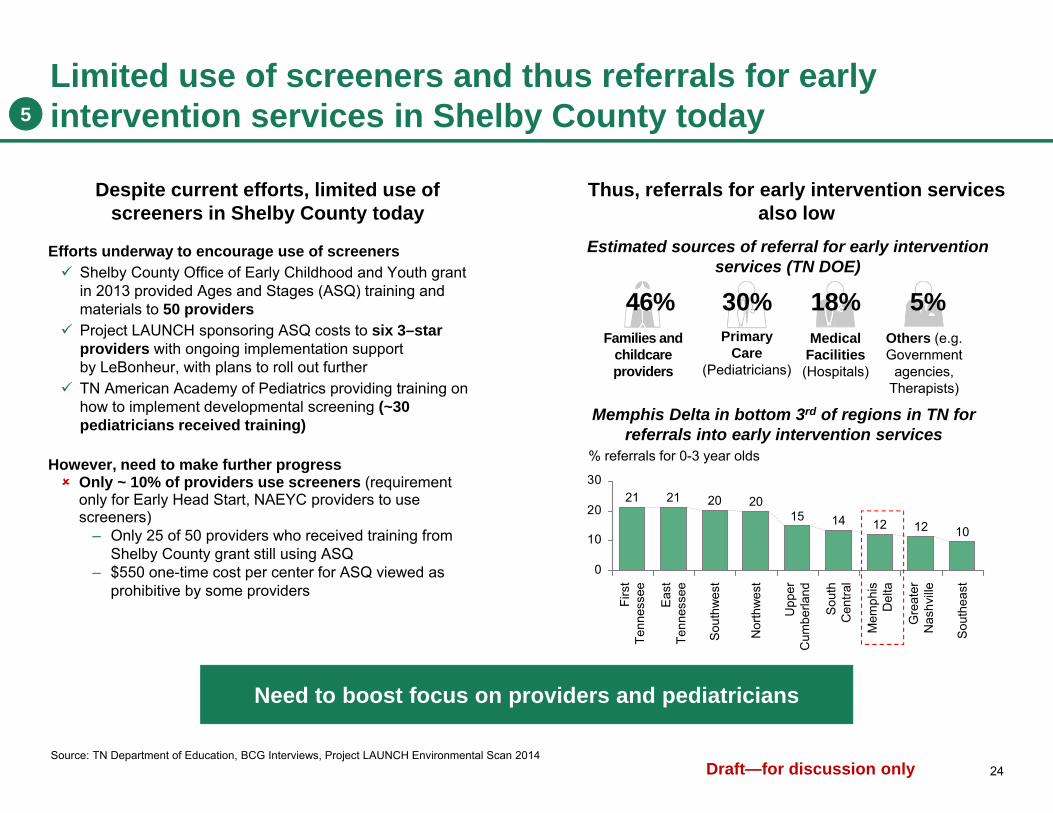
Despite current efforts, limited use of screeners in Shelby County today
Thus, referrals for early intervention services also low
Efforts underway to encourage use of screeners Shelby County Office of Early Childhood and Youth grant
in 2013 provided Ages and Stages (ASQ) training and materials to 50 providers
Project LAUNCH sponsoring ASQ costs to six 3–star providers with ongoing implementation support by LeBonheur, with plans to roll out further
TN American Academy of Pediatrics providing training on how to implement developmental screening (~30 pediatricians received training)
However, need to make further progress Only ~ 10% of providers use screeners (requirement
only for Early Head Start, NAEYC providers to use screeners)
– Only 25 of 50 providers who received training from Shelby County grant still using ASQ
– $550 one-time cost per center for ASQ viewed as prohibitive by some providers
0
10
20
30
142020
Sou
thw
est
Upp
erC
umbe
rland
Nor
thw
est
21
Firs
tTe
nnes
see
2115
Eas
tTe
nnes
see
Sou
thC
entra
l
Gre
ater
Nas
hvill
e
Mem
phis
Del
ta
10
% referrals for 0-3 year olds
Sou
thea
st
1212
Limited use of screeners and thus referrals for early intervention services in Shelby County today
Source: TN Department of Education, BCG Interviews, Project LAUNCH Environmental Scan 2014
Families and childcare providers
Primary Care
(Pediatricians)
Estimated sources of referral for early intervention services (TN DOE)
Medical Facilities(Hospitals)
Others (e.g. Government
agencies, Therapists)
5% 18% 30% 46%
Memphis Delta in bottom 3rd of regions in TN for referrals into early intervention services
Need to boost focus on providers and pediatricians
5
25Draft—for discussion only
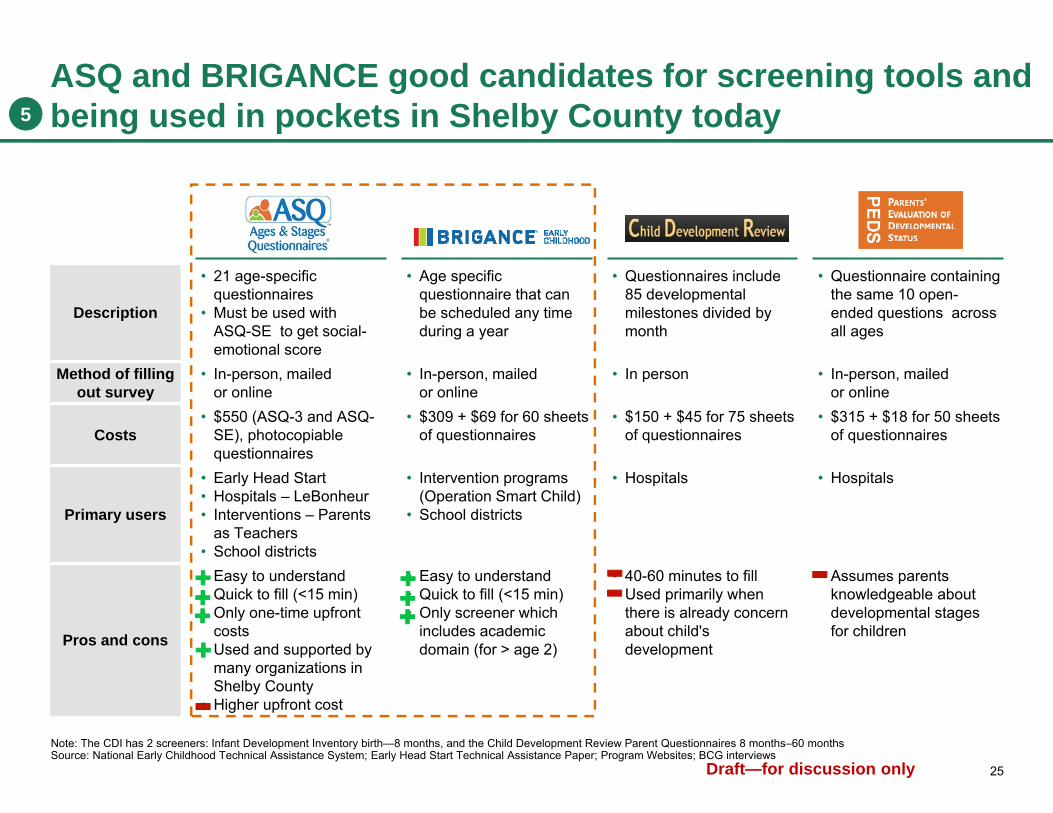
ASQ and BRIGANCE good candidates for screening tools and being used in pockets in Shelby County today
Note: The CDI has 2 screeners: Infant Development Inventory birth—8 months, and the Child Development Review Parent Questionnaires 8 months–60 months Source: National Early Childhood Technical Assistance System; Early Head Start Technical Assistance Paper; Program Websites; BCG interviews
`
Description
• 21 age-specific questionnaires
• Must be used with ASQ-SE to get social-emotional score
• Age specific questionnaire that can be scheduled any time during a year
• Questionnaires include 85 developmental milestones divided by month
• Questionnaire containing the same 10 open-ended questions across all ages
Method of fillingout survey
• In-person, mailed or online
• In-person, mailed or online
• In person • In-person, mailed or online
Costs• $550 (ASQ-3 and ASQ-
SE), photocopiable questionnaires
• $309 + $69 for 60 sheets of questionnaires
• $150 + $45 for 75 sheets of questionnaires
• $315 + $18 for 50 sheets of questionnaires
Primary users
• Early Head Start• Hospitals – LeBonheur• Interventions – Parents
as Teachers• School districts
• Intervention programs (Operation Smart Child)
• School districts
• Hospitals • Hospitals
Pros and cons
• Easy to understand • Quick to fill (<15 min)• Only one-time upfront
costs• Used and supported by
many organizations in Shelby County
• Higher upfront cost
• Easy to understand• Quick to fill (<15 min)• Only screener which
includes academic domain (for > age 2)
• 40-60 minutes to fill • Used primarily when
there is already concern about child's development
• Assumes parents knowledgeable about developmental stages for children
5
26Draft—for discussion only
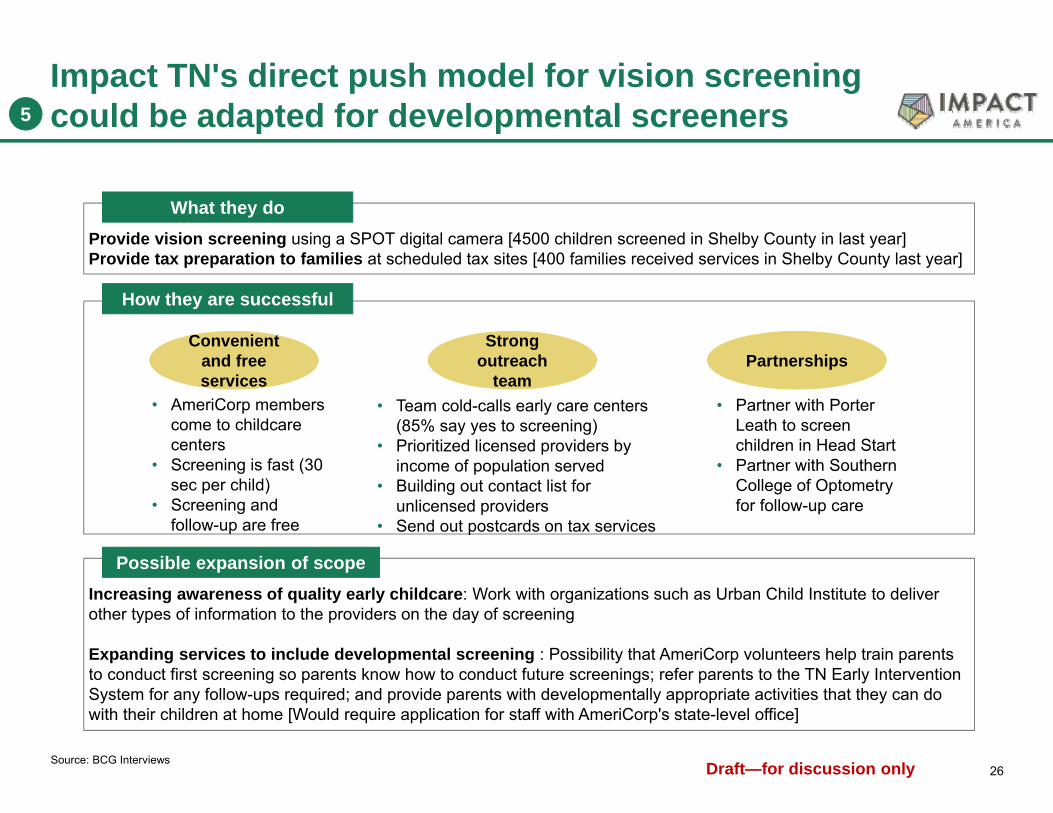
Impact TN's direct push model for vision screening could be adapted for developmental screeners
Provide vision screening using a SPOT digital camera [4500 children screened in Shelby County in last year]Provide tax preparation to families at scheduled tax sites [400 families received services in Shelby County last year]
What they do
How they are successful
Increasing awareness of quality early childcare: Work with organizations such as Urban Child Institute to deliver other types of information to the providers on the day of screening
Expanding services to include developmental screening : Possibility that AmeriCorp volunteers help train parents to conduct first screening so parents know how to conduct future screenings; refer parents to the TN Early Intervention System for any follow-ups required; and provide parents with developmentally appropriate activities that they can do with their children at home [Would require application for staff with AmeriCorp's state-level office]
Possible expansion of scope
Source: BCG Interviews
Convenient and free services
Strong outreach
teamPartnerships
• AmeriCorp members come to childcare centers
• Screening is fast (30 sec per child)
• Screening and follow-up are free
• Team cold-calls early care centers (85% say yes to screening)
• Prioritized licensed providers by income of population served
• Building out contact list for unlicensed providers
• Send out postcards on tax services
• Partner with Porter Leath to screen children in Head Start
• Partner with Southern College of Optometry for follow-up care
5

27Draft—for discussion only
Shelby County also offers variety of home visitation services for families of 0–3 year olds
Evidence based home visitation
Non-Evidence based home
visitation
Family wraparound
services
Healthy Families America
Several e.g., Help Us Grow; One By One; First
Steps; Parent Aide; Operation Smart Child
Family Service Staff(administered
through Porter-Leath)
Parents As Teachers
Nurse-Family Partnership
Description • RN delivered service; more focus on health/medical
• Focus on health issues (e.g., ensure each family has medical provider)
• Support parents to engage children (e.g., role of fathers in child's lives)
• Mentorships and coaching on parenting (e.g., self regulation)
• Provide health screenings, dental services, counseling, etc.
Eligibility• Income• Age of child• Any other
requirements
• Low• Up to 2• First time pregnancy• No later than
28 weeks of pregnancy
• None• Up to 5• Facing challenges
such as single parenthood; childhood history of abuse
• None• Up to 5• Children with
special needs, families at risk for child abuse
• None• Varies• Varies
• Low income• Child up to 3 years• Based on Early
Head Start eligibility
Number of families served
174 145 268 ~370 47
Unfilled capacity - ~25 ~25 - -Estimated cost to serve per family
~$5,0001 $3,800 ~$3,000 Varies ~$1,200
1. Update in cost of Nurse-Family Partnerships to reflect operating costs per family, consistent with costs calculations for the other intervention services.2. Often temporarily due to families transitioning out of the program Source: Program websites, Steering Committee interviews
~1000
502
6

28Draft—for discussion only
Healthy Families AmericaNurse Family Partnerships Parents As Teachers
Scope
Shelby County impact
Research shows a baby's weight at birth is strongly associated with higher math and reading scores from third–eighth grade (0.5lb increase in birth weight is associated with a 0.187 std deviation increase in test scores)
2014/2015 data 2014 data
Other outcomes
tracked
The evidence-based intervention models have shown efficacy locally in Shelby County…
88.285.3
80
90
100
Healthy births > 5.5 lbs (%)
+3% 91.085.3
80
90
100
Healthy births > 5.5 lbs (%)
+7%
2014 data
N = 67 N = 164 N = 255
• 82% of children show improvement in pre and post school readiness assessment
• 98.5% children remained in parent's home without report of abuse of neglect
• 96.1% women delayed pregnancy by at least 1 year
• 84.7% infants born at full-term
• 50% drop in women smoking during pregnancy
• 88% of births were full-term • 92.9% children up to date with
immunizations at 12 months• 88.5% women delayed
pregnancy by at least one year
Note: ESC Benchmark is based on African-American births over 5.5 lbs in Shelby County Source: Urban Child Institute; Memphis Data Partners; Institute of Policy Research; Northwestern University
86.785.3
80
90
100
Healthy births > 5.5 lbs (%)
+2%
Serve 174 low-income women at an operating costs/family ~$5,000
Serve 145 families at risk of abuse at an operating costs/family ~$3,000
Serve 268 low-income families at an operating cost of ~ $3,000
Program participants ESC benchmark
6
29Draft—for discussion only
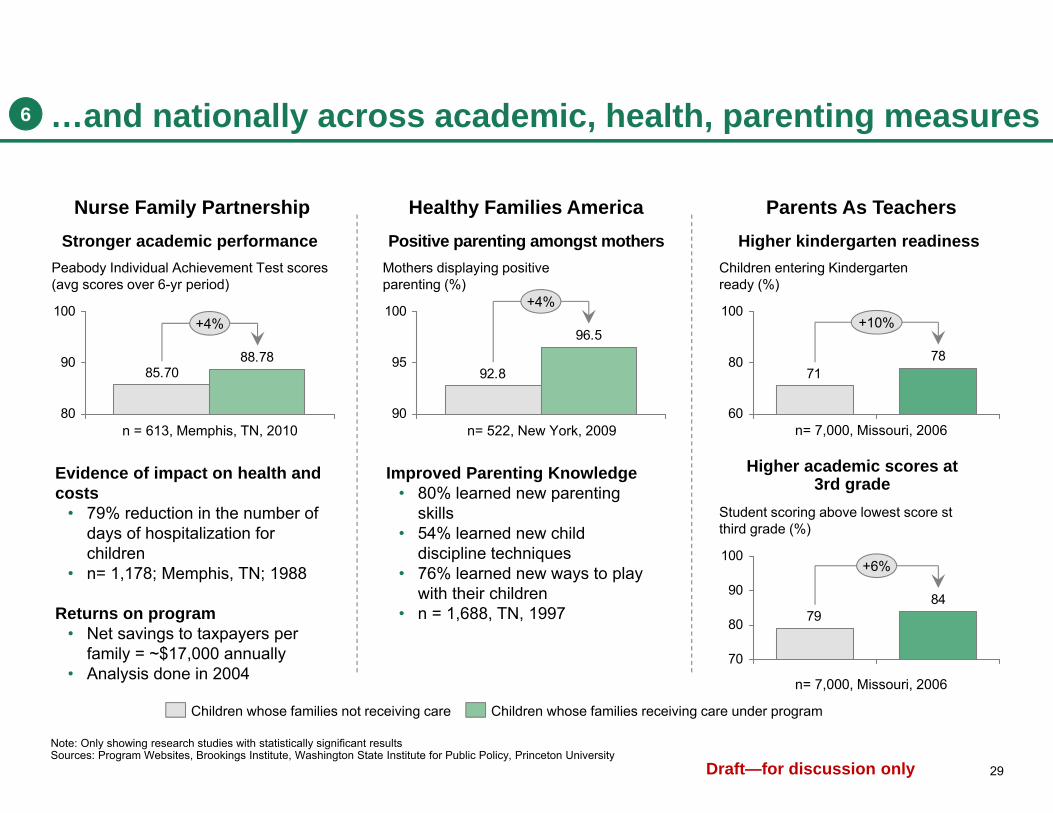
Nurse Family Partnership Healthy Families America Parents As Teachers
85.7088.78
80
90
100
Peabody Individual Achievement Test scores (avg scores over 6-yr period)
+4%
7871
60
80
100
Children entering Kindergarten ready (%)
+10%
92.8
96.5
90
95
100
Mothers displaying positive parenting (%)
+4%
n= 7,000, Missouri, 2006
8479
70
80
90
100
Student scoring above lowest score st third grade (%)
+6%
Evidence of impact on health and costs
• 79% reduction in the number of days of hospitalization for children
• n= 1,178; Memphis, TN; 1988
Returns on program • Net savings to taxpayers per
family = ~$17,000 annually• Analysis done in 2004
Improved Parenting Knowledge • 80% learned new parenting
skills• 54% learned new child
discipline techniques• 76% learned new ways to play
with their children• n = 1,688, TN, 1997
Higher academic scores at 3rd grade
Children whose families receiving care under programChildren whose families not receiving care
Note: Only showing research studies with statistically significant results Sources: Program Websites, Brookings Institute, Washington State Institute for Public Policy, Princeton University
n = 613, Memphis, TN, 2010 n= 522, New York, 2009
Stronger academic performance Positive parenting amongst mothers Higher kindergarten readiness
…and nationally across academic, health, parenting measures
n= 7,000, Missouri, 2006
6
30Draft—for discussion only
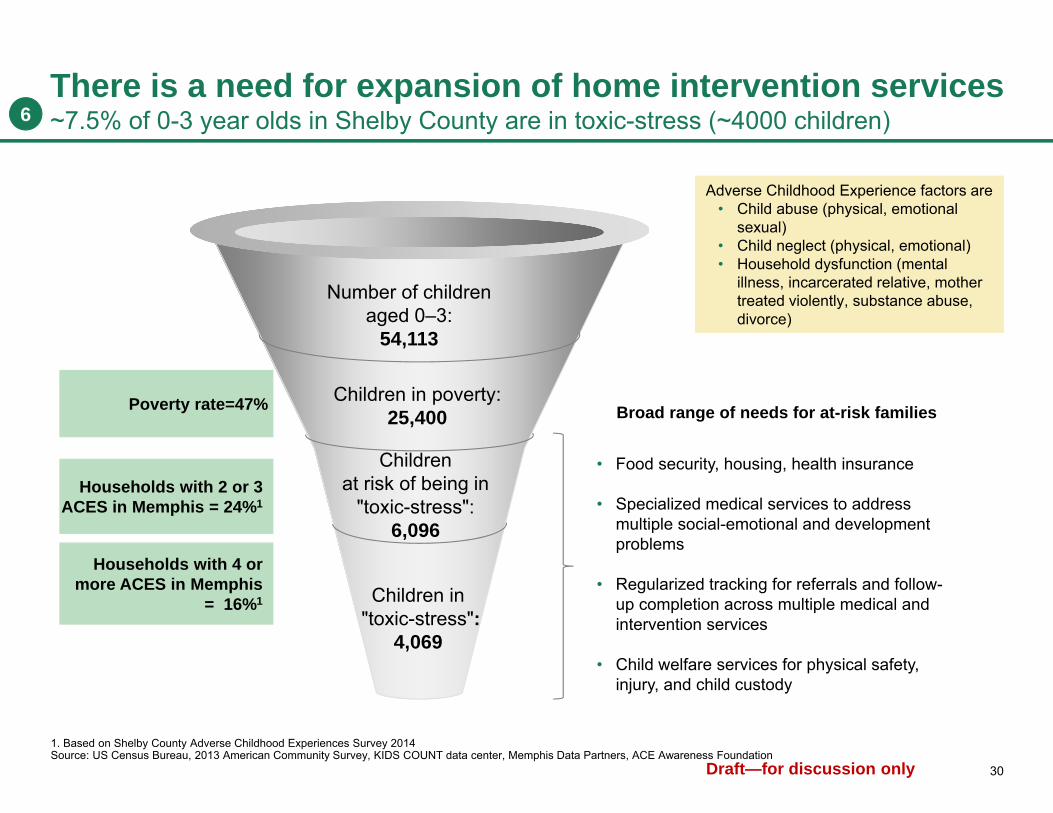
There is a need for expansion of home intervention services~7.5% of 0-3 year olds in Shelby County are in toxic-stress (~4000 children)
Number of children aged 0–3:
54,113
Children in poverty:25,400
Childrenat risk of being in
"toxic-stress":6,096
Children in"toxic-stress":
4,069
Poverty rate=47%
Households with 2 or 3ACES in Memphis = 24%1
Households with 4 or more ACES in Memphis
= 16%1
1. Based on Shelby County Adverse Childhood Experiences Survey 2014Source: US Census Bureau, 2013 American Community Survey, KIDS COUNT data center, Memphis Data Partners, ACE Awareness Foundation
• Food security, housing, health insurance
• Specialized medical services to address multiple social-emotional and development problems
• Regularized tracking for referrals and follow-up completion across multiple medical and intervention services
• Child welfare services for physical safety, injury, and child custody
Broad range of needs for at-risk families
Adverse Childhood Experience factors are • Child abuse (physical, emotional
sexual)• Child neglect (physical, emotional) • Household dysfunction (mental
illness, incarcerated relative, mother treated violently, substance abuse, divorce)
6

31Draft—for discussion only
22
25
13
12
19
30
18
11
16
29
19
7
0 10 20 30
Violencebetween
adults
Substanceabuse in
household
Metal illnessin household
Incarceratedhousehold
member
(%)
5 state ACE study (Arkansas, Louisiana, New Mexico, Washington, Tennessee )
TennesseeShelby country
20
23
14
11
25
14
12
26
15
0 10 20 30 (%)
Sexualabuse
Enotionalabuse
Physicalabuse
Source: Adverse Child hood Experiences in Shelby County publication, November 2014
What is an Adverse Childhood Experience factor? Results from Shelby County ACE Survey
The leading child abuse ACE in Shelby County is emotional abuse
The leading household dysfunction ACE in Shelby County
is substance abuseAbuse NeglectHousehold dysfunction
PhysicalPhysical Mental illness
Incarce-rated
relative
EmotionalEmotional Mother treated
violently
Substancerelative
Sexual Divorce
The three categories of ACEs include
6 Understanding the primary ACES factors in Shelby County
Backup
32Draft—for discussion only
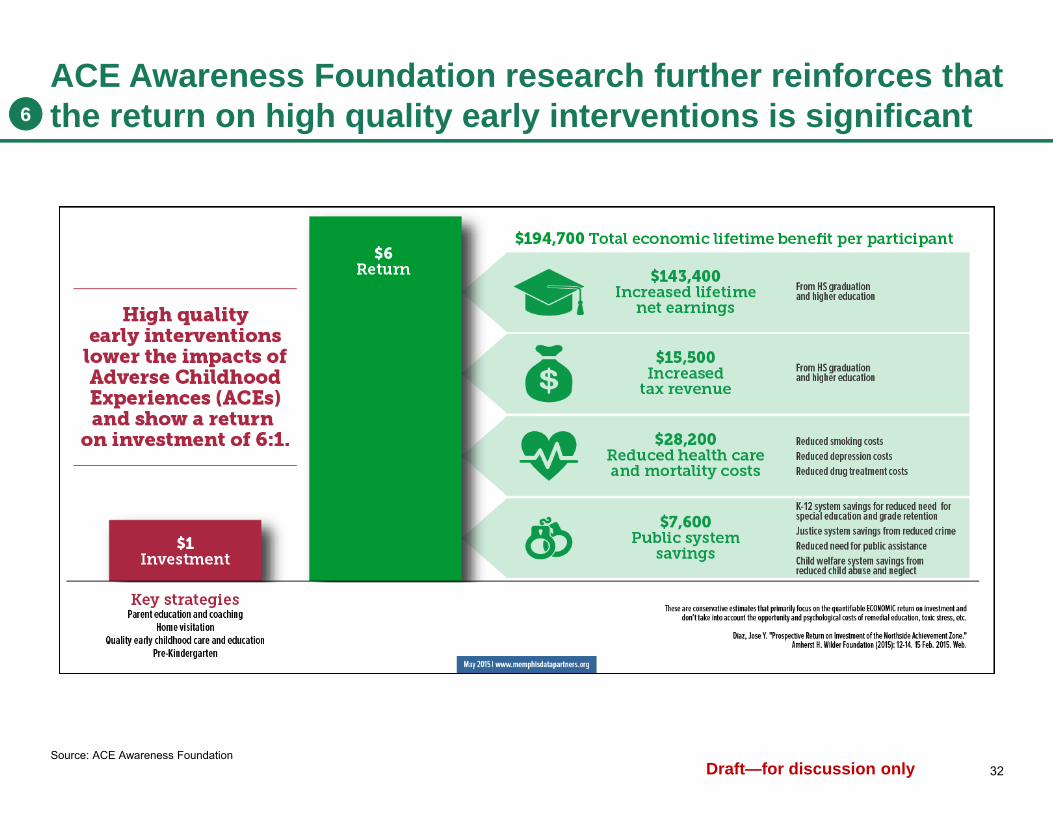
ACE Awareness Foundation research further reinforces that the return on high quality early interventions is significant
Source: ACE Awareness Foundation
6
33Draft—for discussion only
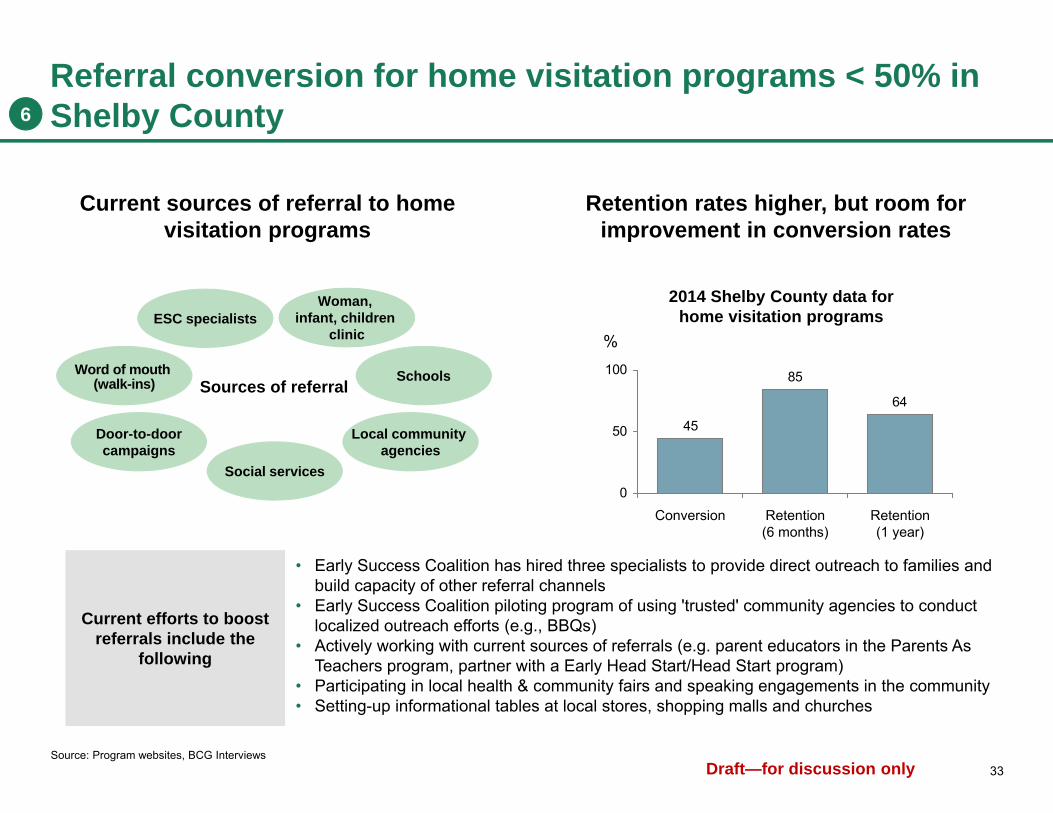
Referral conversion for home visitation programs < 50% in Shelby County
Current sources of referral to home visitation programs
Retention rates higher, but room for improvement in conversion rates
Social services
Sources of referral
ESC specialists Socail
Schools
Door-to-doorcampaigns
Word of mouth (walk-ins)
Local community agencies
• Early Success Coalition has hired three specialists to provide direct outreach to families and build capacity of other referral channels
• Early Success Coalition piloting program of using 'trusted' community agencies to conduct localized outreach efforts (e.g., BBQs)
• Actively working with current sources of referrals (e.g. parent educators in the Parents As Teachers program, partner with a Early Head Start/Head Start program)
• Participating in local health & community fairs and speaking engagements in the community• Setting-up informational tables at local stores, shopping malls and churches
Source: Program websites, BCG Interviews
64
85
45
0
50
100
Retention (6 months)
%
Retention (1 year)
Conversion
Woman, infant, children
clinic
2014 Shelby County data for home visitation programs
Current efforts to boost referrals include the
following
6

34Draft—for discussion only
What more can be done to boost referrals conversion to home visitation programs?
Transient families • Focus efforts at public facilities used by lower-income neighborhoods (e.g., "Wash Time is Talk
Time" awareness drive at Laundromats)• Collaborate with homeless assistance system to identify families in need
Lack of access to child vouchers
• Build awareness about non-voucher-based services• Provide support/referral services to employment agencies• Develop engagement strategy via mobile/social media (e.g., Healthy Kids Healthy Ozarks
manages a Facebook page where they regularly post general education pieces and information about community gatherings)
Distrust of service providers
• Develop a map of community "assets"/trusted people and collaborate with them, using them • as references • Use "local champion" who have used the services and can share back experiences with
the community
Stigma associated with using services
• Conduct focus group on language/messaging of outreach services e.g., consider messages that have the concepts of "support" or "partnership" instead of "coach"
• Conduct publicity campaign emphasizing support nature of services (e.g., "Love that Baby" Family Visiting Campaign where families inform how program helped them be the best parents they could be)
Unable to see value of services
• Providing evidence of services by linking past users/"local champions" with potential clients• Give families some flexibility to guide the interaction/tailor curriculum to each family’s needs
and address their most urgent concerns (e.g. facing eviction) before parenting
Possible barriers Targeted strategies to address possible barriers
Lack of connection with service provider
• Customize matching of service providers to potential clients who shared similar background and/or display of connection to experiences
Source: PEW charitable trusts home visitation survey May 2015, BCG analysis
6
35Draft—for discussion only
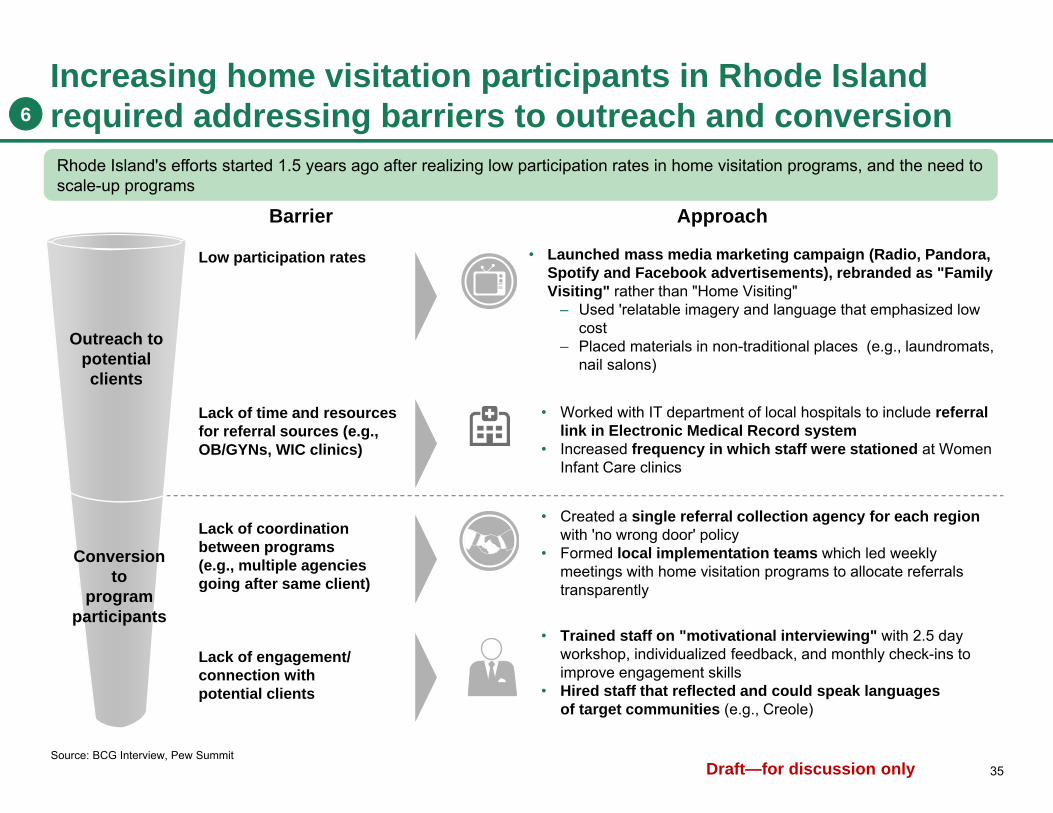
Increasing home visitation participants in Rhode Island required addressing barriers to outreach and conversion
Source: BCG Interview, Pew Summit
• Worked with IT department of local hospitals to include referral link in Electronic Medical Record system
• Increased frequency in which staff were stationed at Women Infant Care clinics
Lack of time and resources for referral sources (e.g., OB/GYNs, WIC clinics)
Low participation rates • Launched mass media marketing campaign (Radio, Pandora, Spotify and Facebook advertisements), rebranded as "Family Visiting" rather than "Home Visiting"
– Used 'relatable imagery and language that emphasized low cost
– Placed materials in non-traditional places (e.g., laundromats, nail salons)
• Created a single referral collection agency for each regionwith 'no wrong door' policy
• Formed local implementation teams which led weekly meetings with home visitation programs to allocate referrals transparently
Lack of coordination between programs (e.g., multiple agencies going after same client)
• Trained staff on "motivational interviewing" with 2.5 day workshop, individualized feedback, and monthly check-ins to improve engagement skills
• Hired staff that reflected and could speak languages of target communities (e.g., Creole)
Lack of engagement/connection with potential clients
Outreach to potential clients
Conversion to
program participants
Barrier Approach
Rhode Island's efforts started 1.5 years ago after realizing low participation rates in home visitation programs, and the need to scale-up programs
6
36Draft—for discussion only
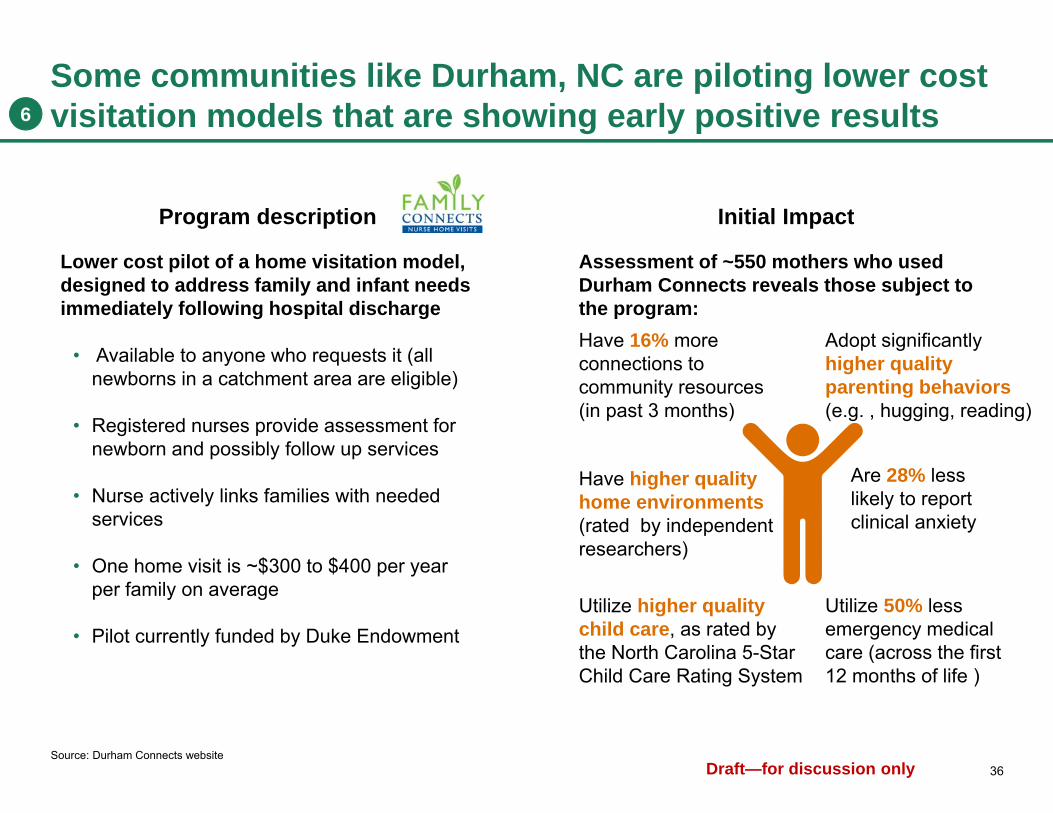
Some communities like Durham, NC are piloting lower cost visitation models that are showing early positive results
Program description
Lower cost pilot of a home visitation model, designed to address family and infant needs immediately following hospital discharge
• Available to anyone who requests it (all newborns in a catchment area are eligible)
• Registered nurses provide assessment for newborn and possibly follow up services
• Nurse actively links families with needed services
• One home visit is ~$300 to $400 per year per family on average
• Pilot currently funded by Duke Endowment
Initial Impact
Assessment of ~550 mothers who used Durham Connects reveals those subject to the program:Have 16% moreconnections to community resources(in past 3 months)
Are 28% less likely to report clinical anxiety
Utilize higher quality child care, as rated by the North Carolina 5-Star Child Care Rating System
Adopt significantly higher quality parenting behaviors(e.g. , hugging, reading)
Have higher quality home environments(rated by independent researchers)
Utilize 50% less emergency medical care (across the first 12 months of life )
6
Source: Durham Connects website
37Draft—for discussion only
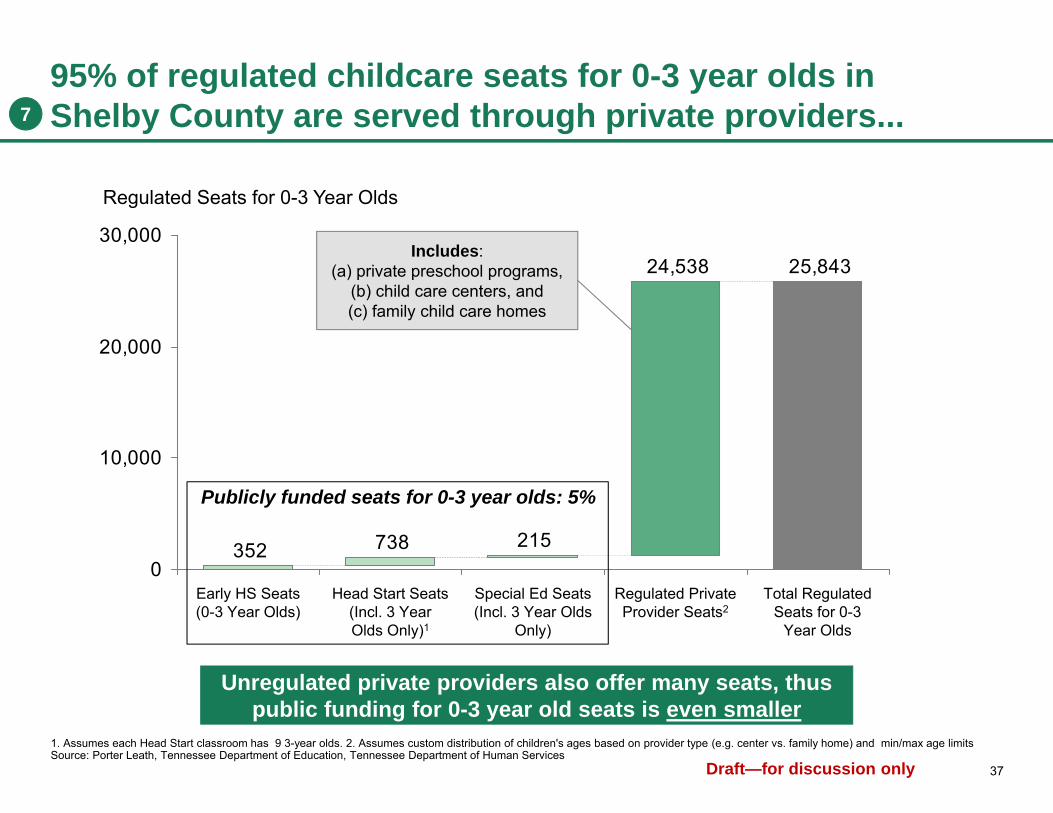
95% of regulated childcare seats for 0-3 year olds in Shelby County are served through private providers...
25,84324,538
2157383520
10,000
20,000
30,000
Regulated Seats for 0-3 Year Olds
Early HS Seats (0-3 Year Olds)
Special Ed Seats(Incl. 3 Year Olds
Only)
Regulated Private Provider Seats2
Total Regulated Seats for 0-3
Year Olds
Head Start Seats (Incl. 3 Year Olds Only)1
Publicly funded seats for 0-3 year olds: 5%
Unregulated private providers also offer many seats, thus public funding for 0-3 year old seats is even smaller
Includes: (a) private preschool programs,
(b) child care centers, and (c) family child care homes
1. Assumes each Head Start classroom has 9 3-year olds. 2. Assumes custom distribution of children's ages based on provider type (e.g. center vs. family home) and min/max age limitsSource: Porter Leath, Tennessee Department of Education, Tennessee Department of Human Services
7
38Draft—for discussion only
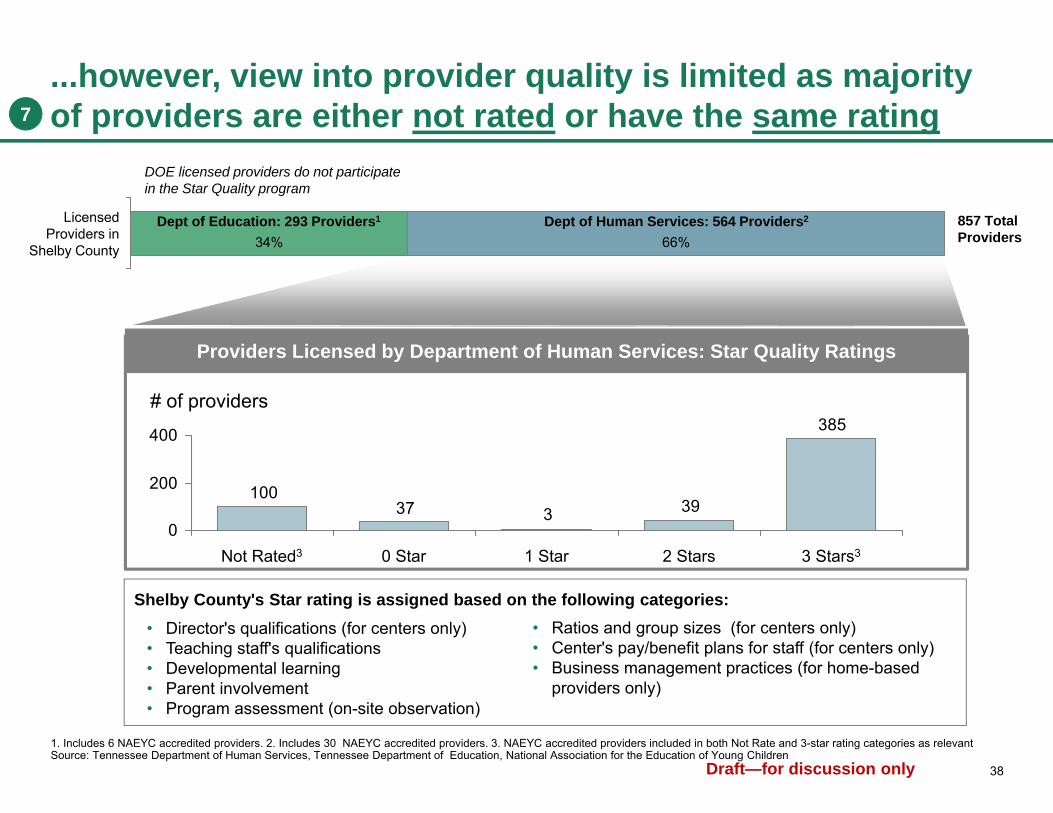
...however, view into provider quality is limited as majority of providers are either not rated or have the same rating
LicensedProviders in
Shelby County 34% 66%
DOE licensed providers do not participatein the Star Quality program
385
39337100
0
200
400
# of providers
3 Stars32 Stars1 Star0 StarNot Rated3
Providers Licensed by Department of Human Services: Star Quality Ratings
857 Total Providers
Dept of Human Services: 564 Providers2Dept of Education: 293 Providers1
1. Includes 6 NAEYC accredited providers. 2. Includes 30 NAEYC accredited providers. 3. NAEYC accredited providers included in both Not Rate and 3-star rating categories as relevantSource: Tennessee Department of Human Services, Tennessee Department of Education, National Association for the Education of Young Children
Shelby County's Star rating is assigned based on the following categories:• Ratios and group sizes (for centers only)• Center's pay/benefit plans for staff (for centers only)• Business management practices (for home-based
providers only)
• Director's qualifications (for centers only)• Teaching staff's qualifications• Developmental learning• Parent involvement• Program assessment (on-site observation)
7
39Draft—for discussion only
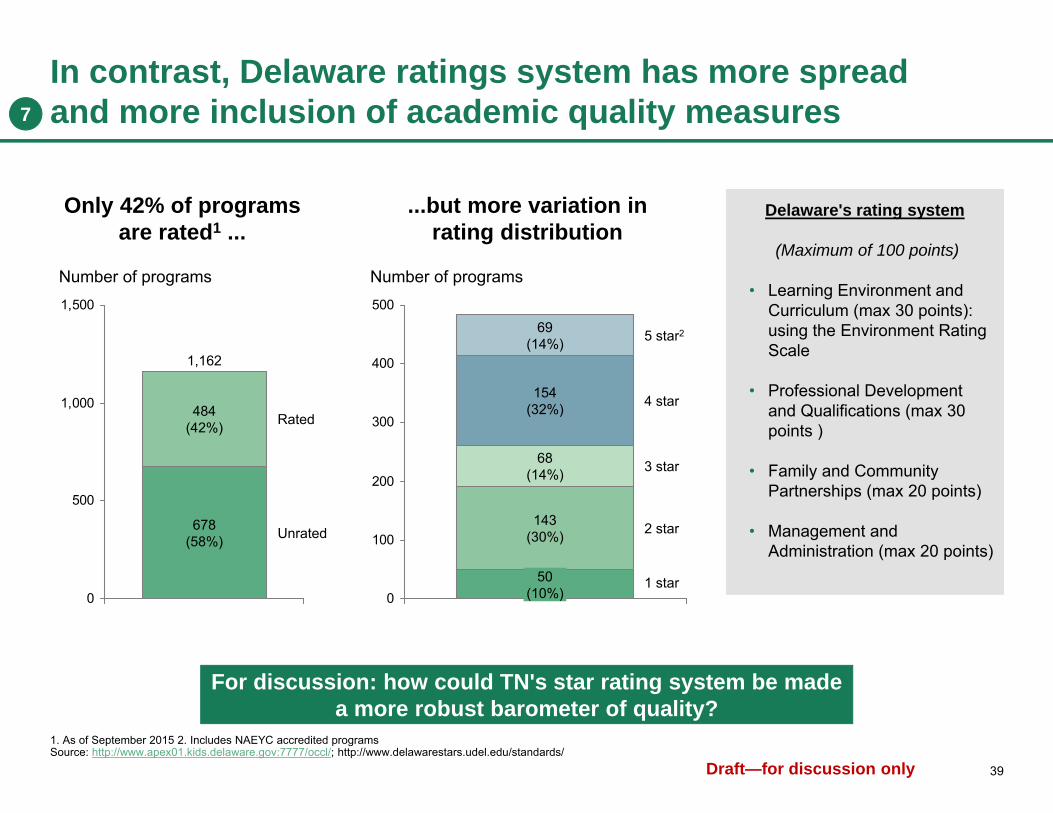
In contrast, Delaware ratings system has more spread and more inclusion of academic quality measures
1. As of September 2015 2. Includes NAEYC accredited programs Source: http://www.apex01.kids.delaware.gov:7777/occl/; http://www.delawarestars.udel.edu/standards/
Only 42% of programs are rated1 ...
...but more variation in rating distribution
0
500
1,000
1,500
678(58%)
Number of programs
1,162
Rated
Unrated
484(42%)
0
100
200
300
400
500
Number of programs
3 star
4 star
5 star2
2 star
154(32%)
1 star50(10%)
68(14%)
143(30%)
69(14%)
Delaware's rating system
(Maximum of 100 points)
• Learning Environment and Curriculum (max 30 points): using the Environment Rating Scale
• Professional Development and Qualifications (max 30 points )
• Family and Community Partnerships (max 20 points)
• Management and Administration (max 20 points)
For discussion: how could TN's star rating system be made a more robust barometer of quality?
7
40Draft—for discussion only
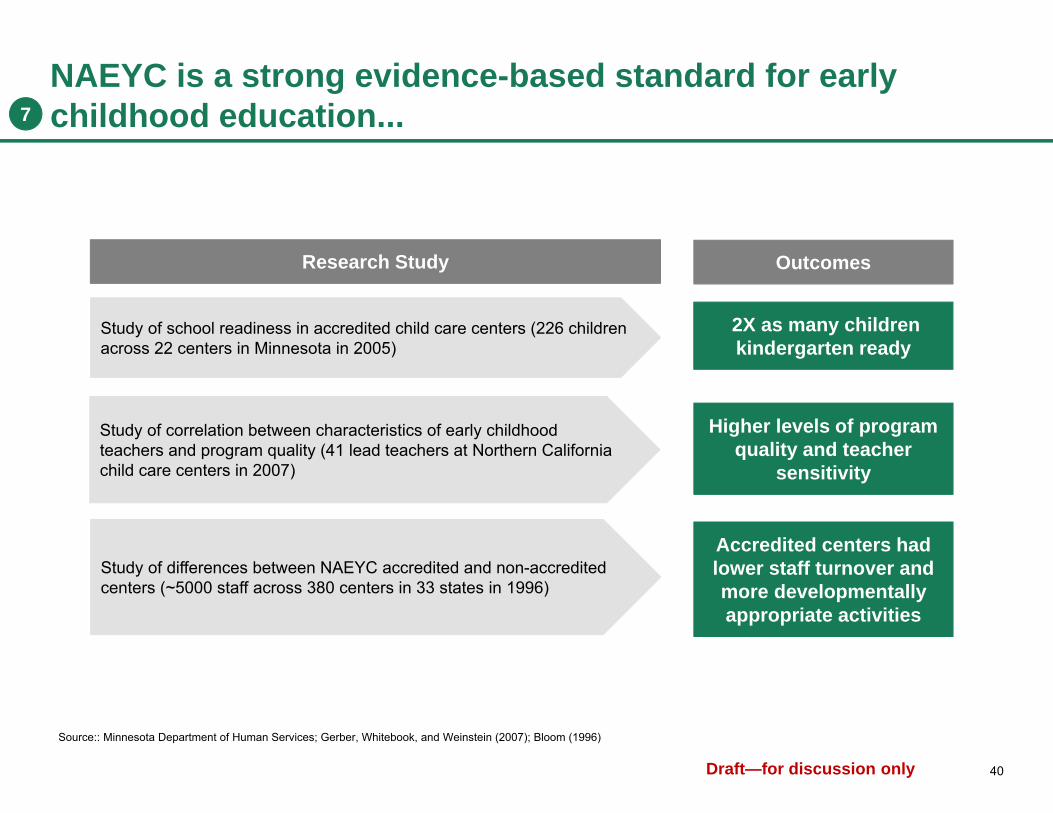
NAEYC is a strong evidence-based standard for early childhood education...
Outcomes
2X as many children kindergarten ready
Higher levels of program quality and teacher
sensitivity
Accredited centers had lower staff turnover and more developmentally appropriate activities
Source:: Minnesota Department of Human Services; Gerber, Whitebook, and Weinstein (2007); Bloom (1996)
Study of differences between NAEYC accredited and non-accredited centers (~5000 staff across 380 centers in 33 states in 1996)
Research Study
Study of correlation between characteristics of early childhood teachers and program quality (41 lead teachers at Northern California child care centers in 2007)
Study of school readiness in accredited child care centers (226 children across 22 centers in Minnesota in 2005)
7
41Draft—for discussion only
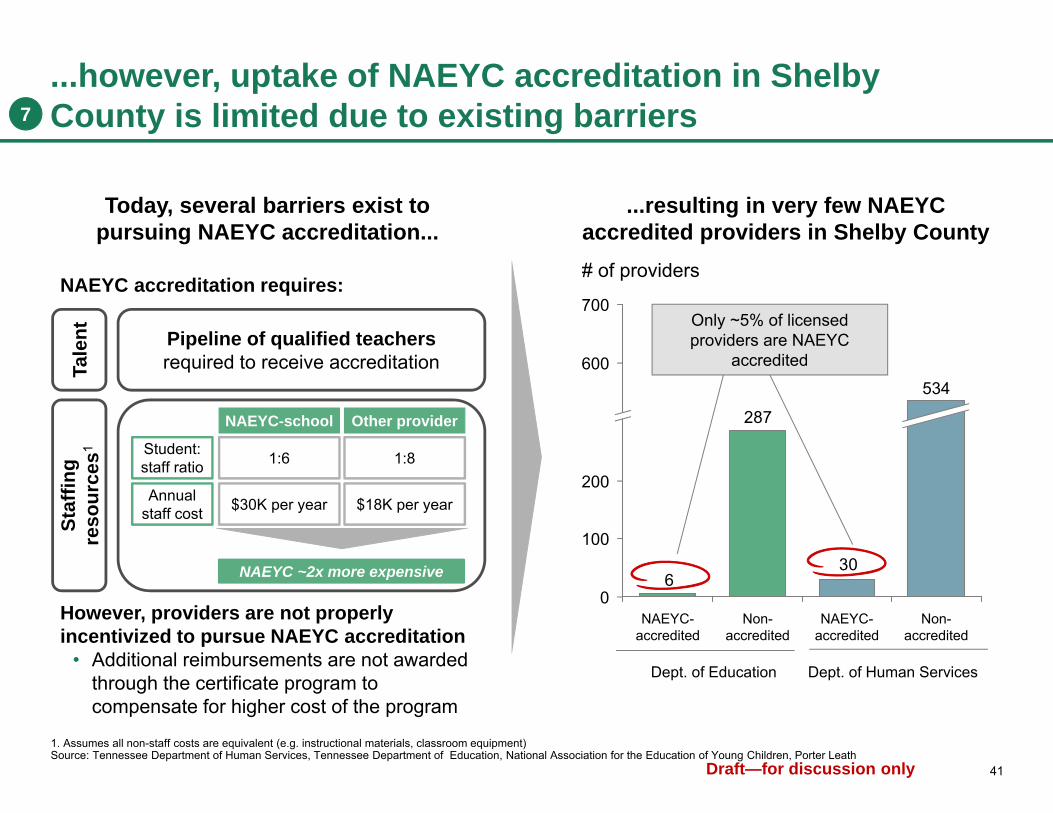
...however, uptake of NAEYC accreditation in Shelby County is limited due to existing barriers
Today, several barriers exist to pursuing NAEYC accreditation...
NAEYC accreditation requires:
However, providers are not properly incentivized to pursue NAEYC accreditation
• Additional reimbursements are not awarded through the certificate program to compensate for higher cost of the program
...resulting in very few NAEYC accredited providers in Shelby County
Tale
ntSt
affin
g re
sour
ces1
Pipeline of qualified teachers required to receive accreditation
NAEYC-school Other provider
Student:staff ratio
Annual staff cost
1:6
$30K per year
1:8
$18K per year
NAEYC ~2x more expensive 30
287
6
100
600
700
200
0
534
NAEYC-accredited
NAEYC-accredited
Non-accredited
Non-accredited
# of providers
Dept. of Education Dept. of Human Services
1. Assumes all non-staff costs are equivalent (e.g. instructional materials, classroom equipment) Source: Tennessee Department of Human Services, Tennessee Department of Education, National Association for the Education of Young Children, Porter Leath
Only ~5% of licensed providers are NAEYC
accredited
7
42Draft—for discussion only
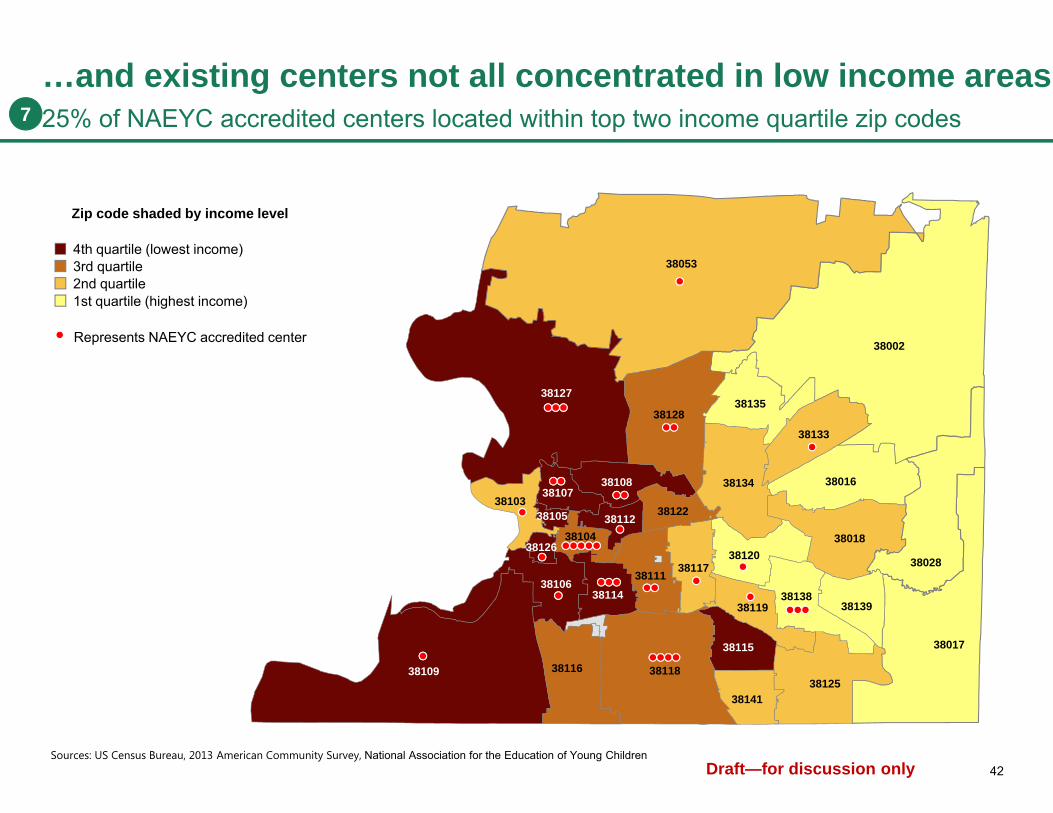
…and existing centers not all concentrated in low income areas25% of NAEYC accredited centers located within top two income quartile zip codes
38002
38016
38017
38018
38028
38053
38103
38104
38105
38106
3810738108
38109
38111
38112
38114
38115
38116
38117
38118
38119
38120
38122
38125
38126
38127
38128
38133
38134
38135
3813838139
38141
1st quartile (highest income)2nd quartile3rd quartile4th quartile (lowest income)
Zip code shaded by income level
Represents NAEYC accredited center
7
Sources: US Census Bureau, 2013 American Community Survey, National Association for the Education of Young Children

43Draft—for discussion only
Room for improvement in TN QRIS system relative particularly related to strengthening standards and supports
Delaware Stars Tennessee Stars
Strengtheningrating
standards
Assistanceto incentadoptionamong
providers
Growingawareness
amongparents and community
Provider assessment
and reimbursement
• No specification of approved curriculum
• No requirements or mention of use of screeners
• No specification on the use of approved assessments
• Environment Rating Scale assessment for learning environment as requirement
• Providers receive tiered reimbursement based on star-levels
• Childcare Resource and Referral Center, TN Childcare Training Alliance, and TopStar Mentoring Programming support training
• TECTA grant available for CDA tuition assistance
• Limited funding for technology and equipment (used to be available under TSAM grant)
• Social media and email communications via Kids Central TN website
• Part of Books to Birth literacy campaign
• Childcare Resource and Referral Center running family engagement at DHS District Office and via telephone
Evidence-based curricula
Widespread use of screeners
Formative assessments
Assessment approach
Tiered reimbursement
Technical assistance
PD support
Technology and equipment
Self campaigns
Partnerships
Grassroots
Potential shortfalls are marked with
• Providers only allowed to use 8 approved curriculum
• Requirement for 4 or 5 star programs to use screeners (e.g., ASQ)
• Assessment such as Teaching Strategies Gold available at a discounted rate
• Environment Rating Scale assessment for learning environment as requirement
• Providers receive tiered reimbursement base on star-levels, with eventual plans to make min 3 star a necessity to receive any funding
• Technical assistants assist in on-boarding process and creating a Quality Improvement Plan
• Funding for TECE certification, B.A in early education, and other higher level certifications
• Carved out funding for iPads (Techonlogy fund), playgrounds, refurbishments, etc.
• Partnership with other campaigns such as Grade Level Reading, First Book
• Local readiness team run by hundreds of volunteers (including parent groups) reach out to local childcare providers within their neighborhoods
• Delaware Stars runs own campaign. Present at every education community event.
Source: BCG Interviews, program websites
7

44Draft—for discussion only
Current efforts and considerationsto improve QRIS Potential challenges
• Currently TopStar mentoring program runs voluntary training program for family-run centers. Will need for more deliberate initiative to encourage centers to meet heightened standards
Fiscal constraints• Limited budget with little flexibility to offer
financial incentives without outside funds • Have to seek ways to improve standards in
tight fiscal environment
Compelling participation in training• Need for incentives to encourage providers
to receive training through TN Early Childhood Training Alliance (currently estimate only ~30% of providers in TN participate in training)
Local and state efforts have been underway in attempts to improve the QRIS in Tennessee
Pushback from providers • Estimate that two-thirds of providers do not
want to see changes to the Star-Rating System (based on state survey)
TN Department of Human Services running information sessions with parents and providers to better understand their needs to inform changes to the QRIS system
The state if considering the following changes to QRIS:
Modifying method of state program assessments to improve quality control by moving from scheduled to unannounced inspections
Considering enhancements to observation rubric from ECERS to the CLASS assessment to get a better view into the interactions between children and providers
PeopleFirst and Chamber Chairman's Circle have been pursuing effort over past several years to improve robustness of QRIS system
Source: BCG Interview
The plan is for the review to be completed by 2016, with implementation in 2017
Stat
e-le
vel
Shel
by
Cou
nty
7
45Draft—for discussion only
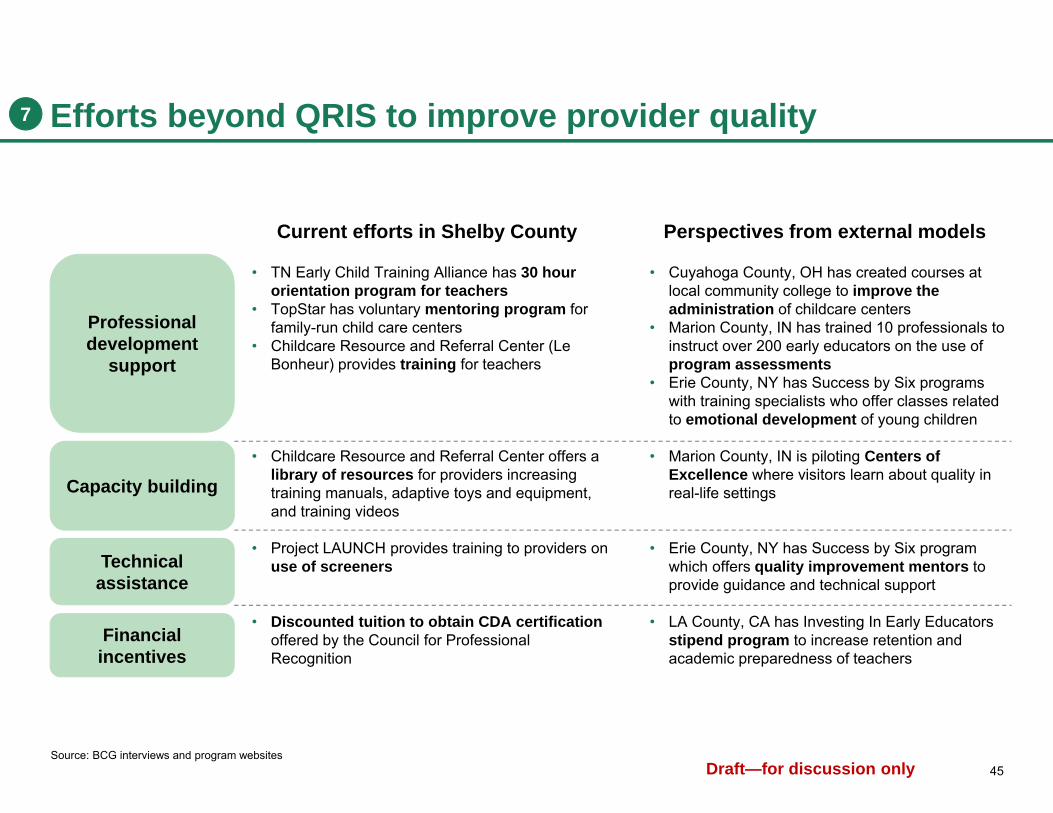
Efforts beyond QRIS to improve provider quality
Professional development
support
Financial incentives
Technical assistance
Capacity building
Current efforts in Shelby County
• TN Early Child Training Alliance has 30 hour orientation program for teachers
• TopStar has voluntary mentoring program for family-run child care centers
• Childcare Resource and Referral Center (Le Bonheur) provides training for teachers
• Childcare Resource and Referral Center offers a library of resources for providers increasing training manuals, adaptive toys and equipment, and training videos
• Project LAUNCH provides training to providers on use of screeners
• Discounted tuition to obtain CDA certification offered by the Council for Professional Recognition
Perspectives from external models
• Cuyahoga County, OH has created courses at local community college to improve the administration of childcare centers
• Marion County, IN has trained 10 professionals to instruct over 200 early educators on the use of program assessments
• Erie County, NY has Success by Six programs with training specialists who offer classes related to emotional development of young children
• Marion County, IN is piloting Centers of Excellence where visitors learn about quality in real-life settings
• Erie County, NY has Success by Six program which offers quality improvement mentors to provide guidance and technical support
• LA County, CA has Investing In Early Educators stipend program to increase retention and academic preparedness of teachers
Source: BCG interviews and program websites
7

46Draft—for discussion only
Licensure requirements should incorporate standards of quality; monitor outcomes to establish scope of licensure
Learnings from research
Licensure can help ensure basic levels of health and safety, and can lead to improved student outcomes (lower student: teacher ratio led to positive impacts on learning quality in the Perry Preschool research)
However, gains are dependent on how quality standards are incorporated into licensure requirements (e.g., 1-3 star licensed programs showed no gains over unlicensed centers in New Mexico in a 2014 study)
Implications for Shelby County
Incorporate standards of quality into licensure requirements in TN and also improve supports to unlicensed centers (e.g., through Alternate Approval Homes)
Establish a five year longitudinal studyto evaluate the kindergarten readiness of children who are in licensed vs. unlicensed centers
If licensed pathway leads to children being more K-ready, mandate that all publically funded early childcare providers have to be licensed over time
Should licensure be
made mandatory?
Source: BCG Interviews, Childtrends, QRIS Compendium
7
47Draft—for discussion only
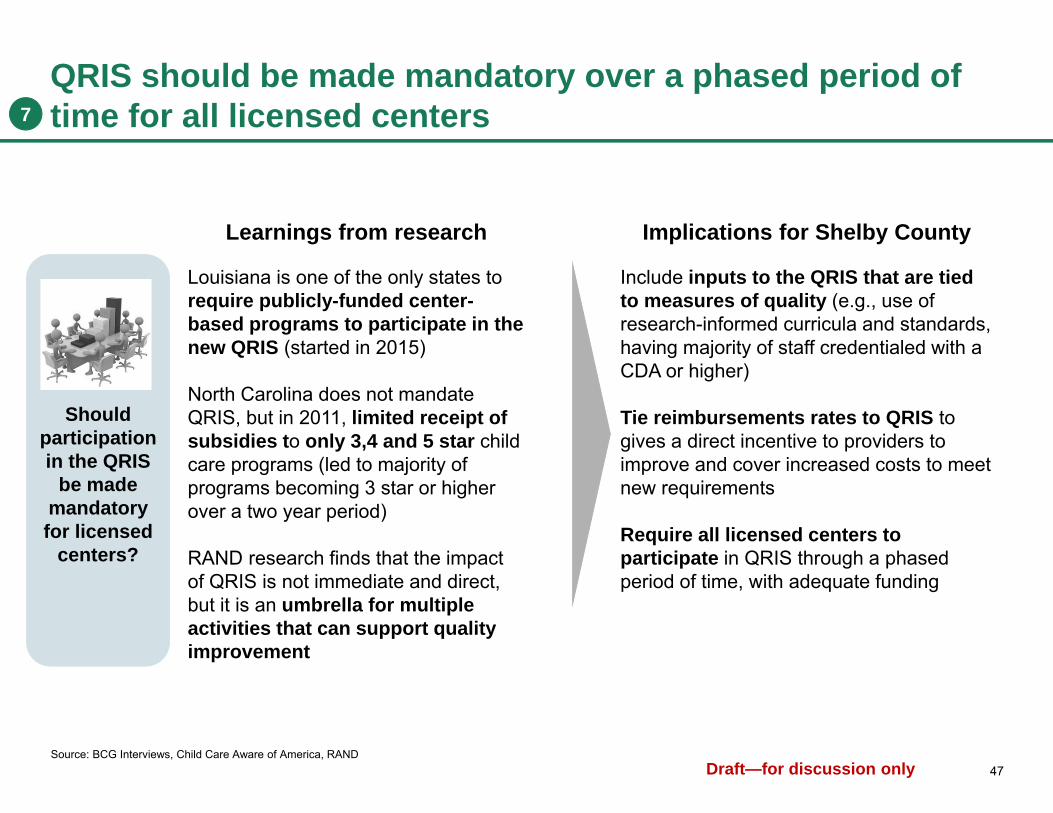
QRIS should be made mandatory over a phased period of time for all licensed centers
Learnings from research
Louisiana is one of the only states to require publicly-funded center-based programs to participate in the new QRIS (started in 2015)
North Carolina does not mandate QRIS, but in 2011, limited receipt of subsidies to only 3,4 and 5 star child care programs (led to majority of programs becoming 3 star or higher over a two year period)
RAND research finds that the impact of QRIS is not immediate and direct, but it is an umbrella for multiple activities that can support quality improvement
Implications for Shelby County
Include inputs to the QRIS that are tied to measures of quality (e.g., use of research-informed curricula and standards, having majority of staff credentialed with a CDA or higher)
Tie reimbursements rates to QRIS to gives a direct incentive to providers to improve and cover increased costs to meet new requirements
Require all licensed centers to participate in QRIS through a phased period of time, with adequate funding
Should participation in the QRIS
be made mandatory for licensed
centers?
Source: BCG Interviews, Child Care Aware of America, RAND
7

48Draft—for discussion only
Early care reimbursement rates by stateComparison states have more star ratings and associated reimbursements than TN
0 star
1 star
2 star
3 star
4 star
5 star
Tennessee
100%
105%
115%
120%
-
-
Delaware
100%
100%
100%
123%
143%
156%
Michigan
100%
100%
107%
113%
120%
126%
Texas
100%
100%
105%
114%
116%
Source: State websites
Note: For ease of comparison, the reimbursement rates for each state has been indexed against that state's base rate for 0 stars
7
49Draft—for discussion only
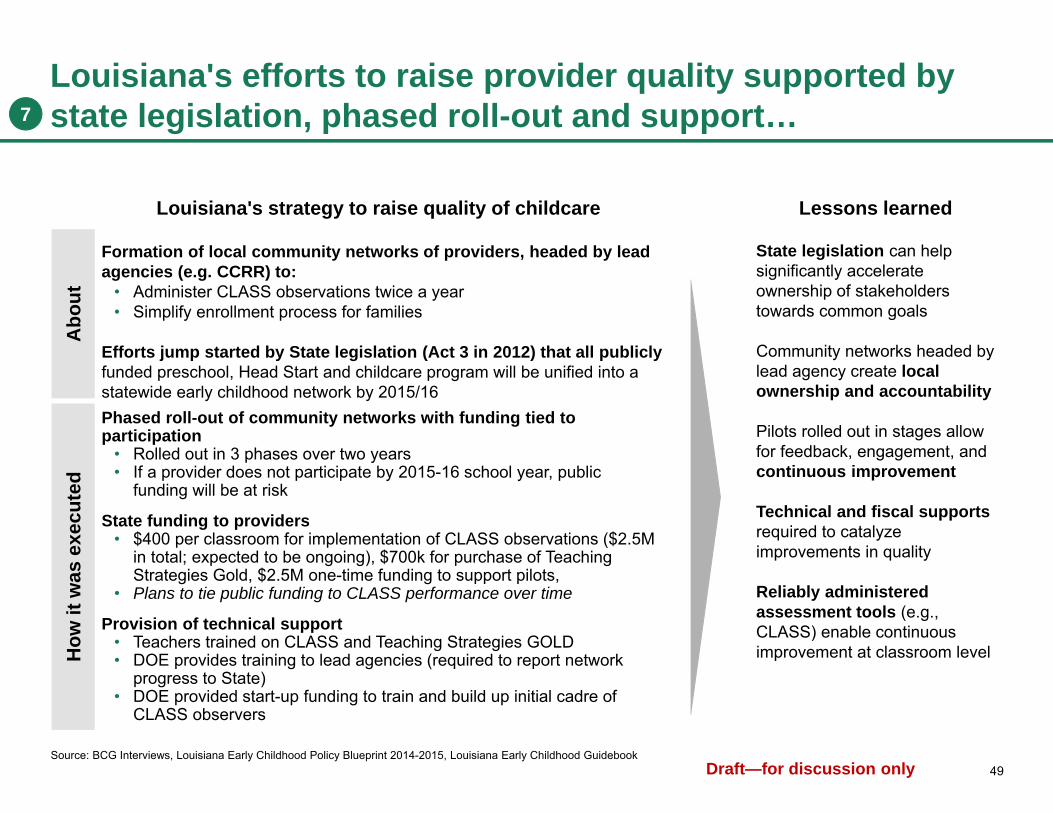
Louisiana's efforts to raise provider quality supported by state legislation, phased roll-out and support…
Louisiana's strategy to raise quality of childcare Lessons learned
Formation of local community networks of providers, headed by lead agencies (e.g. CCRR) to:
• Administer CLASS observations twice a year • Simplify enrollment process for families
Efforts jump started by State legislation (Act 3 in 2012) that all publiclyfunded preschool, Head Start and childcare program will be unified into astatewide early childhood network by 2015/16
Source: BCG Interviews, Louisiana Early Childhood Policy Blueprint 2014-2015, Louisiana Early Childhood Guidebook
Phased roll-out of community networks with funding tied to participation
• Rolled out in 3 phases over two years• If a provider does not participate by 2015-16 school year, public
funding will be at risk
State funding to providers • $400 per classroom for implementation of CLASS observations ($2.5M
in total; expected to be ongoing), $700k for purchase of Teaching Strategies Gold, $2.5M one-time funding to support pilots,
• Plans to tie public funding to CLASS performance over time
Provision of technical support• Teachers trained on CLASS and Teaching Strategies GOLD• DOE provides training to lead agencies (required to report network
progress to State)• DOE provided start-up funding to train and build up initial cadre of
CLASS observers
Abo
utH
ow it
was
exe
cute
d
State legislation can help significantly accelerate ownership of stakeholders towards common goals
Community networks headed by lead agency create local ownership and accountability
Pilots rolled out in stages allow for feedback, engagement, and continuous improvement
Technical and fiscal supports required to catalyze improvements in quality
Reliably administered assessment tools (e.g., CLASS) enable continuous improvement at classroom level
7

50Draft—for discussion only
Assist teachers to assess students accurately• Feedback for teachers from CLASS-observers
conducted twice a year• Coaching for teachers on improving instruction • Support for teachers to set goals and plan
…with quality ratings for providers in Louisiana shown through use of report card
Provider quality rated through report card Support to help providers achieve grade
Reward performance based on grade• Strengthening of School Readiness tax credits and
linkage of tax credit to grades on report cards
Financial support to increase teacher credentials• Increased scholarship program by 10 times to
$5million for certification and higher-level courses; priority given to publicly-funded teachers
Quality standards-based curriculum • Provision of standards-based curriculum and
Teaching Strategies Gold assessment to providers• Training program for teachers to use curriculum and
assessment accurately • Launched in September 2014, pilot in 7 districts• All preschools that receive public money will be graded
by 2015/16Source: Louisiana Early Childhood Policy Blueprint and Early Childhood Guidebook
7

4-year olds
52Draft—for discussion only
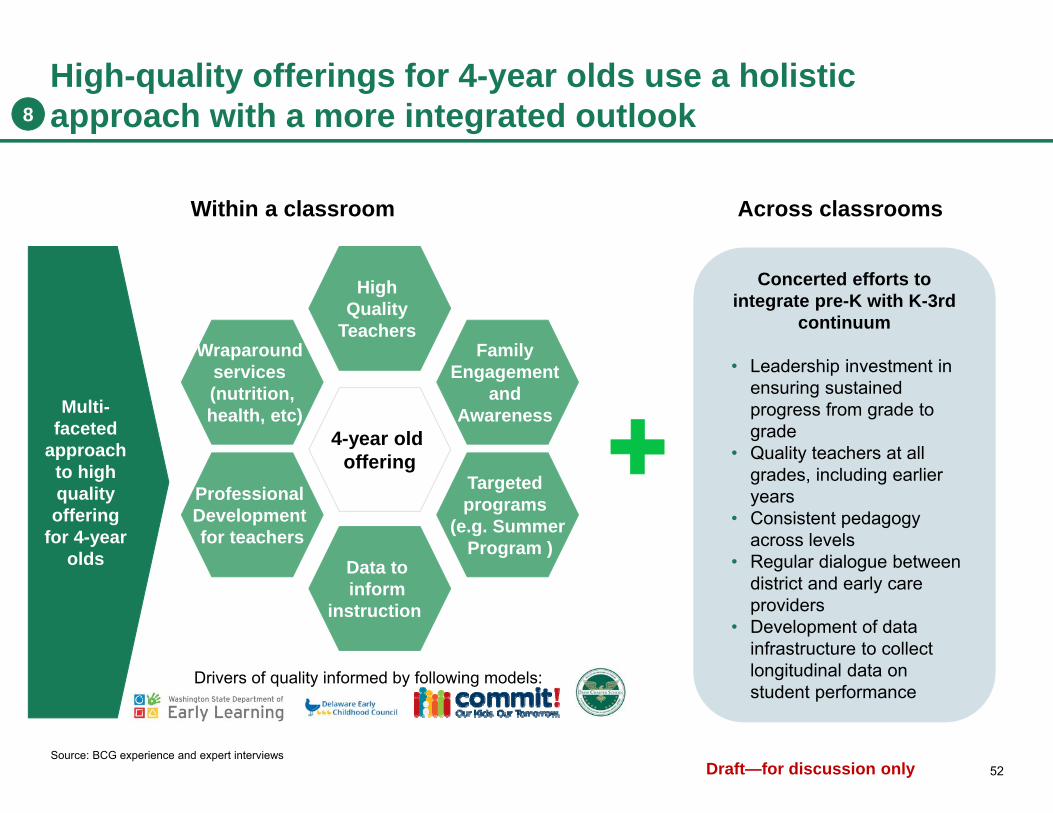
High-quality offerings for 4-year olds use a holistic approach with a more integrated outlook
Wraparound services (nutrition,health, etc)
4-year old offering
Professional Development for teachers
Data to inform
instruction
Family Engagement
and Awareness
Targeted programs
(e.g. SummerProgram )
High Quality
Teachers
Drivers of quality informed by following models:
Source: BCG experience and expert interviews
Multi-faceted
approach to high quality offering
for 4-year olds
Concerted efforts to integrate pre-K with K-3rd
continuum
• Leadership investment in ensuring sustained progress from grade to grade
• Quality teachers at all grades, including earlier years
• Consistent pedagogy across levels
• Regular dialogue between district and early care providers
• Development of data infrastructure to collect longitudinal data on student performance
Within a classroom Across classrooms
8

53Draft—for discussion only
Perspectives on what drives higher K-readinessBased on focus group with Shelby County Kindergarten teachers
Understand everychild's starting point
• Prior programming doesn't tell the whole story. Exposure to vocabulary and technology (through school or family) have a big impact on readiness
• Baseline assessments can gauge a child's starting point, but observing the child is key
Focus on raising bar, while also closing the gap
• Today, we are almost required to spend more time on weaker students (based on RTI)• If you teach to the top instead, you raise the bar for everyone and end up closing the gap
Take a broader view of high-quality teaching
• Need to focus on the whole child – not just academics and "teaching to the test"• Should inspire a love for learning• It's not just about alphabet cards, but about synthesis and application of skills
Improved alignment between pre-K and Kindergarten
• When teachers are in the same school, they can walk down the hallway, know what's going on in other grades, and plan accordingly
Increase frequency and access for parental input
• When we make events on weekends, parents come. They want to be involved - we just have to provide them with opportunities and we need to start earlier
• Some parents in poverty are embarrassed of their clothes or their questions sounding dumb so they won't engage. We still need to reach them because it makes a difference
Expose family to current educational expectations
• Things have changed. Kindergarten is the new first grade, but their parents don't realize that• If parents spend time in classrooms, they realize the academic content they need to support
Expose kids to structure and key focus areas early
• Knowing how to listen and comprehend can be incorporated into early childhood education and makes a difference in kindergarten
• Understanding routines, procedures (e.g. walking in a line) makes learning process easier
Note: Based on 9/22 focus group with six Shelby County kindergarten teachers with wide range of experience (2 years of experience to 22 years of experience)
Themes Supporting quotes
8

54Draft—for discussion only
High variability in absolute performance and improvement exists in Shelby County pre-K classrooms today
0
50
100
Each line represents a school
Shelby County 2015 pre-K Istation reading results (end of year)% of students performing at grade level
1. If Jan/Feb 2015 results showed 50% of students performing at grade level and May 2015 results showed 70% of students performing at grade level, bar would be depicted as 20%Source: Shelby County Schools Istation results
Abs
olut
e Pe
rfor
man
ceIm
prov
emen
t Dur
ing
Pre-
K
-20
0
20
40
60
Each line represents a school
Shelby County 2015 pre-K Istation reading resultsIncrease / (decrease) in % of students performing at grade level1
Data only included for schools with results for 12+ children in May 2015
Data only included for schools with results for 12+ children in both Jan/Feb
2015 and May 2015 assessments
Bright spots exist in Shelby County and can be learned from to inform what can be replicated to drive higher outcomes across all classrooms
8
55Draft—for discussion only
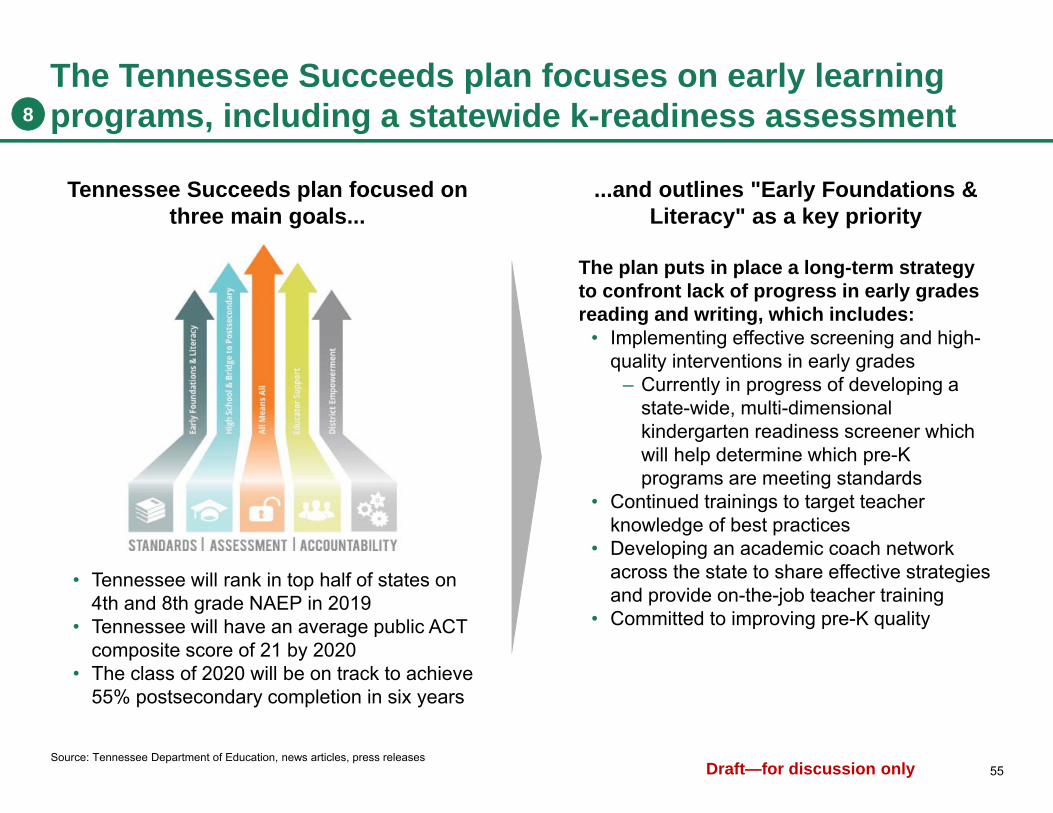
The Tennessee Succeeds plan focuses on early learning programs, including a statewide k-readiness assessment8
Tennessee Succeeds plan focused on three main goals...
• Tennessee will rank in top half of states on 4th and 8th grade NAEP in 2019
• Tennessee will have an average public ACT composite score of 21 by 2020
• The class of 2020 will be on track to achieve 55% postsecondary completion in six years
...and outlines "Early Foundations & Literacy" as a key priority
The plan puts in place a long-term strategy to confront lack of progress in early grades reading and writing, which includes:
• Implementing effective screening and high-quality interventions in early grades
– Currently in progress of developing a state-wide, multi-dimensional kindergarten readiness screener which will help determine which pre-K programs are meeting standards
• Continued trainings to target teacher knowledge of best practices
• Developing an academic coach network across the state to share effective strategies and provide on-the-job teacher training
• Committed to improving pre-K quality
Source: Tennessee Department of Education, news articles, press releases

56Draft—for discussion only
State-led kindergarten entry screener to be piloted in select districts in Fall 2016 and rolled out statewide in Fall 2017
Current – March 2016 April 2016 – Sept 2016 Oct 2016 – Sept 2017
December 2015• Produce report of kindergarten
entry screener (KES) options and draft RFP for vendors
• Outline requirements for KES (e.g., must be multidimensional, include a social-emotional learning component)
January 2016• Select ECE Council with
representation from key groups and convene council to provide input on RFP
March 2016• Complete review process of RFP
and open for vendor response
June 2016• Select KES with input from ECE
Council and Phase I districts (first districts to pilot KES)1
July / August 2016• Train educators and
administrators in Phase I districts to implement KES in Fall 2016
September 2016• Implement KES in Phase I district
schools
Late 2016 / early 2017• Analyze KES implementation and
child outcome results from KES• Survey teachers and districts
implementing the KES in fall 2016• Change 2017 plan according to
feedback
Fall 207• Implement KES statewide
Planning Assessment selection and pilot Statewide rollout
State timeline
1. Phase 1 districts will include those that received funding from the pre-K expansion grant. Other districts (particularly outside of Nashville and Memphis) will be permitted to "opt in" to the pilot so that more representative statewide data can be gatheredSource: Interview with Tennessee Department of Education
8

57Draft—for discussion only
Alignment from pre-K to 3rd requires coordination on assessments, planning time, and support during transitions
Assessments• Utilize assessments that are correlated with one another and early predictors
of 3rd grade literacy so interventions can be put in place early on• Keep assessments stable once implemented
Vertical planning
within a school
• Protect vertical planning time to ensure there are no gaps in content between grades and inform teaching practices of earlier grades to ensure alignment of similar content
Joint planning across sites
• Institute deliberate joint planning on pedagogy between pre-K teachers from offsite locations and kindergarten teachers to ensure smooth transition
Family involvement
• Provide opportunities for parents and students in offsite pre-K classrooms to meet with prospective kindergarten teachers and visit schools so expectations for kindergarten are appropriately set (as done in Perea Preschool)
Potential strategies to increase pre-K to 3rd alignment
Source: BCG interviews
9
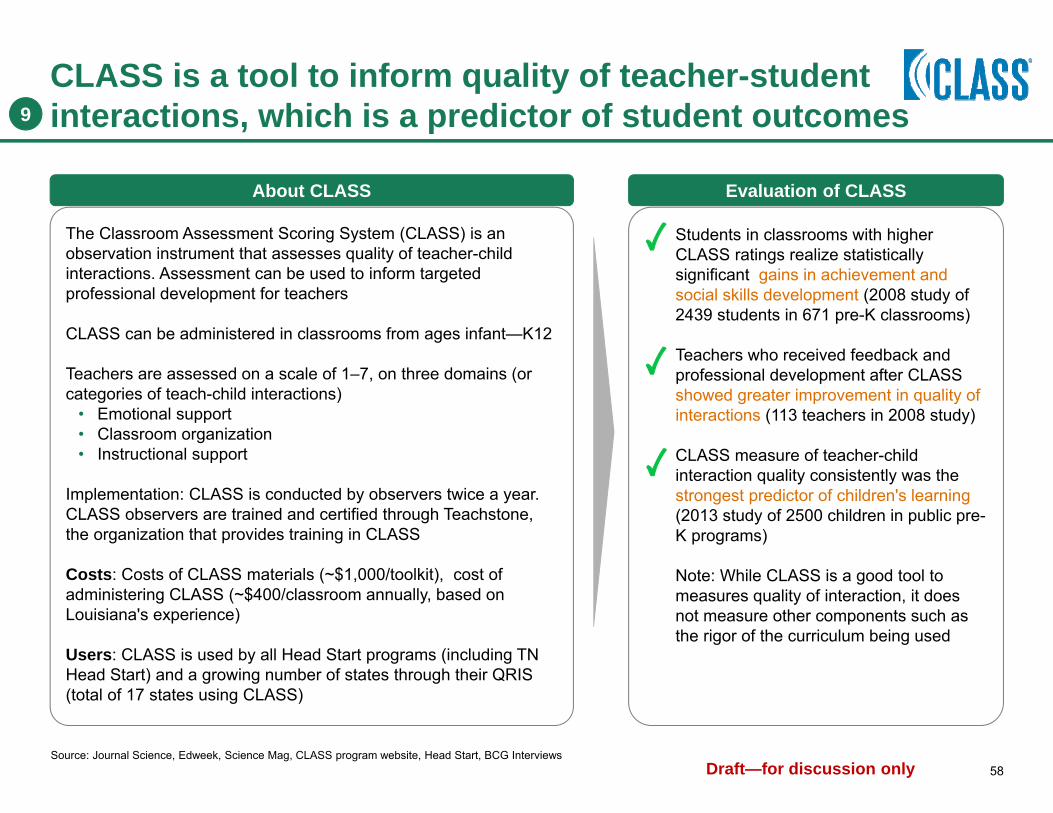
58Draft—for discussion only
CLASS is a tool to inform quality of teacher-student interactions, which is a predictor of student outcomes
About CLASS
The Classroom Assessment Scoring System (CLASS) is an observation instrument that assesses quality of teacher-child interactions. Assessment can be used to inform targeted professional development for teachers
CLASS can be administered in classrooms from ages infant—K12
Teachers are assessed on a scale of 1–7, on three domains (or categories of teach-child interactions)
• Emotional support• Classroom organization• Instructional support
Implementation: CLASS is conducted by observers twice a year. CLASS observers are trained and certified through Teachstone, the organization that provides training in CLASS
Costs: Costs of CLASS materials (~$1,000/toolkit), cost of administering CLASS (~$400/classroom annually, based on Louisiana's experience)
Users: CLASS is used by all Head Start programs (including TN Head Start) and a growing number of states through their QRIS (total of 17 states using CLASS)
Source: Journal Science, Edweek, Science Mag, CLASS program website, Head Start, BCG Interviews
Evaluation of CLASS
Students in classrooms with higher CLASS ratings realize statistically significant gains in achievement and social skills development (2008 study of 2439 students in 671 pre-K classrooms)
Teachers who received feedback and professional development after CLASS showed greater improvement in quality of interactions (113 teachers in 2008 study)
CLASS measure of teacher-child interaction quality consistently was the strongest predictor of children's learning(2013 study of 2500 children in public pre-K programs)
Note: While CLASS is a good tool to measures quality of interaction, it does not measure other components such as the rigor of the curriculum being used
9
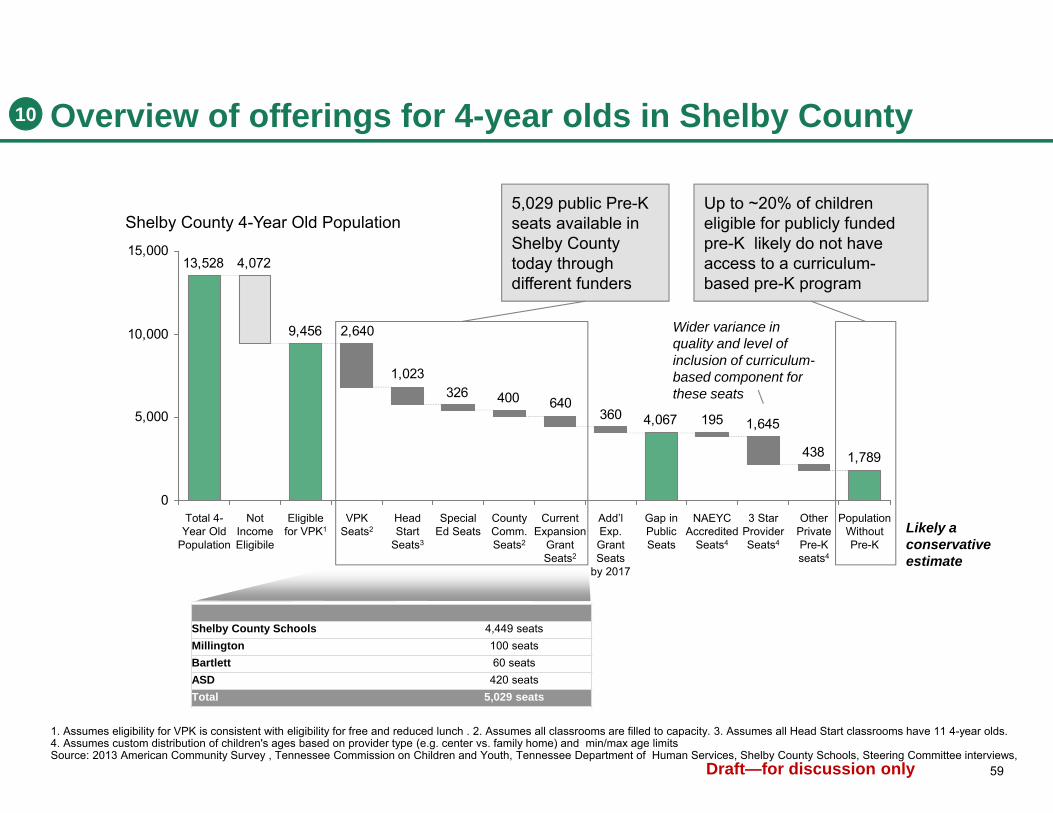
59Draft—for discussion only
Overview of offerings for 4-year olds in Shelby County
1,789438
1954,067360640400326
1,023
2,6409,456
4,07213,528
1,645
0
5,000
10,000
15,000
Add’l Exp. Grant Seats
by 2017
Special Ed Seats
Population Without Pre-K
NAEYC Accredited
Seats4
Eligible for VPK1
Current Expansion
Grant Seats2
County Comm. Seats2
Not Income Eligibile
Other Private Pre-K seats4
VPKSeats2
Shelby County 4-Year Old Population
Head Start
Seats3
Total 4-Year Old
Population
3 Star Provider Seats4
Gap in Public Seats
5,029 public Pre-K seats available in Shelby County today through different funders
1. Assumes eligibility for VPK is consistent with eligibility for free and reduced lunch . 2. Assumes all classrooms are filled to capacity. 3. Assumes all Head Start classrooms have 11 4-year olds. 4. Assumes custom distribution of children's ages based on provider type (e.g. center vs. family home) and min/max age limitsSource: 2013 American Community Survey , Tennessee Commission on Children and Youth, Tennessee Department of Human Services, Shelby County Schools, Steering Committee interviews,
Up to ~20% of children eligible for publicly funded pre-K likely do not have access to a curriculum-based pre-K program
Wider variance in quality and level of inclusion of curriculum-based component for these seats
Likely a conservative estimate
Shelby County Schools 4,449 seatsMillington 100 seatsBartlett 60 seatsASD 420 seatsTotal 5,029 seats
10

60Draft—for discussion only
Estimated cost of extending curriculum-based pre-K to remaining ~1,800 4-year olds is ~$6M per year
Current State Funding
Curriculum-Based Funding
4-year olds not enrolled in curriculum-based pre-K today that are eligible for VPK are likely to be recipients of state-funded vouchers
• Vouchers are used as a form of payment for daycares, family home centers, etc.
On average, the Childcare Certificate Program provides $3,500 annually per child for reimbursement of care for eligible 4-year olds
• Represents blended voucher reimbursement rates for 4-year olds for regulated and unregulated providers
Curriculum-based pre-K programs require funding of ~$7,000 per child per year • Cost assumption based of blended cost of Head Start program cost per child,
county commission pre-K classroom cost per child, etc.
Incremental cost of curriculum-based pre-K per child: $7,000 - $3,500 = $3,500
Shortage of 1,800 curriculum-based seats (conservative estimate)
Incremental cost of extending curriculum based Pre-K = $6 million
Source: Tennessee Department of Human Services, Tennessee Department of Education, Porter Leath, Steering Committee interviews
10
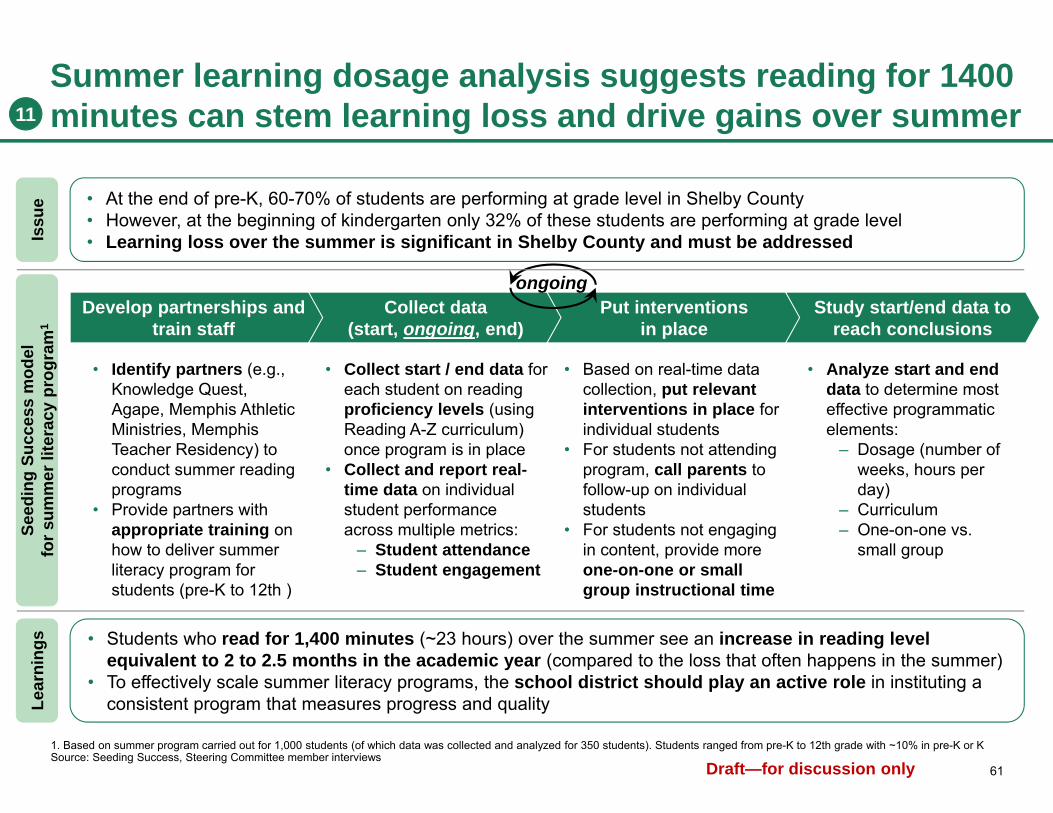
61Draft—for discussion only
Summer learning dosage analysis suggests reading for 1400 minutes can stem learning loss and drive gains over summer
Develop partnerships and train staff
Collect data (start, ongoing, end)
Put interventions in place
Study start/end data to reach conclusions
• Identify partners (e.g., Knowledge Quest, Agape, Memphis Athletic Ministries, Memphis Teacher Residency) to conduct summer reading programs
• Provide partners with appropriate training on how to deliver summer literacy program for students (pre-K to 12th )
• Collect start / end data for each student on reading proficiency levels (using Reading A-Z curriculum) once program is in place
• Collect and report real-time data on individual student performanceacross multiple metrics:
– Student attendance– Student engagement
• Based on real-time data collection, put relevant interventions in place for individual students
• For students not attending program, call parents to follow-up on individual students
• For students not engaging in content, provide more one-on-one or small group instructional time
• Analyze start and end data to determine most effective programmatic elements:
– Dosage (number of weeks, hours per day)
– Curriculum– One-on-one vs.
small group
ongoing
Seed
ing
Succ
ess
mod
el
for s
umm
er li
tera
cy p
rogr
am1
Issu
eLe
arni
ngs
• At the end of pre-K, 60-70% of students are performing at grade level in Shelby County• However, at the beginning of kindergarten only 32% of these students are performing at grade level • Learning loss over the summer is significant in Shelby County and must be addressed
1. Based on summer program carried out for 1,000 students (of which data was collected and analyzed for 350 students). Students ranged from pre-K to 12th grade with ~10% in pre-K or KSource: Seeding Success, Steering Committee member interviews
• Students who read for 1,400 minutes (~23 hours) over the summer see an increase in reading level equivalent to 2 to 2.5 months in the academic year (compared to the loss that often happens in the summer)
• To effectively scale summer literacy programs, the school district should play an active role in instituting a consistent program that measures progress and quality
11
K-3rd grade
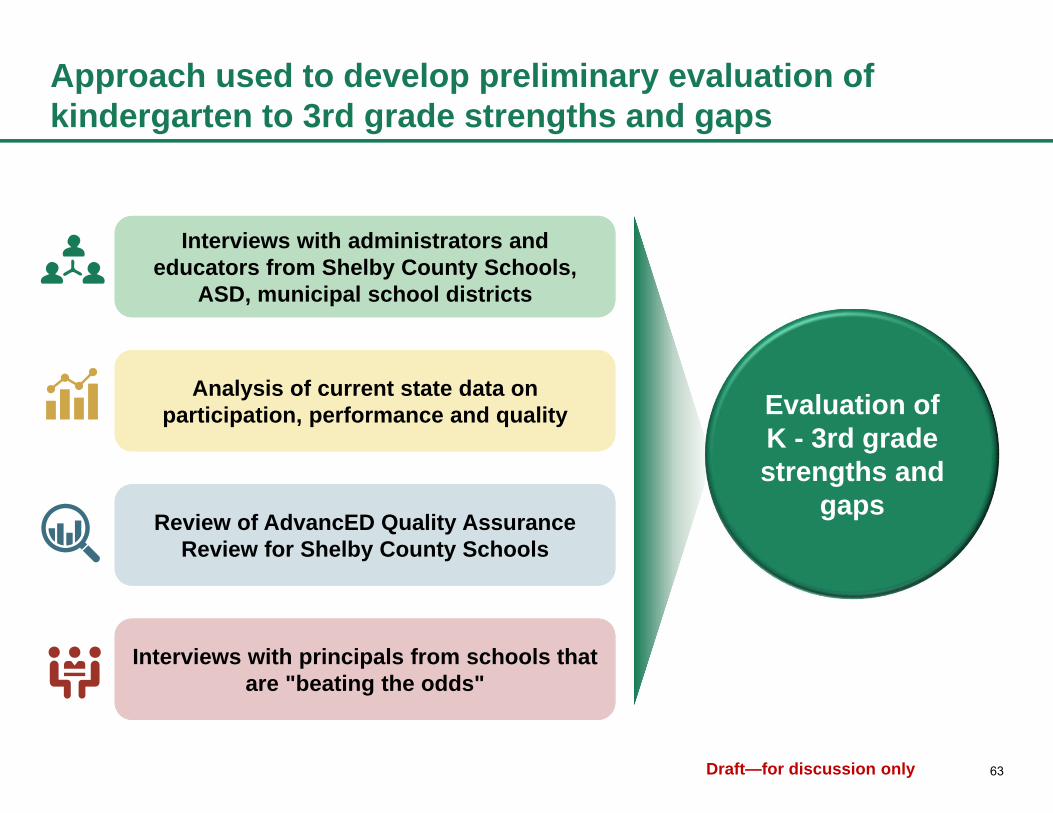
63Draft—for discussion only
Approach used to develop preliminary evaluation of kindergarten to 3rd grade strengths and gaps
Interviews with administrators and educators from Shelby County Schools,
ASD, municipal school districts
Review of AdvancED Quality Assurance Review for Shelby County Schools
Interviews with principals from schools that are "beating the odds"
Analysis of current state data on participation, performance and quality Evaluation of
K - 3rd grade strengths and
gaps

64Draft—for discussion only
Developmentally appropriate
classrooms and resources
Only permitted to use high-quality state approved resources Target high need zip codes to ensure each SCS classroom has 5 computers Adopted Imagine Learning (online program), which targets letter knowledge via games
for 4+ year olds (available in 35-40% of SCS classrooms in early grades) Focused initiative from central office team to help schools setup classrooms to
facilitate small group instruction× While computers and other equipment exists, not always used in ways to maximize
value, such as for small group instruction
Multi-dimensional focus (social, emotional and
academic development)
Head Start grant reinforced with Shelby County leadership the value of focusing on multiple dimensions (especially social emotional learning) in early childhood education
Rolled out Class in K-2nd grade, an evaluation system that tracks teacher-student interactions particularly related to social-emotional support and development
Several operators in ASD have deeper integration of SEL into their curriculum− No adoption of research-informed curriculum focused on social emotional competence
yet (e.g. Second Step) county-wide
Mindset spanning full continuum of early
education
This Shelby County ECE effort and what will follow builds collaboration of stakeholders across continuum to develop common understanding and align on and pursue common priorities
Structure of SCS Early Childhood Division from pre-K to 2nd grade with Instructional Advisors overseeing K-2nd grade promotes continuum mindset
× Different assessments used at every stage of early childhood continuum perpetuates siloed thinking at each age and grade level (e.g. Istation, SAT-10, TCAP, TNReady)
Analysis of current K-3rd offering in Shelby County highlights pockets of promise and areas for improvement (I)
Source: Interviews with Shelby County, Bartlett, and Millington administration; AdvancED school review, BCG analysis
Strength Potential area for action Opportunity to be re-evaluated
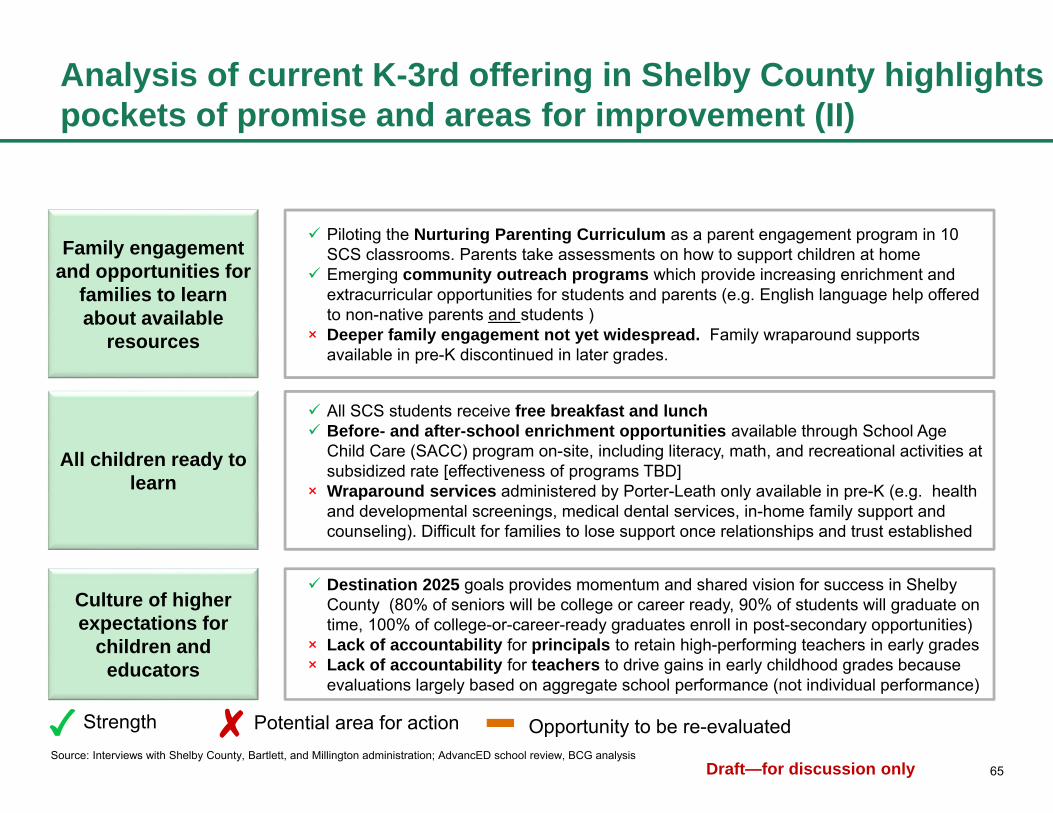
65Draft—for discussion only
Family engagement and opportunities for
families to learn about available
resources
Piloting the Nurturing Parenting Curriculum as a parent engagement program in 10 SCS classrooms. Parents take assessments on how to support children at home
Emerging community outreach programs which provide increasing enrichment and extracurricular opportunities for students and parents (e.g. English language help offered to non-native parents and students )
× Deeper family engagement not yet widespread. Family wraparound supports available in pre-K discontinued in later grades.
All children ready to learn
All SCS students receive free breakfast and lunch Before- and after-school enrichment opportunities available through School Age
Child Care (SACC) program on-site, including literacy, math, and recreational activities at subsidized rate [effectiveness of programs TBD]
× Wraparound services administered by Porter-Leath only available in pre-K (e.g. health and developmental screenings, medical dental services, in-home family support and counseling). Difficult for families to lose support once relationships and trust established
Culture of higher expectations for
children and educators
Destination 2025 goals provides momentum and shared vision for success in Shelby County (80% of seniors will be college or career ready, 90% of students will graduate on time, 100% of college-or-career-ready graduates enroll in post-secondary opportunities)
× Lack of accountability for principals to retain high-performing teachers in early grades× Lack of accountability for teachers to drive gains in early childhood grades because
evaluations largely based on aggregate school performance (not individual performance)
Strength Potential area for actionSource: Interviews with Shelby County, Bartlett, and Millington administration; AdvancED school review, BCG analysis
Analysis of current K-3rd offering in Shelby County highlights pockets of promise and areas for improvement (II)
Opportunity to be re-evaluated

66Draft—for discussion only
High quality teaching
Approach that meets each child's learning
needs
Implementation of RTI2 identifies at-risk students and provides targeted interventions Implementation of Comprehensive Literacy Improvement Plan includes 90 minute
literacy blocks with small group instruction based on student's skill level (being rolled out)× Small group instruction is still rare, need quality PD to train teachers on technique and
ensure children not in rotation with teacher have instructional work (not busy work)× Formative assessments largely not utilized to tailor teaching approach× Enrollment forecasting is challenging causing situations where students are moved in and
out of classrooms in the middle of the year, causing disruption to learning? For discussion: Are special education services being deployed in a manner (e.g., pullout vs.
integrated model) that best meet students needs?
Strong leadership in schools
Instructional Leadership Directors support raising the bar in teaching and leadership instruction and providing support and guidance (from AdvancEd)
Culture of collegiality and trust exists in SCS and is critical in promoting leadership effectiveness (from AdvancED)
? For discussion: Is there evidence that school leaders have strong expertise in early learning?
Strength Potential area for actionSource: Interviews with Shelby County, Bartlett, and Millington administration; AdvancED school review, BCG analysis
More concerted focus at SCS on building out literacy foundation by laying out literacy progressions more deliberately and investing in literacy coaches
× > 40% teachers reported inadequate preparation to teach foundational literacy skills× Lack of targeted PD opportunities for K-2nd grade teachers relative to teachers in later
grades (particularly around data-driven instruction)× Kindergarten classroom observation showed low percentage of teachers engaging in
any instructional practice (need increased accountability for more consistent and quality implementation of curriculum in K-2nd grade)
Analysis of current K-3rd offering in Shelby County highlights pockets of promise and areas for improvement (III)
Opportunity to be re-evaluated
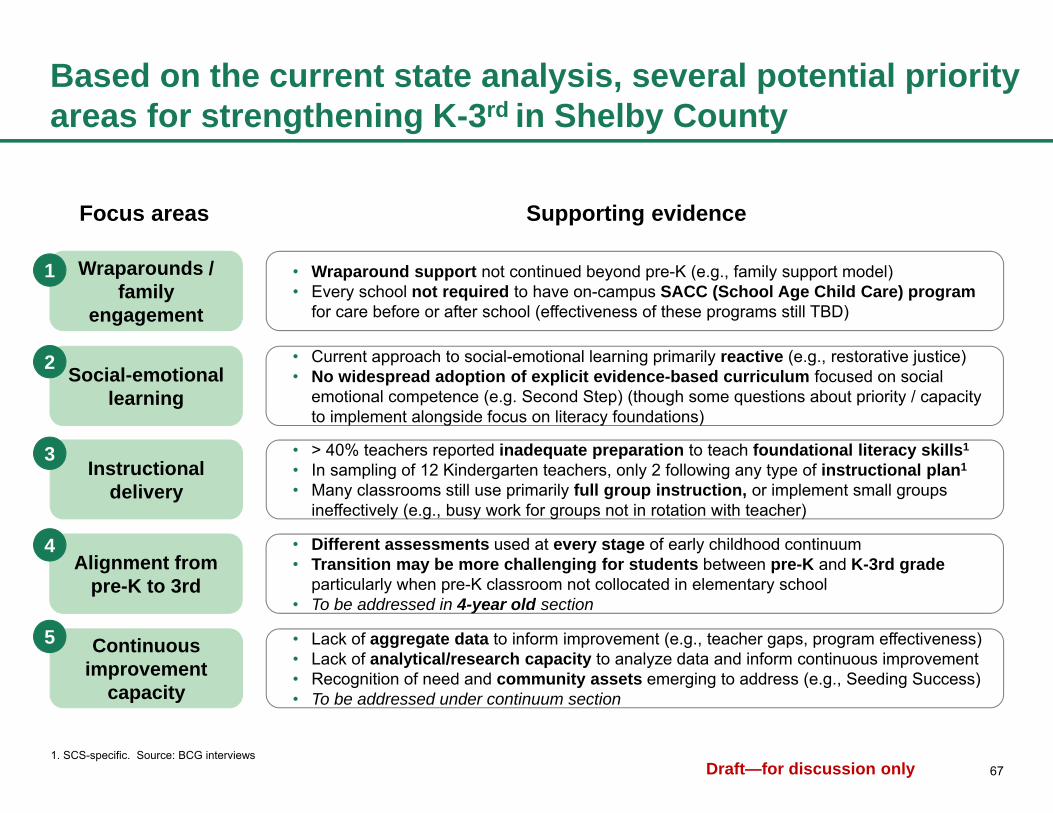
67Draft—for discussion only
Based on the current state analysis, several potential priority areas for strengthening K-3rd in Shelby County
Wraparounds / family
engagement
• Wraparound support not continued beyond pre-K (e.g., family support model)• Every school not required to have on-campus SACC (School Age Child Care) program
for care before or after school (effectiveness of these programs still TBD)
Social-emotional learning
• Current approach to social-emotional learning primarily reactive (e.g., restorative justice)• No widespread adoption of explicit evidence-based curriculum focused on social
emotional competence (e.g. Second Step) (though some questions about priority / capacity to implement alongside focus on literacy foundations)
Instructional delivery
• > 40% teachers reported inadequate preparation to teach foundational literacy skills1
• In sampling of 12 Kindergarten teachers, only 2 following any type of instructional plan1
• Many classrooms still use primarily full group instruction, or implement small groups ineffectively (e.g., busy work for groups not in rotation with teacher)
Alignment from pre-K to 3rd
• Different assessments used at every stage of early childhood continuum• Transition may be more challenging for students between pre-K and K-3rd grade
particularly when pre-K classroom not collocated in elementary school• To be addressed in 4-year old section
Continuous improvement
capacity
• Lack of aggregate data to inform improvement (e.g., teacher gaps, program effectiveness)• Lack of analytical/research capacity to analyze data and inform continuous improvement• Recognition of need and community assets emerging to address (e.g., Seeding Success)• To be addressed under continuum section
Focus areas Supporting evidence
1
2
3
4
5
1. SCS-specific. Source: BCG interviews

68Draft—for discussion only
High-quality ECE offerings require several conditions to be in place within a child's school or center
High-quality ECE
offering
Developmentally appropriate
classrooms and resources
Mindset spanning full continuum
of early education
Family engagement and opportunities for
families to learn about available resources
Multi-dimensional focus (social, emotional
and academic development)
All childrenready to
learn
Culture of higher expectations for
children and educators
Approach that meets each
child'slearning needs
High quality
teaching
Strong leadership in schools and centers
Note: Informed by national research, including Roland Fryer, Mass Insight, Education Endowment Foundation, Institute of Education Sciences, and Gallup . Also incorporates BCG experience and further adapted to Shelby County based on input from Steering Committee member interviews
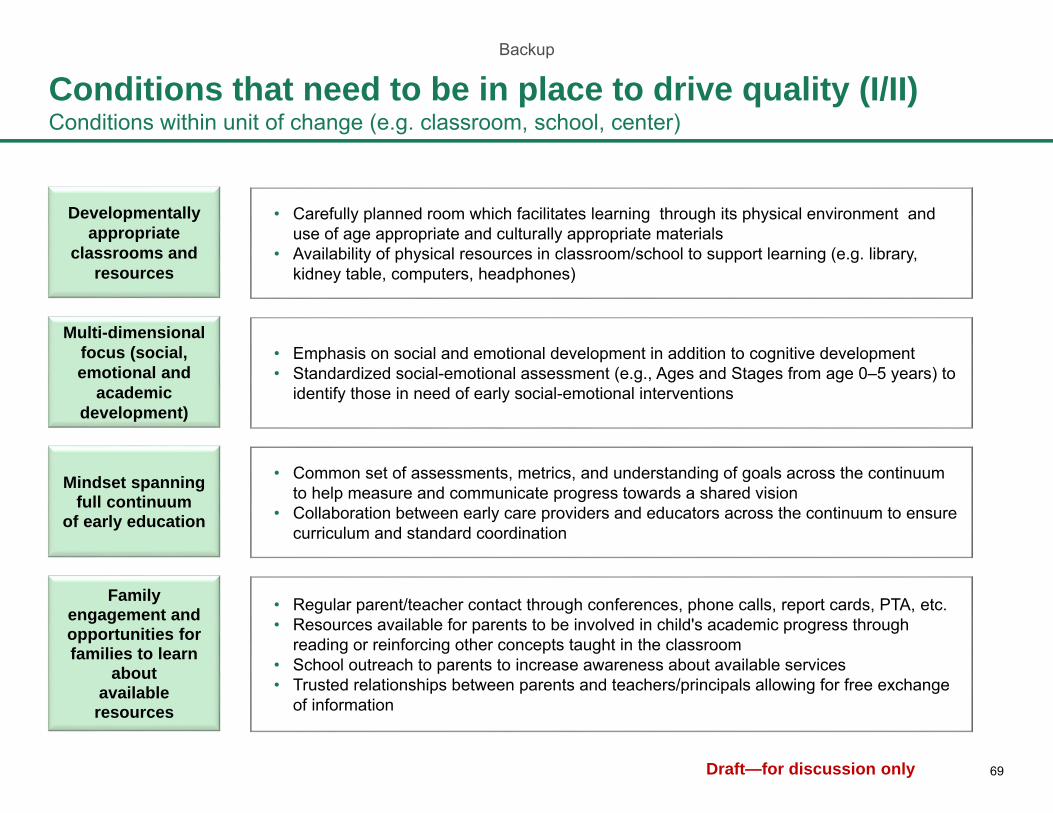
69Draft—for discussion only
Conditions that need to be in place to drive quality (I/II)Conditions within unit of change (e.g. classroom, school, center)
Developmentally appropriate
classrooms and resources
Family engagement and opportunities for families to learn
about available resources
Mindset spanning full continuum
of early education
Multi-dimensional focus (social, emotional and
academic development)
• Carefully planned room which facilitates learning through its physical environment and use of age appropriate and culturally appropriate materials
• Availability of physical resources in classroom/school to support learning (e.g. library, kidney table, computers, headphones)
• Regular parent/teacher contact through conferences, phone calls, report cards, PTA, etc. • Resources available for parents to be involved in child's academic progress through
reading or reinforcing other concepts taught in the classroom• School outreach to parents to increase awareness about available services• Trusted relationships between parents and teachers/principals allowing for free exchange
of information
• Common set of assessments, metrics, and understanding of goals across the continuum to help measure and communicate progress towards a shared vision
• Collaboration between early care providers and educators across the continuum to ensure curriculum and standard coordination
• Emphasis on social and emotional development in addition to cognitive development• Standardized social-emotional assessment (e.g., Ages and Stages from age 0–5 years) to
identify those in need of early social-emotional interventions
Backup

70Draft—for discussion only
Conditions that need to be in place to drive quality (II/II)Conditions within unit of change (e.g. classroom, school, center)
All children ready to learn
Culture of higher expectations for
children and educators
Approach that meets each
children's learning needs
High quality teaching
Strong leadership in schools and
centers
• Basic physical, emotional, mental health needs of the child are met• Non-academic supports that remove impediments to learning (e.g., nutrition, health,
transportation, afterschool and summer enrichment)
• High academic and behavioral expectations for all• Educators empowered, supported, and accountable for continuously improving their
practice• Children and educators excited and hopeful for the future
• Data used to tailor instruction to students' specific needs• 'High dosage' tutoring and/or other targeted interventions• Students engaged and owning their learning
• Teachers with high level of training / credentials and opportunities for PD• Rigorous teaching aligned to standards• Consistent approach to instruction, common language, and use of curriculum • Alignment of instruction during transition points to ensure seamless learning• Purposeful use of tools and resources to support instruction
• Leadership focused on academic achievement, has high expectations, promotes a positive culture
• Principal builds and develops a strong team that is accountable for their performance• Many leaders empowered within the building
Backup

71Draft—for discussion only
3rd grade TCAP scores show SCS has been closing its performance gap relative to statewide averages
55524648
4243
323032
68686762
5759
434449
0
20
40
60
80
2013 20142013 2014 201520152013
3rd grade TCAP scores% of students proficient or advanced
2014 2015
Reading Math Science
Shelby County Schools Tennessee Average
Source: Tennessee Department of Education, Shelby County Schools

72Draft—for discussion only
High variability in 3rd grade proficiency in SCS suggests "bright spots" exist and need to be understood
Need to understand what high-performing schools are doing differentially and replicate where possible
0
20
40
60
80
100
Each line represents a school
3rd grade SCS TCAP reading scores% of students proficient or advanced
District Average: 32%
State Average: 43%
79% of SCS schools perform below state average
Source: Tennessee Department of Education, Shelby County Schools
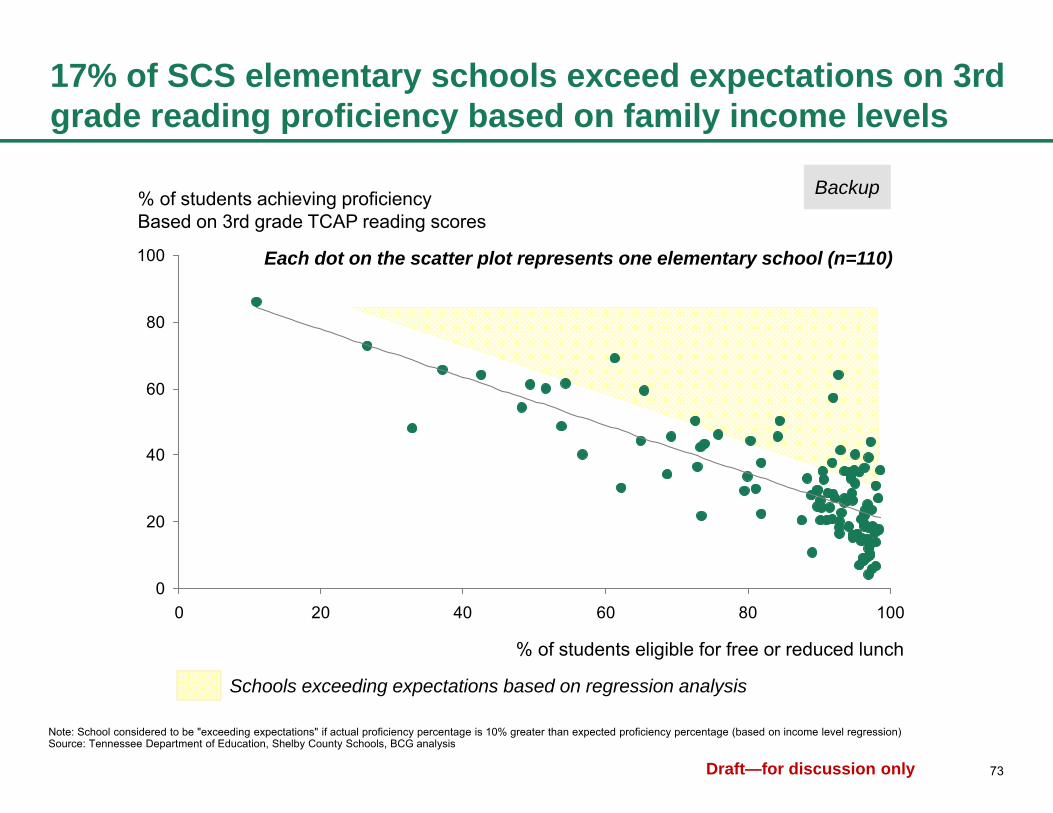
73Draft—for discussion only
17% of SCS elementary schools exceed expectations on 3rd grade reading proficiency based on family income levels
0
20
40
60
80
100
0 20 40 60 80 100
% of students achieving proficiency Based on 3rd grade TCAP reading scores
% of students eligible for free or reduced lunch
Note: School considered to be "exceeding expectations" if actual proficiency percentage is 10% greater than expected proficiency percentage (based on income level regression)Source: Tennessee Department of Education, Shelby County Schools, BCG analysis
Schools exceeding expectations based on regression analysis
Each dot on the scatter plot represents one elementary school (n=110)
Backup

74Draft—for discussion only
23% of SCS elementary schools exceed expectations on 3rd grade math proficiency based on family income levels
0
20
40
60
80
100
0 20 40 60 80 100
% of students achieving proficiency Based on 3rd grade TCAP math scores
% of students eligible for free or reduced lunch
Schools exceeding expectations based on regression analysis
Note: School considered to be "exceeding expectations" if actual proficiency percentage is 10% greater than expected proficiency percentage (based on income level regression)Source: Tennessee Department of Education, Shelby County Schools, BCG analysis
Each dot on the scatter plot represents one elementary school (n=110)
Backup

75Draft—for discussion only
SchoolExpected
Proficiency1
(%)
Actual Proficiency1
(%)Difference (%)
Knight Road 39 78 39
Oakshire 42 76 34
Freeman 61 90 28Mem. Bus. Academy 47 75 28
Jackson 38 65 27
Springdale 38 65 27
Delano 42 67 24Promise Academy 43 68 24
Manor Lake 39 64 24
Charjean 40 64 24
Newberry 43 65 21
E. E. Jeter 67 89 21
Southern Ave 43 63 20
Keystone 40 59 19Gardenview 42 61 19
There is an opportunity to understand what high-performing schools are doing differentially and replicate where possible
School
Expected Proficiency1
(%)
Actual Proficiency1
(%) Difference (%)
Gardenview 25 64 38
Delano 26 57 31
Bethel Grove 22 44 22
Freeman 48 69 21
Downtown 31 50 19
Knight Road 22 39 17Circles of Success 24 40 16
Oakshire 25 41 16
White Station 45 59 14
Jackson 21 35 14Mem. Bus. Academy 31 45 14
Manor Lake 23 36 13
Keystone 24 36 12
Ida B. Wells 26 38 12Hickory Ridge 23 35 11
Outperformance in reading proficiency Outperformance in math proficiency
Schools with solid outperformance in math/reading; to be further evaluated to understand factors contributing to strong performance
1. % of students expected to be proficient and actually proficient based on regression analysis of all Shelby County elementary schools (% of students eligible for FRL and % of students proficient) Source: Tennessee Department of Education, Shelby County Schools, BCG analysis

76Draft—for discussion only
Overview of wraparound services that can be offered fromPre-K to 3rd
Source: Leading The Way: Innovation Birth-Through Third Grade Practices in Three Communities; Transforming East Lake: Systematic Intentionality in Atlanta; Atlanta’s Successful Charles R. Drew Charter School: the Cornerstone of East Lake’s Community Transformation Baltimore’s Version Invites Comparison
• Coordinate school-wide screenings or annual health fair with free immunizations, dental checks, and vision and hearing screenings
• Offer nurses and wellness program to work with children who have health or behavioral problem• Provide students in crisis with interventions to address emotional and behavioral challenges,
enhance coping skills, and improve student emotional and physical health• Help qualify parents for federal food / nutrition programs (e.g. SNAP, WIC)• Offer food and nutrition program to teach parents how to shop and cook on food stamp budget• Offer family access to community resources that promote health and wellbeing (e.g. YMCA)
• Give parents access to parent coaches / social workers who provide advice on parenting, stress, trauma, taking advantage of public benefits, etc.
• Provide parents with access to developmental screener showing child's developmental progress• Maintain a lending library in the community where families can borrow books and toys• Run a community center with adult education services (e.g. GED, English language, computer
training), trainings, and space for parent meetings, outreach, etc.• Network with other social service agencies to help provide food, shelter, clothing, etc.
• Provide after school and Saturday tutoring in literacy and math• Host AmeriCorps volunteers tutoring students struggling in math and science• Facilitate summer bridge program for students at risk of being behind• Offer outside programs coming to campus to hold physical activity classes • Plan enrichment activities such as field trips and special events to enhance learning environment• Organize program through which a book is delivered to child's home every month for 5 years
Health and nutrition
Community and family
Education and
enrichment
12
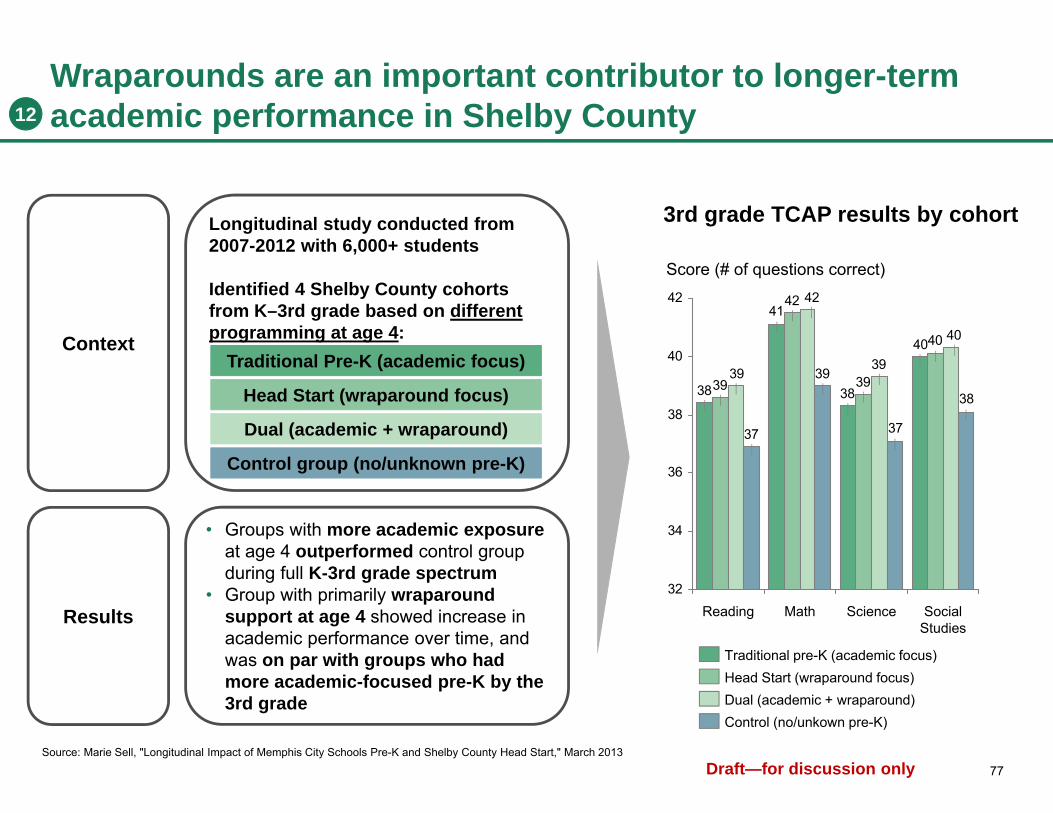
77Draft—for discussion only
Wraparounds are an important contributor to longer-term academic performance in Shelby County
40
38
41
38
40
39
42
39
40
39
42
39
38
37
39
37
32
34
36
38
40
42
Score (# of questions correct)
Social Studies
ScienceMathReading
Source: Marie Sell, "Longitudinal Impact of Memphis City Schools Pre-K and Shelby County Head Start," March 2013
12
Dual (academic + wraparound)Control (no/unkown pre-K)
Head Start (wraparound focus)Traditional pre-K (academic focus)
3rd grade TCAP results by cohort
Context
Results
Longitudinal study conducted from 2007-2012 with 6,000+ students
Identified 4 Shelby County cohorts from K–3rd grade based on different programming at age 4:
• Groups with more academic exposureat age 4 outperformed control group during full K-3rd grade spectrum
• Group with primarily wraparound support at age 4 showed increase in academic performance over time, and was on par with groups who had more academic-focused pre-K by the 3rd grade
Control group (no/unknown pre-K)
Dual (academic + wraparound)
Head Start (wraparound focus)
Traditional Pre-K (academic focus)

78Draft—for discussion only
Perspectives on extending wraparounds and family supports into K-3rd
Wraparound and family supports in Drew Charter School model (Atlanta)....
Drew Charter School is a birth to 12th grade academic model in the East Lake community of Atlanta. It is a model with academics deeply embedded in a set of family and wraparound support services
...have contributed to successful outcomes
AmeriCorps volunteers tutoring students struggling
in math and science
After school and Saturday tutoring in literacy and math
Summer bridge program for students at-risk of being behind via Georgia Tech
Family access to YMCA resources which promote
health and wellbeing
Economic stability supports for families (e.g., financial literacy, career counseling)
Dedicated staff member to actively coordinating across
wraparounds and partnerships
Source: BCG project experience and interviews
12
There is an opportunity to extend wraparound services beyond pre-K and to better coordinate existing services
One of top performing schools in Atlanta (from <60% to over 95% proficiency over ten year period)
73% reduction in crime
70% employment in public housing
Improved health and wellness of families
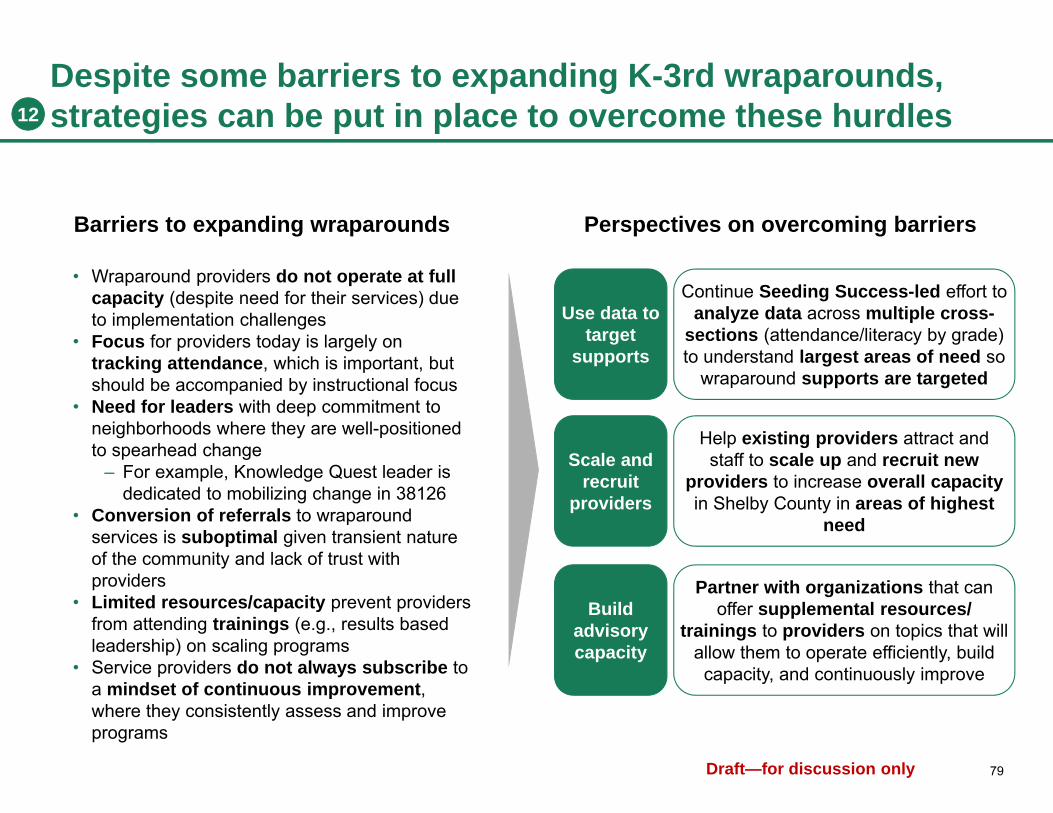
79Draft—for discussion only
Barriers to expanding wraparounds Perspectives on overcoming barriers
Despite some barriers to expanding K-3rd wraparounds, strategies can be put in place to overcome these hurdles12
Continue Seeding Success-led effort to analyze data across multiple cross-
sections (attendance/literacy by grade) to understand largest areas of need so
wraparound supports are targeted
Help existing providers attract and staff to scale up and recruit new
providers to increase overall capacity in Shelby County in areas of highest
need
Partner with organizations that can offer supplemental resources/
trainings to providers on topics that will allow them to operate efficiently, build capacity, and continuously improve
Use data to target
supports
Scale and recruit
providers
Build advisory capacity
• Wraparound providers do not operate at full capacity (despite need for their services) due to implementation challenges
• Focus for providers today is largely on tracking attendance, which is important, but should be accompanied by instructional focus
• Need for leaders with deep commitment to neighborhoods where they are well-positioned to spearhead change
– For example, Knowledge Quest leader is dedicated to mobilizing change in 38126
• Conversion of referrals to wraparound services is suboptimal given transient nature of the community and lack of trust with providers
• Limited resources/capacity prevent providers from attending trainings (e.g., results based leadership) on scaling programs
• Service providers do not always subscribe to a mindset of continuous improvement, where they consistently assess and improve programs

80Draft—for discussion only
Range of ways to enable stronger focus on social emotional learning (SEL) in K-3rd
Spectrum of social-emotional supports for K-3rd
Direct parent interventions
Stand-alone SEL curriculum
SEL embedded in teaching practice
Infused academic SEL curriculum
Outcomes fromSEL focus
Improved academic performance1
Increased positive social behavior
Reduced emotional distress
Reduced conduct problems
Leve
l of d
istr
ict i
nvol
vem
ent
Discussion groups with other parents and suggested home activities
20-30 min SEL lessons several times a week, with hands-on practice activities
Class meetings for team building, cross-age buddies, school-wide community building
Reading aloud and book discussions using SEL vocabulary
Example roll-outs from external models
13
1. Fast Track study comparing measured outcomes in kindergarten and 13-19 years later in three cities and one rural setting showed social competence linked with higher educationSource: Program websites

81Draft—for discussion only
Libertas' Pre-K model focuses on incorporating social-emotional learning in curriculum and community
Montessori School in the Achievement School District located in Frayser. Focuses on advancing social-emotional learning. 125 students between ages of 3 and 7. Goal to grow up to age 12 and have 350 students. Focuses on SEL through curriculum and integrated community
Curriculum embeds SEL in day to day school activitiesCurriculum embeds SEL in day to day school activities1 SEL is reinforced through school/
community partnership activitiesSEL is reinforced through school/ community partnership activities2
Lessons of Grace and Courtesy Familiarize teachers with community• Focused on how children practice living and working in a
community with people• Provides students with language and movements of pro
social behavior (e.g., how to blow nose, how to solve a problem with others)
• Fosters SEL through establishing a peace corner in the class, singing group songs, and showcasing art on the wall
Tier 3 intervention • Intervention approach for troubled children with most
severe trauma with support from school counselor and social worker
• Provide a neighborhood tour for teachers to familiarize them with the context, challenges and background of school children in order to tailor teaching if appropriate
Foster relationship between teachers/families• Provides individualized 1:1 welcome for teacher and
caregivers before the school year
School support efforts of communityenrichment center
• Provide community family enrichment center with donated clothes, snacks, books to borrow, parenting courses, family and community events
• Provide computers for parents who need to apply for jobs or register their children for benefits
13

82Draft—for discussion only
Existing pre-service efforts are working towards providing more relevant coursework and practical experience14
Traditional pre-service programs
University of Memphis is the traditional pre-service program that brings the most teachers into Shelby County
• In 2012-2013, 445 individuals completed the program, with 173 focusing on elementary education (K-6th grade)
Alternative pre-service programs
TFA Memphis and Memphis Teacher Residency (MTR) are the primary alternative pre-service programs
• In 2012-2013, TFA Memphis awarded187 licenses (with 164 focused on 4th-8th grade)
• In 2012-2013, MTR awarded 28 licenses (with 13 focused on K-6th grade)
Are
as o
f Foc
us 1
Prog
ram
s
1. Traditional pre-service program areas of focus based on University of Memphis, and alternative pre-service program areas of focus based on TFASource: Report Card on the Effectiveness of Teacher Training Programs , Shelby County Schools, Teach for America, Memphis Teacher Residency, Steering Committee member interviews, University of Memphis interview
• Added course on how to effectively use observation and assessments
• Strengthened literacy courses to focus on how students acquire language
• In process of adding clinical faculty member who has deep expertise in literacy
• Placing students alongside mentor teachers so they learn from observation in a classroom setting
• Placing emphasis on how to best engage with a diverse set of children from different backgrounds
• Practical experience teaching summer school to learn classroom management and lesson delivery
• Frequent feedback provided by coaches who observe trainees several times a week
• Small group forums to practice teaching new lessons, reacting to classroom challenges, etc.
• Lesson-planning instruction from coaches• Coursework on instruction planning and delivery,
classroom management, diversity, community, and literacy development
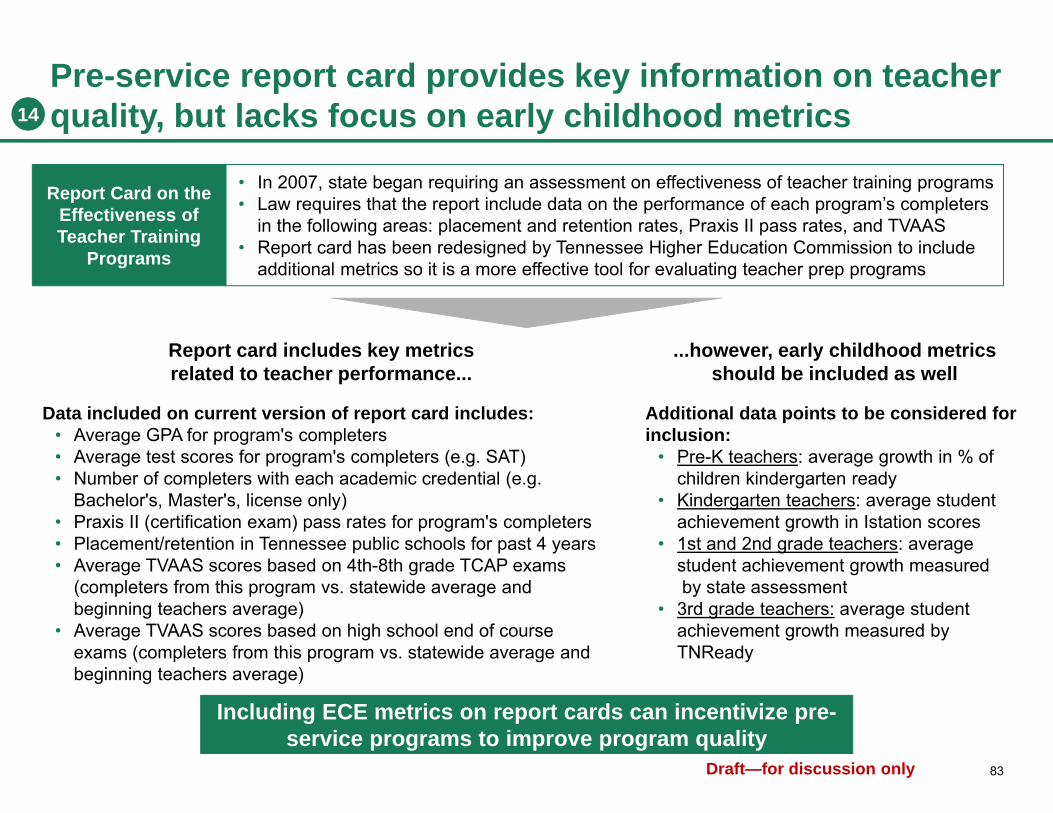
83Draft—for discussion only
Pre-service report card provides key information on teacher quality, but lacks focus on early childhood metrics14
• In 2007, state began requiring an assessment on effectiveness of teacher training programs• Law requires that the report include data on the performance of each program’s completers
in the following areas: placement and retention rates, Praxis II pass rates, and TVAAS• Report card has been redesigned by Tennessee Higher Education Commission to include
additional metrics so it is a more effective tool for evaluating teacher prep programs
Report Card on the Effectiveness of Teacher Training
Programs
Report card includes key metrics related to teacher performance...
Data included on current version of report card includes:• Average GPA for program's completers• Average test scores for program's completers (e.g. SAT)• Number of completers with each academic credential (e.g.
Bachelor's, Master's, license only)• Praxis II (certification exam) pass rates for program's completers• Placement/retention in Tennessee public schools for past 4 years• Average TVAAS scores based on 4th-8th grade TCAP exams
(completers from this program vs. statewide average and beginning teachers average)
• Average TVAAS scores based on high school end of course exams (completers from this program vs. statewide average and beginning teachers average)
...however, early childhood metrics should be included as well
Additional data points to be considered for inclusion:
• Pre-K teachers: average growth in % of children kindergarten ready
• Kindergarten teachers: average student achievement growth in Istation scores
• 1st and 2nd grade teachers: average student achievement growth measuredby state assessment
• 3rd grade teachers: average student achievement growth measured by TNReady
Including ECE metrics on report cards can incentivize pre-service programs to improve program quality
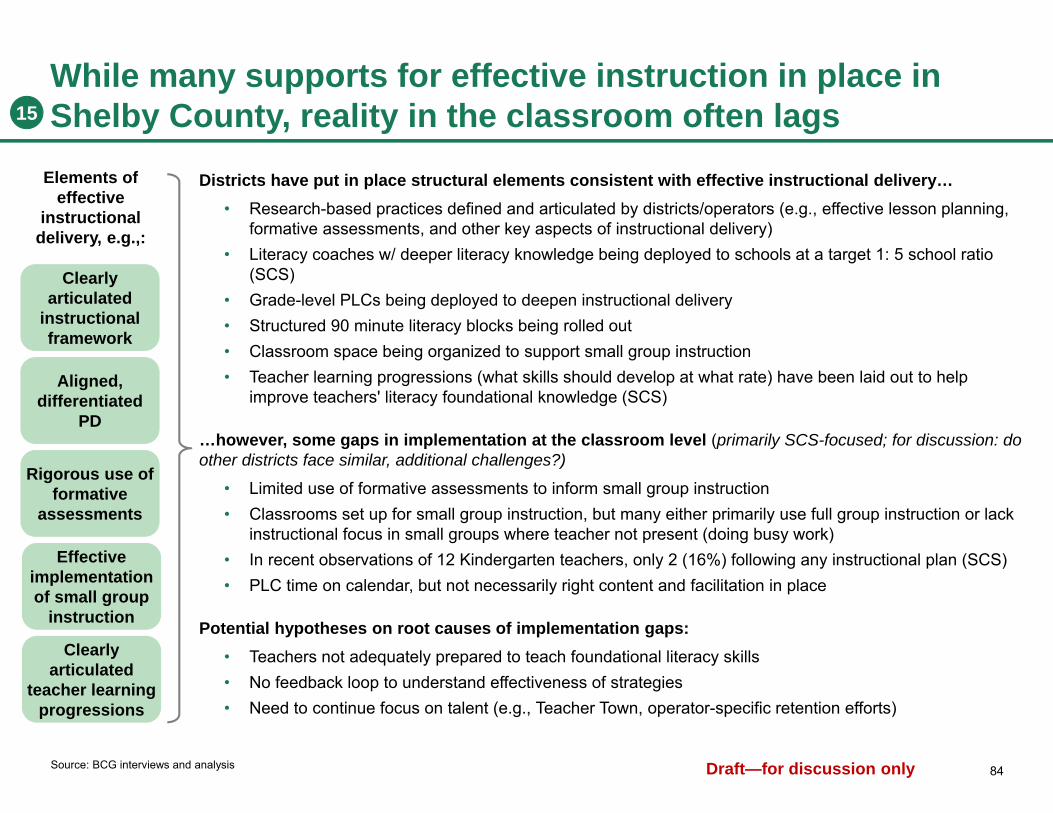
84Draft—for discussion only
While many supports for effective instruction in place in Shelby County, reality in the classroom often lags
Districts have put in place structural elements consistent with effective instructional delivery…• Research-based practices defined and articulated by districts/operators (e.g., effective lesson planning,
formative assessments, and other key aspects of instructional delivery)• Literacy coaches w/ deeper literacy knowledge being deployed to schools at a target 1: 5 school ratio
(SCS)• Grade-level PLCs being deployed to deepen instructional delivery• Structured 90 minute literacy blocks being rolled out• Classroom space being organized to support small group instruction• Teacher learning progressions (what skills should develop at what rate) have been laid out to help
improve teachers' literacy foundational knowledge (SCS)
…however, some gaps in implementation at the classroom level (primarily SCS-focused; for discussion: do other districts face similar, additional challenges?)
• Limited use of formative assessments to inform small group instruction• Classrooms set up for small group instruction, but many either primarily use full group instruction or lack
instructional focus in small groups where teacher not present (doing busy work)• In recent observations of 12 Kindergarten teachers, only 2 (16%) following any instructional plan (SCS)• PLC time on calendar, but not necessarily right content and facilitation in place
Potential hypotheses on root causes of implementation gaps: • Teachers not adequately prepared to teach foundational literacy skills• No feedback loop to understand effectiveness of strategies• Need to continue focus on talent (e.g., Teacher Town, operator-specific retention efforts)
Clearly articulated
instructional framework
Aligned, differentiated
PD
Rigorous use of formative
assessments
Effective implementation of small group
instruction
Clearly articulated
teacher learning progressions
Source: BCG interviews and analysis
Elements of effective
instructional delivery, e.g.,:
15

85Draft—for discussion only
Possible areas of focus
Possible areas of focus to address root causes of implementation gaps in Shelby County
Teachers not adequately prepared to
teach foundational literacy skills
• Pre-service preparation (efforts underway nationally, e.g., Deans for Impact)• Deployment of literacy coaches / specialists • PLCs infused with right content and facilitation• Classroom observation with tailored PD
No feedback loop to understand
effectiveness of strategies
• Continuous improvements mechanisms and capacity to measure impact and implementation fidelity of key strategies (e.g., PLCs, coaches, wraparound, SEL, family programs) and make adjustments based on data and stakeholder feedback
Potential root causes
Limited talent pipeline
• Attraction and retention of effective educators, with at least proportional focus on the early grades (e.g., Teacher Town, district-specific retention efforts)
15

86Draft—for discussion only
TFA-sponsored support for instructional coaches in Dallas outlines several best practices 15
DISD model for training instructional coaches Key learnings
Check-in during
monthly 1-on1's
• Identify high-quality partner (e.g., TFA) with staff who can support training for instructional coaches
• Employees must (1) have strong content knowledge and (2) be able to share best practices for coachingteachers
• TFA teacher coaches held monthly group meetings for instructional coaches from schools in 2 feeders patterns in DISD (3 hours)
– First 90 minutes cover actual content that coaches need to cover with teachers
– Next 90 minutes cover best methods for conveying this content to teachers
• Consists of tactical topics, including building literacy foundations (assuming no prior knowledge), and how to use Istation results to plan student interventions
• TFA teacher coaches visit instructional coaches monthly in school to provide 1-on-1 support
• 1-on-1 meetings focused on how to implement learnings from group meetings
• For example, TFA teacher coaches observe and give coaches feedback on how to communicate with teachers, how to help teachers analyze gaps, etc.
Sequence to be repeated each month during academic school year
Lead monthly group
meetings
Develop partnership
Principal relationship
Coaches most effective when hired by principal and both have a shared vision for goals, role, responsibilities, etc.
Hands-on approach
Coaches require hands-on observation / feedback on "how" to best deliver content in a way that is useful to teachers
Dedicated resource
Coaches most effective when one coach assigned per school and not used to "backfill" for lunchroom monitor, etc.
AuthorityCoaches benefit when have authority so teachers feel compelled to adopt their advice
Baseline in place
Coaches more sustainable when starting point is clearly defined and specific goals and plan for measurement are in place
Source: Teach for America – Dallas interview

87Draft—for discussion only
Effective PLCs require structured meetings in a trusted environment that address key teaching challenges15
Source: American Institutes for Research, SEDL Insights
• Effective facilitators should be selected who are respected by teachers, guide productive conversation, and promote action-oriented discussions
• Facilitators must establish clear structure in PLCs so members understand the purpose and goals (e.g., selecting instructional strategies / assessment techniques, analyzing student work)
• PLCs should use formative benchmark and assessment data to determine the most pressing instructional needs for students so that most relevant topics can be covered at PLC meetings
• Use of mock PLC meeting videos allow teachers to identify key behaviors, practices, and dialogue that foster/inhibit collaboration during PLC meetings
• Learning walks, a process in which teams of school leaders and PLC facilitators participate in classroom observation, can be an effective tool to understand how decisions in PLC meetings are implemented in classrooms
• Teachers should be given individual feedback and the learning walk team members should also collaboratively create a summary of observations made across the school
• Learning walk feedback should be non-evaluative and should be another resource for teachers to take advantage of PLC experience and improve instructional delivery
• Leaders must model trusting relationships and create conditions where teachers can have open conversations that get them to reflect deeply about their teaching to understand individual strengths and challenge areas
• If principals are present at PLC meetings while teachers share instructional challenges, teachers should not be criticized or penalized, but instead recognized for their contributions
• School and district leaders need to ensure that teachers have adequate scheduled time to meet in PLCs and the necessary resources, tools, and instructional support to be successful
Clear structure
and purpose
Feedback mechanism
in place
Environment of trust and
support

88Draft—for discussion only
A closed-loop model should be used to inform continuous improvement in Shelby County
Implement the plan carefully
Make note of specific circumstances in place that may impact results of the programmatic changes
Where possible, initially implement changes on smaller scale (e..g pilot programs )
Generate hypothesis about potential new programs/initiatives or changes to existing programs/initiatives that will drive better student outcomes
Brainstorm best course of action to implement proposed change
Utilize available research capacity to analyze results from new or modified program/initiative
Understand impact of programcompared to previous results and expected results
Based on results, determine which (if any) components of the new or modified program/initiative were successful
Consider scaling effective programming
Reflect on less successful initiatives to understand what could be adjusted in the future to achieve better results
Identifyopportunity for
change Implement changes
Measure and analyzeresults
Usecontinuousfeedback
1
2
3
4
Strong analytical capacity is critical to the effective implementation of the continuous improvement model
15
Source: Carnegie Foundation, BCG experience

Continuum

90Draft—for discussion only
Single scorecard being piloted across country in effort to emphasize "continuum view" and track progress
Source: Organization websites, BCG experience
Organization Cradle-to-career components Learnings
Scorecards focused on measuring minimum sufficient, yet comprehensive set of measures
Intermediary indicators tracked with greater frequency than once annually to inform more immediate action
Goals set for metrics are based on historical trajectory and state and national averages
Scorecards are dynamic not static (e.g., Commit! adding a social emotional assessment as part of its Kindergarten readiness indicator in 2017)
Dallas
PeopleFirst Partnership
Used in 60 and neighborhoodsacross the US
Kindergarten readiness
Middle school math
Post secondary access
Thirdgrade reading
High school graduation
College and career readiness
6 indicators across spectrum
Kindergarten readiness
(3 indicators)
Middle schoolparticipation rate
(2 indicators)
Academicproficiency
% graduating from high school
College access and completion
(2 indicators)
15 indicators across spectrum(including 6 indicators for health, safety and family)
11 indicators across spectrum
3rd Grade reading
Kindergarten readiness
4th grade math
8th grade math
8th grade science
10th/11th
grade PSAT
Percent college ready per SAT/ACT
High school graduation
Post-secondary enrollment
1st year post-secondary retention
Post-secondary completion
Early childhood (Birth–3rd grade) 4th–12th grade
Higher education and workplace
17
Tennessee

91Draft—for discussion only
County-wide scorecard metrics: criteria for inclusion17
Criteria for scorecard metrics
Aligned to 3rd grade literacy
Measurable
Not redundant
Multi-dimensional focus
Succinct yet comprehensive
Should be contributing factors to 3rd grade reading
proficiency
Should be measurable and have a path forward on data
collection
Should not be repetitive or highly correlated with one
another
Collectively represent whole child measures (e.g. health, social-emotional, academic)
Represent comprehensive view of ECE in the most succinct way possible
Full continuum focus
Collectively focus on all stages of continuum
Full set of metrics should be evaluated together to
ensure criteria are met
Metrics considered but excluded
• % of children with recommended immunizations – beyond a certain threshold (which Shelby County has achieved) does not significantly contribute to 3rd grade literacy
• % with access to non-emergency medical care – difficult to determine standardized view of what constitutes non-emergency care, and no clear path to measurement
• % of children with 5+ servings of fruits and vegetables daily -requires knowledge of food consumed both at home and at school for each child, making measurement difficult
• % of children requiring serious disciplinary action - disciplinary action measures used subjectively and difficult to measure across county
Metrics to be evaluated
independently to ensure
criteria are met

92Draft—for discussion only
Stakeholder groups can use scorecard metrics to understand areas of highest need for strategic planning
• Identify strategic areas for improvement• Inform resource allocation• Inform policies, procedures, and
operations to improve performance on lagging metrics
• Share best practices across school districts
School districts
• Identify strategic areas for improvement• Inform resource allocation
Hospitals and public health providers
• Understand Shelby County progress and performance on key early education metrics
Teachers, staff, general public
• Inform state goals in early education• Inform resource allocation to health and
education initiatives
Local and state government
• Inform highest areas of need within early childhood educationPhilanthropists
Stakeholder Use of scorecard
Goa
l-Set
ting
• Scorecard targets should be informed by historical Shelby County data, state and national averages
• Target metrics should assume reasonable levels of progress given Shelby County areas of focus
Freq
uenc
y • Scorecard data should be updated annually to provide various stakeholder groups with current view on progress towards collective goals
Rev
isio
ns
• Scorecard should be revisited frequently (e.g. at least annually) to determine if metrics and/or targets should be added or removed
• Current research on early indicators of 3rd grade proficiency should inform changes
Implementation Scorecard Use
17
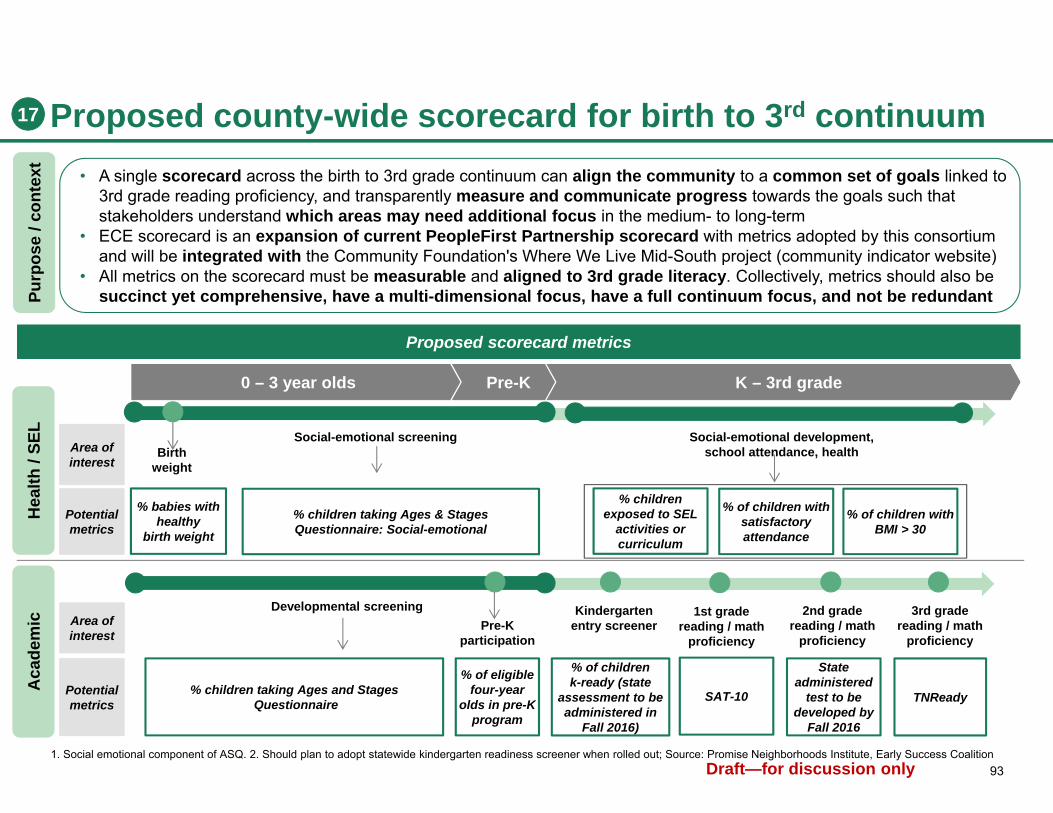
93Draft—for discussion only
Proposed county-wide scorecard for birth to 3rd continuum
Pre-K participation
Kindergarten entry screener
3rd gradereading / math
proficiency
2nd grade reading / math
proficiency
Aca
dem
icH
ealth
/ SE
L
Developmental screening
Social-emotional development, school attendance, health
Social-emotional screening
0 – 3 year olds Pre-K K – 3rd grade
Area of interest
Potential metrics
Area of interest
Potential metrics
Birth weight
Purp
ose
/ con
text
Proposed scorecard metrics
% babies with healthy
birth weight
% of eligible four-year
olds in pre-K program
% of children k-ready (state
assessment to be administered in
Fall 2016)
State administered
test to be developed by
Fall 2016
TNReady% children taking Ages and StagesQuestionnaire
% of children with satisfactory attendance
% of children with BMI > 30
1. Social emotional component of ASQ. 2. Should plan to adopt statewide kindergarten readiness screener when rolled out; Source: Promise Neighborhoods Institute, Early Success Coalition
• A single scorecard across the birth to 3rd grade continuum can align the community to a common set of goals linked to 3rd grade reading proficiency, and transparently measure and communicate progress towards the goals such that stakeholders understand which areas may need additional focus in the medium- to long-term
• ECE scorecard is an expansion of current PeopleFirst Partnership scorecard with metrics adopted by this consortium and will be integrated with the Community Foundation's Where We Live Mid-South project (community indicator website)
• All metrics on the scorecard must be measurable and aligned to 3rd grade literacy. Collectively, metrics should also be succinct yet comprehensive, have a multi-dimensional focus, have a full continuum focus, and not be redundant
% children exposed to SEL
activities or curriculum
% children taking Ages & Stages Questionnaire: Social-emotional
1st grade reading / math
proficiency
SAT-10
17
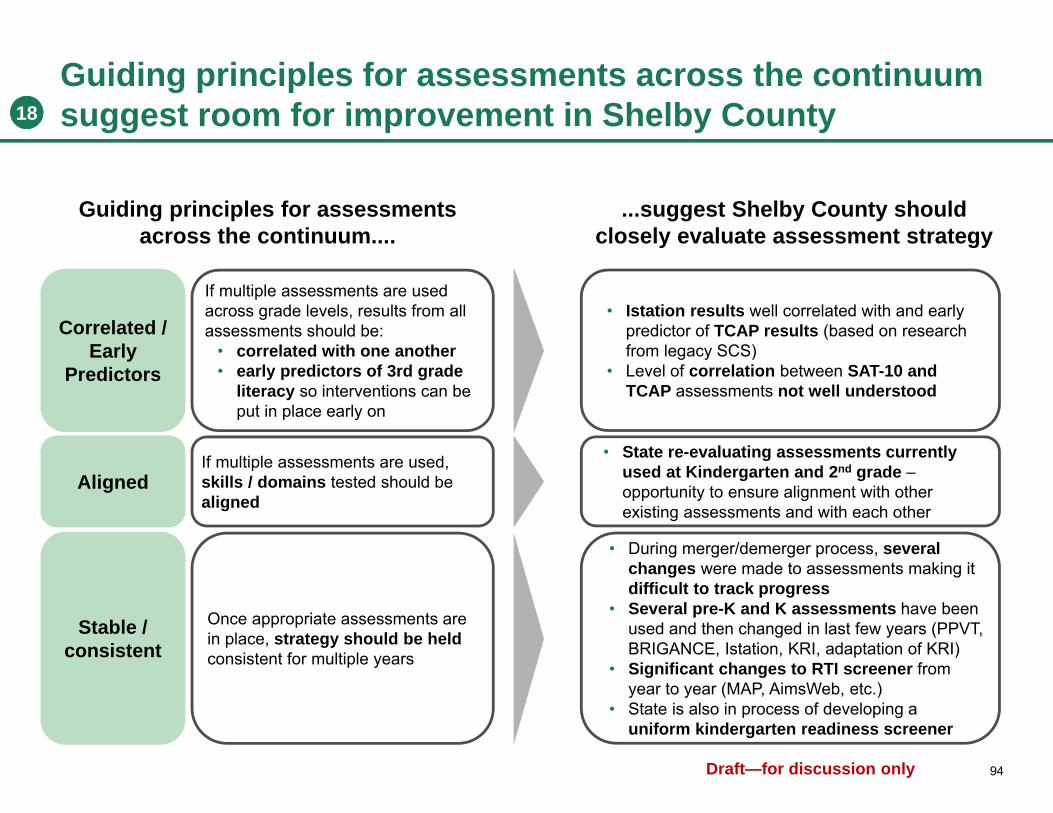
94Draft—for discussion only
Guiding principles for assessments across the continuum suggest room for improvement in Shelby County
...suggest Shelby County should closely evaluate assessment strategy
Guiding principles for assessments across the continuum....
If multiple assessments are used across grade levels, results from all assessments should be:
• correlated with one another• early predictors of 3rd grade
literacy so interventions can be put in place early on
If multiple assessments are used, skills / domains tested should be aligned
Once appropriate assessments are in place, strategy should be held consistent for multiple years
Correlated / Early
Predictors
Aligned
Stable / consistent
• Istation results well correlated with and early predictor of TCAP results (based on research from legacy SCS)
• Level of correlation between SAT-10 and TCAP assessments not well understood
• State re-evaluating assessments currently used at Kindergarten and 2nd grade –opportunity to ensure alignment with other existing assessments and with each other
• During merger/demerger process, several changes were made to assessments making it difficult to track progress
• Several pre-K and K assessments have been used and then changed in last few years (PPVT, BRIGANCE, Istation, KRI, adaptation of KRI)
• Significant changes to RTI screener from year to year (MAP, AimsWeb, etc.)
• State is also in process of developing a uniform kindergarten readiness screener
18
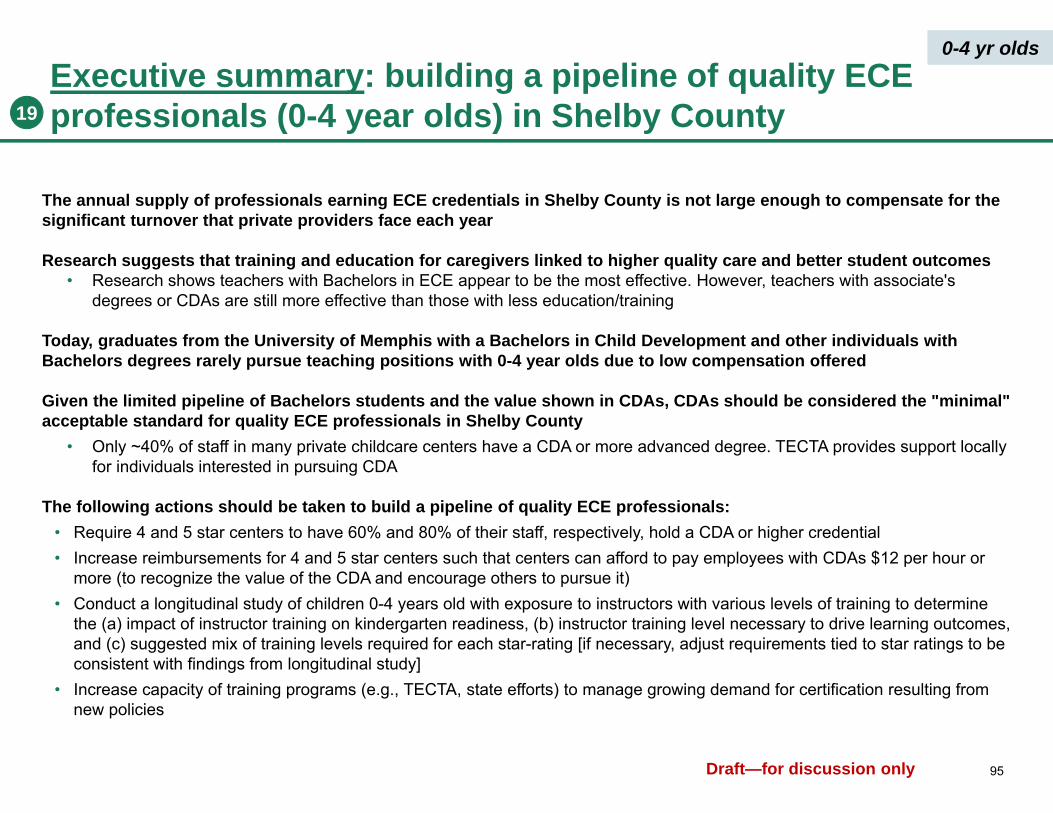
95Draft—for discussion only
Executive summary: building a pipeline of quality ECE professionals (0-4 year olds) in Shelby County
The annual supply of professionals earning ECE credentials in Shelby County is not large enough to compensate for the significant turnover that private providers face each year
Research suggests that training and education for caregivers linked to higher quality care and better student outcomes• Research shows teachers with Bachelors in ECE appear to be the most effective. However, teachers with associate's
degrees or CDAs are still more effective than those with less education/training
Today, graduates from the University of Memphis with a Bachelors in Child Development and other individuals with Bachelors degrees rarely pursue teaching positions with 0-4 year olds due to low compensation offered
Given the limited pipeline of Bachelors students and the value shown in CDAs, CDAs should be considered the "minimal" acceptable standard for quality ECE professionals in Shelby County
• Only ~40% of staff in many private childcare centers have a CDA or more advanced degree. TECTA provides support locally for individuals interested in pursuing CDA
The following actions should be taken to build a pipeline of quality ECE professionals:• Require 4 and 5 star centers to have 60% and 80% of their staff, respectively, hold a CDA or higher credential• Increase reimbursements for 4 and 5 star centers such that centers can afford to pay employees with CDAs $12 per hour or
more (to recognize the value of the CDA and encourage others to pursue it)• Conduct a longitudinal study of children 0-4 years old with exposure to instructors with various levels of training to determine
the (a) impact of instructor training on kindergarten readiness, (b) instructor training level necessary to drive learning outcomes, and (c) suggested mix of training levels required for each star-rating [if necessary, adjust requirements tied to star ratings to be consistent with findings from longitudinal study]
• Increase capacity of training programs (e.g., TECTA, state efforts) to manage growing demand for certification resulting fromnew policies
19
0-4 yr olds
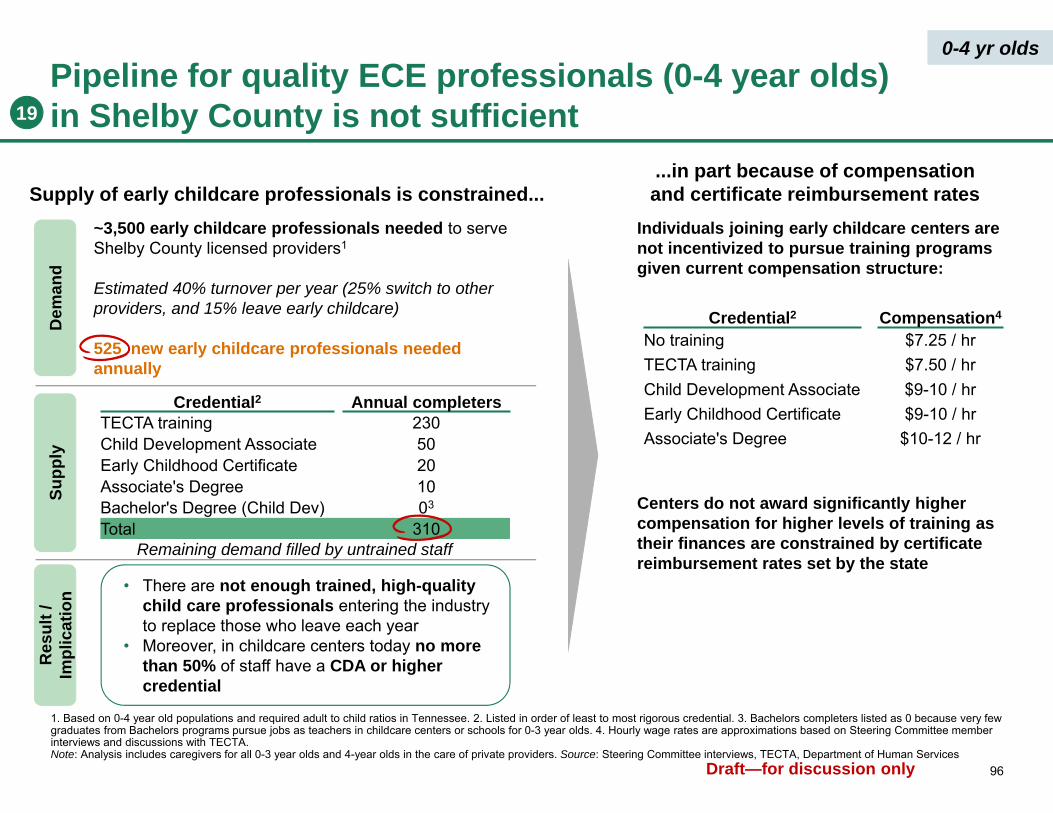
96Draft—for discussion only
Pipeline for quality ECE professionals (0-4 year olds) in Shelby County is not sufficient
Supply of early childcare professionals is constrained...
1. Based on 0-4 year old populations and required adult to child ratios in Tennessee. 2. Listed in order of least to most rigorous credential. 3. Bachelors completers listed as 0 because very few graduates from Bachelors programs pursue jobs as teachers in childcare centers or schools for 0-3 year olds. 4. Hourly wage rates are approximations based on Steering Committee member interviews and discussions with TECTA.Note: Analysis includes caregivers for all 0-3 year olds and 4-year olds in the care of private providers. Source: Steering Committee interviews, TECTA, Department of Human Services
Supp
lyD
eman
d
Credential2 Annual completersTECTA training 230Child Development Associate 50Early Childhood Certificate 20Associate's Degree 10Bachelor's Degree (Child Dev) 03
Total 310
~3,500 early childcare professionals needed to serve Shelby County licensed providers1
Estimated 40% turnover per year (25% switch to other providers, and 15% leave early childcare)
525 new early childcare professionals needed annually
Res
ult /
Im
plic
atio
n • There are not enough trained, high-quality child care professionals entering the industry to replace those who leave each year
• Moreover, in childcare centers today no more than 50% of staff have a CDA or higher credential
Remaining demand filled by untrained staff
...in part because of compensation and certificate reimbursement rates
Individuals joining early childcare centers are not incentivized to pursue training programs given current compensation structure:
Credential2 Compensation4
No training $7.25 / hrTECTA training $7.50 / hrChild Development Associate $9-10 / hrEarly Childhood Certificate $9-10 / hrAssociate's Degree $10-12 / hr
Centers do not award significantly higher compensation for higher levels of training as their finances are constrained by certificate reimbursement rates set by the state
19
0-4 yr olds
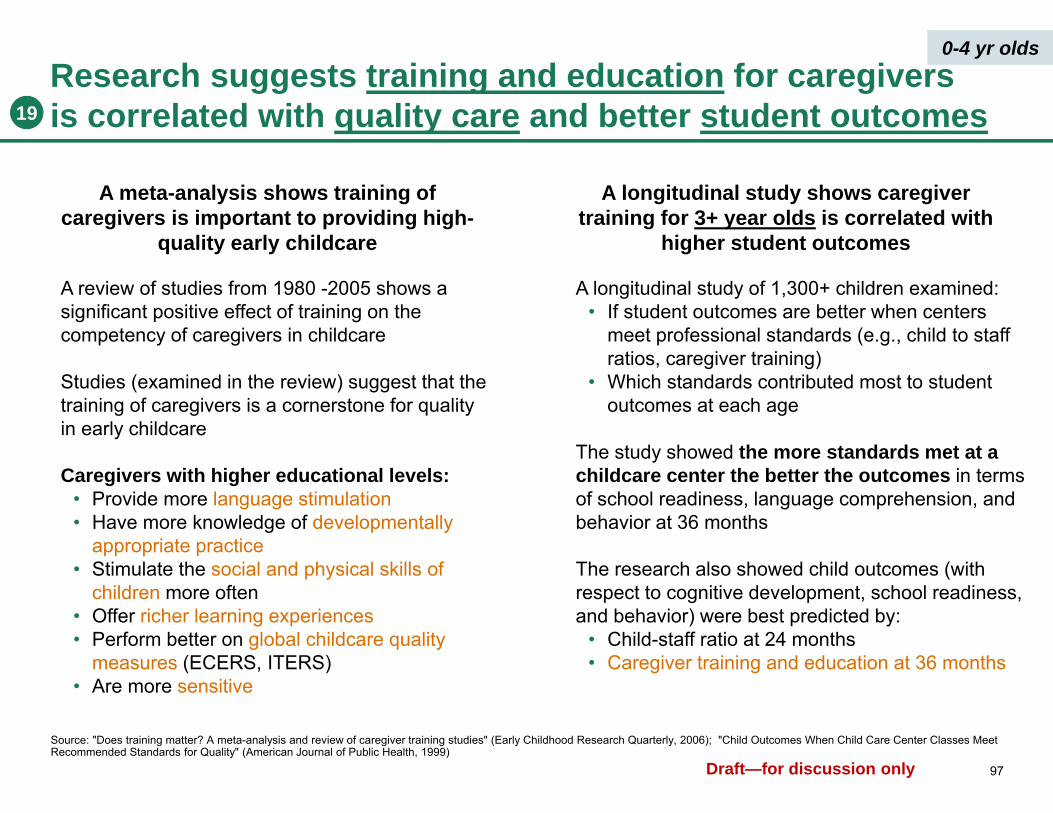
97Draft—for discussion only
Research suggests training and education for caregivers is correlated with quality care and better student outcomes
A meta-analysis shows training of caregivers is important to providing high-
quality early childcare
A review of studies from 1980 -2005 shows a significant positive effect of training on the competency of caregivers in childcare
Studies (examined in the review) suggest that the training of caregivers is a cornerstone for quality in early childcare
Caregivers with higher educational levels:• Provide more language stimulation• Have more knowledge of developmentally
appropriate practice• Stimulate the social and physical skills of
children more often• Offer richer learning experiences• Perform better on global childcare quality
measures (ECERS, ITERS)• Are more sensitive
A longitudinal study shows caregiver training for 3+ year olds is correlated with
higher student outcomes
A longitudinal study of 1,300+ children examined:• If student outcomes are better when centers
meet professional standards (e.g., child to staff ratios, caregiver training)
• Which standards contributed most to student outcomes at each age
The study showed the more standards met at a childcare center the better the outcomes in terms of school readiness, language comprehension, and behavior at 36 months
The research also showed child outcomes (with respect to cognitive development, school readiness, and behavior) were best predicted by:
• Child-staff ratio at 24 months • Caregiver training and education at 36 months
Source: "Does training matter? A meta-analysis and review of caregiver training studies" (Early Childhood Research Quarterly, 2006); "Child Outcomes When Child Care Center Classes Meet Recommended Standards for Quality" (American Journal of Public Health, 1999)
19
0-4 yr olds

98Draft—for discussion only
Additional research suggests CDAs, Associates, and Bachelors degrees are correlated with higher quality care
Non
-cre
dit
trai
ning
Teachers with non-credit training (e.g., workshops) show mixed results• A study of regulated family child care providers from three communities
examined the impact of noncredit training on childcare quality through the Family-to-Family program. At two sites, average global quality increased modestly, and at the third site no change was noted. Average process quality did not change at any site
CD
A
Teachers with a CDA are more effective than those with only high school• Study of 400+ classrooms of infants, toddlers, and preschoolers found:
– Children with teachers who have CDA training received a higher frequency of positive initiation than children in other classrooms
– Children whose teachers had a least a BA in ECE or CDA training had higher frequencies of language play and positive management
Ass
ocia
te's
D
egre
e
Teachers with associate's degree training provide more developmentally appropriate care
• Study of teachers with > 12 credit hours of coursework in associate's degree program showed they provided higher quality care. These teachers showed:
– Significant gains on ECERS / ITERS and the Teacher Belief Scale – More developmentally appropriate care (measured by ECERS / ITERS)
Bac
helo
r's
Deg
ree
Teachers with bachelor's degrees provide higher quality care• Study analyzing 227 child care centers found bachelor's degree teachers were
more sensitive, less harsh / detached, and more appropriate in caregiving with infants, toddlers, and preschoolers than teacher's without a bachelor's
– Study also revealed that children in programs with sensitive and responsive teachers received higher language scores than other children
Supporting research
Note: While the majority of research shows caregiver training/education results in higher quality care, some studies found differing results on the impact of training/education with different age groupsSource: Impact of Training and Education for Caregivers of Infants and Toddlers (National Center for Children in Poverty, 2005); "Early Education Quality: Higher Teacher Qualifications forBetter Learning Environments" (Whitebook, 2003); The effect of education on child care teachers' beliefs and classroom quality (Cassidy, 1995); "Bachelor's Degrees Are Best: Higher Qualifications for Pre-Kindergarten Teachers Lead to Better Learning Environments for Children" (Whitebook, 2003)
Learnings
Several studies show teachers with CDAs, Associates, and Bachelors degrees provide higher quality care (compared to control groups)
• Research on non-credit training is mixed
When degrees are compared, one study showed that teachers with the most advanced education (e.g., Bach. in ECE) appeared to be most effective. However, teachers with associate's degrees / CDAs were still more effective than those with less education / training
19
0-4 yr olds
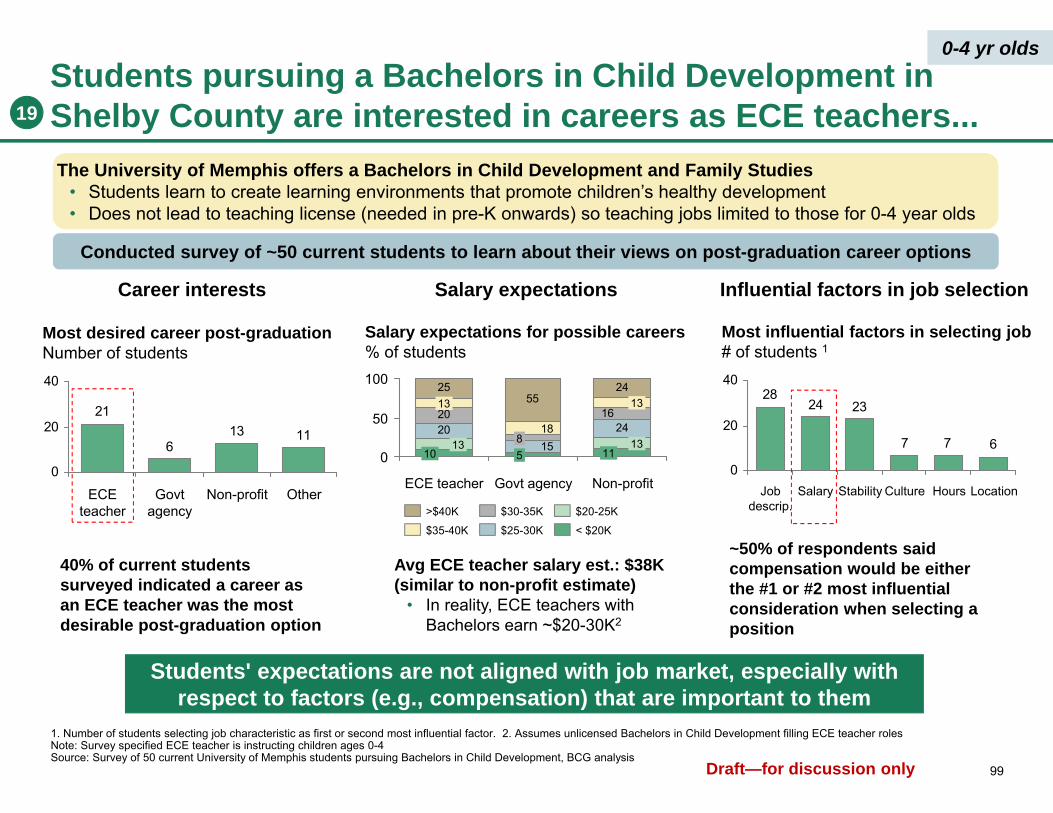
99Draft—for discussion only
Students pursuing a Bachelors in Child Development in Shelby County are interested in careers as ECE teachers...
1. Number of students selecting job characteristic as first or second most influential factor. 2. Assumes unlicensed Bachelors in Child Development filling ECE teacher rolesNote: Survey specified ECE teacher is instructing children ages 0-4Source: Survey of 50 current University of Memphis students pursuing Bachelors in Child Development, BCG analysis
The University of Memphis offers a Bachelors in Child Development and Family Studies• Students learn to create learning environments that promote children’s healthy development • Does not lead to teaching license (needed in pre-K onwards) so teaching jobs limited to those for 0-4 year olds
Students' expectations are not aligned with job market, especially with respect to factors (e.g., compensation) that are important to them
Career interests Salary expectations Influential factors in job selection
Conducted survey of ~50 current students to learn about their views on post-graduation career options
11136
21
0
20
40
Non-profitECE teacher
Govt agency
Other
Most desired career post-graduationNumber of students
40% of current students surveyed indicated a career as an ECE teacher was the most desirable post-graduation option
Avg ECE teacher salary est.: $38K (similar to non-profit estimate)
• In reality, ECE teachers with Bachelors earn ~$20-30K2
~50% of respondents said compensation would be either the #1 or #2 most influential consideration when selecting a position
20 24
2555
24
15
162018
100
50
0 118
Govt agency Non-profitECE teacher
Salary expectations for possible careers% of students
1313
10 51313
$35-40K
$20-25K
< $20K
>$40K $30-35K
$25-30K
677
232428
0
20
40
Culture LocationStabilityJob descrip.
HoursSalary
Most influential factors in selecting job# of students 1
19
0-4 yr olds
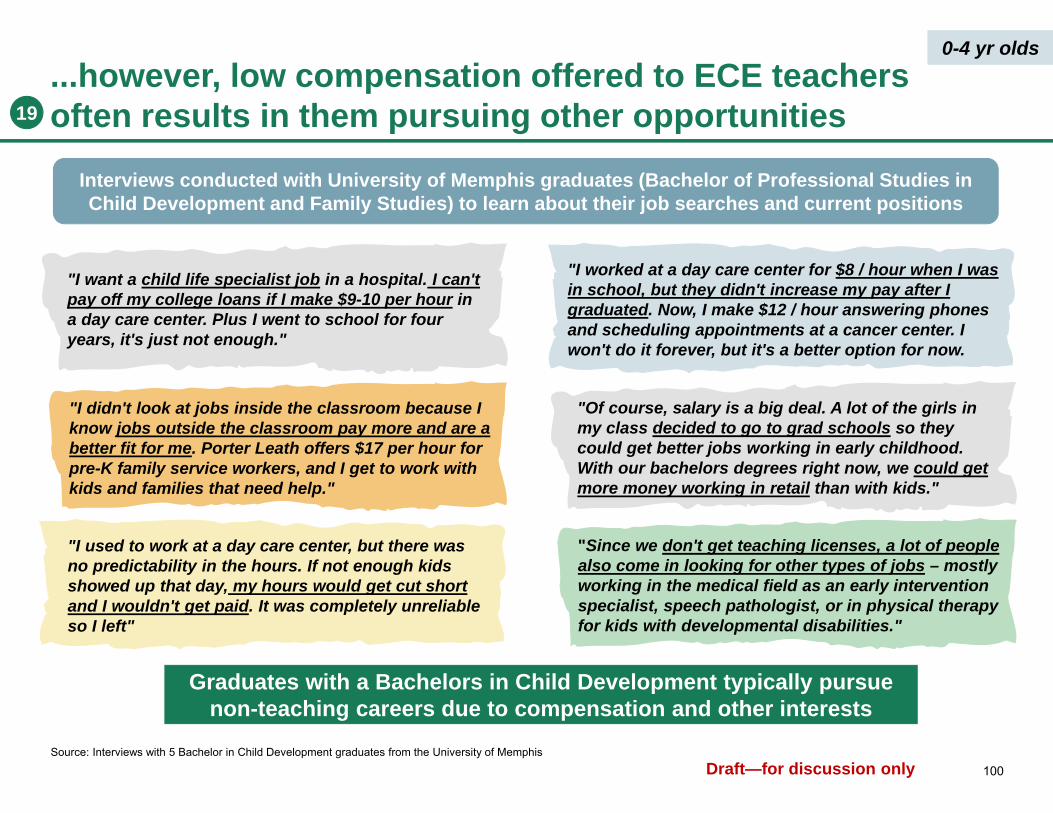
100Draft—for discussion only
...however, low compensation offered to ECE teachers often results in them pursuing other opportunities
"I didn't look at jobs inside the classroom because I know jobs outside the classroom pay more and are a better fit for me. Porter Leath offers $17 per hour for pre-K family service workers, and I get to work with kids and families that need help."
"I want a child life specialist job in a hospital. I can't pay off my college loans if I make $9-10 per hour in a day care center. Plus I went to school for four years, it's just not enough."
"I used to work at a day care center, but there was no predictability in the hours. If not enough kids showed up that day, my hours would get cut short and I wouldn't get paid. It was completely unreliable so I left"
Interviews conducted with University of Memphis graduates (Bachelor of Professional Studies in Child Development and Family Studies) to learn about their job searches and current positions
"Since we don't get teaching licenses, a lot of people also come in looking for other types of jobs – mostly working in the medical field as an early intervention specialist, speech pathologist, or in physical therapy for kids with developmental disabilities."
"Of course, salary is a big deal. A lot of the girls in my class decided to go to grad schools so they could get better jobs working in early childhood. With our bachelors degrees right now, we could get more money working in retail than with kids."
"I worked at a day care center for $8 / hour when I was in school, but they didn't increase my pay after I graduated. Now, I make $12 / hour answering phones and scheduling appointments at a cancer center. I won't do it forever, but it's a better option for now.
Graduates with a Bachelors in Child Development typically pursue non-teaching careers due to compensation and other interests
Source: Interviews with 5 Bachelor in Child Development graduates from the University of Memphis
19
0-4 yr olds

101Draft—for discussion only
0-4 year old educator pipeline: credential overview
Childcare type
High school2
High school + TECTA3 CDA
ECE Certificate
Assoc. degree
Bach. degree
Bach. degree + license
Private day care ~40% ~20% ~40% <5% <5% 0% 0%
NAEYC operated center
0% ~15% ~40% <5% ~15% ~30% <5%
Early Head Start 0% 0% ~15% <5% ~20% ~55% ~10%
Head Start 0% 0% ~30% <5% ~25% ~40% ~5%
SCS CommunityPartner
0% 0% ~50% <5% <5% ~15% ~35%
SCS VPK 0% ~10% <5% <5% ~40% 0% ~50%
Educator training / credential1Figures below reflect percentage of staff with that training level for a given center type
Implications
If a CDA is considered the "minimal" acceptable standard, private childcare centerswill require support to (a) hire new staff, or (b) train current staff
• Only ~40% of staff in private centers have a CDA credential
In addition to support for private providers, capacity must be built for resources (e.g., courses) required to earn CDA by expanding TECTA's CDA support program
1.Training listed from least to most rigorous. 2. Includes employees with high school graduation at most. 3. Training includes TECTA training or other short courses or workshops outside of a recognized credential. Also includes those who have passed the ParaPro AssessmentNote: Includes assistant teachers as well as lead teachers. Figures above are estimates based on expert interviews. Source: Interviews with Steering Committee members, TECTA, SCS
19
0-4 yr olds

102Draft—for discussion only
0-4 year old educator pipeline: compensation overviewAll compensation figures adjusted to reflect hourly wage; figures represent starting wage for newly trained employees
Educator training / credential1
Childcare type
High school2
High school + TECTA3 CDA
ECE Certificate
Assoc. degree
Bach. degree
Bach. degree + license
Private day care 7 8 9 10 10 NA NA
NAEYC operated center
NA 9 10 10 12 16 20
Early Head Start4 NA NA 10 10 11 12 18
Head Start4 NA NA 12 12 13 15 22
SCS CommunityPartner
NA NA 11 12 12 18 18
SCS VPK NA 13 13 13 13 NA 22
1.Training listed from least to most rigorous. 2. Includes employees with high school graduation at most. 3. Training includes TECTA training or other short courses or workshops outside of a recognized credential. Also includes those have passed the ParaPro Assessment. 4. Compensation shown is average of assistant teachers and teachers with same credential levelsNote: Includes assistant teachers as well as lead teachers. Figures above are estimates based on expert interviews. Source: Interviews with Steering Committee members, TECTA, SCS
Implications
If 4-star and 5-star ratings require 60% and 80% of employees, respectively, to have at least CDAs, their staff costs will increase meaningfully
For enough people to consider pursuing a CDA, wages may need to be raised to $12/hr, which would further increase costs for centers
An average center could incur the following incremental costs annually to comply with new regulations:
• 4 star center: $45K• 5 star center: $70K
19
0-4 yr olds
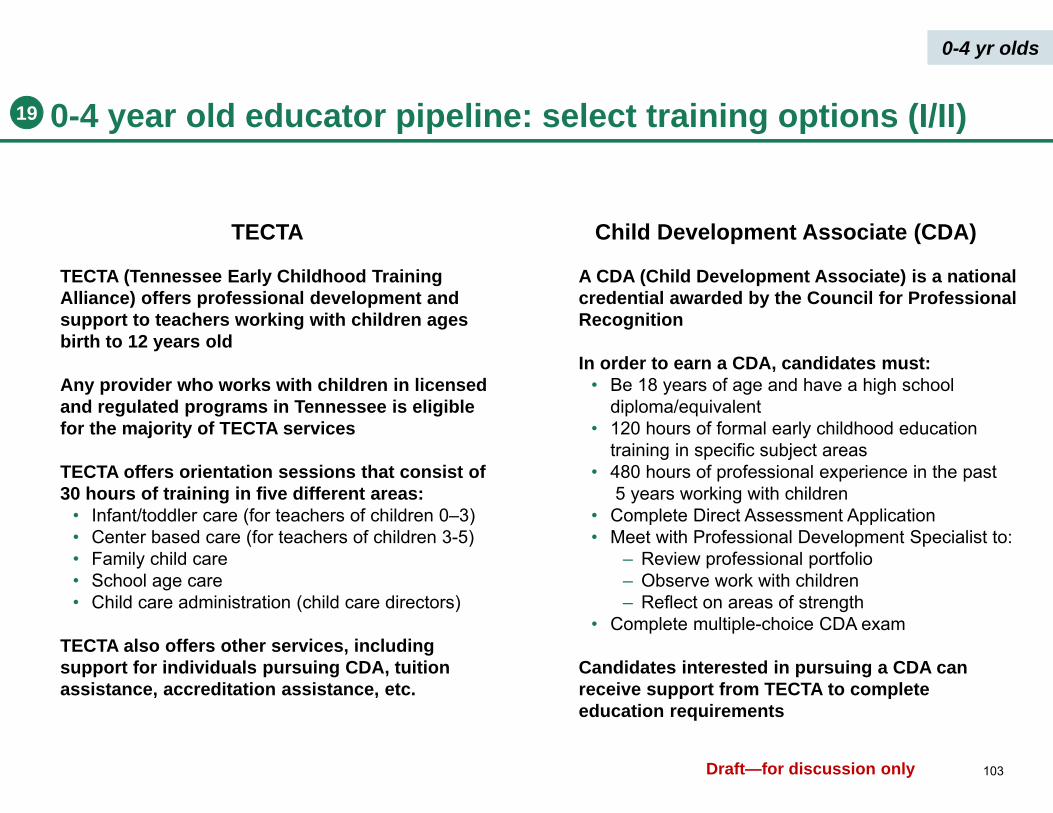
103Draft—for discussion only
0-4 year old educator pipeline: select training options (I/II)
TECTA
TECTA (Tennessee Early Childhood Training Alliance) offers professional development and support to teachers working with children ages birth to 12 years old
Any provider who works with children in licensed and regulated programs in Tennessee is eligible for the majority of TECTA services
TECTA offers orientation sessions that consist of 30 hours of training in five different areas:
• Infant/toddler care (for teachers of children 0–3)• Center based care (for teachers of children 3-5)• Family child care• School age care• Child care administration (child care directors)
TECTA also offers other services, including support for individuals pursuing CDA, tuition assistance, accreditation assistance, etc.
Child Development Associate (CDA)
A CDA (Child Development Associate) is a national credential awarded by the Council for Professional Recognition
In order to earn a CDA, candidates must:• Be 18 years of age and have a high school
diploma/equivalent• 120 hours of formal early childhood education
training in specific subject areas • 480 hours of professional experience in the past
5 years working with children• Complete Direct Assessment Application• Meet with Professional Development Specialist to:
– Review professional portfolio– Observe work with children– Reflect on areas of strength
• Complete multiple-choice CDA exam
Candidates interested in pursuing a CDA can receive support from TECTA to complete education requirements
19
0-4 yr olds
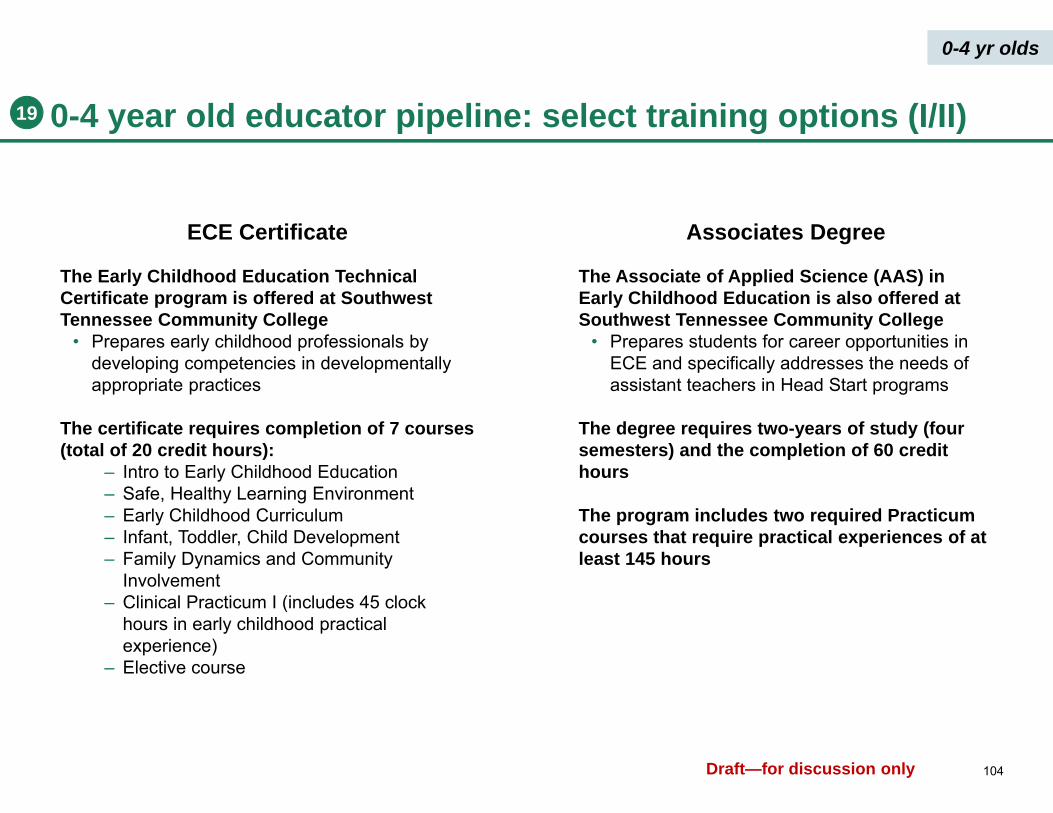
104Draft—for discussion only
0-4 year old educator pipeline: select training options (I/II)
ECE Certificate
The Early Childhood Education Technical Certificate program is offered at Southwest Tennessee Community College
• Prepares early childhood professionals by developing competencies in developmentally appropriate practices
The certificate requires completion of 7 courses (total of 20 credit hours):
– Intro to Early Childhood Education– Safe, Healthy Learning Environment– Early Childhood Curriculum– Infant, Toddler, Child Development– Family Dynamics and Community
Involvement– Clinical Practicum I (includes 45 clock
hours in early childhood practical experience)
– Elective course
Associates Degree
The Associate of Applied Science (AAS) in Early Childhood Education is also offered at Southwest Tennessee Community College
• Prepares students for career opportunities in ECE and specifically addresses the needs of assistant teachers in Head Start programs
The degree requires two-years of study (four semesters) and the completion of 60 credit hours
The program includes two required Practicum courses that require practical experiences of at least 145 hours
19
0-4 yr olds

105Draft—for discussion only
Executive summary: both existing and new efforts should be considered to address the K-3rd teacher shortage
Current K-3rd grade teacher shortage
There is a nationwide shortage of K-12th grade teachers today
The shortage disproportionately impacts rural / low-income districts, including Shelby County
• There are still ~150 teacher vacancies in SCS today (including 60 elementary teacher vacancies)
• Vacancies caused in part by diminishing pipelines from Univ. of Memphis and other organizations
– For example, SCS had 95 TFA corps members last year, but only 57 members this year
Existing pipeline expansion efforts
Districts are taking actions to increase teacher pipeline
• Modifying application to be "candidate friendly"
• Reaching out to previous applicants
• Focusing on nearby states, especially where supply exceeds demand (e.g., Kentucky)
• Targeting career changers
External groups are also focusing on growth initiatives
• Investing in recruiting and training talent through alternative pre-service programs:
• Enhancing brand of teaching in Memphis (e.g., billboards, www.teach901.com)
Other pipeline expansion efforts for consideration
Innovative approaches to expanding teacher pipeline can begin in high school
• Launching Teacher Cadet course/program in high schools to expose students to practice of teaching
• Offering college scholarships for students who agree to teach in Shelby County for a certain number of years
Other efforts can include adding more teacher leader roles that give skilled teachers more responsibility and increased compensation as a retention strategy
• Expanding partnership with Leading Educators
Source: Shelby County Schools, Steering Committee member interviews, Teacher Town, NPR, New York Times, US News & World Report
19
K-3rd

106Draft—for discussion only
There is a significant shortage of elementary school teachers in Shelby County today
There is a nationwide shortage of K-12th grade teachers that exists today• During the economic downtown, several college students chose to pursue careers in
teaching which were perceived to be more stable• In the last few years as the economy has recovered, fewer graduating college students are
joining the workforce as teachers• In select teaching programs, enrollment is down more than 50% over the past five years• This shortage disproportionately impacts rural and low-income districts, including Shelby
County
Furthermore, there is significant evidence of a teacher shortage in Shelby County• Shelby County Schools typically makes 600-800 external hires annually• SCS had 50 teacher vacancies on first day of in-service, and 70 teacher vacancies on the
first day of school– Vacancies can increase during the school year as retirement dates are not aligned with
the school year• Today, there are still 150 teacher vacancies in SCS (including 60 elementary teacher
vacancies)• Vacancies are caused in part by diminishing pipelines from the University of Memphis and
other organizations (both traditional and alternative pre-service programs)– For example, SCS had 95 TFA corps members last year, but only 57 members this year
Shelby County
Nationwide
Source: Shelby County Schools, Steering Committee member interviews, NPR, New York Times, US News & World Report
19
K-3rd
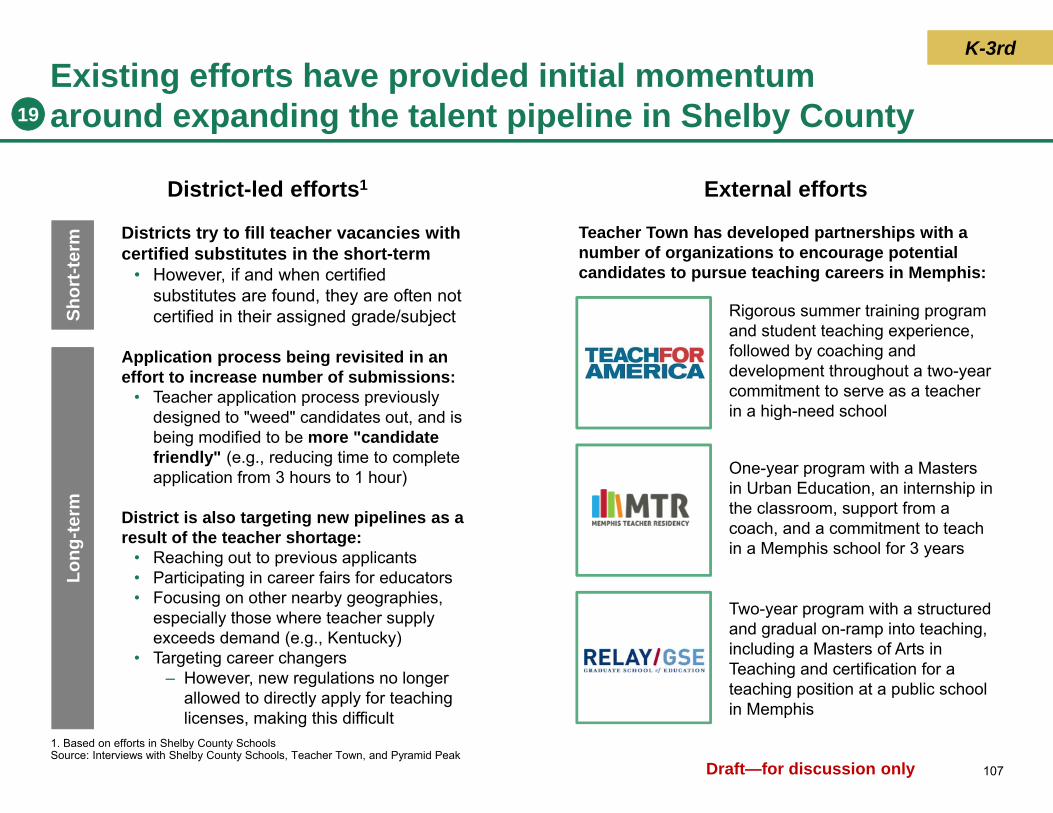
107Draft—for discussion only
Existing efforts have provided initial momentum around expanding the talent pipeline in Shelby County 19
District-led efforts1
Districts try to fill teacher vacancies with certified substitutes in the short-term
• However, if and when certified substitutes are found, they are often not certified in their assigned grade/subject
Application process being revisited in an effort to increase number of submissions:
• Teacher application process previously designed to "weed" candidates out, and is being modified to be more "candidate friendly" (e.g., reducing time to complete application from 3 hours to 1 hour)
District is also targeting new pipelines as a result of the teacher shortage:
• Reaching out to previous applicants• Participating in career fairs for educators• Focusing on other nearby geographies,
especially those where teacher supply exceeds demand (e.g., Kentucky)
• Targeting career changers – However, new regulations no longer
allowed to directly apply for teaching licenses, making this difficult
External efforts
Teacher Town has developed partnerships with a number of organizations to encourage potential candidates to pursue teaching careers in Memphis:
Long
-term
Shor
t-ter
m
1. Based on efforts in Shelby County SchoolsSource: Interviews with Shelby County Schools, Teacher Town, and Pyramid Peak
Rigorous summer training program and student teaching experience, followed by coaching and development throughout a two-year commitment to serve as a teacher in a high-need school
One-year program with a Masters in Urban Education, an internship in the classroom, support from a coach, and a commitment to teach in a Memphis school for 3 years
Two-year program with a structured and gradual on-ramp into teaching, including a Masters of Arts in Teaching and certification for a teaching position at a public school in Memphis
K-3rd

108Draft—for discussion only
Teacher Town-facilitated efforts have targeted increasing awareness and enhancing the brand of teaching
Improve respect and prestige of teaching through high profile marketing efforts
Previously implemented a high profile marketing campaign in Memphis to transform how the city views teachers
The "I teach. I am" campaign showed the faces of 20 of Memphis' best teachers on billboards, in-school posters, social media, and other mediums
Support district marketing and recruiting of teachers through a centralized website
Partnered with City Leadership to develop a state of the art website to promote teaching in Memphis and connect candidates to open positions (www.teach901.com)
The website markets the "Teacher Town, USA" mission to become the hub for excellent teaching and highlights the positive aspects of living in Memphis
In addition to developing partnerships with organizations to recruit teachers, Teacher Town also works alongside organizations to: 1) enhance awareness and marketing efforts targeted at teachers; 2) help new teachers adapt to Memphis; 3) promote professional development opportunities for teachers; and 4) play an advocacy role to influence legislation and community narrative
Sources: Stanford Social Innovation Review, http://www.teach901.com/; http://www.alleycatnyc.com/work/i-teach.-i-am-campaign/
19
K-3rd

109Draft—for discussion only
There are several innovative approaches to expanding the talent pipeline for teachers beginning in high school19
Teacher Cadet Program
The Teacher Cadet program exposes talented high school students in select states to teaching and encourages them to pursue it as a career
• Offered as a dual credit course (high school and college credit) in some states
• Typically taught for a minimum of one class period per day for a year
• Some programs include a “field experience" where high school students work in elementary schools to get exposure to a real classroom
• Program currently in place in Arkansas, North Carolina, and South Carolina
• In North Carolina, 25%+ who were Teacher Cadets in high school became Teaching Fellows (scholarship program for top students training to be teachers)
Golden Apple Scholars
The Golden Apple Scholars identifies talented high school seniors (and first and second-year college students) who have the promise and drive to be excellent teachers in high-need schools
• Awarded significant tuition assistance to attend select colleges
• Participate in teaching internships and seminars on the art and craft of teaching through a residential Summer Institute
• Receive mentorship from a Golden Apple teacher
• Scholars agree to teach for five years in an Illinois School of Need1
• 82% of Golden Apple Scholars teach 5+ years in schools of need
Impa
ctD
escr
iptio
n
1. Tuition assistance converts into a loan if five year teaching requirement is not completedSource: Teacher Cadet Program (North Carolina, South Carolina, Arkansas); Golden Apple Scholars Program
K-3rd
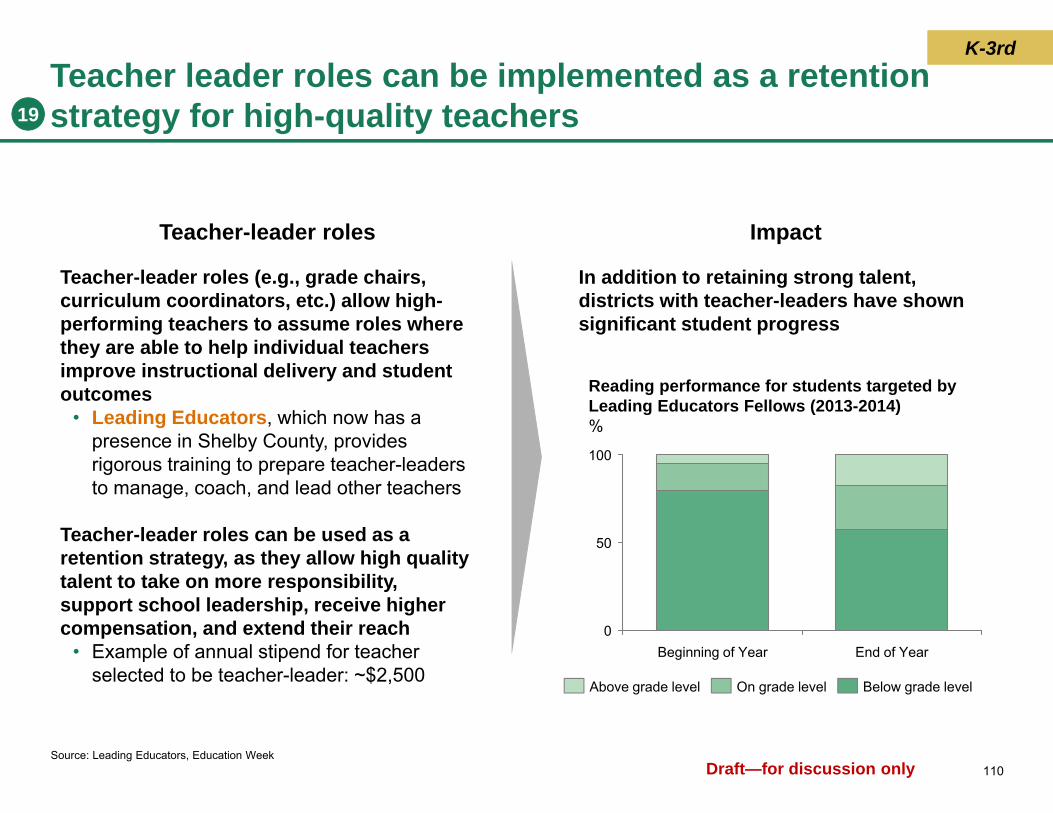
110Draft—for discussion only
Teacher leader roles can be implemented as a retention strategy for high-quality teachers19
Teacher-leader roles
Teacher-leader roles (e.g., grade chairs, curriculum coordinators, etc.) allow high-performing teachers to assume roles where they are able to help individual teachers improve instructional delivery and student outcomes
• Leading Educators, which now has a presence in Shelby County, provides rigorous training to prepare teacher-leaders to manage, coach, and lead other teachers
Teacher-leader roles can be used as a retention strategy, as they allow high quality talent to take on more responsibility, support school leadership, receive higher compensation, and extend their reach
• Example of annual stipend for teacher selected to be teacher-leader: ~$2,500
Impact
In addition to retaining strong talent, districts with teacher-leaders have shown significant student progress
Source: Leading Educators, Education Week
0
100
50
Reading performance for students targeted by Leading Educators Fellows (2013-2014)%
End of YearBeginning of Year
Above grade level On grade level Below grade level
K-3rd
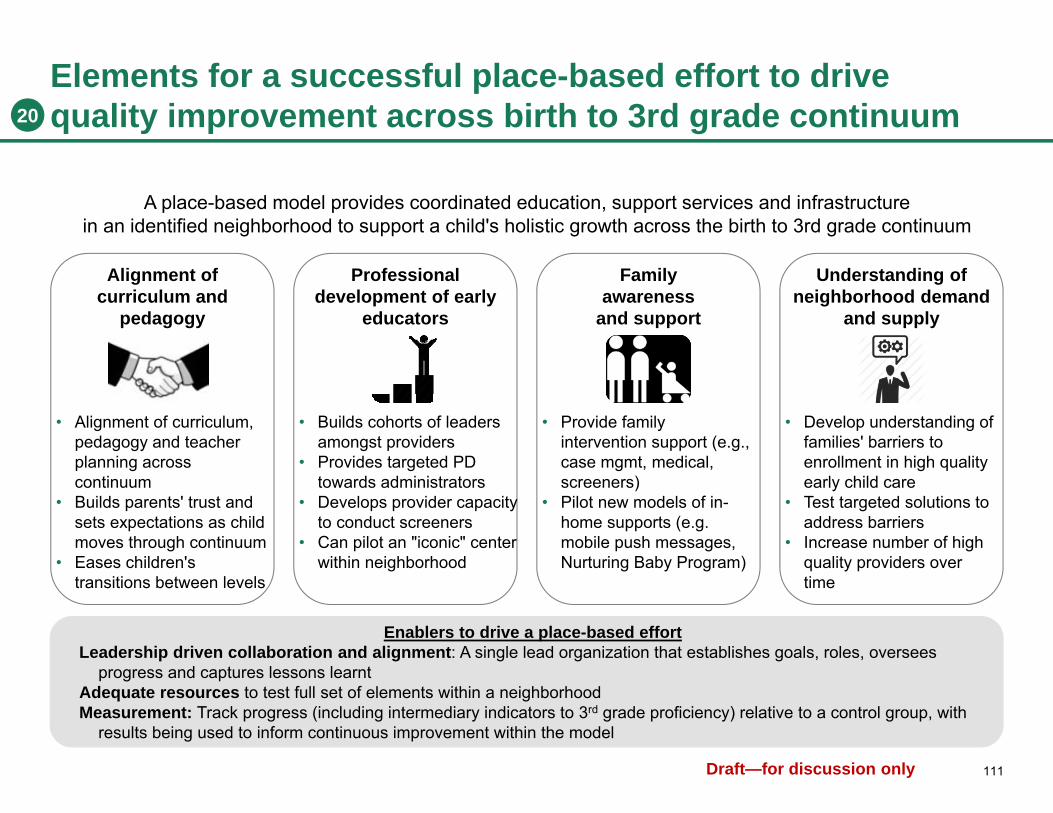
111Draft—for discussion only
Elements for a successful place-based effort to drive quality improvement across birth to 3rd grade continuum
Enablers to drive a place-based effortLeadership driven collaboration and alignment: A single lead organization that establishes goals, roles, oversees
progress and captures lessons learntAdequate resources to test full set of elements within a neighborhood Measurement: Track progress (including intermediary indicators to 3rd grade proficiency) relative to a control group, with
results being used to inform continuous improvement within the model
• Alignment of curriculum, pedagogy and teacher planning across continuum
• Builds parents' trust and sets expectations as child moves through continuum
• Eases children's transitions between levels
Alignment of curriculum and
pedagogy
• Builds cohorts of leaders amongst providers
• Provides targeted PD towards administrators
• Develops provider capacity to conduct screeners
• Can pilot an "iconic" center within neighborhood
Professional development of early
educators
• Provide family intervention support (e.g., case mgmt, medical, screeners)
• Pilot new models of in-home supports (e.g. mobile push messages, Nurturing Baby Program)
Familyawareness
and support
• Develop understanding of families' barriers to enrollment in high quality early child care
• Test targeted solutions toaddress barriers
• Increase number of high quality providers over time
Understanding of neighborhood demand
and supply
A place-based model provides coordinated education, support services and infrastructurein an identified neighborhood to support a child's holistic growth across the birth to 3rd grade continuum
20
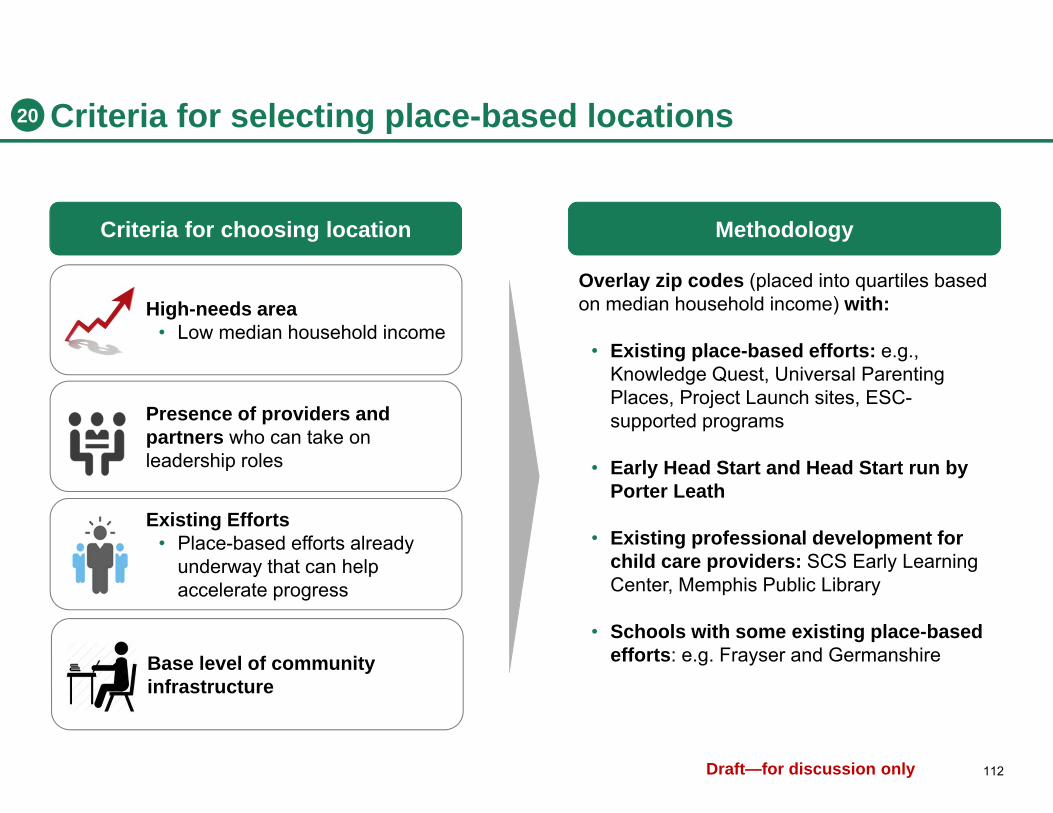
112Draft—for discussion only
High-needs area • Low median household income
Criteria for selecting place-based locations
Criteria for choosing location Methodology
Presence of providers and partners who can take on leadership roles
Existing Efforts • Place-based efforts already
underway that can help accelerate progress
Base level of community infrastructure
Overlay zip codes (placed into quartiles based on median household income) with:
• Existing place-based efforts: e.g., Knowledge Quest, Universal Parenting Places, Project Launch sites, ESC-supported programs
• Early Head Start and Head Start run by Porter Leath
• Existing professional development for child care providers: SCS Early Learning Center, Memphis Public Library
• Schools with some existing place-based efforts: e.g. Frayser and Germanshire
20
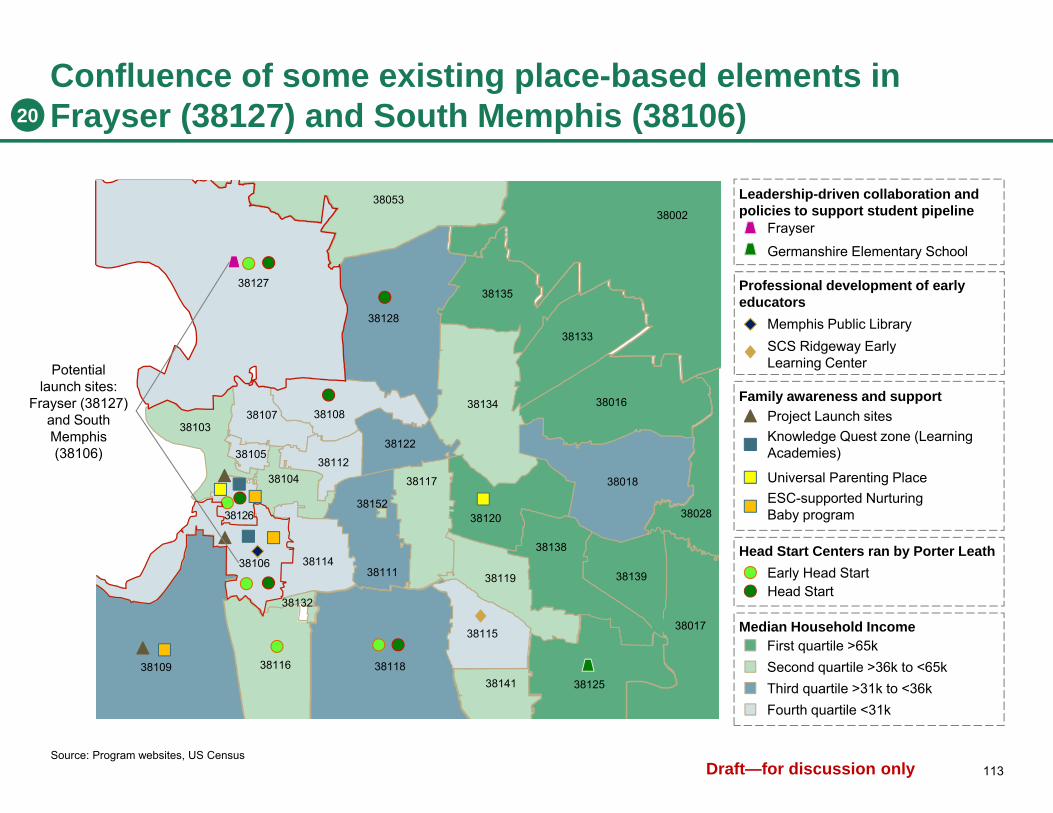
113Draft—for discussion only
Confluence of some existing place-based elements in Frayser (38127) and South Memphis (38106)
Median Household Income
Source: Program websites, US Census
Germanshire Elementary School
Potentiallaunch sites:
Frayser (38127)and South Memphis (38106)
Frayser
Leadership-driven collaboration and policies to support student pipeline
SCS Ridgeway Early Learning Center
Memphis Public Library
Professional development of early educators
Project Launch sitesKnowledge Quest zone (Learning Academies)
Universal Parenting PlaceESC-supported Nurturing Baby program
Family awareness and support
Early Head StartHead Start
Head Start Centers ran by Porter Leath
Second quartile >36k to <65kThird quartile >31k to <36kFourth quartile <31k
First quartile >65k
38016
38017
38018
38028
38104
38106
38109
3811138114
38115
38116
38117
38118
38119
38120
38122
38125
3812838133
38134
38135
38138
38139
38141
38152
38132
3800238053
38127
38126
38103
38105
38107 38108
38112
20

114Draft—for discussion only
Place-based elements currently underway in Shelby County
Element Existing place-based effort
• Principal of Germanshire Elementary School recruits Kindergarten students from nearby Ridgeway Early Learning Center's pre-K classrooms
• ASD changed compliance standards to hold operators accountable to pre-K programs
Neighborhoods
• Germanshire
• Frayser
Source: Program websites, BCG interviews
• SCS's Early Learning Center offers directors and providers of 3 star-centers professional development training on assessments and curriculum
• Memphis Public Library offering provider training
• Hickory Hill
• South Memphis
• Universal Parenting Places hold counseling sessions for families to support behavioral and emotional development of children
• Knowledge Quest runs 5 Learning Academies (after-school care) for pre-K onwards
• Project Launch supports case management of "at-risk children", and mental health consultation for children through providers
• ESC-led Nurturing Baby program provides home visits by nurse to family of newborn (to be launched in 2016)
• South Memphis, East Memphis
• South Memphis
• South Memphis
• South Memphis
Leadership-drivencollaboration
Professionaldevelopment ofearly educators
Family awarenessand support
20

115Draft—for discussion only
Leadership: Appoint an organization already operating in neighborhood (such as organizations mentioned on the left hand side of slide) to take on leadership role
Organization to take lead for driving alignment of curriculum and pedagogy between age spans); and working with parents of children aged 0-3 to increase awareness of pre-K+ options in Frayser
Professional Development: Provide professional development training for early child hood educators at a local center (e.g. Library, School, Head Start) on effective child-teacher interactions and developmentally-appropriate activities (consider centralizing across existing efforts and boosting overall capacity)
Family awareness and support: Consider extending Project Launch case management and referral services to families in Frayser
Pilot direct supports to families (e.g. mobile-based support services) and work with families to refine program and improve efficacy
Develop understanding on barriers to enrollment to quality early care and test solutions (e.g. run parent focus group)
Robust set-up: Develop a clear baseline of current student performance at third grade and intermediary indicators (e.g. 1st and 2nd grade Istation results) within Frayser and track progress
Begin efforts to secure catalytic funding to support testing additional place-based elements (e.g. professional development, focus groups)
Frayser (38127) has a strong network of early childcare, schools, and wraparound supports
Illustrative examples on how to build out more holistic place-based effort
Existing placed-based efforts in Frayser (38127)
• 8 ASD schools from pre-K to grade 12, with case management support from Agape (The Achievement Schools Network operates 5 out of the 8 schools)
• Porter Leath offering 3 Early Head Start and Head Starts together with family service staff providing family wraparounds
Westside Achievement
Middle School
Pathwaysin Education
Whitney In Education
Corning Achievement
Elementary School
Georgian Hills Achievement Elementary
SchoolLibertas
School at Brookmeade
Cornerstone Prep-Denver
Campus
FrayserAchievement Elementary
School
Frayser Head Start and Early
Head StartDelano Head
Start
Source: Program websites, BCG Interviews
20
Backup

116Draft—for discussion only
South Memphis (38106) has variety of family support services, quality education and provider training
Illustrative examples on how to build out more holistic place-based effort
Existing placed-based efforts in South Memphis
20
• Knowledge Quest Learning Academy (after-school care) for grade 2-12
• Porter Leath offering 2 Early Head Start and Head Start centers with family service staff providing family wraparounds
• Early childcare provider training offered through Public Library and Project Launch
• ESC-led Nurturing Baby program to be launched
Leadership: Appoint an organization already operating in neighborhood (such as organizations mentioned on the left hand side of slide) to take on leadership role.
Organization to take on the lead for driving alignment in curriculum and pedagogy between age spans, and increasing parental awareness across levels
Policies: Advocate for "opt-out" option for parents regarding wraparound services, to facilitate referral of children to services based on child's performance
Professional Development: Consider piloting a 'one-stop shop' professional development center in neighborhood for early childcare providers that covers early literacy skills, use of screeners, etc. Alternatively, build a South Memphis cohort within SCS Early Learning Academy
Family awareness and support: ESC can leverage Nurturing Baby program to reach out to parents, and understand barriers to enrollment to quality early care and test solutions
Robust set-up: Develop a clear baseline of current student performance at third grade and intermediary indicators (e.g. 1st and 2nd grade Istation results) within South Memphis and track progress
Begin efforts to secure catalytic funding to support testing additional place-based elements (e.g. professional development, focus groups)
South Lauderdale Early Head Start
Gaston Park Public Library
Scholar Academy Head Start
KnowledgeQuest Learning Academy
Source: Program websites, BCG Interviews
Backup
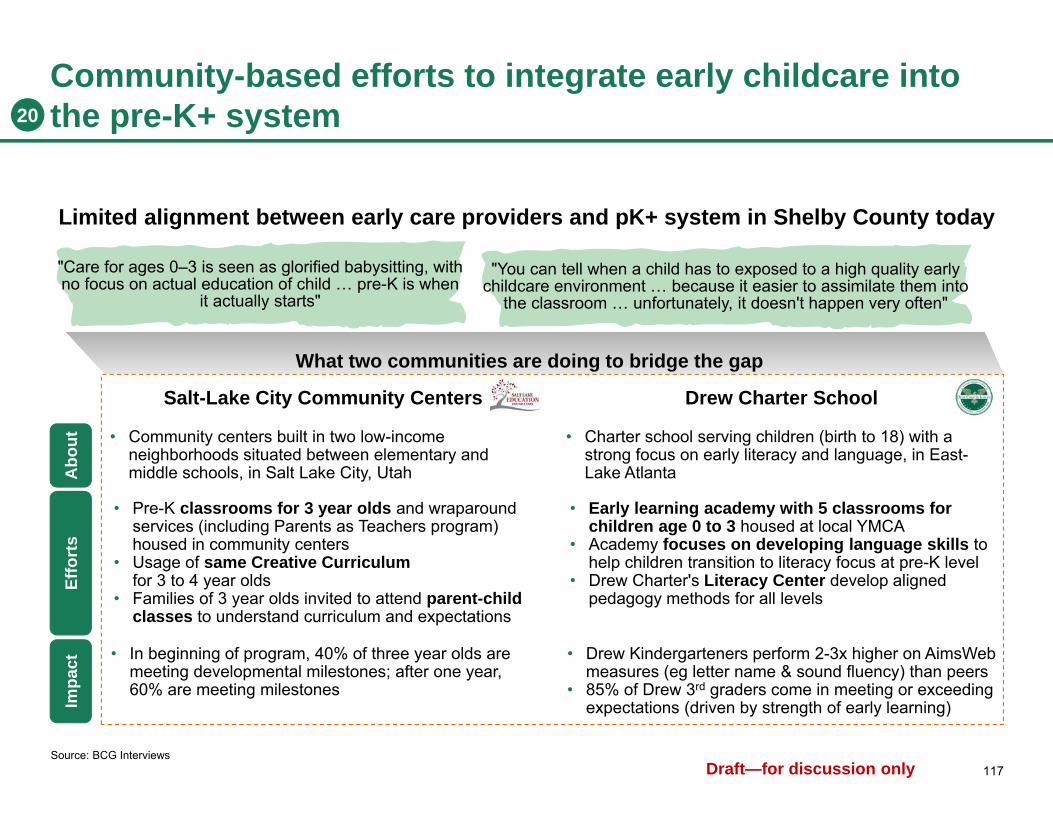
117Draft—for discussion only
Community-based efforts to integrate early childcare into the pre-K+ system
Source: BCG Interviews
Abo
ut • Community centers built in two low-income
neighborhoods situated between elementary and middle schools, in Salt Lake City, Utah
• Charter school serving children (birth to 18) with a strong focus on early literacy and language, in East-Lake Atlanta
Impa
ct • In beginning of program, 40% of three year olds are meeting developmental milestones; after one year, 60% are meeting milestones
• Drew Kindergarteners perform 2-3x higher on AimsWeb measures (eg letter name & sound fluency) than peers
• 85% of Drew 3rd graders come in meeting or exceeding expectations (driven by strength of early learning)
Effo
rts
• Pre-K classrooms for 3 year olds and wraparound services (including Parents as Teachers program) housed in community centers
• Usage of same Creative Curriculumfor 3 to 4 year olds
• Families of 3 year olds invited to attend parent-child classes to understand curriculum and expectations
• Early learning academy with 5 classrooms for children age 0 to 3 housed at local YMCA
• Academy focuses on developing language skills to help children transition to literacy focus at pre-K level
• Drew Charter's Literacy Center develop aligned pedagogy methods for all levels
Limited alignment between early care providers and pK+ system in Shelby County today
What two communities are doing to bridge the gap
Salt-Lake City Community Centers Drew Charter School
"You can tell when a child has to exposed to a high quality early childcare environment … because it easier to assimilate them into
the classroom … unfortunately, it doesn't happen very often"
"Care for ages 0–3 is seen as glorified babysitting, with no focus on actual education of child … pre-K is when
it actually starts"
20
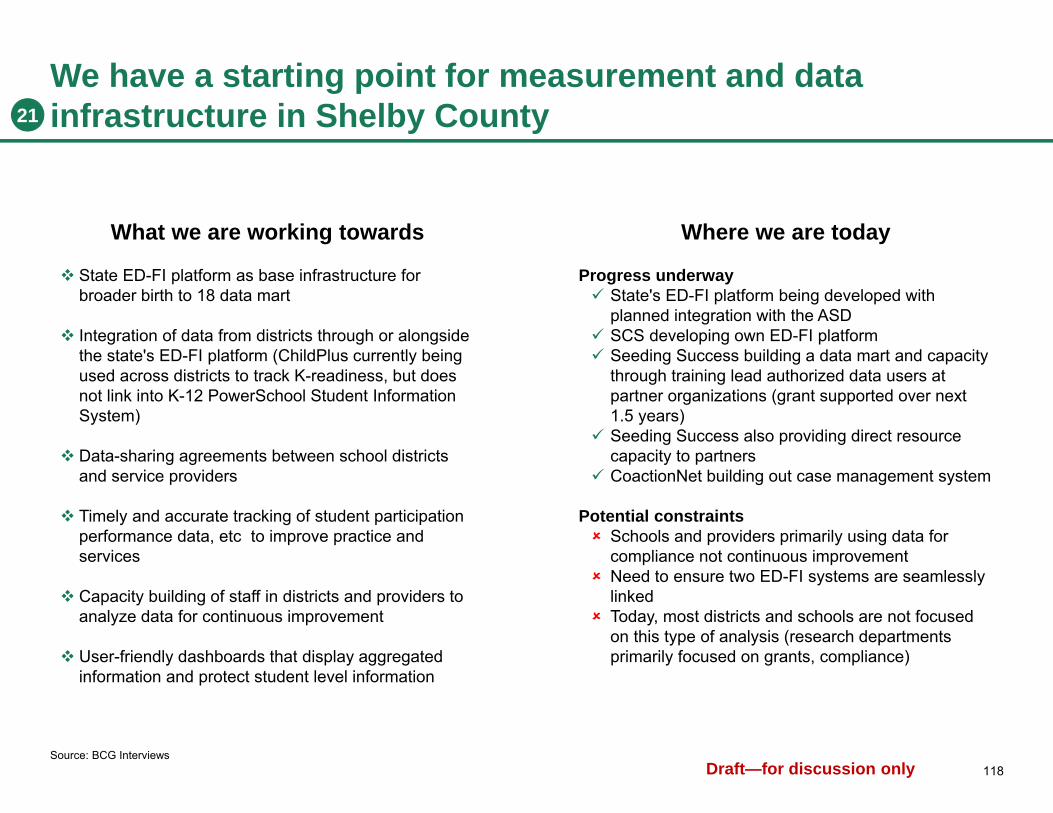
118Draft—for discussion only
We have a starting point for measurement and data infrastructure in Shelby County
Source: BCG Interviews
What we are working towards
State ED-FI platform as base infrastructure for broader birth to 18 data mart
Integration of data from districts through or alongside the state's ED-FI platform (ChildPlus currently being used across districts to track K-readiness, but does not link into K-12 PowerSchool Student Information System)
Data-sharing agreements between school districts and service providers
Timely and accurate tracking of student participation performance data, etc to improve practice and services
Capacity building of staff in districts and providers to analyze data for continuous improvement
User-friendly dashboards that display aggregated information and protect student level information
Where we are today
Progress underway State's ED-FI platform being developed with
planned integration with the ASD SCS developing own ED-FI platform Seeding Success building a data mart and capacity
through training lead authorized data users at partner organizations (grant supported over next 1.5 years)
Seeding Success also providing direct resource capacity to partners
CoactionNet building out case management system
Potential constraints Schools and providers primarily using data for
compliance not continuous improvement Need to ensure two ED-FI systems are seamlessly
linked Today, most districts and schools are not focused
on this type of analysis (research departments primarily focused on grants, compliance)
21
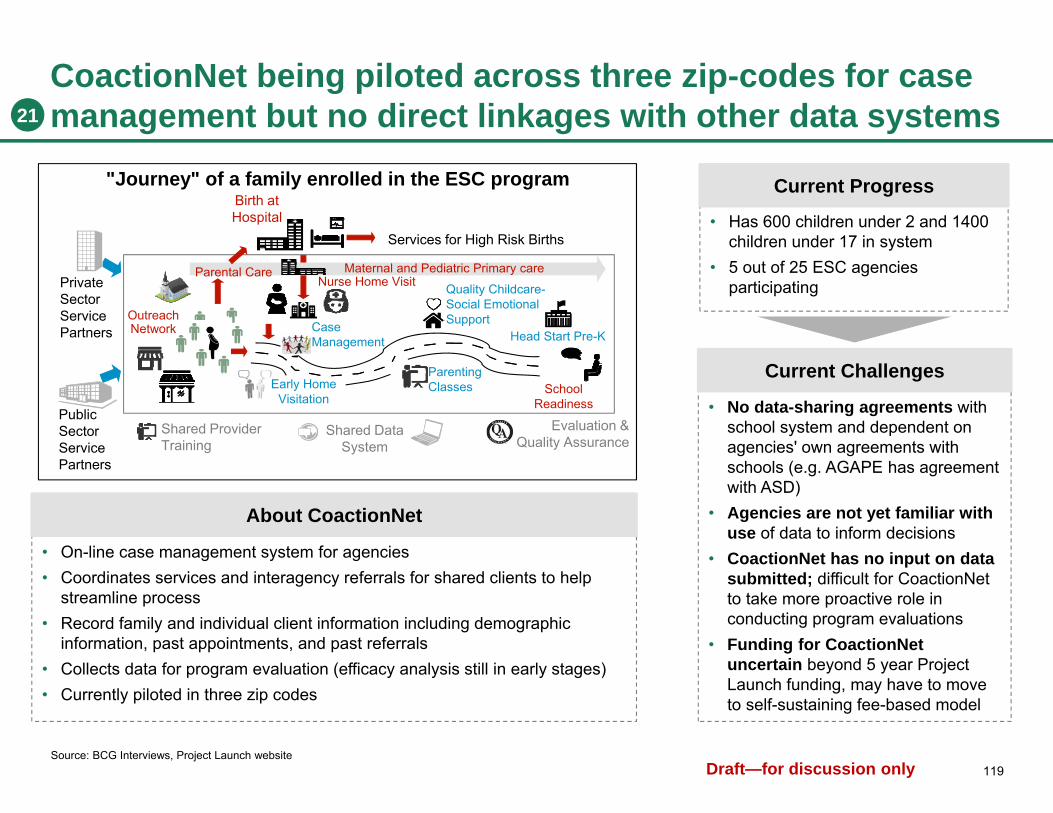
119Draft—for discussion only
CoactionNet being piloted across three zip-codes for case management but no direct linkages with other data systems
• On-line case management system for agencies• Coordinates services and interagency referrals for shared clients to help
streamline process• Record family and individual client information including demographic
information, past appointments, and past referrals • Collects data for program evaluation (efficacy analysis still in early stages)• Currently piloted in three zip codes
Shared ProviderTraining
Shared DataSystem
Evaluation &Quality Assurance
SchoolReadiness
Head Start Pre-K
Quality Childcare-Social EmotionalSupport
ParentingClassesEarly Home
Visitation
CaseManagement
Maternal and Pediatric Primary careNurse Home Visit
Parental Care
Services for High Risk Births
Birth atHospital
OutreachNetwork
PrivateSectorServicePartners
PublicSectorServicePartners
"Journey" of a family enrolled in the ESC program
About CoactionNet
• Has 600 children under 2 and 1400 children under 17 in system
• 5 out of 25 ESC agencies participating
Current Progress
• No data-sharing agreements with school system and dependent on agencies' own agreements with schools (e.g. AGAPE has agreement with ASD)
• Agencies are not yet familiar with use of data to inform decisions
• CoactionNet has no input on data submitted; difficult for CoactionNet to take more proactive role in conducting program evaluations
• Funding for CoactionNet uncertain beyond 5 year Project Launch funding, may have to move to self-sustaining fee-based model
Current Challenges
Source: BCG Interviews, Project Launch website
21
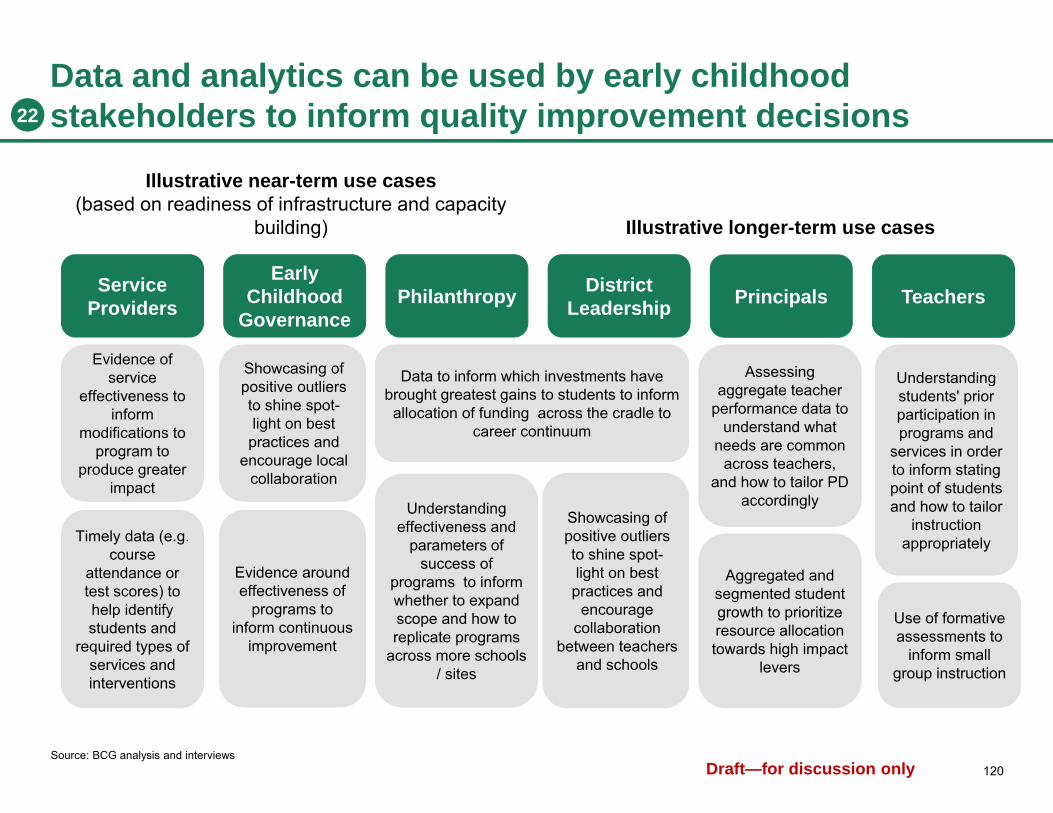
120Draft—for discussion only
Service Providers
District LeadershipPhilanthropy
Early Childhood
GovernanceTeachers
Understanding students' prior participation in programs and
services in order to inform stating point of students and how to tailor
instructionappropriately
Principals
Assessing aggregate teacher
performance data to understand what
needs are common across teachers,
and how to tailor PD accordingly
Use of formative assessments to
inform small group instruction
Evidence of service
effectiveness to inform
modifications to program to
produce greater impact
Showcasing ofpositive outliersto shine spot-light on bestpractices and
encourage localcollaboration
Data and analytics can be used by early childhood stakeholders to inform quality improvement decisions
Illustrative near-term use cases(based on readiness of infrastructure and capacity
building) Illustrative longer-term use cases
Aggregated and segmented student growth to prioritize resource allocation towards high impact
levers
Timely data (e.g. course
attendance or test scores) to help identify students and
required types of services and interventions
Data to inform which investments have brought greatest gains to students to inform allocation of funding across the cradle to
career continuum
Understanding effectiveness and
parameters of success of
programs to inform whether to expand scope and how to replicate programs
across more schools / sites
Evidence around effectiveness of
programs to inform continuous
improvement
Source: BCG analysis and interviews
Showcasing ofpositive outliersto shine spot-light on bestpractices and
encouragecollaboration
between teachersand schools
22

121Draft—for discussion only
Commit! efforts in Dallas to increase familiarity and trust around data collection and elevate strategic use
Phased approach to secure buy-in Building a community-ready dashboard
Developing trust with agencies • Adopted a phased approach in use of data – first
built comfort around what was being measured and why, and data accuracy
• Showed results in aggregate vs. agency-specific• Once trust and understanding was reached,
showed and analyzed data with more granularity
Note: Commit! is a backbone organization in Dallas that is supporting a coalition of stakeholders in making progress on the cradle-to-career continuumSource: BCG interview and Commit! website
Data visualization • Using data tools to layout data in an easy-to-
interpret manner to inform continuous improvement and more informed decisions on scale-up
Highlighting positive outliers • Showcasing agencies which have performed well to
celebrate successes; use of data as a "spotlight" rather than a "hammer"
Investing in resources• Hiring of data analytics and data visualization team
Enabling community to use data • Set up of web-based data dashboard available to
general pubic
• User-friendly interface• Data sorted at campus, district level• Specific data-pulls available (e.g. students
counts by grade, teachers experiences percentages, SAT/ACT % taking)
22

122Draft—for discussion only
Policy advocacy will require the collaboration of many partners to work together to drive change
Each recommendation with policy implications will need a coalition of stakeholders (at the local and state levels) to come together to advocate for policy change
As the backbone, PeopleFirst will help convene stakeholder coalitions in support of policy advocacy and implementation
Identify partners
Convene stakeholders
1
2
• Develop partnerships: Identify and capitalize on relationships in their network that have expertise/influence to aid in policy change (e.g., statewide organizations) and involve them in the effort
• Make the case: Bring expertise of each stakeholder group to the combined body to make an effective case for policy change (e.g., data on existing programs)
• Build awareness and support: Raise the issue with local and state officials to generate interest and support, respond to potential concerns, understand potential risks and work to mitigate them
• Draft policy: Contribute to drafting of policy proposal that can be used as a starting point in legislative sessions
• Support implementation: Once policy has passed, assist government agencies or other organizations with implementation and other challenges that may arise
Each stakeholder coalition involved with policy advocacy will assume the following roles:
23

123Draft—for discussion only
Social impact bonds can serve as innovative funding source
What is it?• Government sets a performance outcome
and will pay a third party if the organization meets that target
• Investors only fund social programs, which have been proven and externally validated against a control group
• Targets are tied to tangible cost avoidance (e.g. reduction in the number of children who require special education)
• First piloted in the UK in 2010• Goldman Sachs Social Impact Fund
especially active in this space in the U.S.
• $7 million bond funded by Goldman Sachs and Pritzker Family Foundation (started in 2013)1
• Implemented by United Way• Funds 3,500 students in
program focused on increasing school readiness among at-risk 3 and 4 year olds
• Performance outcome: number of children that require special education or remedial action after pre-K
• Positive results in 2015: Only 1 of expected 110 students needed special education
• $16.9 million bond funded by Goldman Sachs and Pritzker Family Foundation (started in 2014)
• Implemented by Chicago Public Schools
• Supports the expansion of the Child-Parent Center model to 2,620 children
• Performance outcome: number of children that are kindergarten ready; require special education after pre-K; score above national average for 3rd grade reading
Utah High Quality Pre-School Initiative
Chicago Child-Parent Center Pre-School Initiative
Out of the 50 projects in development in the U.S., 5 projectsimplemented so far, and 2 currently underway in early childhood
1. Utah districts are given a fixed payment of $2,600/student to provide special needs/remedial education. If the state realizes avoided costs due to the program, Goldman Sachs and Pritzker will receive a portion of the savings (95%, or $2,470 per child through 6th grade and 40% or $1,040 per child after)Source: BCG Interview, Program websites, NYTimes
Utah
Chicago
23