shifts in ecb communication: a text mining approach
TRANSCRIPT

Erasmus University Rotterdam
Erasmus School of Economics
Master Thesis Econometrics and Management Science:
Econometrics
Shifts in ECB communication:a text mining approach
Author:
Justyna Klejdysz 475544jk
Supervisor:
Prof. dr. Robin L. Lumsdaine
Second Assessor:
Dr. Michel van der Wel
August 30, 2018
Abstract
This thesis investigates how fundamental changes to communication, made by
the European Central Bank (ECB) during the press conference following monetary
policy decision, affect stock market volatility. First, the ECB press conferences are
dissected into topics using Latent Dirichlet Allocation (LDA), an unsupervised gen-
erative model for text. Then turning points in ECB communication are captured
using the estimated topic probabilities. The proposed approach does not rely on sub-
jective interpretation of topical content. The thesis finds that the topics surge and
die out over time, revealing communication patterns that match the ECB monetary
policy stance. Furthermore, the content of the ECB press conference is informative
for the market, consistent with the previous literature. Market uncertainty increases
if the ECB switches to a different communication regime. The main revisions to
communication on the monetary analysis and the economic analysis are perceived
to be of high importance, whereas the Q&A session does not convey incremental
information.
Keywords: Central banking, ECB, Latent Dirichlet Allocation, Textual analysis,
Stock market reaction

Contents
1 Introduction 2
2 Related literature 6
3 Methodology 11
3.1 Latent Dirichlet Allocation . . . . . . . . . . . . . . . . . . . . . . . . . . . 11
3.2 Choices in model specification . . . . . . . . . . . . . . . . . . . . . . . . . 13
3.3 Estimation . . . . . . . . . . . . . . . . . . . . . . . . . . . . . . . . . . . . 15
3.3.1 Collapsed Gibbs sampling . . . . . . . . . . . . . . . . . . . . . . . 16
3.3.2 Variational EM . . . . . . . . . . . . . . . . . . . . . . . . . . . . . 17
3.3.3 Metropolis-within-Gibbs sampling . . . . . . . . . . . . . . . . . . . 18
3.4 Model evaluation . . . . . . . . . . . . . . . . . . . . . . . . . . . . . . . . 20
3.4.1 Coherence . . . . . . . . . . . . . . . . . . . . . . . . . . . . . . . . 21
3.4.2 Exclusivity . . . . . . . . . . . . . . . . . . . . . . . . . . . . . . . 22
3.4.3 Topic cardinality . . . . . . . . . . . . . . . . . . . . . . . . . . . . 22
3.4.4 Word ranking . . . . . . . . . . . . . . . . . . . . . . . . . . . . . . 23
4 Data 24
4.1 The ECB press conference . . . . . . . . . . . . . . . . . . . . . . . . . . . 24
4.2 Preparing documents . . . . . . . . . . . . . . . . . . . . . . . . . . . . . . 25
4.3 Vocabulary selection . . . . . . . . . . . . . . . . . . . . . . . . . . . . . . 26
4.4 Financial data . . . . . . . . . . . . . . . . . . . . . . . . . . . . . . . . . . 30
5 Results 32
5.1 Estimated topics . . . . . . . . . . . . . . . . . . . . . . . . . . . . . . . . 32
5.2 Interpreting topical content . . . . . . . . . . . . . . . . . . . . . . . . . . 33
5.3 Shifts in ECB communication . . . . . . . . . . . . . . . . . . . . . . . . . 39
5.4 Robustness . . . . . . . . . . . . . . . . . . . . . . . . . . . . . . . . . . . 43
6 Conclusions 45
Appendices 47
References 63
1

1 Introduction
This thesis considers the problem of quantifying communication of the European Central
Bank (ECB) during the press conferences on the Governing Council meeting days.
A growing body of economic literature applies tools from computational linguistics to
analyze central bank communication. The reason is that, communication has become a key
tool for central banks to maintain transparency, manage market expectations and achieve
policy goals in a zero-lower bound environment, where the room for maneuvering interest
rates is limited (Blinder, Ehrmann, Fratzscher, De Haan, & Jansen, 2008). Statements
that explain monetary policy decisions are scrutinized by financial market participants;
however for a human reader it is difficult to spot patterns in multiple long text documents
to learn how central banks revise the informational content of communication.
The ECB uses various channels to communicate the monetary policy stance: press
conferences, monetary policy accounts, monthly bulletins, speeches, and interviews. The
press conference that takes place on the same day as the Governing Council decision
announcement is the primary communication device. It provides explanations for the
monetary policy decision, the core assessment of the economic and monetary situation
and the forward guidance. Two main parts of a typical speech are: an introductory
statement, which is agreed by the members of the Governing Council, and a questions-
and-answers (Q&A) session, when journalists have the opportunity to ask clarification
questions. This structure makes the ECB press conference a case study of both prepared
and extemporaneous remarks.
The focus of the thesis is to study how the dynamics of topical composition of the
ECB press conference affects stock market volatility on the Governing Council meeting
days. The analysis follows in two stages. The first stage is to provide a low-dimensional
representation of the transcripts by dissecting the ECB press conferences into topics. The
second stage is to construct a topic-based measure that captures the switches in the ECB
communication regime.
To identify topics, this thesis applies Latent Dirichlet Allocation (LDA) (Blei, Ng, &
Jordan, 2003), a generative model for text that allows extracting multiple themes that are
2

not specified in advance. In the analysis, text is represented by a document-term matrix,
with documents in rows and unique words in columns. The entries of the matrix are word
frequencies in the documents. The idea is to decompose the document-word relationships
into topic probabilities in each document and word probabilities in each topic. Topics are
thus interpreted as latent dimensions underlying the text.
The second part of the analysis is motivated by the communication patterns discovered
with LDA. The model identifies phases when a single topic dominates in ECB commu-
nication and when a variety of topics is discussed. A novel aspect of this research is to
construct a score based on variations in the probability of the most dominant topic on
a given conference day to capture substantial textual changes in the press conferences.
The score is derived separately for the decision summary, communication on the economic
analysis, the monetary analysis and the answers provided on the Q&A session during the
tenures of Jean Claude Trichet and Mario Draghi. The performance of the measure in
explaining stock market reaction is examined with event-based regressions. The European
stock market volatility is proxied with the VSTOXX index.
The key findings are as follows. First, content exploration with LDA shows clustering
of similar press conferences in time. This is expected, as the ECB should strive to send a
consistent message over time and similar speeches are easier to interpret. Therefore, the
main interest are fundamental updates to the ECB wording, i.e., periods when one topic
dies out and is replaced with a different topic. Comparison of the topic proportions over
time with ECB monetary policy decisions shows that the changes in different sections of
the introductory statement reflect the changes in the monetary policy regime. In case of
the Q&A section, LDA identifies a discontinuity in topic probabilities, occurring on the
first press conference held by Mario Draghi.
Second, market volatility increases in times of transition to a new communication
regime, as compared to the conference days when the ECB sends a relatively homoge-
neous message. The market reacts to the major changes in communication on the mon-
etary analysis and the economic analysis, after controlling for the surprise component in
standard and non-standard monetary policy decisions. This suggests that major revisions
3

to the content of the introductory statement are more difficult to digest for the market,
even if they do not occur in isolation from the changes in the monetary policy stance.
The thesis makes three distinct contributions to the field of analyzing central bank
communication with computational linguistics tools. First, to my knowledge this is the
first study that applies LDA to monthly ECB press conferences, although the frame-
work was successfully employed to analyze the statements, minutes and transcripts of the
Federal Open Market Committee (FOMC) (Hansen & McMahon, 2016; Hansen, McMa-
hon, & Prat, 2017; Jegadeesh & Wu, 2017; Fligstein, Stuart Brundage, & Schultz, 2017).
Common alternatives to quantify text in economic literature are hand-coding (Jansen &
De Haan, 2005; Rosa & Verga, 2007) or automated methods that rely on keyword counting
(Tetlock, 2007; Loughran & McDonald, 2011). These approaches are deductive as they
typically capture meaning along a single, predefined dimension, like expansion-contraction
or hawkish-dovish. LDA offers several advantages in that it satisfies the following con-
ditions (DiMaggio, Nag, & Blei, 2013): (1) it is reproducible; (2) automated, so that it
is easily updated when new documents arrive; (3) inductive, to enable content discovery
without imposing prior beliefs about what to look for in the text; (4) and it recognizes
that terms may have different meanings in different contexts.
Second, the thesis proposes a new content measure that is derived from LDA output
but does not rely on subjective labeling of topics. LDA produces a rich output in the
form of topic probabilities in documents and word probabilities in topics. A persistent
puzzle is how to exploit the output to extract information relevant for financial market
participants or information that improves understanding of central bank decision mak-
ing. Current applications of LDA to central bank communication often rely on assigning
substantive interpretations to topics based on the top most probable words in a topic
(Hansen & McMahon, 2016; Jegadeesh & Wu, 2017). In contrast, the proposed measure
only captures the degree of discussion homogeneity, circumventing the need for assigning
subjective topic labels. To facilitate content exploration and to validate the model out-
put against monetary policy decisions, this thesis employs automated measures of topic
interpretability in the model selection procedure. The proposed communication measure
4

can be partly related to the approaches of measuring speech similarity, for example cosine
similarity between two consecutive speeches (Meade, Acosta, et al., 2015). An advantage
of LDA over these measures is that it can group words with similar semantics into the
same topic. By providing a summary of the whole document collection, the model not
only enables study of to what extent consecutive speeches are similar, but also: (1) what
wording makes the speeches similar, (2) are the topics recurring, and (3) how long is the
transition period to a new topic.
The third contribution is methodological. LDA is a hierarchical Bayesian model, where
the hyperparameters that index prior distributions on a set of latent variables are found to
substantially influence the model inference (Wallach, Mimno, & McCallum, 2009; Asun-
cion, Welling, Smyth, & Teh, 2009; George & Doss, 2018). This thesis adopts a fully
Bayesian approach to formally infer the values of hyperparameters. In contrast, textual
analyses in economics commonly choose the values of the hyperparameters in an ad-hoc
manner (Griffiths & Steyvers, 2004) without careful consideration how these choices affect
the results.
The structure of the thesis is as follows. Section 2 reviews strategies to quantify text in
economic research, and Section 3 presents the methodology of LDA. Section 4 describes
the data and text preprocessing steps. Section 5 investigates the estimated topics and the
shifts in ECB communication. Section 6 concludes.
5

2 Related literature
This work lies in the intersection of two strands of literature: the impact of central
bank communication on the financial market, and natural language processing (NLP),
in particular topic modeling. This section provides an overview of methods for mapping
words to meaningful quantities within economic literature, with a focus on central bank
communication. The literature related to LDA specification and inference is discussed in
section 3.
The literature on central bank communication uses three approaches to gauge the effect
of communication: an indirect approach, manual coding and automated textual analysis.
The automated methods are most relevant for this thesis. The indirect approach does not
quantify verbal information. Instead, it measures financial market movements in a narrow
window of decision announcement and surrounding communication using high-frequency
data. A stylized fact following from indirect analyses is that the market reaction to central
bank communication is more pronounced than the reaction to monetary policy decisions
(Gurkaynak, Sack, & Swansonc, 2005; Ehrmann & Fratzscher, 2009; Brand, Buncic, &
Turunen, 2010). Furthermore, for the ECB the market reaction to the press conference is
stronger for less anticipated decisions, indicating that the introductory statement provides
relevant clarifications (Ehrmann & Fratzscher, 2009). The reasoning behind this result
is that in times of high uncertainty (when the surprise component in a policy decision
is high) the reaction to the actual decision is muted as the market expects a subsequent
explanation and instead responds to that.
A step further is to identify pieces of information that move the markets. The informa-
tion can come either in the form of topics or tone. To extract the content, one can follow
a manual or an automated approach. The manual approach involves hand-coding the
statements on an ordinal scale or classifying verbal expressions to predefined categories.
For example, Ehrmann and Fratzscher (2009) manually classify real-time newswire re-
ports during the ECB press conference via the following content categories: economic
outlook, inflation, second round effects, money growth, and interest rates. Statements
on inflation and interest rates turn out to be the most important market-movers. By
6

hand-coding each ECB introductory statement on a scale ranging from −2 (very dovish)
to 2 (very hawkish), Rosa and Verga (2007) find that ECB words are complementary to
data on macroeconomic variables in predicting the moves in the key ECB interest rate
and show that the market expectations react to the unexpected component of the press
conference content. The main caveat of the manual approach is high subjectivity and low
reproducibility. Furthermore, as communication indicators are constructed ex post, they
might mitigate the unexpected component in the statement and fail to capture how the
financial market understood the message at the release time (Blinder et al., 2008).
To overcome these issues, a strand of literature turns to automated approaches to ensure
that the analysis is transparent and scalable. Overall, within the automated methods one
can either define dimensions to look for in the text, or apply an algorithm to discover
dimensions. In the former case, the most intuitive and relatively simple technique is a
dictionary method, where a researcher predefines a list of keywords describing meanings
of interest. Documents are then summarized by the number of occurrences of words in
the wordlist. In principle, by defining wordlists that separate multiple categories it is
possible to capture multiple dimensions in text (Tetlock, 2007); however typically only
two opposing concepts are considered. The word counts can be converted to a single
communication measure of incremental changes in hawkish and dovish monetary policy
inclinations (Apel & Grimaldi, 2012), positive and negative tone (Jegadeesh & Wu, 2013;
Tetlock, Saar-Tsechansky, & Macskassy, 2008; Born, Ehrmann, & Fratzscher, 2014) or
uncertainty (Jegadeesh & Wu, 2017).
One of the main difficulties with the dictionary approach is developing a wordlist that
accurately captures the meaning for a specific application. Since words often carry differ-
ent sentiment or meaning under different contexts, dictionaries developed in one domain
of study can lead to word misclassification when used in other disciplines (Loughran &
McDonald, 2011). This calls for development of methods that are customized to central
bank communication. One such approach is the Google semantic orientation score devised
to capture policy inclinations in the FOMC statements (Lucca & Trebbi, 2009). Instead
of considering word occurrences in isolation, the sentences in the statements are split into
7

chunks to preserve sentence semantics. The score is based on the strength of association
between a chunk and a ”hawkish” or a ”dovish” word, measured with Google hit counts
of joint searches. The analysis with the semantic score shows that longer-term Treasury
yields mainly react to changes in the content of the statements rather than contempora-
neous setting of the fed funds rate. Moreover, the score contains significant information
regarding both the predicted and the residual component of Taylor rule-implied interest
rate decisions (Lucca & Trebbi, 2009). Looking at the ECB, Picault and Renault (2017)
manually develop a field-dictionary based on the introductory statements to capture the
subtlety of ECB communication. Similarly to this thesis, they investigate the European
stock market reaction to the press conference. They find that market volatility increases
(decreases) when the statements about monetary policy are hawkish (dovish) and the tone
about the economic outlook is negative (positive).
Although dictionary methods quantify concepts guided by theory, they do not answer
the question as to what are the most important dimensions or hidden ideas in text. In
contrast, LDA addresses this question by exploiting the whole vocabulary. An alternative
dimension-reduction technique that uses all terms is Latent Semantic Analysis (LSA) and
it is also present in the applications to central bank communication (Boukus & Rosenberg,
2006; Acosta, 2015; Hendry & Madeley, 2010). LSA performs a singular value decomposi-
tion of a document-term matrix to identify themes that explain most of the variance in a
collection of documents. In contrast, LDA is a probabilistic topic model. It assumes that
latent topics generate words in documents; each word is generated from a single topic,
but the same term in a different document can be generated from a different topic. The
model flexibility enables numerous extensions, for example, correlated (Blei & Lafferty,
2006a), supervised (McAuliffe & Blei, 2008) or dynamic topic models (Blei & Lafferty,
2006b).
The central application of topic models is summarizing a large collection of documents
and discovering patterns in textual data. However, topics themselves are rarely the fi-
nal objective of the analysis. Although there are examples where topic models mainly
augment descriptive analysis (Quinn et al., 2010; Fligstein et al., 2017), recent applica-
8

tions to central bank communication attempt to derive communication measures using
estimated topics, often in combination with dictionary methods (Hansen & McMahon,
2016; Jegadeesh & Wu, 2017; Moniz & de Jong, 2014) in order to understand how this
information affects the market returns, volatility or interest rate expectations. Hansen
and McMahon (2016) hypothesize that one of the most important dimensions of the
FOMC communication on monetary policy are beliefs about economic situation, as the
information set of the FOMC might differ from that of the public. They use estimated
word assignments to topics to isolate sentences in the FOMC statements related mainly
to the economic outlook. The FOMC statements are on average substantially shorter
than the ECB press conferences.1 Rather than fitting LDA on the press conference level,
this thesis uses the standardized structure of the press conference to automatically di-
vide the transcripts into sections on the decision summary, the economic outlook, the
monetary analysis and the Q&A before estimation. This enables changes in each section
to be tracked separately. Several previous studies on ECB communication demonstrate
through manual classification of sentences that market reaction depends on the specific
themes that are addressed in the introductory statement, for example, monetary policy
outlook and economic outlook (Picault & Renault, 2017) or price stability, monetary and
real economy developments (Berger, De Haan, & Sturm, 2011; Lamla & Lein, 2011).
A closely related work to this thesis is Jegadeesh and Wu (2017). They use LDA to in-
vestigate how the U.S. stock market reacts to proportions of discussion on different topics
and tone of the topics in the FOMC minutes. The Fed’s discussion of its policy stance and
inflation is most informative for the market, whereas topics like trade and consumption
are not informative. Unlike the above implementations, this thesis avoids deriving con-
clusions from topic-based measures that depend on subjective interpretations of topics.
This thesis is inspired by work of Hansen et al. (2017) in focusing on the properties of
the estimated document-topic probabilities rather than topic interpretations. Hansen et
al. (2017) compare the FOMC transcripts in periods when committee members did and
1The length of the FOMC statements ranges from around 200 to 900 words in the sample period2004-2018, whereas the length of the ECB introductory statement ranges from around 800 to 2100 words(from 2700 to 6800 words with answers in the Q&A session).
9

did not believe their deliberations would be public to investigate how transparency affects
debate. They use multinomial LASSO to select topics most predictive of voiced dissent
(as compared to the stance expressed by Greenspan). These topics are then inspected
with respect to the breath of discussion (concentration of the probabilities over topics),
similarity between probability distributions across speakers, probability of dissent (given
by the fitted probabilities from the LASSO) and the quantitative content (probabilities of
topics interpreted as a quantitative discussion). In this thesis, LDA groups documents into
topic clusters. A shift in communication occurs when one topic dies out and is replaced
with a new topic that dominates in a sequence of speeches.
10

3 Methodology
3.1 Latent Dirichlet Allocation
Latent Dirichlet Allocation (LDA) introduced by Blei et al. (2003) is a mixed membership
model for text. The basic idea is that observations (words) are grouped into documents
and each of these groups (documents) is modeled with a mixture of distributions. The
components of the mixture are topics, which are multinomial probability distributions
over fixed vocabulary. The topics are shared across all documents (each document is built
from the same components), but the proportions of topics in documents vary.
LDA ignores both the document order and the word order within the documents. A
document is represented as the bag-of-words. The inference is based on the notion of word
co-occurence. Words that often appear together across documents are likely to belong to
the same topic. Intuitively, LDA trades-off two conflicting goals in finding a good topical
representation for a collection of documents (DiMaggio et al., 2013). The first goal is to
assign words in each document to few topics. Second, in each topic a high probability is
assigned to few words.
To formalize this idea, let D be the number of documents, Nd is the number of
words in document d, V is the number of distinct words (vocabulary size) in a collec-
tion of documents (a corpus), K is the number of topics. The corpus is denoted as
W = {w(1), . . . ,w(D)}, where w(d) = {w(d)i }
Ndi=1 is the collection of words in document d
and w(d)i ∈ {1 : V } is i-th word in document d. Let Z = {z(1), . . . ,z(D)} denote topic as-
signments, where z(d) = {z(d)i }
Ndi=1 and z
(d)i ∈ {1 : K} is a topic assignment for word w
(d)i .2
Let Θ be a D×K matrix of topic proportions in documents and Φ is a K × V matrix of
word probabilities. A vector of topic proportions θd in document d is a K−1-dimensional
random variable where 0 < θd,k < 1 and∑K
k=1 θd,k = 1. Similarly, topic k, φk, is a V − 1
dimensional random variable where 0 < φk,v < 1 and∑V
v=1 φv,k = 1. It is assumed that
2 Blei et al. (2003) defines z(d)i and w
(d)i as vectors of length K and V respectively that contain a single
1. Such defined multidimensional variables have the multinomial distribution. In general, a multinomial
vector contains counts that sum to n. Because in our case n = 1, z(d)i and wd
i can be defined as one
dimensional variables with p(z(d)i |θd) =
∏Kk=1 θ
I(z(d)i =k)
d,k and p(w(d)i |φk) =
∏Vv=1 φ
I(w(d)i =v)
k,v .
11

K and V are known and fixed. The generative process for text is as follows (Blei et al.,
2003):
1. For document d = 1, . . . , D choose the topic proportions θd ∼ Dirichlet(α), where
α is a K-dimensional hyperparameter.
2. For topic k = 1, . . . , K choose the word distribution φk ∼ Dirichlet(β), where β is
a V -dimensional hyperparameter.
3. For document d = 1, . . . , D:
for word i = 1, . . . , Nd:
(a) choose the topic z(d)i ∼Multinomial(θd);
(b) choose the word w(d)i ∼Multinomial(φzij).
We only observe a set of documents, W . The underlying topic assignments Z, word
probabilities Φ and topic proportions in documents Θ are latent; α, β are concentration
hyperparameters that are selected in advance.
The central inferential problem is to determine the posterior distribution of topic pro-
portions in documents (Θ), word proportions in topics (Φ) and word-topic assignments
(Z). The joint posterior density is:
p(Φ,Θ,Z|W ,α,β) =p(Φ,Θ,Z,W|α,β)
p(W|α,β)∝ p(W ,Z|Φ,Θ,α,β)p(Θ|α)p(Φ|β). (1)
The following priors are assumed for model parameters Φ and Θ:
p(Θ|α) =D∏d=1
p(θd|α) =D∏d=1
Dirichlet(θd;α), (2)
p(Φ|β) =K∏k=1
p(φk|β) =K∏k=1
Dirichlet(φk;β). (3)
To derive the joint likelihood function of W and Z, we first consider the density of
12

data W given topic assignments Z and model parameters:
p(W|Z,Φ,Θ,α,β) = p(W|Z,Φ) =D∏d=1
Nd∏i=1
p(w(d)i |z
(d)i ,Φ). (4)
The probability p(w(d)i |z
(d)i ,Φ) = φ
z(d)i ,w
(d)i
is an element of matrix Φ located in z(d)i -th row
and w(d)i -th column. The density function of Z is:
p(Z|Φ,Θ,α,β) = p(Z|Θ) =D∏d=1
Nd∏i=1
p(z(d)i |θd). (5)
The probability p(z(d)i |Θ) = θ
d,z(d)i
. The joint density of data and latent variable Z
(complete data likelihood function) is:
p(W ,Z|Φ,Θ,α,β) =D∏d=1
Nd∏i=1
p(w(d)i |z
(d)i ,Φ)p(z
(d)i |θd). (6)
The posterior distribution is proportional to the complete data likelihood function times
the prior:
p(Φ,Θ,Z|W ,α,β) ∝D∏d=1
p(θd|α)︸ ︷︷ ︸Dirichlet
K∏k=1
p(φk|β)︸ ︷︷ ︸Dirichlet
( D∏d=1
Nd∏i=1
p(w(d)i |z
(d)i ,Φ)︸ ︷︷ ︸
Multinomial
p(z(d)i |θd)︸ ︷︷ ︸
Multinomial
). (7)
The goal is to obtain: p(Φ|W ,α,β), p(Θ|W ,α,β) and p(Z|W ,α,β). These distributions
cannot be computed in closed form.
3.2 Choices in model specification
LDA involves important model specification and selection decisions. The estimation re-
sults vary according to the number of topics (K) and hyperparameter settings (α, β).
As regards the number of topics, there is no “right” answer to this choice (Grimmer
& Stewart, 2013; Roberts et al., 2014). The number of topics selected depends on in-
terpretability and goals of the analysis (Blei & Lafferty, 2009). DiMaggio et al. (2013)
note that “the test of the model as a whole is its ability to identify a number of substan-
tively meaningful and analytically useful topics, not its success in optimizing across all
13

topics”. In case of a wide variety of content in the corpus, as would be seen in analysis of
newspaper articles or scientific papers, one would expect a high level of disaggregation.
For example, Blei (2012) fit a 100-topic LDA model to articles from the journal Science.
Documents in central bank communication are often shorter and more focused. Hansen
and McMahon (2016) analyze the FOMC statements using 15 topics, whereas Jegadeesh
and Wu (2017) fit 8 topics to the FOMC minutes. The choice can be formally guided by
predictive performance and model interpretability. The evaluation metrics are discussed
in more detail in subsection 3.4.
The concentration hyperparameters determine the amount of smoothing or sparsity
of the topic-word and the document-topic distributions. For a Dirichlet prior over the
document-topic distributions the expected value of θd,k, which gives the probability of
topic k in document d is:
E(θd,k|α) =αk∑Kk=1 αk
. (8)
If elements of α are larger than 1, the probability vectors for the Multinomial distribution
tend to be smooth (probability mass distributed equally among K components). Larger∑Kk=1 αk implies more smoothness. If elements of α are less than 1, the probability vectors
for the Multinomial distribution are sparse (a few components with high probability).
Therefore, smaller∑K
k=1 αk implies more sparsity. In an analogous way the concentration
parameter β influences the shape and the mean of the topic-word distributions. Large β
implies more uniform topic-word probabilities and leads to similar topics.
Several studies demonstrate that selection of the hyperparameters has a strong influence
on both prior and posterior distributions of Θ and Φ (Wallach, Mimno, & McCallum,
2009; Asuncion et al., 2009; George & Doss, 2018). Implementations of LDA typically
assume that Dirichlet priors are symmetric (β1 = · · · = βV = β and α1 = · · · = αK = α).
It is expected that β < 1 so that many words have low probabilities in a topic.
Following the recommendation of Wallach, Mimno, and McCallum (2009), this thesis
implements a combination of priors which is found to be superior: an asymmetric Dirichlet
prior over Θ and a symmetric Dirichlet prior over Φ. First, an asymmetric Dirichlet prior
over the document-topic distributions allows some topics to be more likely (see (8)). These
14

topics may place high probability on words that appear more frequently than other words
in every document. Second, it increases stability of the results as the number of topics
increases: if additional topics are redundant, they will be seldom used.
Another decision point is determining the values for hyperparameters. There are several
approaches to specify the hyperparameters in LDA:
1. Heuristics. An ad-hoc specification of the hyperparameters dominates in the eco-
nomic literature. Griffiths and Steyvers (2004) provide the most widely applied
recommendation: α = 50K
, β = 0.1 (Moniz & de Jong, 2014; Tirunillai & Tellis,
2014; Hansen & McMahon, 2016; Fligstein et al., 2017; Hansen et al., 2017; Mueller
& Rauh, 2017). This choice is not based on any particular principle.
2. Iterating between Gibbs sampling (E-step) and a gradient-based optimization for
hyperparameters (M-step) (Minka, 2000; Wallach, 2006).
3. Finding the hyperparameters by grid search (Asuncion et al., 2009).
4. Placing proper prior distributions on α and β and estimating the concentration
parameters in a fully Bayesian setting (Wallach, 2008; Jacobs, Donkers, & Fok,
2016).
This thesis follows a principled approach to infer the values of concentration parameters
in a fully Bayesian setting.
3.3 Estimation
This section first provides an overview of two popular strategies to approximate the pos-
terior distributions in LDA: Markov Chain Monte Carlo (MCMC) methods, in particu-
lar collapsed Gibbs sampling (Griffiths & Steyvers, 2004), and variational Expectation-
Maximization (VEM) (Blei et al., 2003). Then Metropolis-within-Gibbs sampling ap-
proach, which extends upon collapsed Gibbs sampling, is presented as the preferred esti-
mation method.
15
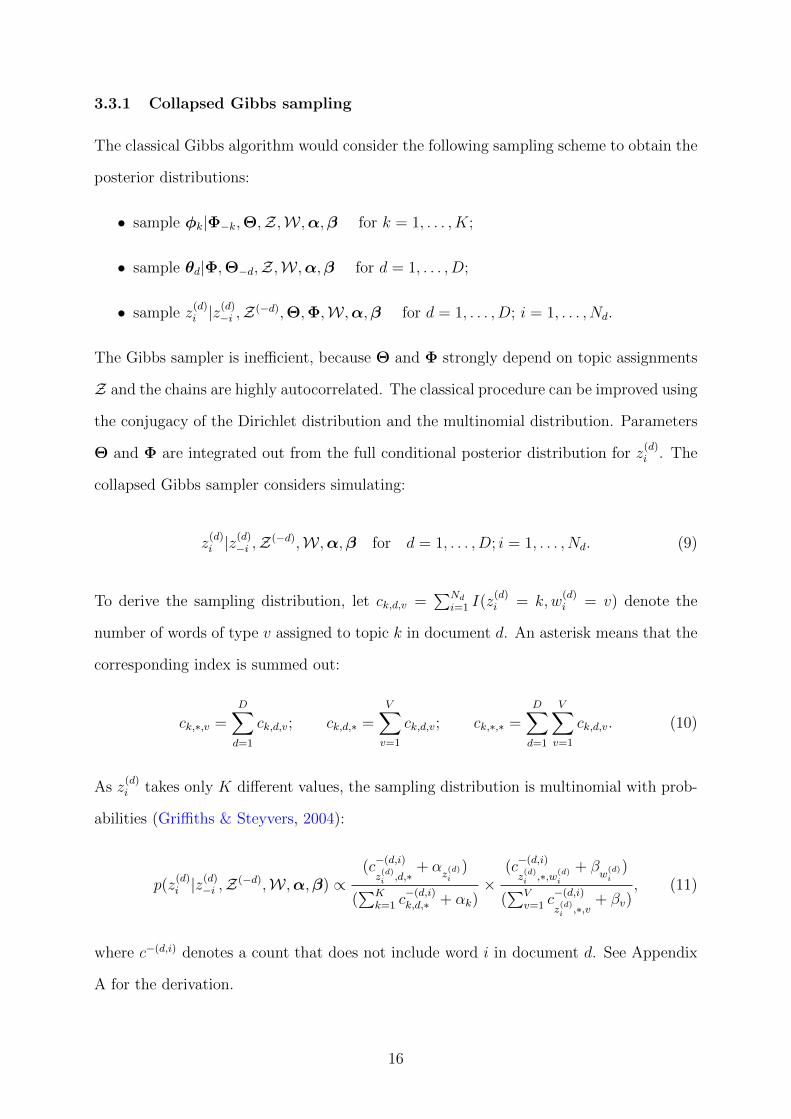
3.3.1 Collapsed Gibbs sampling
The classical Gibbs algorithm would consider the following sampling scheme to obtain the
posterior distributions:
• sample φk|Φ−k,Θ,Z,W ,α,β for k = 1, . . . , K;
• sample θd|Φ,Θ−d,Z,W ,α,β for d = 1, . . . , D;
• sample z(d)i |z
(d)−i ,Z(−d),Θ,Φ,W ,α,β for d = 1, . . . , D; i = 1, . . . , Nd.
The Gibbs sampler is inefficient, because Θ and Φ strongly depend on topic assignments
Z and the chains are highly autocorrelated. The classical procedure can be improved using
the conjugacy of the Dirichlet distribution and the multinomial distribution. Parameters
Θ and Φ are integrated out from the full conditional posterior distribution for z(d)i . The
collapsed Gibbs sampler considers simulating:
z(d)i |z
(d)−i ,Z(−d),W ,α,β for d = 1, . . . , D; i = 1, . . . , Nd. (9)
To derive the sampling distribution, let ck,d,v =∑Nd
i=1 I(z(d)i = k, w
(d)i = v) denote the
number of words of type v assigned to topic k in document d. An asterisk means that the
corresponding index is summed out:
ck,∗,v =D∑d=1
ck,d,v; ck,d,∗ =V∑v=1
ck,d,v; ck,∗,∗ =D∑d=1
V∑v=1
ck,d,v. (10)
As z(d)i takes only K different values, the sampling distribution is multinomial with prob-
abilities (Griffiths & Steyvers, 2004):
p(z(d)i |z
(d)−i ,Z(−d),W ,α,β) ∝
(c−(d,i)
z(d)i ,d,∗
+ αz(d)i
)
(∑K
k=1 c−(d,i)k,d,∗ + αk)
×(c−(d,i)
z(d)i ,∗,w(d)
i
+ βw
(d)i
)
(∑V
v=1 c−(d,i)
z(d)i ,∗,v
+ βv), (11)
where c−(d,i) denotes a count that does not include word i in document d. See Appendix
A for the derivation.
16

For a single draw we can estimate Φ, Θ from the counts:
θd,k =αk + ck,d,∗∑K
k=1(αk + ck,d,∗); φk,v =
βv + ck,∗,v∑Vv=1(βv + ck,∗,v)
. (12)
Posterior mean estimates are obtained by averaging over the draws. However, the poste-
rior inference is complicated by a label switching problem (Stephens, 2000). The problem
emerges, as the complete data likelihood (6) is invariant to permutations of the topics’
labels (there are K! permutations). The posterior will inherit the invariance of the likeli-
hood if priors are symmetric. Various relabeling algorithms can be applied to undo label
switching before averaging over the draws (Rodriguez & Walker, 2014).3
3.3.2 Variational EM
Variational EM uses a simpler distribution on latent variables (a variational distribution)
to approximate the posterior distribution. Φ is treated as a fixed parameter, and so the
approximated posterior distribution for document d is p(θd, z(d)i |W ,Φ,α). The assumed
variational distribution for document d is (Blei et al., 2003):
q(θd, z(d)|γd,πd) = p(θd|γd)︸ ︷︷ ︸
Dirichlet
p(z(d)|πd)︸ ︷︷ ︸Multinomial
, (13)
where γd and πd are variational parameters. The variational distribution is fully factor-
ized, ignoring the strong dependencies between Θ, Φ and Z in the true posterior. VEM
uses Jensen’s inequality to obtain a lower bound on the log likelihood:
log p(W|α,Φ) ≥ Eq(log p(θd|α)) + Eq(log p(z(d)|θd)) + Eq(log p(w(d)|z(d),Φ))
− Eq(log q(θd))− Eq(log q(z(d))).
(14)
The estimation procedure is to iterate over two steps until convergence:
E-step: Maximize the lower bound (14) with respect to variational parameters for given
3A common practice is taking just one last sample instead of relabeling (Teh, Newman, & Welling,2007; Taddy, 2012). Many off-the-shelf solutions provide posterior estimates based on a single iterationof Gibbs sampling. For example, R package lda (Chang, 2015) uses the state at the last iteration ofGibbs sampling and R package topicmodels (Hornik & Grun, 2011) by default returns the sample withthe highest posterior likelihood.
17

α(t), Φ(t). The solution (γ(t)d ,π
(t)d ) can be obtained analytically.4 The superscript refers
to the iteration number.
M-step: Maximize the lower bound with respect to α and Φ for given γ(t)d , π
(t)d . The
solution Φ(t+1) is obtained analytically, whereas the solution α(t+1) is found numerically.
3.3.3 Metropolis-within-Gibbs sampling
MCMC methods have the advantage of being asymptotically exact, but Collapsed Gibbs
sampling requires ad-hoc hyperparameter specification. Variational EM imposes inde-
pendence assumptions that are not present in the true posterior in order to simplify the
optimization problem. It converges faster than MCMC methods at the cost of biased
estimation (Minka & Lafferty, 2002; Taddy, 2012). Both approaches do not guarantee
the convergence to a global optimum due to multimodality of posterior distributions in
LDA (Roberts, Stewart, & Tingley, 2016). However, MCMC methods are less likely to
get stuck in a local optimum as they search the support of a distribution.
The approach adopted in this thesis deviates from the common strategies in order to
achieve asymptotically exact results and formally infer concentration hyperparameters.
The estimation is based on collapsed Gibbs sampling mixed with a Metropolis-Hastings
step. In marketing research Jacobs et al. (2016) implement Metropolis-within-Gibbs sam-
pling to predict purchases with LDA, where a product purchase corresponds to a word
and a customer corresponds to a document.
The basic LDA model is extended by adding one more layer to the hierarchical structure
where lognormal prior distributions are imposed on the Dirichlet concentration parame-
ters. Based on the considerations in section 3.2, the Dirichlet prior on the topic-document
distributions is asymmetric, whereas the Dirichlet prior on the topic-word distributions is
symmetric.
4It can be shown that maximizing the lower bound is equivalent to minimizing the Kullback-Leibler(KL) divergence between the variational distribution for document d and the true posterior probabilityfor document d. KL divergence is a standard measure of how one probability distribution diverges fromanother distribution.
18

The posterior distribution (marginalized over Θ and Φ) is rewritten as:
p(Z,α, β|W) ∝( D∏d=1
Nd∏i=1
p(w(d)i |z
(d)i , β)︸ ︷︷ ︸
Multinomial
p(z(d)i |α)︸ ︷︷ ︸
Multinomial
)π(β)︸︷︷︸
Lognormal
K∏k=1
π(αk)︸ ︷︷ ︸Lognormal
. (15)
The choice of the parameters for the prior distributions is guided by heuristics proposed
by Griffiths and Steyvers (2004) for text modelling. The mode of the prior distribution for
β is set to 0.1 and the variance is such that 95% of the probability mass is under 1. This
specification reflects a prior belief that the word-topic distributions are sparse. The mode
of the prior distribution for αk, k = 1, . . . K, is set to 50K
and the variance is chosen such that
95% of the probability mass is under 503
. This prior specification favors more uniformly
distributed document-topic probabilities, although it remains rather uninformative.
In each sampling step of the Metropolis-within-Gibbs sampling procedure the topic
assignments Z are drawn from the collapsed full posterior distribution (11). The full
conditional distributions of α and β are non-standard, and the samples are obtained using
the random walk Metropolis-Hastings sampler. The full conditional posterior distribution
of β is:
p(β|Z,W ,α) ∝ π(β)K∏k=1
( Γ(V β)
Γ(V β +∑V
v=1 ck,∗,v)
V∏v=1
Γ(β + ck,∗,v)
Γ(β)
). (16)
The full conditional posterior distribution of αk, k = 1, . . . , K is:
p(αk|Z,W ,α−k, β) ∝ π(αk)D∏d=1
Γ(∑K
k=1 αk)
Γ(∑K
k=1 αk + ck,d,∗)× Γ(αk + ck,d,∗)
Γ(αk). (17)
Standard MCMC methods, such as the Metropolis-Hastings algorithm, are known to
slowly traverse the support of highly multimodal distributions (Jasra, Holmes, & Stephens,
2005). To investigate the influence of initialization on the solution, the sampler is run
from multiple random starts. Convergence of the chains is determined based on perplexity,
which is a standard measure to evaluate probabilistic topic models. Perplexity is defined
as the inverse of the geometric mean per-word held-out likelihood:
Perplexity = exp(−∑D
d=1
∑Vv=1 c
test∗,d,v log(
∑Kk=1 φk,vθd,k)∑D
d=1Ntestd
), (18)
19

where φk,v and θd,k are estimated on the training data. Lower perplexity indicates better
fit. This thesis adopts a document-completion approach where the split into the training
and the testing set is performed within each document (Hornik & Grun, 2011).5 Differ-
ences in the estimated perplexities for multiple runs turned out to be marginal, indicating
that the estimated results are stable across initializations (see Table 5 in Appendix B).
For more details on the estimation procedure, see Appendix B. I implement the pro-
cedure in C++ and integrate with R using API enclosed in Rcpp package (Eddelbuettel et
al., 2011).
3.4 Model evaluation
Choosing the number of latent topics and assessing their quality is a long-studied problem
in unsupervised topic modeling. Typically, there is a trade-off between predictive accuracy
of the model and topic interpretability (Chang, Gerrish, Wang, Boyd-Graber, & Blei,
2009).
Metrics of predictive performance, like held-out likelihood or perplexity, are conven-
tionally used to assess model quality (Blei et al., 2003; Wallach, Murray, et al., 2009).
This is because LDA describes the process of generating a collection of documents. To
evaluate the model fit, one can ask how well the model predicts words in a testing set.
Noisy topics will fail to replicate held-out documents, resulting in high perplexity. How-
ever, the predictive metrics have limitations. Usually fine-grained, highly specific topics
yield the best model fit, but they are not easy to interpret or to generalize (Chang et al.,
2009; Boyd-Graber, Mimno, & Newman, 2014; Boyd-Graber, Hu, Mimno, et al., 2017).
Furthermore, predicting the content of the preprocessed text is rarely the objective of
research in political, economic or social sciences, especially since the preprocessing steps
substantially simplify the original documents (Grimmer & Stewart, 2013).
One strand of literature focuses on evaluating topic quality from the perspective of
interpretability using automated measures that correlate well with human ratings. In
comparison to likelihood-based measures, these metrics often are better able to serve
5Various approaches to evaluate held-out likelihood in LDA are discussed by Wallach, Murray,Salakhutdinov, and Mimno (2009).
20
real-world objectives such as discerning meaningful themes or augmenting the subsequent
causal analysis with human-interpretable textual information.
Topics are usually interpreted based on top words with the highest probability (Blei
et al., 2003; Griffiths & Steyvers, 2004). Roberts et al. (2014) argue that a semantically
interpretable topic has two qualities: (1) it is coherent – the highest probability words for
the topic tend to co-occur within documents, and (2) it is exclusive - the words that have
high probability under one topic have low probabilities under other topics.
The remaining part of this section introduces automated measures of topic coherence
and exclusivity used in this thesis. The adopted criteria for the selection of the number
of topics prioritize interpretation over prediction. First, the model selection procedure
discards any solution below the 2/3 quantile along the dimensions of semantic coherence
and exclusivity. Then the solution with the lowest perplexity among the remaining models
is selected. The strategy for model selection is akin Roberts et al. (2014).
3.4.1 Coherence
Automated metrics of coherence are based on averaging some measure of pairwise asso-
ciation between the most probable words in a topic (Newman, Lau, Grieser, & Baldwin,
2010). A common approach to evaluate topic coherence is to assume that co-occurence
frequency of terms within documents is informative about semantical relatedness of the
terms (Newman et al., 2010; Mimno, Wallach, Talley, Leenders, & McCallum, 2011).
The models estimated on the corpus of the ECB press conferences are evaluated with
a semantic coherence score of Mimno et al. (2011). The score is shown to match well with
human judgments and it is defined as:
Coherencek =N∑j=2
j−1∑i=1
logD(w
(k)i , w
(k)j ) + 1
D(w(k)i )
, (19)
where D(·) is a function that returns the number of documents containing all of the
words provided as arguments, and w(k)i denotes a word from the list of top N words with
the highest probability in topic k. Intuitively, the measure is related to the conditional
probability of observing a word given another higher-ranked word. The semantic coherence
21

of Mimno et al. (2011) relies on the word frequencies in documents being modeled, hence
it is more intrinsic in nature.
It is worth mentioning that a variety of alternative coherence measures were designed
in the literature. Newman et al. (2010) use Pointwise Mutual Information (PMI) evalu-
ated on an external corpora (Wikipedia and Google hit matches).6 Aletras and Stevenson
(2013) derive a vector representation for each word using PMI and compute vector sim-
ilarity measures. An increasingly popular tool is word2vec (Mikolov, Chen, Corrado, &
Dean, 2013), a technique to learn vector representations of words (word embeddings) with
graph-based approaches.
3.4.2 Exclusivity
Coherence measures inform about internal consistency of topic representation, but they
do not penalize topics that are similar (Roberts et al., 2014). A counterpoint to semantic
coherence is topic exclusivity that captures inter-topic similarity (Arora et al., 2013). It
compares the usage rate of words with high probability in a topic relative to other topics.
Exclusivity of term v in topic k is defined as (Bischof & Airoldi, 2012; Airoldi & Bischof,
2016):
Exclusivityv,k =φk,v∑Ki=1 φi,v
. (20)
Exclusivity of topic k is computed as an average of the scores for the top N words in a
topic.
3.4.3 Topic cardinality
Topic-based measures of coherence and exclusivity operate on a ranking of the top N
words with the highest probability. The topic cardinality (N) is a hyperparameter and
the standard practice is to select it arbitrarily (usually N = 10). To achieve more stable
evaluation, semantic coherence (19) and exclusivity (20) are computed for different car-
dinalities: N = 5, 10, 15, 20 and averaged (Lau & Baldwin, 2016). Further adjustment
6Semantic coherence (Mimno et al., 2011) is closely related to the Pointwise Mutual Information,
which is defined as: PMI(wi, wj) = logp(wi,wj)
p(wi)p(wj).
22

is computing these scores by first setting the cutoff equal to the V−NV
- th quantile of the
word-topic distribution. The scores are computed for the words with the probabilities
greater than or equal to the cutoff value, allowing for a varying number of top words
across different topics if ties occur in the ranking.
3.4.4 Word ranking
Extracted topics are summarized in a way that facilitates content discovery. The word
ranking based on term probability in a topic favors terms with high frequency in a corpus,
whereas the most common words might not carry any semantically useful information,
and can be used similarly in every topic.
The insight of Bischof and Airoldi (2012) is that the most interesting words in a topic
are both frequent and exclusive. They propose a FREX (Frequency-Exclusivity) score
that combines these two dimensions via the harmonic mean of frequency and exclusivity:
FREXv,k =( ω
ECDF(Exclusivityv,k)+
1− ωECDF(φk,v)
)−1
, (21)
where ECDF is empirical CDF and ω is a weight given to exclusivity (set to 0.5). The score
is the preferred way to rank keywords and it is also consistent with the model evaluation
criteria. A number of other re-ranking schemes were introduced to decrease the ranks for
globally frequent terms (Blei & Lafferty, 2009; Taddy, 2012; Sievert & Shirley, 2014).
23
4 Data
This section introduces the ECB press conference and describes the steps to convert text
to numerical data. It also presents the financial data used to measure the market reaction
to the topic dynamics of the press conference.
4.1 The ECB press conference
The ECB’s monetary policy decisions are published at 13:45 CET on the day of the
Governing Council monetary policy meeting. The press conference starts at 14:30 CET
on the same day. It begins with an introductory statement of the ECB President who
explains the monetary policy decision.
The press conference consists of six major sections: (1) summary of the ECB’s monetary
policy decision, since July 2013 it includes also a forward guidance; (2) economic analysis;
(3) monetary analysis; (4)“cross-check”paragraph; (5) fiscal policy and structural reforms;
(6) questions-and-answers (Q&A) session.
The economic analysis and the monetary analysis are the two pillars by which the
Governing Council evaluates the risks to price stability. The economic analysis part looks
at short to medium-term outlook whereas the monetary analysis assesses medium- to
long-term trends. The cross-check paragraph was introduced in 2003 and its role is to
compare signals from the two pillars.7
The analysis considers all ECB press conferences between January 2004 and April 2018,
covering 91 speeches from Jean-Claude Trichet (whose eight-year term expired at the end
of October 2011), and 65 speeches from Mario Draghi. The textual data has been scraped
from the ECB website.8
7In May 2003 the ECB introduced the new structure of the introductory statement in which theeconomic analysis is discussed first and the monetary analysis is put second. The ECB motivated thisdecision by stating that ”the Governing Council wishes to clarify communication on the cross-checking ofinformation in coming to its unified overall judgement on the risks to price stability” (European CentralBank, 2003).
8https://www.ecb.europa.eu/press/pressconf
24

4.2 Preparing documents
The document is defined at the section level and a separate model is estimated for each
section. The reason to treat the sections separately is that, the standardized structure
of the press conference enables one to distinguish general topics at the preprocessing
stage and investigate latent aspects using a topic model. Focusing on sections gives more
confidence about the context in which words should be understood, alleviating drawbacks
of the ”bag-of-words” representation.
For each press conference I develop an algorithm to: (1) break the transcript into
individual paragraphs; (2) assign each paragraph to section; (3) extract answers from the
Q&A session. I use keywords which are defined as bold word sequences in HTML code
of the press conference to record section where each paragraph is located. For example,
a paragraph which contains the keyword “key ECB interest rates” is identified as the
first paragraph of the decision summary, and a paragraph which contains the keyword
“economic analysis”, begins the section on the economic analysis.
Figure 1 shows how the number of words per section of the introductory statement
evolved over time, along with the Main Refinancing Operations rate (MRO), monetary
policy surprise and decisions regarding non-standard monetary policy measures. The
surprise component is measured by subtracting the Bloomberg survey median forecast
from the ECB rate announcement. Based on the raw word counts, economic analysis is
given a broader coverage than the monetary analysis. Moreover, the ECB communicates
more on the economic outlook when it raises the interest rate as compared to when
it cuts the interest rate. The spikes in the number of words in the decision summary
can be matched with the ECB announcements about new monetary policy tools and
implementation details. Another observation is that since Mario Draghi became the ECB
President in November 2011 the coverage of the cross-check part has sharply decreased
and currently it contains a single sentence that the cross-check of the monetary analysis
and the economic analysis confirms the need for the undertaken monetary policy action.
Because of LDA’s deficiency in handling documents that are too short (Tang, Meng,
Nguyen, Mei, & Zhang, 2014) and the low informational value of the cross-checking over
25
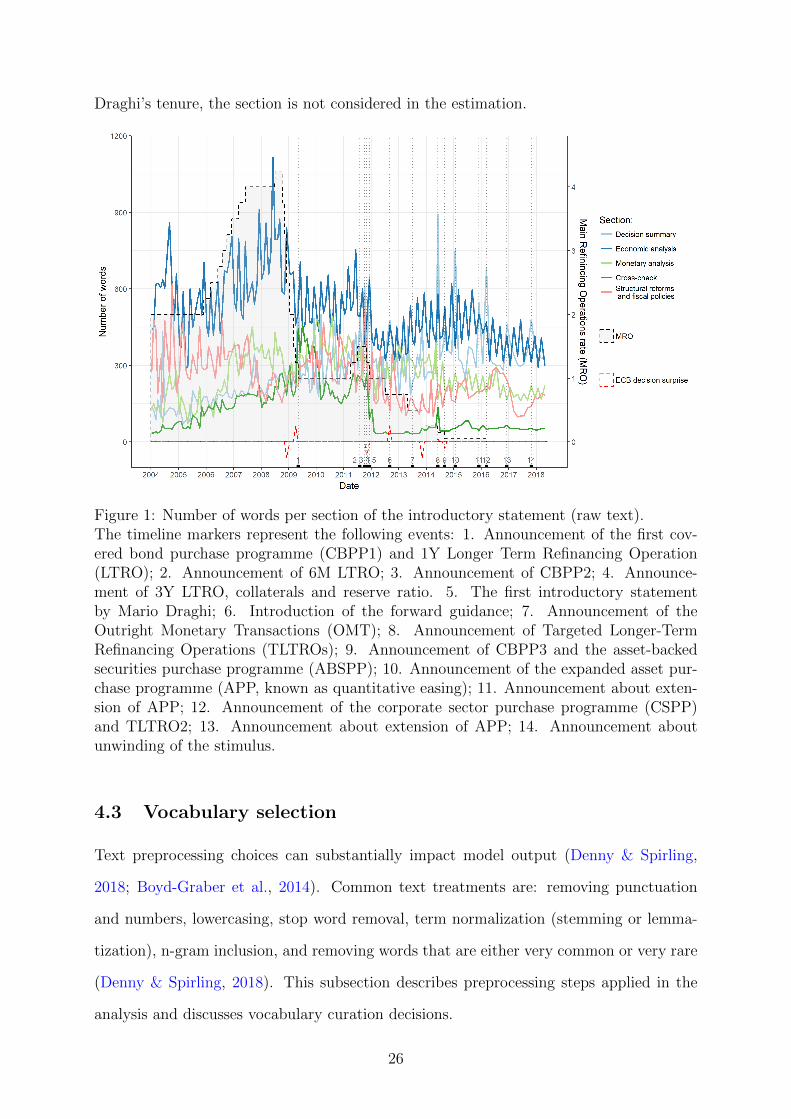
Draghi’s tenure, the section is not considered in the estimation.
Figure 1: Number of words per section of the introductory statement (raw text).The timeline markers represent the following events: 1. Announcement of the first cov-ered bond purchase programme (CBPP1) and 1Y Longer Term Refinancing Operation(LTRO); 2. Announcement of 6M LTRO; 3. Announcement of CBPP2; 4. Announce-ment of 3Y LTRO, collaterals and reserve ratio. 5. The first introductory statementby Mario Draghi; 6. Introduction of the forward guidance; 7. Announcement of theOutright Monetary Transactions (OMT); 8. Announcement of Targeted Longer-TermRefinancing Operations (TLTROs); 9. Announcement of CBPP3 and the asset-backedsecurities purchase programme (ABSPP); 10. Announcement of the expanded asset pur-chase programme (APP, known as quantitative easing); 11. Announcement about exten-sion of APP; 12. Announcement of the corporate sector purchase programme (CSPP)and TLTRO2; 13. Announcement about extension of APP; 14. Announcement aboutunwinding of the stimulus.
4.3 Vocabulary selection
Text preprocessing choices can substantially impact model output (Denny & Spirling,
2018; Boyd-Graber et al., 2014). Common text treatments are: removing punctuation
and numbers, lowercasing, stop word removal, term normalization (stemming or lemma-
tization), n-gram inclusion, and removing words that are either very common or very rare
(Denny & Spirling, 2018). This subsection describes preprocessing steps applied in the
analysis and discusses vocabulary curation decisions.
26

First, I remove neutral sentences or parts of sentences that introduce the next section
and are repeated in every speech, for example: “Ladies and gentlemen, the Vice President
and I are very pleased to come you to our press conference”, “Let me now explain our
assessment in greater detail, starting with the economic analysis”, “We are now at your
disposal for questions”. The complete list of expressions that were removed is provided
in Appendix C. I also clean the Q&A section from the answers in French, since English-
translations of these answers (that are included in the analysis) immediately follow.
The second step is to convert all words to lower case, remove punctuation, stop words
and month names. Stop words are common function words like ”the” or ”and” with
no inherent useful information and their overwhelming presence in all documents can
produce spurious associations between content words (Roberts et al., 2014).9 I also remove
all words containing non-alphabetic characters, with the exception of labels for money
aggregates (M1, M2, M3) and abbreviations for groups of countries (G3, G7, G8, etc.).
The third step is term normalization: each term is classified into its part of speech
(POS) using Stanford POS tagger (Collobert et al., 2011) and reduced to its dictionary
form by lemmatization.10
Finally, I identify collocations and create multiword expressions, called n-grams, which
allow one to capture the broader context of a word and reduce ambiguities resulting from
the ”bag of words” assumption. I use Normalized Pointwise Mutual Information (Bouma,
2009) as a measure of word association, and part of speech patterns (Justeson & Katz,
1995) to filter candidate word sequences for further consideration as collocations. The
list of all n-grams that were used in the analysis is provided in Appendix C. It includes
technical terms used by the ECB such as ”full allotment” or ”covered bond”, expressions
providing context for very common words, like ”key ecb interest rate unchanged”, as well
as long-used statements specific to ECB communication, such as the premise to ”never
pre commit” to any future policy action.
Table 1 reports descriptive statistics of the vocabulary before and after implementing
9The stop word list is from http://snowball.tartarus.org/algorithms/english/stop.txt. Itincludes pronouns, articles, prepositions, conjunctions.
10Stanford POS-tagging algorithm is used to provide auxiliary information about the part of speechfor the WordNet lemmatizer in Python.
27

the preprocessing steps. The preprocessed text is converted to a document-term frequency
matrix, where rows represent documents and columns represent unique terms. The ele-
ments of the matrix are term frequencies in the documents.
Table 1: Data dimensionality reduction after preprocessing steps.
RawStop words removaland lemmatization
Creatingn-grams
Total words 775842 365040 321406
Average section length 829 390 343
Unique words (vocabulary size, overall) 9175 6118 6250
Unique words by section:
Decision summary 1763 1221 1336
Economic analysis 1805 1260 1361
Monetary analysis 1589 1040 1109
Cross-check 901 650 714
Structural reforms, fiscal policies 2380 1674 1748
Q&A 8782 5936 6053
After eliminating text formatting, removing stop words, lemmatization and creating
n-grams there are still frequent domain-specific terms which do not contribute to the
meaning of the documents. Those terms tend to skew word distributions and dominate all
topics. Removing the frequent and contentless words also leads to a less computationally
intensive problem. A popular technique of dimensionality reduction is frequency-inverse
document frequency (tf-idf) weighting, which punishes both rare and frequent terms (Blei
& Lafferty, 2009; Boyd-Graber et al., 2014). However, reducing the vocabulary of the ECB
press conferences by putting thresholds on tf-idf weight would prune out terms which are
important for the thematic content of the statement (the terms with the lowest tf-idf
weight in each section are presented in Figure 6 in Appendix C). In addition, it is difficult
to argue for the cutoff settings employed in tf-idf based filtering. An alternative solution
is developing a domain-specific stop word list, but hand-curated lists of words may call
into question the validity of a model: it can be biased towards what the researcher views
as irrelevant in a corpus after repeated LDA runs.
28

Schofield, Magnusson, and Mimno (2017) show that further removal of stop words
beyond most frequent terms, like determiners, conjunctions ad prepositions, does not
consistently improve the model’s performance in terms of model likelihood, topic coherence
or classification accuracy. LDA may also partially accommodate separating out common
words without removing them by placing an asymmetric Dirichlet prior on document-topic
distribution, which is adopted in the thesis (Wallach, Murray, et al., 2009). Taking into
account these considerations and reproducibility of the results, no corpus-specific stop
words were removed.11
Another decision point is the method of term normalization. Two different normal-
ization approaches are usually distinguished – stemming and lemmatization (Schutze,
Manning, & Raghavan, 2008). Both techniques aim to reduce inflectional and deriva-
tional word forms to a common base form. Stemming refers to applying a set of rules to
remove the affixes (for example, it reduces “increasing” to “increas”, “stability” to “stabil”,
“financial” to “financi”). The most widely used are algorithmic stemmers (Porter, Lovins,
Paice/Husk), which operate without a lexicon and thus ignore word meaning.
In contrast to algorithmic stemmers, lemmatization requires morphological knowledge.
It involves determining the part of speech of a word in a sentence before reducing the
word to its lemma. A lemmatizer transforms all plurals into singular forms and past-tense
verbs to present-tense verbs (e. g. “left” to “leave”, “developments” to “development”, but
“stability” and “financial” are unaffected).
I use a lemmatizer because it is more accurate than stemmer and it is unlikely to
over-conflate (Schofield & Mimno, 2016). First, a lemmatizer finds a common form for
irregular verbs and nouns (”analyses”- ”analysis”, ”indices”- ”index”), which an algorithmic
stemmer cannot. Second, a stemmer may remove too many endings and conflate terms
with different meanings. For example, a stemmer (e.g., the Porter (2001) stemmer) would
view the following pairs of words as equivalent while lemmatization would not: ”import”
and ”important”, ”income” and ”incoming”, ”emerging” and ”emergence”, ”future” and
”futures”, ”maturity” and ”mature”, ”consistent” and ”consist”, ”positive” and ”position”,
11Additional checks with an extended stop word list led to the same number of topics selected.
29

”accounts” and ”accountability”.
A lemmatizer increases precision at the expense of recall. In contrast to a stemmer, it
is not able to conflate semantically related words belonging to different parts of speech.
For example, in the sentence: “With regard to fiscal policies, the Governing Council sees
continued reasons for concern”, the term ”continued” is tagged as adjective and its lemma
is ”continued”. The Porter stemmer conflates ”continue”, ”continuing”, ”continued” to the
same stem“continu”. Another example: ”inform”and ”information”have different lemmas,
but the same stem.
4.4 Financial data
This thesis uses the VSTOXX index to measure investor’s reaction to ECB communication
patterns on press conference days. The VSTOXX index represents the implied volatility
of the Euro Stoxx 50 index (EURO STOXX 50 real-time option prices) and it is designed
to reflect market expectations of near-term volatility. The index was also investigated
in the context of ECB communication and monetary policy actions by Grimaldi (2011),
Fratzscher, Duca, and Straub (2016), Picault and Renault (2017), and is often used as a
proxy for uncertainty in the euro area. The daily closing values of the VSTOXX index
for stock market volatility are sourced from Bloomberg. The series is log-transformed and
differenced to approximate the percentage change.
A number of control variables is considered in the empirical investigation: the surprise
component of the ECB interest rate decision, a dummy variable for the announcements
regarding non-standard monetary policy measures (the complete list of the announcements
is presented in Figure 1), the daily difference in German 2-year government bond yields
and the surprise component of the U.S. jobless claims. The data on German government
bond yields, the MRO rate and released values of the U.S. jobless claims are collected
from Bloomberg.12 The sample period for the financial variables is from January 2004 to
April 2018. After obtaining daily differences, only the values on ECB press conference
12Ticker codes for the Bloomberg data: V2TX (VSTOXX Index), GTDEM2Y:GOV (German 2-yearbond yields), EURR002W:IND (the Main Refinancing Operations Rate), INJCJC:IND (the U.S. joblessclaims).
30

days are considered.
All surprise components are constructed by deducting the Bloomberg survey median
expectations of professional forecasters from the released value. Ehrmann and Fratzscher
(2005) find that the survey expectations about monetary policy decisions are unbiased
and efficient.
31

5 Results
LDA yields two types of output for each section of the press conference: topic proportions
in documents and word probabilities in topics. Furthermore, the model selection procedure
provides insights about interactions between dimensionality of the latent space, model fit
and model interpretability. This section describes the main findings. It starts with general
remarks about model selection and properties of the estimated topic-word and document-
topic distributions. Next, it investigates the changing attention to different topics over
time.
5.1 Estimated topics
In line with the findings of Chang et al. (2009), higher model complexity results in lower
perplexity, but also in lower average coherence. Exclusivity does not seem to be related to
semantic coherence, confirming that the two measures capture distinct aspects of topic in-
terpretability. The set of solutions with the highest coherence and exclusivity is dominated
by relatively parsimonious models. The selected dimensionality varies across sections, but
it does not exceed 10 topics. Diagnostic plots illustrating model selection are presented
in Appendix D.
I find that document-topic distributions are generally sparse in all sections, i.e. few
topics comprise a document. The conclusion about sparsity of the document-topic distri-
butions will not change if a different number of topics is specified. Furthermore, LDA is
able to group the press conferences in time although no information about the order of
documents is incorporated in the estimation procedure. The sparsity of document-topic
distributions and the similarity of consecutive documents lead to identification of differ-
ent phases of ECB communication. Although the sections of the press conference were
considered separately in the estimation, the algorithm identifies a rise of a new topic in
each section at approximately the same time.
It is worth stressing that the topic sparsity in the ECB press conferences is not detected
if one follows the heuristics about Dirichlet prior parameters instead of estimating them.
The heuristic (α = 50K
) imposes that the document-topic distribution is smooth forK < 50.
32
In line with the heuristic regarding Dirichlet prior parameter for topic-word distributions,
the estimated word-topic distributions are sparse: there is a limited number of words with
relatively high probability.
As expected, frequent words in the corpus often end up scattered across top most likely
words in many topics. The term re-ranking using the FREX score downgrades general
terms and corpus-specific stop-words and reveals intuitive topic interpretations based on
keywords that are both frequent and exclusive. To illustrate this point, Figure 2 presents
word clouds of the two most popular topics in the economic analysis section which were
labeled as ”Positive economic outlook” and ”Negative economic outlook”. The size of the
word in a cloud is proportional to its probability in a topic. The top 10 words ranked by
the FREX score are listed below Figure 2. If topics were represented in a common way
in terms of their most frequent terms, they would be described by nonexclusive words
and many topics in this section would appear to be similar. On the other hand, the most
exclusive terms are also infrequent and not representative for the topic-specific content.
Both frequency and exclusivity are important for extracting the most characteristic terms.
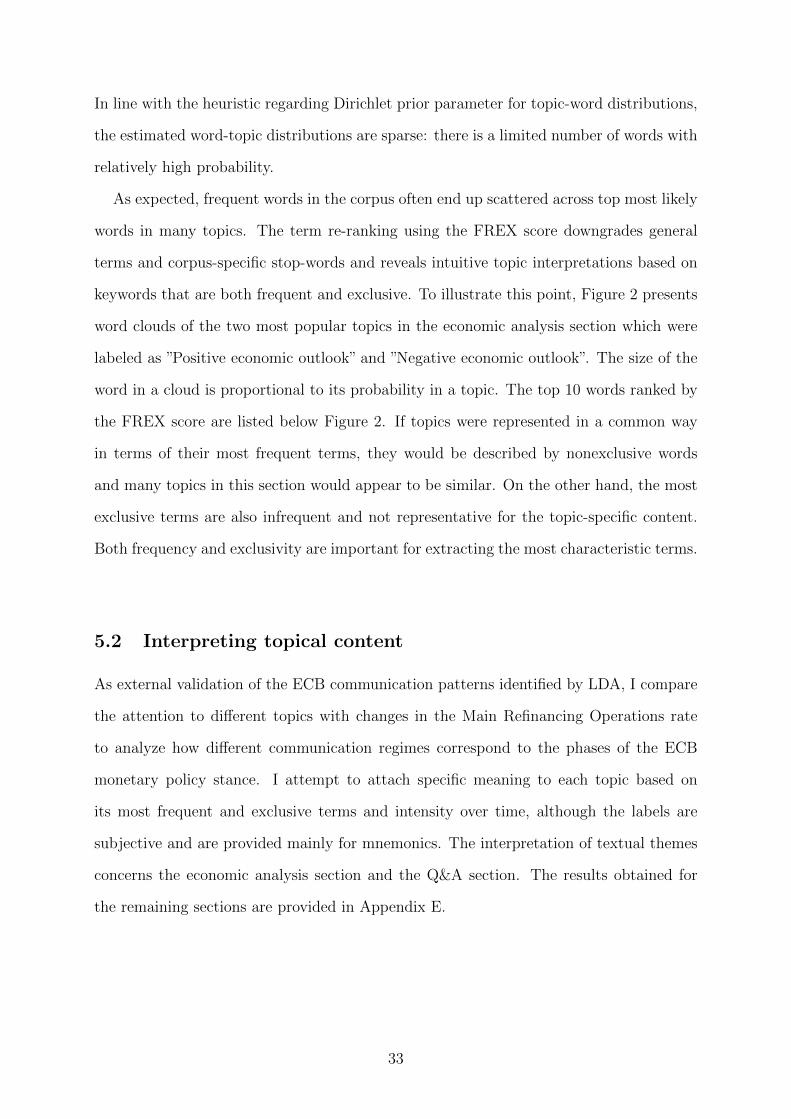
5.2 Interpreting topical content
As external validation of the ECB communication patterns identified by LDA, I compare
the attention to different topics with changes in the Main Refinancing Operations rate
to analyze how different communication regimes correspond to the phases of the ECB
monetary policy stance. I attempt to attach specific meaning to each topic based on
its most frequent and exclusive terms and intensity over time, although the labels are
subjective and are provided mainly for mnemonics. The interpretation of textual themes
concerns the economic analysis section and the Q&A section. The results obtained for
the remaining sections are provided in Appendix E.
33

(a) Topic 2: ”Negative economic outlook”.Top terms ranked by the FREX score: weak,low level, economic outlook, gradual, public,expected, modest, insufficient, global demand,slow.
(b) Topic 5: ”Positive economic outlook”.Top terms ranked by the FREX score:side, robust, economic growth, earnings,favourable, efficiency, lie, short term, con-sumption growth.
Figure 2: Distributions over terms represented as word clouds, where the size of a term isapproximately proportional to its probability. The word clouds show 200 most frequentterms in each topic.
Figure 3: Topic proportions over time and the ECB interest rate decisions. Section:Economic analysis.
34

Table 2: Top 10 terms within topics ranked by the FREX score. Section: Economic analysis.
1 ”Projections” 2 ”Positive economic outlook” 3 ”Wage-price spiral”staff macroeconomic projection side schemeecb robust avoidrange economic growth partyeurosystem earnings food priceprojection favourable soundrevise efficiency behaviourstaff projection lie shockforesee short term orderupwards oil price constraintdownwards consumption growth power4 ”Stimulus” 5 ”Negative economic outlook” 6 ”Recovery”correction weak monetary policy measurefunction low level private consumptionstimulus economic outlook economic recoverymacroeconomic gradual structural reforminflation rate close medium term public exchange ratefinancial system expected closelyowing modest geopolitical riskaim insufficient pickrestore global demand monitorkeep slow household
Figure 3 graphs topic proportions over time in the section on economic analysis. The
key terms of topic 1 (”staff macroeconomic projection”, ”range”, ”revise”, ”upwards”,
”downwards”) appear to capture a discussion about macroeconomic projections. The
topic is especially active on the press conference days in March, July, September and
December when the quarterly staff macroeconomic projections are presented.
The remaining topics in the section can be reasonably associated with various phases
of the ECB monetary policy stance. Topic 2 remains strong during the tightening phase
2005-2007. The topic is mostly characterized by both frequent and exclusive terms such as:
”robust”, ”favourable” and ”efficiency”, highlighting a discussion about positive economic
outlook. It declines shortly after the sequence of the rate hikes; its proportion falls
permanently below 50% on the meeting in December 2007, whereas the last rate hike in
the sequence occurred in June 2007.
Topic 3 is the most prominent during the first phase of policy responses to the financial
turmoil that started in August 2007 (Stark, 2009). In that period the ECB particularly
often used the keyword ”scheme” to express the concern about wage-price spiral, but in
general the fundamentals of the euro area economy were described as ”sound”.13
13The ECB has repeatedly used the term ”scheme”and ”shock”in the following context: ”the GoverningCouncil is concerned about the existence of schemes in which nominal wages are indexed to consumerprices. Such schemes involve the risk of upward shocks in inflation leading to a wage-price spiral” (Pressconference, 3 July 2008).
35

The bankruptcy of Lehman Brothers in September 2008 marks the intensification of
the crisis and precedes an abrupt change in ECB communication. Topic 4 surges in
November 2008, exactly on the first conference day the ECB cut its key interest rate by
50 basis point after the Lehman collapse.14 Distinctive for this phase is a discussion about
”financial system” and ”stimulus”. This phase was finished with two interest rate increases
in April and July 2011, which turned out to be premature (Constancio, 2018).
The rise of topic 5 marks the start of the recession in the third quarter of 2011 that
lasted until the first quarter of 2013, according to CEPR definition of recessions for the
euro area. This phase is associated with the easing cycle where the language used by the
ECB (”weak”, ”low level”, ”modest”, ”insufficient”, ”slow”) reflected the weakness of the
economy.
The discourse represented by topic 6 was emerging gradually, as the interest rates were
approaching the zero lower bound. The ECB introduced its unconventional monetary
policy instruments and hence predominant for topic 6 is the keyword ”monetary policy
measure”, but the other frequent and exclusive terms are ”economic recovery”, ”structural
reform”, ”exchange rate”, ”household” and ”private consumption”. Interestingly, a reading
of the statements confirms that the ECB expressed concerns about exchange rate devel-
opments, discussed the structural reforms, private consumption and the situation of the
households as a part of its economic analysis solely in the statements where topic 6 is
active (2004-2005 and 2013-2017) and never in between. What is common to these two
periods is that both concern the phase of the economic recovery. The recovery discussed
in 2004-2005 followed the protracted period of economic slowdown experienced from mid-
2001 to mid-2003 (European Central Bank, 2009). This suggests that there might exist
some recurring textual patterns of central bank communication, although the current
sample is too short to make explicit links between communication and the business cycle.
During the Q&A session the ECB has the opportunity to clarify its messages and
emphasize its point of view about the economic outlook. Conversely, the questions may
14The first press conference after the Lehman collapse was held on 2nd October 2008 and the decisionwas to keep the interest rates unchanged. The first interest rate cut in response to the financial crisis wasunscheduled. It took place on 8th October 2008 as a part of coordinated action with other major centralbanks. See https://www.ecb.europa.eu/press/pr/date/2008/html/pr081008.en.html
36

reveal ambiguities in ECB communication or indicate topics that market participants
find important. In contrast to the introductory statement, which is prepared by the
whole Governing Council, the answers provided by the ECB President during the Q&A
session are non-prompted. Therefore, we can expect differences between the wording used
by Jean Claude Trichet and Mario Draghi.
Figure 4: Topic proportions over time and the ECB interest rate decisions. Section:Q&A. The white vertical line indicates the first press conference held by Mario Draghi(November 2011).
Table 3: Terms within topics ranked by the FREX score. Section: Q&A.
1 ”General terms” 2 ”General terms” 3: ”Vigilance” 4 5 ”Liquidity”time particular vigilant episode commercial bankfirst already vigilance correction decreasequestion observe body atlantic boldyear line homework dynamic refinance operationway present diagnosis labour productivity main refinance operationcome respect favourable economist long term refinancepoint include erm ii counter exceptionalmuch possible sentiment social partner supplymean behalf million inhabitant delivery money marketgive carefully banca italia salary mro6 7 ”LTRO/OMT” 8 ”Greek crisis” 9 ”QE” 10 ”QE/tapering”doctrine fragmentation ela abs eurozonehead funding haircut effect nplsrestore ltro greek low inflation sustainedpeer ltros conditionality qe asset purchase programmegovernance fiscal consolidation waiver cause asset purchaseadvanced economy supervisor sharing lending financing conditioncommensurate backstop summit medium term outlook underlieahead omt counterparty factor stockmessage omts financing affect taperrecord undertake greece company path
37

Figure 4 shows the topical representation of answers provided during the Q&A session.
Several interesting points emerge. A spontaneous speech, in comparison to prepared
speech, appears to have smaller signal to noise ratio, where noise is represented by words
that do not contribute to the informational value of the answer. As expected, LDA with
an asymmetric prior on the document-topic distribution was able to handle very common
words, like ”question”, ”much”, ”give”, ”behalf” or ”already”, in an appropriate fashion and
sequester them into topics 1 and 2.
There is a discontinuity in the topics’ probabilities occurring at the first conference
held by Mario Draghi. The discontinuity in the time series of topics 1 and 2 may reflect
different speaking styles of both Presidents, but there is also a clear split among specialized
topics discussed during the tenures of Trichet and Draghi.
Starting with the answers of Trichet, the attention to the topic ”Vigilance” was dom-
inating in advance of the tightening phase 2005-2007 and during that period. This ob-
servation is in line with Jansen and De Haan (2007) who counted the frequency of the
keyword ”vigilance”/”vigilant”, and found that it was used extensively in ECB communi-
cation starting in March 2004 and continued to be mentioned after the tightening cycle,
but less often. The code word ”vigilance” used to be a clear signal for financial markets
that the ECB pre-announces the interest rate hike.15 Topic 5 also has a natural label.
It clusters terms related to various liquidity injecting operations provided to the banking
sector (main refinancing operations and longer-term refinancing operations).
The Q&A sessions held by Draghi seem to be richer in content. The focal points are
additional explanations about non-standard monetary policy measures (LRTOs – Long
Term Refinancing Operations, OMTs – Outright Monetary Transactions, the asset pur-
chase program), the Greek crisis and ELA (Emergency Liquidity Assistance, on which the
Greek banks have been highly dependent since being cut off from standard ECB funding
options).
15According to Reuters, June 22, 2011: ”The ECB used the phrase “strong vigilance” in March beforeincreasing rates in April. It also used the phrase repeatedly during its 2005-2007 rate hike cycle, typicallyone month before it raised rates, although there were exceptions to that rule.”
38

5.3 Shifts in ECB communication
This section examines the stock market reaction to shifts in ECB communication. I
exploit the feature of the ECB statements that topics emerge and disappear over time
to investigate whether the transition periods in ECB communication increase market
volatility. The market reaction is measured with the VSTOXX index.
The aim is to derive a simple topic-based measure that captures the phases of ECB
communication when the message was relatively homogeneous. An intuitive approach is
to define a summarizing communication measure for each section as a proportion of the
topic with the highest probability on a conference day:
Id = maxk∈1,...,K
(θd,k). (22)
Large values (near one) imply that ECB communication is dominated by a single topic,
whereas small values represent a situation where a variety of topics is discussed.
The analysis is constrained to the sections: decision summary, economic analysis, mon-
etary analysis (because they refer to the two pillars of the ECB decision making) and
Q&A session (because of its unique clarification role). The communication measure ig-
nores topics that constitute a featured part of discussion (topic 1 about macroeconomic
projections in the economic analysis section) or low-quality topics containing corpus spe-
cific stop words (topics 1 and 2 with general terms in the Q&A section). The probability
of the dominating topic from the set of remaining topics is then normalized by dividing
by the sum of topic probabilities in this set. Figure 5 graphs the communication measures
derived from LDA document-topic distributions. For presentation purposes, a moving
average filter (3 meetings) is used to smooth out short-term fluctuations in probabilities.
Analysis of the impact of ECB communication is conducted through event-based re-
gressions, where only statement days are considered. The empirical investigation is com-
plicated by the fact, that the ECB press conference always takes place on the same day
as a monetary policy decision is announced. To control for the effects of policy actions, I
include the absolute surprise component in the ECB monetary policy decision, as in Rosa
39
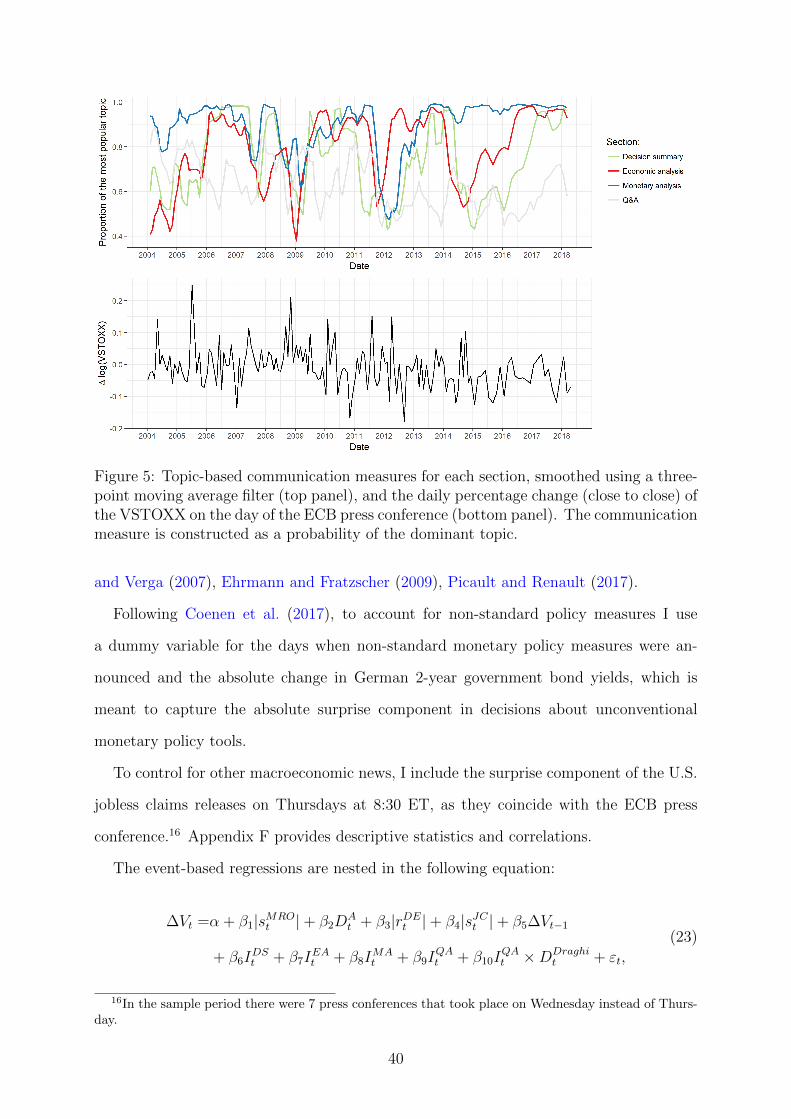
Figure 5: Topic-based communication measures for each section, smoothed using a three-point moving average filter (top panel), and the daily percentage change (close to close) ofthe VSTOXX on the day of the ECB press conference (bottom panel). The communicationmeasure is constructed as a probability of the dominant topic.
and Verga (2007), Ehrmann and Fratzscher (2009), Picault and Renault (2017).
Following Coenen et al. (2017), to account for non-standard policy measures I use
a dummy variable for the days when non-standard monetary policy measures were an-
nounced and the absolute change in German 2-year government bond yields, which is
meant to capture the absolute surprise component in decisions about unconventional
monetary policy tools.
To control for other macroeconomic news, I include the surprise component of the U.S.
jobless claims releases on Thursdays at 8:30 ET, as they coincide with the ECB press
conference.16 Appendix F provides descriptive statistics and correlations.
The event-based regressions are nested in the following equation:
∆Vt =α + β1|sMROt |+ β2D
At + β3|rDEt |+ β4|sJCt |+ β5∆Vt−1
+ β6IDSt + β7I
EAt + β8I
MAt + β9I
QAt + β10I
QAt ×DDraghi
t + εt,
(23)
16In the sample period there were 7 press conferences that took place on Wednesday instead of Thurs-day.
40

where ∆Vt denotes the daily percentage change in the euro VSTOXX index on the con-
ference day, sMROt and sJCt are surprise components of the MRO rate and the U.S. jobless
claims respectively, DAt is an indicator for announcements regarding non-standard mon-
etary policy measures, rDEt is a daily change in German 2-year government bond yields
and IDSt , IEAt , IMAt , IQAt denote the index values that capture changes in communication
by section: Decision summary, Economic analysis, Monetary analysis, Q&A. The com-
munication score for the Q&A section also appears in the interaction with an indicator
variable for presidency (DDraghit ). Table 4 shows the estimation results.
In the regressions, I use the values of the communication measures derived from the
matrix of document-topic distributions averaged across 400 draws from a Markov chain.
However, there is uncertainty arising from the sampling algorithm used to estimate topics.
The regression analysis is repeated for each draw to obtain a distribution of the effect,
similarly to Hansen et al. (2017). Table 4 reports the range of the 5th to 95th percentiles
of these distributions.
The qualitative conclusion is that the major transitions in ECB communication re-
garding the two pillars of ECB decision making, economic analysis and monetary analy-
sis, have an incremental information over the ECB monetary policy decisions not already
incorporated in market expectations, and after controlling for all announcements about
non-standard monetary policy measures. The uncertainty proxied by the VSTOXX index
is on average lower when the ECB sends a homogeneous message, than it is in times of
transition to a different topic. The most robustly estimated effect is found for the mone-
tary analysis. The results suggests that if the ECB sends a consistent message over time,
it is likely to be interpreted similarly by market participants. However, agents might
disagree in the short term about the interpretation of the news in the statements, leading
to increased uncertainty (Dewachter, Erdemlioglu, Gnabo, & Lecourt, 2014).
The changing composition of the decision summary is not significant. This is expected,
as the effect of this section should be already subsumed into the effect of announcements
about policy rate and non-standard monetary policy measures. Similarly, the changing
composition of the Q&A session is not informative for the market. This result agrees with
41

Table 4: Regression results.
Dependent variable:∆Vt
(1) (2) (3)
|sMROt | −0.115 −0.136 −0.139
[0.333] [0.258] [0.236]
DAt −0.023 −0.017 −0.010
[0.240] [0.384] [0.594]
rDEt −0.176∗∗ −0.174∗∗ −0.171∗∗
[0.039] [0.038] [0.038]
|sJCt | 0.001 0.0004 0.0003[0.111] [0.348] [0.427]
∆Vt−1 −0.017 0.019 0.059[0.876] [0.861] [0.591]
IDSt 0.047 0.040[0.134] (0.023; 0.054) [0.205] (0.015; 0.048)
IEAt −0.063∗ −0.052[0.075] (−0.077;−0.037) [0.137] (−0.064;−0.029)
IMAt −0.099∗∗ −0.087∗∗
[0.022] (−0.117;−0.067) [0.041](−0.104;−0.055)
IQAt 0.025 −0.008[0.566] (0.001; 0.048) [0.851](−0.026; 0.016)
IQAt ×DDraghit −0.051∗∗
[0.012](−0.057;−0.044)
Constant −0.019∗∗ 0.072 0.092∗
[0.020] [0.167] [0.076]
Observations 156 156 156Adjusted R2 0.034 0.071 0.105Partial F Statistic 2.476∗∗ 3.336∗∗∗
Note: p-values are in brackets and the sampling uncertainty is in parentheses. Partial F test isused to verify if communication variables are jointly significant. ∗p<0.1; ∗∗p<0.05; ∗∗∗p<0.01.
the findings of Ehrmann and Fratzscher (2009) who analyze the reaction of three-month
Euribor futures and find that the Q&A session does not systematically add information
beyond that contained in the introductory statement, suggesting that in most cases the
introductory statement provides sufficient explanations. Although the Q&A does not seem
to significantly affect the stock market, the presidency matters. Under the leadership of
Trichet stock market volatility was on average higher than under Draghi. To a large
extent the effect may be attributed to the financial crisis.
42

5.4 Robustness
Specification of communication variables
As a robustness check, I recode the communication score to a categorical variable. The
recoded variable captures the major transition periods and is insensitive to minor fluc-
tuations in the probability of the dominant topic. The categories can be interpreted as
three degrees of homogeneity of the ECB talk: (1) single topic clearly dominates the
discussion, (2) it is not sure which topic will dominate, as the probability of the most
dominant topic is at its lowest level (3) a transition period between the cases (1) and (2).
The cutoff values are set to 0.3 and 0.7 quantile of the score distribution in each section.
For the Q&A section the quantiles are computed in subsamples by Trichet and Draghi
tenure. This specification strengthens the significance of the Monetary analysis and the
Economic analysis. Table 12 in Appendix G reports the results. An alternative specifica-
tion of variables where the probabilities are smoothed with an spline before recoding the
variable to categories does not qualitatively influence the results and the estimates are
not presented.
LDA model selection
One may be concerned about the impact of the number of topics on the results, as the
model selection necessarily involved human judgment in balancing multiple criteria (ex-
clusivity, coherence, predictive power). To address this issue, two other schemes for topic
selection were tested. The first scheme discards solutions below the 2/3 quantile along the
dimensions of semantic coherence and excusivity (as in the baseline procedure) and then
selects the model that strictly dominates other models in terms of both coherence and
exclusivity. The number of topics decreases for the Decision summary (6 to 4), Economic
analysis (6 to 3), Monetary analysis (4 to 3), Q&A (10 to 7) . The second scheme de-
creases the baseline dimensionality in each section by 1. Table 13 in Appendix G reports
the estimates. The significance of the results does not change compared to the baseline
specification.
The effect is not stable if one selects more topics, for example, solely based on per-
43

plexity, which would approximately double the number of analyzed topics. In that case
it is no longer the prevalence of a single theme that determines whether ECB commu-
nication is relatively homogeneous, but two or three topics that co-occur and disappear
at the same time. Therefore finer topic disaggregation would require a re-specification of
the communication variables or combining topics that are close in terms of probability
distance. A potential route for circumventing the problem is to shift focus from model
selection in LDA to model selection in the analysis of financial market reaction - finding
topics that are most informative for the market.
44

6 Conclusions
This thesis focuses on the ECB press conference following the monetary policy decision
announcement on the same day. It analyzes (1) what are the main communication patterns
in the press conference and (2) how shifts in the communication patterns affect the stock
market reaction on the press conference days.
The results show that similar documents are clustered in time. The main topics surge,
die out over time, and rarely reappear in the analyzed sample period 2004 - 2018. Mar-
ket volatility increases when the ECB substantially updates its wording on the economic
and monetary analysis, as compared to the conference days when the ECB sends a rela-
tively homogeneous message, controlling for the unexpected components in standard and
non-standard monetary policy measures. The revisions to the ECB narrative in general
accompany the changes in the policy direction, but the increased uncertainty is not solely
driven by the ECB monetary policy actions. The shifts in ECB communication introduce
incremental volatility, suggesting that for some time the market participants might have
diverging views as to how the new explanations conveyed in the official statement should
be interpreted.
The analysis follows in two parts. First, LDA summarizes the ECB press conference
with a set of coherent and exclusive topics to identify the main communication patterns
in the ECB press conferences. The approach is automated, scalable and deductive - it has
the potential to reveal dimensions that are previously unknown or understudied in text.
Second, conditional on the document clustering discovered with LDA, the thesis proposes
and tests the properties of a communication measure to capture fundamental changes in
ECB communication on the economic analysis, monetary analysis and discussion during
the Q&A session.
The main contribution to the current literature that applies computational linguistics
tools to analyze central bank communication is a new topic-based communication measure
that does not depend on subjective interpretations of topics. Furthermore, the topic model
is estimated in a fully Bayesian approach instead of making ad-hoc choices about model
hyperparameters.
45

The thesis demonstrates the ability of LDA to identify speeches that change the cur-
rent discourse. In that way, the model improves understanding of how a central bank’s
words correspond to its actions. However, the model does not eliminate the need to read
statements in order to understand what they are about. Furthermore, deep understand-
ing of documents before estimation is necessary for making guided modeling decisions and
vocabulary choices.
There are several avenues for extending the analysis. First, this thesis makes an iden-
tification assumption that the monetary policy decisions, accompanying communication
and the release of the US jobless claims dominate all other news on ECB press confer-
ence days. To disentangle the effect of communication from the decision announcement
and reduce the influence of other news that hit the financial market on the same day,
the market reaction could be considered in separate time windows around the decision
announcement, and the press conference. However, the two events are not independent.
The content of the statement likely depends on the unexpected component in the deci-
sion (Ehrmann & Fratzscher, 2009). Assuming that documents of the press conferences
are generated conditional on some observed variables, one can incorporate the surprise
component into the prior on document-topic distributions and hence improve the informa-
tiveness of the prior used, or study how document-level covariates affect topic prevalence
(Mimno & McCallum, 2008; Roberts et al., 2014).
Second, LDA recognizes that similar documents are clustered in time, although no
information about the document ordering is incorporated in the estimation procedure, i.e.
LDA assumes that documents are exchangeable. It would be interesting to investigate
topic dynamics in a framework that explicitly models the evolving content in a sequence
of documents (Blei & Lafferty, 2006b).
46

Appendix A: Derivation of the full conditional distri-
bution of topic assignments
p(z(d)i |z
(d)−i ,Z(−d),W ,α,β) ∝ p(Z,W|α,β)
=
∫ ∫p(Z,W ,Θ,Φ|α,β)dΘdΦ
=
∫ D∏d=1
(p(θd|α)
Nd∏i=1
p(z(d)i |θd)
)dΘ
×∫ K∏
k=1
p(φk|β)D∏d=1
Nd∏i=1
p(w(d)i |z
(d)i ,Φ)dΦ
=D∏d=1
∫p(θd|α)
Nd∏i=1
K∏k=1
θI(z
(d)i =k)
d,k dθd
×K∏k=1
∫p(φk|β)
D∏d=1
Nd∏i=1
V∏v=1
φI(z
(d)i =k,w
(d)i =v)
k,v dφk
∝∫p(θd|α)
K∏k=1
θck,d,∗d,k dθd ×
K∏k=1
∫p(φk|β)
V∏v=1
φck,∗,vk,v dφk
=
∫Γ(∑K
k=1 αk)∏Kk=1 Γ(αk)
K∏k=1
θck,d,∗+αk−1
d,k dθd ×K∏k=1
∫Γ(∑V
v=1 βv)∏Vv=1 Γ(βv)
V∏v=1
φck,∗,v+βv−1
k,v dφk
∝∏K
k=1 Γ(ck,d,∗ + αk)
Γ(∑K
k=1 ck,d,∗ + αk)
∫Γ(∑K
k=1 ck,d,∗ + αk)∏Kk=1 Γ(ck,d,∗ + αk)
K∏k=1
θck,d,∗+αk−1
d,k dθd
=1, integrating over the entire support of Dirichlet
×K∏k=1
∏Vv=1 Γ(ck,∗,v + βv)
Γ(∑V
v=1 ck,∗,v + βv)
∫Γ(∑V
v=1 ck,∗,v + βv∏Vv=1 Γ(ck,∗,v + βv)
V∏v=1
φck,∗,v+βv−1
k,v dφk
=1, integrating over the entire support of Dirichlet
=
∏Kk=1 Γ(ck,d,∗ + αk)
Γ(∑K
k=1 ck,d,∗ + αk)×
K∏k=1
∏Vv=1 Γ(ck,∗,v + βv)
Γ(∑V
v=1 ck,∗,v + βv)
∝∏K
k=1 Γ(ck,d,∗ + αk)
Γ(∑K
k=1 ck,d,∗ + αk)×
K∏k=1
Γ(ck,∗,w(d)
i+ β
w(d)i
)
Γ(∑V
v=1 ck,∗,v + βv).
(24)
47

The next step is to separate terms, which depend on the current term (d, i). This
involves splitting the counts to the part which does not count the current position and
the part counting only the current position. We also use that Γ(x+ 1) = xΓ(x).
p(z(d)i |z
(d)−i ,Z(−d),W ,α,β) ∝
∏K
k=1;k 6=z(d)i
Γ(c−(d,i)k,d,∗ + αk)× Γ(c
−(d,i)
z(d)i ,d,∗
+ αz(d)i
+ 1)
Γ(1 +∑K
k=1 c−(d,i)k,d,∗ + αk)
×K∏
k=1,k 6=z(d)i
Γ(c−(d,i)
k,∗,w(d)i
+ βw
(d)i
)
Γ(∑V
v=1 c−(d,i)k,∗,v + βv)
×Γ(1 + c
−(d,i)
z(d)i ,∗,w(d)
i
+ βw
(d)i
)
Γ(1 +∑V
v=1 c−(d,i)
z(d)i ,∗,v
+ βv)
∝
∏Kk=1 Γ(c
−(d,i)k,d,∗ + αk)× (c
−(d,i)
z(d)i ,d,∗
+ αz(d)i
)
Γ(∑K
k=1 c−(d,i)k,d,∗ + αk)× (
∑Kk=1 c
−(d,i)k,d,∗ + αk)
×K∏k=1
Γ(c−(d,i)
k,∗,w(d)i
+ βw
(d)i
)
Γ(∑V
v=1 c−(d,i)k,∗,v + βv)
×(c−(d,i)
z(d)i ,∗,w(d)
i
+ βw
(d)i
)
(∑V
v=1 c−(d,i)
z(d)i ,∗,v
+ βv)
∝(c−(d,i)
z(d)i ,d,∗
+ αz(d)i
)
(∑K
k=1 c−(d,i)k,d,∗ + αk)
×(c−(d,i)
z(d)i ,∗,w(d)
i
+ βw
(d)i
)
(∑V
v=1 c−(d,i)
z(d)i ,∗,v
+ βv)
∝ (c−(d,i)
z(d)i ,d,∗
+ αz(d)i
)×(c−(d,i)
z(d)i ,∗,w(d)
i
+ βw
(d)i
)
(∑V
v=1 c−(d,i)
z(d)i ,∗,v
+ βv).
(25)
48

Appendix B: Estimation details
The model is estimated and evaluated for K = 3, . . . , 20 where K denotes the number
of latent topics (for the Q&A section, which is substantially longer than the remaining
sections, K = 6, . . . , 20).
B.1. Multiple random starts and calculation of perplexities
To compute perplexities, the data is split into the training and the testing set (held out
25% of words in each document). A model with K components is initialized from 5 random
starts. For each starting point the sampler runs for 2000 iterations. In each iteration
topic assignments are simulated with a collapsed Gibbs sampling step and concentration
parameters for the Dirichlet distributions are simuated with a Metropolis-Hastings step.
Variances of the proposal distributions are calibrated within the first 500 iterations. The
burn-in period is 1000. The start with the lowest average perplexity is selected. The
sampler runs for another 4000 iterations for the selected start. Every 10-th draw is stored
and the iterations used in the start selection procedure are considered as the burn-in
phase. This results in 400 samples from the posterior distribution.
Table 5: Perplexity scores for five chains with different initializations (iterations 1000-2000).
Mean Standard deviation
Section 1 2 3 4 5 1 2 3 4 5
DS 357.87 362.74 363.39 363.65 361.44 2.26 2.32 2.40 2.44 2.29
EA 383.23 380.24 383.34 383.37 380.74 1.54 1.51 1.50 1.44 1.44
MA 293.57 297.42 293.52 293.49 293.72 1.36 1.28 1.31 1.29 1.37
SF 483.04 482.64 482.36 481.95 482.21 2.95 2.94 2.74 3.07 2.88
QA 1039.17 1039.39 1041.37 1039.19 1038.50 1.30 1.51 1.32 1.27 1.39
Sections (number of topics in parentheses): DS - Decision summary (6); EA - Economic analysis (6);
MA - Monetary analysis (4); SF -Structural reforms and fiscal policies (6); QA - Q&A (10).
49
B.2. Estimation of model parameters and evaluation of the model
interpretability.
The estimation is conducted using the whole vocabulary. The multiple starts procedure
described in (B.1) shows that the chain is not sensitive to the starting values, therefore
this procedure is omitted. The sampler runs for 6000 iterations, out of which 2000 are
considered as the burn-in phase. Every 10-th draw is stored.
Stephens’s algorithm (Stephens, 2000) is implemented to verify whether label switching
has occurred and perform relabeling if necessary. The posterior mean estimates of the
model parameters are obtained by averaging over the draws.
To achieve a robust evaluation, the measures of semantic coherence and topic exclusiv-
ity are computed for different topic cardinalities: N = 5, 10, 15, 20; where N denotes the
number of words with the highest probability in a topic (Lau & Baldwin, 2016). A single
score for the model with K components is obtained by averaging the topic-level scores.
B.3. Metropolis-Hastings step
The random-walk Metropolis-Hastings step is composed of the following parts:
1. Sample candidate values β∗ from logN(β, s2β), where β(m) denotes the current value
of the parameter and s2β is the proposal variance. Similarly, sample candidate values
for α∗k from logN(α(m)k , s2
αk), k = 1, . . . , K.
2. For each univariate Metropolis-Hastings sampler compute the log acceptance proba-
bility (log transformation is applied to evaluate the Gamma functions). For example,
for the parameter β:
log δ = min(r, 0)
r = log(p(β∗|Z,W ,α)) + log(q(β(m)|β∗)
− log(p(β(m)|Z,W ,α))− log(q(β∗|β(m)),
(26)
where q(β|β(m)) is a candidate generating density function.
50
3. Set β(m+1) = β∗ with probability δ.
Set β(m+1) = β(m) with probability 1− δ.
B.4. Calibration of the proposal distribution
The procedure for calibrating the proposal distribution closely follows Jacobs et al. (2016).
The target acceptance rate is 50%. The calibration window size is 10. For each calibration
window the number of accepted samples (nA) is stored. If nA falls outside the 95%
confidence bounds of the Binomial distribution B(10, 0.5) then the variance is decreased
or increased. See Jacobs et al. (2016) for details. The initial Metropolis-Hastings standard
deviations are: sβ = 0.9, sαk= 0.5.
Appendix C: Vocabulary selection
Table 6: List of expressions removed from the corpus of the ECB press conferences.
”Ladies and gentlemen, the Vice President and I are very pleased to welcome
you at the press conference.”
”I will now report on the outcome of today’s meeting of the Governing Council
of the ECB, which was also attended by (. . . )”
”Based on its regular economic and monetary analysis the Governing Council
decided”
”Let me now explain our assessment in greater detail, starting with the eco-
nomic analysis.”
”Turning to the monetary analysis”
”We are now at your disposal for questions.”
51

Figure 6: Frequencies of 20 words with the lowest tf-idf score in each section. The termfrequency is tfv = 1 + log(nv), where nv is the number of occurrences of term v in alldocuments. The inverse document frequency is idfv = log( D
Dv), where D is the number of
documents, Dv is the number of documents in which term v occurs. The tf-idf weight ofterm v is tfv × idfv.
List of all n-grams used in the analysis (sorted by frequency, number of occurences
in parentheses):
euro area (3195), govern council (1812), monetary policy (816), medium term (811), interest rate (774), price stability (682),
first question (630), take account (540), inflation rate (536), second question (531), structural reform (499), central bank
(485), short term (437), economic activity (433), financial market (422), oil price (415), inflation expectation (394), hicp
inflation (377), exchange rate (377), price development (356), price stability medium term (348), fiscal policy (314), balance
sheet (311), monetary policy stance (293), low level (282), annual hicp inflation (277), annual hicp (277), medium long
term (268), fiscal consolidation (264), monetary policy measure (259), real economy (257), economic growth (252), labour
market (249), private sector (242), look ahead (239), key ecb interest rate (234), downside risk (234), stability growth pact
(231), long term (230), staff projection (228), upside risk price stability (218), annual growth (215), second round effect
(213), money market (209), inflationary pressure (206), growth rate (206), firmly anchor (206), economic analysis (202),
united state (197), financial stability (196), commodity price (191), energy price (188), cross check (180), real gdp growth
52

(174), staff macroeconomic projection (170), anchor inflation expectation (163), annual rate (162), economic recovery (161),
introductory statement (159), basis point (159), non standard measure (158), high level (158), loan non financial corporation
(154), upside risk (150), domestic demand (150), accord eurostat flash estimate (142), three month (142), price oil (139),
inflationary expectation (138), forward guidance (137), press conference (135), indirect ta (134), global level (133), ne t
year (130), definition price stability (129), risk outlook (129), real gdp (129), loan private sector (128), global economy
(126), long term inflation expectation (125), risk price stability (125), low inflation (125), inflation rate close medium (124),
inflation rate close medium term (124), key ecb interest rate unchanged (122), medium term outlook (119), risk price
stability medium term (119), public finance (118), european commission (118), headline inflation (114), administer price
(114), growth potential (113), pace monetary expansion (112), price pressure (111), financing condition (111), european
union (104), yield curve (103), job creation (103), remain subdue (102), fellow citizen (102), base effect (102), global
imbalance (100), economic outlook (100), market participant (99), monitor closely development (98), full allotment (98),
banking system (96), growth rate loan (95), loan sale securitisation (95), accommodative monetary policy (94), baseline
scenario (94), money credit growth (92), sustainable growth (92), monetary accommodation (91), food price (91), asset
purchase (91), real disposable income (89), broad money (88), balance sheet adjustment (84), non financial corporation
(83), monetary policy decision (83), non financial sector (78), social partner (78), non standard (78), national central bank
(77), adjust loan sale (77), policy relevant horizon (76), implementation structural reform (75), business cycle (75), broad
base (75), rate change (74), never pre commit (72), transmission monetary policy (72), long term refinance (72), broadly
balanced (72), unit labour cost (71), asset purchase programme (71), bank lending survey (70), market interest rate (69),
extend period time (69), protectionist pressure (69), federal reserve (69), non financial (67), monetary analysis (67), financial
system (67), ex ante (67), favourable financing condition (66), vice president (66), growth rate m3 (65), banking sector (65),
european parliament (64), single currency (61), financial environment (61), executive branch (61), main refinance operation
(60), refinance operation (60), private consumption (60), excessive deficit (60), excess liquidity (60), economic policy (60),
timely manner (59), global demand (57), stress test (56), low interest rate (55), fixed rate (55), financial condition (55),
oil commodity price (54), maintain price stability (54), monetary policy transmission (54), commercial bank (53), labour
market reform (52), broadly balance (52), risk premia (51), purchase power (51), world economy (50), long run (50), labour
productivity (50), covered bond (50), productivity growth (49), support purchase power (48), public sector (48), financial
market tension (47), policy measure (47), needle compass (46), purchase programme (44), pre commit (44), unite state
(43), inflationary risk (43), bond market (42), wage growth (41), risk management (41), output growth (41), loan growth
(41), domestic price (41), unemployment rate (40), pro con (40), monetary expansion (40), geopolitical risk (40), upward
53

trend (39), maintenance period (39), executive board (39), capital market (39), accommodative stance (38), foreign demand
(37), faithful mandate (36), output gap (35), risk aversion (34), market expectation (34), lag relationship (34), consumption
growth (34), business confidence (34), debt ratio (33), tail risk (32), banca italia (32), real estate (31), non conventional (31),
indirect taxation (29), central banker (29), advanced economy (27), world war (26), plausible measure (25), extended period
(25), crystal clear (25), pave way (23), bank england (23), fix rate tender (21), multi dimensional (21), interbank market
(21), ben bernanke (21), principal payment (20), jean claude (19), erm ii (19), youth unemployment (18), van rompuy (18),
adjusted loan sale securitisation (18), hedge fund (17), feedback loop (17), million inhabitant (16), macro prudential (16),
state art (15), reappraisal risk (15), per se (15), automatic stabiliser (15), unutilised capacity (14), property market (14),
preventive arm (14), playing field (14), mass unemployment (14), increase key ecb interest rate (14), inconsistent progress
(14), en passant (14), credit crunch (14), euro zone (13), quantum leap (12), investment grade (12), doha round (12), de
facto (12), tentative sign (11), reinvest principal (11), fine tuning (11), banque de (11), selective default (10), redenomination
risk (10), magnetic north (10), jurgen stark (10), human capital (10), backward look (10), porte parole (9), rendez vous
(8), boca raton (8), reduce key ecb interest rate (7), goldman sachs (5), founding father (5), charlie mccreevy (5), sick man
(3), prima facie (3), mea culpa (3), bretton wood (3), ad hoc (3), pari passu (2), optimist pessimist (2), gordon brown (2),
giscard estaing (2), et cetera (2), drilling exploration (2), bini smaghi (2), ich weiss nicht soll bedeuten (1), wir teilen ein
gemeinsames schicksal (1), iraq gaza syria libya (1), heine ich weiss nicht (1), jose manuel gonzalez paramo (1), nein zu allem
(1), coop himmelb au (1), saint malo brittany (1), putin george bush (1), caricature southern cabal (1), abraham lincoln
famously (1), admission guilt mao (1), monte dei paschi (1), splitting repackaging reformatting (1), arcelor mittal steel (1),
sea swimmer swim (1), munich milan uncollateralised (1), youtube video (1), tv broadcast (1), tumpel gugerell (1), survive
prosper (1), stricto sensu (1), somebody clue (1), sn reaal (1), sine qua (1), silver bullet (1), ring fenced (1), preach desert
(1), police judicial (1), passing baton (1), oregon utah (1), optical illusion (1), occupational geographical (1), mumbling
rumbling (1), mill printing (1), meilleur gagne (1), matti vanhala (1), luc dehaene (1), los cabos (1), killer medicine (1), jim
flaherty (1), istanbul gothenburg (1), ingenious creative (1), indover nl (1), horst staatssekretar (1), hildebrand resignation
(1), helmut schlesinger (1), giuliano amato (1), fruitless chatter (1), consiglio superiore (1), cleverness intelligence (1),
chamber versailles (1), cfi gcfi (1), ceteris paribus (1), cesr clearing (1), bubbly ish (1), blind deaf (1), blank cheque (1),
bertie ahern (1), bankhaus ag (1), author reuters (1), assemblee nationale (1), wall street journal (1), sub prime (1)
54
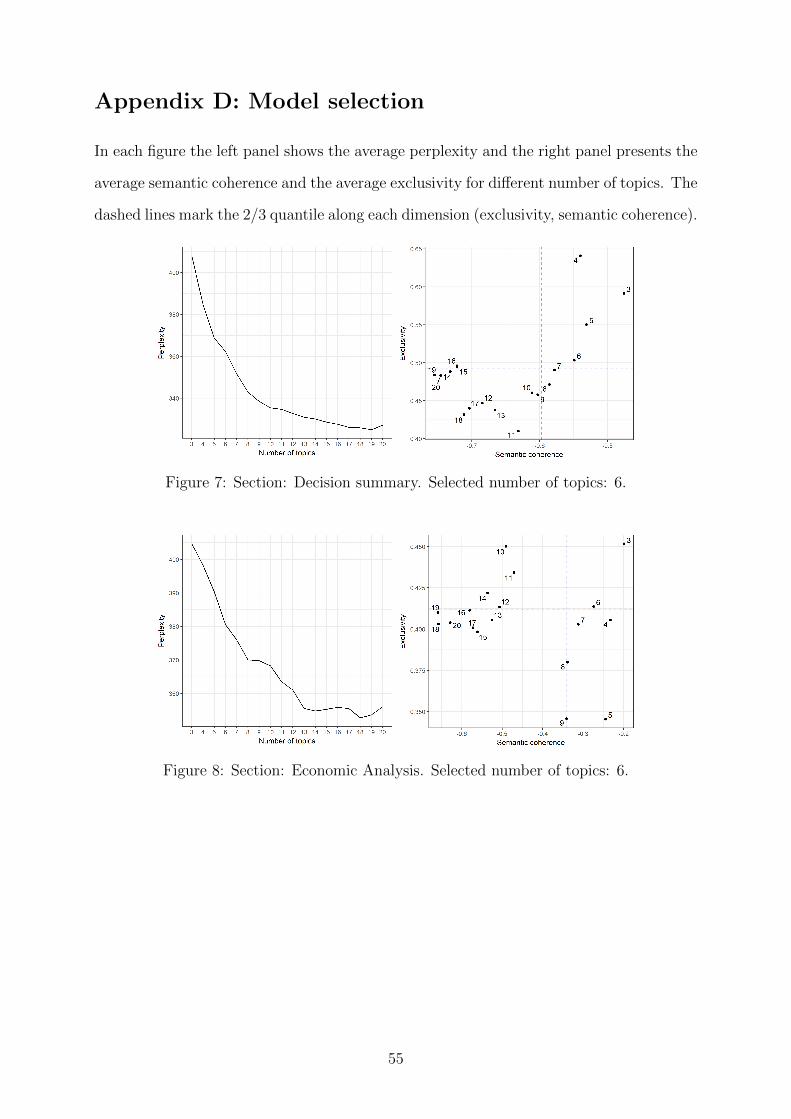
Appendix D: Model selection
In each figure the left panel shows the average perplexity and the right panel presents the
average semantic coherence and the average exclusivity for different number of topics. The
dashed lines mark the 2/3 quantile along each dimension (exclusivity, semantic coherence).
Figure 7: Section: Decision summary. Selected number of topics: 6.
Figure 8: Section: Economic Analysis. Selected number of topics: 6.
55

Figure 9: Section: Monetary analysis. Selected number of topics: 4.
Figure 10: Section: Structural reforms and fiscal policies. Selected number of topics: 6.
Figure 11: Section: Q&A. Selected number of topics: 10.
56

Appendix E: Estimated topics
Figure 12: Topic proportions over time and the ECB interest rate decisions. Section:Decision summary.
Table 7: Terms within topics ranked by the FREX score. Section: Decision summary
Topic 1 Topic 2 Topic 3prerequisite fundamental temporaryeconomic growth second round effect naturejob creation sustainable growth support purchase powerensure sound likelysolidly exceptionally take accountwarrant protracted non standard measureample primary appropriatecontribution employment constructionanchor accordance financial market tensionnominal diminish price developmentTopic 4 Topic 5 Topic 6subdue conduct asset purchasepicture operation sustainedextend fixed rate pathgovernment procedure asset purchase programmeprolong full allotment netweakness maintenance period casedynamic tender monthlygradual long term refinance beyondconfidence mros appimprovement start run
57

Figure 13: Topic proportions over time and the ECB interest rate decisions. Section:Monetary analysis.
Table 8: Terms within topics ranked by the FREX score. Section: Monetary analysis.
Topic 1 Topic 2 Topic 3 Topic 4low level financial market challenge adjustprice turmoil measure loan sale securitisationample intensification full adjustmentexcess liquidity analysis recapitalisation netliquidity affect advantage monetary policy measurehouse complete government growth rate loanmid influence positive recoverymedium tension low changestimulative temporary negative lag relationshipeconomic broad base outside begin
58

Figure 14: Topic proportions over time and the ECB interest rate decisions. Section:Structural reforms and fiscal policies.
Table 9: Terms within topics ranked by the FREX score. Section: Structural reforms and fiscal policies.
Topic 1 Topic 2 Topic 3lisbon revenue strengtheningchallenge eurogroup robustchange price foundationpopulation pro restructuringmember agricultural banking sectorstate inflationary pressure settechnological windfall layreport integration risk managementagenda berlin modelrevise trade bankTopic 4 Topic 5 Topic 6governance deficit boostecb fiscal fullfinancial market product consistentproposal fiscal consolidation implementation structural reformhand year raiseelement commitment compositionsovereign progress decisivelycompetitiveness make reapsemester euro area monetary policy measuressm country area
59

Appendix F: Descriptive statistics
Table 10: Descriptive statistics
Mean Std Min Max∆Vt -0.012 0.066 -0.180 0.249
|sMROt | 0.009 0.045 0.000 0.250DAt 0.077 0.267 0.000 1.000
rDEt -0.003 0.063 -0.204 0.288|sJCt | 14.144 12.367 0.000 64.000IDSt 0.746 0.195 0.378 0.988IEAt 0.789 0.171 0.366 0.984IMAt 0.893 0.132 0.403 0.995
IQAt 0.639 0.135 0.300 0.946
Table 11: Correlation matrix
∆Vt IDSt IEAt IMAt IQAt
∆Vt 1.000IDSt 0.051 1.000IEAt -0.140 0.373 1.000IMAt -0.155 0.357 0.129 1.000
IQAt 0.120 0.065 -0.315 0.147 1.000
60

Appendix G: Robustness check
Table 12: Robustness check: alternative specification of the communication variables.
Dependent variable:
∆Vt
(1) (2)
|sMROt | −0.133 −0.113
[0.265] [0.339]DAt −0.027 −0.019
[0.178] [0.347]rDEt −0.180∗∗ −0.165∗∗
[0.034] [0.048]|sJCt | 0.0003 0.0003
[0.469] [0.530]∆Vt−1 0.016 0.071
[0.886] [0.516]
IDS,1t −0.003 −0.006[0.788] [0.639]
IDS,2t 0.016 0.010[0.257] [0.477]
IEA,1t −0.020 −0.017[0.139] [0.203]
IEA,2t −0.042∗∗∗ −0.033∗∗
[0.004] [0.026]
IMA,1t −0.035∗∗∗ −0.034∗∗∗
[0.007] [0.008]
IMA,2t −0.015 −0.009
[0.281] [0.506]
IQA,1t −0.005 −0.002[0.702] [0.861]
IQA,2t −0.009 −0.005[0.532] [0.690]
DDraghit −0.027∗∗
[0.019]Constant 0.027 0.033∗
[0.144] [0.070]
Observations 156 156Adjusted R2 0.089 0.118
Note: Table reports the regression results where thecommunication variable ISection
t is recoded to a cate-gorical variable with three levels and split to dummyvariables ISection,0
t , ISection,1t , ISection,2
t ; higher cat-egory implies greater homogeneity; p-values are inbrackets.∗p<0.1; ∗∗p<0.05; ∗∗∗p<0.01
61

Table 13: Robustness check: different number of topics.
Dependent variable:
∆Vt
(1) (2)
|sMROt | −0.098 −0.114
[0.402] [0.328]DAt −0.004 −0.008
[0.845] [0.692]rDEt −0.155∗ −0.170∗∗
[0.062] [0.040]|sJCt | 0.0004 0.0003
[0.391] [0.414]∆Vt−1 0.059 0.060
[0.595] [0.581]IDSt 0.024 0.022
[0.471] [0.522]IEAt −0.025 −0.025
[0.439] [0.439]IMAt −0.113∗∗ −0.111∗∗
[0.018] [0.026]
IQAt 0.026 0.021[0.592] [0.563]
IQAt ×DDraghit −0.054∗∗∗ −0.046∗∗
[0.003] [0.011]Constant 0.087 0.086∗
[0.134] [0.083]
Observations 156 156Adjusted R2 0.101 0.100
Note: Column (1) reports the regression results wherethe number of topics is selected first by discardingsolutions below the 2/3 quantile along dimensions:coherence, exclusivity and then selecting the modelthat strictly dominates other models in terms of bothcoherence and exclusivity; Column (2) reports the re-sults where the baseline dimensionality is decreased by1; p-values are in brackets.∗p<0.1; ∗∗p<0.05; ∗∗∗p<0.01
62

References
Acosta, M. (2015). FOMC responses to calls for transparency. Finance and Economic
Discussion Series 2015-060, Board of Governors of the Federal Reserve System.
Airoldi, E. M., & Bischof, J. M. (2016). Improving and evaluating topic models and
other models of text. Journal of the American Statistical Association, 111 (516),
1381–1403.
Aletras, N., & Stevenson, M. (2013). Evaluating topic coherence using distributional
semantics. In Proceedings of the 10th international conference on computational
semantics (IWCS 2013)–long papers (pp. 13–22).
Apel, M., & Grimaldi, M. (2012). The information content of central bank minutes.
Working Paper Series 261, Sveriges Riksbank .
Arora, S., Ge, R., Halpern, Y., Mimno, D., Moitra, A., Sontag, D., . . . Zhu, M. (2013).
A practical algorithm for topic modeling with provable guarantees. In International
conference on machine learning (pp. 280–288).
Asuncion, A., Welling, M., Smyth, P., & Teh, Y. W. (2009). On smoothing and inference
for topic models. In Proceedings of the 25-th conference on uncertainty in artificial
intelligence (pp. 27–34).
Berger, H., De Haan, J., & Sturm, J.-E. (2011). Does money matter in the ecb strategy?
new evidence based on ecb communication. International Journal of Finance &
Economics, 16 (1), 16–31.
Bischof, J., & Airoldi, E. M. (2012). Summarizing topical content with word frequency
and exclusivity. In Proceedings of the 29th international conference on machine
learning (ICML-12) (pp. 201–208).
Blei, D. M. (2012). Probabilistic topic models. Communications of the ACM , 55 (4),
77–84.
Blei, D. M., & Lafferty, J. (2006a). Correlated topic models. Advances in neural infor-
mation processing systems , 18 , 147.
Blei, D. M., & Lafferty, J. D. (2006b). Dynamic topic models. In Proceedings of the 23rd
international conference on machine learning (pp. 113–120).
63
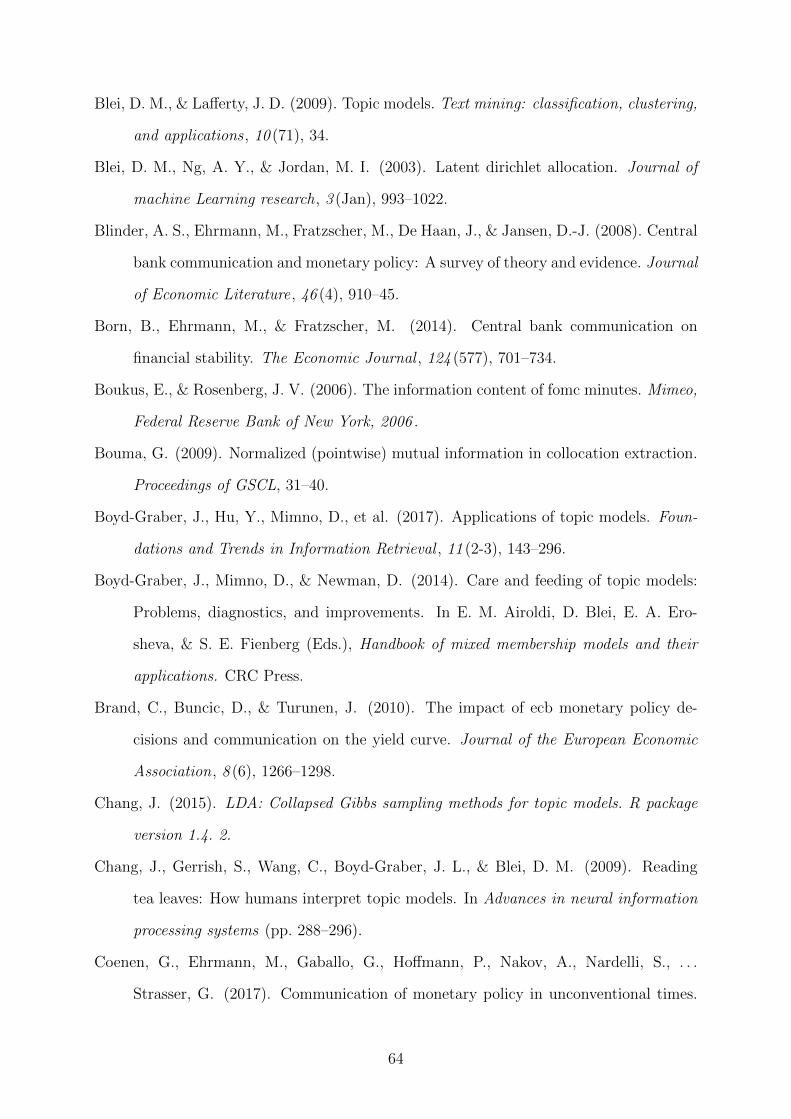
Blei, D. M., & Lafferty, J. D. (2009). Topic models. Text mining: classification, clustering,
and applications , 10 (71), 34.
Blei, D. M., Ng, A. Y., & Jordan, M. I. (2003). Latent dirichlet allocation. Journal of
machine Learning research, 3 (Jan), 993–1022.
Blinder, A. S., Ehrmann, M., Fratzscher, M., De Haan, J., & Jansen, D.-J. (2008). Central
bank communication and monetary policy: A survey of theory and evidence. Journal
of Economic Literature, 46 (4), 910–45.
Born, B., Ehrmann, M., & Fratzscher, M. (2014). Central bank communication on
financial stability. The Economic Journal , 124 (577), 701–734.
Boukus, E., & Rosenberg, J. V. (2006). The information content of fomc minutes. Mimeo,
Federal Reserve Bank of New York, 2006 .
Bouma, G. (2009). Normalized (pointwise) mutual information in collocation extraction.
Proceedings of GSCL, 31–40.
Boyd-Graber, J., Hu, Y., Mimno, D., et al. (2017). Applications of topic models. Foun-
dations and Trends in Information Retrieval , 11 (2-3), 143–296.
Boyd-Graber, J., Mimno, D., & Newman, D. (2014). Care and feeding of topic models:
Problems, diagnostics, and improvements. In E. M. Airoldi, D. Blei, E. A. Ero-
sheva, & S. E. Fienberg (Eds.), Handbook of mixed membership models and their
applications. CRC Press.
Brand, C., Buncic, D., & Turunen, J. (2010). The impact of ecb monetary policy de-
cisions and communication on the yield curve. Journal of the European Economic
Association, 8 (6), 1266–1298.
Chang, J. (2015). LDA: Collapsed Gibbs sampling methods for topic models. R package
version 1.4. 2.
Chang, J., Gerrish, S., Wang, C., Boyd-Graber, J. L., & Blei, D. M. (2009). Reading
tea leaves: How humans interpret topic models. In Advances in neural information
processing systems (pp. 288–296).
Coenen, G., Ehrmann, M., Gaballo, G., Hoffmann, P., Nakov, A., Nardelli, S., . . .
Strasser, G. (2017). Communication of monetary policy in unconventional times.
64

European Central Bank .
Collobert, R., Weston, J., Bottou, L., Karlen, M., Kavukcuoglu, K., & Kuksa, P. (2011).
Natural language processing (almost) from scratch. Journal of Machine Learning
Research, 12 (Aug), 2493–2537.
Constancio, V. (2018). Past and future of the ECB monetary policy.
Retrieved from https://www.ecb.europa.eu/press/key/date/2018/html/ecb
.sp180504.en.html
Denny, M. J., & Spirling, A. (2018). Text preprocessing for unsupervised learning: why
it matters, when it misleads, and what to do about it. Political Analysis , 26 (2),
168–189.
Dewachter, H., Erdemlioglu, D., Gnabo, J.-Y., & Lecourt, C. (2014). The intra-day impact
of communication on euro-dollar volatility and jumps. Journal of International
Money and Finance, 43 , 131–154.
DiMaggio, P., Nag, M., & Blei, D. (2013). Exploiting affinities between topic modeling
and the sociological perspective on culture: Application to newspaper coverage of
us government arts funding. Poetics, 41 (6), 570–606.
Eddelbuettel, D., Francois, R., Allaire, J., Ushey, K., Kou, Q., Russel, N., . . . Bates, D.
(2011). Rcpp: Seamless R and C++ integration. Journal of Statistical Software,
40 (8), 1–18.
Ehrmann, M., & Fratzscher, M. (2005). Equal size, equal role? Interest rate interde-
pendence between the euro area and the United States. The Economic Journal ,
115 (506), 928–948.
Ehrmann, M., & Fratzscher, M. (2009). Explaining Monetary Policy in Press Conferences.
International Journal of Central Banking , 5 (2), 42-84.
European Central Bank. (2003, May). The ECB’s monetary policy strategy [Press re-
lease]. Retrieved from https://www.ecb.europa.eu/press/pr/date/2003/html/
pr030508_2.en.html
European Central Bank. (2009). The current euro area recovery from a historical per-
spective. Monthly Bulletin, February .
65

Fligstein, N., Stuart Brundage, J., & Schultz, M. (2017). Seeing like the fed: Culture, cog-
nition, and framing in the failure to anticipate the financial crisis of 2008. American
Sociological Review , 82 (5), 879–909.
Fratzscher, M., Duca, M. L., & Straub, R. (2016). ECB unconventional monetary policy:
market impact and international spillovers. IMF Economic Review , 64 (1), 36–74.
George, C. P., & Doss, H. (2018). Principled selection of hyperparameters in the latent
dirichlet allocation model. Journal of Machine Learning Research, 18 (162), 1–38.
Griffiths, T. L., & Steyvers, M. (2004). Finding scientific topics. Proceedings of the
National academy of Sciences , 101 (suppl 1), 5228–5235.
Grimaldi, M. (2011). Up for count? Central bank words and financial stress. Sveriges
Riksbank .
Grimmer, J., & Stewart, B. M. (2013). Text as data: The promise and pitfalls of automatic
content analysis methods for political texts. Political analysis, 21 (3), 267–297.
Gurkaynak, R. S., Sack, B., & Swansonc, E. T. (2005). Do actions speak louder than
words? the response of asset prices to monetary policy actions and statements.
International Journal of Central Banking .
Hansen, S., & McMahon, M. (2016). Shocking language: Understanding the macroeco-
nomic effects of central bank communication. Journal of International Economics ,
99 , S114–S133.
Hansen, S., McMahon, M., & Prat, A. (2017). Transparency and deliberation within the
fomc: a computational linguistics approach. The Quarterly Journal of Economics ,
133 (2), 801–870.
Hendry, S., & Madeley, A. (2010). Text mining and the information content of Bank of
Canada communications. Working Paper 10–31, Bank of Canada.
Hornik, K., & Grun, B. (2011). topicmodels: An R package for fitting topic models.
Journal of Statistical Software, 40 (13), 1–30.
Jacobs, B. J., Donkers, B., & Fok, D. (2016). Model-based purchase predictions for large
assortments. Marketing Science, 35 (3), 389–404.
Jansen, D.-J., & De Haan, J. (2005). Talking heads: the effects of ecb statements on
66

the euro–dollar exchange rate. Journal of International Money and Finance, 24 (2),
343–361.
Jansen, D.-J., & De Haan, J. (2007). The Importance of Being Vigilant: Has ECB
Communication Influenced Euro Area Inflation Expectations?
Jasra, A., Holmes, C. C., & Stephens, D. A. (2005). Markov chain Monte Carlo methods
and the label switching problem in Bayesian mixture modeling. Statistical Science,
50–67.
Jegadeesh, N., & Wu, D. (2013). Word power: A new approach for content analysis.
Journal of Financial Economics , 110 (3), 712–729.
Jegadeesh, N., & Wu, D. A. (2017). Deciphering fedspeak: The information content of
FOMC meetings.
Justeson, J. S., & Katz, S. M. (1995). Technical terminology: some linguistic properties
and an algorithm for identification in text. Natural language engineering , 1 (1),
9–27.
Lamla, M. J., & Lein, S. M. (2011). What matters when? The impact of ECB commu-
nication on financial market expectations. Applied Economics , 43 (28), 4289–4309.
Lau, J. H., & Baldwin, T. (2016). The sensitivity of topic coherence evaluation to topic
cardinality. In Proceedings of the 2016 Conference of the North American Chapter
of the Association for Computational Linguistics: Human Language Technologies
(pp. 483–487).
Loughran, T., & McDonald, B. (2011). When is a liability not a liability? textual analysis,
dictionaries, and 10-ks. The Journal of Finance, 66 (1), 35–65.
Lucca, D. O., & Trebbi, F. (2009). Measuring central bank communication: an automated
approach with application to FOMC statements. NBER Working Paper No. 15367 .
McAuliffe, J. D., & Blei, D. M. (2008). Supervised topic models. In Advances in neural
information processing systems (pp. 121–128).
Meade, E. E., Acosta, M., et al. (2015). Hanging on every word: Semantic analysis of
the fomc’s postmeeting statement. FEDS Notes. Washington: Board of Governors
of the Federal Reserve System.
67

Mikolov, T., Chen, K., Corrado, G., & Dean, J. (2013). Efficient estimation of word
representations in vector space. arXiv preprint arXiv:1301.3781 .
Mimno, D., & McCallum, A. D. (2008). Topic models conditioned on arbitrary features
with dirichlet-multinomial regression. In UAI.
Mimno, D., Wallach, H. M., Talley, E., Leenders, M., & McCallum, A. (2011). Optimizing
semantic coherence in topic models. In Proceedings of the conference on empirical
methods in natural language processing (pp. 262–272).
Minka, T. (2000). Estimating a Dirichlet distribution.
Minka, T., & Lafferty, J. (2002). Expectation-propagation for the generative aspect model.
In Proceedings of the eighteenth conference on uncertainty in artificial intelligence
(pp. 352–359).
Moniz, A., & de Jong, F. (2014). Predicting the impact of central bank communications
on financial market investors’ interest rate expectations. In European Semantic Web
Conference (pp. 144–155).
Mueller, H., & Rauh, C. (2017). Reading between the lines: Prediction of political violence
using newspaper text. American Political Science Review , 1–18.
Newman, D., Lau, J. H., Grieser, K., & Baldwin, T. (2010). Automatic evaluation of
topic coherence. In Human Language Technologies: The 2010 Annual Conference of
the North American Chapter of the Association for Computational Linguistics (pp.
100–108).
Picault, M., & Renault, T. (2017). Words are not all created equal: A new measure of
ecb communication. Journal of International Money and Finance, 79 , 136–156.
Porter, M. F. (2001). Snowball: A language for stemming algorithms.
Quinn, K. M., Monroe, B. L., Colaresi, M., Crespin, M. H., & Radev, D. R. (2010).
How to analyze political attention with minimal assumptions and costs. American
Journal of Political Science, 54 (1), 209–228.
Roberts, M. E., Stewart, B. M., & Tingley, D. (2016). Navigating the local modes of big
data. Computational Social Science, 51 .
Roberts, M. E., Stewart, B. M., Tingley, D., Lucas, C., Leder-Luis, J., Gadarian, S. K.,
68

. . . Rand, D. G. (2014). Structural topic models for open-ended survey responses.
American Journal of Political Science, 58 (4), 1064–1082.
Rodriguez, C. E., & Walker, S. G. (2014). Label switching in bayesian mixture mod-
els: Deterministic relabeling strategies. Journal of Computational and Graphical
Statistics , 23 (1), 25–45.
Rosa, C., & Verga, G. (2007). On the consistency and effectiveness of central bank
communication: Evidence from the ecb. European Journal of Political Economy ,
23 (1), 146–175.
Schofield, A., Magnusson, M., & Mimno, D. (2017). Pulling out the stops: Rethinking
stopword removal for topic models. In Proceedings of the 15th Conference of the Eu-
ropean Chapter of the Association for Computational Linguistics: Volume 2, Short
Papers (Vol. 2, pp. 432–436).
Schofield, A., & Mimno, D. (2016). Comparing apples to apple: The effects of stemmers
on topic models. Transactions of the Association for Computational Linguistics , 4 ,
287–300.
Schutze, H., Manning, C. D., & Raghavan, P. (2008). Introduction to information retrieval
(Vol. 39). Cambridge University Press.
Sievert, C., & Shirley, K. (2014). Ldavis: A method for visualizing and interpreting topics.
In Proceedings of the workshop on interactive language learning, visualization, and
interfaces (pp. 63–70).
Stark, J. (2009). Monetary policy before, during and after the financial cri-
sis. Retrieved from https://www.ecb.europa.eu/press/key/date/2009/html/
sp091109.en.html
Stephens, M. (2000). Dealing with label switching in mixture models. Journal of the
Royal Statistical Society: Series B (Statistical Methodology), 62 (4), 795–809.
Taddy, M. (2012). On estimation and selection for topic models. In Artificial intelligence
and statistics (pp. 1184–1193).
Tang, J., Meng, Z., Nguyen, X., Mei, Q., & Zhang, M. (2014). Understanding the
limiting factors of topic modeling via posterior contraction analysis. In International
69
conference on machine learning (pp. 190–198).
Teh, Y. W., Newman, D., & Welling, M. (2007). A collapsed variational Bayesian in-
ference algorithm for latent Dirichlet allocation. In Advances in neural information
processing systems (pp. 1353–1360).
Tetlock, P. C. (2007). Giving content to investor sentiment: The role of media in the
stock market. The Journal of finance, 62 (3), 1139–1168.
Tetlock, P. C., Saar-Tsechansky, M., & Macskassy, S. (2008). More than words: Quan-
tifying language to measure firms’ fundamentals. The Journal of Finance, 63 (3),
1437–1467.
Tirunillai, S., & Tellis, G. J. (2014). Mining marketing meaning from online chatter:
Strategic brand analysis of big data using latent dirichlet allocation. Journal of
Marketing Research, 51 (4), 463–479.
Wallach, H. M. (2006). Topic modeling: beyond bag-of-words. In Proceedings of the 23rd
international conference on machine learning (pp. 977–984).
Wallach, H. M. (2008). Structured topic models for language (Unpublished doctoral
dissertation). University of Cambridge Cambridge, UK.
Wallach, H. M., Mimno, D., & McCallum, A. (2009). Rethinking lda: Why priors matter.
In Advances in neural information processing systems (pp. 1973–1981).
Wallach, H. M., Murray, I., Salakhutdinov, R., & Mimno, D. (2009). Evaluation methods
for topic models. In Proceedings of the 26th annual international conference on
machine learning (pp. 1105–1112).
70