shin-etsu chemical co., ltd. annual report 2017 · customers, optical fiber preform continued to...
TRANSCRIPT

Shin-Etsu Chemical Co., Ltd.
Annual Report 2017 Financial Section
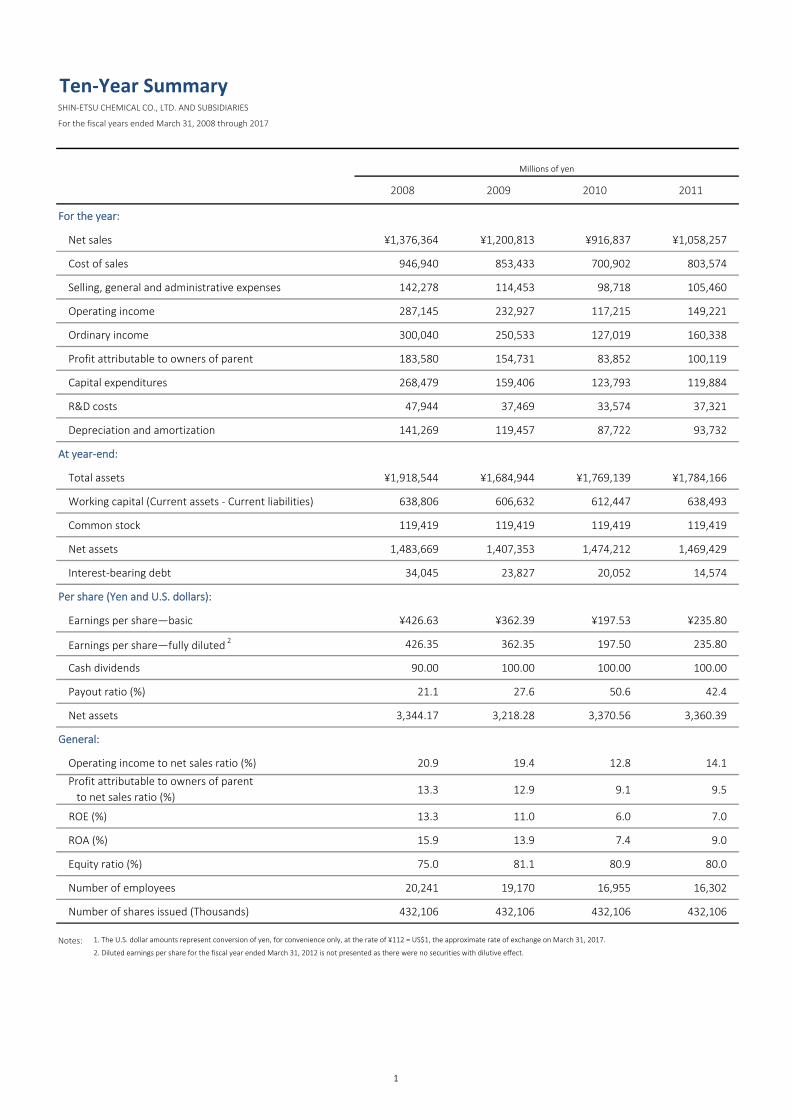
Ten-Year SummarySHIN-ETSU CHEMICAL CO., LTD. AND SUBSIDIARIES
For the fiscal years ended March 31, 2008 through 2017
2008 2009 2010 2011
For the year:
Net sales ¥1,376,364 ¥1,200,813 ¥916,837 ¥1,058,257
Cost of sales 946,940 853,433 700,902 803,574
Selling, general and administrative expenses 142,278 114,453 98,718 105,460
Operating income 287,145 232,927 117,215 149,221
Ordinary income 300,040 250,533 127,019 160,338
Profit attributable to owners of parent 183,580 154,731 83,852 100,119
Capital expenditures 268,479 159,406 123,793 119,884
R&D costs 47,944 37,469 33,574 37,321
Depreciation and amortization 141,269 119,457 87,722 93,732
At year-end:
Total assets ¥1,918,544 ¥1,684,944 ¥1,769,139 ¥1,784,166
Working capital (Current assets - Current liabilities) 638,806 606,632 612,447 638,493
Common stock 119,419 119,419 119,419 119,419
Net assets 1,483,669 1,407,353 1,474,212 1,469,429
Interest-bearing debt 34,045 23,827 20,052 14,574
Per share (Yen and U.S. dollars):
Earnings per share—basic ¥426.63 ¥362.39 ¥197.53 ¥235.80
Earnings per share—fully diluted 2 426.35 362.35 197.50 235.80
Cash dividends 90.00 100.00 100.00 100.00
Payout ratio (%) 21.1 27.6 50.6 42.4
Net assets 3,344.17 3,218.28 3,370.56 3,360.39
General:
Operating income to net sales ratio (%) 20.9 19.4 12.8 14.1
13.3 12.9 9.1 9.5
ROE (%) 13.3 11.0 6.0 7.0
ROA (%) 15.9 13.9 7.4 9.0
Equity ratio (%) 75.0 81.1 80.9 80.0
Number of employees 20,241 19,170 16,955 16,302
Number of shares issued (Thousands) 432,106 432,106 432,106 432,106
Notes: 1. The U.S. dollar amounts represent conversion of yen, for convenience only, at the rate of ¥112 = US$1, the approximate rate of exchange on March 31, 2017.
2. Diluted earnings per share for the fiscal year ended March 31, 2012 is not presented as there were no securities with dilutive effect.
Profit attributable to owners of parent to net sales ratio (%)
Millions of yen
1

Thousands of
U.S. dollars 1
2012 2013 2014 2015 2016 2017 2017
¥1,047,731 ¥1,025,409 ¥1,165,819 ¥1,255,543 ¥1,279,807 ¥1,237,405 $11,048,267
798,592 769,427 873,879 940,399 930,019 868,404 7,753,612
99,505 98,938 118,130 129,814 141,262 130,383 1,164,140
149,632 157,043 173,809 185,329 208,525 238,617 2,130,514
165,237 170,207 180,605 198,025 220,005 242,133 2,161,907
100,643 105,714 113,617 128,606 148,840 175,912 1,570,645
87,165 86,841 83,155 109,903 134,753 145,647 1,300,423
35,725 37,671 43,546 47,165 53,165 49,020 437,680
82,868 80,961 91,445 96,918 100,466 93,087 831,140
¥1,809,841 ¥1,920,903 ¥2,198,912 ¥2,452,306 ¥2,510,085 ¥2,655,636 $23,711,036
694,803 832,878 981,667 1,100,999 1,170,679 1,232,607 11,005,421
119,419 119,419 119,419 119,419 119,419 119,419 1,066,247
1,494,573 1,623,176 1,822,135 2,012,711 2,080,465 2,190,082 19,554,306
15,732 13,929 15,638 14,328 13,470 14,642 130,738
¥237.03 ¥248.94 ¥267.20 ¥302.05 ¥349.46 ¥412.86 $3.686
— 248.92 267.07 301.98 349.42 412.83 3.685
100.00 100.00 100.00 100.00 110.00 120.00 1.071
42.2 40.2 37.4 33.1 31.5 29.1 29.1
3,422.93 3,709.19 4,165.28 4,602.80 4,761.48 5,002.16 44.662
14.3 15.3 14.9 14.8 16.3 19.3 19.3
9.6 10.3 9.7 10.2 11.6 14.2 14.2
7.0 7.0 6.8 6.9 7.5 8.5 8.5
9.2 9.1 8.8 8.5 8.9 9.4 9.4
80.3 82.0 80.6 79.9 80.8 80.3 80.3
16,167 17,712 17,892 18,276 18,407 19,206 19,206
432,106 432,106 432,106 432,106 432,106 432,106 432,106
Millions of yen
2
Management’s Discussion and AnalysisSHIN-ETSU CHEMICAL CO., LTD. AND SUBSIDIARIES
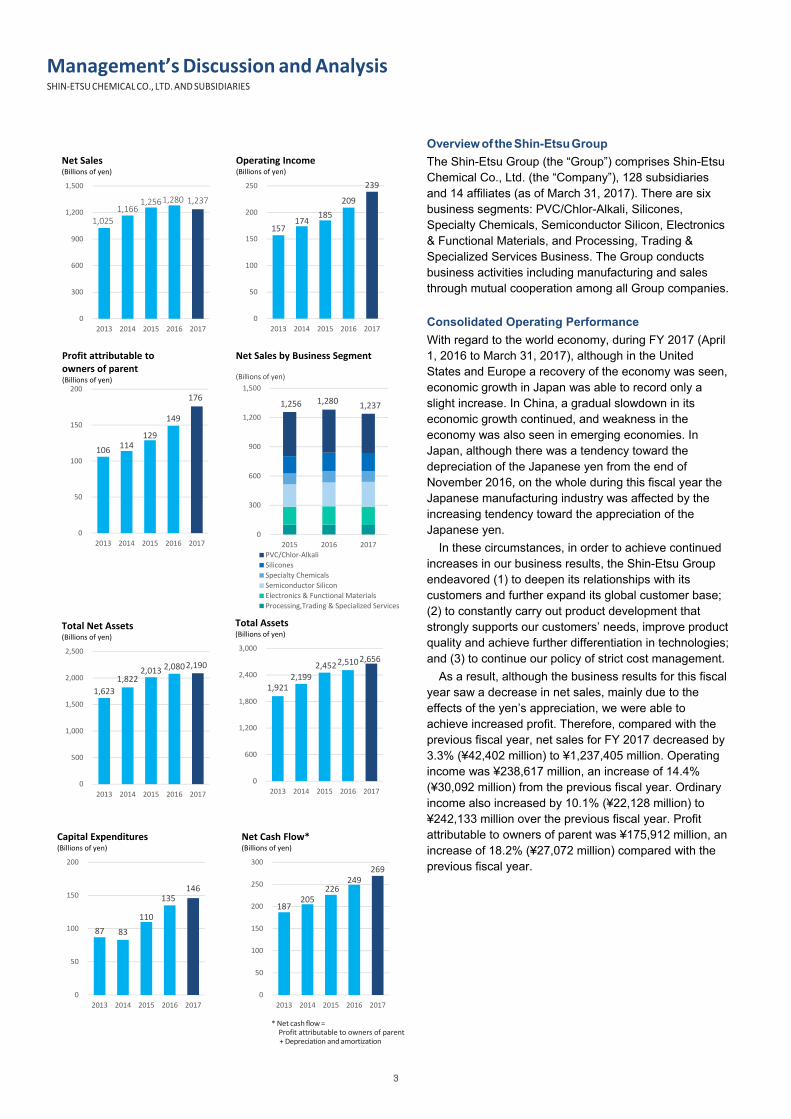
Overview of the Shin-Etsu Group The Shin-Etsu Group (the “Group”) comprises Shin-Etsu Chemical Co., Ltd. (the “Company”), 128 subsidiaries and 14 affiliates (as of March 31, 2017). There are six business segments: PVC/Chlor-Alkali, Silicones, Specialty Chemicals, Semiconductor Silicon, Electronics & Functional Materials, and Processing, Trading & Specialized Services Business. The Group conducts business activities including manufacturing and sales through mutual cooperation among all Group companies. Consolidated Operating Performance With regard to the world economy, during FY 2017 (April 1, 2016 to March 31, 2017), although in the United States and Europe a recovery of the economy was seen, economic growth in Japan was able to record only a slight increase. In China, a gradual slowdown in its economic growth continued, and weakness in the economy was also seen in emerging economies. In Japan, although there was a tendency toward the depreciation of the Japanese yen from the end of November 2016, on the whole during this fiscal year the Japanese manufacturing industry was affected by the increasing tendency toward the appreciation of the Japanese yen.
In these circumstances, in order to achieve continued increases in our business results, the Shin-Etsu Group endeavored (1) to deepen its relationships with its customers and further expand its global customer base; (2) to constantly carry out product development that strongly supports our customers’ needs, improve product quality and achieve further differentiation in technologies; and (3) to continue our policy of strict cost management.
As a result, although the business results for this fiscal year saw a decrease in net sales, mainly due to the effects of the yen’s appreciation, we were able to achieve increased profit. Therefore, compared with the previous fiscal year, net sales for FY 2017 decreased by 3.3% (¥42,402 million) to ¥1,237,405 million. Operating income was ¥238,617 million, an increase of 14.4% (¥30,092 million) from the previous fiscal year. Ordinary income also increased by 10.1% (¥22,128 million) to ¥242,133 million over the previous fiscal year. Profit attributable to owners of parent was ¥175,912 million, an increase of 18.2% (¥27,072 million) compared with the previous fiscal year.
* Net cash flow = Profit attributable to owners of parent
+ Depreciation and amortization
187 205
226 249
269
0
50
100
150
200
250
300
2013 2014 2015 2016 2017
Net Cash Flow*(Billions of yen)
1,025 1,166
1,256 1,280 1,237
0
300
600
900
1,200
1,500
2013 2014 2015 2016 2017
Net Sales(Billions of yen)
157 174 185
209
239
0
50
100
150
200
250
2013 2014 2015 2016 2017
Operating Income(Billions of yen)
106 114 129
149
176
0
50
100
150
200
2013 2014 2015 2016 2017
Profit attributable to owners of parent(Billions of yen)
1,256 1,280 1,237
0
300
600
900
1,200
1,500
2015 2016 2017
Net Sales by Business Segment
(Billions of yen)
PVC/Chlor-AlkaliSiliconesSpecialty ChemicalsSemiconductor SiliconElectronics & Functional MaterialsProcessing,Trading & Specialized Services
1,623 1,822
2,013 2,080 2,190
0
500
1,000
1,500
2,000
2,500
2013 2014 2015 2016 2017
Total Net Assets(Billions of yen)
1,921 2,199
2,452 2,510 2,656
0
600
1,200
1,800
2,400
3,000
2013 2014 2015 2016 2017
Total Assets(Billions of yen)
87 83 110
135 146
0
50
100
150
200
2013 2014 2015 2016 2017
Capital Expenditures(Billions of yen)
3
Business Segment Overview PVC/Chlor-Alkali Business Mainly comprising the manufacture and sales of PVC and caustic soda With regard to our PVC business, because Shintech in the U.S., making good use of its expanded production capacity, realized sales growth that surpassed that of the industry both within and outside of North America, it achieved a double-digit profit increase. Shin-Etsu PVC in Europe continued steady operation, and its shipments continued to be firm. The PVC business in Japan increased its sales volume both within Japan and outside of Japan and improved its profit.
As a result, compared with the previous fiscal year, net sales for this business segment decreased by 6.8% (¥30,101 million) to ¥411,600 million and operating income increased by 19.0% (¥8,496 million) to ¥53,186 million. Silicones Business Mainly comprising the manufacture and sales of silicones With regard to the silicones business, in Japan, shipments of product applications for cosmetics and on-board automobiles continued to do well. Globally, although general-purpose products were affected in the first half of the fiscal year by sluggish market prices, shipments of functional products for the United States, China and Southeast Asia were firm.
As a result, compared with the previous fiscal year, net sales for this business segment decreased by 4.5% (¥8,473 million) to ¥179,275 million and operating income increased by 2.5% (¥1,049 million) to ¥42,549 million.
Specialty Chemicals Business Mainly comprising the manufacture and sales of cellulose derivatives and silicon metals With regard to cellulose derivatives, in Japan, although sales of construction materials products were slow, shipments of pharmaceutical-use products continued to do well. The business of SE Tylose in Europe continued to be steady on the whole for coating products and construction materials products. Shipments were firm in the silicon metal business of Simcoa Operations in Australia, although it was affected by a decline in market prices.
As a result, compared with the previous fiscal year, net sales for this business segment decreased by 7.5% (¥8,791 million) to ¥108,058 million and operating income increased by 22.2% (¥4,043 million) to ¥22,233 million.
Semiconductor Silicon Business Mainly comprising the manufacture and sales of semiconductor silicon With regard to semiconductor silicon, together with applications for memory devices continuing to be firm, shipments of logic devices also did well, supported by demand in a wide range of fields for applications such as for smartphones.
As a result, compared with the previous fiscal year, net sales for this business segment increased by 3.8% (¥9,286 million) to ¥252,612 million and operating income increased by 19.4% (¥9,080 million) to ¥55,991 million. Electronics & Functional Materials Business Mainly comprising the manufacture and sales of rare earth magnets and synthetic quartz products With regard to the rare earth magnets business, although products for hard-disk drives were slow, products for applications in automobiles were firm, including those for hybrid cars. With regard to the photoresist products business, ArF resists and trilayer materials continued to perform steadily and photomask blanks had good shipments. Although the business of materials for LED packaging was affected by production adjustments made by some customers, optical fiber preform continued to have firm shipments.
As a result, compared with the previous fiscal year, net sales for this business segment increased by 0.6% (¥1,173 million) to ¥187,938 million and operating income increased by 7.3% (¥3,756 million) to ¥55,209 million. Processing, Trading & Specialized Services Business*Mainly comprising the Shin-Etsu Polymer Group business and the provision of various services including construction and repairs Shin-Etsu Polymer Co., Ltd.’s business of input devices for automobiles and semiconductor wafer-related containers continued to do well.
As a result, compared with the previous fiscal year, net sales for this business segment decreased by 5.3% (¥5,496 million) to ¥97,919 million and operating income increased by 70.2% (¥3,953 million) to ¥9,584 million.
*The name of this business segment was changed from the previousname of “Diversified Business” to “Processing, Trading & SpecializedServices Business” in FY 2017. This change was made in order tomake clearer the contents of this business segment. There is nochange in the products and services that come under this businesssegment.
4

Analysis of Financial Position Information on Assets, Liabilities and Net Assets At the end of FY 2017, total assets increased by ¥145,551 million compared with that at the end of the previous fiscal year to ¥2,655,636 million. This was mainly due to the increase in cash and time deposits and fixed assets.
Total liabilities increased by ¥35,934 million from that at the end of the previous fiscal year to ¥465,553 million.
Total net assets amounted to ¥2,190,082 million. This was mainly due to the increase in retained earnings, resulting from profit attributable to owners of parent of ¥175,912 million, offset by a decrease in foreign currency translation adjustments due to the appreciation of the yen.
The equity ratio was 80.3%, down 0.5 percentage points from 80.8%, and net assets per share increased by ¥240.68 compared with the previous fiscal year, to ¥5,002.16. Cash Flows The balance of cash and cash equivalents at the end of FY 2017 increased by 50.4% (¥245,701 million) compared with that at the end of the previous fiscal year to ¥733,306 million. Cash Flows from Operating Activities Net cash provided by operating activities amounted to ¥290,872 million, an increase of ¥9,229 million from the previous fiscal year. This was mainly attributable to ¥242,133 million in income before income taxes and non-controlling interests, ¥93,087 million in depreciation and amortization, an increase of ¥23,501 million in accounts receivable-trade and ¥62,895 million for the payment of income taxes. Cash Flows from Investing Activities Net cash provided by investing activities was ¥1,281 million, while net cash used for investing activities was ¥166,599 million in the previous fiscal year. This was mainly attributable to cash inflows of ¥186,381 million in proceeds from redemption of securities and a ¥30,289 million decrease in time deposits, despite cash outflow of ¥134,897 million for purchases of property, plant and equipment as well as ¥74,001 million for purchases of securities. Cash Flows from Financing Activities Net cash used for financing activities decreased by ¥1,742 million from the previous fiscal year to ¥37,199 million. This was mainly due to a cash dividend payment of ¥48,987 million. Capital Expenditures Capital expenditures totaled ¥145,647 million overall for the PVC/Chlor-Alkali Business, Silicones Business, Specialty Chemicals Business, Semiconductor Silicon Business, Electronics & Functional Materials Business and the Processing, Trading & Specialized Services Business.
Capital expenditure in the PVC/Chlor-Alkali Business totaled ¥57,232 million. This was mainly due to PVC processing equipment enhancements at Shintech and the construction of a new ethylene manufacturing plant (currently under construction).
In the Silicones Business, capital expenditures were ¥23,182 million. This was mainly due to the enhancement and rationalization of silicone product manufacturing equipment.
In the Specialty Chemicals Business, capital expenditures were ¥7,806 million.
In the Semiconductor Silicon Business, capital expenditures were ¥14,982 million. This was mainly due to investments to improve the quality of semiconductor silicon wafers at Shin-Etsu Handotai Co., Ltd.
In the Electronics & Functional Materials Business, capital expenditures were ¥38,190 million. This was mainly due to the construction of a new plant for the production of optical fiber preform at Shin-Etsu YOFC (Hubei) Optical Preform Co., Ltd. and the construction of a new plant for the production of photomask blanks at the Shin-Etsu Chemical Takefu plant.
In the Processing, Trading & Specialized Services Business, capital expenditures were ¥4,431 million.
Funds required for these investments were provided mainly using our own capital.
Basic Policy Concerning Profit-sharing Taking a long-term perspective, Shin-Etsu Chemical Co., Ltd. (the “Company”) will focus on expanding company earnings and strengthening the make-up of the Group’s structure as well as on sharing the results of such successful management efforts. It is our basic policy to distribute dividends so as to appropriately reward all of our shareholders. With regard to our financial reserves, we are making efforts to heighten the value of the company by reinvesting them in such core business activities as facility investment, and research and development, and we will proactively utilize them for strengthening Shin-Etsu’s global competitive power and future business development.
In line with our basic profit-sharing policy, the year-end dividend is scheduled to be ¥60 per share, the same amount as the interim dividend of ¥60. Accordingly, the total annual dividend per share for FY 2017 will be an increase of ¥10 over the annual dividend of the previous fiscal year (¥110) to become ¥120 per share.
The forecast for the shareholders’ dividend for FY 2018 has not yet been determined.
Outlook for Fiscal 2018 (Ending March 31, 2018) The world economy contains many uncertain factors and it does not allow for optimism.
Facing such a situation, the Shin-Etsu Group will carefully focus on developments in world markets and aggressively develop our sales activities while accurately capturing trends in demand. At the same time, we will further accelerate the development of our global business by such means as constructing manufacturing bases at optimal locations in the world and strengthening and expanding existing facilities. In addition, we will further focus on enhancing productivity and product quality, and at the same time, we will strive to develop products that have value for customers and we will also strive to assure the stable supply of our products. For this purpose, while continuing to maintain a sound financial base, we will proactively utilize our financial strength to carry out appropriate investments in a timely manner.
On the other hand, among the main products of the Shin-Etsu Group, there are those products that will be greatly affected by such factors as fluctuations in raw materials prices and in market conditions as well as supply and demand conditions.
b.
5

In addition, over 70% of the Group’s sales consist of sales outside of Japan, and exchange rate fluctuations affect our company’s business. Exchange rate fluctuations also affect us when converting Shin-Etsu Chemical’s overseas Group companies’ business results into Japanese yen. When considering these external factors that have the possibility of these kinds of fluctuations, it is difficult at this point in time to make a reasonable business forecast for the coming fiscal year. Therefore, we have decided to refrain from making a forecast for FY 2018’s consolidated operating performance. We will disclose the consolidated business forecast as soon as it becomes possible to do so. Business Risks This section discusses risk factors that could potentially influence such key business matters as the results of the Group’s business operations, financial condition and cash flows. The Group reduces its vulnerability to business risks by taking measures to prevent, disperse or hedge these risks. However, if an unforeseeable situation should occur, it could have a significant impact on the Group’s business results.
This section contains a list of significant items that the Group considers are current risk factors, but it is not intended to be a comprehensive list of all risks that could seriously impact the Group’s business performance. 1) Influence of Economic Trends and Product Markets Changes in the economic situation of countries or regions where the Group’s key products are marketed can have a great impact on the results of the Group’s business operations. In addition, among the Group’s key products, some products could be affected by large price fluctuations due to the global supply and demand environment. The Group is hedging its risks by taking such strategies as diversifying and globalizing its businesses. However, a downturn in demand for certain of its products or escalating price competition could have a significant effect on the Group’s business operations results. 2) Influence of Fluctuations in Foreign Exchange RatesOverseas sales accounted for 72% of the consolidated net sales of the Group in fiscal 2017, and it is expected that this ratio will remain at a high level. The Japanese yen equivalent amounts of items in the financial statement items of overseas consolidated subsidiaries, which are included in the Group’s consolidated financial statements, are influenced by fluctuations in foreign exchange rates.
A large movement in these rates could have a great impact on the business results of the entire Group. In addition, although we use forward-exchange contracts and other measures to reduce risk exposure associated with transactions in foreign currencies, a large movement in foreign exchange rates could have a similar serious effect on the Group’s business operations results. 3) Influence of Natural Disasters and Disastrous
Accidents To minimize the damage that could result from an interruption of production activities, the Group performs
regular disaster-prevention inspections, carries out a constant program of facility maintenance activities at its production facilities and makes facility investments to enhance safety and establish multiple manufacturing bases. However, if a natural disaster or disastrous accident or other unforeseen event damages production facilities or other areas, such circumstances could have a major impact on the Group’s business operations results. 4) Influence of Public Regulations and Laws In countries and regions where the Group is carrying out its business activities, we are bound by the approval processes and licensing requirements involving investment and import/export regulations as well as by various related laws concerning commercial transactions, labor, patents, taxes, foreign exchange and other items. Any changes in these regulations and laws could have a significant effect on the Group’s business operations results. 5) Influence of Supply Factors on Procurement of
Materials The Group uses various raw materials in its production activities, and we strive to assure a stable supply of these materials by diversifying our supply sources. However, if supplies become tight or there are delays in procuring these materials, or if prices increase because of these events, there could be a great effect on the Group’s business operations results. 6) Influence of the Development of New Products and
Technologies The pace of technological progress is rapid in the electronics industry, which is an important market for some of the Group’s products. The Group is constantly working on developing the most advanced cutting-edge materials to meet needs associated with this technological innovation. However, if the Group is unable to take appropriate measures in response to changes in industries and/or markets despite its constant efforts, there could be a significant effect on the Group’s business operations results. 7) Influence of Environmental Issues The Group handles various types of chemical substances and complies strictly with various laws and regulations concerning the environment. In addition, the Group has been making efforts for energy-saving in order to help combat global warming and for eliminating or significantly reducing emissions of substances that are harmful to the environment.However, if regulations concerning the environment become more strict than presently anticipated and require large-scale capital expenditures and other investments as a result, there could be a significant effect on the Group’s business operations results. 8) Influence of Product Liability The Group uses a large number of measures to maintain the optimum quality of its products in accordance with the characteristics of each product. However, a problem involving product quality that occurs due to unforeseen circumstances could have a significant effect on the Group’s business operations results.
6

Consolidated Balance SheetSHIN-ETSU CHEMICAL CO., LTD. AND SUBSIDIARIESAs of March 31, 2016 and 2017
20152016 2017 2017
ASSETSCurrent Assets:
Cash and time deposits (Note 20) ¥597,048 ¥752,675 $6,720,319Notes and accounts receivable-trade 268,905 287,853 2,570,124Securities (Notes 5 and 20) 236,486 186,591 1,665,997Merchandise and finished goods 133,664 126,026 1,125,233Work in process 13,367 12,234 109,232Raw materials and supplies 133,981 128,896 1,150,865Deferred taxes, current (Note 18) 36,330 35,937 320,866Other 47,689 33,941 303,048Less: Allowance for doubtful accounts (Note 2 (5)) (14,840) (14,549) (129,910)
Total current assets 1,452,633 1,549,607 13,835,779
Fixed Assets:Property, Plant and Equipment (Notes 2 (8) and 8):
Buildings and structures, net 170,478 174,923 1,561,816Machinery and equipment, net 410,322 437,775 3,908,706Land 83,108 86,953 776,372
Construction in progress 133,551 139,180 1,242,684Other, net 7,510 7,737 69,089
Total property, plant and equipment 804,972 846,570 7,558,669
Intangible Assets 13,152 10,229 91,337
Investments and Other Assets:Investments in securities (Notes 5 and 7) 130,202 135,311 1,208,142Net defined benefit asset (Note 10) 1,551 1,928 17,221Deferred taxes, non-current (Note 18) 16,458 22,562 201,449Other (Note 7) 92,923 91,265 814,872Less: Allowance for doubtful accounts (Note 2 (5)) (1,807) (1,840) (16,435)
Total investments and other assets 239,327 249,228 2,225,250Total fixed assets 1,057,451 1,106,028 9,875,257Total Assets ¥2,510,085 ¥2,655,636 $23,711,036
The accompanying notes are an integral part of the consolidated financial statements.
Thousands of U.S.dollars (Note 3)Millions of yen
7

20152016 2017 2017
LIABILITIESCurrent Liabilities:
Notes and accounts payable-trade ¥115,557 ¥123,823 $1,105,569Short-term borrowings (Note 9) 7,873 12,788 114,185Accounts payable-other 49,071 54,671 488,140Accrued expenses 56,824 61,611 550,104Accrued income taxes 29,519 32,711 292,065Accrued bonuses for employees 2,627 2,898 25,881Accrued bonuses for directors 547 612 5,470Other (Note 18) 19,933 27,881 248,940
Total current liabilities 281,954 317,000 2,830,357
Long-Term Liabilities:Long-term debt (Note 9) 5,288 1,578 14,092Deferred taxes, non-current (Note 18) 96,183 98,228 877,042Net defined benefit liability (Note 10) 33,319 35,809 319,730Other 12,872 12,936 115,507
Total long-term liabilities 147,665 148,553 1,326,372
Total Liabilities 429,619 465,553 4,156,729Commitment and Contingent Liabilities (Note 11)
NET ASSETSStockholders’ Equity:
Common stock: 119,419 119,419 1,066,247Authorized: 1,720,000,000 sharesIssued: 432,106,693 shares as of March 31, 2016and 2017, respectively
Additional paid-in capital 128,759 129,626 1,157,376Retained earnings (Note 12) 1,731,042 1,857,857 16,588,017Less: Treasury stock, at cost (33,407) (31,213) (278,692)
6,127,692 shares and 5,724,030 shares as of March 31, 2016 and 2017, respectivelyTotal stockholders’ equity 1,945,813 2,075,690 18,532,947
Accumulated Other Comprehensive Income:Unrealized gains (losses) on available-for-sale securities (Note 2 (7)) 13,780 22,887 204,348Deferred gains (losses) on hedges 1,611 862 7,697Foreign currency translation adjustments 68,566 35,154 313,879Remeasurements of defined benefit plans (1,480) (1,761) (15,723)
Total accumulated other comprehensive income 82,478 57,142 510,201
Share Subscription Rights 237 152 1,364Non-controlling Interests in Consolidated Subsidiaries 51,936 57,096 509,793
Total net assets 2,080,465 2,190,082 19,554,306Total Liabilities and Net Assets ¥2,510,085 ¥2,655,636 $23,711,036
Thousands of U.S.dollars (Note 3)Millions of yen
8

Consolidated Statement of IncomeSHIN-ETSU CHEMICAL CO., LTD. AND SUBSIDIARIES
For the fiscal years ended March 31, 2016 and 2017
2016 2017 2017
Net Sales (Note 21) ¥1,279,807 ¥1,237,405 $11,048,267
Cost of Sales (Notes 10 and 16) 930,019 868,404 7,753,612
Gross profit 349,787 369,001 3,294,655
Selling, General and Administrative Expenses (Notes 10, 15 and 16) 141,262 130,383 1,164,140
Operating income (Note 21) 208,525 238,617 2,130,514
Other Income (Expenses):
Interest income 4,011 4,714 42,092
Dividend income 4,506 2,602 23,237
Equity in earnings (losses) of affiliates 3,302 2,788 24,898
Subsidy income 2,837 — —
Interest expenses (452) (529) (4,725)
Loss on disposal of property, plant and equipment (1,329) (974) (8,700)
Foreign exchange gain (loss) (2,760) (3,697) (33,009)
Other, net 1,363 (1,388) (12,400)
Ordinary income 220,005 242,133 2,161,907
Income before income taxes and non-controlling interests 220,005 242,133 2,161,907
Income Taxes (Note 18):
Current 65,342 67,187 599,887
Deferred 4,284 (3,363) (30,032)
Total Income Taxes 69,627 63,823 569,855
Profit 150,377 178,309 1,592,052
Profit attributable to non-controlling interests (1,537) (2,397) (21,406)
Profit attributable to owners of parent ¥148,840 ¥175,912 $1,570,645
U.S. dollars(Note 3)
Profit attributable to owners of parent—basic ¥349.46 ¥412.86 $3.686
Profit attributable to owners of parent—fully diluted 349.42 412.83 3.685
Cash dividends 110.00 120.00 1.071
Weighted-Average Number of Shares Outstanding (Thousands) 425,919 426,086 426,086The accompanying notes are an integral part of the consolidated financial statements.
Earnings per Share (Note 2 (14)):
Thousands of U.S.dollars (Note 3)Millions of yen
Yen
9

Consolidated Statement of Comprehensive IncomeSHIN-ETSU CHEMICAL CO., LTD. AND SUBSIDIARIESFor the fiscal years ended March 31, 2016 and 2017
2016 2017 2017
Profit ¥150,377 ¥178,309 $1,592,052
Other Comprehensive Income (Note 19):
Unrealized gains (losses) on available-for-sale securities (8,589) 9,149 81,688
Deferred gains (losses) on hedges 1,703 (753) (6,726)
Foreign currency translation adjustments (33,370) (34,265) (305,944)
Remeasurements of defined benefit plans 1,905 (280) (2,504)
Share of other comprehensive income (loss) of affiliates accounted for using the equity method (141) (205) (1,837)
Total other comprehensive income (loss) (38,491) (26,356) (235,324)
Comprehensive Income ¥111,885 ¥151,953 $1,356,728
(Breakdown)
Comprehensive income attributable to owners of parent ¥112,017 ¥150,576 $1,344,434
Comprehensive income attributable to non-controlling interests (132) 1,376 12,293The accompanying notes are an integral part of the consolidated financial statements.
Thousands of U.S.dollars (Note 3)Millions of yen
10

Consolidated Statement of Changes in Net AssetsSHIN-ETSU CHEMICAL CO., LTD. AND SUBSIDIARIES
Thousands
Number of sharesof common stock
Commonstock
Additional paid-incapital
Retainedearnings
Treasury stock, at cost Total
Balance at April 1, 2015 432,106 ¥119,419 ¥128,572 ¥1,626,873 ¥(33,837) ¥1,841,029
Cash dividends (Note 12) (44,720) (44,720)
Profit attributable to owners of parent 148,840 148,840
Purchase of treasury stock (16) (16)
Disposal of treasury stock (19) 445 425
Others 206 49 255
Net changes of items other than stockholders’ equity
Balance at March 31, 2016 432,106 ¥119,419 ¥128,759 ¥1,731,042 ¥(33,407) ¥1,945,813
Unrealized gains(losses) on
available-for-salesecurities
Deferred gains(losses) on hedges
Foreign currencytranslation
adjustments
Remeasurements ofdefined benefit plans
TotalShare
subscriptionrights
Non-controllinginterests in
consolidatedsubsidiaries
Totalnet assets
Balance at April 1, 2015 ¥22,349 ¥(91) ¥100,425 ¥(3,382) ¥119,300 ¥139 ¥52,242 ¥2,012,711
Cash dividends (Note 12) (44,720)
Profit attributable to owners of parent 148,840
Purchase of treasury stock (16)
Disposal of treasury stock 425
Others 255
Net changes of items other than stockholders’ equity (8,568) 1,703 (31,858) 1,901 (36,822) 97 (306) (37,030)
Balance at March 31, 2016 ¥13,780 ¥1,611 ¥68,566 ¥(1,480) ¥82,478 ¥237 ¥51,936 ¥2,080,465
Millions of yen
Accumulated Other Comprehensive Income
Millions of yen
Stockholders’ Equity
11

Thousands
Number of sharesof common stock
Commonstock
Additional paid-incapital
Retainedearnings
Treasury stock, at cost Total
Balance at April 1, 2016 432,106 ¥119,419 ¥128,759 ¥1,731,042 ¥(33,407) ¥1,945,813
Cash dividends (Note 12) (48,987) (48,987)
Profit attributable to owners of parent 175,912 175,912
Purchase of treasury stock (19) (19)
Disposal of treasury stock 878 2,213 3,092
Others (11) (109) (121)
Net changes of items other than stockholders’ equity
Balance at March 31, 2017 432,106 ¥119,419 ¥129,626 ¥1,857,857 ¥(31,213) ¥2,075,690
Unrealized gains(losses) on
available-for-salesecurities
Deferred gains(losses) on hedges
Foreign currencytranslation
adjustments
Remeasurements ofdefined benefit plans
TotalShare
subscriptionrights
Non-controllinginterests in
consolidatedsubsidiaries
Totalnet assets
Balance at April 1, 2016 ¥13,780 ¥1,611 ¥68,566 ¥(1,480) ¥82,478 ¥237 ¥51,936 ¥2,080,465
Cash dividends (Note 12) (48,987)
Profit attributable to owners of parent 175,912
Purchase of treasury stock (19)
Disposal of treasury stock 3,092
Others (121)
Net changes of items other than stockholders’ equity 9,106 (749) (33,412) (280) (25,335) (84) 5,160 (20,259)
Balance at March 31, 2017 ¥22,887 ¥862 ¥35,154 ¥(1,761) ¥57,142 ¥152 ¥57,096 ¥2,190,082
Thousands
Number of sharesof common stock
Commonstock
Additional paid-incapital
Retainedearnings
Treasury stock, at cost Total
Balance at April 1, 2016 432,106 $1,066,247 $1,149,634 $15,455,740 $(298,285) $17,373,336
Cash dividends (Note 12) (437,388) (437,388)
Profit attributable to owners of parent 1,570,645 1,570,645
Purchase of treasury stock (174) (174)
Disposal of treasury stock 7,843 19,767 27,610
Others (101) (979) (1,081)
Net changes of items other than stockholders’ equity
Balance at March 31, 2017 432,106 $1,066,247 $1,157,376 $16,588,017 $(278,692) $18,532,947
Unrealized gains(losses) on
available-for-salesecurities
Deferred gains(losses) on hedges
Foreign currencytranslation
adjustments
Remeasurements ofdefined benefit plans
TotalShare
subscriptionrights
Non-controllinginterests in
consolidatedsubsidiaries
Totalnet assets
Balance at April 1, 2016 $123,038 $14,390 $612,204 $(13,221) $736,412 $2,117 $463,720 $18,575,587
Cash dividends (Note 12) (437,388)
Profit attributable to owners of parent 1,570,645
Purchase of treasury stock (174)
Disposal of treasury stock 27,610
Others (1,081)
Net changes of items other than stockholders’ equity 81,310 (6,693) (298,325) (2,502) (226,210) (753) 46,073 (180,891)
Balance at March 31, 2017 $204,348 $7,697 $313,879 $(15,723) $510,201 $1,364 $509,793 $19,554,306
The accompanying notes are an integral part of the consolidated financial statements.
Thousands of U.S. dollars (Note 3)
Accumulated Other Comprehensive Income
Millions of yen
Stockholders’ Equity
Millions of yen
Accumulated Other Comprehensive Income
Thousands of U.S. dollars (Note 3)
Stockholders’ Equity
12

Consolidated Statement of Cash FlowsSHIN-ETSU CHEMICAL CO., LTD. AND SUBSIDIARIESFor the fiscal years ended March 31, 2016 and 2017
20152016 2017 2017
Cash Flows from Operating Activities:Income before income taxes and non-controlling interests ¥220,005 ¥242,133 $2,161,907Adjustments to reconcile income before income taxes to net cash provided by operating activities:
Depreciation and amortization 100,466 93,087 831,140Loss on impairment of fixed assets 3,343 2,028 18,115 Increase (decrease) in net defined benefit liability 2,461 1,384 12,359(Gain) loss on sales of investments in securities (145) (0) (1)(Gain) loss on write-down of investments in securities 40 — — Increase (decrease) in allowance for doubtful accounts 4,128 (165) (1,476)Interest and dividend income (8,517) (7,317) (65,330)Interest expenses 452 529 4,725Exchange (gain) loss 4,451 2,370 21,161Equity in (earnings) losses of affiliates (3,302) (2,788) (24,898)
Changes in assets and liabilities:(Increase) decrease in notes and accounts receivable 20,180 (23,501) (209,834)(Increase) decrease in inventories (8,510) 10,621 94,836(Increase) decrease in long-term advance payment 3,900 3,180 28,395Increase (decrease) in notes and accounts payable (4,610) 9,606 85,775Other, net 12,270 15,351 137,070
Subtotal 346,614 346,522 3,093,947Proceeds from interest and dividends 9,133 7,774 69,412Payments of interest (468) (528) (4,720)Payments of income taxes (73,635) (62,895) (561,564)
Net cash provided by operating activities 281,643 290,872 2,597,075Cash Flows from Investing Activities:
(Increase) decrease in time deposits (79,555) 30,289 270,440Purchases of securities (190,901) (74,001) (660,725)Proceeds from redemption of securities 265,146 186,381 1,664,123Purchases of property, plant and equipment (147,227) (134,897) (1,204,440)Proceeds from sales of property, plant and equipment 271 235 2,099Purchases of intangible fixed assets (818) (1,377) (12,296)Purchases of investments in securities (1,854) (1,613) (14,407)Proceeds from sales of investments in securities 310 53 476Proceeds from redemption of investments in securities 5,000 0 0Purchases of investments in subsidiaries resulting in change in scope of consolidation
(2,516) — —
Payments of loans (2,858) (481) (4,295)Proceeds from collection of loans 698 3,494 31,205Other, net (12,294) (6,802) (60,740)
Net cash used for investing activities (166,599) 1,281 11,438Cash Flows from Financing Activities:
Net increase (decrease) in short-term borrowings 151 520 4,643Proceeds from long-term debt — 25 223Repayments of long-term debt (875) (212) (1,897)Purchases of treasury stock (16) (19) (174)Proceeds from sales of treasury stock 361 2,979 26,606Cash dividends paid (44,720) (48,987) (437,388)Cash dividends paid to non-controlling interests (576) (615) (5,497)Other, net 6,733 9,110 81,344
Net cash used for financing activities (38,941) (37,199) (332,140)Effect of Exchange Rate Changes on Cash and Cash Equivalents (12,513) (13,584) (121,288)Net Increase (Decrease) in Cash and Cash Equivalents 63,589 241,369 2,155,085Cash and Cash Equivalents at Beginning of Year 423,846 487,604 4,353,611
Increase (Decrease) in Cash and Cash Equivalents Resulting from Changes in Scope of Consolidation
167 4,332 38,681
Cash and Cash Equivalents at End of Year (Note 20) ¥487,604 ¥733,306 $6,547,377The accompanying notes are an integral part of the consolidated financial statements.
Thousands of U.S.dollars (Note 3)Millions of yen
13

Notes to Consolidated Financial StatementsSHIN-ETSU CHEMICAL CO., LTD. AND SUBSIDIARIESFor the fiscal years ended March 31, 2016 and 2017
The accompanying consolidated financial statements have been prepared from accounts and records maintained by Shin-Etsu Chemical Co., Ltd. (the “Company”) and its subsidiaries. The Company and its domestic consolidated subsidiaries maintain their accounts and records in accordance with the provisions set forth in the Corporation Law of Japan and the Financial Instruments and Exchange Law and in conformity with generally accepted accounting principles prevailing in Japan. The accounts of overseas consolidated subsidiaries are based on their accounting records maintained in conformity with generally accepted accounting principles prevailing in the respective countries. Before the fiscal year ended March 31, 2008, in general, no adjustments to the accounts of overseas consolidated subsidiaries were reflected in the accompanying consolidated financial statements to present them in compliance with Japanese accounting principles followed by the Company.
Effective from the fiscal year ended March 31, 2009, the “Practical Solution on Unification of Accounting Policies Applied to Foreign Subsidiaries for Consolidated Financial Statements” (Accounting Standards Board of Japan (“ASBJ”) Practical Issues Task Force No. 18, issued on May 17, 2006) has been applied, and accordingly some revisions have been made to the consolidated accounts as necessary.
The accompanying consolidated financial statements of the Company and its subsidiaries are prepared on the basis of accounting principles generally accepted in Japan, which are different in certain respects as to application and disclosure requirements of International Financial Reporting Standards, and are compiled from the consolidated financial statements prepared by the Company, as required by the Financial Instruments and Exchange Law of Japan.
The presentation of the accompanying consolidated financial statements is made in conformity with the Consolidated Financial Statements Regulation (ordinance promulgated by the Ministry of Finance) and meets the requirements for disclosure of financial information of the Company on a consolidated basis. However, certain reclassifications have been made to the consolidated financial statements issued domestically to enable the presentation in a form which is more familiar to readers outside Japan.
The amounts in the accompanying consolidated financial statements are stated in millions of yen. Amounts less than ¥1 million are omitted, except where otherwise indicated.
1. BASIS OF PRESENTING CONSOLIDATED FINANCIAL STATEMENTS
2. SUMMARY OF SIGNIFICANT ACCOUNTING POLICIES(1) Principles of consolidationThe Company had 128 majority-owned subsidiaries as of March 31, 2017 (127 as of March 31, 2016). The consolidated financial statements include the accounts of the Company and 94 (91 for 2016) majority-owned subsidiaries (collectively, the “Companies”), of which the principal firms are listed on page 37 with their respective fiscal year-ends.
The remaining 34 (36 for 2016) unconsolidated subsidiaries, including Shin-Etsu Electronics (Malaysia) Sdn. Bhd., whose total assets, net sales, net income and retained earnings in the aggregate are not material to the consolidated financial statements have been excluded from the scope of consolidation. For consolidation of subsidiaries whose fiscal year-ends are not the same as the Company, necessary adjustments are made for significant intercompany transactions occurring during the periods between the fiscal year-end of respective consolidated subsidiaries and that of the Company.
Unrealized intercompany profits and losses among the Companies are entirely eliminated, and the portion thereof attributable to non-controlling interests is allocated to the non-controlling interests.
Assets and liabilities of consolidated subsidiaries are measured at fair value at the time of acquisition. Goodwill is amortized within 20 years on a straight-line basis.Shin-Etsu Magnetic Materials Vietnam Co., Ltd. and other companies were newly included in the scope of consolidation mainly due to
increased importance.(2) Accounting for investments in unconsolidated subsidiaries and affiliatesThe Company had 34 (36 for 2016) unconsolidated subsidiaries (majority-owned) and 14 (14 for 2016) affiliates (meaning 20% to 50% ownership of a company’s equity interest). The equity method is applied to the investments in 3 (3 for 2016) major affiliates and investments in the remaining unconsolidated subsidiaries, including Shin-Etsu Electronics (Malaysia) Sdn. Bhd., and affiliates, including TATSUNO CHEMICAL INDUSTRIES INC., are stated at cost because they are not material to the consolidated financial statements.
The unconsolidated subsidiaries and affiliates accounted for by the equity method are listed below: Mimasu Semiconductor Industry Co., Ltd.Shin-Etsu Quartz Products Co., Ltd. Admatechs Co., Ltd.
(3) Translation of foreign currency transactionsForeign currency transactions are generally translated into yen at the rates prevailing at the respective transaction dates.
Foreign currency deposits, receivables and payables are translated into yen at the exchange rate prevailing at the respective balance sheet dates and the resulting translation gain or loss is included in the determination of profit for the year.
However, all of the overseas consolidated subsidiaries apply the current rate method to translate transactions and account balances in foreign currencies into their respective home currencies.(4) Translation of foreign currency financial statements (accounts of overseas subsidiaries)The balance sheet accounts of overseas consolidated subsidiaries are translated into yen at current exchange rates prevailing at the end of the fiscal year, except for equity, which is translated at the historical rate. Revenue and expense accounts are translated at the average exchange rates during the year. The resulting translation adjustments are shown as “Foreign currency translation adjustments” in the accompanying balance sheets as of March 31, 2016 and 2017.
14

(5) Allowance for doubtful accountsThe Company and its consolidated subsidiaries provide an allowance for doubtful accounts using the historic percentage of bad debt loss against the balance of general receivables plus an amount deemed necessary to cover individual accounts estimated to be uncollectible.(6) InventoriesInventories are mainly stated at cost determined by the weighted-average method. Balance sheet amounts are written down based on any decline in profitability.(7) Financial instrumentsSecurities:Held-to-maturity debt securities are stated at amortized cost using the straight-line method. Available-for-sale securities for which market quotations are available are stated at fair value. Net unrealized gains or losses on these securities are reported as a separate component of accumulated other comprehensive income at net-of-tax amounts. Other securities for which market quotations are unavailable are stated at cost, determined by the moving-average cost method.Derivatives:Derivatives are stated at fair value, with changes in fair value included in profit or loss in the same period in which they arise, except for derivatives that are designated as “hedging instruments.”
The Company and consolidated subsidiaries enter into foreign exchange contracts, currency swaps, interest rate swaps and commodity swap contracts.Hedge accounting:Gains or losses arising from changes in the fair value of the derivatives designated as “hedging instruments” are deferred as an asset or liability and included in profit or loss in the same period during which the gains and losses on the hedged items or transactions are recognized.
The derivatives designated as hedging instruments by the Company are interest rate swaps, foreign exchange contracts, currency swaps and commodity swap contracts. The related hedged items are interest rate transactions tied to funding activities, forecasted foreign currency transactions and prices of raw materials.
The Company has a policy to utilize the above hedging instruments in order to hedge the risk of fluctuations in interest rates and foreign currencies. Thus, the Company’s purchases of the hedging instruments are limited to, at maximum, the amounts of the underlying hedged items. The Company does not enter into derivative transactions for trading or speculative purposes.
The Company evaluates the effectiveness of its hedging activities by reference to the accumulated gains or losses on the hedging instruments and the corresponding hedged items from the commencement of the hedges.(8) Property, plant and equipmentThe Company and its domestic subsidiaries principally calculate depreciation by the declining-balance method, based on the estimated useful lives of the assets, except for buildings acquired on or after April 1, 2008, and facilities attached to buildings and structures acquired on or after April 1, 2016, which are depreciated by straight-line method. Foreign subsidiaries principally calculate depreciation by the straight-line method over the estimated useful lives of the assets. The cost of property, plant and equipment retired or otherwise disposed of and accumulated depreciation are eliminated from the related accounts, and the resulting gain or loss is reflected in income.(9) Repairs and maintenanceNormal repairs and maintenance, including minor renewals and improvements, are charged to income as incurred.(10) Accrued bonuses for employeesCertain consolidated subsidiaries recognize the estimated amount of employees’ bonuses to be paid in the subsequent period that is attributable to the current fiscal year.(11) Accrued bonuses for directorsThe Company and its consolidated subsidiaries recognize the estimated amount of directors’ bonuses to be paid in the subsequent period that is attributable to the current fiscal year.(12) Accrued retirement benefitsThe Company applies the benefit formula basis to measure the pension obligations. The expected retirement benefit attributed to periods of service under the plan’s benefit formula is deemed as arising in each period.
Actuarial differences are amortized over a five-year period, which is within the average remaining service period of employees, using the straight-line method from the fiscal year when the difference was generated. Prior service cost is amortized as incurred over ten-year period, which is within the average remaining service period of employees using the straight-line method from the time when the prior service cost was generated.
15

(13) Research and development costsResearch and development costs are charged to income as incurred.(14) Income and dividends per shareEarnings per share is based upon the weighted-average number of shares of common stock outstanding during each fiscal year. Earnings per share adjusted for dilution represents earnings per share assuming full conversion of all convertible debentures of the Company outstanding with related reduction in interest expenses.(15) DividendsDividends are proposed by the Board of Directors and approved by the stockholders at meetings held subsequent to the fiscal year to which the dividends are applicable, and registered stockholders as of the end of such fiscal year are entitled to the subsequently declared dividends. Interim cash dividends are also paid (see Note 12).
Dividends charged to retained earnings in the accompanying consolidated statements of changes in net assets represent dividends approved and paid during the year.(16) Consumption taxConsumption tax withheld by the Company and certain subsidiaries on sales of products and services is not included in the amount of net sales in the consolidated statements of income. Consumption tax borne by the Company and certain subsidiaries on purchases of goods and services and on expenses is also not included in the related amounts in the consolidated statements of income.
3. UNITED STATES DOLLAR AMOUNTS
The accompanying consolidated financial statements are prepared in Japanese yen. The U.S. dollar amounts included in the consolidatedfinancial statements and notes thereto represent the arithmetical results of translating yen to dollars on a basis of ¥112 to US$1, the approximate effective rate of exchange on March 31, 2017. The inclusion of such dollar amounts is solely for convenience and is not intended to imply that yen amounts have been or could be readily converted, realized or settled in dollars at ¥112 to US$1 or at any other rate.
4. FINANCIAL INSTRUMENTS(1) Overview of financial instrumentsManagement policyIn principle, fund management is limited to deposits with financial institutions with high credit ratings and risk-free bonds, and financing is obtained primarily through borrowings from banks.Financial instruments, risks and risk managementNotes and accounts receivable-trade are exposed to credit risk of customers. With regard to credit risk related to notes and accounts receivable-trade, each business department not only controls and manages account due dates and balances, but also confirms the credit standing of major customers periodically, making efforts to identify doubtful accounts as early as possible.
Securities and investments in securities are stocks in companies with which the Company has business relationships, held-to-maturity debt securities and also certificates of deposit. Regarding securities and investment securities, the Company regularly determines their fair value and the financial situation of the issuing companies. For stocks, the Company also continually reviews the stock holding status, considering its relationship with the issuing companies.
In order to hedge the foreign currency exchange risk associated with assets and liabilities denominated in foreign currencies and interest rate risk associated with financial assets and liabilities, derivative transactions such as interest rate swap transactions, currency swap transactions and foreign exchange forward contracts are utilized. Also, to hedge price fluctuation risks when procuring raw materials, commodity swap transactions are utilized. All derivative transactions are entered into for the purpose of hedging risks arising in the ordinary course of business, and there are no derivative transactions entered into for trading or speculative purposes.Supplementary explanation on the estimated fair value of financial instrumentsThe fair value of financial instruments is based on their quoted market price, if available. When there is no quoted market price available, fair value is reasonably estimated. Since various assumptions and factors are reflected in estimating the fair value, different assumptions and factors could result in different fair values.
16

(2) Fair value of financial instrumentsAs of March 31, 2016 and 2017, the book value, fair value and the difference between the two are as follows:
Book value Fair value DifferenceAssets:(1) Cash and time deposits ¥597,048 ¥597,048 ¥— (2) Notes and accounts receivable—trade 268,905 268,905 — (3) Securities and investments in securities
i) Held-to-maturity debt securities 9,137 9,163 26ii) Investments in and advances tounconsolidated subsidiaries and affiliates
23,572 14,586 (8,986)
iii) Available-for-sale securities 298,979 298,979 — (4) Long-term loans 7,091 7,034 (57)
Total ¥1,204,735 ¥1,195,717 ¥(9,017)
Liabilities:(1) Notes and accounts payable—trade ¥115,557 ¥115,557 ¥— (2) Short-term borrowings 7,873 7,873 — (3) Accounts payable—other 49,071 49,071 — (4) Accrued expenses 56,824 56,824 — (5) Accrued income taxes 29,519 29,519 — (6) Long-term debt 5,288 5,289 0
Total ¥264,135 ¥264,135 ¥0
Derivative transactions:Hedge accounting not applied ¥3,137 ¥3,137 ¥— Hedge accounting applied 2,325 2,325 — Total ¥5,462 ¥5,462 ¥—
Millions of yen2016
17

Book value Fair value Difference Book value Fair value DifferenceAssets:(1) Cash and time deposits ¥752,675 ¥752,675 ¥— $6,720,319 $6,720,319 $— (2) Notes and accounts receivable—trade 287,853 287,853 — 2,570,124 2,570,124 — (3) Securities and investments in securities
i) Held-to-maturity debt securities 9,263 9,226 (37) 82,713 82,381 (331)ii) Investments in and advances tounconsolidated subsidiaries and affiliates
24,250 24,860 610 216,518 221,968 5,450
iii) Available-for-sale securities 260,071 260,071 — 2,322,066 2,322,066 — (4) Long-term loans 6,422 6,182 (240) 57,346 55,199 (2,147)
Total ¥1,340,537 ¥1,340,870 ¥332 $11,969,089 $11,972,061 $2,972
Liabilities:(1) Notes and accounts payable—trade ¥123,823 ¥123,823 ¥— $1,105,569 $1,105,569 $— (2) Short-term borrowings 12,788 12,788 — 114,185 114,185 — (3) Accounts payable—other 54,671 54,671 — 488,140 488,140 — (4) Accrued expenses 61,611 61,611 — 550,104 550,104 — (5) Accrued income taxes 32,711 32,711 — 292,065 292,065 — (6) Long-term debt 1,578 1,559 (19) 14,092 13,920 (171)
Total ¥287,185 ¥287,166 ¥(19) $2,564,157 $2,563,985 $(171)
Derivative transactions:Hedge accounting not applied ¥(3,941) ¥(3,941) ¥— $(35,193) $(35,193) $— Hedge accounting applied 1,149 1,149 — 10,266 10,266 — Total ¥(2,791) ¥(2,791) ¥— $(24,926) $(24,926) $—
Notes: 1. Method for calculating fair value of financial instruments, and notes regarding securities and derivative transactions
Assets(1) Cash and time deposits and (2) Notes and accounts receivable—trade
These are settled within a short time, and their fair value and book value are nearly equal. Thus, the book value is listed as the fair value in the table above.(3) Securities and investments in securities
(4) Long-term loans
Liabilities(1) Notes and accounts payable—trade, (2) Short-term borrowings, (3) Accounts payable—other, (4) Accrued expenses and (5) Accrued income taxes
These are settled within a short time, and their fair value and book value are nearly equal. Thus, the book value is listed as the fair value in the table above.(6) Long-term debt
The fair value for long-term debt is calculated based on a present value of principal and interest, discounted at the expected rate for new borrowings with the same terms. Derivative transactions
Assets and liabilities arising from derivative transactions are presented in the table above. Total net payables are shown in parenthesis.
2. The following table summarizes financial instruments whose fair value is extremely difficult to estimate.Thousands ofU.S. dollars
Description 2016 2017 2017Non-listed equity securities ¥34,531 ¥27,811 $248,319Investments in securities, etc. 467 506 4,522
Total ¥34,999 ¥28,318 $252,842Quoted market prices are not available for these securities. Since it is extremely difficult to estimate their fair value, the fair value is not disclosed.
Millions of yen
These mainly consist of stocks and held-to-maturity debt securities. The fair value of stocks is based on prices quoted on stock exchanges, while the fair value of held-to-maturity debtsecurities is based on either a price quoted on the exchanges or prices provided by counterparty financial institutions. Negotiable certificates of deposit are settled within a short time, andthe fair value and book value are nearly equal. Thus, the book value is listed as the fair value in the table above.
Millions of yen Thousands of U.S. dollars2017 2017
The fair value of long-term loans is calculated based on a future cash flow discounted at an appropriate rate such as mid-term and long-term interest rates with credit spreads, for all loansgrouped by a certain period of time and credit rating under the Company’s credit exposure management.
18

DescriptionWithin
one yearOver one year
within five yearsOver five years
within ten years Over ten yearsTime deposits ¥596,986 ¥— ¥— ¥—
Notes and accounts receivable-trade 268,905 — — —
Securities and investments in securities 236,486 3,533 5,123 —
Long-term loans — 2,671 572 3,847
Total ¥1,102,378 ¥6,205 ¥5,695 ¥3,847
DescriptionWithin
one yearOver one year
within five yearsOver five years
within ten years Over ten yearsWithin
one yearOver one year
within five yearsOver five years
within ten years Over ten yearsTime deposits ¥752,639 ¥— ¥— ¥— $6,719,996 $— $— $—
Notes and accounts receivable-trade 287,853 — — — 2,570,124 — — —
Securities and investments in securities 186,591 3,560 5,118 — 1,665,997 31,790 45,701 —
Long-term loans — 2,546 160 3,715 — 22,736 1,433 33,176
Total ¥1,227,085 ¥6,107 ¥5,279 ¥3,715 $10,956,119 $54,527 $47,134 $33,176
DescriptionWithin
one yearOver two years
within three yearsOver three yearswithin four years
Over four yearswithin five years Over five years
Short-term borrowings ¥6,510 ¥— ¥— ¥— ¥—
Long-term debt 1,363 24 6 13 31
Lease obligations 135 45 29 9 1
Total ¥8,009 ¥69 ¥36 ¥23 ¥32
DescriptionWithin
one yearOver two years
within three yearsOver three yearswithin four years
Over four yearswithin five years Over five years
Short-term borrowings ¥6,976 ¥— ¥— ¥— ¥—
Long-term debt 5,812 355 5 1,178 31
Lease obligations 110 51 31 11 4
Total ¥12,899 ¥406 ¥37 ¥1,190 ¥36
DescriptionWithin
one yearOver two years
within three yearsOver three yearswithin four years
Over four yearswithin five years Over five years
Short-term borrowings $62,289 $— $— $— $—
Long-term debt 51,895 3,173 53 10,526 282
Lease obligations 989 455 279 99 39
Total $115,174 $3,629 $333 $10,625 $322
3. Repayment schedule of time deposits, notes and accounts receivable-trade, securities and investments in securities, and long-term loans.
4. Repayment schedule of short-term borrowings, long-term debt and lease obligations.
¥73
Over one yearwithin two years
2017
Millions of yen
2016
Millions of yen
Thousands of U.S. dollars
2017
¥5,299
2016
Over one yearwithin two years
¥—
55
598
$653
Millions of yen
2017
$—
2017
Thousands of U.S. dollars
Over one yearwithin two years
¥—
6
66
Millions of yen
5,213
86
19

Securities as of March 31, 2016 and 2017 consisted of the following:(1) Held-to-maturity debt securities
DescriptionBookvalue
Fairvalue Difference
Bookvalue
Fairvalue Difference
Bookvalue
Fairvalue Difference
Securities with fair value that exceeds book value
¥5,860 ¥5,919 ¥59 ¥6,102 ¥6,120 ¥18 $54,482 $54,647 $164
Securities with fair value that does not exceed book value 3,277 3,244 (33) 3,161 3,106 (55) 28,230 27,734 (495)
Total ¥9,137 ¥9,163 ¥26 ¥9,263 ¥9,226 ¥(37) $82,713 $82,381 $(331)
(2) Available-for-sale securities
DescriptionBookvalue
Acquisitioncost Difference
Bookvalue
Acquisitioncost Difference
Bookvalue
Acquisitioncost Difference
Securities with book value that exceed acquisition cost ¥52,853 ¥28,475 ¥24,377 ¥70,421 ¥36,879 ¥33,542 $628,766 $329,279 $299,486
Securities with book value that does not exceed acquisition cost 246,125 248,411 (2,285) 189,649 189,993 (343) 1,693,300 1,696,369 (3,069)
Total ¥298,979 ¥276,887 ¥22,092 ¥260,071 ¥226,872 ¥33,198 $2,322,066 $2,025,649 $296,417
(1) Derivative transactions to which hedge accounting is not applied:
As of March 31, 2016
DescriptionContractamounts
Fairvalue
Unrealizedgain (loss)
Forward foreign exchange contractsSales contracts:
USD ¥107,837 ¥3,117 ¥3,117EUR 1,781 53 53Other 1,640 15 15
Purchase contracts:USD 1,190 (16) (16)Other 3,004 110 110Total ¥115,454 ¥3,280 ¥3,280
As of March 31, 2017
DescriptionContractamounts
Fairvalue
Unrealizedgain (loss)
Contractamounts
Fairvalue
Unrealizedgain (loss)
Forward foreign exchange contractsSales contracts:
USD ¥109,052 ¥(3,727) ¥(3,727) $973,679 $(33,281) $(33,281)EUR 3,101 (32) (32) 27,691 (291) (291)Other 2,342 31 31 20,910 277 277
Purchase contracts:USD 1,303 22 22 11,635 198 198Other 7,083 (234) (234) 63,244 (2,096) (2,096)Total ¥122,882 ¥(3,941) ¥(3,941) $1,097,162 $(35,193) $(35,193)
Note: The fair value is provided by counterparty financial institutions.
Thousands of U.S. dollarsMillions of yen
Millions of yen
Thousands of U.S. dollars2017
Thousands of U.S. dollars2017
Note: Non‐listed equity securities, with a book value of ¥3,800 million and ¥2,018 million ($18,024 thousand), and other investment securities with a book value of ¥467 million and ¥506 million ($4,522thousand), as of March 31, 2016 and 2017, respectively, whose fair value is extremely difficult to estimate are excluded from the above.
1) Currency related:
2016Millions of yen
Millions of yen2016 2017
2017
5. SECURITIES
6. DERIVATIVE TRANSACTIONS
20
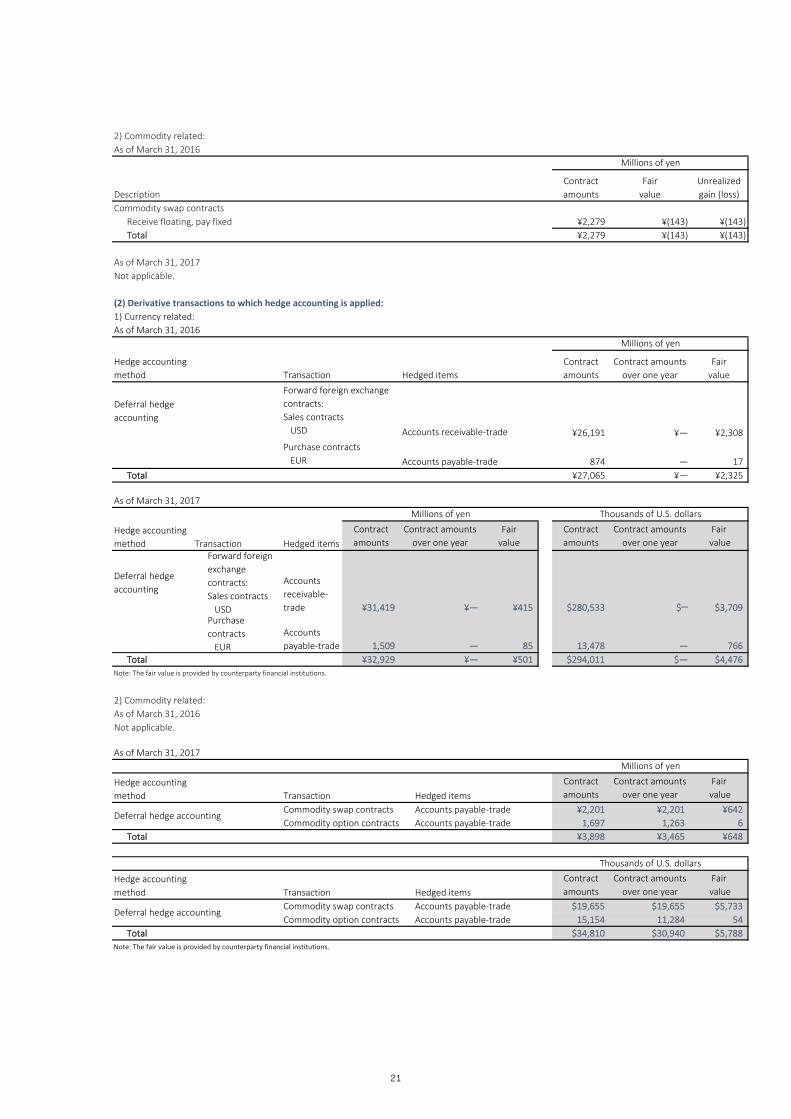
2) Commodity related:As of March 31, 2016
DescriptionContractamounts
Fairvalue
Unrealizedgain (loss)
Commodity swap contractsReceive floating, pay fixed ¥2,279 ¥(143) ¥(143)Total ¥2,279 ¥(143) ¥(143)
As of March 31, 2017Not applicable.
(2) Derivative transactions to which hedge accounting is applied:1) Currency related:As of March 31, 2016
Hedge accountingmethod Transaction Hedged items
Contractamounts
Contract amountsover one year
Fairvalue
Deferral hedgeaccounting
¥26,191 ¥— ¥2,308
Accounts payable-trade 874 — 17Total ¥27,065 ¥— ¥2,325
As of March 31, 2017
Hedge accountingmethod Transaction Hedged items
Contractamounts
Contract amountsover one year
Fairvalue
Contractamounts
Contract amountsover one year
Fair value
Deferral hedgeaccounting
Forward foreignexchangecontracts:Sales contracts USD
Accountsreceivable-trade ¥31,419 ¥— ¥415 $280,533 $— $3,709
Purchasecontracts EUR
Accountspayable-trade 1,509 — 85 13,478 — 766
Total ¥32,929 ¥— ¥501 $294,011 $— $4,476Note: The fair value is provided by counterparty financial institutions.
2) Commodity related:As of March 31, 2016Not applicable.
As of March 31, 2017
Hedge accountingmethod Transaction Hedged items
Contractamounts
Contract amountsover one year
Fair value
Commodity swap contracts Accounts payable-trade ¥2,201 ¥2,201 ¥642Commodity option contracts Accounts payable-trade 1,697 1,263 6
Total ¥3,898 ¥3,465 ¥648
Hedge accountingmethod Transaction Hedged items
Contractamounts
Contract amountsover one year
Fair value
Commodity swap contracts Accounts payable-trade $19,655 $19,655 $5,733Commodity option contracts Accounts payable-trade 15,154 11,284 54
Total $34,810 $30,940 $5,788Note: The fair value is provided by counterparty financial institutions.
Thousands of U.S. dollars
Millions of yen
Deferral hedge accounting
Deferral hedge accounting
Millions of yen
Millions of yen
Millions of yen Thousands of U.S. dollars
Accounts receivable-trade
Forward foreign exchangecontracts:Sales contracts USD
Purchase contracts EUR
21
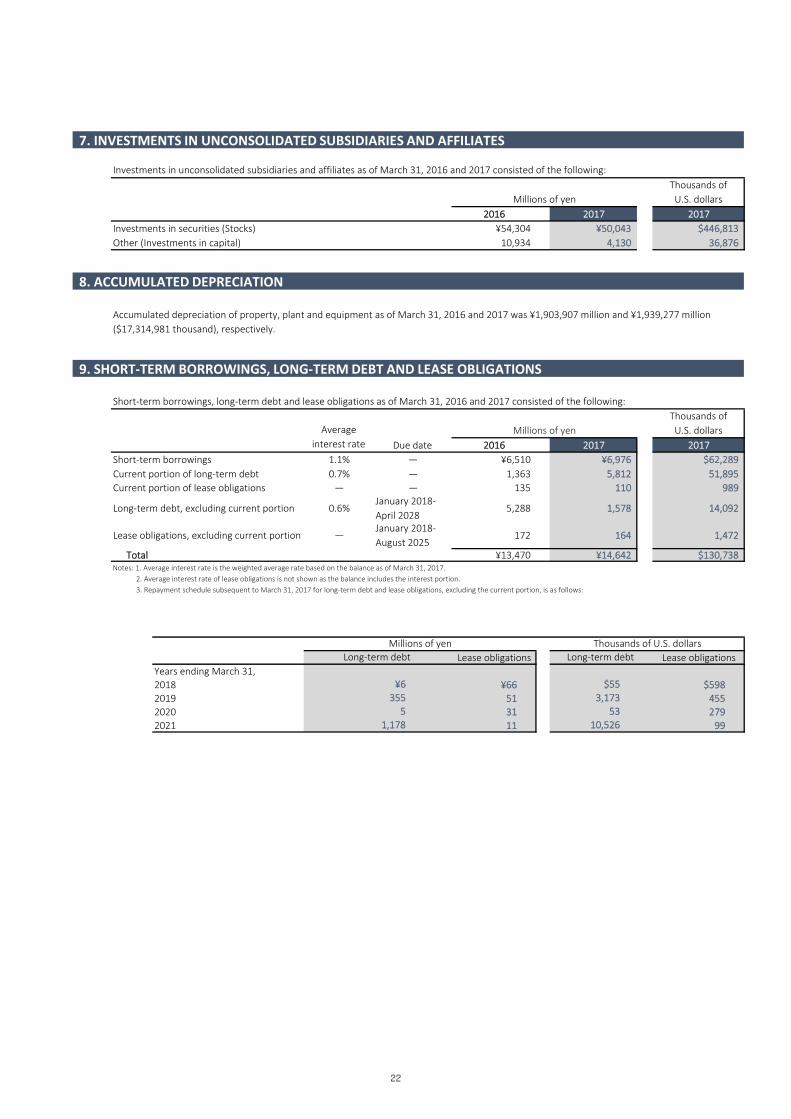
Investments in unconsolidated subsidiaries and affiliates as of March 31, 2016 and 2017 consisted of the following:Thousands ofU.S. dollars
2016 2017 2017Investments in securities (Stocks) ¥54,304 ¥50,043 $446,813Other (Investments in capital) 10,934 4,130 36,876
Thousands ofU.S. dollars
Due date 2016 2017 2017Short-term borrowings 1.1% — ¥6,510 ¥6,976 $62,289Current portion of long-term debt 0.7% — 1,363 5,812 51,895Current portion of lease obligations — — 135 110 989
Long-term debt, excluding current portion 0.6%January 2018-April 2028
5,288 1,578 14,092
Lease obligations, excluding current portion —January 2018-August 2025
172 164 1,472
Total ¥13,470 ¥14,642 $130,738
Lease obligations Lease obligationsYears ending March 31,2018 ¥66 $5982019 51 4552020 31 2792021 11 99
53
Millions of yen
Millions of yenAverageinterest rate
10,526
Accumulated depreciation of property, plant and equipment as of March 31, 2016 and 2017 was ¥1,903,907 million and ¥1,939,277 million($17,314,981 thousand), respectively.
Short-term borrowings, long-term debt and lease obligations as of March 31, 2016 and 2017 consisted of the following:
5
Millions of yen Thousands of U.S. dollarsLong-term debt
1,178
Long-term debt
¥6355
$553,173
Notes: 1. Average interest rate is the weighted average rate based on the balance as of March 31, 2017. 2. Average interest rate of lease obligations is not shown as the balance includes the interest portion. 3. Repayment schedule subsequent to March 31, 2017 for long-term debt and lease obligations, excluding the current portion, is as follows:
7. INVESTMENTS IN UNCONSOLIDATED SUBSIDIARIES AND AFFILIATES
8. ACCUMULATED DEPRECIATION
9. SHORT-TERM BORROWINGS, LONG-TERM DEBT AND LEASE OBLIGATIONS
22

1. Defined Benefit Pension Plans(1) Changes in Benefit Obligations
Thousands ofU.S. dollars
2016 2017 2017Beginning balance of benefit obligations ¥61,807 ¥61,328 $547,577
Service costs 4,116 3,641 32,517Interest costs 1,431 1,271 11,357Actuarial differences arising during the year (2,391) 2,315 20,675Retirement benefits paid (2,527) (2,893) (25,831)Other* (1,107) (1,164) (10,399)
Ending balance of benefit obligations ¥61,328 ¥64,500 $575,895*Mainly foreign currency translation adjustments
(2) Changes in Pension AssetsThousands ofU.S. dollars
2016 2017 2017Beginning balance of pension assets ¥30,446 ¥29,559 $263,927
Expected return on pension assets 1,054 1,224 10,935Actuarial differences arising during the year (1,383) 279 2,495Contributions made by the Company and consolidated subsidiaries 915 1,079 9,642Retirement benefits paid (634) (1,115) (9,958)Other* (838) (409) (3,656)
Ending balance of pension assets ¥29,559 ¥30,619 $273,386*Mainly foreign currency translation adjustments
Thousands ofU.S. dollars
2016 2017 2017Funded benefit obligations ¥54,684 ¥57,408 $512,577Pension assets (29,559) (30,619) (273,386)Net 25,124 26,789 239,191Unfunded benefit obligations 6,644 7,091 63,318Net amount of liability and asset on Consolidated Balance Sheets ¥31,768 ¥33,881 $302,509
Thousands ofU.S. dollars
2016 2017 2017Net defined benefit liability ¥33,319 ¥35,809 $319,730Net defined benefit asset (1,551) (1,928) (17,221)Net amount of liability and asset on Consolidated Balance Sheets ¥31,768 ¥33,881 $302,509
Millions of yen
Millions of yen
The Company and its domestic consolidated subsidiaries have defined contribution pension plans (DC pension plans) and lump-sumseverance payment plans as their defined benefit pension plans.
Certain overseas consolidated subsidiaries have defined benefit pension plans while others have defined contribution pension plans.Additionally, the Company has a “Retirement Benefit Trust”.Information on defined benefit pension plans for the fiscal years ended March 31, 2016 and 2017 is as follows:
(3) Reconciliation of Benefit Obligations and Pension Assets with Net Defined Benefit Liability and Asset on the Consolidated BalanceSheets
Millions of yen
Millions of yen
10. RETIREMENT AND PENSION PLANS
23

(4) Retirement Benefit ExpensesThousands ofU.S. dollars
2016 2017 2017Service costs ¥4,116 ¥3,641 $32,517Interest costs 1,431 1,271 11,357Expected return on pension assets (1,054) (1,224) (10,935)Amortization of actuarial differences 2,020 1,346 12,018Amortization of prior service cost 19 17 155Retirement benefit expenses for defined benefit pension plans ¥6,532 ¥5,052 $45,113
(5) Remeasurements of Defined Benefit Plans (Other Comprehensive Income)Breakdown (before deduction of tax effects)
Thousands ofU.S. dollars
2016 2017 2017Actuarial differences ¥3,029 ¥(693) $(6,190)Prior service cost 19 (5) (48)Total ¥3,048 ¥(698) $(6,238)
(6) Remeasurements of Defined Benefit Plans (Accumulated Other Comprehensive Income)Breakdown (before deduction of tax effects)
Thousands ofU.S. dollars
2016 2017 2017Unrecognized actuarial differences ¥(1,757) ¥(2,451) $(21,884)Unrecognized prior service cost (40) (46) (410)Total ¥(1,798) ¥(2,497) $(22,295)
(7) Pension AssetsBreakdown
2016 2017Bonds 42% 41%Stocks 32% 34%Other 26% 25%Total 100% 100%(Note) 19% and 20% of total pension assets amount were in a “Retirement Benefit Trust” for lump-sum severance payment plans as of March 31, 2016 and 2017, respectively.
(8) Basic Assumptions for Calculating Benefit Obligations
2016 2017Discount rate Mainly 0.2% Mainly 0.2%Expected rate of return on pension assets Mainly 1.5% Mainly 1.5%
2. Defined Contribution Pension PlansContributions to defined contribution pension plans by the Company and its consolidated subsidiaries
Thousands ofU.S. dollars
2016 2017 2017¥2,282 ¥2,191 $19,563
Millions of yen
Millions of yen
Millions of yen
Millions of yen
Rate of expected return on pension assetsThe expected return on pension assets is determined based on the current and estimated future rates of return on various pension assets.
24

ResolutionType ofshares Record date Effective date
Fiscal year ended March 31, 2016Ordinary general meeting of shareholders held on June 26, 2015
Commonstock
March 31,2015
June 29, 2015
Board of directors meeting held on October 27, 2015
Commonstock
September30, 2015
November18, 2015
Total
Millions ofyen Yen
Thousands ofU.S. dollars
U.S.dollars
ResolutionType ofshares Record date Effective date
Totalamount ofdividends
Cashdividendsper share
Totalamount ofdividends
Cashdividendsper share
Fiscal year ended March 31, 2017Ordinary general meeting of shareholders held on June 29, 2016
Commonstock
March 31,2016
June 30, 2016 ¥23,428 ¥55.00 $209,186 $0.49
Board of directors meeting held on October 28, 2016
Commonstock
September30, 2016
November18, 2016
25,558 60.00 228,202 0.54
Total ¥48,987 $437,388
(2) Cash dividends for the fiscal years ended March 31, 2016 and 2017 with an effective date in the subsequent fiscal year are as follows:
ResolutionType ofshares
Source ofdividends Record date Effective date
Fiscal year ended March 31, 2016 Ordinary general meeting of shareholders held on June 29, 2016
Commonstock
Retainedearnings
March 31,2016
June 30, 2016
Millions ofyen Yen
Thousands ofU.S. dollars
U.S.dollars
ResolutionType ofshares
Source ofdividends Record date Effective date
Totalamount ofdividends
Cashdividendsper share
Totalamount ofdividends
Cashdividendsper share
Fiscal year ended March 31, 2017 Ordinary general meeting of shareholders held on June 29, 2017
Commonstock
Retainedearnings
March 31,2017
June 30, 2017 ¥25,582 ¥60.00 $228,419 $0.54
Millions of yen Yen
Total amount ofdividends
Cash dividendsper share
¥23,428 ¥55.00
¥21,294 ¥50.00
23,425 55.00
¥44,720
The Companies were contingently liable as guarantors of housing loans for employees and of loans by unconsolidated subsidiaries,affiliates and others as of March 31, 2016 and 2017 in the aggregate amounts of ¥257 million and ¥191 million ($1,711 thousand),respectively.
(1) Cash dividends from retained earnings represent dividends with an effective date during the fiscal year. Details of cash dividends paidduring the fiscal years ended March 31, 2016 and 2017 are as follows:
Millions of yen Yen
Total amount ofdividends
Cash dividendsper share
11. COMMITMENT AND CONTINGENT LIABILITIES
12. RETAINED EARNINGS
25

Fiscal year ended March 31, 2016
Beginningbalance
Increase DecreaseEndingbalance
Stock options Common stock 102,500 773,000 93,500 782,000— — — — — —
Total
Fiscal year ended March 31, 2017Millions of
yenThousands ofU.S. dollars
Beginningbalance
Increase DecreaseEndingbalance
Balance atMarch 31,
2017
Balance atMarch 31,
2017Stock options Common stock 782,000 — 415,000 367,000 ¥101 $907
— — — — — — 51 456Total ¥152 $1,364
(1) Shin-Etsu Chemical Co., Ltd.
Stock options as of March 31, 2017 were as follows:
Movement in stock options during the fiscal year ended March 31, 2017 was as follows:
2011 2015Beginning balance (Stock options outstanding) 9,000 773,000
Granted — — Exercised — 406,000Forfeited 9,000 —
Ending balance (Stock options outstanding) — 367,000
Exercise price — ¥7,339Weighted average market value per share at the exercise date — 9,272Fair value per share at the grant date — 277
Exercise price — $65.53Weighted average market value per share at the exercise date — 82.79Fair value per share at the grant date — 2.47
Number of shares
Yen
U.S. dollars
Number of stock options granted by category of stock (in shares)
773,000 shares of common stock
Exercise periodSeptember 25, 2016throughMarch 31, 2020
Grant dateVesting conditions None
September 24, 2015
Consolidated subsidiary
2015
Millions of yen
Balance at March 31, 2016
¥221 15¥237
Issuer Description
Type of sharessubject to share
subscriptionrights
Number of sharessubject to share subscription rights
The Company
Grantees 82 employees of the Company
Consolidated subsidiary
There were no stock option expenses recorded for the fiscal year ended March 31, 2017. The stock option expenses for the fiscal year endedMarch 31, 2016 of ¥214 million were included in selling, general and administrative expenses in the consolidated statements of income. Gains onforfeited stock options for the fiscal years ended March 31, 2016 and 2017 were ¥9 million and ¥7 million ($63 thousand), respectively.
Issuer Description
Type of sharessubject to share
subscriptionrights
Number of sharessubject to share subscription rights
The Company
18 directors of the Company
13. SHARE SUBSCRIPTION RIGHTS
14. STOCK OPTIONS
26
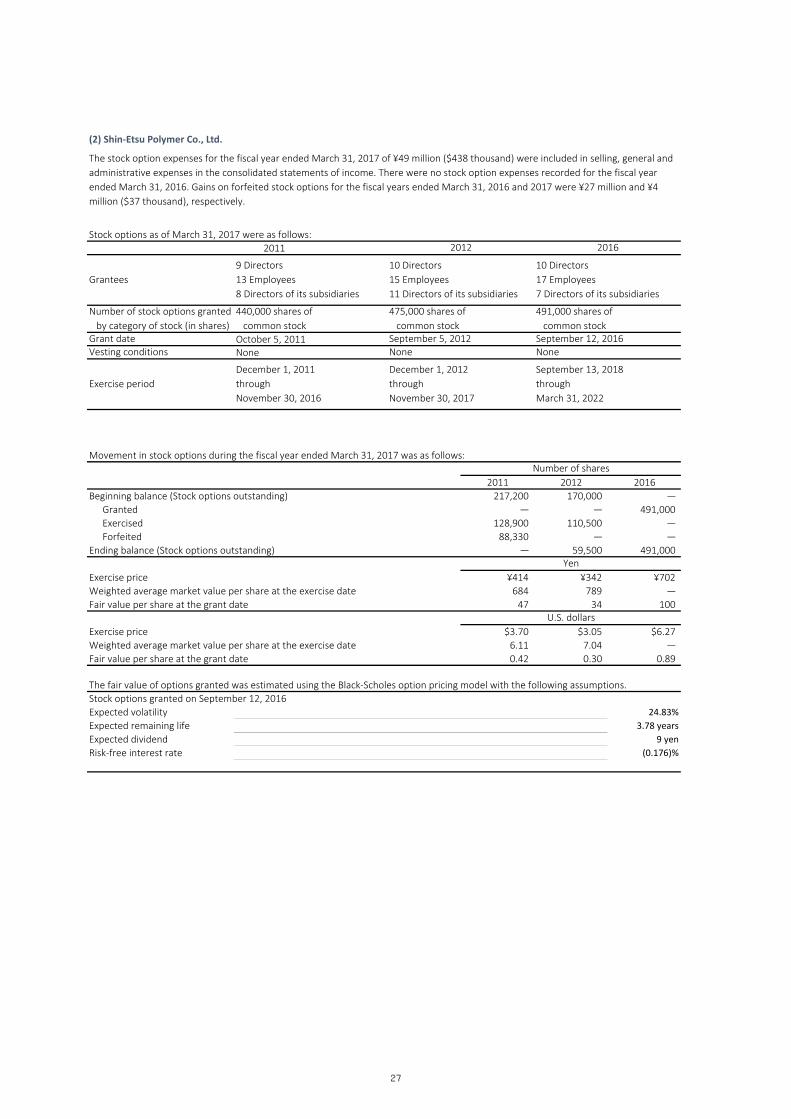
(2) Shin-Etsu Polymer Co., Ltd.
Stock options as of March 31, 2017 were as follows:2011
October 5, 2011None
Movement in stock options during the fiscal year ended March 31, 2017 was as follows:
2011 2012 2016Beginning balance (Stock options outstanding) 217,200 170,000 —
Granted — — 491,000Exercised 128,900 110,500 — Forfeited 88,330 — —
Ending balance (Stock options outstanding) — 59,500 491,000
Exercise price ¥414 ¥342 ¥702Weighted average market value per share at the exercise date 684 789 — Fair value per share at the grant date 47 34 100
Exercise price $3.70 $3.05 $6.27Weighted average market value per share at the exercise date 6.11 7.04 — Fair value per share at the grant date 0.42 0.30 0.89
The fair value of options granted was estimated using the Black-Scholes option pricing model with the following assumptions.Stock options granted on September 12, 2016Expected volatility 24.83%Expected remaining life 3.78 yearsExpected dividend 9 yenRisk-free interest rate (0.176)%
Number of shares
Yen
U.S. dollars
Vesting conditions None None
Exercise periodDecember 1, 2012throughNovember 30, 2017
September 13, 2018throughMarch 31, 2022
December 1, 2011throughNovember 30, 2016
Number of stock options granted by category of stock (in shares)
475,000 shares of common stock
491,000 shares of common stock
Grant date September 5, 2012 September 12, 2016
440,000 shares of common stock
Grantees10 Directors15 Employees11 Directors of its subsidiaries
10 Directors17 Employees7 Directors of its subsidiaries
The stock option expenses for the fiscal year ended March 31, 2017 of ¥49 million ($438 thousand) were included in selling, general andadministrative expenses in the consolidated statements of income. There were no stock option expenses recorded for the fiscal yearended March 31, 2016. Gains on forfeited stock options for the fiscal years ended March 31, 2016 and 2017 were ¥27 million and ¥4million ($37 thousand), respectively.
2012 2016
9 Directors13 Employees8 Directors of its subsidiaries
27
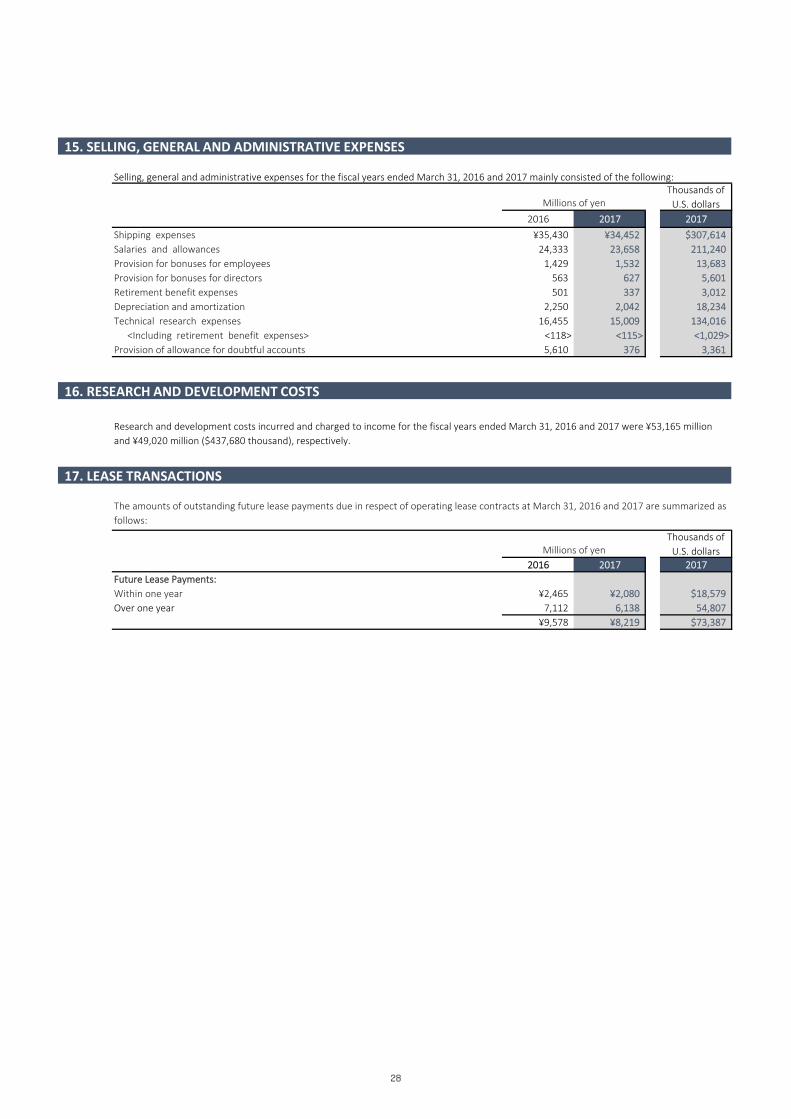
Selling, general and administrative expenses for the fiscal years ended March 31, 2016 and 2017 mainly consisted of the following:Thousands ofU.S. dollars
2016 2017 2017Shipping expenses ¥35,430 ¥34,452 $307,614Salaries and allowances 24,333 23,658 211,240Provision for bonuses for employees 1,429 1,532 13,683Provision for bonuses for directors 563 627 5,601Retirement benefit expenses 501 337 3,012Depreciation and amortization 2,250 2,042 18,234Technical research expenses 16,455 15,009 134,016
<Including retirement benefit expenses> <118> <115> <1,029>Provision of allowance for doubtful accounts 5,610 376 3,361
Thousands ofU.S. dollars
2016 2016 2017 2017Future Lease Payments:Within one year ¥2,465 ¥2,080 $18,579Over one year 7,112 6,138 54,807
¥9,578 ¥8,219 $73,387
Millions of yen
The amounts of outstanding future lease payments due in respect of operating lease contracts at March 31, 2016 and 2017 are summarized asfollows:
Research and development costs incurred and charged to income for the fiscal years ended March 31, 2016 and 2017 were ¥53,165 millionand ¥49,020 million ($437,680 thousand), respectively.
Millions of yen
15. SELLING, GENERAL AND ADMINISTRATIVE EXPENSES
16. RESEARCH AND DEVELOPMENT COSTS
17. LEASE TRANSACTIONS
28

Thousands of U.S.dollars
2016 2017Deferred Tax Assets:
Depreciation and amortization ¥13,959 ¥11,996 $107,113Net defined benefit liability 9,803 11,152 99,576Unrealized profit 6,411 6,441 57,509Maintenance costs 5,473 5,006 44,704Allowance for doubtful accounts 3,695 4,264 38,079Unsettled accounts receivable and payable 2,465 3,989 35,616Accrued bonuses 3,155 3,289 29,372Accrued enterprise taxes 1,721 1,090 9,738Tax loss carryforwards 769 664 5,936Unrealized gains/losses on available-for-sale securities 68 151 1,352Other 23,367 30,132 269,039Valuation allowance (5,117) (5,237) (46,760)Total ¥65,775 ¥72,943 $651,279
Deferred Tax Liabilities:Depreciation and amortization ¥98,049 ¥97,949 $874,552Unrealized gains/losses on available-for-sale securities 6,789 10,245 91,480Reserve for special depreciation 105 70 630Other 7,475 7,117 63,552Total ¥112,420 ¥115,384 $1,030,216
Net deferred tax assets (liabilities) ¥(46,645) ¥(42,440) $(378,936)
Thousands of U.S.dollars
2016 2017Current assets: Deferred taxes, current ¥36,330 ¥35,937 $320,866Fixed assets: Deferred taxes, non-current 16,458 22,562 201,449Current liabilities: Other (3,249) (2,711) (24,210)Long-term liabilities: Deferred taxes, non-current (96,183) (98,228) (877,042)
2016Statutory tax rate 32.8 % 30.7 %Rate difference from foreign subsidiaries (0.5) 0.0Equity in (earnings) losses of affiliates (0.5) (0.4)Dividend and other non-taxable income (2.7) (1.9)Elimination of intercompany dividend income 2.5 1.9Tax deduction for research expenses (1.6) (1.3)Entertainment and other non-deductible expenses 0.2 0.2Adjustment on deferred tax assets due to change in income tax rate 1.3 —
Other, net 0.4 (2.9)Effective tax rate 31.6 26.4
The Company and its domestic subsidiaries are subject to a number of Japanese income taxes, which, in the aggregate, resulted instatutory tax rates of approximately 32.8% and 30.7% for the fiscal years ended March 31, 2016 and 2017, respectively. The tax effects of significant temporary differences and tax loss carry forwards that resulted in deferred tax assets or liabilities at March 31,2016 and 2017 are as follows:
Net deferred tax assets (liabilities) are included in the following accounts:
A reconciliation of the difference between the statutory tax rate and effective rate on taxable income for the fiscal years ended March 31,2016 and 2017 is as follows:
2016 2017
2016 2017Millions of yen
Millions of yen
2016 2017
18. INCOME TAXES
29

Thousands ofU.S. dollars
2016 2016 2017 2017Unrealized gains (losses) on available-for-sale securities
Amount arising during the year ¥(13,166) ¥12,468 $111,329Reclassification adjustment for gains and losses included in profit or loss 45 27 249Unrealized gains (losses) on available-for-sale securities before tax (13,121) 12,496 111,579Tax effect 4,531 (3,347) (29,891)Unrealized gains (losses) on available-for-sale securities (8,589) 9,149 81,688
Deferred gains (losses) on hedgesAmount arising during the year 2,232 1,431 12,782Reclassification adjustment for gains and losses included in profit or loss 246 (2,463) (21,996)Deferred gains (losses) on hedges before tax 2,479 (1,031) (9,213)Tax effect (775) 278 2,486Deferred gains (losses) on hedges 1,703 (753) (6,726)
Foreign currency translation adjustmentsAmount arising during the year (33,370) (34,265) (305,944)
Remeasurements of defined benefit plansAmount arising during the year 1,008 (2,062) (18,412)Reclassification adjustment for gains and losses included in profit or loss 2,039 1,363 12,174Remeasurements of defined benefit plans before tax 3,048 (698) (6,238)Tax effect (1,142) 418 3,734Remeasurements of defined benefit plans 1,905 (280) (2,504)
Amount arising during the year (128) (205) (1,837)Reclassification adjustment for gains and losses included in profit or loss (12) — —
(141) (205) (1,837)
Total other comprehensive income (loss) ¥(38,491) ¥(26,356) $(235,324)
Thousands ofU.S. dollars
2016 2017 2017Cash and time deposits ¥597,048 ¥752,675 $6,720,319Securities 236,486 186,591 1,665,997Time deposits (maturities over three months) (163,943) (135,369) (1,208,656)Securities (maturities over three months) (181,986) (70,591) (630,283)Cash and cash equivalents ¥487,604 ¥733,306 $6,547,377
Millions of yen
Share of other comprehensive income (loss) of affiliates accounted for using the equity method
Reclassification adjustments and tax effects of each component of other comprehensive income for the fiscal years ended March 31, 2016 and2017 are as follows:
Cash and cash equivalents on the consolidated statements of cash flows consist of cash in hand, deposits that can be withdrawn on demandand liquid investments easily convertible into cash that mature within approximately three months from the acquisition date and that haveinsignificant risk exposure in terms of fluctuation in value. Reconciliations between cash and cash equivalents and the related accounts shown in the consolidated balance sheets as of March 31, 2016and 2017 are presented below:
Share of other comprehensive income (loss) of affiliates accounted for using the equity method
Millions of yen
19. OTHER COMPREHENSIVE INCOME
20. SUPPLEMENTAL CASH FLOW INFORMATION
30

1. Segment information (1) Overview of reportable segments
PVC/Chlor-Alkali Business Silicones BusinessSpecialty Chemicals Business Semiconductor Silicon Business
Electronics & Functional Materials Business
Processing, Trading & Specialized Services Business*
(2) Calcula on of income, assets and liabili es of reportable segments
(3) Information on sales, income (loss) and other items of reportable segments
PVC/Chlor-Alkali
SiliconesSpecialty
ChemicalsSemiconductor
Silicon
Electronics &FunctionalMaterials
Processing,Trading &
SpecializedServices
Total Adjustment(1)
Figures inconsolidated
financialstatements
Sales to outside customers ¥441,701 ¥187,748 ¥116,849 ¥243,326 ¥186,765 ¥103,415 ¥1,279,807 ¥— ¥1,279,807
Intersegment sales 3,210 9,264 12,665 3 7,490 72,247 104,882 (104,882) —
Total ¥444,912 ¥197,012 ¥129,515 ¥243,329 ¥194,256 ¥175,662 ¥1,384,689 ¥(104,882) ¥1,279,807Segment income (Operating income)
¥44,690 ¥41,500 ¥18,190 ¥46,911 ¥51,453 ¥5,631 ¥208,377 ¥147 ¥208,525
Depreciation and amortization
¥32,543 ¥11,723 ¥10,148 ¥23,496 ¥16,267 ¥4,516 ¥98,696 ¥(268) ¥98,427
Amortization of goodwill ¥794 ¥177 ¥1,066 ¥— ¥— ¥— ¥2,039 ¥— ¥2,039Increase in property, plant and equipment and intangible assets
¥62,488 ¥20,462 ¥12,382 ¥17,675 ¥16,682 ¥5,505 ¥135,196 ¥(442) ¥134,753
The reportable segments in the Shin-Etsu Group are defined as individual units for which discrete financial information is available and that are subjectto regular review to evaluate their operating results and allocate management resources by the highest decision making body of the Company, such asthe Managing Directors’ Meeting. The Shin-Etsu Group conducts business through each business division and affiliated companies based on specific products and services, consisting ofthe following six segments: “PVC/Chlor-Alkali Business”, “Silicones Business”, “Specialty Chemicals Business”, “Semiconductor Silicon Business”,“Electronics & Functional Materials Business” and “Processing, Trading & Specialized Services Business”. Consequently, these six businesses arespecified as reportable segments. The main products and services of each segment are as follows:
Main products and servicesSegment
Processed plastics, Export of plant equipment, Technology licensing, International trading,Engineering
Polyvinyl chloride, Caustic soda, Methanol, ChloromethaneSiliconesCellulose derivatives, Silicon metal, Polyvinyl alcohol, Synthetic pheromonesSemiconductor silicon
Rare-earth magnets for electronics industry and general applications, Semiconductorencapsulating materials, Packaging materials for LEDs, Photoresists, Photomask blanks,Synthetic quartz products, Liquid fluoroelastomers, Pellicles
Segment income denotes operating income, and the accounting methods applied are identical to those stated in the “Basis of presenting consolidatedfinancial statements”. Internal revenues and transfers arising from transactions among the segments are based on market prices in general. Assets and liabilities are not allocated to business segments.
Millions of yen2016
*The name of this business segment was changed from the previous name of the "Diversified Business" to "Processing, Trading & Specialized ServicesBusiness" in the fiscal year ended March 31, 2017. This change was made in order to make clearer the contents of this business segment. There is nochange in the products and services that come under this business segment.
21. SEGMENT AND RELATED INFORMATION
31

PVC/Chlor-Alkali
SiliconesSpecialty
ChemicalsSemiconductor
Silicon
Electronics &FunctionalMaterials
Processing,Trading &
SpecializedServices
Total Adjustment (1)
Figures inconsolidated
financialstatements
Sales to outside customers ¥411,600 ¥179,275 ¥108,058 ¥252,612 ¥187,938 ¥97,919 ¥1,237,405 ¥— ¥1,237,405Intersegment sales 2,858 6,043 13,940 1 6,554 79,823 109,221 (109,221) —
Total ¥414,458 ¥185,318 ¥121,998 ¥252,614 ¥194,493 ¥177,743 ¥1,346,627 ¥(109,221) ¥1,237,405Segment income (Operating income)
¥53,186 ¥42,549 ¥22,233 ¥55,991 ¥55,209 ¥9,584 ¥238,756 ¥(138) ¥238,617
Depreciation and amortization
¥30,256 ¥11,349 ¥8,903 ¥20,798 ¥17,240 ¥3,956 ¥92,504 ¥(270) ¥92,234
Amortization of goodwill ¥— ¥154 ¥698 ¥— ¥— ¥— ¥853 ¥— ¥853
Increase in property, plant and equipment and intangible assets
¥57,232 ¥23,182 ¥7,806 ¥14,982 ¥38,190 ¥4,431 ¥145,825 ¥(177) ¥145,647
PVC/Chlor-Alkali
SiliconesSpecialty
ChemicalsSemiconductor
Silicon
Electronics &FunctionalMaterials
Processing,Trading &
SpecializedServices
Total Adjustment (1)
Figures inconsolidated
financialstatements
Sales to outside customers $3,675,006 $1,600,670 $964,806 $2,255,471 $1,678,026 $874,285 $11,048,267 $— $11,048,267Intersegment sales 25,519 53,961 124,464 13 58,524 712,708 975,192 (975,192) —
Total $3,700,526 $1,654,631 $1,089,271 $2,255,485 $1,736,550 $1,586,993 $12,023,459 $(975,192) $11,048,267Segment income (Operating income)
$474,878 $379,909 $198,515 $499,928 $492,944 $85,575 $2,131,753 $(1,238) $2,130,514
Depreciation and amortization
$270,143 $101,334 $79,499 $185,696 $153,933 $35,324 $825,931 $(2,411) $823,520
Amortization of goodwill $— $1,383 $6,236 $— $— $— $7,620 $— $7,620
Increase in property, plant and equipment and intangible assets
$511,000 $206,986 $69,701 $133,768 $340,985 $39,568 $1,302,011 $(1,587) $1,300,423
Notes: [1] Elimination of intersegment transactions.
Thousands of U.S. dollars
2017
Millions of yen2017
32
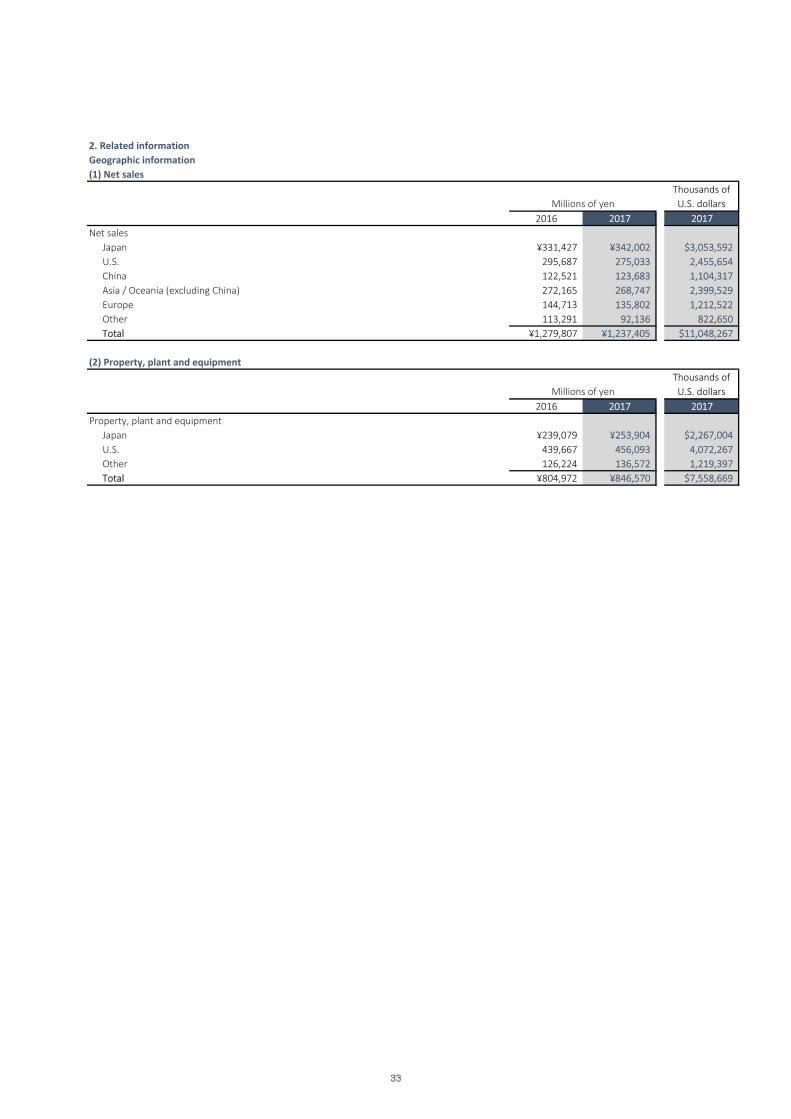
2. Related information Geographic information(1) Net sales
Thousands ofU.S. dollars
2016 2017 2017Net sales
Japan ¥331,427 ¥342,002 $3,053,592U.S. 295,687 275,033 2,455,654China 122,521 123,683 1,104,317Asia / Oceania (excluding China) 272,165 268,747 2,399,529Europe 144,713 135,802 1,212,522Other 113,291 92,136 822,650Total ¥1,279,807 ¥1,237,405 $11,048,267
(2) Property, plant and equipmentThousands ofU.S. dollars
2016 2017 2017Property, plant and equipment
Japan ¥239,079 ¥253,904 $2,267,004U.S. 439,667 456,093 4,072,267Other 126,224 136,572 1,219,397Total ¥804,972 ¥846,570 $7,558,669
Millions of yen
Millions of yen
33

3. Loss on impairment of fixed assets
PVC/Chlor-Alkali
SiliconesSpecialty
ChemicalsSemiconductor
Silicon
Electronics &FunctionalMaterials
Processing,Trading &
SpecializedServices
Elimination orcommon asset
Total
Loss on impairment of fixedassets
¥— ¥— ¥2,298 ¥— ¥— ¥1,045 ¥— ¥3,343
PVC/Chlor-Alkali
SiliconesSpecialty
ChemicalsSemiconductor
Silicon
Electronics &FunctionalMaterials
Processing,Trading &
SpecializedServices
Elimination orcommon asset
Total
Loss on impairment of fixedassets
¥— ¥— ¥1,489 ¥— ¥— ¥539 ¥— ¥2,028
PVC/Chlor-Alkali
SiliconesSpecialty
ChemicalsSemiconductor
Silicon
Electronics &FunctionalMaterials
Processing,Trading &
SpecializedServices
Elimination orcommon asset
Total
Loss on impairment of fixedassets
$— $— $13,301 $— $— $4,813 $— $18,115
4. Amortization of goodwill and unamortized balance
PVC/Chlor-Alkali
SiliconesSpecialty
ChemicalsSemiconductor
Silicon
Electronics &FunctionalMaterials
Processing,Trading &
SpecializedServices
Elimination orcommon asset
Figures inconsolidated
financialstatements
Amortization of goodwill ¥794 ¥177 ¥1,066 ¥— ¥— ¥— ¥— ¥2,039Unamortized balance ¥— ¥1,690 ¥5,360 ¥— ¥— ¥— ¥— ¥7,051
PVC/Chlor-Alkali
SiliconesSpecialty
ChemicalsSemiconductor
Silicon
Electronics &FunctionalMaterials
Processing,Trading &
SpecializedServices
Elimination orcommon asset
Figures inconsolidated
financialstatements
Amortization of goodwill ¥— ¥154 ¥698 ¥— ¥— ¥— ¥— ¥853Unamortized balance ¥— ¥1,502 ¥2,818 ¥— ¥— ¥— ¥— ¥4,321
PVC/Chlor-Alkali
SiliconesSpecialty
ChemicalsSemiconductor
Silicon
Electronics &FunctionalMaterials
Processing,Trading &
SpecializedServices
Elimination orcommon asset
Figures inconsolidated
financialstatements
Amortization of goodwill $— $1,383 $6,236 $— $— $— $— $7,620Unamortized balance $— $13,416 $25,168 $— $— $— $— $38,584
Millions of yen2016
Thousands of U.S. dollars2017
Millions of yen2017
Thousands of U.S. dollars2017
Millions of yen2017
Millions of yen2016
34
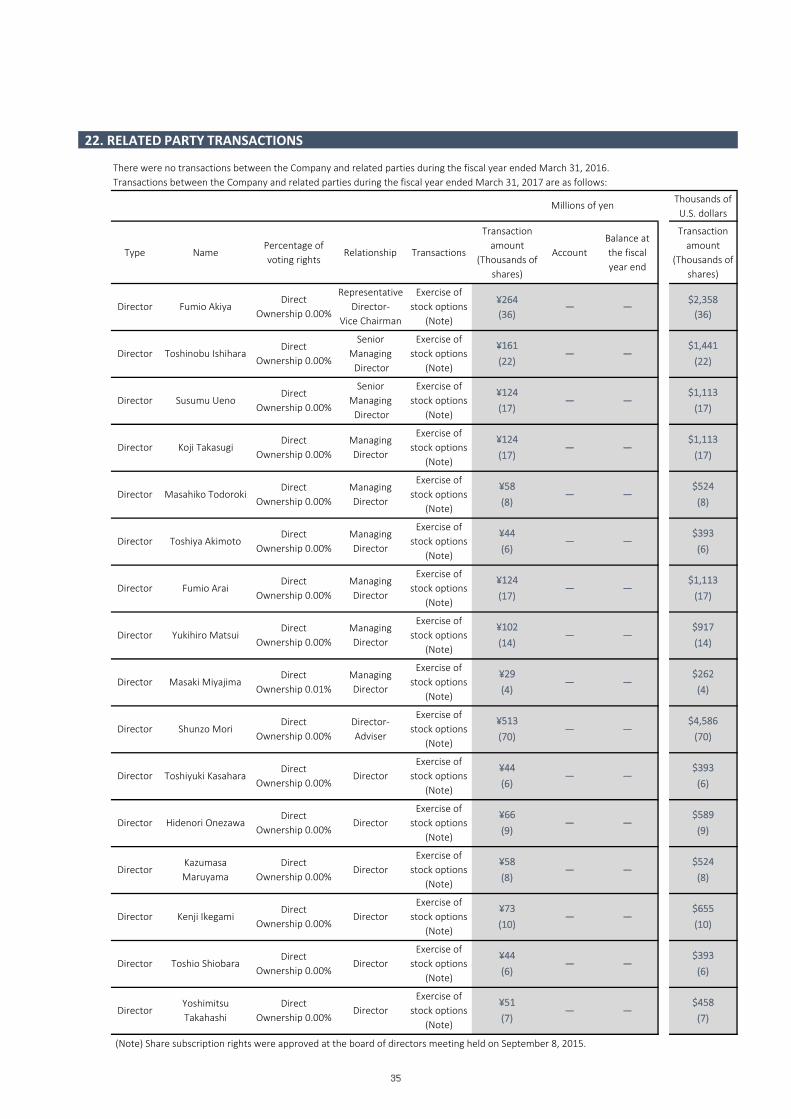
Thousands ofU.S. dollars
Type NamePercentage ofvoting rights
Relationship Transactions
Transactionamount
(Thousands ofshares)
AccountBalance atthe fiscalyear end
Transactionamount
(Thousands ofshares)
¥264 $2,358(36) (36)
¥161 $1,441(22) (22)
¥124 $1,113(17) (17)
¥124 $1,113(17) (17)
¥58 $524(8) (8)
¥44 $393(6) (6)
¥124 $1,113(17) (17)
¥102 $917(14) (14)
¥29 $262(4) (4)
¥513 $4,586(70) (70)
¥44 $393(6) (6)
¥66 $589(9) (9)
¥58 $524(8) (8)
¥73 $655(10) (10)
¥44 $393(6) (6)
¥51 $458(7) (7)
(Note) Share subscription rights were approved at the board of directors meeting held on September 8, 2015.
Director Masaki MiyajimaDirect
Ownership 0.01%ManagingDirector
Exercise ofstock options
(Note)— —
— —
— —
DirectorKazumasaMaruyama
DirectOwnership 0.00%
DirectorExercise of
stock options(Note)
— —
Exercise ofstock options
(Note)— —
Director Hidenori OnezawaDirect
Ownership 0.00%
—
Director Toshio ShiobaraDirect
Ownership 0.00%Director
Exercise ofstock options
(Note)— —
DirectorYoshimitsuTakahashi
DirectOwnership 0.00%
DirectorExercise of
stock options(Note)
Director Kenji IkegamiDirect
Ownership 0.00%Director
Exercise ofstock options
(Note)— —
Director Toshiyuki KasaharaDirect
Ownership 0.00%Director
DirectorExercise of
stock options(Note)
Director Shunzo MoriDirect
Ownership 0.00%Director-Adviser
Exercise ofstock options
(Note)— —
Exercise ofstock options
(Note)
Director Fumio AraiDirect
Ownership 0.00%ManagingDirector
Exercise ofstock options
(Note)— —
Director Yukihiro MatsuiDirect
Ownership 0.00%ManagingDirector
Exercise ofstock options
(Note)
— —
Director Masahiko TodorokiDirect
Ownership 0.00%ManagingDirector
Exercise ofstock options
(Note)— —
— —
SeniorManaging Director
Exercise ofstock options
(Note)Director —Toshinobu Ishihara
DirectOwnership 0.00%
Director Toshiya AkimotoDirect
Ownership 0.00%ManagingDirector
Exercise ofstock options
(Note)— —
—Director Susumu UenoDirect
Ownership 0.00%
SeniorManaging Director
Exercise ofstock options
(Note)—
Director Koji TakasugiDirect
Ownership 0.00%ManagingDirector
There were no transactions between the Company and related parties during the fiscal year ended March 31, 2016.Transactions between the Company and related parties during the fiscal year ended March 31, 2017 are as follows:
Millions of yen
— —Director Fumio AkiyaDirect
Ownership 0.00%
RepresentativeDirector-
Vice Chairman
Exercise ofstock options
(Note)
22. RELATED PARTY TRANSACTIONS
35

Application of Revised Implementation Guidance on Recoverability of Deferred Tax AssetsEffective the first quarter of the fiscal year ended March 31, 2017, the “Revised Implementation Guidance on Recoverability of Deferred Tax Assets” (ASBJ Guidance No. 26, issued March 28, 2016) was adopted.
24. SUPPLEMENTARY INFORMATION
Application of Practical Solution on a Change in Depreciation Method due to Tax Reform 2016Effective the first quarter of the fiscal year ended March 31, 2017, the “Practical Solution on a change in depreciation method due to Tax Reform 2016” (ASBJ PITF No. 32, issued June 17, 2016) was adopted, in accordance with the revision of the Corporation Tax Law of Japan. As a result, the depreciation method for facilities attached to buildings and for structures acquired on or after April 1, 2016 was changed from the declining-balance method to the straight-line method.
The impact of this change on operating income, ordinary income, and income before income taxes and non-controlling interests for the fiscal year ended March 31, 2017 was immaterial.
23. CHANGES IN ACCOUNTING POLICIES
The amounts in the accompanying consolidated financial statements and the notes thereto, including the amounts for prior fiscal years, are stated in millions of yen with amounts less than ¥1 million omitted.
36

Principal Consolidated SubsidiariesPercentage ofVoting Rights
FiscalYear-End Principal Consolidated Subsidiaries
Percentage ofVoting Rights
FiscalYear-End
Shintech Inc.* 100.0 December 31 Naoetsu Precision Co., Ltd. 100.0 February 28
Shin-Etsu Handotai Co., Ltd. 100.0 March 31 Skyward Information System Co., Ltd. 100.0 March 31
S.E.H. Malaysia Sdn. Bhd.* 100.0 December 31 Shinano Electric Refining Co., Ltd. 100.0 March 31
Shin-Etsu Handotai America, Inc.* 100.0 December 31Fukui Environmental Analysis Center Co., Ltd.
100.0 February 28
Shin-Etsu PVC B.V.* 100.0 December 31 Shin-Etsu Film Co., Ltd. 100.0 March 31
Shin-Etsu Polymer Co., Ltd. 52.5 March 31 Shin-Etsu Technology Service Co., Ltd. 76.9 February 28
SE Tylose GmbH & Co. KG* 100.0 December 31 Urawa Polymer Co., Ltd. 100.0 March 31
Shin-Etsu Astech Co., Ltd. 99.6 March 31 Niigata Polymer Company Limited 100.0 March 31
Shin-Etsu Engineering Co., Ltd. 100.0 March 31 Shin-Etsu Polymer America, Inc.* 100.0 December 31
Shin-Etsu Handotai Taiwan Co., Ltd.* 70.0 December 31 Naoetsu Sangyo Limited 100.0 March 31
Simcoa Operations Pty. Ltd.* 100.0 December 31 San-Ace Co., Ltd. 100.0 March 31
Shin-Etsu Silicones (Thailand) Ltd.* 100.0 December 31 Shinken Total Plant Co., Ltd. 100.0 February 28
Asia Silicones Monomer Limited* 100.0 December 31 Saitama Shinkoh Mold Co., Ltd. 100.0 March 31
Nagano Electronics Industrial Co., Ltd. 90.0 February 28 Shinkoh Mold Co., Ltd. 100.0 March 31
Naoetsu Electronics Co., Ltd. 100.0 February 28 Shin-Etsu Magnet Co., Ltd. 100.0 March 31
Shin-Etsu Handotai Europe, Ltd.* 100.0 December 31 Shin-Etsu Polymer India Pvt. Ltd.* 100.0 December 31
S-E, Inc.* 100.0 December 31 PT. Shin-Etsu Polymer Indonesia* 100.0 December 31
Shin-Etsu Electronics Materials Singapore Pte. Ltd.*
100.0 December 31 Shin-Etsu Polymer Singapore Pte. Ltd.* 100.0 December 31
Shin-Etsu Silicone International Trading (Shanghai) Co., Ltd.*
100.0 December 31 Shin-Etsu Polymer Shanghai Co., Ltd.* 100.0 December 31
Shin-Etsu Finetech Co., Ltd. 100.0 March 31 Shin-Etsu Polymer Hong Kong Co., Ltd.* 100.0 December 31
Shin-Etsu Magnetics Philippines., Inc.* 100.0 December 31 Shin-Etsu Polymer Hungary Kft.* 100.0 December 31
JAPAN VAM & POVAL Co., Ltd. 100.0 March 31 Shin-Etsu Polymer (Thailand) Ltd.* 100.0 December 31
CIRES, Lda.* 100.0 December 31 Dongguan Shin-Etsu Polymer Co., Ltd.* 100.0 December 31
Shin-Etsu Singapore Pte. Ltd.* 100.0 December 31 Human Create Co., Ltd. 100.0 March 31
Shin-Etsu Silicone Korea Co., Ltd.* 100.0 December 31 Suzhou Shin-Etsu Polymer Co., Ltd.* 100.0 December 31
Shinano Polymer Co., Ltd. 100.0 March 31 S.E.H. (Shah Alam) Sdn. Bhd.* 100.0 December 31
Shin-Etsu (Malaysia) Sdn. Bhd.* 100.0 December 31SHIN-ETSU HANDOTAI SINGAPORE PTE. LTD.*
100.0 December 31
Nissin Chemical Industry Co., Ltd. 100.0 February 28 SE Tylose USA, Inc.* 100.0 December 31
Shin-Etsu MicroSi, Inc.* 100.0 December 31 K-Bin, Inc.* 100.0 December 31
Shin-Etsu Silicone Taiwan Co., Ltd.* 93.3 December 31 Shin-Etsu Silicone (Nantong) Co., Ltd.* 100.0 December 31
Shin-Etsu Silicones of America, Inc.* 100.0 December 31Shin-Etsu (Jiangsu) Optical Preform Co., Ltd.*
75.0 December 31
Shin-Etsu Silicones Europe B.V.* 100.0 December 31 Kashima Chlorine & Alkali Co., Ltd. 79.0 March 31
Shin-Etsu Opto Electronic Co., Ltd.* 80.0 December 31 Kashima Vinyl Chloride Monomer Co., Ltd. 70.6 March 31
Shin-Etsu Polymer (Malaysia) Sdn. Bhd.* 100.0 December 31Shin-Etsu Magnetic Materials Vietnam Co., Ltd.*
100.0 December 31
Shin-Etsu Polymer Europe B.V.* 100.0 December 31Shin-Etsu Electronics Materials Taiwan Co., Ltd.*
100.0 December 31
Shin-Etsu International Europe B.V.* 100.0 December 31 Shin-Etsu YOFC (Hubei) Optical Preform Co., Ltd.*
51.0 December 31
Nihon Resin Co., Ltd. 100.0 December 31
*Overseas subsidiary 21 other consolidated subsidiaries
Consolidated SubsidiariesSHIN-ETSU CHEMICAL CO., LTD. AND SUBSIDIARIES
37

38