shining cities (pdf)
TRANSCRIPT

Shining CitiesHarnessing the Benefits of Solar Energy in America

Written by:
Judee Burr and Lindsey Hallock, Frontier Group
Rob Sargent, Environment America Research & Policy Center
Shining CitiesHarnessing the Benefits of Solar Energy in America
Spring 2015

Environment America Research & Policy Center is a 501(c)(3) organization. We are dedicated to protecting America’s air, water and open spaces. We investigate prob-lems, craft solutions, educate the public and decision makers, and help Americans make their voices heard in local, state and national debates over the quality of our
environment and our lives. For more information about Environment America Research & Policy Center or for additional copies of this report, please visit www.environmentamericacenter.org.
AcknowledgmentsEnvironment America Research & Policy Center sincerely thanks Chad Laurent, Meister Consultants Group, Inc.; Anya Schoolman, Community Power Network; Pierre Bull, Natural Resources Defense Coun-cil; Andrea Luecke, The Solar Foundation; John Farrell, Institute for Local Self Reliance and Riana Ackley, ICLEI-Local Governments for Sustainability for their review of drafts of this document, as well as their insights and suggestions. Thanks to everyone who went out of their way to provide us with data for this report. Thanks also to Jeff Inglis, Tony Dutzik and Gideon Weissman of Frontier Group for editorial sup-port and to ESRI for their grant of ArcGIS software that we used for our data analysis in this report.
Environment America Research & Policy Center thanks The Tilia Fund, The Barr Foundation, The John Merck Fund, The Scherman Foundation, The Arntz Family Fund, The Carolyn Foundation, The Fred and Alice Stanback Foundation, The Meyer Memorial Trust, Fund for New Jersey, The Town Creek Founda-tion, The Rauch Foundation, The McCune Charitable Foundation, Edna Wardlaw Charitable Trust, The Waterfall Fund, The Morris Foundation, The Krieger Fund, The Fund for Change, and The Bancroft Foun-dation for making this report possible.
The authors bear responsibility for any factual errors. The recommendations are those of Environment America Research & Policy Center. The views expressed in this report are those of the authors and do not necessarily reflect the views of our funders or those who provided review.
© 2015 Environment America Research & Policy Center
Frontier Group provides information and ideas to help citizens build a cleaner, healthier, fairer and more democratic America. We address issues that will define our nation’s course in the 21st century – from frack-ing to solar energy, global warming to transportation, clean water to clean elections. Our experts and writers deliver timely research and analysis that is accessible to the public, applying insights gleaned from a variety of disciplines to arrive at new ideas for solving pressing problems. For more information about Frontier Group, please visit www.frontiergroup.org.
Layout: To The Point Publications, tothepointpublications.com
Cover photos: top center, Detroit, Applied Energy Technologies; bottom left, Poway, California, Community Housing Works; bottom center, Boston, Renew Boston; bottom right, Raleigh, City of Raleigh.

Table of ContentsExecutive Summary . . . . . . . . . . . . . . . . . . . . . . . . . . . . . . . . . . . . . . . . . . . . . . . . . . . . . 4
Introduction . . . . . . . . . . . . . . . . . . . . . . . . . . . . . . . . . . . . . . . . . . . . . . . . . . . . . . . . . . 10
Solar Energy Use Is Rapidly Expanding in the United States. . . . . . . . . . . . . . . . . . 12
Solar Energy Has the Potential to Power the United States 100 Times Over . . . . . . . . . . . . . . . . . . . . . . . . . . . 12
Solar Energy in the United States Has Quadrupled in the Past Three Years . . . . . . . . . . . . . . . . . . . . . . . . . . . 13
Solar Energy Can Power Sustainable Cities and Strong Economies . . . . . . . . . . . . 14
Solar Energy Reduces Climate-Altering Carbon Pollution . . . . . . . . . . . . . . . . . . . . . . . . . . . . . . . . . . . . . . . . 14
Solar Energy Reduces Air Pollution . . . . . . . . . . . . . . . . . . . . . . . . . . . . . . . . . . . . . . . . . . . . . . . . . . . . . . . . . . . . . . . 15
Solar Energy Fortifies Cities Against Severe Storms and Drought . . . . . . . . . . . . . . . . . . . . . . . . . . . . . . . . 16
Solar Energy Reduces the Cost of Electricity and Spurs Economic Growth . . . . . . . . . . . . . . . . . . . . . . . 16
America’s Top Solar Cities Are Building a Clean Energy Future . . . . . . . . . . . . . . 18
Top 20 Cities Run on Over 1 Gigawatt of Solar Power . . . . . . . . . . . . . . . . . . . . . . . . . . . . . . . . . . . . . . . . . . . . 18
Cities with Ambitious Solar Energy Goals and Pro-Solar Policies Are Creating a Clean Electric Grid . . . . . . . . . . . . . . . . . . . . . . . . . . . . . . . . . . . . . . . . . . . . . . . . . . . . . . . . . . . . . . . . . . . . . . . . . . . . . . . . . . . . . . 29
Policy Recommendations. . . . . . . . . . . . . . . . . . . . . . . . . . . . . . . . . . . . . . . . . . . . . . . . 36
Methodology . . . . . . . . . . . . . . . . . . . . . . . . . . . . . . . . . . . . . . . . . . . . . . . . . . . . . . . . . . 39
Selecting the Cities . . . . . . . . . . . . . . . . . . . . . . . . . . . . . . . . . . . . . . . . . . . . . . . . . . . . . . . . . . . . . . . . . . . . . . . . . . . . . . . 39
Collecting Data on Installed Solar PV Capacity . . . . . . . . . . . . . . . . . . . . . . . . . . . . . . . . . . . . . . . . . . . . . . . . . . .40
Appendix A: Solar Energy in Major U.S. Cities . . . . . . . . . . . . . . . . . . . . . . . . . . . . . 41
Appendix B: City-by-City Data Sources . . . . . . . . . . . . . . . . . . . . . . . . . . . . . . . . . . . 43
Notes . . . . . . . . . . . . . . . . . . . . . . . . . . . . . . . . . . . . . . . . . . . . . . . . . . . . . . . . . . . . . . . . . 51

4 Shining Cities
Executive Summary
The use of solar power is expanding rapidly across the United States. By the end of 2014, the United States had 20,500 megawatts
(MW) of cumulative solar electric capacity, enough to power four million average U.S. homes. This success is the outcome of federal, state and local programs that are working in concert to make solar power
accessible to more Americans, thereby cleaning our air, protecting our health, and hedging against volatile electricity prices.
America’s major cities have played key roles in the clean energy revolution and stand to reap significant benefits from solar energy adoption. As population
City State Total Solar PV
Installed (MW-DC)Total Solar PV
Rank
Per Capita Solar PV Installed (Watts-
DC/Person) Per Capita Rank
Los Angeles CA 170 1 44 15
San Diego CA 149 2 110 4
Phoenix AZ 115 3 76 9
Indianapolis IN 107 4 127 2
San Jose CA 105 5 110 3
Honolulu HI 96 6 276 1
San Antonio TX 88 7 63 10
Denver CO 58 8 89 7
New York NY 41 9 5 44
New Orleans LA 36 10 94 6
San Francisco CA 30 11 36 19
Albuquerque NM 28 12 50 14
Raleigh NC 27 13 62 11
Sacramento CA 25 14 53 12
Las Vegas NV 24 15 40 16
Newark NJ 22 16 78 8
Austin TX 21 17 24 23
Portland OR 21 18 34 21
Jacksonville FL 14 19 17 27
Boston MA 13 20 20 24
Table ES-1: Top 20 Solar Cities by Total Installed Solar PV Capacity, End of 2014*
* This includes all solar PV capacity (rooftop and utility-scale solar installations) within the city limits of each city. See methodology for an explanation of how these rankings were calculated. See Appendix B for city-specific sources of data.

Executive Summary 5
centers, they are home to the largest electricity mar-kets and can have an important influence on the way we power our grid. Many cities are already benefit-ting from smart policies that encourage investment in solar energy.
As of the end of 2014, 20 cities – representing just 0.1 percent of U.S. land area – account for 6.5 percent of solar photovoltaic (PV) capacity in the United States. The 65 cities in this report have installed 1.3 gigawatts (GW) of solar PV capacity – more solar
PV than was installed in the entire country at the end of 2009. Los Angeles leads the nation in total installed solar PV capacity, followed by San Diego, Phoenix, Indianapolis and San Jose. (See Figure ES-1 and Table ES-1.)
The cities with the most solar PV installed per person are the “Solar Stars” – cities with 50 or more watts of installed solar PV capacity per person. These cities have experienced dramatic growth in solar energy and are setting the pace nationally for solar energy
Figure ES-1: U.S. Cities by Cumulative Installed Solar PV Capacity, End of 2014

6 Shining Cities
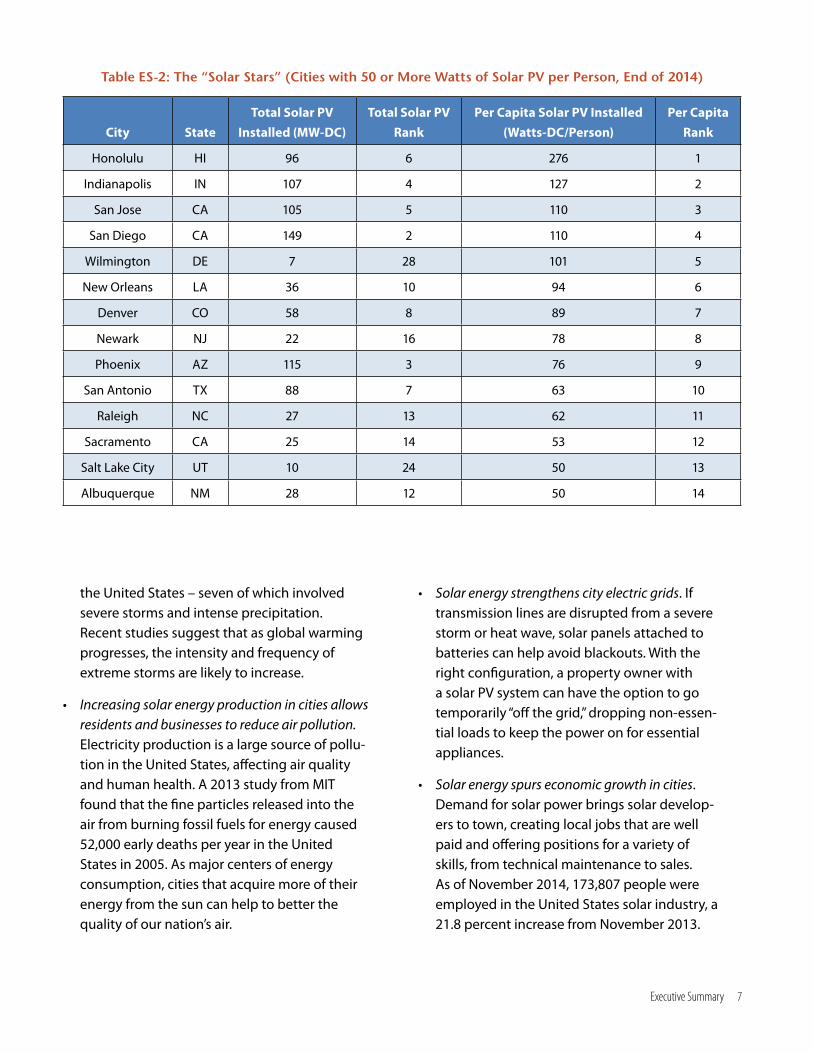
development. Honolulu, Indianapolis, San Jose, San Diego and Wilmington, Delaware, are the top 5 cities in the nation for installed solar PV capac-ity per person. (See Figure ES-2 and Table ES-2.)
Cities were also divided into U.S. Census sub-regions and ranked by solar PV capacity installed per person. New cities stand out when categorized and ranked by U.S. region. Regional leaders are Honolulu in the Pacific region, Denver in the Mountain region, India-napolis in the North Central regions, New Orleans in the South Central regions, Wilmington, Delaware in the South Atlantic region, and Newark, New Jersey in the New England and Mid-Atlantic regions.
Figure ES-2: U.S. Cities by Per Capita Installed Solar PV Capacity, End of 2014
Solar power makes sense for cities. Solar power reduces the threat to cities posed by global warm-ing, cuts down on toxic air pollution, fortifies cities against severe weather events and boosts local economies:
• By switching to solar energy, cities can do their part to mitigate the dangerous impacts of global warming. Solar power produces 96 percent less global warming pollution than coal-fired power plants over its entire life-cycle. Mitigating global warming pollution is important for cities: in 2014, there were eight weather events that caused damage valued at more than $1 billion each in
Executive Summary 7
Table ES-2: The “Solar Stars” (Cities with 50 or More Watts of Solar PV per Person, End of 2014)
City State Total Solar PV
Installed (MW-DC)Total Solar PV
RankPer Capita Solar PV Installed
(Watts-DC/Person)Per Capita
Rank
Honolulu HI 96 6 276 1
Indianapolis IN 107 4 127 2
San Jose CA 105 5 110 3
San Diego CA 149 2 110 4
Wilmington DE 7 28 101 5
New Orleans LA 36 10 94 6
Denver CO 58 8 89 7
Newark NJ 22 16 78 8
Phoenix AZ 115 3 76 9
San Antonio TX 88 7 63 10
Raleigh NC 27 13 62 11
Sacramento CA 25 14 53 12
Salt Lake City UT 10 24 50 13
Albuquerque NM 28 12 50 14
the United States – seven of which involved severe storms and intense precipitation. Recent studies suggest that as global warming progresses, the intensity and frequency of extreme storms are likely to increase.
• Increasing solar energy production in cities allows residents and businesses to reduce air pollution. Electricity production is a large source of pollu-tion in the United States, affecting air quality and human health. A 2013 study from MIT found that the fine particles released into the air from burning fossil fuels for energy caused 52,000 early deaths per year in the United States in 2005. As major centers of energy consumption, cities that acquire more of their energy from the sun can help to better the quality of our nation’s air.
• Solar energy strengthens city electric grids. If transmission lines are disrupted from a severe storm or heat wave, solar panels attached to batteries can help avoid blackouts. With the right configuration, a property owner with a solar PV system can have the option to go temporarily “off the grid,” dropping non-essen-tial loads to keep the power on for essential appliances.
• Solar energy spurs economic growth in cities. Demand for solar power brings solar develop-ers to town, creating local jobs that are well paid and offering positions for a variety of skills, from technical maintenance to sales. As of November 2014, 173,807 people were employed in the United States solar industry, a 21.8 percent increase from November 2013.

8 Shining Cities
Cities can reap the benefits of clean, solar energy by adopting pro-solar policies and taking actions that will encourage innovation and investment in the solar industry. Many leading cities have successfully built their solar energy markets with local government policies. Some leading cities are in states that have taken state-level action to promote solar energy adop-tion. Some of the most effective drivers of solar energy development include:
• Streamlining the permitting process for solar power. The “soft costs” associated with solar power – costs such as those associated with attracting customers, installing the systems, completing paperwork, and paying taxes and permitting fees – can make up to 64 percent of the total cost of an installed solar energy system, as of 2013. The Department of Energy’s SunShot Initiative rewards cities working to reduce these costs with funds to implement
City State Region
Total Solar PV Installed
(MW-DC)
Regional Total Solar
PV Rank
Per Capita Solar PV Installed (Watts-
DC/Person)
Regional Per Capita
Rank
Newark NJNew England and Mid-Atlantic 22 2 78 1
Burlington VTNew England and Mid-Atlantic 2 8 39 2
Wilmington DE South Atlantic 7 4 101 1
Raleigh NC South Atlantic 27 1 62 2
Indianapolis INWest North Central and East North Central 107 1 127 1
Kansas City MOWest North Central and East North Central 11 3 25 2
Honolulu HI Pacific 96 4 276 1
San Jose CA Pacific 105 3 110 2
Denver CO Mountain 58 2 89 1
Phoenix AZ Mountain 115 1 76 2
New Orleans LAWest South Central and East South Central 36 2 94 1
San Antonio TXWest South Central and East South Central 88 1 63 2
Table ES-3: Top Two U.S. Cities by Region by Per Capita Installed Solar PV Capacity, End of 2014

Executive Summary 9
programs that make permitting processes easier, increase solar financing options or reduce the upkeep costs over time.
• Removing local barriers to solar energy adoption. Encouraging local lending for solar projects, providing predictable tax incentives that make solar energy more affordable, and adopting solar-friendly permitting policies and building codes have proven critical in building strong solar energy markets.
• Expanding access to solar. “Solarize” programs and community solar programs have been success-ful at lowering the cost of solar energy systems for communities, and allowing more people to receive the benefits of solar energy. Solarize programs, like those in Portland, Oregon, allow communities to bulk purchase solar energy systems in order to receive volume discounts. In Washington D.C., local officials passed a commu-nity solar act in 2013 that allows residents to buy ownership of off-site panels and receive credit on their electricity bills for the solar energy produced.
• Partnering with local utilities. Municipal utilities in several cities have driven the growth of solar power by setting renewable energy goals and offering financial incentives for solar projects. Cities served by investor-owned utilities (IOUs) make up a large part of an IOU’s customer base and can also effectively partner with the electric utility to promote solar energy adoption. New York City partnered with Con Edison, its local IOU, to connect solar power to the city grid and creat-ed designated “Solar Empowerment Zones” where solar power could deliver the most benefits.
Strong public policies at every level of govern-ment can help the United States continue to har-ness clean solar energy and overcome legislative and regulatory barriers to distributed generation.
To achieve the nation’s full solar potential:
• Local governments should follow the lead of top solar cities by setting strong goals for solar energy adoption, implementing programs that promote the rapid expansion of solar energy, and urging state and federal officials and investor-owned utilities to facilitate that expansion.
• State governments should set ambitious goals for solar energy adoption and adopt policies to meet them. It is critical that states have strong net metering laws in order to make solar instal-lations accessible and affordable. States can also pass strong renewable portfolio standards with solar carve-outs, community solar legislation, tax credits for solar energy, promote solar programs for low-income households, and establish public benefits charges on electricity bills to raise funds for solar energy programs. State governments should also use their role as the primary regula-tors of electric utilities to encourage utility invest-ments in solar energy and implement rate struc-tures that maximize the benefits of solar energy to consumers.
• The federal government should continue to provide long-term support for solar power through tax credits, grants to non-profits for solar energy development, and grants to support solar energy deployment on low income housing developments, in addition to other incentives. The federal government should continue to support research, development and deployment efforts designed to reduce the cost of solar energy and to speed the integration of renewables, storage and smart grid technologies into the grid.

10 Shining Cities
Introduction
Cities across the United States are recognizing and harnessing the transformative power of solar energy. Many local governments have
recognized the benefits of solar energy and are using it to make their electric grids more efficient, create local jobs, protect residents from the dangers of extreme weather events, and mitigate pollution that is fueling global warming and endangering public health.
Chicago is investing in solar energy to insulate the city against extreme weather events. Chicago launched the Sustainable Chicago 2015 agenda – an initiative to prepare the city for longer heat waves, more intense rainstorms, and shifts in the water cycle.1 Increasing solar energy capacity was a top priority under the new agenda; in working towards its goals the city launched the Solar Chicago Bulk Purchase program, which offered discounts to com-munity solar projects, and the Solar Express program, which streamlined city permitting processes and reduced the “soft costs” of installation.2
Fort Collins, Colorado, is investing in solar energy as part of a plan to update its electric grid and spur local economic development. The city launched an initiative called Utilities for the 21st Century in 2010. This initiative works to reduce costs and increase sustainability by modernizing utility services, includ-ing the electric distribution system.3 Solar energy is a big part of that effort. Fort Collins is a partner in the Solar Friendly Communities project funded by the
U.S. Department of Energy, a project that, by bring-ing down the costs of solar energy, “encourages the spread of a locally powered, job-creating energy source that has no fuel costs and produces no pollu-tion.”4 By implementing guidelines that reduce the “soft costs” of solar energy, offering rebates on solar energy systems to homeowners and businesses, and launching a community solar program, Fort Collins has more than tripled its solar PV capacity in just four years, from a total of 722 kW in 2010 to a total of 2.5 MW by 2014.5
More cities are investing in solar energy to reduce their energy-related carbon dioxide emissions and fight global warming. In 2014, the mayors of three of the nation’s largest cities – Los Angeles, Houston and Philadelphia – launched the “Mayors’ National Climate Action Agenda.” The initiative acknowledges that cities are responsible for a large part of green-house gas emissions, and is based on the idea that, as leaders of cities, “mayors are uniquely compelled and equipped to lead on the fight to stem climate change, as well as to adapt to it and prepare for the impacts of global warming.”6 A major component of this initia-tive is sourcing more energy from renewable sources like solar energy. Houston already generates 50 percent of its electricity from wind and solar energy.7 The city expects to source even more of its energy from wind and solar sources by 2016.8 Philadelphia implemented the agenda in conjunction with its sustainability program, Greenworks Philadelphia, and

Introduction 11
has a goal of purchasing 20 percent of its electricity from alternative sources by 2015.9 The Philadelphia Water Department has installed a 250 kW solar ener-gy system, and the Philadelphia Eagles football team installed 11,000 solar panels around Lincoln Financial Field that will work with wind turbines to provide 30 percent of the power used by the stadium.10 In March 2014, the Philadelphia City Council passed a resolu-tion to increase solar energy capacity in the city even further, with a goal of 20,000 rooftop solar energy systems by 2025.11 These cities are now moving to join the leading cities committed to powering their grids with clean energy.
City officials are on the front lines of adopting the best new technologies to update our electric grid and prepare our cities for extreme weather events
in a warming world. Implementing policies that make solar energy more accessible and building a grid powered by clean energy from the sun will help to reduce climate-altering emissions, localize electricity production, create jobs, and support a more flexible and sophisticated electric grid.
The city leaders included in this report have shown that setting goals and implementing trans-parent and well-designed programs are key to bringing solar energy to their communities. Every city has the potential to adopt smart policies and make this same progress toward a clean energy future. Cities can lead America’s transformation from a country largely dependent on polluting fossil fuels to one that sources much of its energy from the sun.
Rooftop solar panels on top of the historic Gem Theater in Kansas City, Missouri.
Photo: The City of Kansas City

12 Shining Cities
Solar Energy Use Is Rapidly Expanding in the United States
The United States has witnessed a decade of impressive growth in solar energy use, and the future continues to look bright. By the
end of 2014, the United States had 20,500 megawatts (MW) of cumulative solar electric capacity, enough to power four million average U.S. homes.12 The United States has the solar potential and the industry momentum to transform our population centers into shining examples of solar power at work.
Solar Energy Has the Potential to Power the United States 100 Times OverSolar power is growing exceptionally fast, but the United States is nowhere near the limit of the solar capacity it can support. The United States has the technical potential to install enough solar electricity capacity to meet the nation’s electricity needs more than 100 times over.13 If every state captured 0.1 percent of its technical potential for solar power, the United States would be generating 10 percent of its electricity from the sun by 2030.14 U.S. cities can help us to achieve this potential by preserving and ex-panding programs that make generating and storing solar energy easy and accessible to all.
As major population centers, our nation’s cities are home to millions of households and businesses that already provide the rooftops we need to generate more solar power in urban areas. The United States has an estimated 35 million rooftops capable of
hosting solar panels, and cities are host to millions of these rooftops.15 One new mapping tool devel-oped at MIT, and used by the startup Mapdwell, uses mapping data to calculate the solar potential of various communities. According to the tool, Bos-ton, Massachusetts has the potential to install 2,094 MW of solar photovoltaic (PV) capacity on nearly 128,000 buildings.16 Thanks to continuous innova-tion in solar panel technology, solar energy systems are able to convert more sunlight into energy, at a lower cost, using the same amount of surface area, thereby avoiding the need to invest in expensive new fossil fuel-using power plants and transmis-sion infrastructure.17
Falling costs, combined with innovation in solar energy technology and pro-solar policies, mean that urban residents and businesses no longer have to be passive consumers of energy – they can generate their own energy from the sun. The price of the average solar PV panel has dropped 63 percent since the third quarter of 2010, providing more Americans with the opportunity to generate their own energy at home or at their business.18 Continued developments in solar panel efficiency allow systems to convert more sunlight into energy using the same amount of space, and recent in-novations in storage systems will allow consumers to store the excess energy generated during the day and use it when needed.19 In an urban setting, generating the most energy for the least amount of space is important and many new solar technolo-

Solar Energy Use Is Rapidly Expanding in the United States 13
gies, when completed, will allow city residents to maximize their solar energy generation. For example, researchers are developing a transparent material that could convert solar energy to electricity on win-dow panes.20 Solar roads and bike paths are also fast becoming a reality – the Netherlands installed the world’s first solar bike path in November 2014.21
Innovation in solar energy storage technologies is also increasing solar energy’s potential. Battery technologies can store energy from the sun for use at night and on cloudy days, thus retaining the solar energy produced during periods of high production and using it during periods of low production.22 Bat-teries can be both stationary and mobile; the latter already exist in the rapidly expanding electric vehicle market.23 Electric vehicles charged from solar energy provide the driver with an emissions-free fuel to drive home after a midday charge at work. In addition to batteries, thermal energy storage resources like ice-making air conditioners offer inexpensive and readily available solutions.24 In New York City, the local utility Con Edison is offering rebates to customers who in-stall solar energy storage systems, spurring demand for this technology in the most populated city in the United States.25
Solar Energy in the United States Has Quadrupled in the Past Three YearsThe United States has witnessed remarkable growth in the solar energy industry in just a little more than a decade. In 2000, the United States had a total of 170 MW of solar PV capacity in the entire country.26 Thanks to pro-solar policies that helped encourage new technologies, increase financing options for homeowners and businesses, and streamline zoning and permitting regulations, the United States had installed 18.3 gigawatts (GW) of solar PV capacity by the end 2014.27 This impressive growth is providing our nation’s electricity grid with a clean and renew-able energy source, while reducing our dependence on fossil fuels.
In the early 2000s, non-residential PV and utility scale systems drove the majority of growth in the solar energy industry. In the past three years, however, the residential sector has become a growing source of demand. In 2011, approximately 300 MW of residen-tial PV capacity was installed throughout the year.28 In 2014, the residential sector installed more than 1 GW of solar energy capacity in a year for the first time.29 Because cities are home to a large percentage of the population, decreasing the up-front costs of small-scale solar PV systems will be critical for expanding solar energy throughout more U.S. cities. As demand for solar PV systems continues to increase, system installers continue to gain more experience and be-come more productive, causing costs to fall farther, providing more urban residents with the opportunity to “go solar.”
Current trends point to a promising future for cities. The potential for growth in urban residential PV sys-tems is enormous, and the time has never been bet-ter. Using smart policies that allow urban residents to benefit from solar power will help cities create a clean and more reliable electric grid while lowering monthly costs for homeowners and businesses.

14 Shining Cities
Solar Energy Can Power Sustainable Cities and Strong Economies
Cities stand to benefit greatly from solar en-ergy. Cities are national hubs of community and economic activity – but they are also
centers of energy consumption and pollution. Cities account for around 70 percent of global energy use and energy-related greenhouse gas emissions, much of which comes from the burning of fossil fuels to generate electricity.30 Even as the nation continues to urbanize (America’s urban population growth outpaced that of rural areas between 2000 and 2010, a trend the United Nations predicts will continue), our nation’s cities have the potential to generate the power they need from the sun without fueling urban air pollution or contributing to global warming.31 By encouraging a strong solar industry, cities can lead the way in reducing greenhouse gas emissions, pro-tecting public health, growing a strong new sector of the economy and helping residents to reduce the cost of powering their homes.
Solar Energy Reduces Climate-Altering Carbon Pollution Increasing the amount of solar power cities use will decrease the global warming pollution that comes from fossil fuel combustion. In 2012, U.S. power plants produced more carbon pollution than the entire economies of any other nation besides China.32
In 2013, the United States emitted 5.2 million metric tons of carbon dioxide, the second-highest amount in the world; coal-fired power plants accounted for nearly one-third of those emissions.33
The impacts of global warming are taking their toll on cities as severe storms, extreme precipitation, drought and heat waves occur more frequently and intensely. If global warming pollution remains un-checked, these impacts will grow even more severe.
As sea level continues to rise, cities will face increased risks of “nuisance flooding” – flooding one to two feet above the average local high tide – that will take a high toll on roads, storm drains and the economy.34 According to the National Oceanic and Atmospheric Administration (NOAA), cities on the coasts of the United States have seen drastic increases in the number of nuisance flood days. An-napolis, Maryland, the city with the highest increase, experienced an average of 3.8 days of nuisance flood-ing each year between 1957 and 1963.35 From 2007 to 2013, however, the city experienced an annual average of 39.3 days of nuisance flooding.36
This flooding will be exacerbated by increased precipitation intensity. As surface air temperatures rise, the atmosphere is able to hold more of the water vapor that comes from increased evaporation.37 Sci-

Solar Energy Can Power Sustainable Cities and Strong Economies 15
entists predict that this excess vapor will cause more instances of intense precipitation events, which, in turn, leads to soil erosion, flooding and landslides.38 In 2014, there were eight weather events with dam-age valued at over $1 billion each in the United States – seven of them involved severe storms and intense precipitation.39 Several states and cities, such as New York state, Pensacola, Florida, and Mobile, Alabama, set new 24-hour precipitation records.40 Recent studies suggest that, as global warming progresses, occurrences of severe thunderstorms are likely to increase.41
Global warming will also lead to more intense, and more frequent, heat waves. Urban residents are more vulnerable to the health impacts of heat waves as cities tend to experience higher tempera-tures than surrounding areas due to the heat trap-ping capabilities of cement and other materials that make up urban infrastructure, also known as the “heat island” effect.42 Higher temperatures, in turn, cause heat stroke, heat exhaustion and intensify lev-els of smog and air pollution.43
Increasing temperatures and more frequent heat waves also lead to longer and more costly fire seasons. A 2014 report prepared by the U.S. Forest Service predicts that the area burned by wildfire will double by the middle of the 21st century.44 This is sure to impact urban areas, especially those already close to “very high fire hazard” regions such as Los Angeles and San Diego counties (together home to more than 13 million people).45 As fires become more frequent and burn for longer periods of time, managing and suppressing them will increase the cost to cities. In Santa Fe, New Mexico, for example, extended fires threatened the city’s main watershed, which provides one-third of the city’s water supply. The city esti-mated costs of up to $248 million to rehabilitate the watershed if a significant fire were to reach it.46
As major centers of electricity consumption, urban areas will play a critical role in reducing greenhouse gas emissions. By powering urban electricity grids
with solar energy, cities can reduce these emissions and mitigate the worst effects of climate change.
Solar power generation produces no global warming pollution. Even when emissions from manufacturing, transportation and installation of solar panels are in-cluded, solar power produces 96 percent less global warming pollution than coal-fired power plants over its entire life-cycle, and 91 percent less global warm-ing pollution than natural gas-fired power plants.47 By reducing the need for electricity from fossil fuel-fired power plants and by not generating significant global warming pollution itself, solar power reduces the threat posed by global warming and helps to clean the nation’s air.
Solar Energy Reduces Air Pollution U.S. cities are major consumers of energy, much of which the nation still obtains by burning coal and natural gas.48 Electricity production is a large source of pollution in the United States, affecting air qual-ity and human health.49 Cities that work to expand access to solar energy to more of their residents will play a big role in reducing overall demand for energy from fossil fuel power plants, thereby bettering our nation’s air quality and reducing the number of early deaths caused by pollution.
Fossil fuel combustion forms dangerous levels of fine particle matter in the air. Particle pollution from fossil fuel combustion is created when gases emitted dur-ing the combustion process condense, or react with other gases and particles, and this pollution puts the population at increased risk of developing asthma and chronic respiratory disease and even stroke and premature death.50 According to an MIT study, fine particle pollution caused 52,000 early deaths in the United States in 2005.51 While much of urban air pol-lution comes from vehicles and industry, cities in the Midwest and Mid-Atlantic, such as Baltimore, Cleve-land, St. Louis and Washington, D.C., are particularly threatened by fine particle pollution from electricity generation.52

16 Shining Cities
In a joint announcement, the National Aeronautics and Space Administration (NASA) and the National Oceanic and Atmospheric Administration (NOAA) confirmed that 2014 was the hottest year on record.53 As cities experience hotter days, electricity demand for air conditioning increases, causing us to burn more fossil fuels and to turn on natural-gas-fired “peaker” power plants – plants that are too expensive to run regularly but are required to meet high de-mand.54 Increasing our solar power capacity will allow us to get more energy from the sun during periods of high demand, thereby reducing air pollution and a major threat to public health.
Solar Energy Fortifies Cities Against Severe Storms and DroughtRooftop solar energy can also protect cities in the face of severe storms and heat waves, which global warming will worsen. If transmission lines are disrupt-ed from a severe storm or heat wave, solar energy attached to batteries can help avoid blackouts by giving a solar PV system the option to go temporar-ily “off the grid,” dropping non-essential loads and continuing to power essential services.55
Two of America’s largest cities, New York and Chi-cago, have launched climate change adaptation plans that seek to integrate more clean and renew-able energy generators, like solar energy, into the cities’ infrastructure.56 After Hurricane Sandy hit in 2012, New York City launched a comprehensive study of what happened to the city during the storm, and how it could avoid those failures in future storms. The report notes that “during and after the storm, one-third of the city’s electric generating capacity was temporarily lost,” and “five major electric transmis-sion substations in the city flooded and shut down,” leaving 800,000 people without power.57 In reaction to these events, the report recommends that the city work to scale up distributed solar generation and mi-crogrids – localized energy grids that have the ability to disconnect from the larger grid during emergen-
cies or blackouts by powering themselves with solar energy, batteries or distributed generators.58
Solar energy also protects cities in times of drought and extreme heat. Electricity production accounts for 41 percent of freshwater withdrawals nationally, largely because of our dependence on aging power plants that need a lot of water for cooling.59 Reduc-ing the amount of water we use to create electricity is increasingly important in order to protect aquatic environments and to conserve communities’ water resources in the face of increasing drought.60 With less water available for generating hydroelectricity or to serve as a cooling agent for fossil fuel power plants, cities must find sources of energy that do not drain local water resources. Solar PV uses almost no water. The life-cycle water consumption of solar PV is 1/500th of the life-cycle water consumption of coal power plants and 1/80th of that of natural gas plants per unit of electricity produced.
Solar Energy Reduces the Cost of Electricity and Spurs Economic GrowthCities that encourage investments in solar energy offer their residents many important economic ben-efits. The cost per watt of solar energy systems has fallen drastically, allowing more people to generate clean energy and avoid greenhouse gas emissions.61
Homeowners and businesses who install solar panels can offset major portions – in some cases all – of their electric bills. Because energy from the sun is free (after the initial investment is made), consum-ers who invest in solar panels are insulated from the volatile prices of fossil fuel markets. Solar energy can also be a near-term economic winner for consumers and businesses – especially in states where electricity prices are high, owners of solar panels are allowed to recoup the full benefits of the electricity they pro-duce, and there are other strong, pro-solar policies in place. In California, for example, years of investment

Solar Energy Can Power Sustainable Cities and Strong Economies 17
in the solar energy market have helped to lower the cost of a residential PV system by 45 percent since 2008.62
The benefits of solar energy extend far beyond the home or commercial building where solar panels are installed. Solar energy benefits all consumers by reducing many of the costs of operating the electric-ity system. Among the benefits of distributed solar electricity to the grid are:
• Reduced need for expensive “peaking” power – Solar panels usually produce the most electricity on sunny days when demand for power is at its highest. These are the times when utilities must generate or purchase power from expensive, often inefficient “peaking” power plants that may operate only a few hours each year. Expanding solar power can reduce the cost of providing power during those peak periods.63
• Reduced need for investment in transmission capacity – Generating more electricity closer to the locations where it is used reduces the need to construct or upgrade expensive transmission capacity.
• Reduced energy losses – Many cities depend on electricity transmitted from hundreds of miles away to meet local needs. In coal-fired power plants, for example, much of the original energy content of the coal is “lost”, or turned into forms of energy that cannot be used or captured, during the combustion process.64 In addition, more energy is lost during transmission of electricity, usually in the form of heat.65 Distributed solar energy avoids these losses by generating electric-ity at or near the location where it is used.
Solar energy also delivers important benefits to low-income consumers. Rebate programs across the country make buying a solar energy system more affordable by helping with the up-front costs.66 For families who do not live in a single-family home, “vir-
tual net metering” programs allow multiple residents to participate in the same metering system, sharing both the costs and the benefits of a solar energy installation on the building, or even off of their prop-erty.67 Even those families who do not have a solar energy system benefit from increased solar power generation – with solar energy as a significant energy source, consumers would experience much less fossil fuel-related volatility in the price of electricity.68
Solar energy also helps the economy by boosting new industry and employment. Employment in the solar industry has grown by 86 percent from 2010 to 2014.69 As of November 2014, 173,807 people were employed in the United States solar industry, a 21.8 percent increase from November 2013.70 Installation accounts for 55.8 percent of the jobs in the American solar energy industry.71 These jobs are created in local communities and, due to the hands-on nature of the work, cannot be outsourced. Manufacturing accounts for 18.7 percent of jobs nationally, while jobs in sales and project development make up 11.6 percent and 8.7 percent respectively.72 Due to increasing demand for solar panels in New York, SolarCity, one of the nation’s largest solar energy system installers, plans to open a new solar panel manufacturing factory in Buffalo, creating as many as 3,000 new jobs.73

18 Shining Cities
America’s Top Solar Cities Are Building a Clean Energy Future
City leaders and residents are taking ad-vantage of the significant opportunities offered by solar energy as the U.S. solar
energy boom continues to escalate.
In leading cities, city officials are setting ambitious goals for solar energy adoption and putting solar panels on city buildings; city leaders and utilities are working together to update the electric grid and offer electricity customers incentives to invest in solar energy systems; city permitting depart-ments are taking steps to reduce fees and process-ing time for solar installation applications; and city residents – individually and with their neighbors – are cutting their electricity bills and contributing to a cleaner environment by putting solar panels on their homes and apartment buildings. Solar energy is a key part of a cleaner energy economy and a more efficient, local and sustainable electric grid in densely populated places.
This report is our second review of solar photovol-taic (PV) installations in U.S. cities. This year, the list of cities to be surveyed started with the primary cities in the top 50 most populous Metropolitan Statistical Areas in the United States. If a state did not have a city included in that list, its largest city was added to the list to be surveyed. For a complete list of cities, see Appendix B. If reliable data was ultimately unavailable for a city, it was dropped from the list.74
There is no uniform national data source that tracks solar energy by municipality, so the data for this report come from a wide variety of sources—mu-nicipal and investor-owned utilities, city and state government agencies, operators of regional electric grids, and non-profit organizations. (See Methodol-ogy.) The use of multiple data sources leads to the possibility of variation among cities in how solar capacity is quantified and in the comprehensive-ness of the data. While we endeavored to correct for many of these inconsistencies, readers should be aware that some discrepancies may remain and should interpret the data accordingly. Readers should also be aware that we were able to obtain more specific and reliable data this year than we were able to find for the first edition of Shining Cit-ies, released in 2014. In Appendix B, we noted the cases in which it is unreliable to compare city data between this report and the first edition.
Top 20 Cities Run on Over 1 Gigawatt of Solar Power Cities that lead the nation in installed solar PV capacity come from all regions of the United States. The 65 cities included in this report installed 1.3 GW of solar PV as of the end of 2014. (See Appendix A.) These cities contain more solar power than was installed across the entire United States in 2009.75

America’s Top Solar Cities Are Building a Clean Energy Future 19
As of the end of 2014, the United States had installed 18.3 GW of solar PV capacity; by the end of 2014, the 20 cities in our report with the most solar PV capacity had installed 1.2 GW of solar PV capacity.76 Despite making up only 0.1 percent of the nation’s land
area, these cities contain 6.5 percent of U.S. solar PV capacity.77 Los Angeles leads the nation in total installed solar PV capacity, followed by San Diego, Phoenix, Indianapolis and San Jose. (See Table 1 and Figure 1).78
City State
Total Solar PV Installed
(MW-DC)Total Solar
PV Rank
Per Capita Solar PV Installed (Watts-DC/
Person)Per Capita
Rank
Los Angeles CA 170 1 44 15
San Diego CA 149 2 110 4
Phoenix AZ 115 3 76 9
Indianapolis IN 107 4 127 2
San Jose CA 105 5 110 3
Honolulu HI 96 6 276 1
San Antonio TX 88 7 63 10
Denver CO 58 8 89 7
New York NY 41 9 5 44
New Orleans LA 36 10 94 6
San Francisco CA 30 11 36 19
Albuquerque NM 28 12 50 14
Raleigh NC 27 13 62 11
Sacramento CA 25 14 53 12
Las Vegas NV 24 15 40 16
Newark NJ 22 16 78 8
Austin TX 21 17 24 23
Portland OR 21 18 34 21
Jacksonville FL 14 19 17 27
Boston MA 13 20 20 24
Table 1: Top 20 Solar Cities by Total Installed Solar PV Capacity, End of 2014

20 Shining Cities
Cities Ranked by Per Capita Solar PV CapacityThe cities ranked in this report vary in size and geog-raphy. Measuring solar PV capacity installed per city resident in addition to comparing total solar PV ca-pacity installed can give city officials an idea of how deeply solar power has permeated the community.
Figure 1: U.S. Cities by Cumulative Installed Solar PV Capacity, End of 2014
Solar Stars are cities with 50 or more watts of installed solar PV capacity per person. They are cities that have experienced dramatic growth in solar energy in recent years and are setting the pace nationally for solar energy development. Honolulu, Indianapolis, San Jose, San Diego and Wilmington are the top 5 cities in the nation for installed solar PV capacity per person.

America’s Top Solar Cities Are Building a Clean Energy Future 21
City State Total Solar PV
Installed (MW-DC)Total Solar PV
RankPer Capita Solar PV
Installed (Watts-DC/Person)Per Capita
Rank
Honolulu HI 96 6 276 1
Indianapolis IN 107 4 127 2
San Jose CA 105 5 110 3
San Diego CA 149 2 110 4
Wilmington DE 7 28 101 5
New Orleans LA 36 10 94 6
Denver CO 58 8 89 7
Newark NJ 22 16 78 8
Phoenix AZ 115 3 76 9
San Antonio TX 88 7 63 10
Raleigh NC 27 13 62 11
Sacramento CA 25 14 53 12
Salt Lake City UT 10 24 50 13
Albuquerque NM 28 12 50 14
Figure 2: U.S. Cities by Per Capita Installed Solar PV Capacity, End of 2014
Table 2: The “Solar Stars” (Cities with 50 or More Watts of Solar PV Per Person, End of 2014)

22 Shining Cities
Solar Leaders have between 25 and 50 watts of solar PV installed per person. These cities include Los Angeles, which leads the nation for total solar capacity, and smaller cities like Riverside and Burlington.
City State Total Solar PV In-stalled (MW-DC)
Total Solar PV Rank
Per Capita Solar PV Installed (Watts-DC/Person)
Per Capita Rank
Los Angeles CA 170 1 44 15
Las Vegas NV 24 15 40 16
Burlington VT 2 44 39 17
Providence RI 7 29 39 18
San Francisco CA 30 11 36 19
Riverside CA 11 23 35 20
Portland OR 21 18 34 21
The Solar Builders are those with between 5 and 25 watts of installed solar PV capacity per person. This diverse group of cities includes cities that have a history of solar energy leadership as well as cities that have only recently experienced significant solar energy development.
City State Total Solar PV
Installed (MW-DC)Total Solar
PV RankPer Capita Solar PV
Installed (Watts-DC/Person)Per Capita
Rank
Kansas City MO 11 22 24.6 22
Austin TX 21 17 24 23
Boston MA 13 20 20 24
St. Louis MO 6 30 19 25
Hartford CT 2 42 18 26
Jacksonville FL 14 19 17 27
Cincinnati OH 5 35 17 28
Tampa FL 5 31 15 29
Washington DC 9 25 14 30
Buffalo NY 3 38 12 31
Seattle WA 8 27 12 32
Orlando FL 3 40 10 33
Manchester* NH 1 50 9 34
Baltimore MD 5 34 8 35
Nashville TN 5 33 8 36
Portland ME < 1 57 7 37
Richmond VA 1 47 7 38
Atlanta GA 3 39 6 39
Minneapolis* MN 2 41 6 40
Philadelphia PA 9 26 6 41
Charlotte NC 5 36 6 42
Memphis TN 4 37 6 43
Table 4: The “Solar Builders” (Cities with Less than 25 and 5 or More Watts of Solar PV Per Person, End of 2014)
Table 3: The “Solar Leaders” (Cities with Less than 50 and 25 or More Watts of Solar PV Per Person, End of 2014)
* City data through 2013 only. See Methodology.

America’s Top Solar Cities Are Building a Clean Energy Future 23
The Solar Beginners are cities with less than 5 watts of installed solar PV capacity per person. Many of these cities are just beginning to experience signifi-cant development of solar energy, while a few have
experienced little solar energy development at all. New York, with more people than many states, has a lower per-capita ranking, but has experienced sub-stantial growth in solar energy in recent years.
City State
Total Solar PV Installed (MW-
DC)
Total Solar PV
Rank
Per Capita Solar PV Installed (Watts-DC/
Person)Per Capita
Rank
New York NY 41 9 4.9 44
Chicago IL 12 21 4 45
Boise ID 1 52 4 46
Charleston WV < 1 62 3 47
Milwaukee WI 2 46 3 48
Columbia SC < 1 59 2 49
Houston TX 5 32 2 50
Columbus OH 2 43 2 51
Pittsburgh* PA 1 53 2 52
Detroit MI 1 48 2 53
Billings* MT < 1 61 2 54
Oklahoma City OK 1 49 2 55
Louisville KY 1 51 1 56
Des Moines IA < 1 60 1 57
Cleveland OH 1 55 1 58
Omaha NE 1 54 1 59
Dallas TX 2 45 1 60
Miami FL < 1 56 1 61
Virginia Beach VA < 1 58 1 62
Fargo ND < 1 65 1 63
Birmingham AL < 1 64 < 1 64
Anchorage AK < 1 63 < 1 65
Table 5: The “Solar Beginners” (Cities with Less than 5 Watts of Solar PV Per Person, End of 2014)
* City data through 2013 only. See Methodology.

24 Shining Cities
Cities Ranked by RegionWe ranked the cities by region to highlight the lead-ers from different parts of the United States. We used regional designations from the U.S. Census, group-ing some regions together for the purposes of our
comparisons.79 We compared cities in the following regions: Pacific, Mountain, East North Central and West North Central, East South Central and West South Central, South Atlantic, and Mid-Atlantic and New England.
Figure 3: Top Two U.S. Cities by Region for Installed Solar PV Capacity Per Person, End of 2014

America’s Top Solar Cities Are Building a Clean Energy Future 25
City State Region
Total Solar PV Installed
(MW-DC)
Regional Total Solar
PV Rank
Per Capita Solar PV Installed (Watts-
DC/Person)
Regional Per Capita
Rank
Newark NJNew England and Mid-Atlantic 22 2 78 1
Burlington VTNew England and Mid-Atlantic 2 8 39 2
Wilmington DE South Atlantic 7 4 101 1
Raleigh NC South Atlantic 27 1 62 2
Indianapolis IN
West North Central and East North Central 107 1 127 1
Kansas City MO
West North Central and East North Central 11 3 25 2
Honolulu HI Pacific 96 4 276 1
San Jose CA Pacific 105 3 110 2
Denver CO Mountain 58 2 89 1
Phoenix AZ Mountain 115 1 76 2
New Orleans LA
West South Central and East South Central 36 2 94 1
San Antonio TX
West South Central and East South Central 88 1 63 2
Table 6: Top Two U.S. Cities by Region by Per Capita Installed Solar PV Capacity, End of 2014

26 Shining Cities
In the Pacific region, Honolulu is a definitive leader, with 276 watts of solar PV capacity installed per per-son; that is about one average-sized residential solar PV installation per 18 residents of the city.80 San Jose and San Diego are ranked second and third in the
region for solar PV installed per person, with 110 watts of solar PV capacity installed per person. Los Angeles leads the region and the country in the total amount of solar PV capacity installed. (See Table 7.)
City State RegionTotal Solar PV
Installed (MW-DC)
Regional Total Solar
PV Rank
Per Capita Solar PV Installed (Watts-
DC/Person)
Regional Per Capita
Rank
Honolulu HI Pacific 96 4 276 1
San Jose CA Pacific 105 3 110 2
San Diego CA Pacific 149 2 110 3
Sacramento CA Pacific 25 6 53 4
Los Angeles CA Pacific 170 1 44 5
San Francisco CA Pacific 30 5 36 6
Riverside CA Pacific 11 8 35 7
Portland OR Pacific 21 7 34 8
Seattle WA Pacific 8 9 12 9
Anchorage AK Pacific < 1 10 < 1 10
Table 7: Cities in the Pacific Region Ranked for Solar PV Capacity Installed Per Person, End of 2014
Denver leads the Mountain region for the amount of solar PV capacity installed per person, equiva-lent to one residential solar PV system for every 56 people in the city.81 Phoenix and Salt Lake City
are ranked second and third in the region for solar PV installed per person. Phoenix leads the region for the total amount of solar PV capacity installed. (See Table 8.)
City State RegionTotal Solar PV
Installed (MW-DC)
Regional Total Solar
PV Rank
Per Capita Solar PV Installed (Watts-DC/
Person)
Regional Per Capita
Rank
Denver CO Mountain 58 2 89 1
Phoenix AZ Mountain 115 1 76 2
Salt Lake City UT Mountain 10 5 50 3
Albuquerque NM Mountain 28 3 50 4
Las Vegas NV Mountain 24 4 40 5
Boise ID Mountain 1 6 4 6
Billings* MT Mountain < 1 7 2 7
Table 8: Cities in the Mountain Region Ranked for Solar PV Capacity Installed Per Person, End of 2014
* City data through 2013 only. See Methodology.

America’s Top Solar Cities Are Building a Clean Energy Future 27
Indianapolis ranks first in the East and West North Central regions for the total amount of solar PV ca-pacity installed and the solar PV installed per person, equivalent to one residential solar PV system per 39
city residents.82 Kansas City and St. Louis, Mis-souri ranked second and third in the regions for the amount of solar PV installed per person. (See Table 9.)
New Orleans leads the East and West South Central regions for solar PV capacity installed per person, with the equivalent of one home solar PV system per
Table 9: Cities in the East and West North Central Regions Ranked for Solar PV Capacity Installed Per Person, End of 2014
City State Region
Total Solar PV Installed
(MW-DC)
Regional Total Solar
PV Rank
Per Capita Solar PV Installed (Watts-DC/
Person)
Regional Per Capita
Rank
Indianapolis IN East North Central 107 1 127 1
Kansas City MO West North Central 11 3 25 2
St. Louis MO West North Central 6 4 19 3
Cincinnati OH East North Central 5 5 17 4
Minneapolis* MN West North Central 2 6 6 5
Chicago IL East North Central 12 2 4 6
Milwaukee WI East North Central 2 8 3 7
Columbus OH East North Central 2 7 2 8
Detroit MI East North Central 1 9 2 9
Des Moines IA West North Central < 1 12 1 10
Cleveland OH East North Central 1 11 1 11
Omaha NE West North Central 1 10 1 12
Fargo ND West North Central < 1 13 1 13
* City data through 2013 only. See Methodology.
53 city residents.83 San Antonio is ranked second in the region for solar PV installed per capita and first in the region for total solar PV capacity installed. (See Table 10.)
City State Region
Total Solar PV Installed
(MW-DC)
Regional Total Solar
PV Rank
Per Capita Solar PV Installed (Watts-
DC/Person)
Regional Per Capita
Rank
New Orleans LA West South Central 36 2 94 1
San Antonio TX West South Central 88 1 63 2
Austin TX West South Central 21 3 24 3
Nashville TN East South Central 5 5 8 4
Memphis TN East South Central 4 6 6 5
Houston TX West South Central 5 4 2 6
Oklahoma City OK West South Central 1 8 2 7
Louisville KY East South Central 1 9 1 8
Dallas TX West South Central 2 7 1 9
Birmingham AL East South Central < 1 10 < 1 10
Table 10: Cities in the East and West South Central Regions Ranked for Solar PV Capacity Installed Per Person, End of 2014

28 Shining Cities
Wilmington, Delaware, leads the South Atlantic region for solar PV installed per person, with the equivalent of one home solar PV system per 50 resi-
dents. Raleigh, North Carolina, ranks second in the region for solar PV installed per person and first for total solar PV capacity installed. (See Table 11.)
Newark, New Jersey, is the leading city in the Mid-At-lantic and New England regions for solar PV installed per person, with the equivalent of one solar instal-lation per 64 residents. Burlington, Vermont, and
Table 11: Cities in the South Atlantic Region Ranked for Solar PV Capacity Installed Per Person, End of 2014
City State Region
Total Solar PV Installed
(MW-DC)
Regional Total Solar
PV Rank
Per Capita Solar PV Installed (Watts-DC/
Person)
Per Capita Rank
Wilmington DE South Atlantic 7 4 101 1
Raleigh NC South Atlantic 27 1 62 2
Jacksonville FL South Atlantic 14 2 17 3
Tampa FL South Atlantic 5 5 15 4
Washington DC South Atlantic 9 3 14 5
Orlando FL South Atlantic 3 9 10 6
Baltimore MD South Atlantic 5 6 8 7
Richmond VA South Atlantic 1 10 7 8
Atlanta GA South Atlantic 3 8 6 9
Charlotte NC South Atlantic 5 7 6 10
Charleston WV South Atlantic < 1 14 3 11
Columbia SC South Atlantic < 1 13 2 12
Miami FL South Atlantic < 1 11 1 13
Virginia Beach VA South Atlantic < 1 12 1 14
Providence, Rhode Island, rank second and third in the region for solar PV capacity installed per per-son. New York City leads the region for total solar PV capacity installed. (See Table 12.)
Table 12: Cities in the Mid-Atlantic and New England Regions Ranked for Solar PV Capacity Installed Per Person, End of 2014
City State Region
Total Solar PV Installed
(MW-DC)
Regional Total Solar
PV Rank
Per Capita Solar PV Installed (Watts-DC/
Person)
Regional Per Capita
Rank
Newark NJ Middle Atlantic 22 2 78 1
Burlington VT New England 2 8 39 2
Providence RI New England 7 5 39 3
Boston MA New England 13 3 20 4
Hartford CT New England 2 7 18 5
Buffalo NY Middle Atlantic 3 6 12 6
Manchester* NH New England 1 9 9 7
Portland ME New England < 1 11 7 8
Philadelphia PA Middle Atlantic 9 4 6 9
New York NY Middle Atlantic 41 1 5 10
Pittsburgh* PA Middle Atlantic 1 10 2 11
* City data through 2013 only. See Methodology.

America’s Top Solar Cities Are Building a Clean Energy Future 29
Many cities that are in the lead have strong goals for solar energy adoption, along with policies and programs that make solar power accessible and affordable to residents. Cities all have the potential to power themselves with solar energy – but those influenced by pro-solar state and city policies are moving most quickly toward a clean energy future.
Cities with Ambitious Solar Energy Goals and Pro-Solar Policies Are Creating a Clean Electric GridThose cities that have opened the door for solar en-ergy with the adoption of strong, smart public poli-cies are building the nation’s most successful solar markets. These are not necessarily the cities that receive the most sunlight. Cities seeing explosive growth in solar power are ones where homeown-ers are paid a fair price for the energy they supply to the grid, where installing solar panels is easy and hassle-free, where there are attractive options for solar financing, and where there has been a strong commitment to support solar energy development.
Top solar cities have followed a variety of paths in developing solar energy. In some cases, city gov-ernments have played an important role in jump-starting local solar growth by setting goals for installed solar capacity, implementing solar-friendly laws, and expediting zoning and permitting pro-cesses. Some cities with municipal utilities have had an even more direct influence on solar power adop-tion by establishing ambitious requirements for solar energy and implementing effective financial incentives. Some cities have taken steps to increase the use of solar energy on public facilities, while, in other cities, strong state policies are driving local solar power growth.
Cities can most effectively promote solar power when city, state and utility policies work together. The best policies facilitate the adoption of rooftop solar power in addition to larger solar installations.
This section will describe a few of the policies and practices that have encouraged solar power growth in leading solar cities.
Denver, Colorado: Reducing the Soft Costs of Solar EnergyDenver rapidly increased its solar energy capacity in 2014. It went from 24 MW as of December 2013 to 58 MW as of December 2014.84 This growth has been spurred, in part, by key city policies that expand on existing state-level policies to further reduce the costs of installing a solar energy system.
Colorado is well known for its strong, pro-solar policies. The state’s renewable electricity standard (RES) requires investor-owned utilities to generate or source 30 percent of their energy from renewable, or greenhouse gas-neutral, sources.85 Co-ops and large municipal utilities have a requirement of 10 percent by 2020.86 Residents and businesses with solar energy systems also benefit from strong interconnection and net-metering policies, allowing them to receive fair credit for excess energy they supply to the grid.87
To build on these policies and make solar energy an option for more people, the city of Denver has worked to educate the public about the benefits of solar energy and to streamline the permit and inspec-tion process for solar energy systems, reducing the “soft costs” associated with solar power (costs such as those associated with attracting customers, install-ing the systems, completing paperwork, and paying taxes and permitting fees).88 These soft costs can account for up to 64 percent of the total cost of an installed solar energy system. 89 Policies that work to reduce these costs, therefore, can play an important role in reducing the cost of solar energy.
While state law already limits the amount of money that can be charged for a solar energy permit to $500, Denver charges only $50 for its solar energy permits.90 In addition, many solar energy projects are eligible for a same-day permit review process,

30 Shining Cities
reducing the time customers and contractors must wait for construction approval. After the system has been installed, it must be inspected, and the city has also worked to streamline that process. Technologi-cal improvements in the way records are created and maintained, in addition to giving solar energy projects a priority in scheduling, have allowed the inspection process to move more quickly.91
Other city-level initiatives directly assist residents who want to invest in clean energy and cut their en-ergy costs. In 2011, with funding from the American Recovery and Reinvestment Act, the city and county of Denver created the Denver Energy Challenge.92 In addition to offering energy efficiency services, the program also helps customers apply for loans, rebates and credits should they decide to install a solar energy system. The program has worked with more than 8,600 Denver residents, achieving its goal of working with at least 6,000 homes and 1,200 busi-nesses several months ahead of schedule.93
Together, these policies encourage a strong solar energy industry by making solar energy more af-fordable and by giving residents and businesses the information they need to “go solar.”
Kansas City, Missouri: Financing Options Spur Solar Energy Adoption From the Kansas City Chiefs football stadium, where 308 solar panels are installed, to the many small residential systems around the city, Kansas City, Mis-souri, is paving the way for a solar future in the North Central United States.94
In 2008, Missouri established a renewable electric-ity standard that required investor-owned utilities to create solar energy rebate programs for their cus-tomers.95 For Kansas City residents and businesses interested in installing solar PV systems, this program (offered by the local utility Kansas City Power & Light) reduces the up-front costs of solar PV systems by
offering rebates valued at $2.00/watt in 2013 and winding down to $0.25/watt for applications received in 2019.96 Projects in the rebate program must also be net-metered, allowing system owners to receive a fair price for excess energy they provide to the grid. This rebate program makes solar PV more affordable in Kansas City and provides even those residents with-out solar PV systems with a cleaner electricity grid.
The success of the rebate program in bringing costs down for Kansas City homes and businesses led pro-ponents of solar energy to look toward other ways of encouraging the industry. In 2011, the Mid-America Regional Council (MARC), based in Kansas City, and other regional partners received a $450,000 Depart-ment of Energy SunShot Initiative grant to start the Solar Ready KC program. This program sought to streamline the permitting process, increase access to financing, and update zoning and planning codes for solar PV systems. In 2013, MARC and its partners received another $2.6 million from the SunShot Initiative to continue the work of Solar Ready KC in reducing the soft costs associated with solar energy. Solar Ready II is taking the best practices and lessons learned from the Solar Ready KC initiative and apply-ing them to nine other Regional Planning Commis-sions across the country.97
In addition to the these successful policies, com-mercial and industrial properties in Kansas City have access to Property Assessed Clean Energy (PACE) financing, which allows property owners to borrow money from a specially created fund for clean energy projects.98 The loan is paid off on property tax bills over a number of years, assuring future repayment of the loan even if the property changes hands.99 PACE programs can be established and run directly by a local government, or sponsored locally and administered by an outside third-party organization. This program is just kicking off in Kansas City; the first PACE loan in the city was granted in November 2014.100

America’s Top Solar Cities Are Building a Clean Energy Future 31
Meeting the country’s true clean energy potential will require making solar PV systems more
accessible to residents of all income levels in our nation’s cities. According to the U.S. Census Bureau, 19.1 percent of people in cities lived below the poverty line in 2013 and, even for many residents above the poverty line, the up-front costs of buying a solar PV system are formidable.101 Cities and groups across the nation have been implementing innovative financing and installation options that reduce the up-front costs for low-income populations and make solar energy an option for more people.
GRID Alternatives, an organization that first began in California but now works nationally, is one example of success. The group uses public rebates, incentives, donations and public grants to install solar electric sys-tems at little or no cost to qualified low-income house-holds. In addition to using rebates and incentives to buy the systems, the program cuts costs on installation by using a “barn-raising” model – volunteers and job trainees install the solar panels, providing members of the community with experience they can use to find a job in the solar energy sector. In the past ten years, the program has installed 14 MW of solar PV capacity nationally, from California to Colorado to New York. In fall 2014, the program expanded to the South-Atlantic region as well, and will be serving Washington, D.C., Maryland, Delaware and Virginia.102
Baltimore, Maryland, is one city looking to take ad-vantage of GRID Alternatives model. In this city, 33 percent of the population makes under $25,000 per year, making programs that lower the up-front costs of solar power an important city offering. Baltimore’s solar energy advocates have been experimenting with ways to make solar energy more accessible to urban residents.103 Several non-profit groups, includ-ing Maryland SUN, Community Power Network and Interfaith Power, have launched residential purchas-ing groups that allow members to get discounts on solar energy system installations by buying them all at once.104 GRID Alternatives will be able to provide
solar energy systems at little to no cost, thereby giving another option to groups unable to afford systems in the bulk purchasing co-ops.105 Even for those residents who choose not to install a system, GRID Alternatives pro-vides a great opportunity for green jobs training in a city that averaged 8.6 percent unemployment in 2014.106 As of the end of 2014, Baltimore has installed 5 MW of solar PV capacity, ranking it 6th in the South Atlantic region for total installed capacity and 34th nationally. Programs that make solar power more accessible to the broader com-munity will help build the city’s solar industry.
Third-party financing models have also taken off across the country and lower the up-front costs of solar instal-lations. These usually take one of three forms: power purchase agreements (PPAs), solar leasing agreements, or solar loan programs.107 Under a PPA, a household or business can host a solar energy system, at no cost, paid for by an outside installer or developer. The power generated is then sold back to the host customer at a fixed rate, often lower than the local price of electricity from the grid.108 Under a solar leasing agreement, the host customer may pay some, or none, of the installation costs, along with a set amount monthly for use of the system instead of the power generated.109 Solar-specific loan programs have become particularly popular since 2013.110 Rapid growth in the solar energy market, com-bined with the falling costs of systems, has made solar-specific loans a more attractive option to both lenders and borrowers.111 Loan programs offer residents and businesses the benefits of ownership and full tax incen-tives, without the costs of buying the system upfront.
These three models give low-income communities that want to see the environmental and financial benefits of solar energy, but are deterred by the up-front costs of buying a system, more opportunities to “go solar.” Cities across the country are offering financing options and rebate programs that extend the reach of solar energy. As demand for solar energy continues to increase, costs will drop further and our nation’s cities will move closer to building self-sustaining solar markets.
Creative Programs and Third-Party Financing Extend the Reach of Solar Energy

32 Shining Cities
Las Vegas, Nevada: Leading by Example to Prepare for a Warmer Future Las Vegas, a city with more than 600,000 residents located in the Mojave Desert, is familiar with warm weather.112 But, recently, these high temperatures have become even more extreme. In 2014, Las Vegas experienced its warmest year on record.113 Scien-tists predict that these trends will become the new normal as global warming progresses, projecting more frequent drought and longer heat waves.114 As temperatures increase, so does electricity use, plac-ing more pressure on the city’s electricity grid and increasing electricity production.115
Faced with a future of higher temperatures, city of-ficials in Las Vegas put policies in place that would create a more sustainable electric grid that sources power from the sun.
City officials began by setting goals. In 2008, Las Vegas acknowledged the threats that it faces, and declared it was “no longer acceptable to allocate public resources based solely on financial analysis, but rather that decisions on energy projects, poli-cies and programs must also take into consideration environmental health, economic strength, and social well-being.”116 The city announced the implementa-tion of a “Sustainable Energy Strategy” that would seek to, among other things, reduce the city’s elec-tricity consumption by 5 percent, install 7 megawatts of renewable energy capacity by 2015, and acquire 30 percent of its electricity from renewable sources by 2030.117
The city is leading by example, having completed a number of solar installations on city facilities. As of November 2014, there were 6 megawatts (MW) of so-lar energy capacity installed on municipal facilities.118 The city’s wastewater treatment facility has installed solar panels with 3.3 MW of capacity, which helps to offset 20 percent of the plant’s energy use, according to the city.119
The city also put policies in place to make solar en-ergy adoption easier and more affordable. Las Vegas
utilizes an expedited permit process that reduces waiting time; the process helps officials recognize solar PV installations that only require a basic review and expedite them.120 Solar Generations, a solar en-ergy program offered by NV Energy (the local utility) and regulated by the Public Utilities Commission of Nevada, seeks to expand the number of solar dis-tributed generation systems in Nevada by providing incentives for installing solar energy systems. Nevada residents and business owners who install a solar en-ergy system also benefit from net metering policies, allowing them to receive credit for the excess energy they provide to the grid.121
By the end of 2014, the greater Las Vegas area (in-cluding communities outside of the city limits) had installed more than 32 MW of solar power.122 The city of Las Vegas itself ranks 15th nationwide for total installed solar PV capacity and 16th for solar capacity installed per person. As Las Vegas brings more solar energy online, the city is building a thriving solar energy industry that will prepare its residents and businesses for a warming world, while creating more jobs and cutting costs in the future.
New York City, New York: Allowing Urban Residents to Benefit from Solar Power Through Community Solar ProgramsIn 2012, Governor Andrew Cuomo announced the creation of the NY-SUN Initiative, a program that would work to double the amount of customer-sited solar energy capacity installed in the state annually.123 In 2014, after two years of strong program participa-tion resulting in the successful installation of over 300 MW, the administration extended the program and set a new goal of installing 3,000 MW by 2023.124
New York City has benefited a great deal from this initiative. The city ranks ninth in our report for cumu-lative solar PV installed, with 41 MW of solar power within the city limits. New York City partnered with Con Edison, its local IOU, to connect solar power to the city grid and created designated “Solar Empower-

America’s Top Solar Cities Are Building a Clean Energy Future 33
As solar power comes to supply an increasing share of the nation’s energy, the United
States will need to transition from a power grid reliant on large, centralized power plants to a “smart” grid where electricity is produced at thousands of locations and shared across an increasingly nimble, sophisticated, and versatile infrastructure. In order to begin planning for that future, states should develop policies that support the expansion of energy storage technologies that can help manage demand and avoid power outages.130
The effects of climate change are pushing cities and states to set ambitious renewable energy standards, and to modernize their grids to better protect them from a future of unpredictable weather patterns. In this effort, the procure-ment of energy storage becomes more impor-tant than ever. In October 2014, the New Jersey Board of Public Utilities announced that it was seeking bids from contractors for investing $3 million in grid-connected energy storage.131 The “request for quotation” (RFQ), which specifically cites Hurricane Sandy as a motivator for building a stronger grid, also requires that the storage be connected to a renewable energy source. On the West Coast, Southern California Edison is using energy storage to displace aging power infrastructure that would be costly to replace.132 The utility, serving vast swaths of southern Cali-fornia between San Diego and Santa Barbara, announced it would buy 250 MW of energy stor-age to provide the capacity lost by the closure of the San Onofre nuclear power plant.133
While the choice to install more storage is becom-ing more common for utilities or large commer-cial operations, residential energy storage is just beginning to gain traction as rebate programs become more common. Developments in battery technology and increases in global demand, in large part driven by the recent rise in consumer de-mand for electric vehicles, have reduced the price of lithium-ion batteries by 40 percent since 2010, but for many Americans, the need for a stand-alone stationary storage system does not justify the cost.134 Germany has been offering rebates to residents who install solar energy storage and, according to a report by BSW-Solar, the German Solar Industries Association, approximately 15,000 German residents were using battery storage plus solar power by the end of 2014. Forward-thinking utilities in the United States, projecting a change in the energy services demanded and increased costs, are implementing battery rebate systems as well. Con Edison, the utility serving New York City, is offering rebates of $600/kW for battery storage projects completed by June 1, 2016.135
While not all energy storage systems will be immediately used for solar energy, putting the infrastructure into place is a good first step. As solar panel prices continue to drop and pro-solar public policies allow more Americans to opt in to solar energy systems, the nation will produce more and more of its energy from the sun. Energy storage systems, both stationary and mobile, will allow solar energy growth to continue, and will also help us avert the expense of reinvesting in outdated and dirty power generating technology.
Integrating More Solar Energy into the Grid: Developing Energy Storage

34 Shining Cities
ment Zones,” which are geographic regions in the city identified to be ideal for solar power production and where solar projects are eligible for additional solar incentives.125 For many New Yorkers, however, solar power remains out of reach, no matter how affordable it becomes, because they rent, have no control over their roof space, or have shaded roofs that are not able to facilitate a solar energy system.
In his 2015 Opportunity Agenda, Governor Cuomo addressed these barriers by calling for a new cam-paign to implement “Shared Solar” policies in New York. The program would extend the benefits of solar power to more people, according to the plan: “Whether or not they own a suitable rooftop them-selves, interested New Yorkers would be able to sub-scribe to a local solar energy project and get credit on their utility bills for their portion of the clean power produced.” 126 By revising the state’s current net metering policies to make it possible for mul-tiple people to benefit from the same solar energy system, New York City would be able to dramatically increase the amount of energy it sources from the sun.
Shared solar, also known as community net meter-ing, has proven to be a successful model in other cities around the country. Washington D.C., for example, passed the Community Renewable Energy Act in 2013 in order to help achieve the require-ments of its renewable electricity standard.127 The act allows residents to buy ownership in local com-munity solar projects and receive credit on their utility bills for the power produced by their shares.128 Innovative policies such as these will allow cities to become more active participants in the solar energy revolution, providing benefits to the cities and their residents.
By the end of 2014, the greater New York area (in-cluding communities outside of the city limits) had installed more than 58 MW of solar power.129 New York City itself ranks 9th nationwide for total installed solar PV capacity and 1st in the New England and Mid-Atlantic regions.
Indianapolis, Indiana: New Policies May Threaten the City’s Role as a Solar LeaderIn 2012, Indiana had only a little over 4 MW of solar capacity installed in the entire state—1/600th the amount installed in California and only about 2 per-cent as much as was installed in Massachusetts.136 But Indianapolis Power & Light’s feed-in tariff program changed the picture for solar energy in Indianapolis.
In 2010, Indianapolis Power and Light (IP&L) took the first step toward diversifying its energy sources, which largely consisted of coal at the time, by insti-tuting a voluntary feed-in tariff (FiT) program.137 This program pays solar power producers fixed, above-market rates for solar power generated. Once this program was running, Indianapolis became an attrac-tive place for solar developers to generate power.
In 2013, the first 12 MW of a solar farm were activated at the Indianapolis airport and three utility-scale installations came online, with the power sold to IP&L.138 At the end of 2014, the second installation at the Indianapolis airport was completed – adding 76,000 more solar panels with enough capacity to power more than 1,410 average American homes.139 This project, in addition to other systems, brought Indianapolis to 107 MW of installed solar PV capac-ity at the end of 2014, the 4th highest-ranked city for total solar PV capacity in the nation and second in the country for solar PV capacity installed per resident.
While Indianapolis has seen rapid growth in solar energy, several recent legislative actions may put that growth in danger. IP&L’s FiT was discontinued in March 2013, which may mean slower solar power growth going forward.140 Another bill, HB 1320, introduced in February 2015, would cut the amount of money solar generators receive for the excess energy they provide to the grid, while simultaneously allowing utilities to charge a user fee for households and businesses that install solar energy systems.141 While IP&L continues to offer net metering to qualifying customers, the utility’s small-scale solar PV incentive program that provided rebates for qualifying residential solar installations

America’s Top Solar Cities Are Building a Clean Energy Future 35
expired at the end of 2014.142 The large solar projects in Indianapolis have reduced reliance on polluting coal-fired power plants and created jobs through construc-tion of these facilities.143 But, in order for the city to reap the full benefits of solar energy adoption, local officials must adopt policies that encourage customers to put solar installations on their rooftops and create a
market for distributed energy. So far, 13 solar projects over 1 MW in size account for 97 percent of Indianapo-lis’ installed solar capacity.144 Ending the policies that have created a solar boom in the city and failing to promote small-scale solar projects would reverse years of progress, threatening Indianapolis’ air and a thriving new sector of the economy.
The growth of solar power is empowering residents and businesses to look beyond the
dirty energy alternatives of the past. Yet as more and more people generate their own electricity, solar energy is threatening the traditional busi-ness model of electric utilities.145 Some utilities have begun to introduce user demand fees and to attack net metering policies designed to help solar power generators recoup the cost of their solar installations.
Net metering is an essential policy for encourag-ing distributed solar power on residential roof-tops in those cities with established solar energy markets and particularly in cities that are only just beginning to develop solar energy.
In Colorado, a battle over net metering with the utility Xcel Energy began in 2013. The state has a wide array of policies that have been known to encourage solar energy, including multiple financ-ing options, rebate programs, permitting stan-dards, and net metering.146 Xcel Energy, however, wants to cut the net metering credit solar gen-erators receive on their utility bills for the power they supply to the grid.147 The utility offered two proposals – one that would cut the net metering rate by 50 percent, and one that would cut the rate by 45 percent.148 These cuts would drastically reduce the amount of money solar energy sys-tem owners receive, making it harder to pay back
Challenges to Solar Energy Growth: Net Metering Battles and Increasing User Demand Fees
the up-front costs of the system and reversing the progress the state has made in building up its clean energy resources.
In addition to weakening net metering policies, some utilities are imposing extra fees on solar energy cus-tomers. In Wisconsin, a state just beginning to build up solar energy capacity, the utility We Energies is pushing for a series of policies that would ban third-party ownership of wind and solar energy systems, reduce payments to net metering customers by 78 percent (from 14 cents per kilowatt-hour (kWh) to 3 cents/kWh), and charge solar energy system owners demand fees of $3.80/kW per month.149 In Arizona, the Salt River Project (one of the state’s largest utili-ties) approved a fee on all solar customers, which will average around $50 per month.150 According to SolarCity, a solar panel installer that filed a lawsuit in response, applications for installations dropped 96 percent after the new rates were announced.151 These policies will take away the ability of solar energy customers to recoup the cost of installing their solar energy systems and get credit for the excess energy they provide to the grid.152
Utility attacks on strong net metering policies and efforts to impose extra fees on solar energy gen-erators will only unfairly prevent otherwise eager residents from taking part in the solar energy revo-lution and bringing the benefits of clean energy to their communities.

36 Shining Cities
Policy Recommendations
U.S. cities, as centers of population growth and energy consumption, must lead the way in building a grid powered by more solar en-
ergy. Many cities have already experienced the havoc that a future fraught with severe weather, drought, increased precipitation and intense heat waves can cause, particularly on cities’ power grids. Building so-lar energy capacity, encouraging innovation in battery storage, “smart” grid development and micro-grid technology will be critical tools for creating the clean electricity grids of the future.
Research shows that solar energy policies – far more than the availability of sunshine – dictate which states have successful solar industries and which ones do not.153 The most effective policies facilitate the wide-scale adoption of small-scale solar energy systems on homes, businesses, and other institutions while also speeding up solar energy development across the country with large solar projects. Policy-makers at every level of government – federal, state and lo-cal – have an important role to play in making a solar energy future for American cities a reality.
Strong and thoughtful federal policies can promote solar power, make it more accessible, and lay an important foundation on which state and local policy initiatives can be built. Among the key policy ap-proaches that the federal government should take are the following:
• Extend tax credits for solar energy – The federal government has often taken an “on-again/off-again” approach to its support of renew-
able energy. With a key financial incentive for solar energy – federal tax credits for residential and business solar installations – now sched-uled to expire at the end of 2016, the federal government should extend these incentives and consider making them permanent with the value phasing down over time as solar energy capacity expands.154 Non-profit organizations, low-income households and local governments that are not eligible for tax credits should have access to grants and similar benefits.
• Support research to drive solar power innovations – The U.S. Department of Energy’s SunShot Initiative has served as a rallying point for federal efforts to encourage the expansion of solar energy.155 By continuing to investigate how to best integrate solar energy into the grid, how to deliver solar energy more efficiently and cost-effectively, and how to lower market barriers to solar energy, the SunShot Initiative and other efforts play a key supporting role in the nation’s drive to embrace the promise of solar energy. The federal govern-ment should invest in research and development of solar energy storage to expand the integration of renewable energy into the grid, and to strength-en cities’ electric grids in the face of extreme weather.
• Lead by example – In his June 2013 speech on global warming, President Obama committed to obtaining 20 percent of the federal govern-ment’s electricity from renewable sources within the next seven years.156
Solar energy will likely be
Policy Recommendations 37
a major contributor to reaching that goal. The federal government consumes vast amounts of energy and manages thousands of buildings. If the government put solar installations on every possible rooftop, it would set a strong example for what can be done to harness the limitless and pollution-free energy of the sun. The U.S. military has committed to getting one-quarter of its energy from renewable sources by 2025 and has already installed more than 130 megawatts of solar energy capacity.157 Federal agencies should contin-ue to invest in solar energy, and agencies such as the Department of Housing and Urban Develop-ment and Department of Education should work to expand access to solar energy for schools and in subsidized housing through system installations or community solar projects. Programs designed to provide fuel assistance to low-income customers, such as the Low Income Home Energy Assistance Program (LIHEAP), should be expanded to include solar energy as an energy and cost saving option. In addition, the federal government should contin-ue to work for environmentally responsible expan-sion of solar energy on federal lands.
• Finalize and strengthen the requirements of the Clean Power Plan – The federal government should adopt a strong Clean Power Plan to reduce global warming emissions by at least 30 percent below 2005 levels by 2030. Renewable energy can play the dominant role in helping the United States achieve these pollution reductions.
State governments should set high goals for solar energy adoption, implement net metering policies that allow residents to realize the full benefits of solar power, and use public policies to incentivize contin-ued innovation and growth in the solar industry.
• Set mandatory renewable energy standards with a strong solar carve-out – States should adopt renewable energy standards with solar carve-outs that require a significant and growing share of that state’s electricity to come from the sun. State
governments should lead the way toward meeting these goals by installing solar power on all avail-able government buildings.
• Adopt and preserve strong statewide intercon-nection and net metering policies – These critical policies ensure that individuals and businesses are appropriately compensated for the electricity that they export to the grid, and allow them to move seamlessly between producing their own electric-ity and using electricity from the grid. In states without strong net metering programs, carefully implemented CLEAN contracts (also known as feed-in tariffs) and value-of-solar payments can play an important role in ensuring that consumers receive a fair price for solar energy, so long as the payments fully account for the benefits of solar energy and are sufficient to spur participation in the market. Policies such as virtual or aggregate net metering or shared solar allow the solar market to expand to low-income households, renters, and apartment dwellers and allow community financ-ing and ownership of solar.
• Reform Public Utilities Commissions – Provide utility regulators with guidance on valuing the ratepayer and societal benefits of solar and other distributed energy resources, and require them to consider those benefits in their ratemaking proceedings.
• Establish public benefits charges on utility bills, or other sustainable financing mechanisms, to fund solar energy for low income households, non-profits, small businesses, and local municipali-ties to ensure that all categories of customers have access to the benefits of solar power.
• Enable third-party sales of electricity – Financing rooftop solar energy systems through third-party electricity sales significantly lowers the up-front cost of installing solar PV systems for commercial consumers. The state should allow companies that install solar panels to sell electricity to their customers without subjecting them to the same regulations as large public utilities.

38 Shining Cities
• Implement policies that support energy storage, electric vehicle smart charging and microgrids – As solar power comes to supply an increasing share of the nation’s energy, state governments will need to be at the forefront of designing policies that transition the nation from a power grid reliant on large, centralized power plants to a “smart” grid where electricity is produced at thousands of locations and shared across an increasingly nimble and sophisticated infrastructure. In order to begin planning for that future, states should develop policies that support the expansion of energy storage technologies, electric vehicle smart charging networks and microgrids, including those offered by third parties.158
• Adopt the goals of the Clean Power Plan – States should set effective plans for meeting or surpass-ing the goals of the federal Clean Power Plan, with clean and renewable sources of energy such as solar playing a leading role.
Local governments should adopt strong solar goals, enact local initiatives to help make solar power avail-able to all residents and eliminate red tape that makes solar power more expensive and less accessible to customers.
• Implement solar access ordinances – These critical protections guard homeowners’ right to gener-ate electricity from the sunlight that hits their property, regardless of the actions of neighbors or homeowners’ associations. Local governments should also offer clear zoning regulations that allow solar energy installations on residential and commercial rooftops, which will help unlock new solar markets in communities.159 The Delaware Valley Regional Planning Commission offers a model ordinance guide that cities can apply to their own local laws.160
• Eliminate red tape by reforming permitting processes – Reducing fees, making permitting rules clear and readily available, speeding up the permitting
process, and making inspections convenient for property owners can help residents “go solar.”161 The Department of Energy’s SunShot Initiative helps cities to fund programs that work toward this goal, and The Vote Solar Initiative has laid out a series of best practices that local governments can follow to ensure that their permitting process is solar-friendly.162
• Expand access to solar energy – “Solarize” programs and community solar programs have been successful at lowering the cost of solar energy systems for communities, and allowing more people to receive the benefits of solar energy.163 Solarize programs, like that in Portland, Oregon, allow communities to bulk purchase solar energy systems in order to receive volume discounts.164 In Washington, D.C., local officials passed a commu-nity solar act in 2013 that allows residents to buy ownership of off-site panels and receive credit for the solar energy produced on their electricity bills.165
• Help reduce the cost of solar power – Cities can also provide financial or zoning incentives to encour-age the construction of green buildings that incor-porate small-scale renewable energy technologies such as solar power. Solar ready construction and building guidelines (or in a few cases solar mandates) can also reduce the cost of solar and encourage solar development in new construction.
• Install solar panels on public buildings – Local governments can promote clean energy, boost their local solar energy markets, and cut air pollu-tion by installing solar panels and signing solar PPAs for public buildings like public schools and municipal offices. According to a report from The Solar Foundation for the U.S. Department of Energy, schools across the country have 3,727 PV systems installed that currently host 490 MW of solar capac-ity.166 Not only do these panels save money on electricity bills, they also serve as a public example of a smart, clean-energy investment.

Methodology 39
Methodology
There is no uniform national data source that tracks solar energy by municipality and there are only a handful of states that compile
this information in a comparable format. As a result, the data for this report come from a wide variety of sources – municipal and investor-owned utilities, city and state government agencies, operators of regional electric grids and non-profit organizations. These data sources have varying levels of comprehensive-ness, with varying levels of geographic precision, and often use different methods of quantifying solar photovoltaic capacity (e.g. alternating current (AC) versus direct current (DC) capacity).
We have worked to obtain data that are as com-prehensive as possible, to resolve discrepancies in various methods of estimating solar PV capacity, to limit the solar facilities included to only those within the city limits of the municipalities studied, and, where precise geographic information could not be obtained, to use reasonable methods to estimate the proportion of a given area’s solar energy capac-ity that exists within a particular city. The data are sufficiently accurate to provide an overall picture of a city’s adoption of solar power and to enable compari-sons with its peers. Readers should note, however, that the data-related challenges described here could have minor impacts on individual cities’ rankings. We look forward to building on and further developing
our methodology and data sources in future reports and encourage other researchers to do the same. The full list of sources of data for each city is provided in Appendix B along with the details of any data ma-nipulations made.
Readers should also be aware that we were able to obtain more specific and reliable data this year than we were able to find for the first edition of Shining Cities, released in 2014. In Appendix B, we noted the cases in which it is unreliable to compare city data between this report and the first edition.
Selecting the CitiesThe list of cities to be surveyed started with the pri-mary cities in the top 50 most populous Metropolitan Statistical Areas in the United States, according to the U.S. Census Bureau’s 2013 American Community Survey 1-Year Estimates. If a state did not have a city included in that list, its largest city – according to the U.S. Census Bureau’s 2011-2013 American Community Survey 3-Year Estimates – was added to the list to be surveyed. For a complete list of cities, see Appendix A. If we were unable to find reliable data for a city, we dropped it from our list. Cities for which we were unable to find reliable data are: Cheyenne, Wyoming; Little Rock, Arkansas; Jackson, Mississippi; Sioux Falls, South Dakota; and Wichita, Kansas.

40 Shining Cities
Collecting Data on Installed Solar PV CapacityThis report compares the capacity of all solar PV installations within the city limits of the chosen 64 cities as of the end of 2014. See Appendix B for a detailed account of the sources of data for each city, which vary between cities.
Converting from AC watts to DC wattsJurisdictions and agencies often use different meth-ods of quantifying solar photovoltaic capacity (e.g. alternating current (AC) and direct current (DC)). Solar PV panels produce energy in DC, which is then con-verted to AC in order to enter the electric grid. Solar capacity reported in AC watts accounts for the loss of energy that occurs when DC is converted to AC.167
We attempted to convert all data to DC watts for the sake of accurate comparison. When we could not de-termine whether the data were reported in AC watts or DC watts, we made the conservative estimate that the data were in DC watts.
To convert the numbers from AC to DC megawatts (MW), we used NREL’s PV watts default derate factor of 0.77. See NREL’s website for a detailed explanation of this conversion factor: http://rredc.nrel.gov/solar/calculators/pvWatts/system.html.
Converting Data on Solar PV Capacity by Zip Code into Estimates of Solar PV Capacity Within City LimitsIn some cases, we were unable to locate data on solar PV capacity delimited by the city limits, but we were able to find data on solar PV capacity installed in zip codes in and around the city in question. Zip codes do not necessarily confirm to city boundaries; in many cases, a zip code will fall partially inside and partially outside of a city’s boundaries. In these cases, we used ArcMap to determine which zip codes were centered within the city limits; it was those zip codes for which we included their corresponding solar PV capacity in the city’s total.
We used the “Zip Code Points” layer in ArcMap to produce a map of zip codes in the U.S. as points. These points mark the center of a zip code area, or for Post Office Box Zip Codes or Residential Post Offices with no delivery area, as single points at a building or organization.168 We overlaid this zip code layer with a map of “USA Census Populated Places Areas,” which includes the boundaries of the cities that we included in our report. We applied a “spatial join” to link the zip code points with the city in which they fall. This provided us with a list of zip codes centered in the city limits, which we used to select the zip codes that we should include in our definition of each city.

Appendices 41
Appendix A: Solar Energy in Major U.S. Cities
Table A-1: Installed Cumulative Solar PV Capacity by City, End of 2014 (Ranked Alphabetically)
Continued on page 42
City State Region
Total Solar PV Installed
(MW-DC)
Total Solar PV
Rank
Per Capita Solar PV Installed
(Watts-DC/Person)
Per Capita Rank
Albuquerque NM Mountain 28 12 50 14
Anchorage AK Pacific < 1 63 < 1 65
Atlanta GA South Atlantic 3 39 6 39
Austin TX West South Central 21 17 24 23
Baltimore MD South Atlantic 5 34 8 35
Billings* MT Mountain < 1 61 2 54
Birmingham AL East South Central < 1 64 < 1 64
Boise ID Mountain 1 52 4 46
Boston MA New England 13 20 20 24
Buffalo NY Middle Atlantic 3 38 12 31
Burlington VT New England 2 44 39 17
Charleston WV South Atlantic < 1 62 3 47
Charlotte NC South Atlantic 5 36 6 42
Chicago IL East North Central 12 21 4 45
Cincinnati OH East North Central 5 35 17 28
Cleveland OH East North Central 1 55 1 58
Columbia SC South Atlantic < 1 59 2 49
Columbus OH East North Central 2 43 2 51
Dallas TX West South Central 2 45 1 60
Denver CO Mountain 58 8 89 7
Des Moines IA West North Central < 1 60 1 57
Detroit MI East North Central 1 48 2 53
Fargo ND West North Central < 1 65 1 63
Hartford CT New England 2 42 18 26
Honolulu HI Pacific 96 6 276 1
Houston TX West South Central 5 32 2 50
Indianapolis IN East North Central 107 4 127 2

42 Shining Cities
Continued from page 41
Jacksonville FL South Atlantic 14 19 17 27
Kansas City MO West North Central 11 22 25 22
Las Vegas NV Mountain 24 15 40 16
Los Angeles CA Pacific 170 1 44 15
Louisville KY East South Central 1 51 1 56
Manchester* NH New England 1 50 9 34
Memphis TN East South Central 4 37 6 43
Miami FL South Atlantic < 1 56 1 61
Milwaukee WI East North Central 2 46 3 48
Minneapolis* MN West North Central 2 41 6 40
Nashville TN East South Central 5 33 8 36
New Orleans LA West South Central 36 10 94 6
New York NY Middle Atlantic 41 9 5 44
Newark NJ Middle Atlantic 22 16 78 8
Oklahoma City OK West South Central 1 49 2 55
Omaha NE West North Central 1 54 1 59
Orlando FL South Atlantic 3 40 10 33
Philadelphia PA Middle Atlantic 9 26 6 41
Phoenix AZ Mountain 115 3 76 9
Pittsburgh* PA Middle Atlantic 1 53 2 52
Portland ME New England < 1 57 7 37
Portland OR Pacific 21 18 34 21
Providence RI New England 7 29 39 18
Raleigh NC South Atlantic 27 13 62 11
Richmond VA South Atlantic 1 47 7 38
Riverside CA Pacific 11 23 35 20
Sacramento CA Pacific 25 14 53 12
Salt Lake City UT Mountain 10 24 50 13
San Antonio TX West South Central 88 7 63 10
San Diego CA Pacific 149 2 110 4
San Francisco CA Pacific 30 11 36 19
San Jose CA Pacific 105 5 110 3
Seattle WA Pacific 8 27 12 32
St. Louis MO West North Central 6 30 19 25
Tampa FL South Atlantic 5 31 15 29
Virginia Beach VA South Atlantic < 1 58 1 62
Washington DC South Atlantic 9 25 14 30
Wilmington DE South Atlantic 7 28 101 5
* City data through 2013 only. See Methodology.
City State Region
Total Solar PV Installed
(MW-DC)
Total Solar PV
Rank
Per Capita Solar PV Installed
(Watts-DC/Person)
Per Capita Rank

Appendices 43
Appendix B: City-by-City Data Sources
In the descriptions below, we detail the sources of our solar PV capacity totals for each city. We note when the data were reported in AC watts
and converted to DC watts. Unless otherwise men-tioned, the data were either reported in DC watts, or we made the conservative assumption that the data were in DC watts.
Where we or our data source used zip codes, postal addresses or the city name to determine what amount of solar capacity fell within the city limits, the result may be a small overestimation or underestima-tion of the total solar capacity within the city limits. Estimates based on zip codes, postal addresses or the city name may contain a small number of instal-lations that are not within the city limits or miss some installations that are within the city limits.
Albuquerque, New MexicoThe Public Service Company of New Mexico (PNM), which serves the city of Albuquerque, provided us with an estimate of solar PV capacity in DC watts installed in the city limits as of December 31, 2014.169
Anchorage, AlaskaTwo electric utilities serving the city of Anchorage – Chugach Electric and Anchorage Municipal Power and Light – provided us with summary information on the solar PV capacity installed in the city limits as of December 31, 2014.170 These data were provided in AC watts and converted to DC watts.
Atlanta, GeorgiaSouthface (http://www.southface.org/) provided us with a list of solar PV installations in DeKalb and Fulton counties through December 31, 2014, with latitude and longitude information for each instal-lation.171 Southface maintains a map of “Geor-gia Energy Data” at www.georgiaenergydata.org/solarmap, which is believed to be the most comprehensive source of data on solar energy installations in the state of Georgia. These data are believed to be largely in DC watts, but some sources of data relied on by Southface did not specify whether capacity was in DC or AC watts. The information provided by Southface allowed us to map the solar PV installations using ArcMap, and isolate the capacity within the city limits of Atlanta.
Austin, TexasData were provided by zip code from Austin En-ergy in DC watts, as of December 31, 2014.172
Austin Energy, the municipal utility serving Austin, also generates solar power at a 30-MW solar facil-ity that exists partially in Austin’s “extraterritorial jurisdiction” (ETJ). Austin’s ETJ includes unincor-porated land within five miles of Austin’s city limits.173 Because this solar farm lies outside what are technically the city limits of Austin, we did not include it in Austin’s solar total.

44 Shining Cities
Baltimore, MarylandData on solar PV installed in the city of Baltimore was taken from the SREC registry PJM-GATS.174 These data only include solar PV installations that are registered in the system before December 31, 2014 and the capacity provided is in DC watts.
Billings, MontanaNorthwestern Energy, the utility serving Billings, provided the known amount of solar PV capacity in-stalled in Billings as of December 31, 2012 (0.191 MW), and an estimate of the solar PV capacity installed in Billings during 2013 (0.016 MW).175 No new informa-tion was available for 2014.176
Birmingham, AlabamaData were provided by Alabama Power, the electric utility serving the city of Birmingham, as of Decem-ber 31, 2014 in DC watts.177
Boise, IdahoData were provided by Idaho Power, the electric utility serving Boise, via the city of Boise.178 Data were provided in DC watts and current as of December 31, 2014.
Boston, MassachusettsData on solar PV installed in the city of Boston before 2010 were taken from NREL’s Open PV database.179 Data on solar PV installed in the city of Boston be-tween 2010 and December 31, 2014 were taken from two different spreadsheets maintained by the state of Massachusetts. The first spreadsheet, titled “Solar Carve-out Qualified Units,” contains solar PV instal-lations qualified for the RPS Class 1 solar carve-out program, and can be found at http://www.mass.gov/eea/energy-utilities-clean-tech/renewable-energy/solar/rps-solar-carve-out/current-status-of-the-rps-solar-carve-out-program.html. These installations are those installed in the city of Boston with a Com-mercial Operation Date by December 31, 2014, and the capacity is measured in DC watts with the Name-
plate rating. The second spreadsheet contains solar PV installations qualified for the Solar Carve-Out II program. The spreadsheet is titled “Solar Carve-Out II Qualified Units,” and can be found at http://www.mass.gov/eea/energy-utilities-clean-tech/renewable-energy/solar/rps-solar-carve-out-2/current-statis-solar-carve-out-ii.html. These installations are those installed in Boston with a Commercial Operation Date by December 31, 2014, and the capacity is measured in DC watts.
Buffalo, New YorkData on solar PV installed in the city of Buffalo was taken from the Open NY Database titled “Solar Photovoltaic (PV) Incentive Program: Beginning 2003,” which can be found at data.ny.gov/Energy-Environment/Solar-Photovoltaic-PV-Incentive-Program-Beginning-/3x8r-34rs. These data include solar PV installations registered in the system before December 31, 2014 located in Buffalo city, and are in DC watts with the Nameplate rating.
Burlington, VermontData were obtained from the Vermont Energy Atlas (http://www.vtenergyatlas.com) a project of the Ver-mont Sustainable Jobs Fund, the Vermont Center for Geographic Information, Fountains Spatial and Overit Media. Data for the map are provided by the Vermont Clean Energy Development Fund, the Vermont Public Service Board and other sources. Installations were sorted by town name, and we totaled the installa-tions labeled with “Burlington.” The data were last updated January 12, 2015. A review of several of the installations found them to be reported in AC watts, so we assumed the total was in AC watts and con-verted it to DC watts.
Charleston, West VirginiaThe Appalachian Power Company provided an ag-gregate sum of solar PV capacity within a Charleston mailing address. These data were provided through January 12, 2015, so solar PV capacity installed in the first twelve days of 2015 may be included.

Appendices 45
Charlotte, North CarolinaSolar PV capacity within Charlotte was determined by identifying solar PV projects in North Carolina from the North Carolina Utilities Commission (NCUC) worksheet, “New Renewable Energy Facility Registra-tions Accepted by the North Carolina Utilities Com-mission, 2008-2013,” last updated September 2013.180 The NCUC docket for each registered solar PV instal-lation was then reviewed, using the NCUC’s electronic docket, to determine whether the location of the system was within the city of Charlotte.
Although we used the same methodology to calcu-late Charlotte’s total in our 2014 report, our solar PV capacity total for Charlotte is lower this year than last year. Last year, the NCUC docket for several of the projects referred to their capacity in terms of AC watts, and we therefore assumed that this held true for the other projects as well. This year, the docket for the new project in Charlotte did not designate whether the capacity was in AC or DC watts. We thus decided to use the conservative number, DC watts, which gave us a lower number than last year.
Chicago, IllinoisData were provided by ComEdison, the electric utility serving the city of Chicago, as of December 31, 2014 in DC watts.181
Cincinnati, OhioData were provided by Duke Energy, the electric utility serving the city of Cincinnati, as of December 31, 2014.182 These data were provided in AC watts and converted to DC watts. The estimate we used from Duke Energy in this edition of the report is not precisely comparable to the data used in last year’s report.
Cleveland, OhioThe Public Utilities Commission of Ohio provided us with a list of certified renewable energy installations, with city name information, updated as of December
31, 2014.183 We took the sum of the capacity of instal-lations listed with the city name “Cleveland.” Because this was a list of “certified” installations, this is pos-sibly an overestimate of installed solar PV capacity as of December 31, 2014; some installations may have completed the certification process but are not yet online.
Because we used city name to identify which instal-lations fell into Cleveland this year, the capacity total for the city is lower than the total we reported in the previous edition of this report, using a different methodology.
Columbia, South CarolinaSolar PV capacity within Columbia was provided to us in a spreadsheet compiled by the South Carolina Energy Office.184 The spreadsheet includes solar PV installations in the city limits as of December 31, 2014. The capacity was provided in AC watts and we con-verted it to DC watts.
Columbus, OhioThe Public Utilities Commission of Ohio provided us with a list of certified renewable energy installations, with city name information, updated as of December 31, 2014.185 We took the sum of the capacity of instal-lations listed with the city name “Columbus.” Because this was a list of “certified” installations, this is pos-sibly an overestimate of installed solar PV capacity as of December 31, 2014; some installations may have completed the certification process but are not yet online.
Because we used city name to identify which instal-lations fell into Columbus this year, the capacity total for the city is not comparable to the total we reported in the previous edition of this report, using a different methodology.
Dallas, TexasWe were unable to obtain a city-specific estimate of solar PV capacity in Dallas from Oncor Electric, the

46 Shining Cities
electric utility serving the city and administering the city’s solar incentive program.186 The Northern Texas Renewable Energy Group is working on a city analysis of solar installations, but their analysis does not lend itself to an estimate of solar capacity at this stage. We used an estimate of solar PV capacity from the National Renewable Energy Laboratory’s OpenPV Database.187
Denver, ColoradoData were provided by Xcel Energy, the electric utility serving the city, as of December 31, 2014. The city of Denver’s Office of Sustainability assisted us in finding the correct information.188 The capacity was provided in AC watts and converted to DC watts. The estimate we used from Xcel Energy in this edition of the report is not precisely comparable to the data used in last year’s report.
Des Moines, IowaData were provided by the city of Des Moines.189 Nine projects were reported between 2010 and 2014, but only three of those projects had capacity informa-tion. Data were reported in AC watts and converted to DC watts.
Detroit, MichiganDTE Energy Company provided us with the solar PV capacity within the city limits of Detroit as of De-cember 31, 2014.190 The capacity was provided in DC watts.
Fargo, North DakotaAn estimate of solar PV capacity in Fargo was pro-vided by the Cass County Electric Cooperative, which serves part of the city.191 We assumed that this capac-ity was in DC watts. Xcel Energy, which serves the other part of Fargo, did not have any known solar PV capacity to report.192
Hartford, ConnecticutThis total is the sum of the solar PV capacities of solar facilities listed as approved under Connecticut’s Renewable Portfolio Standard, based on a worksheet obtained from the Connecticut Public Utilities Regu-latory Authority (PURA) labeled “RPS,” obtained from http://www.ct.gov/pura/lib/pura/rps/rps.xls, and last updated on 12 November 2014.
Honolulu, HawaiiWe estimated the amount of solar PV capacity in urban Honolulu from county-level data released by Hawaiian Electric, the company serving the county of Honolulu (which is coterminous with the island of Oahu).193 Within the island of Oahu, the census desig-nated place “urban Honolulu” is the place most com-parable with other U.S. cities.194 Data that would allow for more precise identification of PV facilities within urban Honolulu were requested from the Hawaii State Energy Office, but they could not provide data more geographically specific than the county level.
We used the total capacity of solar PV installations within Honolulu County to estimate what percent of this capacity would fall in urban Honolulu.195
Solar PV Capacity in urban Honolulu Esti-mate (MW) = Total Solar PV Capacity in Honolulu County*(Urban Honolulu Households/Honolulu County Households)
Solar PV Capacity in Honolulu Estimate (MW) = 221 MW *(127,652/308,490)
Houston, TexasData were provided by CenterPoint Energy, the electric utility serving the city, as of December 31, 2014.196 The capacity was provided in AC watts and we converted it to DC watts.

Appendices 47
Indianapolis, IndianaData were provided by Indianapolis Power and Light, the electric utility serving the city, as of December 31, 2014.197
Jacksonville, FloridaData were provided by Jacksonville Electric Authority (JEA), the utility serving the city, as of December 31, 2014 in DC watts.198
In the last edition of this report, data were provided by JEA by zip code, leading to a higher city total than we report this year. Our estimate using ArcGIS yielded a city total of 16 MW as of the end of 2013. The data we use this year were summarized by city by JEA, and are therefore more accurate than our estimate last year.
Kansas City, MissouriData were provided by Kansas City Power & Light, the electric utility serving the city, as of December 31, 2014 in DC watts.199
Las Vegas, NevadaData were provided by the City of Las Vegas, as of December 31, 2014 (in a spreadsheet compiled for the city by NV Energy, the city’s electric utility).200 The capacity was provided in AC watts and we converted it to DC watts. NV Energy also produces solar energy at a 3.3 MW installation on its wastewater treatment facility just outside of the city limits.
Los Angeles, CaliforniaData were provided by the Los Angeles Department of Water & Power, the city’s municipal electric utility, as of December 31, 2014.201 The capacity was provid-ed in AC watts and we converted it to DC watts.
Louisville, KentuckyData were provided by Louisville Gas & Electric, the electric utility serving the city, as of December 31, 2014.202 The capacity was provided in AC watts and we converted it to DC watts.
Manchester, New HampshirePublic Service of New Hampshire, the electric utility company serving the city of Manchester, provided us with an aggregate total of installed solar PV capacity within the city limits of Man-chester, through 31 December 2013.203 These data were reported in AC watts and were converted to DC watts. We were unable to obtain data for 2014.
Memphis, TennesseeData were provided by Memphis Light, Gas and Water, the city’s municipal electric utility, as of December 31, 2014 in DC watts.204
Miami, FloridaFlorida Power & Light provided us with solar PV installed in their service area, broken down by zip code, as of 31 December 2014 in DC watts.205 We used ArcMap to isolate those zip codes that are centered within the city limits of Miami and counted only solar PV installations in those Miami zip codes in the solar PV capacity total for the city.
Milwaukee, WisconsinData were received from the office of Renew Wis-consin. The data are up to date as of December 31, 2014 in DC megawatts.206
Minneapolis, MinnesotaXcel Energy, the utility serving the city, provided us with data on the solar PV capacity of installa-tions within Minneapolis. They declined to give us the data from 2014, therefore, the data are up to date as of 2013. These data were reported in DC watts.
Nashville, TennesseeData were provided by Nashville Electric, the electric utility serving the city, as of December 31, 2014 in DC watts.207
48 Shining Cities
New Orleans, LouisianaEntergy New Orleans, the electric utility serving New Orleans, provided us with this solar PV capacity total, as of December 31, 2014. These data were reported in AC watts, and were converted to DC watts (see Methodology).208
New York, New York Data on solar PV capacity in the city limits of New York as of December 31, 2014 were provided by Con Edison, the utility serving New York City. These data were reported in DC watts (see Methodology).209
Newark, New JerseyThe solar PV installations supported by New Jersey’s Clean Energy Program (NJCEP) are made available online in the “NJCEP Solar Installations Report” with city and zip code information. When we collected the data, information was available through December 31, 2014. We found the Newark solar PV total by filter-ing “city name” for Newark.210
Oklahoma City, OklahomaData were provided by Oklahoma Gas & Electric (OGE) and by the City of Oklahoma City as of Decem-ber 31, 2014.211 OGE only has a list tracking solar PV installations less than 300 kW; we added a known 1 megawatt installation at the Veteran’s Hospital to the 312 kW of solar PV capacity reported by OGE. We as-sumed the data were in DC watts.
Omaha, NebraskaEstimated solar PV capacity in Omaha was provided by Omaha Public Power District, the electric utility serving the city of Omaha, as of December 31, 2014.212 These data were reported in AC watts and were con-verted to DC watts.
Orlando, FloridaJennifer Szaro, the Renewable Energy Manager at the Orlando Utilities Commission (the municipal utility serving the city of Orlando) provided us with
a spreadsheet of solar installations listed as being in “Orlando” and updated as of 31 December 2014. The capacity numbers were provided in DC watts.
Philadelphia, PennsylvaniaThe data were obtained from the SREC registry PJM-GATS.213 These data only include solar PV installations that are registered in the system before December 31, 2014 and the capacity provided is in DC watts.
Phoenix, ArizonaPhoenix is served by two electric utilities, Arizona Public Service (APS) and Salt River Project (SRP). Data from APS’s service territory were provided by APS via the City of Phoenix as of December 31, 2014 in DC watts.214 Data from SRP’s service territory was downloaded by zip code from the Arizona “Go Solar” website, managed by the Arizona Corporation Com-mission with information provided by regulated electric utilities.215 We downloaded SRP’s spreadsheet of installations and selected those installations that were assigned the status of “installed,” were listed as “PV,” were installed before December 31, 2014, and fell into zip codes centered in the Phoenix city limits. We added this estimate of solar PV capacity in SRP’s service territory to APS’s total to estimate the capac-ity installed in Phoenix at the end of 2014.
Pittsburgh, PennsylvaniaPennFuture provided us with data on Solar PV installations in Pittsburgh. This data is updated only through the middle of December 2013 and was ob-tained in DC watts.216 We were unable to obtain data for 2014.
Portland, MaineThe solar PV capacity installed in Portland was pro-vided by Central Maine Power. These data are up to date through December 31, 2014.217 It was unknown whether the capacity given was in AC or DC watts. We therefore used the more conservative estimate of DC watts.

Appendices 49
Portland, OregonThe city of Portland is served in part by Portland Gen-eral Electric and in part by Rocky Mountain Power (RMP). Data on solar PV capacity installed in Portland General Electric’s service were provided by Portland General Electric via the City of Portland’s Bureau of Planning and Sustainability as of December 31, 2014 in DC watts.218 Data on capacity installed in RMP’s ser-vice territory were provided by RMP’s net metering department as of December 31, 2014 in DC watts.219
Providence, Rhode IslandData were provided from the Rhode Island Office of Energy Resources as of December 31, 2014 in DC watts.220
Raleigh, North CarolinaThe City of Raleigh provided us with data on solar PV installations in the city limits of Raleigh as of 31 December 2014. We filtered projects to those only labeled “PV”. Some of the data was reported in DC watts, and some was reported in AC watts. For those projects reported in AC watts, we converted them to DC watts (see Methodology).221
Richmond, VirginiaA list of net metered solar PV installations was ob-tained from the Virginia Department of Mines, Miner-als and Energy as of December 2014 in DC watts. We used installations listed with the “city name” of Richmond. These data only include projects that are net-metered.222
Riverside, CaliforniaThe installed solar PV capacity total for Riverside was taken from a solar map maintained by the Riverside Power District: http://www.greenriverside.com/Green-Map-9. This map is updated daily, and the total we used was recorded on December 30, 2014; there-fore, solar PV capacity from December 30 and 31, 2014 may be missing.223
Sacramento, CaliforniaData were provided by Sacramento Municipal Utility District, the city’s publically-owned electric utility, as of December 31, 2014.224 The capacity was provided in AC watts and we converted it to DC watts.
Salt Lake City, CaliforniaData were provided by Rocky Mountain Power, the electric utility serving the city, as of December 31, 2014 in DC watts.225
San Antonio, TexasData were provided by zip code by CPS Energy, the electric utility serving the city, as of December 31, 2014.226 Solar San Antonio, a non-profit organization in San Antonio, provided us with information on utility-scale installations that fall within the city limits of San Antonio: Alamo 1, Blue Wing and William R. Sinkin Centennial Solar Farms 1 and 2.227 We verified that these fell within the city limits using Google maps.
San Diego, CaliforniaData were provided by San Diego Gas & Electric, the electric utility serving the city, as of December 31, 2014.228 The capacity was provided in AC watts and we converted it to DC watts.
San Francisco, CaliforniaData were provided by the San Francisco Department of the Environment as of December 31, 2014 in DC watts.229
San Jose, CaliforniaData were provided by Pacific Gas & Electric via the City of San Jose’s Environmental Services Department as of December 31, 2014.230 The capacity was provid-ed in AC watts and we converted it to DC watts.
In the previous edition of our report, we reported that San Jose had 72 MW-AC of solar PV capacity as of the end of 2013 (94 MW-DC). In our research this year, the

50 Shining Cities
city received different information and informed us that this was an overestimate – San Jose had 62.6 MW of solar PV capacity installed as of the end of 2013.
Seattle, WashingtonAn estimate of installed solar PV capacity as of De-cember 31, 2014 was provided by the Seattle Depart-ment of Planning and Development (obtained from Seattle City Light, the city’s municipal utility).231
St. Louis, MissouriAmeren Missouri, the utility serving the city of St. Louis, provided us with a total capacity number updated as of March 3, 2015, in DC watts, for the city of St. Louis.232 The utility totaled installed solar PV ca-pacity in the following St. Louis zip codes to estimate how much solar PV fell within the city limits: 63101, 63102, 63103, 63104, 63106, 63107, 63108, 63109, 63110, 63111, 63112, 63113, 63115, 63116, 63118, 63139, 63147 and 63155.
Tampa, FloridaTECO Energy, the utility serving the city of Tampa, provided us with a total capacity number updated as of December 31, 2014, in DC watts, for the city of Tampa.233
Virginia Beach, VirginiaDominion Virginia Power provided us with data on solar PV installed in the city limits of Virginia Beach as of December 31, 2014. These data were reported in AC watts, and were converted to DC watts (see Methodology).234
Washington, D.C.Data for solar PV capacity for installations in Wash-ington, D.C. were found on the Public Service Com-mission of the District of Columbia website. We downloaded the Excel file titled “List of Eligible Renewable Generators” and filtered for projects titled “Solar PV”. These data are up to date through Decem-ber 8, 2014 and are reported in DC watts.235
Wilmington, DelawareThe Delaware Public Service Commission maintains a downloadable spreadsheet of certified renewable energy facilities. We used this spreadsheet to find the solar PV capacity in Wilmington, based on postal ad-dress, as of December 31, 2014 in DC watts.236

Notes 51
Notes
1. Katharine Hayhoe et al., Climate Change and Chi-
cago, 7 November 2007.
2. City of Chicago Office of the Mayor, 2015 Sustainable
Chicago Action Agenda: Year Two Progress Report, Fall 2014.
3. Lynn Adams and Patty Bigner, “A Utility for the 21st
Century – Creating a Path toward Sustainability,” Journal
AWWA, May 2010.
4. Solar Friendly Communities, About Us, accessed at
solarcommunities.org/about-us, 18 February 2015.
5. City of Fort Collins, Cumulative Installed PV Capacity,
accessed at www.fcgov.com/utilities/img/site_specific/up-
loads/PV_Installed_Capacity.pdf, 18 February 2015.
6. The City of Houston, Mayor Annise Parker Launches
Mayors National Climate Action Agenda with Los Angeles
and Philadelphia (press release), 22 September 2014.
7. Matthew Tresaugue, “Houston Takes Lead with Cli-
mate Plan,” Houston Chronicle, 22 September 2014.
8. For current solar and wind generation percentages:
United States Environmental Protection Agency, Top 30
Local Government, 26 January 2015; For 2016 generation
predictions: See Note 7.
9. Alex Dews and Sarah Wu, Mayor’s Office of
Sustainability, 2013 Progress Report: Greenworks Philadel-
phia, 2014, accessed at www.phila.gov/green/PDFs/Green-
works2013ProgressReport_Web.pdf.
10. Ibid.
11. PennEnvironment, Philadelphia City Council Com-
mits to Goal of 20,000 Solar Roofs [news release], 20 March
2014.
12. Solar Energy Industries Association, Solar Industry
Data, accessed at www.seia.org/research-resources/solar-
industry-data, 22 January 2015.
13. This includes potential solar power generation
from rooftop solar panels, large utility-scale solar installa-
tions, and concentrating solar power plants. Judee Burr and
Lindsey Hallock, Frontier Group, Rob Sargent, Environment
America Research & Policy Center, Star Power: The Growing
Role of Solar Energy in America, November 2014.
14. Ibid.
15. Ibid.
16. Mapdwell, Boston, MA, accessed at www.map-
dwell.com/en/boston/stats, 5 March 2015.
17. Magdalena Mis, “New-generation Solar Panels Far
Cheaper, More Efficient: Scientists,” The Washington Post,
27 January 2015.
18. Solar Energy Industries of America, U.S. Installs 6.2
GW of Solar PV in 2014, Up 30% Over 2013 [press release],
10 March 2015.
19. Solar panel efficiency: Kevin Bullis, “A Cheap
Material Boosts Solar Cells by 50 Percent,” MIT Technol-
ogy Review, 30 January 2015; Storage: Katherine Tweed, “4
Things to Watch For in the 2015 Energy Storage Market,”
GreenTech Media, 20 January 2015.

52 Shining Cities
20. Matt Safford, “This Clear Plastic Material Harvests
Solar Energy Without You Even Knowing It’s There,” Smith-
sonian, 30 September 2014.
21. Bill Chappell, “Solar Bike Path Opens This Week in
the Netherlands,” National Public Radio, 10 November 2014.
22. Hal Bernton, “How to Store Solar Energy for a Rainy
Day? A Really Big Battery,” The Seattle Times, 15 January
2015.
23. United States Department of Energy, Alternative
Fuels Data Center, accessed at www.afdc.energy.gov/ve-
hicles/electric_batteries.html, 2 March 2015.
24. Jeff St. John, “SCE Chooses Ice Energy for 25MW
of Rooftop Thermal Energy Storage,” GreenTech Media, 13
November 2014.
25. Stephen Lacey, “Storage is the New Solar: Will
Batteries and PV Create an Unstoppable Hybrid Force?”
Greentech Media, accessed at www.greentechmedia.com/
articles/featured/Storage-Is-the-New-Solar-Will-Batteries-
and-PV-Create-an-Unstoppable-Hybri, 29 January 2015.
26. Eric Wesoff, “Milestone: 10 Gigawatts of Solar Pan-
els in 2010, Part 1,” GreenTechSolar, 6 October 2010.
27. See Note 18.
28. Solar Energy Industries Association and GTM
Research, Solar Market Insight Report 2014 Q3, accessed
at www.seia.org/research-resources/solar-market-insight-
report-2014-q3, 1 February 2015.
29. See Note 18.
30. The Global Commission on the Economy and Cli-
mate, The New Climate Economy, 2014.
31. Urbanization rates 2000-2010: United States
Census Bureau, Growth in Urban Population Outpaces Rest
of Nation, Census Bureau Reports (press release), 26 March
2012. For future urban growth: United Nations, World Ur-
banization Prospects 2014, 2014.
32. Jordan Schneider, Frontier Group, and Julian Boggs,
Environment America Research & Policy Center, America’s
Dirtiest Power Plants: Polluters on a Global Scale, September
2014.
33. Global Carbon Atlas, Emissions, accessed at www.
globalcarbonatlas.org/?q=en/emissions, 22 January 2015.
34. Definition of Nuisance Flooding: National Oceanic
and Atmospheric Administration, NOAA Establishes ‘Tipping
Points’ For Sea Level Rise, 18 December 2014.
35. National Oceanic and Atmospheric Association,
NOAA: ‘Nuisance Flooding’ an Increasing Problem as Coastal
Sea Levels Rise, 28 July 2014.
36. Ibid.
37. Union of Concerned Scientists, Early Warning Signs
of Global Warming: Downpours, Heavy Snowfalls, and
Flooding, accessed at www.ucsusa.org/global_warming/
science_and_impacts/impacts/early-warning-signs-of-glob-
al-3.html#.VME_1dLF-ug, 22 January 2015.
38. Kevin E. Trenberth, National Center for Atmospher-
ic Research, “Changes in Precipitation with Climate Change,”
Climate Research, 47:123-138, doi: 10.3354/cr00953, March
2011.
39. National Climatic Data Center, Billion-Dollar Weath-
er and Climate Disasters: Table of Events, accessed at www.
ncdc.noaa.gov/billions/events, 22 January 2015.
40. Ibid.
41. Noah S. Diffenbaugh and Martin Scherer, Stanford
University, Robert J. Trapp, Purdue University, “Robust In-
creases in Severe Thunderstorm Environments in Response
to Greenhouse Forcing,” Proceedings of the National Acad-
emy of Sciences, 110(41):16361-16366, 8 October 2013.
42. United States Environmental Protection Agency,
Heat Island Effect, accessed at www.epa.gov/heatisland/, 9
February 2015.
Notes 53
43. Intergovernmental Panel on Climate Change, Work-
ing Group II: Impacts, Adaptation and Vulnerability: Thermal
Stress (Heat Waves, Cold Spells), accessed at: www.ipcc.ch/
ipccreports/tar/wg2/index.php?idp=353#941, 20 January
2015.
44. United States Forest Service, National Climate
Assessment Executive Summary, accessed at www.fs.fed.
us/research/docs/climate-change/assessment/national-cli-
mate-assessment-executive-summary.pdf, 22 January 2015.
45. California Emergency Management Agency, My-
Hazards: Fire, accessed at myhazards.calema.ca.gov/, 22
January 2015.
46. Headwater Economics, Local Responses to Wildfire
Risks and Costs: Case Studies and Lessons Learned, April
2014.
47. Based on harmonized data for all energy sources
other than natural gas (for which published data were used)
from National Renewable Energy Laboratory, LCA Harmo-
nization, accessed at www.nrel.gov/analysis/sustain_lcah.
html, 15 February 2015.
48. Rani Molla, “Coal Still Is Top Source of Electricity in
U.S.; Where Does Your State Stand?,” The Wall Street Jour-
nal, 14 August 2014.
49. United States Environmental Protection Agency,
Clean Energy, accessed at www.epa.gov/cleanenergy/ener-
gy-and-you/affect/air-emissions.html, 9 February 2015.
50. American Lung Association, Ozone Pollution, ac-
cessed at www.stateoftheair.org/2013/health-risks/health-
risks-ozone.html#_edn23, 20 January 2015.
51. Fabio Caiazzo et al., “Air pollution and Early Deaths
in the United States. Part I: Quantifying the Impact of Major
Sectors in 2005”, Atmospheric Environment, 79:198-208, 31
May 2013.
52. Ibid.
53. Chris Mooney, “It’s Official: 2014 was the Hottest
Year in Recorded History,” The Washington Post, 16 January
2015.
54. For relationship between heat and electricity
demand: See Note 42; For peaker plant information: Jeff St.
John, “Dueling Charts of the Day: Peaker Plants vs. Green
Power,” GreenTech Media, 17 January 2014.
55. Robert G. Sanders and Lewis Milford, Clean Energy
Group, Clean Energy for Resilient Communities: Expanding
Solar Generation in Baltimore’s Low-Income Neighborhoods,
February 2014.
56. New York: The City of New York, A Stronger, More
Resilient New York, 11 June 2013; Chicago: City of Chicago,
Chicago Climate Action Plan: Progress Report (2008-2009),
2010.
57. The City of New York, A Stronger, More Resilient
New York, 11 June 2013.
58. Report recommendations: The City of New York, A
Stronger, More Resilient New York, 11 June 2013; Definition
of a microgrid: Untited States Department of Energy, How
Microgrids Work, 17 June 2014.
59. Union of Concerned Scientists, The Energy- Water
Collision: 10 Things You Should Know, September 2010.
60. Kristen Averyt, et al., Union of Concerned Scien-
tists, Freshwater Use by U.S. Power Plants: Electricity’s Thirst
for a Precious Resource, November 2011.
61. Go Solar California, Cost by Quarter, accessed at
www.californiasolarstatistics.ca.gov/reports/quarterly_
cost_per_watt/, 27 January 2015.
62. Ibid.
63. Keyes, Fox and Wiedman, LLP, Interstate Renew-
able Energy Council, Unlocking DG Value: A PURPA-Based
Approach to Promoting DG Growth, May 2013.
64. The National Academies, Sources and Uses, ac-
cessed at www.nap.edu/reports/energy/sources.html, 9
February 2015.
65. Ibid.
54 Shining Cities
66. “Massachusetts Closes Out Landmark Solar Rebate
Program,” Solar Industry Magazine, 22 January 2015.
67. Emily Hois, Clean Energy Collective, Virtual Net
Meterina and the Future of Community Solar, 30 December
2013.
68. Alison Kemper and Roger Martin, “Volatile Fossil
Fuel Prices Make Renewable Energy More Attractive,” The
Guardian, 21 March 2013.
69. The Solar Foundation, National Solar Jobs Census
2014, 2014.
70. Ibid.
71. Ibid.
72. Ibid.
73. David Robinson, “’Historic Day for Buffalo’ Zemsky
says of SolarCity RiverBend Plans,” The Buffalo News, 23
September 2014.
74. After requesting data from a number of sources
and finding ourselves unable to procure reliable informa-
tion, we did not include Birmingham, Alabama; Cheyenne,
Wyoming; Jackson, Mississippi; Little Rock, Arkansas; Sioux
Falls, South Dakota; or Wichita, Kansas.
75. Galen Barbose, Samantha Weaver, and Naïm Darg-
houth, Lawrence Berkeley National Laboratory, Tracking
the Sun VII: An Historical Summary of the Installed Price of
Photovoltaics in the United States from 1998 to 2013, 2014.
76. See Note 18.
77. Land area was calculated using the city land areas
provided by the United States Census Bureau’s City Quick-
facts. They define land area as the size of all areas desig-
nated as land in the Census Bureau’s national geographic
database. United States Census Bureau, Land Area and
Persons per Square Mile, accessed at quickfacts.census.gov/
qfd/meta/long_LND110210.htm, 3 March 2015.
78. Of the top 20 solar cities, 11 of them were recipi-
ents of the Solar America Cities award given in 2008 by
the Department of Energy: Austin, Boston, Denver, New
Orleans, New York City, Portland, Sacramento, San Antonio,
San Diego, San Francisco and San Jose. National Renewable
Energy Laboratory, Solar America Award Initiative Fact-
sheet, March 2008.
79. U.S. Census Bureau, U.S. Department of Commerce
Economics and Statistics Administration, Census Regions
and Divisions of the United States, downloaded from https://
www.census.gov/geo/maps-data/maps/pdfs/reference/
us_regdiv.pdf, 5 March 2015.
80. This refers to the census designated place “urban
Honolulu.” In an analysis by the National Renewable Energy
Laboratory, researchers assume an average residential solar
PV system size of 5 kW on detached homes: Paul Denholm
and Robert Margolis, National Renewable Energy Labora-
tory, Supply Curves for Rooftop Solar PV-Generated Electric-
ity for the United States, November 2008, 13.
81. In an analysis by the National Renewable Energy
Laboratory, researchers assume an average residential solar
PV system size of 5 kW on detached homes: Paul Denholm
and Robert Margolis, National Renewable Energy Labora-
tory, Supply Curves for Rooftop Solar PV-Generated Electric-
ity for the United States, November 2008, 13.
82. Ibid.
83. Ibid.
84. During our research this year, we discovered that
Denver had 23.5 MW of solar PV capacity at the end of
2013, instead of the 25 MW figure we used in the 2014 Shin-
ing Cities report. See Appendix B for details.
85. Solar Energy Industries Association, RPS Solar Fact
Sheet CO, accessed at www.seia.org/sites/default/files/
resources/RPS%20Solar%20Fact%20Sheet%20CO.pdf, 2
February 2015.
86. Ibid.

Notes 55
87. Database of State Incentives for Renewables &
Efficiency, Net Metering Summary Map, accessed at www.
dsireusa.org/documents/summarymaps/net_metering_
map.pdf, 2 February 2015, last updated September 2014.
88. For more information on “soft costs” associated
with solar energy: Barry Friedman et al., National Renew-
able Energy Laboratory, Benchmarking Non-Hardware
Balance-of-System (Soft) Costs for U.S. Photovoltaic Systems,
Using a Bottom-Up Approach and Installer Survey – Second
Edition, October 2013.
89. Dropped 60 percent: Solar Energy Industries Asso-
ciation, Solar Energy Facts: 2013 Year in Review (factsheet),
5 March 2014; 64 percent: U.S. Department of Energy, Sun-
Shot Initiative, Reducing Non-Hardware Costs, 14 November
2013, available at www1.eere.energy.gov/solar/sunshot/
nonhardware_costs.html.
90. Additional “walk-through” construction fees
for large projects or high value projects may apply. For
information on Colorado permit cost limit: Database
of State Incentives for Renewables & Efficiency, Colo-
rado: Solar Construction Permitting Standards, accessed
at dsireusa.org/incentives/incentive.cfm?Incentive_
Code=CO45R&re=0&ee=0, last updated 1 August 2014; For
cost of permits in Denver: City and County of Denver, Proj-
ect Guide for Solar Panels, accessed at www.denvergov.org/
developmentservices/DevelopmentServices/HomeProjects/
OutsidetheHome/SolarPanels/tabid/441392/Default.aspx, 2
February 2015.
91. Elizabeth Babcock, Manager of Air, Water and
Climate, City of Denver, personal communication, 3 Febru-
ary 2015.
92. Denver Energy Challenge, About the Challenge, ac-
cessed at www.denverenergy.org/about, 2 February 2015.
93. Ibid.
94. Kansas City Chiefs Installation: James Dornbrook,
“Chiefs add solar array to Arrowhead Stadium,” Kansas City
Business Journal, 19 August 2014.
95. Database of State Incentives for Renewables
& Energy, Kansas City Power & Light: Solar Photovoltaic
Rebates, accessed at dsireusa.org/incentives/incentive.
cfm?Incentive_Code=MO94F&re=0&ee=0, 10 February
2015.
96. Kansas City Power & Light, Solar Power Rebate,
accessed at www.kcpl.com/save-energy-and-money/for-
home/home-rebates/mo/solar-power-rebate, 10 February
2015.
97. Mid-American Regional Council, Solar Ready II,
accessed at marc.org/Environment/Energy/Renewable-
Energy/Solar-Ready-II, 10 February 2015.
98. “First PACE Financed Project Launches in Kansas
City,” MetroWire Media, 12 December, 2014.
99. Database of State Incentives for Renewables
& Energy, Missouri Clean Energy District, accessed
at dsireusa.org/incentives/incentive.cfm?Incentive_
Code=MO123F&re=0&ee=0, 10 February 2015.
100. City of Kansas City, Clean Energy Loan Granted to
Wornall Plaza Condominiums in Kansas City (press release),
21 November 2014.
101. The “cities” measured in this U.S. Census Bureau
report were principal cities inside U.S Census designated
metropolitan statistical areas. Carmen DeNavas-Walt and
Bernadette D. Proctor, U.S. Census Bureau, Income and Pov-
erty in the United States: 2013, September 2014.
102. GRID Alternatives, We’re in the Mid-Atlantic!, ac-
cessed at www.gridalternatives.org/midatlantic, 17 Febru-
ary 2015.
103. This is based on the Five Year American Com-
munity Survey (2008-2013) from the United States Census
Bureau. The numbers are in 2013 dollars, adjusted for infla-
tion. United States Census Bureau, American Community
Survey: Baltimore City, accessed at factfinder.census.gov/
faces/tableservices/jsf/pages/productview.xhtml?src=bkmk,
18 February 2015.

56 Shining Cities
104. Barbara Push, “Coalition brings solar energy co-
ops to Baltimore area,” Baltimore Sun, 25 July 2014.
105. GRID Alternatives, About GRID Alternatives Mid-
Atlantic, accessed at www.gridalternatives.org/regions/
midatlantic/learn, 18 February 2015.
106. Maryland Department of Labor, Licensing and
Regulation, Civilian Labor Force, Employment & Unemploy-
ment by Place of Residence (LAUS) - Baltimore City, accessed
at www.dllr.state.md.us/lmi/laus/baltimorecity.shtml, 18
February 2015.
107. Solar Energy Industries Association, Third-Party
Solar Financing, accessed at www.seia.org/policy/finance-
tax/third-party-financing, 17 February 2015.
108. Ibid.
109. Ibid.
110. David Feldman and Travis Lowder, National Re-
newable Energy Laboratory, Banking on Solar: An Analysis
of Banking Opportunities in the U.S. Distributed Photovoltaic
Market, November 2014.
111. Ibid.
112. Population of Las Vegas: United States Cen-
sus Bureau, State & County QuickFacts: Las Vegas (city),
Nevada, accessed at http://quickfacts.census.gov/qfd/
states/32/3240000.html, 9 February 2015.
113. National Weather Service, The Las Vegas NV Cli-
mate Summary for the Year 2014, 6 January 2015.
114. United States Global Change Research Program,
2014 National Climate Assessment, October 2014.
115. Hashem Akbari, Lawrence Berkeley National Labo-
ratory, Energy Saving Potentials and Air Quality Benefits of
Urban Heat Island Mitigation, 23 August 2005.
116. The City Council of Las Vegas, RESOLUTION
ADOPTING A SUSTAINABLE ENERGY STRATEGY FOR
THE CITY OF LAS VEGAS, accessed at www5.lasveg-
asnevada.gov/sirepub/cache/2/mgu4ypjvqk33awiui-
k515wn3/16325860204201512364999.PDF, 4 February
2015.
117. Ibid.
118. City of Las Vegas, EPA RECOGNIZES CITY OF LAS
VEGAS WITH A GREEN POWER LEADERSHIP AWARD (press
release), 18 November 2014.
119. Ibid.
120. Solar America Board for Codes and Standards,
Expedited Permit Process for PV Systems, accessed at www.
lasvegasnevada.gov/files/Expedited_Permit_Process_for_
PV_Systems.pdf, 4 February 2015.
121. NVEnergy, Net Metering, accessed at www.nven-
ergy.com/renewablesenvironment/renewablegenerations/
NetMetering.cfm, 11 March 2015.
122. Mark Velotta, Office of Sustainability, The City of
Las Vegas, personal communication, 15 January 2015.
123. New York State Government, Governor Cuomo
Announces Comprehensive NY-Sun Initiative to Expand Solar
Development in New York (press release), 19 April 2012.
124. Solar Energy Industries of America, Gov. Cuomo’s
Successful NY-Sun Solar Program Will Shine Through 2023,
accessed at www.seia.org/news/gov-cuomo-s-successful-
ny-sun-solar-program-will-shine-through-2023, 24 April
2014.
125. The City University of New York, Sustainable
CUNY: Strategic Zones, accessed at www.cuny.edu, 7 March
2014.
126. Governor Andrew M. Cuomo, 2015 Opportunity
Agenda p. 143, accessed at www.governor.ny.gov/sites/
governor.ny.gov/files/atoms/files/2015_Opportunity_Agen-
da_Book.pdf, 2 February 2015.
127. United States Department of Energy, Virtual Net-
Metering Now Available to Washington D.C. Residents (press
release), accessed at apps3.eere.energy.gov/greenpower/
news/news_template.shtml?id=1871, 2 February 2015.

Notes 57
128. Ibid.
129. Allan Drury, Public Affairs Manager at Con Edison,
personal communication, 13 February 2015.
130. Microgrids are electricity “systems that have at
least one distributed energy resource and associated loads,
and can form intentional islands in the electrical distribu-
tion system to operate independently of the power grid”:
E. Hotchkiss, et al., National Renewable Energy Laboratory,
Alternative Energy Generation Opportunities in Critical Infra-
structure New Jersey, November 2013.
131. Eric Wesoff, “New Jersey Begins the Process of
Deploying Grid-Scale Energy Storage,” Greentech Media, 23
October 2014.
132. Matthew L. Wald, “Nuclear Power Plant in Limbo
Decides to Close,” The New York Times, 7 June 2013.
133. Eric Wesoff and Jeff St. John, “Breaking: SCE
Announces Winners of Energy Storage Contracts Worth
250MW,” Greentech Media, 5 November 2014.
134. See Note 25.
135. Con Edison, Demand Management Incentives, ac-
cessed at www.coned.com/energyefficiency/demand_man-
agement_incentives.asp, 3 February 2015.
136. Data on solar capacity by state were obtained
from: Larry Sherwood, Interstate Renewable Energy Coun-
cil, U.S. Solar Market Trends 2012, July 2013.
137. Dependent on coal at the time: John Haselden,
Indianapolis Power and Light, Corporate Affairs, personal
communication, 4 February 2014.
138. Kari Lydersen, “Indianapolis Solar Shines, but Will
the Boom Continue,” Midwest Energy News, 23 April 2013
139. Justin L. Mack, “World’s Largest Solar Farm
Complete at Indianapolis Airport,” INDYSTAR, 23 December
2014.
140. See Note 138.
141. Tim Evans, “Solar Bill Appears to be in Trouble,”
INDYSTAR, 24 February 2015.
142. Indianapolis Power & Light, Renewable Energy
Incentive Program, downloaded from www.iplpower.com,
14 March 2014..
143. Permanent jobs created were not available, but 220
people were employed during construction of Indy I, II, and
III: Dan Genest, Media Relations, Dominion, personal com-
munication, 6 February 2014.
144. Jon Hasledon, Indianapolis Power & Light, personal
communication, 15 January 2015.
145. Edison Electric Institute, an electric utility trade
group, produced a report detailing their concerns with dis-
tributed energy generation, like rooftop solar power: Peter
Kind, Energy Infrastructure Associates, Disruptive Challenges:
Financial Implications and Strategic Responses to a Changing
Retail Electric Business, January 2013.
146. Database of State Incentives for Renewable Energy,
Net Metering, accessed at programs.dsireusa.org/system/
program/detail/271, 3 March 2015.
147. Lucy Woods, “Battle Lines Drawn Over Colorado
Net Metering Dispute,” PVTECH, 9 October 2014.
148. Mark Jaffe, “Battle over Xcel’s Net-Metering Credit
Starts Thursday,” The Denver Post, 23 July 2014.
149. Rosana Francescato, “Wisconsin: the Latest Solar
Battleground,” PV Solar Report, 19 September 2014.
150. Ryan Randazzo, “SRP Board OKs Rate Hike, New
Fees for Solar Customers,” AZ Central, 27 February 2015.
151. Patrick O’Grady, “SolarCity Sues Salt River Project
Over New Rate Hikes on Potential Solar Customers,” Phoenix
Business Journal, 3 March 2015.
152. Rosana Francescato, “Wisconsin: the Latest Solar
Background,” PV Solar Report, 19 September 2014.

58 Shining Cities
153. Elizabeth Doris and Rachel Gelman, National
Renewable Energy Laboratory, State of the States 2010:
The Role of Policy in Clean Energy Market Transformation,
January 2011, and Jordan Schneider, Frontier Group, and
Rob Sargent, Environment America Research & Policy
Center, Lighting the Way: The Top Ten States that Helped
Drive America’s Solar Energy Boom in 2013, August 2014.
154. Solar Energy Industries Association, Solar
Investment Tax Credit (ITC), accessed at www.seia.org, 10
February 2015.
155. More information about the U.S. Department of
Energy’s Sunshot Initiative available at U.S. Department
of Energy, Sunshot Initiative, accessed at energy.gov/eere/
sunshot/sunshot-initiative, 10 February 2015.
156. Tom Randall, “We Need to Act,’ Transcript of
Obama’s Climate Change Speech,” Bloomberg, 25 June
2013.
157. Solar Energy Industries Association, Enlisting the
Sun: Powering the U.S. Military with Solar Energy, 17 May
2013.
158. See Note 130.
159. North Carolina Sustainable Energy Association
and North Carolina Solar Center, Template Solar Energy
Development Ordinance for North Carolina: Executive
Summary, accessed at www.ncsc.ncsu.edu, 10 July 2014.
160. Delaware Valley Regional Planning Commission,
Renewable Energy Ordinance Framework-Solar, accessed
at www.dvrpc.org/energyclimate/ModelOrdinance/solar.
htm, 3 March 2015.
161. Vote Solar Initiative and Interstate Renewable
Energy Council, Project Permit: Best Practices in Solar
Permitting, May 2013.
162. Department of Energy SunShot Initiative: The
United States Department of Energy, Soft Costs, accessed
at energy.gov/eere/sunshot/soft-costs, 3 March 2015. The
Vote Solar Initiative: Vote Solar Initiative and Interstate
Renewable Energy Council, Project Permit: Best Practices
in Solar Permitting, May 2013.
163. Linda Irvine, Alexandra Sawyer and Jennifer Gro-
ver, Northwest Sustainable Energy for Economic Develop-
ment, THE SOLARIZE GUIDEBOOK: A Community Guide to
Collective Purchasing of Residential PV Systems, May 2012.
164. Ibid.
165. DC Solar United Neighborhoods, Community
Renewables Energy Act of 2013, accessed at www.dcsun.
org/community-renewables-energy-act-of-2013/, 11 March
2015.
166. The Solar Foundation, Brighter Future: A Study on
Solar in US Schools, September 2014.
167. National Renewable Energy Laboratory, PVWatts:
Changing System Parameters, downloaded from http://
rredc.nrel.gov/solar/calculators/pvWatts/system.html, 4
February 2014.
168. ESRI, ArcGIS Discussion Forums, accessed at
http://forums.esri.com/Thread.asp?c=93&f=982&t=146645,
16 February 2015.
169. Kumiko Styes, Manager of Retail Renewable
Energy Programs, Public Service of New Mexico, personal
communication, 18 February 2015.
170. William Klatt, Chugach Electric, personal com-
munication, 26 January 2015; Steve McElroy, Anchorage
Municipal Power & Light, personal communication, 27 Janu-
ary 2015.
171. Shan Arora, Southface, personal communication,
January 2015.
172. Tim Harvey, Austin Energy, personal communica-
tion, 29 January 2015.
173. AustinTexas.gov, Planning and Development
Review Department, Extraterritorial Jurisdiction: What Is It?,
downloaded from http://www.austintexas.gov/faq/extrater-
ritorial-jurisdiction-etj-what-it, 5 March 2014.
174. PJM Environmental Information Services, Public
Reports: Renewable Generators Registered in GATS, down-
loaded from https://gats.pjm-eis.com/gats2/PublicReports/
RenewableGeneratorsRegisteredinGATS, 7 January 2015.

Notes 59
175. June Pusich-Lester, Northwestern Energy, per-
sonal communication, 13 January 2014.
176. Ibid.
177. Michael Sznajderman, Alabama Power, personal
communication, 6 February 2015.
178. Beth Baird, City of Boise, personal communica-
tion, 23 January 2015.
179. The Open PV database is an open online database
of solar energy installations maintained by the National
Renewable Energy Laboratory. There is only 5.6 GW of
solar PV capacity reported in the database as of February
6, 2015 of the known 20.5 GW of installed solar PV capacity
in the United States, so we know this database is missing
information. The data in Open PV comes from a variety of
sources, and NREL screens most of these data for obvious
errors before uploading it. Data in the “Open PV” dataset
are reported in DC watts. To calculate city totals from the
“Open PV” dataset, we downloaded the full dataset from
the website, selected only those installations installed prior
to 2010, and used the latitude and longitude coordinates
associated with each installation to map them in ArcMap.
We then “joined” these installations with a layer of Census
designated places provided by ESRI to calculate the total so-
lar PV capacity for Boston. The vast majority of the data re-
ceived by Open PV do not have an address, only a zip code.
As a result, the totals for some cities may include some PV
systems that are outside a city’s boundaries but still within
the boundaries of a zip code that includes part of a city. For
20.5 GW: See Note 18.
180. North Carolina Utilities Commission, Registration
Spreadsheet 2008-Present, accessed at www.ncuc.net/reps/
RegistrationSpreadsheet2008-present.xls, 15 January, 2015.
181. Catherine Watkins, ComEdison, personal commu-
nication, 28 January 2015.
182. Nancy Connelly, Duke Energy, personal communi-
cation, 14 January 2015.
183. Sarah Parrot, Public Utilities Commission of Ohio,
Legal Department, personal communication, 22 January
2014.
184. Jake Scoggins, South Carolina Energy Office, per-
sonal communication, January 2015.
185. See Note 183.
186. Stephen Blackburn and Jay Squyres, North Texas
Renewable Energy Group, personal communication, 18
February 2015.
187. For an explanation of the Open PV Database, see
note 179.
188. Jerry Tinianow, Chief Sustainability Officer,
Mayor’s Office of Sustainability, personal communication, 2
February 2015.
189. Laura Graham, Sustainability Coordinator, City of
Des Moines, personal communication, 30 January 2015.
190. Scott Simons, DTE Energy, personal communica-
tion, January 2015.
191. Troy Knutson, Distributed Generation Engineer,
Cass County Electric Cooperative, personal communication,
21 January 2015.
192. Mark Nisbet, Principal Manager, Xcel Energy, per-
sonal communication, 21 January 2015.
193. Hawaiian Electric Company, Quarterly Installed
PV Data, Cumulative Installed PV – As of December 31, 2014,
downloaded from http://www.hawaiianelectric.com/heco/
Clean-Energy/Going-Solar/More-Solar-Information, 4 Febru-
ary 2015.
194. “Honolulu” is defined as the census-designated
place “urban Honolulu”: U.S. Census Bureau State and
County Quickfacts, Urban Honolulu CDP, HI, downloaded
from http://quickfacts.census.gov, 11 March 2014.
195. Urban Honolulu and Honolulu County Population
Figures: US Census Quickfacts, 2008-2012 Survey House-
hold Estimates, accessed at http://quickfacts.census.gov, 11
March 2014.
196. Timothy Sullivan, Lead Engineer, CenterPoint En-
ergy Houston Electric, personal communication, 4 February
2015.

60 Shining Cities
197. Jon Hasledon, Indianapolis Power & Light, per-
sonal communication, 15 January 2015.
198. Edgar Gutierrez, Jacksonville Electric Authority,
personal communication, January 2015.
199. Kristin Riggins, Kansas City Power & Light, persona
communication, 2 February 2015.
200. Marco Velotta, Office of Sustainability, City of Las
Vegas, personal communication, 14 January 2015.
201. Kimberly Hughes, Communications, Los Angeles
Department of Water & Power, personal communication, 21
January 2015.
202. Timothy Melton, Manager Customer Commit-
ment, Louisville Gas & Electric, personal communication, 16
January 2015
203. Martin Murray, Public Service of New Hampshire,
Media Relations, personal communication, 14 January 2014.
204. Becky Williamson, Strategic Marketing Coordina-
tor, Memphis Light, Gas and Water Division, personal com-
munication, 22 January 2015.
205. John Mccomb, Florida Power & Light, personal
communication, January 2015.
206. Amy Heart, Renew Wisconsin, personal communi-
cation, January 2015.
207. Marie Anderson, Engineering Supervisor, Nashville
Electric, personal communication, 12 January 2015.
208. Albert D. Eiffert, Entergy New Orleans, personal
communication, 19 January 2015.
209. Allan Drury, Public Affairs Manager at Con Edison,
personal communication, 13 February 2015.
210. New Jersey’s Clean Energy Program, New Jersey
Solar Installation Update, accessed at www.njcleanenergy.
com/renewable-energy/project-activity-reports/installa-
tion-summary-by-technology/solar-installation-projects, 18
February 2015.
211. T.O. Bowman, Office of Sustainability, City of
Oklahoma City, personal communication, 13 January 2015;
Aaron Hunsaker, Oklahoma Gas & Electric, personal com-
munication, 13 January 2015.
212. Dean Mueller, Division Manager of Sustainability,
Omaha Public Power District, personal communication,
4 February 2015. Dean reported data for OPPD’s entire
service territory but says that “at least 95% of these are in
Omaha” and that there is no way to separate the ones that
are not.
213. See Note 174.
214. Dimitrios Laloudakis, Energy Manager, City of
Phoenix, personal communication, 17 February 2015.
215. Arizona Goes Solar, Utility Incentives, Salt River
Project: Installations, downloaded from http://arizonagoess-
olar.org, 2 January 2015.
216. Evan R. Endres, Project Coordinator for Citizens
for Pennsylvania’s Future (PennFuture), personal communi-
cation, 20 January 2015.
217. Richard P. Hevey, Central Maine Power, personal
communication, 29 January 2015.
218. Kyle Diesner, Bureau of Planning and
Sustainability, City of Portland, personal communication, 26
January 2015.
219. John Sullivan, Net Metering Department, Rocky
Mountain Power, personal communication, 20 January
2015.
220. Danny Musher, Rhode Island Office of Energy
Resources, personal communication, 18 February 2015.
221. Robert C. Hinson, Renewable Energy Coordinator
with the City of Raleigh, personal communication, 15 Janu-
ary 2015.
222. Ken Jurman, Virginia Department of Mines, Miner-
als and Energy, personal communication, 26 January 2015.

Notes 61
223. Updated daily: Jerry Buydos, Riverside Power,
personal communication, 9 January 2014.
224. Jim Barnett, Principal Architect, Sacramento Mu-
nicipal Utility District, personal communication, 30 January
2015.
225. See Note 219.
226. Olivia Gomez, Energy Management, CPS Energy,
personal communication, 22 January 2015.
227. Devon Rood, Solar San Antonio, Research Associ-
ate, personal communication, 8 January 2014.
228. Ken Parks, Customer Generation Manager, San
Diego Gas & Electric, personal communication, 20 January
2015.
229. Terra Weeks, Renewable Energy Program Ad-
vocate, San Francisco Department of the Environment,
personal communication, 20 February 2015.
230. Michael Foster, City of San Jose Environmental
Services Department, personal communication, 9 February
2015.
231. Duane Jonlin, Department of Planning and
Development, City of Seattle, personal communication, 21
January 2015.
232. This capacity total includes 2 extra months and
may be an overestimate, but, a representative from the
Renewable Energy program at Ameren Missouri commu-
nicated to us that they “have had very few installations in
the past two months”: Patrick Justis, Renewable Energy
Program, Ameren Missouri, personal communication, 2
March 2015.
233. Shelly Aubuchon, Renewable Energy Program
Manager at Teco Energy, personal communication, 22 Janu-
ary 2015.
234. James R. Tew, Program Manager at Dominion
Virginia Power, personal communication, 14 January 2015.
235. Public Service Commission of the District of
Columbia, Renewable Energy Portfolio Standard Program,
accessed at www.dcpsc.org/Electric/Renewable.asp, Janu-
ary 2015.
236. Delaware Public Service Commission, “List of
Certified Eligible Energy Resources,” accessed at depsc.
delaware.gov/electric/delrps.shtml, 28 January 2015.