shinken documentation - media.readthedocs.org · – centreon (with ndo, not fully working, not...
TRANSCRIPT

Shinken DocumentationRelease 2.4
Shinken Team
July 15, 2015

Contents
1 About 11.1 About Shinken . . . . . . . . . . . . . . . . . . . . . . . . . . . . . . . . . . . . . . . . . . . . . . 2
2 Getting Started 52.1 Advice for Beginners . . . . . . . . . . . . . . . . . . . . . . . . . . . . . . . . . . . . . . . . . . . 62.2 Installations . . . . . . . . . . . . . . . . . . . . . . . . . . . . . . . . . . . . . . . . . . . . . . . . 72.3 Upgrading Shinken . . . . . . . . . . . . . . . . . . . . . . . . . . . . . . . . . . . . . . . . . . . . 11
3 Configuring Shinken 133.1 Configuration Overview . . . . . . . . . . . . . . . . . . . . . . . . . . . . . . . . . . . . . . . . . 143.2 Main Configuration File (shinken.cfg) Options . . . . . . . . . . . . . . . . . . . . . . . . . . . . . 153.3 Object Configuration Overview . . . . . . . . . . . . . . . . . . . . . . . . . . . . . . . . . . . . . 233.4 Object Definitions . . . . . . . . . . . . . . . . . . . . . . . . . . . . . . . . . . . . . . . . . . . . 253.5 Custom Object Variables . . . . . . . . . . . . . . . . . . . . . . . . . . . . . . . . . . . . . . . . . 263.6 Main advanced configuration . . . . . . . . . . . . . . . . . . . . . . . . . . . . . . . . . . . . . . 28
4 Running Shinken 494.1 Verifying Your Configuration . . . . . . . . . . . . . . . . . . . . . . . . . . . . . . . . . . . . . . 504.2 Starting and Stopping Shinken . . . . . . . . . . . . . . . . . . . . . . . . . . . . . . . . . . . . . . 50
5 The Basics 535.1 Setting up a basic Shinken Configuration . . . . . . . . . . . . . . . . . . . . . . . . . . . . . . . . 545.2 Monitoring Plugins . . . . . . . . . . . . . . . . . . . . . . . . . . . . . . . . . . . . . . . . . . . . 595.3 Understanding Macros and How They Work . . . . . . . . . . . . . . . . . . . . . . . . . . . . . . 615.4 Standard Macros in Shinken . . . . . . . . . . . . . . . . . . . . . . . . . . . . . . . . . . . . . . . 65
69subsubsection*.13770subsubsection*.18372subsubsection*.23673subsubsection*.262
5.5 Host Checks . . . . . . . . . . . . . . . . . . . . . . . . . . . . . . . . . . . . . . . . . . . . . . . 795.6 Service Checks . . . . . . . . . . . . . . . . . . . . . . . . . . . . . . . . . . . . . . . . . . . . . . 815.7 Active Checks . . . . . . . . . . . . . . . . . . . . . . . . . . . . . . . . . . . . . . . . . . . . . . 825.8 Passive Checks . . . . . . . . . . . . . . . . . . . . . . . . . . . . . . . . . . . . . . . . . . . . . . 835.9 State Types . . . . . . . . . . . . . . . . . . . . . . . . . . . . . . . . . . . . . . . . . . . . . . . . 865.10 Time Periods . . . . . . . . . . . . . . . . . . . . . . . . . . . . . . . . . . . . . . . . . . . . . . . 885.11 Determining Status and Reachability of Network Hosts . . . . . . . . . . . . . . . . . . . . . . . . . 905.12 Notifications . . . . . . . . . . . . . . . . . . . . . . . . . . . . . . . . . . . . . . . . . . . . . . . 965.13 Active data acquisition modules . . . . . . . . . . . . . . . . . . . . . . . . . . . . . . . . . . . . . 100
i
5.14 Setup Network and logical dependencies in Shinken . . . . . . . . . . . . . . . . . . . . . . . . . . 1015.15 Update Shinken . . . . . . . . . . . . . . . . . . . . . . . . . . . . . . . . . . . . . . . . . . . . . 108
6 Medium 1116.1 Business rules . . . . . . . . . . . . . . . . . . . . . . . . . . . . . . . . . . . . . . . . . . . . . . 1126.2 Monitoring a DMZ . . . . . . . . . . . . . . . . . . . . . . . . . . . . . . . . . . . . . . . . . . . . 1206.3 Shinken High Availability . . . . . . . . . . . . . . . . . . . . . . . . . . . . . . . . . . . . . . . . 1216.4 Mixed GNU/linux AND Windows pollers . . . . . . . . . . . . . . . . . . . . . . . . . . . . . . . . 1236.5 Notifications and escalations . . . . . . . . . . . . . . . . . . . . . . . . . . . . . . . . . . . . . . . 1246.6 The Notification Ways, AKA mail 24x7, SMS only the night for a same contact . . . . . . . . . . . . 1286.7 Passive data acquisition . . . . . . . . . . . . . . . . . . . . . . . . . . . . . . . . . . . . . . . . . 1296.8 Snapshots . . . . . . . . . . . . . . . . . . . . . . . . . . . . . . . . . . . . . . . . . . . . . . . . . 131
7 Advanced Topics 1337.1 External Commands . . . . . . . . . . . . . . . . . . . . . . . . . . . . . . . . . . . . . . . . . . . 1347.2 Event Handlers . . . . . . . . . . . . . . . . . . . . . . . . . . . . . . . . . . . . . . . . . . . . . . 1357.3 Volatile Services . . . . . . . . . . . . . . . . . . . . . . . . . . . . . . . . . . . . . . . . . . . . . 1397.4 Service and Host Freshness Checks . . . . . . . . . . . . . . . . . . . . . . . . . . . . . . . . . . . 1417.5 Distributed Monitoring . . . . . . . . . . . . . . . . . . . . . . . . . . . . . . . . . . . . . . . . . . 1437.6 Redundant and Failover Network Monitoring . . . . . . . . . . . . . . . . . . . . . . . . . . . . . . 1527.7 Detection and Handling of State Flapping . . . . . . . . . . . . . . . . . . . . . . . . . . . . . . . . 1527.8 Notification Escalations . . . . . . . . . . . . . . . . . . . . . . . . . . . . . . . . . . . . . . . . . 1557.9 On-Call Rotations . . . . . . . . . . . . . . . . . . . . . . . . . . . . . . . . . . . . . . . . . . . . 1617.10 Monitoring Service and Host Clusters . . . . . . . . . . . . . . . . . . . . . . . . . . . . . . . . . . 1657.11 Host and Service Dependencies . . . . . . . . . . . . . . . . . . . . . . . . . . . . . . . . . . . . . 1657.12 State Stalking . . . . . . . . . . . . . . . . . . . . . . . . . . . . . . . . . . . . . . . . . . . . . . . 1717.13 Performance Data . . . . . . . . . . . . . . . . . . . . . . . . . . . . . . . . . . . . . . . . . . . . 1727.14 Scheduled Downtime . . . . . . . . . . . . . . . . . . . . . . . . . . . . . . . . . . . . . . . . . . . 1757.15 Adaptive Monitoring . . . . . . . . . . . . . . . . . . . . . . . . . . . . . . . . . . . . . . . . . . . 1767.16 Predictive Dependency Checks . . . . . . . . . . . . . . . . . . . . . . . . . . . . . . . . . . . . . 1777.17 Cached Checks . . . . . . . . . . . . . . . . . . . . . . . . . . . . . . . . . . . . . . . . . . . . . . 1797.18 Passive Host State Translation . . . . . . . . . . . . . . . . . . . . . . . . . . . . . . . . . . . . . . 1837.19 Service and Host Check Scheduling . . . . . . . . . . . . . . . . . . . . . . . . . . . . . . . . . . . 1837.20 Object Inheritance . . . . . . . . . . . . . . . . . . . . . . . . . . . . . . . . . . . . . . . . . . . . 1847.21 Advanced tricks . . . . . . . . . . . . . . . . . . . . . . . . . . . . . . . . . . . . . . . . . . . . . 1957.22 Migrating from Nagios to Shinken . . . . . . . . . . . . . . . . . . . . . . . . . . . . . . . . . . . . 2027.23 Multi layer discovery . . . . . . . . . . . . . . . . . . . . . . . . . . . . . . . . . . . . . . . . . . . 2027.24 Multiple action urls . . . . . . . . . . . . . . . . . . . . . . . . . . . . . . . . . . . . . . . . . . . . 2057.25 Aggregation rule . . . . . . . . . . . . . . . . . . . . . . . . . . . . . . . . . . . . . . . . . . . . . 2057.26 Scaling Shinken for large deployments . . . . . . . . . . . . . . . . . . . . . . . . . . . . . . . . . 2077.27 Defining advanced service dependencies . . . . . . . . . . . . . . . . . . . . . . . . . . . . . . . . 2117.28 Shinken’s distributed architecture . . . . . . . . . . . . . . . . . . . . . . . . . . . . . . . . . . . . 2167.29 Shinken’s distributed architecture with realms . . . . . . . . . . . . . . . . . . . . . . . . . . . . . . 2187.30 Businessimpact modulations . . . . . . . . . . . . . . . . . . . . . . . . . . . . . . . . . . . . . . . 2217.31 Check modulations . . . . . . . . . . . . . . . . . . . . . . . . . . . . . . . . . . . . . . . . . . . . 2227.32 Macro modulations . . . . . . . . . . . . . . . . . . . . . . . . . . . . . . . . . . . . . . . . . . . . 2227.33 Result modulations . . . . . . . . . . . . . . . . . . . . . . . . . . . . . . . . . . . . . . . . . . . . 2237.34 Shinken and Android . . . . . . . . . . . . . . . . . . . . . . . . . . . . . . . . . . . . . . . . . . . 2247.35 Send sms by gateway . . . . . . . . . . . . . . . . . . . . . . . . . . . . . . . . . . . . . . . . . . . 2267.36 Triggers . . . . . . . . . . . . . . . . . . . . . . . . . . . . . . . . . . . . . . . . . . . . . . . . . . 2287.37 Unused nagios parameters . . . . . . . . . . . . . . . . . . . . . . . . . . . . . . . . . . . . . . . . 2297.38 Advanced discovery with Shinken . . . . . . . . . . . . . . . . . . . . . . . . . . . . . . . . . . . . 2367.39 Discovery with Shinken . . . . . . . . . . . . . . . . . . . . . . . . . . . . . . . . . . . . . . . . . 239
ii

8 Config 2438.1 Host Definition . . . . . . . . . . . . . . . . . . . . . . . . . . . . . . . . . . . . . . . . . . . . . . 2448.2 Host Group Definition . . . . . . . . . . . . . . . . . . . . . . . . . . . . . . . . . . . . . . . . . . 2518.3 Service Definition . . . . . . . . . . . . . . . . . . . . . . . . . . . . . . . . . . . . . . . . . . . . 2528.4 Service Group Definition . . . . . . . . . . . . . . . . . . . . . . . . . . . . . . . . . . . . . . . . . 2608.5 Contact Definition . . . . . . . . . . . . . . . . . . . . . . . . . . . . . . . . . . . . . . . . . . . . 2618.6 Contact Group Definition . . . . . . . . . . . . . . . . . . . . . . . . . . . . . . . . . . . . . . . . 2658.7 Time Period Definition . . . . . . . . . . . . . . . . . . . . . . . . . . . . . . . . . . . . . . . . . . 2658.8 Command Definition . . . . . . . . . . . . . . . . . . . . . . . . . . . . . . . . . . . . . . . . . . . 2678.9 Service Dependency Definition . . . . . . . . . . . . . . . . . . . . . . . . . . . . . . . . . . . . . 2698.10 Service Escalation Definition . . . . . . . . . . . . . . . . . . . . . . . . . . . . . . . . . . . . . . 2718.11 Host Dependency Definition . . . . . . . . . . . . . . . . . . . . . . . . . . . . . . . . . . . . . . . 2738.12 Host Escalation Definition . . . . . . . . . . . . . . . . . . . . . . . . . . . . . . . . . . . . . . . . 2748.13 Extended Host Information Definition . . . . . . . . . . . . . . . . . . . . . . . . . . . . . . . . . . 2768.14 Extended Service Information Definition . . . . . . . . . . . . . . . . . . . . . . . . . . . . . . . . 2788.15 Notification Way Definition . . . . . . . . . . . . . . . . . . . . . . . . . . . . . . . . . . . . . . . 2808.16 Realm Definition . . . . . . . . . . . . . . . . . . . . . . . . . . . . . . . . . . . . . . . . . . . . . 2818.17 Arbiter Definition . . . . . . . . . . . . . . . . . . . . . . . . . . . . . . . . . . . . . . . . . . . . 2828.18 Scheduler Definition . . . . . . . . . . . . . . . . . . . . . . . . . . . . . . . . . . . . . . . . . . . 2848.19 Poller Definition . . . . . . . . . . . . . . . . . . . . . . . . . . . . . . . . . . . . . . . . . . . . . 2858.20 Reactionner Definition . . . . . . . . . . . . . . . . . . . . . . . . . . . . . . . . . . . . . . . . . . 2868.21 Broker Definition . . . . . . . . . . . . . . . . . . . . . . . . . . . . . . . . . . . . . . . . . . . . . 288
9 Shinken Architecture 2919.1 Arbiter supervision of Shinken processes . . . . . . . . . . . . . . . . . . . . . . . . . . . . . . . . 2929.2 Advanced architectures . . . . . . . . . . . . . . . . . . . . . . . . . . . . . . . . . . . . . . . . . . 2949.3 How are commands and configurations managed in Shinken . . . . . . . . . . . . . . . . . . . . . . 3009.4 Problems and impacts correlation management . . . . . . . . . . . . . . . . . . . . . . . . . . . . . 3029.5 Shinken Architecture . . . . . . . . . . . . . . . . . . . . . . . . . . . . . . . . . . . . . . . . . . . 303
10 Troubleshooting 30910.1 FAQ - Shinken troubleshooting . . . . . . . . . . . . . . . . . . . . . . . . . . . . . . . . . . . . . 310
11 Integration With Other Software 31311.1 Integration Overview . . . . . . . . . . . . . . . . . . . . . . . . . . . . . . . . . . . . . . . . . . . 31411.2 SNMP Trap Integration . . . . . . . . . . . . . . . . . . . . . . . . . . . . . . . . . . . . . . . . . 31511.3 TCP Wrappers Integration . . . . . . . . . . . . . . . . . . . . . . . . . . . . . . . . . . . . . . . . 31611.4 Use Shinken with Thruk . . . . . . . . . . . . . . . . . . . . . . . . . . . . . . . . . . . . . . . . . 31811.5 Nagios CGI UI . . . . . . . . . . . . . . . . . . . . . . . . . . . . . . . . . . . . . . . . . . . . . . 32011.6 Thruk interface . . . . . . . . . . . . . . . . . . . . . . . . . . . . . . . . . . . . . . . . . . . . . . 32111.7 Use Shinken with ... . . . . . . . . . . . . . . . . . . . . . . . . . . . . . . . . . . . . . . . . . . . 32211.8 Use Shinken with Centreon . . . . . . . . . . . . . . . . . . . . . . . . . . . . . . . . . . . . . . . 32711.9 Use Shinken with Graphite . . . . . . . . . . . . . . . . . . . . . . . . . . . . . . . . . . . . . . . . 32911.10 Use Shinken with Multisite . . . . . . . . . . . . . . . . . . . . . . . . . . . . . . . . . . . . . . . 33211.11 Use Shinken with Nagvis . . . . . . . . . . . . . . . . . . . . . . . . . . . . . . . . . . . . . . . . 33411.12 Use Shinken with Old CGI and VShell . . . . . . . . . . . . . . . . . . . . . . . . . . . . . . . . . 33511.13 Use Shinken with PNP4Nagios . . . . . . . . . . . . . . . . . . . . . . . . . . . . . . . . . . . . . 33611.14 Use Shinken with WebUI . . . . . . . . . . . . . . . . . . . . . . . . . . . . . . . . . . . . . . . . 338
12 Security and Performance Tuning 34312.1 Security Considerations . . . . . . . . . . . . . . . . . . . . . . . . . . . . . . . . . . . . . . . . . 34412.2 Tuning Shinken For Maximum Performance . . . . . . . . . . . . . . . . . . . . . . . . . . . . . . 34712.3 Scaling a Shinken installation . . . . . . . . . . . . . . . . . . . . . . . . . . . . . . . . . . . . . . 34812.4 Shinken performance statistics . . . . . . . . . . . . . . . . . . . . . . . . . . . . . . . . . . . . . . 34812.5 Graphing Performance Info With MRTG and nagiostats . . . . . . . . . . . . . . . . . . . . . . . . 349
iii

13 How to monitor ... 35113.1 Monitoring Active Directory . . . . . . . . . . . . . . . . . . . . . . . . . . . . . . . . . . . . . . . 35213.2 Monitoring Asterisk servers . . . . . . . . . . . . . . . . . . . . . . . . . . . . . . . . . . . . . . . 35413.3 Monitoring DHCP servers . . . . . . . . . . . . . . . . . . . . . . . . . . . . . . . . . . . . . . . . 35613.4 Monitoring IIS servers . . . . . . . . . . . . . . . . . . . . . . . . . . . . . . . . . . . . . . . . . . 35713.5 Monitoring Linux devices . . . . . . . . . . . . . . . . . . . . . . . . . . . . . . . . . . . . . . . . 35913.6 Monitoring Linux devices . . . . . . . . . . . . . . . . . . . . . . . . . . . . . . . . . . . . . . . . 36313.7 Monitoring Linux devices via a Local Agent . . . . . . . . . . . . . . . . . . . . . . . . . . . . . . 36313.8 Monitoring Linux devices via SNMP . . . . . . . . . . . . . . . . . . . . . . . . . . . . . . . . . . 36413.9 Monitoring Microsoft Exchange . . . . . . . . . . . . . . . . . . . . . . . . . . . . . . . . . . . . . 36613.10 Monitoring Microsoft SQL databases . . . . . . . . . . . . . . . . . . . . . . . . . . . . . . . . . . 36913.11 Monitoring MySQL databases . . . . . . . . . . . . . . . . . . . . . . . . . . . . . . . . . . . . . . 37213.12 Monitoring Routers and Switches . . . . . . . . . . . . . . . . . . . . . . . . . . . . . . . . . . . . 37513.13 Monitoring Network devices . . . . . . . . . . . . . . . . . . . . . . . . . . . . . . . . . . . . . . . 37913.14 Monitoring Oracle databases . . . . . . . . . . . . . . . . . . . . . . . . . . . . . . . . . . . . . . . 38313.15 Monitoring Printers . . . . . . . . . . . . . . . . . . . . . . . . . . . . . . . . . . . . . . . . . . . 38913.16 Monitoring Publicly Available Services . . . . . . . . . . . . . . . . . . . . . . . . . . . . . . . . . 39113.17 Monitoring VMware hosts and machines . . . . . . . . . . . . . . . . . . . . . . . . . . . . . . . . 39513.18 Monitoring Windows devices . . . . . . . . . . . . . . . . . . . . . . . . . . . . . . . . . . . . . . 39813.19 Monitoring Windows devices via NSClient++ . . . . . . . . . . . . . . . . . . . . . . . . . . . . . . 40113.20 Monitoring Windows devices via WMI . . . . . . . . . . . . . . . . . . . . . . . . . . . . . . . . . 404
14 How to contribute 40914.1 Shinken packs . . . . . . . . . . . . . . . . . . . . . . . . . . . . . . . . . . . . . . . . . . . . . . 41014.2 Shinken modules . . . . . . . . . . . . . . . . . . . . . . . . . . . . . . . . . . . . . . . . . . . . . 41114.3 Getting Help and Ways to Contribute . . . . . . . . . . . . . . . . . . . . . . . . . . . . . . . . . . 41214.4 Shinken Package Manager . . . . . . . . . . . . . . . . . . . . . . . . . . . . . . . . . . . . . . . . 414
15 Development 41715.1 Shinken Programming Guidelines . . . . . . . . . . . . . . . . . . . . . . . . . . . . . . . . . . . . 41815.2 Test Driven Development . . . . . . . . . . . . . . . . . . . . . . . . . . . . . . . . . . . . . . . . 41915.3 Shinken Plugin API . . . . . . . . . . . . . . . . . . . . . . . . . . . . . . . . . . . . . . . . . . . 42315.4 Developing Shinken Daemon Modules . . . . . . . . . . . . . . . . . . . . . . . . . . . . . . . . . 42515.5 Hacking the Shinken Code . . . . . . . . . . . . . . . . . . . . . . . . . . . . . . . . . . . . . . . . 42615.6 Shinken documentation . . . . . . . . . . . . . . . . . . . . . . . . . . . . . . . . . . . . . . . . . 429
16 Deprecated 43516.1 Feature comparison between Shinken and Nagios . . . . . . . . . . . . . . . . . . . . . . . . . . . . 436
17 Shinken modules 439
Python Module Index 441
iv

CHAPTER 1
About
1
Shinken Documentation, Release 2.4
1.1 About Shinken
Shinken is an open source monitoring framework written in Python under the terms of the GNU Affero General PublicLicense . It was created in 2009 as a simple proof of concept of a Nagios patch. The first release of Shinken wasthe December 1st of 2009 as simple monitoring tool. Since the 2.0 version (April 2014) Shinken is described asa monitoring framework due to its high number of modules. For the same reason, modules are now in separatedrepositories. You can find some in the shinken-monitoring organization’s page on Github
1.1.1 Shinken Project
Shinken is now an open source monitoring framework but was first created to be a open source monitoring solution.This difference is important for the team, a framework does not have the same use than an all in one solution. Themain idea when developing Shinken is the flexibility which is our definition of framework. Nevertheless, Shinken wasfirst made differently and we try to keep all the good things that made it a monitoring solution :
• Easy to install : install is mainly done with pip but some packages are available (deb / rpm) and we are planningto provide nightly build.
• Easy for new users : once installed, Shinken provide a simple command line interface to install new module andpacks.
• Easy to migrate from Nagios : we want Nagios configuration and plugins to work in Shinken so that it is a “inplace” replacement. Plugins provide great flexibility and are a big legacy codebase to use. It would be a shamenot to use all this community work
• Multi-platform : python is available in a lot of OS. We try to write generic code to keep this possible.
• Utf8 compliant : python is here to do that. For now Shinken is compatible with 2.6-2.7 version but python 3.Xis even more character encoding friendly.
• Independent from other monitoring solution : our goal is to provide a modular tool that can integrate with othersthrough standard interfaces). Flexibility first.
• Flexible : in an architecture point view. It is very close to our scalability wish. Cloud computing is makearchitecture moving a lot, we have to fit to it.
• Fun to code : python ensure good code readability. Adding code should not be a pain when developing.
This is basically what Shinken is made of. Maybe add the “keep it simple” Linux principle and it’s prefect. There isnothing we don’t want, we consider every features / ideas.
1.1.2 Features
Shinken has a lot of features, we started to list some of them in the last paragraph. Let’s go into details:
• Role separated daemons : we want a daemon to do one thing but doing it good. There are 6 of thembut one is not compulsory.
• Great flexibility : you didn’t got that already? Shinken modules allow it to talk to almost everythingyou can imagine.
Those to points involve all the following :
• Data export to databases :
– Graphite
– InfluxDB
– RRD
2 Chapter 1. About

Shinken Documentation, Release 2.4
– GLPI
– CouchDB
– Livestatus (MK_Livestatus reimplementation)
– Socket write for other purpose (Splunk, Logstash, Elastic Search)
– MySQL (NDO reimplementation)
– Oracle (NDO reimplementation)
• Integration with web user interface :
– WebUI (Shinken own UI)
– Thruk
– Adagios
– Multisite
– Nagvis
– PNP4Nagios
– NConf
– Centreon (With NDO, not fully working, not recommended)
• Import config from databases :
– GLPI
– Amazon EC2
– MySQL
– MongoDB
– Canonical Landscape
• Shinken provide sets of configuration, named packs, for a huge number of services :
– Databases (Mysql, Oracle, MSSQL, memcached, mongodb, influxdb etc.)
– Routers, Switches (Cisco, Nortel, Procurve etc.)
– OS (Linux, windows, Aix, HP-UX etc.)
– Hypervisors (VMWare, Vsphere)
– Protocols (HTTP, SSH, LDAP, DNS, IMAP, FTP, etc.)
– Application (Weblogic, Exchange, Active Directory, Tomcat, Asterisk, etc.)
– Storage (IBM-DS, Safekit, Hacmp, etc.)
• Smart SNMP polling : The SNMP Booster module is a must have if you have a huge infrastructureof routers and switches.
• Scalability : no server overloading, you just have to install new daemons on another server and loadbalancing is done.
But Shinken is even more :
• Realm concept : you can monitor independent environments / customer
• DMZ monitroing : some daemon have passive facilities so that firewall don’t block monitoring.
1.1. About Shinken 3
Shinken Documentation, Release 2.4
• Business impact : Shinken can differentiate impact of a critical alert on a toaster versus the webstore
• Efficient correlation between parent-child relationship and business process rules
• High availability : daemons can have spare ones.
• Business rules : For a higher level of monitoring. Shinken can notify you only if 3 out 5 of yourserver are down
• Very open-minded team : help is always welcome, there is job for everyone.
1.1.3 Release cycle
Shinken team is trying to setup a new release cycle with an objective of 4 release per year. Each release is divided intothree part : re-factoring (few weeks), features (one month), freezing (one month). Roadmap is available in a specificGithub issue, feature addition can be discussed there. Technical point of view about a specific feature are discussed ina separated issue.
1.1.4 Release code names
I (Jean Gabès) keep the right to name the code name of each release. That’s the only thing I will keep for me in thisproject as its founder. :)
4 Chapter 1. About

CHAPTER 2
Getting Started
5

Shinken Documentation, Release 2.4
2.1 Advice for Beginners
Congratulations on choosing Shinken! Shinken is quite powerful and flexible, but it can take a bit of work to get itconfigured just the way you’d like. Once you become familiar with how it works and what it can do for you, you’llnever want to be without it :-) Here are some important things to keep in mind for first-time Shinken users:
• Relax - it takes some time. Don’t expect to be able to get things working exactly the way you want them rightoff the bat. Setting up Shinken can involve a bit of work - partly because of the options that Shinken offers,partly because you need to know what to monitor on your network (and how best to do it).
• Use the quickstart instructions. The Quickstart installation guide is designed to get most new users up andrunning with a basic Shinken setup fairly quickly. Within 10 minutes you can have Shinken installed andmonitoring your local system. Once that’s complete, you can move on to learning how to configure Shinken todo more.
• Get familiar with the Getting Started section. Shinken has a getting started documentation section, that iseasier to read through for common undertakings and to understand how Shinken works. It can be simpler tofollow than the exhaustive official documentation.
• Read the documentation. Shinken can be tricky to configure when you’ve got a good grasp of what’s goingon, and nearly impossible if you don’t. Make sure you read the documentation (particularly the sections onConfiguring Shinken and The Basics). Save the advanced topics for when you’ve got a good understanding ofthe basics.
• Seek the help of others. If you’ve read the documentation, reviewed the sample config files, and are stillhaving problems, go through the Shinken user resources to learn how you can get help and contribute back tothe project.
6 Chapter 2. Getting Started

Shinken Documentation, Release 2.4
2.2 Installations
2.2. Installations 7

Shinken Documentation, Release 2.4
2.2.1 10 Minutes Shinken Installation Guide
Summary
By following this tutorial, in 10 minutes you will have the core monitoring system for your network.
The very first step is to verify that your server meets the requirements, the installation script will try to meet allrequirements automatically.
You can get familiar with the Shinken Architecture now, or after the installation. This will explain the softwarecomponents and how they fit together.
• Installation : GNU/Linux & Unix
• Installation : Windows
Ready? Let’s go!
Requirements
Mandatory Requirements
• Python 2.6 or higher (2.7 will get higher performance)
• python-pycurl Python package for Shinken daemon communication
• setuptools or distribute Python package for installation
Conditional Requirements
• Python 2.7 is required for developers to run the test suite, shinken/test/
• python-cherrypy3 (recommended) enhanceddaemons communications, especially in HTTPS mode
• Monitoring Plugins (recommended) provides a set of plugins to monitor host (Shinken uses check_icmp bydefault install). Monitoring plugins are available on most linux distributions (nagios-plugins package)
Warning: Do not mix installation methods! If you wish to change method, use the uninstaller from the chosenmethod THEN install using the alternate method.
GNU/Linux & Unix Installation
Method 1: Pip
Shinken 2.4 is available on Pypi : https://pypi.python.org/pypi/Shinken/2.4 You can download the tarball and executethe setup.py or just use the pip command to install it automatically.
apt-get install python-pip python-pycurladduser shinkenpip install shinken
8 Chapter 2. Getting Started

Shinken Documentation, Release 2.4
Method 2: Packages
For now the 2.4 packages are not available, but the community is working hard for it! Packages are simple, easy toupdate and clean. Packages should be available on Debian/Ubuntu and Fedora/RH/CentOS soon (basically .deb and.rpm).
Method 3: Installation from sources
Download last stable Shinken tarball archive (or get the latest git snapshot) and extract it somewhere:
adduser shinkenwget http://www.shinken-monitoring.org/pub/shinken-2.4.tar.gztar -xvzf shinken-2.4.tar.gzcd shinken-2.4python setup.py install
Shinken 2.X uses LSB path. If you want to stick to one directory installation you can of course. Default paths are thefollowing:
• /etc/shinken for configuration files
• /var/lib/shinken for shinken modules, retention files...
• /var/log/shinken for log files
• /var/run/shinken for pid files
Windows Installation
For 2.X+ the executable installer may not be provided. Consequently, installing Shinken on a Windows may be manualwith setup.py. Steps are basically the same as on Linux (Python install etc.) but in windows environment it’s always abit tricky.
2.2.2 Configure Shinken for Production
If you have installed Shinken with packages, they should be production-ready. Otherwise, you should do the followingsteps to ensure everything is fine.
Enable Shinken at boot
This depend on your Linux distribution (actually it’s related to the init mechanism : upstart, systemd, sysv ..) you mayuse one of the following tool.
Systemd
This enable Shinken service on a systemd base OS. Note that a Shinken service can be used to start all service.
for i in arbiter poller reactionner scheduler broker receiver; dosystemctl enable shinken-$i.service;done
2.2. Installations 9

Shinken Documentation, Release 2.4
RedHat / CentOS
This enable Shinken service on a RedHat/CentOS. Note that a Shinken service can be used to start all service.
chkconfig shinken on
Debian / Ubuntu
This enable Shinken service on a Debian/Ubuntu.
update-rc.d shinken defaults
Start Shinken
This also depend on the OS you are running. You can start Shinken with one of the following:
/etc/init.d/shinken startservice shinken startsystemctl start shinken
Configure Shinken for Sandbox
If you want to try Shinken and keep a simple configuration you may not need to have Shinken enabled at boot. In thiscase you can just start Shinken with the simple shell script provided into the sources.
./bin/launch_all.sh
You will have Shinken Core working. No module are loaded for now. You need to install some with the command lineinterface
Configure Shinken for Development
If you are willing to edit Shinken source code, you should have chosen the third installation method. In this case youhave currently the whole source code in a directory.
The first thing to do is edit the etc/shinken.cfg and change the shinken user and group (you can comment the line).You don’t need a shinken user do you? Just run shinken as the current user, creating user is for real shinken setup :)
To manually launch Shinken do the following :
./bin/shinken-scheduler -c /etc/shinken/daemons/schedulerd.ini -d
./bin/shinken-poller -c /etc/shinken/daemons/pollerd.ini -d
./bin/shinken-broker -c /etc/shinken/daemons/brokerd.ini -d
./bin/shinken-reactionner -c /etc/shinken/daemons/reactionnerd.ini -d
./bin/shinken-arbiter -c /etc/shinken/shinken.cfg -d
./bin/shinken-receiver -c /etc/shinken/daemons/receiverd.ini -d
2.2.3 Where is the configuration?
The configuration is where you put the etc directory. Usually it’s /etc/shinken or C:/Program Files/Shinken.
• shinken.cfg is meant to be main configuration file that will call all others
10 Chapter 2. Getting Started

Shinken Documentation, Release 2.4
2.2.4 I migrate from Nagios, do I need to change my Nagios configuration?
No, there is no need to change your existing Nagios configuration. You can use an existing Nagios configuration as-is,as long as you have installed the plugins expected by the configuration.
Once you are comfortable with Shinken you can start to use its unique and powerful features.
2.2.5 What do I need to do next
The next logical steps for a new user are as listed in the Getting Started pages:
• Did you read the Shinken Architecture presentation?
• Complete the Shinken basic installation
• Start adding devices to monitor, such as:
– Public services (HTTP, SMTP, IMAP, SSH, etc.)
– GNU/Linux clients
– Windows clients
– Routers
– Printers
• Setup the web interface:
– Use the default WebUI
– Or set-up a third-party web interface and addons.
2.2.6 Getting Help
New and experienced users sometimes need to find documentation, troubleshooting tips, a place to chat, etc. TheShinken community provides many resources to help you. You can discuss installation documentation changes in theShinken forums.
2.3 Upgrading Shinken
2.3.1 Upgrading From Previous Shinken Releases
See the update page for that. Basically it’s only about backuping and installing from a later git version (or package).
2.3.2 Upgrading From Nagios 3.x
Just install Shinken and start the arbiter with your Nagios configuration. That’s all.
2.3. Upgrading Shinken 11

Shinken Documentation, Release 2.4
12 Chapter 2. Getting Started

CHAPTER 3
Configuring Shinken
13

Shinken Documentation, Release 2.4
3.1 Configuration Overview
3.1.1 Introduction
There are several different configuration files that you’re going to need to create or edit before you start monitoringanything. Be patient! Configuring Shinken can take quite a while, especially if you’re first-time user. Once you figureout how things work, it’ll all be well worth your time. :-)
Sample configuration files are installed in the /etc/shinken/ directory when you follow the Quickstart installationguide.
3.1.2 Main Configuration File : shinken.cfg
Note: A main configuration file is a file given to the arbiter as parameter from command_line. In Shinken 2.0, thereis only shinken.cfg
The 2.0 introduces a new configuration layout. The basic configuration is now split into several small files. Don’t beafraid, it’s actually a better layout for your mind because one file ~ one object definition. This helps a lot to understandobject concepts and uses in Shinken configuration.
However, one file, among others can be considered as the entry point : shinken.cfg. This is the main configurationfile.
This configuration file is pointing to all configuration directories Shinken needs. The cfg_dir= statement is actuallydoing all the job. It includes all the configuration files described below.
Note: The cfg_dir statement will only read files that end with .cfg. Any other file is skipped.
Documentation for the main configuration file can be found Main Configuration File Options.
3.1.3 Daemons Definition Files
Files for daemons definition are located in separated directories. For example pollers definitions are in the pollersdirectory. Each directory contains one file per existing daemon.
3.1.4 Modules Definition Files
Files for modules definition are located in /etc/shinken/modules. Each module has its own configuration file. Asmodules are loaded by daemons, modules files are referenced in daemons files. The statement is module to specify amodule to load.
14 Chapter 3. Configuring Shinken

Shinken Documentation, Release 2.4
3.1.5 Resource Files
Resource files can be used to store user-defined macros. The main point of having resource files is to use them to storesensitive configuration information (like passwords), without making them available to the CGIs.
You can specify one or more optional resource files by using the resource_file directive in your main configuration file.
3.1.6 Object Definition Files
Object definition files are used to define hosts, services, hostgroups, contacts, contactgroups, commands, etc. This iswhere you define all the things you want monitor and how you want to monitor them.
You can specify one or more object definition files by using the cfg_file and/or cfg_dir directives in your main config-uration file.
An introduction to object definitions, and how they relate to each other, can be found here.
3.2 Main Configuration File (shinken.cfg) Options
When creating and/or editing configuration files, keep the following in mind:
• Lines that start with a ‘”#”’ character are taken to be comments and are not processed
• Variable names are case-sensitive
• If you want to configure a process to use a specific module:
3.2. Main Configuration File (shinken.cfg) Options 15

Shinken Documentation, Release 2.4
– You must define the module in a xxx.cfg file in the modules directory
– You must reference it in the modules section for that process, e.g. the broker.cfg file
The main configuration file is “shinken.cfg”. It is located in the “/etc/shinken/” directory. Sample main configurationfiles are installed for you when you follow the Quickstart installation guide. Below are listed parameters currentlyused in the file. For other parameters (not mentionned by default) see Main Configuration File Advanced
3.2.1 Default used options
Cfg dir and Cfg files
Format :
cfg_dir=<directory_name>cfg_file=<file_name>
Those are statements and not parameters. The arbiter considers them as order to open other(s) configuration(s)file(s) For the cfg_dir one, the arbiter only reads files ending with ”.cfg”. The arbiter does read recursively directoryfor files but does not consider lines into those files as statements anymore.
This means that a cfg_dir or cfg_file is considered as a parameter outside of shinken.cfg (or any configuration filedirectly given to the arbiter as parameter in a command line) The arbiter handles main configuration files differentlythan any other files.
With those 2 statements, all Shinken configuration is defined : daemons, objects, resources.
Automatic State Retention Update Interval
Format:
retention_update_interval=<minutes>
Default:
retention_update_interval=60
This setting determines how often (in minutes) that Shinken scheduler will automatically save retention data duringnormal operation. If you set this value to 0, it will not save retention data at regular intervals, but it will still saveretention data before shutting down or restarting. If you have disabled state retention (with the State Retention Optionoption), this option has no effect.
Maximum Host/Service Check Spread
Format:
max_service_check_spread=<minutes>max_host_check_spread=<minutes>
Default:
max_service_check_spread=30max_host_check_spread=30
This option determines the maximum number of minutes from when Shinken starts that all hosts/services (that arescheduled to be regularly checked) are checked. This option will ensure that the initial checks of all hosts/servicesoccur within the timeframe you specify. Default value is 30 (minutes).
16 Chapter 3. Configuring Shinken

Shinken Documentation, Release 2.4
Service/Host Check Timeout
Format:
service_check_timeout=<seconds>host_check_timeout=<seconds>
Default:
service_check_timeout=60host_check_timeout=30
This is the maximum number of seconds that Shinken will allow service/host checks to run. If checks exceed thislimit, they are killed and a CRITICAL state is returned. A timeout error will also be logged.
There is often widespread confusion as to what this option really does. It is meant to be used as a last ditch mechanismto kill off plugins which are misbehaving and not exiting in a timely manner. It should be set to something high (like60 seconds or more), so that each check normally finishes executing within this time limit. If a check runs longer thanthis limit, Shinken will kill it off thinking it is a runaway processes.
Timeout Exit Status
Format:
timeout_exit_status=[0,1,2,3]
Default:
timeout_exit_status=2
State set by Shinken in case of timeout.
Flap History
Format:
flap_history=<int>
Default:
flap_history=20
This option is used to set the history size of states keep by the scheduler to make the flapping calculation. By default,the value is 20 states kept.
The size in memory is for the scheduler daemon : 4Bytes * flap_history * (nb hosts + nb services). For a big en-vironment, it costs 4 * 20 * (1000+10000) - 900Ko. So you can raise it to higher value if you want. To have moreinformation about flapping, you can read this.
Max Plugins Output Length
Format:
max_plugins_output_length=<int>
Default:
3.2. Main Configuration File (shinken.cfg) Options 17
Shinken Documentation, Release 2.4
max_plugins_output_length=8192
This option is used to set the max size in bytes for the checks plugins output. So if you saw truncated output like forhuge disk check when you have a lot of partitions, raise this value.
Enable problem/impacts states change
Format:
enable_problem_impacts_states_change=<0/1>
Default:
enable_problem_impacts_states_change=0
This option is used to know if we apply or not the state change when a host or service is impacted by a root problem(like the service’s host going down or a host’s parent being down too). The state will be changed by UNKNONW fora service and UNREACHABLE for a host until their next schedule check. This state change do not count as a attempt,it’s just for console so the users know that theses objects got problems and the previous states are not sure.
Disable Old Nagios Parameters Whining
Format:
disable_old_nagios_parameters_whining=<0/1>
Default:
disable_old_nagios_parameters_whining=0
If 1, disable all notice and warning messages at configuration checking
Timezone Option
Format:
use_timezone=<tz from tz database>
Default:
use_timezone=''
This option allows you to override the default timezone that this instance of Shinken runs in. Useful if you havemultiple instances of Shinken that need to run from the same server, but have different local times associated withthem. If not specified, Shinken will use the system configured timezone.
Environment Macros Option
Format:
enable_environment_macros=<0/1>
Default:
18 Chapter 3. Configuring Shinken

Shinken Documentation, Release 2.4
enable_environment_macros=1
This option determines whether or not the Shinken daemon will make all standard macros available as environmentvariables to your check, notification, event hander, etc. commands. In large installations this can be problematicbecause it takes additional CPU to compute the values of all macros and make them available to the environment. Italso cost a increase network communication between schedulers and pollers.
• 0 = Don’t make macros available as environment variables
• 1 = Make macros available as environment variables
Initial States Logging Option (Not implemented)
Format:
log_initial_states=<0/1>
Default:
log_initial_states=1
This variable determines whether or not Shinken will force all initial host and service states to be logged, even if theyresult in an OK state. Initial service and host states are normally only logged when there is a problem on the firstcheck. Enabling this option is useful if you are using an application that scans the log file to determine long-term statestatistics for services and hosts.
• 0 = Don’t log initial states
• 1 = Log initial states
Event Handler during downtimes
Format:
no_event_handlers_during_downtimes=<0/1>
Default:
no_event_handlers_during_downtimes=0
This option determines whether or not Shinken will run event handlers when the host or service is in a scheduleddowntime.
• 0 = Launch event handlers (Nagios behavior)
• 1 = Don’t launch event handlers
References:
• http://www.mail-archive.com/[email protected]/msg01394.html
• https://github.com/naparuba/shinken/commit/9ce28d80857c137e5b915b39bbb8c1baecc821f9
3.2.2 Arbiter daemon part
The following parameters are common to all daemons.
3.2. Main Configuration File (shinken.cfg) Options 19
Shinken Documentation, Release 2.4
Workdir
Format:
workdir=<directory>
Default :
workdir=/var/run/shinken/
This variable specify the working directory of the daemon. In the arbiter case, if the value is empty, the directory nameof lock_file parameter. See below
Arbiter Lock File
Defined in nagios.cfg file.
Format:
lock_file=<file_name>
Example:
lock_file=/var/lib/shinken/arbiterd.pid
This option specifies the location of the lock file that Shinken arbiter daemon should create when it runs as a daemon(when started with the “-d” command line argument). This file contains the process id (PID) number of the runningarbiter process.
Local Log
Format:
local_log=<filename>
Default:
local_log=/var/log/shinken/arbiterd.log'
This variable specifies the log file for the daemon.
Log Level
Format:
log_level=[DEBUG,INFO,WARNING,ERROR,CRITICAL]
Default:
log_level=WARNING
This variable specifies which logs will be raised by the arbiter daemon. For others daemons, it can be defined in theirlocal *d.ini files.
20 Chapter 3. Configuring Shinken
Shinken Documentation, Release 2.4
Arbiter Daemon User
Defined in brokerd.ini, brokerd-windows.ini, pollerd.ini, pollerd-windows.ini, reactionnerd.ini, schedulerd.ini andschedulerd-windows.ini.
Format:
shinken_user=username
Default:
shinken_user=<current user>
This is used to set the effective user that the Arbiter process (main process) should run as. After initial programstartup, Shinken will drop its effective privileges and run as this user.
Arbiter Daemon user Group
Defined in brokerd.ini, brokerd-windows.ini, pollerd.ini, pollerd-windows.ini, reactionnerd.ini, schedulerd.ini andschedulerd-windows.ini.
Format:
shinken_group=groupname
Default:
shinken_group=<current group>
This is used to set the effective group of the user used to launch the arbiter daemon.
Modules directory
Format:
modules_dir=<direname>
Default:
modules_dir=/var/lib/shinken/modules
Path to the modules directory
Daemon Enabled
Format:
daemon_enabled=[0/1]
Default:
:: daemon_enabled=1
Set to 0 if you want to make this daemon (arbiter) NOT to run
3.2. Main Configuration File (shinken.cfg) Options 21

Shinken Documentation, Release 2.4
Use SSL
Format:
use_ssl=[0/1]
Default:
use_ssl=0
Use SSl or not. You have to enable it on other daemons too.
Ca Cert
Format:
ca_cert=<filename>
Default:
ca_cert=etc/certs/ca.pem
Certification Authority (CA) certificate
Warning: Put full paths for certs
Server Cert
Format:
server_cert=<filename>
Default:
server_cert=/etc/certs/server.cert
Server certificate for SSL
Warning: Put full paths for certs
Server Key
Format:
server_key=<filename>
Default:
server_key=/etc/certs/server.key
Server key for SSL
Warning: Put full paths for certs
22 Chapter 3. Configuring Shinken

Shinken Documentation, Release 2.4
Hard SSL Name Check
Format:
hard_ssl_name_check=[0/1]
Default:
hard_ssl_name_check=0
Enable SSL name check.
HTTP Backend
Format:
http_backend=[auto, cherrypy, swsgiref]
Default:
http_backend=auto
Specify which http_backend to use. Auto is better. If cherrypy3 is not available, it will fail back to swsgiref .. note::Actually, if you specify something else than cherrypy or auto, it will fall into swsgiref
3.3 Object Configuration Overview
3.3.1 What Are Objects?
Objects are all the elements that are involved in the monitoring and notification logic. Types of objects include:
• Services
• Service Groups
• Hosts
• Host Groups
• Contacts
• Contact Groups
• Commands
• Time Periods
• Notification Escalations
• Notification and Execution Dependencies
More information on what objects are and how they relate to each other can be found below.
3.3.2 Where Are Objects Defined?
Objects can be defined in one or more configuration files and/or directories that you specify using the cfg_file and/orcfg_dir directives in the main configuration file.
3.3. Object Configuration Overview 23

Shinken Documentation, Release 2.4
When you follow the Quickstart installation guide, several sample object configuration files are placed in“/etc/shinken/”. Every object has now is own directory. You can use these sample files to see how object inheri-tance works and learn how to define your own object definitions.
3.3.3 How Are Objects Defined?
Objects are defined in a flexible template format, which can make it much easier to manage your Shinken configurationin the long term. Basic information on how to define objects in your configuration files can be found here.
Once you get familiar with the basics of how to define objects, you should read up on object inheritance, as it willmake your configuration more robust for the future. Seasoned users can exploit some advanced features of objectdefinitions as described in the documentation on object tricks.
3.3.4 Objects Explained
Some of the main object types are explained in greater detail below...
Hosts
Hosts are one of the central objects in the monitoring logic. Important attributes of hosts are as follows:
• Hosts are usually physical devices on your network (servers, workstations, routers, switches, printers, etc).
• Hosts have an address of some kind (e.g. an IP or MAC address).
• Hosts have one or more more services associated with them.
• Hosts can have parent/child relationships with other hosts, often representing real-world network connections,which is used in the network reachability logic.
Host Groups
Host Groups are groups of one or more hosts. Host groups can make it easier to
• view the status of related hosts in the Shinken web interface and
• simplify your configuration through the use of object tricks.
Services
Services are one of the central objects in the monitoring logic. Services are associated with hosts and can be:
• Attributes of a host (CPU load, disk usage, uptime, etc.)
• Services provided by the host (“HTTP”, “POP3”, “FTP”, “SSH”, etc.)
• Other things associated with the host (“DNS” records, etc.)
Service Groups
Service Groups are groups of one or more services. Service groups can make it easier to
• view the status of related services in the Shinken web interface and
• simplify your configuration through the use of object tricks.
24 Chapter 3. Configuring Shinken

Shinken Documentation, Release 2.4
Contacts
Contacts are people involved in the notification process:
• Contacts have one or more notification methods (cellphone, pager, email, instant messaging, etc.)
• Contacts receive notifications for hosts and service they are responsible for
Contact Groups
Contact Groups are groups of one or more contacts. Contact groups can make it easier to define all the people whoget notified when certain host or service problems occur.
Timeperiods
Timeperiods are are used to control:
• When hosts and services can be monitored
• When contacts can receive notifications
Information on how timeperiods work can be found here.
Commands
Commands are used to tell Shinken what programs, scripts, etc. it should execute to perform:
• Host and service checks
• Notifications
• Event handlers
• and more...
3.4 Object Definitions
3.4.1 Introduction
One of the features of Shinken’ object configuration format is that you can create object definitions that inherit prop-erties from other object definitions. An explanation of how object inheritance works can be found here. I stronglysuggest that you familiarize yourself with object inheritance once you read over the documentation presented below,as it will make the job of creating and maintaining object definitions much easier than it otherwise would be. Also,read up on the object tricks that offer shortcuts for otherwise tedious configuration tasks.
When creating and/or editing configuration files, keep the following in mind:
• Lines that start with a ‘”#”’ character are taken to be comments and are not processed
• Directive names are case-sensitive
3.4.2 Sample Configuration Files
Sample object configuration files are installed in the “/etc/shinken/” directory when you follow the quickstart installa-tion guide.
3.4. Object Definitions 25

Shinken Documentation, Release 2.4
3.4.3 Object Types
• Host
• Host Group
• Service
• Service Group
• Contact
• Contact Group
• Time Period
• Command
• Service Dependency
• Service Escalation
• Host Dependency
• Host Escalation
• Extended Host Information
• Extended Service Information
• Realm
• Arbiter
• Scheduler
• Poller
• Reactionner
• Broker
3.5 Custom Object Variables
3.5.1 Introduction
Users often request that new variables be added to host, service, and contact definitions. These include variablesfor “SNMP” community, MAC address, AIM username, Skype number, and street address. The list is endless. Theproblem that I see with doing this is that it makes Nagios less generic and more infrastructure-specific. Nagios wasintended to be flexible, which meant things needed to be designed in a generic manner. Host definitions in Nagios, forexample, have a generic “address” variable that can contain anything from an IP address to human-readable drivingdirections - whatever is appropriate for the user’s setup.
Still, there needs to be a method for admins to store information about their infrastructure components in their Nagiosconfiguration without imposing a set of specific variables on others. Nagios attempts to solve this problem by allowingusers to define custom variables in their object definitions. Custom variables allow users to define additional propertiesin their host, service, and contact definitions, and use their values in notifications, event handlers, and host and servicechecks.
26 Chapter 3. Configuring Shinken
Shinken Documentation, Release 2.4
3.5.2 Custom Variable Basics
There are a few important things that you should note about custom variables:
• Custom variable names must begin with an underscore (_) to prevent name collision with standard variables
• Custom variable names are case-insensitive
• Custom variables are inherited from object templates like normal variables
• Scripts can reference custom variable values with macros and environment variables
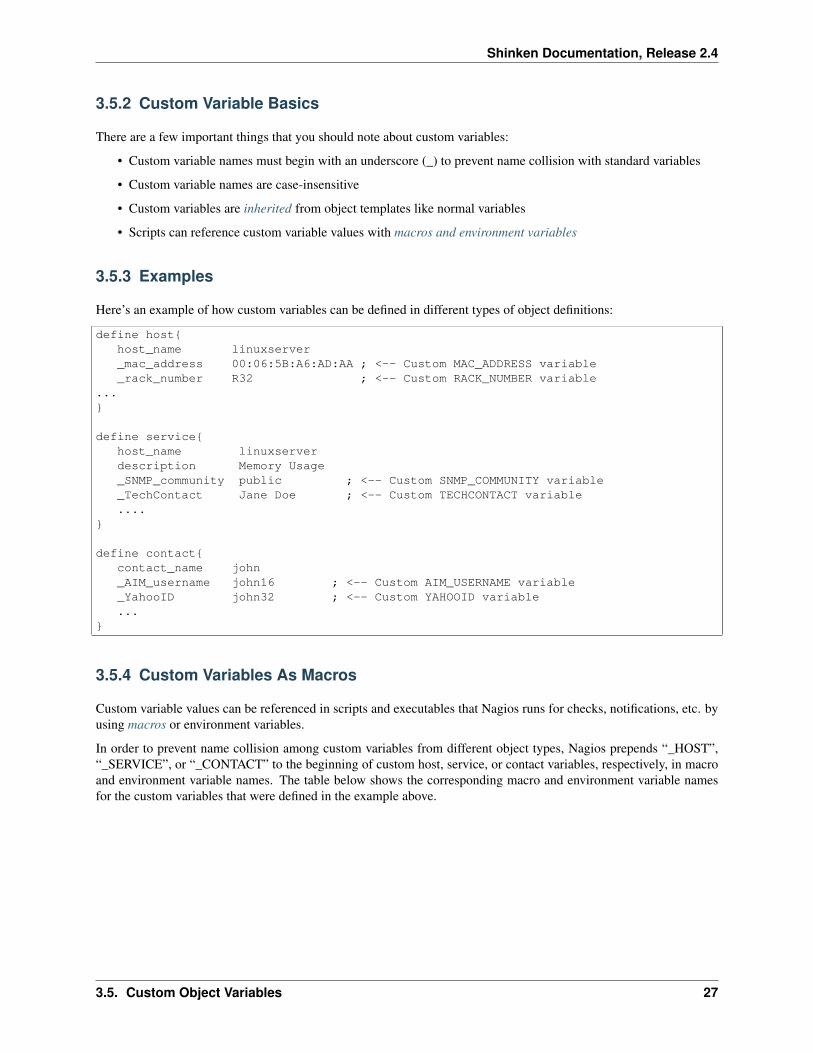
3.5.3 Examples
Here’s an example of how custom variables can be defined in different types of object definitions:
define host{host_name linuxserver_mac_address 00:06:5B:A6:AD:AA ; <-- Custom MAC_ADDRESS variable_rack_number R32 ; <-- Custom RACK_NUMBER variable
...}
define service{host_name linuxserverdescription Memory Usage_SNMP_community public ; <-- Custom SNMP_COMMUNITY variable_TechContact Jane Doe ; <-- Custom TECHCONTACT variable....
}
define contact{contact_name john_AIM_username john16 ; <-- Custom AIM_USERNAME variable_YahooID john32 ; <-- Custom YAHOOID variable...
}
3.5.4 Custom Variables As Macros
Custom variable values can be referenced in scripts and executables that Nagios runs for checks, notifications, etc. byusing macros or environment variables.
In order to prevent name collision among custom variables from different object types, Nagios prepends “_HOST”,“_SERVICE”, or “_CONTACT” to the beginning of custom host, service, or contact variables, respectively, in macroand environment variable names. The table below shows the corresponding macro and environment variable namesfor the custom variables that were defined in the example above.
3.5. Custom Object Variables 27

Shinken Documentation, Release 2.4
ObjectType
Variable Name Macro Name Environment Variable
Host MAC_ADDRESS $_HOSTMAC_ADDRESS$ NAGIOS__HOSTMAC_ADDRESSHost RACK_NUMBER $_HOSTRACK_NUMBER$ NAGIOS__HOSTRACK_NUMBERService SNMP_COMMUNITY$_SERVICES-
NMP_COMMUNITY$NA-GIOS__SERVICESNMP_COMMUNITY
Service TECHCONTACT $_SERVICETECHCONTACT$ NAGIOS__SERVICETECHCONTACTContact AIM_USERNAME $_CONTAC-
TAIM_USERNAME$NA-GIOS__CONTACTAIM_USERNAME
Contact YAHOOID $_CONTACTYAHOOID$ NAGIOS__CONTACTYAHOOID
3.5.5 Custom Variables And Inheritance
Custom object variables are inherited just like standard host, service, or contact variables.
3.6 Main advanced configuration
3.6.1 Tuning and advanced parameters
Important: If you do not know how to change the values of theses parameters, don’t touch them :) (and ask for helpon the mailing list).
3.6.2 Performance data parameters
Performance Data Processor Command Timeout
Format:
perfdata_timeout=<seconds>
Example:
perfdata_timeout=5
This is the maximum number of seconds that Shinken will allow a host performance data processor command orservice performance data processor command to be run. If a command exceeds this time limit it will be killed and awarning will be logged.
Performance Data Processing Option
Format:
process_performance_data=<0/1>
Example:
process_performance_data=1
This value determines whether or not Shinken will process host and service check performance data.
• 0 = Don’t process performance data
28 Chapter 3. Configuring Shinken

Shinken Documentation, Release 2.4
• 1 = Process performance data (default)
If you want to use tools like PNP, NagiosGrapher or Graphite set it to 1.
Host/Service Performance Data Processing Command
Format:
host_perfdata_command=<configobjects/command>service_perfdata_command=<configobjects/command>
Example:
host_perfdata_command=process-host-perfdataservice_perfdata_command=process-service-perfdata
This option allows you to specify a command to be run after every host/service check to process host/service perfor-mance data that may be returned from the check. The command argument is the short name of a command definitionthat you define in your object configuration file. This command is only executed if the Performance Data ProcessingOption option is enabled globally and if the “process_perf_data” directive in the host definition is enabled.
Host/Service Performance Data File
Format:
host_perfdata_file=<file_name>service_perfdata_file=<file_name>
Example:
host_perfdata_file=/var/lib/shinken/host-perfdata.datservice_perfdata_file=/var/lib/shinken/service-perfdata.dat
This option allows you to specify a file to which host/service performance data will be written after every host check.Data will be written to the performance file as specified by the Host Performance Data File Template option or theservice one. Performance data is only written to this file if the Performance Data Processing Option option is enabledglobally and if the “process_perf_data” directive in the host definition is enabled.
Host Performance Data File Template
Format:
host_perfdata_file_template=<template>
Example:
host_perfdata_file_template=[HOSTPERFDATA]\t$TIMET$\t$HOSTNAME$\t$HOSTEXECUTIONTIME$\t$HOSTOUTPUT$\t$HOSTPERFDATA$
This option determines what (and how) data is written to the host performance data file. The template may containmacros, special characters (t for tab, r for carriage return, n for newline) and plain text. A newline is automaticallyadded after each write to the performance data file.
Service Performance Data File Template
Format:
3.6. Main advanced configuration 29
Shinken Documentation, Release 2.4
service_perfdata_file_template=<template>
Example:
service_perfdata_file_template=[SERVICEPERFDATA]\t$TIMET$\t$HOSTNAME$\t$SERVICEDESC$\t$SERVICEEXECUTIONTIME$\t$SERVICELATENCY$\t$SERVICEOUTPUT$\t$SERVICEPERFDATA$
This option determines what (and how) data is written to the service performance data file. The template may containmacros, special characters (t for tab, r for carriage return, n for newline) and plain text. A newline is automaticallyadded after each write to the performance data file.
Host/Service Performance Data File Mode
Format:
host_perfdata_file_mode=<mode>service_perfdata_file_mode=<mode>
Example:
host_perfdata_file_mode=aservice_perfdata_file_mode=a
This option determines how the host performance data file (or the service one) is opened. Unless the file is a namedpipe you’ll probably want to use the default mode of append.
• a = Open file in append mode (default)
• w = Open file in write mode
• p = Open in non-blocking read/write mode (useful when writing to pipes)
Host/Service Performance Data File Processing Interval (Unused)
Format:
host_perfdata_file_processing_interval=<seconds>service_perfdata_file_processing_interval=<seconds>
Example:
host_perfdata_file_processing_interval=0service_perfdata_file_processing_interval=0
This option allows you to specify the interval (in seconds) at which the host performance data file (or the service one)is processed using the host performance data file processing command. A value of 0 indicates that the performancedata file should not be processed at regular intervals.
Host/Service Performance Data File Processing Command (Unused)
Format:
host_perfdata_file_processing_command=<configobjects/command>service_perfdata_file_processing_command=<configobjects/command>
Example:
30 Chapter 3. Configuring Shinken

Shinken Documentation, Release 2.4
host_perfdata_file_processing_command=process-host-perfdata-fileservice_perfdata_file_processing_command=process-service-perfdata-file
This option allows you to specify the command that should be executed to process the host performance datafile (or the service one). The command argument is the short name of a command definition that you de-fine in your object configuration file. The interval at which this command is executed is determined by thehost_perfdata_file_processing_interval directive.
3.6.3 Advanced scheduling parameters
Passive Host Checks Are SOFT Option (Not implemented)
Format:
passive_host_checks_are_soft=<0/1>
Example:
passive_host_checks_are_soft=1
This option determines whether or not Shinken will treat passive host checks as HARD states or SOFT states. Bydefault, a passive host check result will put a host into a HARD state type. You can change this behavior by enablingthis option.
• 0 = Passive host checks are HARD (default)
• 1 = Passive host checks are SOFT
Predictive Host/Service Dependency Checks Option (Unused)
Format:
enable_predictive_host_dependency_checks=<0/1>enable_predictive_service_dependency_checks=<0/1>
Example:
enable_predictive_host_dependency_checks=1enable_predictive_service_dependency_checks=1
This option determines whether or not Shinken will execute predictive checks of hosts/services that are being dependedupon (as defined in host/services dependencies) for a particular host/service when it changes state. Predictive checkshelp ensure that the dependency logic is as accurate as possible. More information on how predictive checks work canbe found here.
• 0 = Disable predictive checks
• 1 = Enable predictive checks (default)
Orphaned Host/Service Check Option
Format:
check_for_orphaned_services=<0/1>check_for_orphaned_hosts=<0/1>
3.6. Main advanced configuration 31
Shinken Documentation, Release 2.4
Example:
check_for_orphaned_services=1check_for_orphaned_hosts=1
This option allows you to enable or disable checks for orphaned service/host checks. Orphaned checks are checkswhich have been launched to pollers but have not had any results reported in a long time.
Since no results have come back in for it, it is not rescheduled in the event queue. This can cause checks to stop beingexecuted. Normally it is very rare for this to happen - it might happen if an external user or process killed off theprocess that was being used to execute a check.
If this option is enabled and Shinken finds that results for a particular check have not come back, it will log an errormessage and reschedule the check. If you start seeing checks that never seem to get rescheduled, enable this optionand see if you notice any log messages about orphaned services.
• 0 = Don’t check for orphaned service checks
• 1 = Check for orphaned service checks (default)
Soft State Dependencies Option (Not implemented)
Format: soft_state_dependencies=<0/1> Example: soft_state_dependencies=0
This option determines whether or not Shinken will use soft state information when checking host and service depen-dencies. Normally it will only use the latest hard host or service state when checking dependencies. If you want it touse the latest state (regardless of whether its a soft or hard state type), enable this option.
• 0 = Don’t use soft state dependencies (default)
• 1 = Use soft state dependencies
3.6.4 Performance tuning
Cached Host/Service Check Horizon
Format:
cached_host_check_horizon=<seconds>cached_service_check_horizon=<seconds>
Example:
cached_host_check_horizon=15cached_service_check_horizon=15
This option determines the maximum amount of time (in seconds) that the state of a previous host check is consideredcurrent. Cached host states (from host/service checks that were performed more recently than the time specified by thisvalue) can improve host check performance immensely. Too high of a value for this option may result in (temporarily)inaccurate host/service states, while a low value may result in a performance hit for host/service checks. Use a valueof 0 if you want to disable host/service check caching. More information on cached checks can be found here.
Tip: Nagios default is 15s, but it’s a tweak that make checks less accurate. So Shinken use 0s as a default. If youhave performances problems and you can’t add a new scheduler or poller, increase this value and start to buy a newserver because this won’t be magical.
32 Chapter 3. Configuring Shinken

Shinken Documentation, Release 2.4
Large Installation Tweaks Option
Format:
use_large_installation_tweaks=<0/1>
Example:
use_large_installation_tweaks=0
This option determines whether or not the Shinken daemon will take shortcuts to improve performance. These short-cuts result in the loss of a few features, but larger installations will likely see a lot of benefit from doing so. If you can’tadd new satellites to manage the load (like new pollers), you can activate it. More information on what optimizationsare taken when you enable this option can be found here.
• 0 = Don’t use tweaks (default)
• 1 = Use tweaks
3.6.5 Flapping parameters
Flap Detection Option
Format:
enable_flap_detection=<0/1>
Example:
enable_flap_detection=1
This option determines whether or not Shinken will try and detect hosts and services that are “flapping”. Flappingoccurs when a host or service changes between states too frequently, resulting in a barrage of notifications beingsent out. When Shinken detects that a host or service is flapping, it will temporarily suppress notifications for thathost/service until it stops flapping.
More information on how flap detection and handling works can be found here.
• 0 = Don’t enable flap detection (default)
• 1 = Enable flap detection
Low Service/Host Flap Threshold
Format:
low_service_flap_threshold=<percent>low_host_flap_threshold=<percent>
Example:
low_service_flap_threshold=25.0low_host_flap_threshold=25.0
This option is used to set the low threshold for detection of host/service flapping. For more information on how flapdetection and handling works (and how this option affects things) read this.
3.6. Main advanced configuration 33

Shinken Documentation, Release 2.4
High Service/Host Flap Threshold
Format:
high_service_flap_threshold=<percent>high_host_flap_threshold=<percent>
Example:
high_service_flap_threshold=50.0high_host_flap_threshold=50.0
This option is used to set the high threshold for detection of host/service flapping. For more information on how flapdetection and handling works (and how this option affects things) read this.
Various commands Timeouts
Format:
event_handler_timeout=<seconds> # default: 30snotification_timeout=<seconds> # default: 30socsp_timeout=<seconds> # default: 15sochp_timeout=<seconds> # default: 15s
Example:
event_handler_timeout=60notification_timeout=60ocsp_timeout=5ochp_timeout=5
This is the maximum number of seconds that Shinken will allow event handlers, notification, obsessive compulsiveservice processor command or a Obsessive Compulsive Host Processor Command to be run. If an command exceedsthis time limit it will be killed and a warning will be logged.
There is often widespread confusion as to what this option really does. It is meant to be used as a last ditch mechanismto kill off commands which are misbehaving and not exiting in a timely manner. It should be set to something high(like 60 seconds or more for notification, less for oc*p commands), so that each event handler command normallyfinishes executing within this time limit. If an event handler runs longer than this limit, Shinken will kill it off thinkingit is a runaway processes.
3.6.6 Old Obsess Over commands
Obsess Over Services Option
Format:
obsess_over_services=<0/1>
Example:
obsess_over_services=1
This value determines whether or not Shinken will “obsess” over service checks results and run the obsessive compul-sive service processor command you define. I know _ funny name, but it was all I could think of. This option is usefulfor performing distributed monitoring. If you’re not doing distributed monitoring, don’t enable this option.
• 0 = Don’t obsess over services (default)
34 Chapter 3. Configuring Shinken

Shinken Documentation, Release 2.4
• 1 = Obsess over services
Obsessive Compulsive Service Processor Command
Format:
ocsp_command=<configobjects/command>
Example:
ocsp_command=obsessive_service_handler
This option allows you to specify a command to be run after every service check, which can be useful in distributedmonitoring. This command is executed after any event handler or notification commands. The command argument isthe short name of a command definition that you define in your object configuration file.
It’s used nearly only for the old school distributed architecture. If you use it, please look at new architecture capabilitiesthat are far efficient than the old one. More information on distributed monitoring can be found here. This command isonly executed if the Obsess Over Services Option option is enabled globally and if the “obsess_over_service” directivein the service definition is enabled.
Obsess Over Hosts Option
Format:
obsess_over_hosts=<0/1>
Example:
obsess_over_hosts=1
This value determines whether or not Shinken will “obsess” over host checks results and run the obsessive compulsivehost processor command you define. Same like the service one but for hosts :)
• 0 = Don’t obsess over hosts (default)
• 1 = Obsess over hosts
Obsessive Compulsive Host Processor Command
Format:
ochp_command=<configobjects/command>
Example:
ochp_command=obsessive_host_handler
This option allows you to specify a command to be run after every host check, which can be useful in distributedmonitoring. This command is executed after any event handler or notification commands. The command argument isthe short name of a command definition that you define in your object configuration file.
This command is only executed if the Obsess Over Hosts Option option is enabled globally and if the “ob-sess_over_host” directive in the host definition is enabled.
3.6. Main advanced configuration 35
Shinken Documentation, Release 2.4
3.6.7 Freshness check
Host/Service Freshness Checking Option
Format:
check_service_freshness=<0/1>check_host_freshness=<0/1>
Example:
check_service_freshness=0check_host_freshness=0
This option determines whether or not Shinken will periodically check the “freshness” of host/service checks. Enablingthis option is useful for helping to ensure that passive service checks are received in a timely manner. More informationon freshness checking can be found here.
• 0 = Don’t check host/service freshness
• 1 = Check host/service freshness (default)
Host/Service Freshness Check Interval
Format:
service_freshness_check_interval=<seconds>host_freshness_check_interval=<seconds>
Example:
service_freshness_check_interval=60host_freshness_check_interval=60
This setting determines how often (in seconds) Shinken will periodically check the “freshness” of host/service checkresults. If you have disabled host/service freshness checking (with the check_service_freshness option), this optionhas no effect. More information on freshness checking can be found here.
Additional Freshness Threshold Latency Option (Not implemented)
Format:
additional_freshness_latency=<#>
Example:
additional_freshness_latency=15
This option determines the number of seconds Shinken will add to any host or services freshness threshold it automat-ically calculates (e.g. those not specified explicitly by the user). More information on freshness checking can be foundhere.
Human format for log timestamp
Say if the timespam should be a unixtime (default) or a human read one.
Format
36 Chapter 3. Configuring Shinken
Shinken Documentation, Release 2.4
human_timestamp_log=[0/1]
Example
human_timestamp_log=0
This directive is used to specify if the timespam before the log entry should be in unixtime (like [1302874960]) whichis the default, or a human readable one (like [Fri Apr 15 15:43:19 2011]).
Beware : if you set the human format, some automatic parsing log tools won’t work!
Resource File
Defined in shinken.cfg file.
Format
resource_file=<file_name>
Example:
resource_file=/etc/shinken/resource.cfg
This is used to specify an optional resource file that can contain “$USERn$” Understanding Macros and How TheyWork definitions. “$USERn$” macros are useful for storing usernames, passwords, and items commonly used incommand definitions (like directory paths). A classical variable used is $USER1$, used to store the plugins path,“/usr/lib/nagios/plugins” on a classic installation.
Triggers directory
Format
triggers_dir=<directory>
Example:
triggers_dir=triggers.d
Used to specify the trigger directory. It will open the directory and look recursively for .trig files.
Bypass security checks for the Arbiter daemon
Defined in brokerd.ini, brokerd-windows.ini, pollerd.ini, pollerd-windows.ini, reactionnerd.ini, schedulerd.ini andschedulerd-windows.ini.
Format:
idontcareaboutsecurity=<0/1>
Example:
idontcareaboutsecurity=0
This option determines whether or not Shinken will allow the Arbiter daemon to run under the root account. If thisoption is disabled, Shinken will bailout if the nagios_user or the nagios_group is configured with the root account.
The Shinken daemons do not need root right. Without a good reason do not run thems under this account!
3.6. Main advanced configuration 37

Shinken Documentation, Release 2.4
• 0 = Be a responsible administrator
• 1 = Make crazy your security manager
Notifications Option
Format:
enable_notifications=<0/1>
Example:
enable_notifications=1
This option determines whether or not Shinken will send out notifications. If this option is disabled, Shinken will notsend out notifications for any host or service.
Values are as follows:
• 0 = Disable notifications
• 1 = Enable notifications (default)
Log Rotation Method (Not fully implemented)
Format:
log_rotation_method=<n/h/d/w/m>
Example:
log_rotation_method=d
This is the rotation method that you would like Shinken to use for your log file on the broker server. Values are asfollows:
• n = None (don’t rotate the log - this is the default)
• h = Hourly (rotate the log at the top of each hour)
• d = Daily (rotate the log at midnight each day)
• w = Weekly (rotate the log at midnight on Saturday)
• m = Monthly (rotate the log at midnight on the last day of the month)
Tip: From now, only the d (Daily) parameter is managed.
External Command Check Option
Format:
check_external_commands=<0/1>
Example:
check_external_commands=1
This option determines whether or not Shinken will check the External Command File for commands that should beexecuted with the arbiter daemon. More information on external commands can be found here.
38 Chapter 3. Configuring Shinken

Shinken Documentation, Release 2.4
• 0 = Don’t check external commands (default)
• 1 = Check external commands (default)
Note: FIX ME : Find the real default value
External Command File
Defined in nagios.cfg file.
Format:
command_file=<file_name>
Example:
command_file=/var/lib/shinken/rw/nagios.cmd
This is the file that Shinken will check for external commands to process with the arbiter daemon. The commandCGI writes commands to this file. The external command file is implemented as a named pipe (FIFO), which is createdwhen Nagios starts and removed when it shuts down. More information on external commands can be found here.
Tip: This external command file is not managed under Windows system. Please use others way to send commandslike the LiveStatus module for example.
State Retention Option (Not implemented)
Format:
retain_state_information=<0/1>
Example:
retain_state_information=1
This option determines whether or not Shinken will retain state information for hosts and services between program restarts. If you enable this option, you should supply a value for the State Retention File variable. When enabled, Shinken will save all state information for hosts and service before it shuts down (or restarts) and will read in previously saved state information when it starts up again.
• 0 = Don’t retain state information
• 1 = Retain state information (default)
Note: Idea to approve : Mark it as Unused : Related topic. A Shinken module replace it.
State Retention File
Format:
state_retention_file=<file_name>
Example:
state_retention_file=/var/lib/shinken/retention.dat
3.6. Main advanced configuration 39

Shinken Documentation, Release 2.4
This is the file that Shinken scheduler daemons will use for storing status, downtime, and comment informationbefore they shuts down. When Shinken is restarted it will use the information stored in this file for setting the initialstates of services and hosts before it starts monitoring anything. In order to make Shinken retain state informationbetween program restarts, you must enable the State Retention Option option.
Important: The file format is not the same between Shinken and Nagios! The retention.dat generated with Nagioswill not load into Shinken.
3.6.8 Scheduling parameters
Service/Host Check Execution Option
Format:
execute_service_checks=<0/1>execute_host_checks=<0/1>
Example:
execute_service_checks=1execute_host_checks=1
This option determines whether or not Shinken will execute service/host checks. Do not change this option unless youuse a old school distributed architecture. And even if you do this, please change your architecture with a cool new onefar more efficient.
• 0 = Don’t execute service checks
• 1 = Execute service checks (default)
Passive Service/Host Check Acceptance Option
Format:
accept_passive_service_checks=<0/1>accept_passive_host_checks=<0/1>
Example:
accept_passive_service_checks=1accept_passive_host_checks=1
This option determines whether or not Shinken will accept passive service/host checks. If this option is disabled,Nagios will not accept any passive service/host checks.
• 0 = Don’t accept passive service/host checks
• 1 = Accept passive service/host checks (default)
Event Handler Option
Format:
enable_event_handlers=<0/1>
Example:
40 Chapter 3. Configuring Shinken

Shinken Documentation, Release 2.4
enable_event_handlers=1
This option determines whether or not Shinken will run event handlers.
• 0 = Disable event handlers
• 1 = Enable event handlers (default)
Syslog Logging Option
Format:
use_syslog=<0/1>
Example:
use_syslog=1
This variable determines whether messages are logged to the syslog facility on your local host. Values are as follows:
• 0 = Don’t use syslog facility
• 1 = Use syslog facility
Tip: This is a Unix Os only option.
Notification Logging Option
Format:
log_notifications=<0/1>
Example:
log_notifications=1
This variable determines whether or not notification messages are logged. If you have a lot of contacts or regularservice failures your log file will grow (let say some Mo by day for a huge configuration, so it’s quite OK for nearlyevery one to log them). Use this option to keep contact notifications from being logged.
• 0 = Don’t log notifications
• 1 = Log notifications
Service/Host Check Retry Logging Option (Not implemented)
Format:
log_service_retries=<0/1>log_host_retries=<0/1>
Example:
log_service_retries=0log_host_retries=0
3.6. Main advanced configuration 41

Shinken Documentation, Release 2.4
This variable determines whether or not service/host check retries are logged. Service check retries occur when aservice check results in a non-OK state, but you have configured Shinken to retry the service more than once beforeresponding to the error. Services in this situation are considered to be in “soft” states. Logging service check retries ismostly useful when attempting to debug Shinken or test out service/host event handlers.
• 0 = Don’t log service/host check retries (default)
• 1 = Log service/host check retries
Event Handler Logging Option
Format:
log_event_handlers=<0/1>
Example:
log_event_handlers=1
This variable determines whether or not service and host event handlers are logged. Event handlers are optionalcommands that can be run whenever a service or hosts changes state. Logging event handlers is most useful whendebugging Shinken or first trying out your event handler scripts.
• 0 = Don’t log event handlers
• 1 = Log event handlers
External Command Logging Option
Format:
log_external_commands=<0/1>
Example:
log_external_commands=1
This variable determines whether or not Shinken will log external commands that it receives.
• 0 = Don’t log external commands
• 1 = Log external commands (default)
Passive Check Logging Option (Not implemented)
Format:
log_passive_checks=<0/1>
Example:
log_passive_checks=1
This variable determines whether or not Shinken will log passive host and service checks that it receives from theexternal command file.
• 0 = Don’t log passive checks
• 1 = Log passive checks (default)
42 Chapter 3. Configuring Shinken

Shinken Documentation, Release 2.4
Global Host/Service Event Handler Option (Not implemented)
Format:
global_host_event_handler=<configobjects/command>global_service_event_handler=<configobjects/command>
Example:
global_host_event_handler=log-host-event-to-dbglobal_service_event_handler=log-service-event-to-db
This option allows you to specify a host event handler command that is to be run for every host state change. Theglobal event handler is executed immediately prior to the event handler that you have optionally specified in each hostdefinition. The command argument is the short name of a command that you define in your Object ConfigurationOverview. The maximum amount of time that this command can run is controlled by the Event Handler Timeoutoption. More information on event handlers can be found here.
Such commands should not be so useful with the new Shinken distributed architecture. If you use it, look if you canavoid it because such commands will kill your performances.
Timing Interval Length
Format:
interval_length=<seconds>
Example:
interval_length=60
This is the number of seconds per “unit interval” used for timing in the scheduling queue, re-notifications, etc. “Unitsintervals” are used in the object configuration file to determine how often to run a service check, how often to re-notifya contact, etc.
The default value for this is set to 60, which means that a “unit value” of 1 in the object configuration file will mean60 seconds (1 minute).
Tip: Set this option top 1 is not a good thing with Shinken. It’s not design to be a hard real time (<5seconds)monitoring system. Nearly no one need such hard real time (maybe only the Nuclear center or a market place like theLondon Exchange...).
3.6.9 Old CGI related parameter
If you are using the old CGI from Nagios, please migrate to a new WebUI. For historical perspective you can findinformation on the specific CGI parameters.
3.6.10 Unused parameters
The below parameters are inherited from Nagios but are not used in Shinken. You can defined them but if you don’t itwill be the same :)
They are listed on another page unused Nagios parameters.
3.6. Main advanced configuration 43

Shinken Documentation, Release 2.4
3.6.11 All the others :)
Date Format (Not implemented)
Format:
date_format=<option>
Example:
date_format=us
This option allows you to specify what kind of date/time format Shinken should use in date/time macros. Possibleoptions (along with example output) include:
Option Output Format Sample Outputus MM/DD/YYYY HH:MM:SS 06/30/2002 03:15:00euro DD/MM/YYYY HH:MM:SS 30/06/2002 03:15:00iso8601 YYYY-MM-DD HH:MM:SS 2002-06-30 03:15:00strict-iso8601 YYYY-MM-DDTHH:MM:SS 2002-06-30T03:15:00
Illegal Object Name Characters
Format:
illegal_object_name_chars=<chars...>
Example:
illegal_object_name_chars=`-!$%^&*"|'<>?,()=
This option allows you to specify illegal characters that cannot be used in host names, service descriptions, or names ofother object types. Shinken will allow you to use most characters in object definitions, but I recommend not using thecharacters shown in the example above. Doing may give you problems in the web interface, notification commands,etc.
Illegal Macro Output Characters
Format:
illegal_macro_output_chars=<chars...>
Example:
illegal_macro_output_chars=`-$^&"|'<>
This option allows you to specify illegal characters that should be stripped from macros before being used in notifica-tions, event handlers, and other commands. This DOES NOT affect macros used in service or host check commands.You can choose to not strip out the characters shown in the example above, but I recommend you do not do this. Someof these characters are interpreted by the shell (i.e. the backtick) and can lead to security problems. The followingmacros are stripped of the characters you specify:
• “$HOSTOUTPUT$”
• “$HOSTPERFDATA$”
• “$HOSTACKAUTHOR$”
44 Chapter 3. Configuring Shinken
Shinken Documentation, Release 2.4
• “$HOSTACKCOMMENT$”
• “$SERVICEOUTPUT$”
• “$SERVICEPERFDATA$”
• “$SERVICEACKAUTHOR$”
• “$SERVICEACKCOMMENT$”
Regular Expression Matching Option (Not implemented)
Format:
use_regexp_matching=<0/1>
Example:
use_regexp_matching=0
This option determines whether or not various directives in your Object Configuration Overview will be processed asregular expressions. More information on how this works can be found here.
• 0 = Don’t use regular expression matching (default)
• 1 = Use regular expression matching
True Regular Expression Matching Option (Not implemented)
Format:
use_true_regexp_matching=<0/1>
Example:
use_true_regexp_matching=0
If you’ve enabled regular expression matching of various object directives using the Regular Expression MatchingOption option, this option will determine when object directives are treated as regular expressions. If this option isdisabled (the default), directives will only be treated as regular expressions if they contain *, ?, +, or .. If this optionis enabled, all appropriate directives will be treated as regular expression _ be careful when enabling this! Moreinformation on how this works can be found here.
• 0 = Don’t use true regular expression matching (default)
• 1 = Use true regular expression matching
Administrator Email Address (unused)
Format:
admin_email=<email_address>
Example:
This is the email address for the administrator of the local machine (i.e. the one that Shinken is running on). Thisvalue can be used in notification commands by using the “$ADMINEMAIL$” macro.
3.6. Main advanced configuration 45

Shinken Documentation, Release 2.4
Administrator Pager (unused)
Format:
admin_pager=<pager_number_or_pager_email_gateway>
Example:
This is the pager number (or pager email gateway) for the administrator of the local machine (i.e. the one that Shinkenis running on). The pager number/address can be used in notification commands by using the $ADMINPAGER$macro.
Shinken.io api_key
Format:
api_key=<api_key>
Example:
api_key=AZERTYUIOP
This is the api_key/scret to exchange with shinken.io and especially the kernel.shinken.io service that will print yourshinken metrics. To enable it you must fill the api_key and secret parameters. You must register to http://shinken.ioand look at your profile http://shinken.io/~ for your api_key and your secret.
Shinken.io secret
Format:
secret=<secret>
Example:
secret=QSDFGHJ
This is the api_key/scret to exchange with shinken.io and especially the kernel.shinken.io service that will print yourshinken metrics. To enable it you must fill the api_key and secret parameters. You must register to http://shinken.ioand look at your profile http://shinken.io/~ for your api_key and your secret.
Statsd host
Format:
statsd_host=<host or ip>
Example:
statsd_host=localhost
Configure your local statsd daemon address.
46 Chapter 3. Configuring Shinken

Shinken Documentation, Release 2.4
Statsd port
Format:
statsd_port=<int>
Example:
statsd_port=8125
Configure your local statsd daemon port. Notice that the port is in UDP
Statsd prefix
Format:
statsd_prefix=<string>
Example:
statsd_prefix=shinken
The prefix to add before all your stats so you will find them easily in graphite
Statsd enabled (or not)
Format:
statsd_enabled=<0/1>
Example:
statsd_enabled=0
Enable or not the statsd communication. By default it’s disabled.
3.6. Main advanced configuration 47

Shinken Documentation, Release 2.4
48 Chapter 3. Configuring Shinken

CHAPTER 4
Running Shinken
49

Shinken Documentation, Release 2.4
4.1 Verifying Your Configuration
Every time you modify your Configuration, you should run a sanity check on them. It is important to do this beforeyou (re)start Shinken, as Shinken will shut down if your configuration contains errors.
Note: In recent Shinken versions, a shinken reload will check your configuration before restarting the arbiter:/etc/init.d/shinken reload
4.1.1 How to verify the configuration
In order to verify your configuration, run Shinken-arbiter with the “-v” command line option like so:
linux:~ # /usr/bin/shinken-arbiter -v -c /etc/shinken/shinken.cfg
If you’ve forgotten to enter some critical data or misconfigured things, Shinken will spit out a warning or error messagethat should point you to the location of the problem. Error messages generally print out the line in the configurationfile that seems to be the source of the problem. On errors, Shinken will exit the pre-flight check. If you get any errormessages you’ll need to go and edit your configuration files to remedy the problem. Warning messages can generallybe safely ignored, since they are only recommendations and not requirements.
4.1.2 Important caveats
1. Shinken will not check the syntax of module variables
2. Shinken will not check the validity of data passed to modules
3. Shinken will NOT notify you if you mistyped an expected variable, it will treat it as a custom variable.
4. Shinken sometimes uses variables that expect lists, the order of items in lists is important, check the relevantdocumentation
4.1.3 How to apply your changes
Once you’ve verified your configuration files and fixed any errors you can go ahead and reload or (re)start Shinken.
4.2 Starting and Stopping Shinken
There’s more than one way to start, stop, and restart Shinken. Here are some of the more common ones...
In recent Shinken versions, you can use the init script to reload Shinken: your configuration will be checked beforerestarting the arbiter.
Always make sure you verify your configuration before you (re)start Shinken.
4.2.1 Starting Shinken
• Init Script: The easiest way to start the Shinken daemon is by using the init script like so:
linux:~ # /etc/rc.d/init.d/shinken start
• Manually: You can start the Shinken daemon manually with the “-d” command line option like so:
50 Chapter 4. Running Shinken
Shinken Documentation, Release 2.4
linux:~ # /usr/bin/shinken/shinken-scheduler -d -c /etc/shinken/daemons/schedulerd.inilinux:~ # /usr/bin/shinken/shinken-poller -d -c /etc/shinken/daemons/pollerd.inilinux:~ # /usr/bin/shinken/shinken-reactionner -d -c /etc/shinken/daemons/reactionnerd.inilinux:~ # /usr/bin/shinken/shinken-broker -d -c /etc/shinken/daemons/brokerd.inilinux:~ # /usr/bin/shinken/shinken-arbiter -d -c /etc/shinken/shinken.cfg
Important: Enabling debugging output under windows requires changing registry values associated with Shinken
4.2.2 Restarting Shinken
Restarting/reloading is nececessary when you modify your configuration files and want those changes to take effect.
• Init Script: The easiest way to restart the Shinken daemon is by using the init script like so:
linux:~ # /etc/rc.d/init.d/shinken restart
• Manually: You can restart the Shinken process by sending it a SIGTERM signal like so:
linux:~ # kill <configobjects/arbiter_pid>linux:~ # /usr/bin/shinken-arbiter -d -c /etc/shinken/shinken.cfg
4.2.3 Stopping Shinken
• Init Script: The easiest way to stop the Shinken daemons is by using the init script like so:
linux:~ # /etc/rc.d/init.d/shinken stop
• Manually: You can stop the Shinken process by sending it a SIGTERM signal like so:
linux:~ # kill <configobjects/arbiter_pid> <configobjects/scheduler_pid> <configobjects/poller_pid> <configobjects/reactionner_pid> <configobjects/broker_pid>
4.2. Starting and Stopping Shinken 51

Shinken Documentation, Release 2.4
52 Chapter 4. Running Shinken

CHAPTER 5
The Basics
53

Shinken Documentation, Release 2.4
5.1 Setting up a basic Shinken Configuration
5.1.1 Default Shinken configuration
If you followed the 10 Minute Shinken Installation Guide tutorial you were able to install and launch Shinken.
The default configuration deployed with the Shinken sources contains:
• one arbiter
• one scheduler
• one poller
• one reactionner
• one broker
• one receiver (commented out)
All these elements must have a basic configuration. The Arbiter must know about the other daemons and how tocommunicate with them, just as the other daemons need to know on which TCP port they must listen on.
5.1.2 Configure the Shinken Daemons
The schedulers, pollers, reactionners and brokers daemons need to know in which directory to work on, and on whichTCP port to listen. That’s all.
Note: If you plan on using the default directories, user (shinken) and tcp port you shouldn’t have to edit these files.
Each daemon has one configuration file. The default location is /etc/shinken/.
Important: Remember that all daemons can be on different servers: the daemons configuration files need to be onthe server which is running the daemon, not necessarily on every server
Let’s see what it looks like:
$cat /etc/shinken/daemons/schedulerd.ini
[daemon]workdir=/var/lib/shinkenpidfile=%(workdir)s/schedulerd.pidport=7768host=0.0.0.0
daemon_enabled=1
# Optional configurations
user=shinkengroup=shinkenidontcareaboutsecurity=0use_ssl=0#certs_dir=etc/certs#ca_cert=etc/certs/ca.pem#server_cert=etc/certs/server.pemhard_ssl_name_check=0use_local_log=1
54 Chapter 5. The Basics

Shinken Documentation, Release 2.4
local_log=brokerd.loglog_level=INFOmax_queue_size=100000
So here we have a scheduler:
• workdir: Working directory of the daemon. By default /var/lib/shinken
• pidfile: PID file of the daemon (so we can kill it :) ). By default /var/lib/shinken/schedulerd.pid for a scheduler.
• port: TCP port to listen to. By default:
– scheduler: 7768
– poller: 7771
– reactionner: 7769
– broker: 7772
– arbiter: 7770 (the arbiter configuration will be seen later)
• host: IP interface to listen on. The default 0.0.0.0 means all interfaces.
• user: User used by the daemon to run. By default shinken.
• group: Group of the user. By default shinken.
• idontcareaboutsecurity: If set to 1, you can run it under the root account. But seriously: do not do this. Thedefault is 0 of course.
• daemon_enabled : If set to 0, the daemon won’t run. For example, in distributed setups where you only need apoller.
• use_ssl=0
• #certs_dir=etc/certs
• #ca_cert=etc/certs/ca.pem
• #server_cert=etc/certs/server.pem
• hard_ssl_name_check=0
• use_local_log=1 : Log all messages that match the log_level for this daemon in a local directory.
• local_log=brokerd.log : Name of the log file where to save the logs.
• log_level=INFO : Log_level that will be permitted to be logger. Warning permits Warning, Error, Critical to belogged. INFO by default.
• max_queue_size=100000 : If a module gets a brok queue() higher than this value, it will be killed and restarted.Set to 0 to disable it.
5.1.3 Daemon declaration in the global configuration
Now each daemon knows in which directory to run, and on which tcp port to listen. A daemon is a resource in theShinken architecture. Such resources must be declared in the global configuration (where the Arbiter is) for them tobe utilized.
The global configuration file is: /etc/shinken/shinken.cfg
The daemon declarations are quite simple: each daemon is represented by an object. The information contained in thedaemon object are network parameters about how its resources should be treated (e.g. is it a spare, ...).
Each objects type corresponds to a daemon:
5.1. Setting up a basic Shinken Configuration 55

Shinken Documentation, Release 2.4
• arbiter
• scheduler
• poller
• reactionner
• broker
• receiver
The names were chosen to clearly represent their roles. :)
They have these parameters in common:
• *_name: name of the resource
• address: IP or DNS address to connect to the daemon
• port: I think you can find it on your own by now :)
• [spare]: 1 or 0, is a spare or not. See advanced features for this.
• [realm]: realm membership See advanced features for this.
• [manage_sub_realms]: whether or not to manage sub realms. See advanced features for this.
• [modules]: modules used by the daemon. See below.
Special parameters
Some daemons have special parameters:
For the arbiter:
• host_name: hostname of the server where the arbiter is installed. It’s mandatory for a high availabilityenvironment (2 arbiters or more).
For pollers:
• poller_tags: “tags” that the poller manages. See advanced features for this.
Module objects
All daemons can use modules. In the brokers case, they are mandatory for it to actually accomplish a task.
Modules have some common properties:
• module_name: module name called by the resource.
• module_type: module type of the module. It’s a fixed value given by the module.
• other options: each module can have specific parameters. See the respective module documentation tolearn more about them.
Module references, list of overall modules:
• Arbiter modules
• Scheduler modules
• Broker modules
• Receiver modules
56 Chapter 5. The Basics

Shinken Documentation, Release 2.4
• Pollers modules
• Reactionner modules
Configuration example
Here is an example of a simple configuration (which you already used without knowing it during the 10min installationtutorial). It has been kept to the strict minimum, with only one daemon for each type. There is no load distribution orhigh availability, but you’ll get the picture more easily.
Here, we have a server named server-1 that has 192.168.0.1 as its IP address:
define arbiter{arbiter_name arbiter-1host_name server-1address 192.168.0.1port 7770spare 0
}
define scheduler{scheduler_name scheduler-1address 192.168.0.1port 7768spare 0
}
define reactionner{reactionner_name reactionner-1address 192.168.0.1port 7769spare 0
}
define poller{poller_name poller-1address 192.168.0.1port 7771spare 0
}
define broker{broker_name broker-1address 192.168.0.1port 7772spare 0modules Status-Dat,Simple-log
}
define module{module_name Simple-logmodule_type simple_logpath /var/lib/shinken/shinken.log
}
define module{module_name Status-Datmodule_type status_dat
5.1. Setting up a basic Shinken Configuration 57

Shinken Documentation, Release 2.4
status_file /var/lib/shinken/status.dataobject_cache_file /var/lib/shinken/objects.cachestatus_update_interval 15 ; update status.dat every 15s
}
See? That was easy. And don’t worry about forgetting one of them: if there is a missing daemon type, Shinkenautomatically adds one locally with a default address/port configuration.
Removing unused configurations
The sample shinken.cfg file has all possible modules in addition to the basic daemon declarations.
• Backup your shinken.cfg file.
• Delete all unused modules from your configuration file
• Ex. If you do not use the openldap module, delete it from the file
This will make any warnings or errors that show up in your log files more pertinent. This is because the modules, ifdeclared will get loadedup even if they are not use in your Modules declaration of your daemons.
If you ever lose your shinken.cfg, you can simply go to the shinken github repository and download the file.
Launch all daemons
To launch daemons, simply type:
daemon_path -d -c daemon_configuration.ini
The command lines arguments are:
• -c, –config: Config file.
• -d, –daemon: Run in daemon mode
• -r, –replace: Replace previous running scheduler
• -h, –help: Print detailed help screen
• –debug: path of the debug file
So a standard launch of the resources looks like:
/usr/bin/shinken-scheduler -d -c /etc/shinken/schedulerd.ini/usr/bin/shinken-poller -d -c /etc/shinken/pollerd.ini/usr/bin/shinken-reactionner -d -c /etc/shinken/reactionnerd.ini/usr/bin/shinken-broker -d -c /etc/shinken/brokerd.ini
Now we can start the arbiter with the global configuration:
#First we should check the configuration for errorspython bin/shinken-arbiter -v -c etc/shinken.cfg
#then, we can really launch itpython bin/shinken-arbiter -d -c etc/shinken.cfg
Now, you’ve got the same thing you had when you launched bin/launch_all.sh script 8-) (but now you know whatyou’re doing)
58 Chapter 5. The Basics

Shinken Documentation, Release 2.4
5.1.4 What’s next
You are ready to continue to the next section, get DATA IN Shinken.
If you feel in the mood for testing even more shinken features, now would be the time to look at advanced_features toplay with distributed and high availability architectures!
5.2 Monitoring Plugins
5.2.1 Introduction
Shinken includes a set of scalable internal mechanisms for checking the status of hosts and services on your network.These are called modules and can be loaded by the various Shinken daemons involved in data acquisition (Pollerdaemons, Receiver daemons, Arbiter Daemon) Shinken also relies on external programs (called check plugins) tomonitor a very wide variety of devices, applications and networked services.
5.2.2 What Are Plugins?
Plugins are compiled executables or scripts (Perl scripts, shell scripts, etc.) that can be run from a command line tocheck the status of a host or service. Shinken uses the results from plugins to determine the current status of hosts andservices on your network and obtain performance data about the monitored service.
Shinken will execute a plugin whenever there is a need to check the status of a service or host. The plugin doessomething (notice the very general term) to perform the check and then simply returns the results to Shinken. It willprocess the results that it receives from the plugin and take any necessary actions (running event handlers, sending outnotifications, etc).
5.2.3 Shinken integrated data acquisition modules
These replace traditional unscalable plugins with high performance variants that are more tightly coupled withShinken.
Integrated Shinken data acquisition modules support the following protocols:
• NRPE
• SNMP
5.2. Monitoring Plugins 59
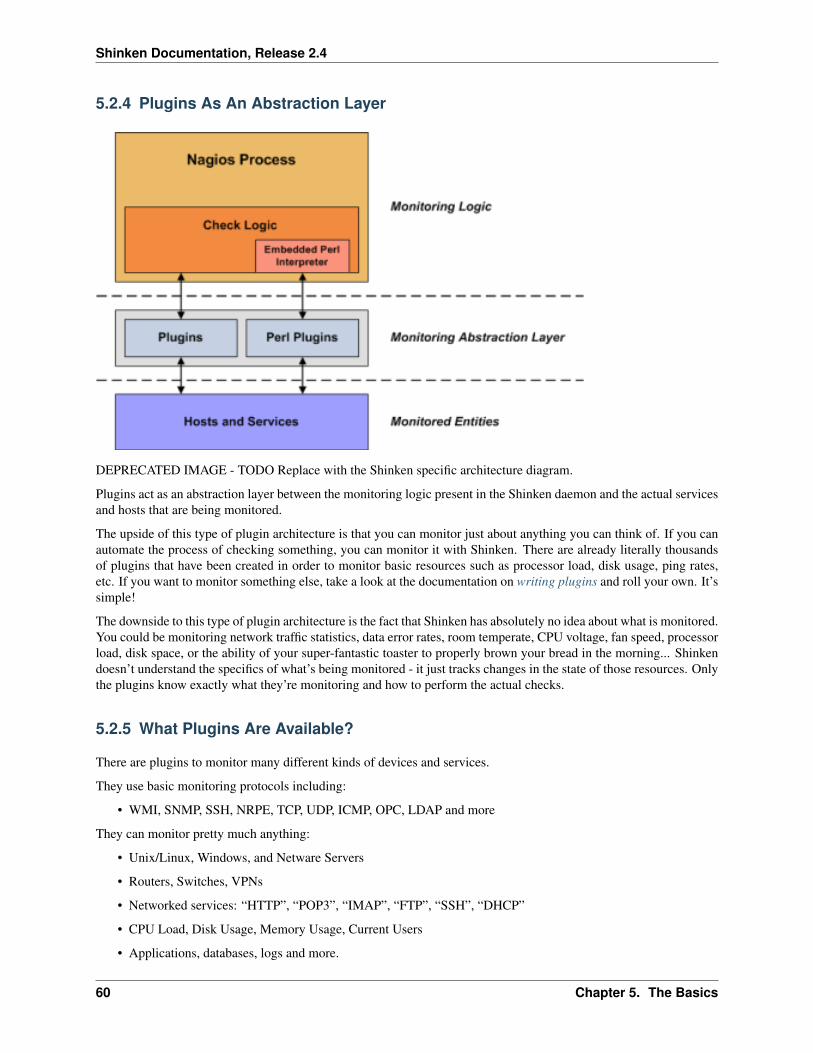
Shinken Documentation, Release 2.4
5.2.4 Plugins As An Abstraction Layer
DEPRECATED IMAGE - TODO Replace with the Shinken specific architecture diagram.
Plugins act as an abstraction layer between the monitoring logic present in the Shinken daemon and the actual servicesand hosts that are being monitored.
The upside of this type of plugin architecture is that you can monitor just about anything you can think of. If you canautomate the process of checking something, you can monitor it with Shinken. There are already literally thousandsof plugins that have been created in order to monitor basic resources such as processor load, disk usage, ping rates,etc. If you want to monitor something else, take a look at the documentation on writing plugins and roll your own. It’ssimple!
The downside to this type of plugin architecture is the fact that Shinken has absolutely no idea about what is monitored.You could be monitoring network traffic statistics, data error rates, room temperate, CPU voltage, fan speed, processorload, disk space, or the ability of your super-fantastic toaster to properly brown your bread in the morning... Shinkendoesn’t understand the specifics of what’s being monitored - it just tracks changes in the state of those resources. Onlythe plugins know exactly what they’re monitoring and how to perform the actual checks.
5.2.5 What Plugins Are Available?
There are plugins to monitor many different kinds of devices and services.
They use basic monitoring protocols including:
• WMI, SNMP, SSH, NRPE, TCP, UDP, ICMP, OPC, LDAP and more
They can monitor pretty much anything:
• Unix/Linux, Windows, and Netware Servers
• Routers, Switches, VPNs
• Networked services: “HTTP”, “POP3”, “IMAP”, “FTP”, “SSH”, “DHCP”
• CPU Load, Disk Usage, Memory Usage, Current Users
• Applications, databases, logs and more.
60 Chapter 5. The Basics

Shinken Documentation, Release 2.4
5.2.6 Obtaining Plugins
Shinken also organizes monitoring configuration packages. These are pre-built for fast no nonsense deployments. Theyinclude the check command definitions, service templates, host templates, discovery rules and integration hooks to theCommunity web site. The integration with the community web site permits deployment and updates of monitoringpacks.
Get started with Shinken Monitoring Packages “Packs” today.
The plugins themselves are not distributed with Shinken, but you can download the official Monitoring-plugins andmany additional plugins created and maintained by Nagios users from the following locations:
• Monitoring Plugins Project: https://www.monitoring-plugins.org/
• Nagios Downloads Page: http://www.nagios.org/download/
• NagiosExchange.org: http://www.nagiosexchange.org/
5.2.7 How Do I Use Plugin X?
Most plugins will display basic usage information when you execute them using “-h” or “–help” on the commandline. For example, if you want to know how the check_http plugin works or what options it accepts, you should tryexecuting the following command:
./check_http --help
5.2.8 Plugin API
You can find information on the technical aspects of plugins, as well as how to go about creating your own customplugins here.
5.3 Understanding Macros and How They Work
5.3.1 Macros
One of the main features that make Shinken so flexible is the ability to use macros in command defintions. Macrosallow you to reference information from hosts, services, and other sources in your commands.
5.3.2 Macro Substitution - How Macros Work
Before Shinken executes a command, it will replace any macros it finds in the command definition with their corre-sponding values. This macro substitution occurs for all types of commands that Shinken executes - host and servicechecks, notifications, event handlers, etc.
Certain macros may themselves contain other macros. These include the “$HOSTNOTES$”, “$HOSTNOTESURL$”,“$HOSTACTIONURL$”, “$SERVICENOTES$”, “$SERVICENOTESURL$”, and “$SERVICEACTIONURL$”macros.
Tip: If, you need to have the ‘$’ character in one of your command (and not referring to a macro), please put “$$”instead. Shinken will replace it well
5.3. Understanding Macros and How They Work 61

Shinken Documentation, Release 2.4
5.3.3 Example 1: Host Address Macro
When you use host and service macros in command definitions, they refer to values for the host or service for whichthe command is being run. Let’s try an example. Assuming we are using a host definition and a check_ping commanddefined like this:
define host{host_name linuxboxaddress 192.168.1.2check_command check_ping...
}
define command{command_name check_pingcommand_line /var/lib/shinken/libexec/check_ping -H $HOSTADDRESS$ -w 100.0,90% -c 200.0,60%
}
the expanded/final command line to be executed for the host’s check command would look like this:
/var/lib/shinken/libexec/check_ping -H 192.168.1.2 -w 100.0,90% -c 200.0,60%
Pretty simple, right? The beauty in this is that you can use a single command definition to check an unlimited numberof hosts. Each host can be checked with the same command definition because each host’s address is automaticallysubstituted in the command line before execution.
5.3.4 Example 2: Command Argument Macros
You can pass arguments to commands as well, which is quite handy if you’d like to keep your command definitionsrather generic. Arguments are specified in the object (i.e. host or service) definition, by separating them from thecommand name with exclamation points (!) like so:
define service{host_name linuxboxservice_description PINGcheck_command check_ping!200.0,80%!400.0,40%...
}
In the example above, the service check command has two arguments (which can be referenced with $ARGn$ macros).The $ARG1$ macro will be “200.0,80%” and “$ARG2$” will be “400.0,40%” (both without quotes). Assuming weare using the host definition given earlier and a check_ping command defined like this:
define command{command_name check_pingcommand_line /var/lib/shinken/libexec/check_ping -H $HOSTADDRESS$ -w $ARG1$ -c $ARG2$
}
the expanded/final command line to be executed for the service’s check command would look like this:
/var/lib/shinken/libexec/check_ping -H 192.168.1.2 -w 200.0,40% -c 400.0,80%
If you need to pass bang (!) characters in your command arguments, you can do so by escaping them with a backslash(). If you need to include backslashes in your command arguments, they should also be escaped with a backslash.
62 Chapter 5. The Basics

Shinken Documentation, Release 2.4
5.3.5 On-Demand Macros
Normally when you use host and service macros in command definitions, they refer to values for the host or servicefor which the command is being run. For instance, if a host check command is being executed for a host named“linuxbox”, all the standard host macros will refer to values for that host (“linuxbox”).
If you would like to reference values for another host or service in a command (for which the command is not beingrun), you can use what are called “on-demand” macros. On-demand macros look like normal macros, except for thefact that they contain an identifier for the host or service from which they should get their value. Here’s the basicformat for on-demand macros:
• “$HOSTMACRONAME:host_name$”
• “$SERVICEMACRONAME:host_name:service_description$”
Replace “HOSTMACRONAME” and “SERVICEMACRONAME” with the name of one of the standard host of ser-vice macros found here.
Note that the macro name is separated from the host or service identifier by a colon (:). For on-demand service macros,the service identifier consists of both a host name and a service description - these are separated by a colon (:) as well.
On-demand service macros can contain an empty host name field. In this case the name of the host associated with theservice will automatically be used.
Examples of on-demand host and service macros follow:
$HOSTDOWNTIME:myhost$ // On-demand host macro$SERVICESTATEID:server:database$ // On-demand service macro$SERVICESTATEID::CPU Load$ // On-demand service macro with blank host name field
On-demand macros are also available for hostgroup, servicegroup, contact, and contactgroup macros. For example:
$CONTACTEMAIL:john$ // On-demand contact macro$CONTACTGROUPMEMBERS:linux-admins$ // On-demand contactgroup macro$HOSTGROUPALIAS:linux-servers$ // On-demand hostgroup macro$SERVICEGROUPALIAS:DNS-Cluster$ // On-demand servicegroup macro
5.3.6 On-Demand Group Macros
You can obtain the values of a macro across all contacts, hosts, or services in a specific group by using a special formatfor your on-demand macro declaration. You do this by referencing a specific host group, service group, or contactgroup name in an on-demand macro, like so:
• “$HOSTMACRONAME:hostgroup_name:delimiter$”
• “$SERVICEMACRONAME:servicegroup_name:delimiter$”
• “$CONTACTMACRONAME:contactgroup_name:delimiter$”
Replace “HOSTMACRONAME”, “SERVICEMACRONAME”, and “CONTACTMACRONAME” with the name ofone of the standard host, service, or contact macros found here. The delimiter you specify is used to separate macrovalues for each group member.
For example, the following macro will return a comma-separated list of host state ids for hosts that are members of thehg1 hostgroup:
"$HOSTSTATEID:hg1:,$"
This macro definition will return something that looks like this:
5.3. Understanding Macros and How They Work 63

Shinken Documentation, Release 2.4
5.3.7 Custom Variable Macros
Any custom object variables that you define in host, service, or contact definitions are also available as macros. Customvariable macros are named as follows:
• “$_HOSTvarname$”
• “$_SERVICEvarname$”
• “$_CONTACTvarname$”
Take the following host definition with a custom variable called “”_MACADDRESS””...
define host{host_name linuxboxaddress 192.168.1.1_MACADDRESS 00:01:02:03:04:05...
}
The “_MACADDRESS” custom variable would be available in a macro called “$_HOSTMACADDRESS$”. Moreinformation on custom object variables and how they can be used in macros can be found here.
5.3.8 Macro Cleansing
Some macros are stripped of potentially dangerous shell metacharacters before being substituted into commands to beexecuted. Which characters are stripped from the macros depends on the setting of the illegal_macro_output_charsdirective. The following macros are stripped of potentially dangerous characters:
• $HOSTOUTPUT$
• $LONGHOSTOUTPUT$
• $HOSTPERFDATA$
• $HOSTACKAUTHOR$
• $HOSTACKCOMMENT$
• $SERVICEOUTPUT$
• $LONGSERVICEOUTPUT$
• $SERVICEPERFDATA$
• $SERVICEACKAUTHOR$
• $SERVICEACKCOMMENT$
5.3.9 Macros as Environment Variables
Most macros are made available as environment variables for easy reference by scripts or commands that are executedby Shinken. For purposes of security and sanity, $USERn$ and “on-demand” host and service macros are not madeavailable as environment variables.
Environment variables that contain standard macros are named the same as their corresponding macro names (listedhere), with “NAGIOS_” prepended to their names. For example, the $HOSTNAME$ macro would be available as anenvironment variable named “NAGIOS_HOSTNAME”.
64 Chapter 5. The Basics

Shinken Documentation, Release 2.4
5.3.10 Available Macros
A list of all the macros that are available in Shinken, as well as a chart of when they can be used, can be found here.
5.4 Standard Macros in Shinken
Standard macros that are available in Shinken are listed here. On-demand macros and macros for custom variables aredescribed here.
5.4.1 Macro Validity
Although macros can be used in all commands you define, not all macros may be valid” in a particular type ofcommand. For example, some macros may only be valid during service notification commands, whereas other mayonly be valid during host check commands. There are ten types of commands that Nagios recognizes and treatsdifferently. They are as follows:
• Service checks
• Service notifications
• Host checks
• Host notifications
• Service event handlers and/or a global service event handler
• Host event handlers and/or a global host event handler
• OCSP command
• OCHP command
• Service performance data commands
• Host performance data commands
The tables below list all macros currently available in Shinken, along with a brief description of each and the types ofcommands in which they are valid. If a macro is used in a command in which it is invalid, it is replaced with an emptystring. It should be noted that macros consist of all uppercase characters and are enclosed in $ characters.
5.4.2 Macro Availability Chart
Legend:
No The macro is not availableYes The macro is available
Macro Name Service Checks Service Notifications Host Checks Host Notifications Service Event Handlers and OCSP Host Event Handlers and OCHP Service Perf Data Host Perf DataHost Macros: 03$HOSTNAME$ Yes Yes Yes Yes Yes Yes Yes Yes$HOSTDISPLAYNAME$ Yes Yes Yes Yes Yes Yes Yes Yes$HOSTALIAS$ Yes Yes Yes Yes Yes Yes Yes Yes$HOSTADDRESS$ Yes Yes Yes Yes Yes Yes Yes Yes$HOSTSTATE$ Yes Yes Yes 01 Yes Yes Yes Yes Yes$HOSTSTATEID$ Yes Yes Yes 01 Yes Yes Yes Yes Yes
Continued on next page
5.4. Standard Macros in Shinken 65
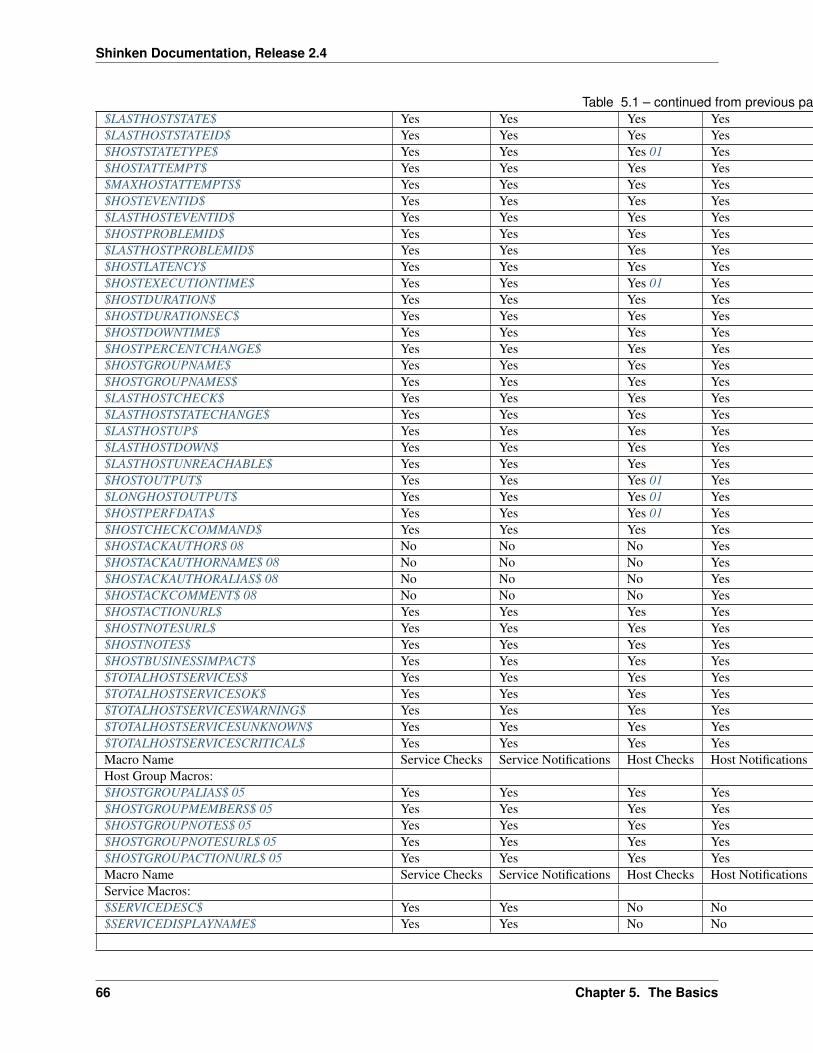
Shinken Documentation, Release 2.4
Table 5.1 – continued from previous page$LASTHOSTSTATE$ Yes Yes Yes Yes Yes Yes Yes Yes$LASTHOSTSTATEID$ Yes Yes Yes Yes Yes Yes Yes Yes$HOSTSTATETYPE$ Yes Yes Yes 01 Yes Yes Yes Yes Yes$HOSTATTEMPT$ Yes Yes Yes Yes Yes Yes Yes Yes$MAXHOSTATTEMPTS$ Yes Yes Yes Yes Yes Yes Yes Yes$HOSTEVENTID$ Yes Yes Yes Yes Yes Yes Yes Yes$LASTHOSTEVENTID$ Yes Yes Yes Yes Yes Yes Yes Yes$HOSTPROBLEMID$ Yes Yes Yes Yes Yes Yes Yes Yes$LASTHOSTPROBLEMID$ Yes Yes Yes Yes Yes Yes Yes Yes$HOSTLATENCY$ Yes Yes Yes Yes Yes Yes Yes Yes$HOSTEXECUTIONTIME$ Yes Yes Yes 01 Yes Yes Yes Yes Yes$HOSTDURATION$ Yes Yes Yes Yes Yes Yes Yes Yes$HOSTDURATIONSEC$ Yes Yes Yes Yes Yes Yes Yes Yes$HOSTDOWNTIME$ Yes Yes Yes Yes Yes Yes Yes Yes$HOSTPERCENTCHANGE$ Yes Yes Yes Yes Yes Yes Yes Yes$HOSTGROUPNAME$ Yes Yes Yes Yes Yes Yes Yes Yes$HOSTGROUPNAMES$ Yes Yes Yes Yes Yes Yes Yes Yes$LASTHOSTCHECK$ Yes Yes Yes Yes Yes Yes Yes Yes$LASTHOSTSTATECHANGE$ Yes Yes Yes Yes Yes Yes Yes Yes$LASTHOSTUP$ Yes Yes Yes Yes Yes Yes Yes Yes$LASTHOSTDOWN$ Yes Yes Yes Yes Yes Yes Yes Yes$LASTHOSTUNREACHABLE$ Yes Yes Yes Yes Yes Yes Yes Yes$HOSTOUTPUT$ Yes Yes Yes 01 Yes Yes Yes Yes Yes$LONGHOSTOUTPUT$ Yes Yes Yes 01 Yes Yes Yes Yes Yes$HOSTPERFDATA$ Yes Yes Yes 01 Yes Yes Yes Yes Yes$HOSTCHECKCOMMAND$ Yes Yes Yes Yes Yes Yes Yes Yes$HOSTACKAUTHOR$ 08 No No No Yes No No No No$HOSTACKAUTHORNAME$ 08 No No No Yes No No No No$HOSTACKAUTHORALIAS$ 08 No No No Yes No No No No$HOSTACKCOMMENT$ 08 No No No Yes No No No No$HOSTACTIONURL$ Yes Yes Yes Yes Yes Yes Yes Yes$HOSTNOTESURL$ Yes Yes Yes Yes Yes Yes Yes Yes$HOSTNOTES$ Yes Yes Yes Yes Yes Yes Yes Yes$HOSTBUSINESSIMPACT$ Yes Yes Yes Yes Yes Yes Yes Yes$TOTALHOSTSERVICES$ Yes Yes Yes Yes Yes Yes Yes Yes$TOTALHOSTSERVICESOK$ Yes Yes Yes Yes Yes Yes Yes Yes$TOTALHOSTSERVICESWARNING$ Yes Yes Yes Yes Yes Yes Yes Yes$TOTALHOSTSERVICESUNKNOWN$ Yes Yes Yes Yes Yes Yes Yes Yes$TOTALHOSTSERVICESCRITICAL$ Yes Yes Yes Yes Yes Yes Yes YesMacro Name Service Checks Service Notifications Host Checks Host Notifications Service Event Handlers and OCSP Host Event Handlers and OCHP Service Perf Data Host Perf DataHost Group Macros:$HOSTGROUPALIAS$ 05 Yes Yes Yes Yes Yes Yes Yes Yes$HOSTGROUPMEMBERS$ 05 Yes Yes Yes Yes Yes Yes Yes Yes$HOSTGROUPNOTES$ 05 Yes Yes Yes Yes Yes Yes Yes Yes$HOSTGROUPNOTESURL$ 05 Yes Yes Yes Yes Yes Yes Yes Yes$HOSTGROUPACTIONURL$ 05 Yes Yes Yes Yes Yes Yes Yes YesMacro Name Service Checks Service Notifications Host Checks Host Notifications Service Event Handlers and OCSP Host Event Handlers and OCHP Service Perf Data Host Perf DataService Macros:$SERVICEDESC$ Yes Yes No No Yes No Yes No$SERVICEDISPLAYNAME$ Yes Yes No No Yes No Yes No
Continued on next page
66 Chapter 5. The Basics

Shinken Documentation, Release 2.4
Table 5.1 – continued from previous page$SERVICESTATE$ Yes 02 Yes No No Yes No Yes No$SERVICESTATEID$ Yes 02 Yes No No Yes No Yes No$LASTSERVICESTATE$ Yes Yes No No Yes No Yes No$LASTSERVICESTATEID$ Yes Yes No No Yes No Yes No$SERVICESTATETYPE$ Yes Yes No No Yes No Yes No$SERVICEATTEMPT$ Yes Yes No No Yes No Yes No$MAXSERVICEATTEMPTS$ Yes Yes No No Yes No Yes No$SERVICEISVOLATILE$ Yes Yes No No Yes No Yes No$SERVICEEVENTID$ Yes Yes No No Yes No Yes No$LASTSERVICEEVENTID$ Yes Yes No No Yes No Yes No$SERVICEPROBLEMID$ Yes Yes No No Yes No Yes No$LASTSERVICEPROBLEMID$ Yes Yes No No Yes No Yes No$SERVICELATENCY$ Yes Yes No No Yes No Yes No$SERVICEEXECUTIONTIME$ Yes 02 Yes No No Yes No Yes No$SERVICEDURATION$ Yes Yes No No Yes No Yes No$SERVICEDURATIONSEC$ Yes Yes No No Yes No Yes No$SERVICEDOWNTIME$ Yes Yes No No Yes No Yes No$SERVICEPERCENTCHANGE$ Yes Yes No No Yes No Yes No$SERVICEGROUPNAME$ Yes Yes No No Yes No Yes No$SERVICEGROUPNAMES$ Yes Yes No No Yes No Yes No$LASTSERVICECHECK$ Yes Yes No No Yes No Yes No$LASTSERVICESTATECHANGE$ Yes Yes No No Yes No Yes No$LASTSERVICEOK$ Yes Yes No No Yes No Yes No$LASTSERVICEWARNING$ Yes Yes No No Yes No Yes No$LASTSERVICEUNKNOWN$ Yes Yes No No Yes No Yes No$LASTSERVICECRITICAL$ Yes Yes No No Yes No Yes No$SERVICEOUTPUT$ Yes 02 Yes No No Yes No Yes No$LONGSERVICEOUTPUT$ Yes 02 Yes No No Yes No Yes No$SERVICEPERFDATA$ Yes 02 Yes No No Yes No Yes No$SERVICECHECKCOMMAND$ Yes Yes No No Yes No Yes No$SERVICEACKAUTHOR$ 08 No Yes No No No No No No$SERVICEACKAUTHORNAME$ 08 No Yes No No No No No No$SERVICEACKAUTHORALIAS$ 08 No Yes No No No No No No$SERVICEACKCOMMENT$ 08 No Yes No No No No No No$SERVICEACTIONURL$ Yes Yes No No Yes No Yes No$SERVICENOTESURL$ Yes Yes No No Yes No Yes No$SERVICENOTES$ Yes Yes No No Yes No Yes No$SERVICEBUSINESSIMPACT$ Yes Yes No No Yes No Yes NoMacro Name Service Checks Service Notifications Host Checks Host Notifications Service Event Handlers and OCSP Host Event Handlers and OCHP Service Perf Data Host Perf DataService Group Macros:$SERVICEGROUPALIAS$ 06 Yes Yes Yes Yes Yes Yes Yes Yes$SERVICEGROUPMEMBERS$ 06 Yes Yes Yes Yes Yes Yes Yes Yes$SERVICEGROUPNOTES$ 06 Yes Yes Yes Yes Yes Yes Yes Yes$SERVICEGROUPNOTESURL$ 06 Yes Yes Yes Yes Yes Yes Yes Yes$SERVICEGROUPACTIONURL$ 06 Yes Yes Yes Yes Yes Yes Yes YesMacro Name Service Checks Service Notifications Host Checks Host Notifications Service Event Handlers and OCSP Host Event Handlers and OCHP Service Perf Data Host Perf DataContact Macros:$CONTACTNAME$ No Yes No Yes No No No No$CONTACTALIAS$ No Yes No Yes No No No No$CONTACTEMAIL$ No Yes No Yes No No No No
Continued on next page
5.4. Standard Macros in Shinken 67
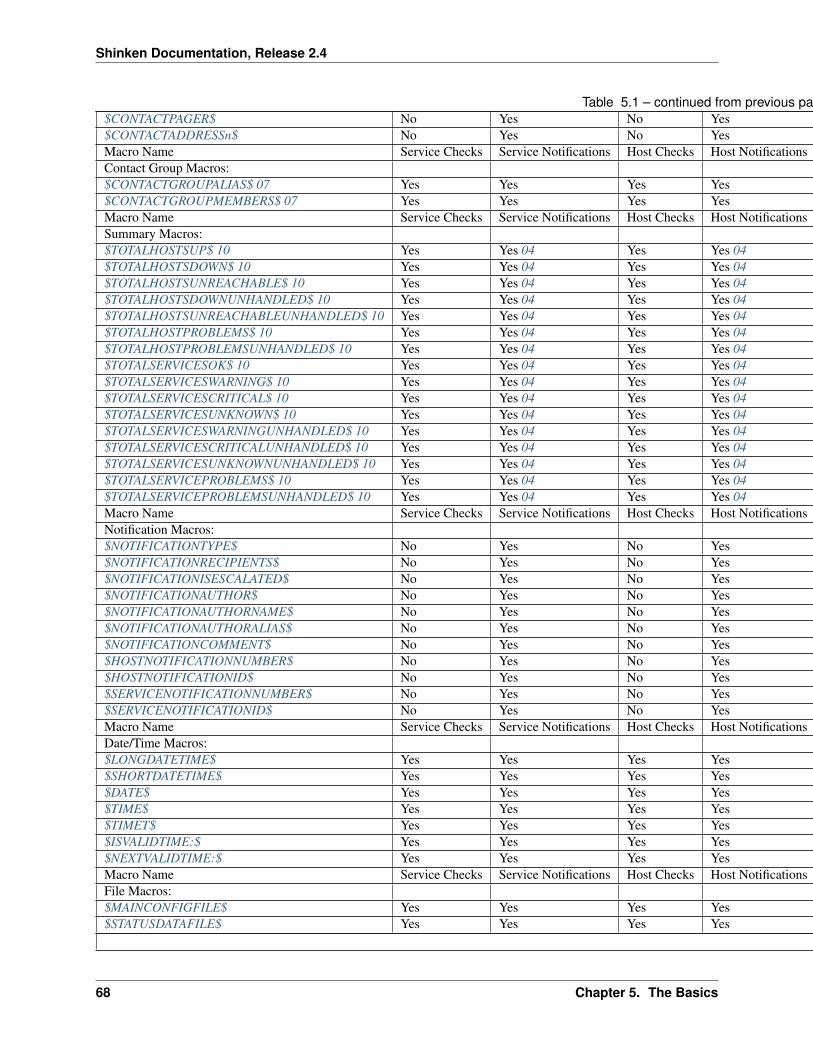
Shinken Documentation, Release 2.4
Table 5.1 – continued from previous page$CONTACTPAGER$ No Yes No Yes No No No No$CONTACTADDRESSn$ No Yes No Yes No No No NoMacro Name Service Checks Service Notifications Host Checks Host Notifications Service Event Handlers and OCSP Host Event Handlers and OCHP Service Perf Data Host Perf DataContact Group Macros:$CONTACTGROUPALIAS$ 07 Yes Yes Yes Yes Yes Yes Yes Yes$CONTACTGROUPMEMBERS$ 07 Yes Yes Yes Yes Yes Yes Yes YesMacro Name Service Checks Service Notifications Host Checks Host Notifications Service Event Handlers and OCSP Host Event Handlers and OCHP Service Perf Data Host Perf DataSummary Macros:$TOTALHOSTSUP$ 10 Yes Yes 04 Yes Yes 04 Yes Yes Yes Yes$TOTALHOSTSDOWN$ 10 Yes Yes 04 Yes Yes 04 Yes Yes Yes Yes$TOTALHOSTSUNREACHABLE$ 10 Yes Yes 04 Yes Yes 04 Yes Yes Yes Yes$TOTALHOSTSDOWNUNHANDLED$ 10 Yes Yes 04 Yes Yes 04 Yes Yes Yes Yes$TOTALHOSTSUNREACHABLEUNHANDLED$ 10 Yes Yes 04 Yes Yes 04 Yes Yes Yes Yes$TOTALHOSTPROBLEMS$ 10 Yes Yes 04 Yes Yes 04 Yes Yes Yes Yes$TOTALHOSTPROBLEMSUNHANDLED$ 10 Yes Yes 04 Yes Yes 04 Yes Yes Yes Yes$TOTALSERVICESOK$ 10 Yes Yes 04 Yes Yes 04 Yes Yes Yes Yes$TOTALSERVICESWARNING$ 10 Yes Yes 04 Yes Yes 04 Yes Yes Yes Yes$TOTALSERVICESCRITICAL$ 10 Yes Yes 04 Yes Yes 04 Yes Yes Yes Yes$TOTALSERVICESUNKNOWN$ 10 Yes Yes 04 Yes Yes 04 Yes Yes Yes Yes$TOTALSERVICESWARNINGUNHANDLED$ 10 Yes Yes 04 Yes Yes 04 Yes Yes Yes Yes$TOTALSERVICESCRITICALUNHANDLED$ 10 Yes Yes 04 Yes Yes 04 Yes Yes Yes Yes$TOTALSERVICESUNKNOWNUNHANDLED$ 10 Yes Yes 04 Yes Yes 04 Yes Yes Yes Yes$TOTALSERVICEPROBLEMS$ 10 Yes Yes 04 Yes Yes 04 Yes Yes Yes Yes$TOTALSERVICEPROBLEMSUNHANDLED$ 10 Yes Yes 04 Yes Yes 04 Yes Yes Yes YesMacro Name Service Checks Service Notifications Host Checks Host Notifications Service Event Handlers and OCSP Host Event Handlers and OCHP Service Perf Data Host Perf DataNotification Macros:$NOTIFICATIONTYPE$ No Yes No Yes No No No No$NOTIFICATIONRECIPIENTS$ No Yes No Yes No No No No$NOTIFICATIONISESCALATED$ No Yes No Yes No No No No$NOTIFICATIONAUTHOR$ No Yes No Yes No No No No$NOTIFICATIONAUTHORNAME$ No Yes No Yes No No No No$NOTIFICATIONAUTHORALIAS$ No Yes No Yes No No No No$NOTIFICATIONCOMMENT$ No Yes No Yes No No No No$HOSTNOTIFICATIONNUMBER$ No Yes No Yes No No No No$HOSTNOTIFICATIONID$ No Yes No Yes No No No No$SERVICENOTIFICATIONNUMBER$ No Yes No Yes No No No No$SERVICENOTIFICATIONID$ No Yes No Yes No No No NoMacro Name Service Checks Service Notifications Host Checks Host Notifications Service Event Handlers and OCSP Host Event Handlers and OCHP Service Perf Data Host Perf DataDate/Time Macros:$LONGDATETIME$ Yes Yes Yes Yes Yes Yes Yes Yes$SHORTDATETIME$ Yes Yes Yes Yes Yes Yes Yes Yes$DATE$ Yes Yes Yes Yes Yes Yes Yes Yes$TIME$ Yes Yes Yes Yes Yes Yes Yes Yes$TIMET$ Yes Yes Yes Yes Yes Yes Yes Yes$ISVALIDTIME:$ Yes Yes Yes Yes Yes Yes Yes Yes$NEXTVALIDTIME:$ Yes Yes Yes Yes Yes Yes Yes YesMacro Name Service Checks Service Notifications Host Checks Host Notifications Service Event Handlers and OCSP Host Event Handlers and OCHP Service Perf Data Host Perf DataFile Macros:$MAINCONFIGFILE$ Yes Yes Yes Yes Yes Yes Yes Yes$STATUSDATAFILE$ Yes Yes Yes Yes Yes Yes Yes Yes
Continued on next page
68 Chapter 5. The Basics

Shinken Documentation, Release 2.4
Table 5.1 – continued from previous page$COMMENTDATAFILE$ Yes Yes Yes Yes Yes Yes Yes Yes 05$DOWNTIMEDATAFILE$ Yes Yes Yes Yes Yes Yes Yes Yes$RETENTIONDATAFILE$ Yes Yes Yes Yes Yes Yes Yes Yes$OBJECTCACHEFILE$ Yes Yes Yes Yes Yes Yes Yes Yes$TEMPFILE$ Yes Yes Yes Yes Yes Yes Yes Yes$TEMPPATH$ Yes Yes Yes Yes Yes Yes Yes Yes$LOGFILE$ Yes Yes Yes Yes Yes Yes Yes Yes$RESOURCEFILE$ Yes Yes Yes Yes Yes Yes Yes Yes$COMMANDFILE$ Yes Yes Yes Yes Yes Yes Yes Yes$HOSTPERFDATAFILE$ Yes Yes Yes Yes Yes Yes Yes Yes$SERVICEPERFDATAFILE$ Yes Yes Yes Yes Yes Yes Yes YesMacro Name Service Checks Service Notifications Host Checks Host Notifications Service Event Handlers and OCSP Host Event Handlers and OCHP Service Perf Data Host Perf DataMisc Macros:$PROCESSSTARTTIME$ Yes Yes Yes Yes Yes Yes Yes Yes$EVENTSTARTTIME$ Yes Yes Yes Yes Yes Yes Yes Yes$ADMINEMAIL$ Yes Yes Yes Yes Yes Yes Yes Yes$ADMINPAGER$ Yes Yes Yes Yes Yes Yes Yes Yes$ARGn$ Yes Yes Yes Yes Yes Yes Yes Yes$USERn$ Yes Yes Yes Yes Yes Yes Yes Yes
5.4.3 Macro Descriptions
Host Macros 03
$HOSTNAME$ Short name for the host (i.e. “biglinuxbox”). This value is taken from the host_name directive in the host definition.$HOSTDISPLAYNAME$ An alternate display name for the host. This value is taken from the display_name directive in the host definition.$HOSTALIAS$ Long name/description for the host. This value is taken from the alias directive in the host definition.$HOSTADDRESS$ Address of the host. This value is taken from the address directive in the host definition.$HOSTSTATE$ A string indicating the current state of the host (“UP”, “DOWN”, or “UNREACHABLE”).$HOSTSTATEID$ A number that corresponds to the current state of the host: 0=UP, 1=DOWN, 2=UNREACHABLE.$LASTHOSTSTATE$ A string indicating the last state of the host (“UP”, “DOWN”, or “UNREACHABLE”).$LASTHOSTSTATEID$ A number that corresponds to the last state of the host: 0=UP, 1=DOWN, 2=UNREACHABLE.$HOSTSTATETYPE$ A string indicating the state type for the current host check (“HARD” or “SOFT”). Soft states occur when host checks return a non-OK (non-UP) state and are in the process of being retried. Hard states result when host checks have been checked a specified maximum number of times.$HOSTATTEMPT$ The number of the current host check retry. For instance, if this is the second time that the host is being rechecked, this will be the number two. Current attempt number is really only useful when writing host event handlers for “soft” states that take a specific action based on the host retry number.$MAXHOSTATTEMPTS$ The max check attempts as defined for the current host. Useful when writing host event handlers for “soft” states that take a specific action based on the host retry number.$HOSTEVENTID$ A globally unique number associated with the host’s current state. Every time a host (or service) experiences a state change, a global event ID number is incremented by one (1). If a host has experienced no state changes, this macro will be set to zero (0).$LASTHOSTEVENTID$ The previous (globally unique) event number that was given to the host.$HOSTPROBLEMID$ A globally unique number associated with the host’s current problem state. Every time a host (or service) transitions from an UP or OK state to a problem state, a global problem ID number is incremented by one (1). This macro will be non-zero if the host is currently a non-UP state. State transitions between non-UP states (e.g. DOWN to UNREACHABLE) do not cause this problem id to increase. If the host is currently in an UP state, this macro will be set to zero (0). Combined with event handlers, this macro could be used to automatically open trouble tickets when hosts first enter a problem state.$LASTHOSTPROBLEMID$ The previous (globally unique) problem number that was given to the host. Combined with event handlers, this macro could be used for automatically closing trouble tickets, etc. when a host recovers to an UP state.$HOSTLATENCY$ A (floating point) number indicating the number of seconds that a scheduled host check lagged behind its scheduled check time. For instance, if a check was scheduled for 03:14:15 and it didn’t get executed until 03:14:17, there would be a check latency of 2.0 seconds. On-demand host checks have a latency of zero seconds.$HOSTEXECUTIONTIME$ A (floating point) number indicating the number of seconds that the host check took to execute (i.e. the amount of time the check was executing).$HOSTDURATION$ A string indicating the amount of time that the host has spent in its current state. Format is “XXh YYm ZZs”, indicating hours, minutes and seconds.$HOSTDURATIONSEC$ A number indicating the number of seconds that the host has spent in its current state.$HOSTDOWNTIME$ A number indicating the current “downtime depth” for the host. If this host is currently in a period of scheduled downtime, the value will be greater than zero. If the host is not currently in a period of downtime, this value will be zero.$HOSTPERCENTCHANGE$ A (floating point) number indicating the percent state change the host has undergone. Percent state change is used by the flap detection algorithm.$HOSTGROUPNAME$ The short name of the hostgroup that this host belongs to. This value is taken from the hostgroup_name directive in the hostgroup definition. If the host belongs to more than one hostgroup this macro will contain the name of just one of them.$HOSTGROUPNAMES$ A comma separated list of the short names of all the hostgroups that this host belongs to.$LASTHOSTCHECK$ This is a timestamp in time_t format (seconds since the UNIX epoch) indicating the time at which a check of the host was last performed.$LASTHOSTSTATECHANGE$ This is a timestamp in time_t format (seconds since the UNIX epoch) indicating the time the host last changed state.
Continued on next page
5.4. Standard Macros in Shinken 69
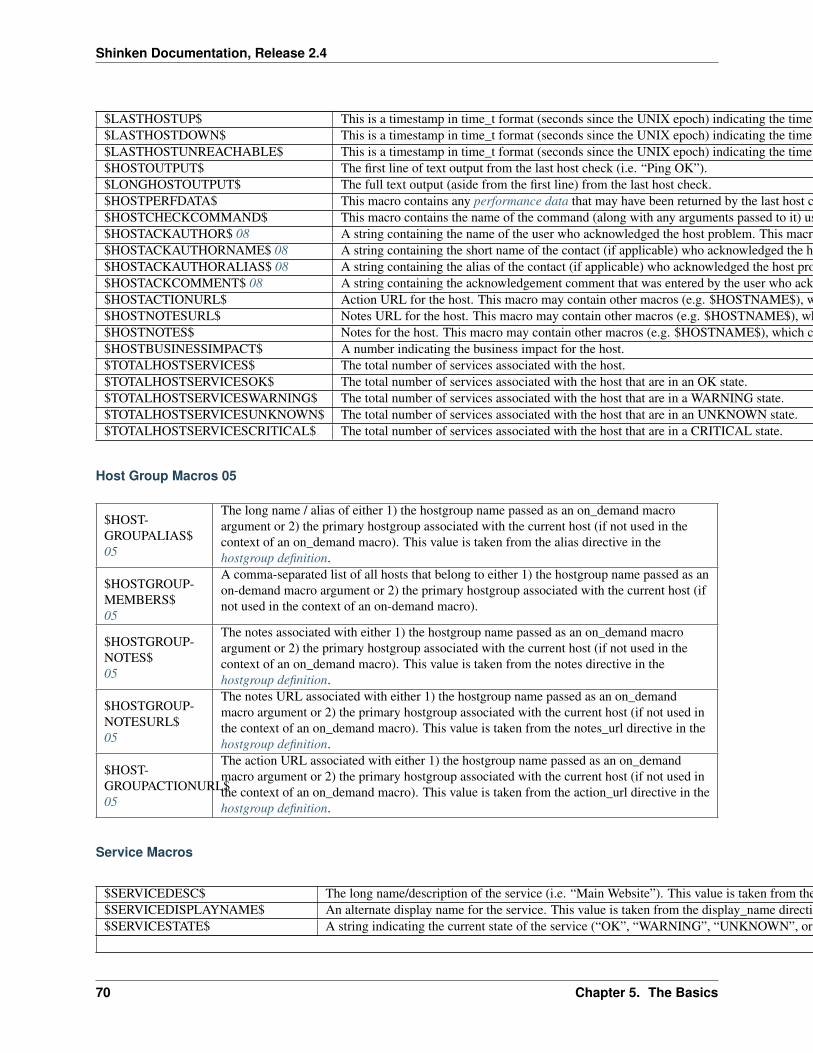
Shinken Documentation, Release 2.4
Table 5.2 – continued from previous page$LASTHOSTUP$ This is a timestamp in time_t format (seconds since the UNIX epoch) indicating the time at which the host was last detected as being in an UP state.$LASTHOSTDOWN$ This is a timestamp in time_t format (seconds since the UNIX epoch) indicating the time at which the host was last detected as being in a DOWN state.$LASTHOSTUNREACHABLE$ This is a timestamp in time_t format (seconds since the UNIX epoch) indicating the time at which the host was last detected as being in an UNREACHABLE state.$HOSTOUTPUT$ The first line of text output from the last host check (i.e. “Ping OK”).$LONGHOSTOUTPUT$ The full text output (aside from the first line) from the last host check.$HOSTPERFDATA$ This macro contains any performance data that may have been returned by the last host check.$HOSTCHECKCOMMAND$ This macro contains the name of the command (along with any arguments passed to it) used to perform the host check.$HOSTACKAUTHOR$ 08 A string containing the name of the user who acknowledged the host problem. This macro is only valid in notifications where the $NOTIFICATIONTYPE$ macro is set to “ACKNOWLEDGEMENT”.$HOSTACKAUTHORNAME$ 08 A string containing the short name of the contact (if applicable) who acknowledged the host problem. This macro is only valid in notifications where the $NOTIFICATIONTYPE$ macro is set to “ACKNOWLEDGEMENT”.$HOSTACKAUTHORALIAS$ 08 A string containing the alias of the contact (if applicable) who acknowledged the host problem. This macro is only valid in notifications where the $NOTIFICATIONTYPE$ macro is set to “ACKNOWLEDGEMENT”.$HOSTACKCOMMENT$ 08 A string containing the acknowledgement comment that was entered by the user who acknowledged the host problem. This macro is only valid in notifications where the $NOTIFICATIONTYPE$ macro is set to “ACKNOWLEDGEMENT”.$HOSTACTIONURL$ Action URL for the host. This macro may contain other macros (e.g. $HOSTNAME$), which can be useful when you want to pass the host name to a web page.$HOSTNOTESURL$ Notes URL for the host. This macro may contain other macros (e.g. $HOSTNAME$), which can be useful when you want to pass the host name to a web page.$HOSTNOTES$ Notes for the host. This macro may contain other macros (e.g. $HOSTNAME$), which can be useful when you want to host-specific status information, etc. in the description.$HOSTBUSINESSIMPACT$ A number indicating the business impact for the host.$TOTALHOSTSERVICES$ The total number of services associated with the host.$TOTALHOSTSERVICESOK$ The total number of services associated with the host that are in an OK state.$TOTALHOSTSERVICESWARNING$ The total number of services associated with the host that are in a WARNING state.$TOTALHOSTSERVICESUNKNOWN$ The total number of services associated with the host that are in an UNKNOWN state.$TOTALHOSTSERVICESCRITICAL$ The total number of services associated with the host that are in a CRITICAL state.
Host Group Macros 05
$HOST-GROUPALIAS$05
The long name / alias of either 1) the hostgroup name passed as an on_demand macroargument or 2) the primary hostgroup associated with the current host (if not used in thecontext of an on_demand macro). This value is taken from the alias directive in thehostgroup definition.
$HOSTGROUP-MEMBERS$05
A comma-separated list of all hosts that belong to either 1) the hostgroup name passed as anon-demand macro argument or 2) the primary hostgroup associated with the current host (ifnot used in the context of an on-demand macro).
$HOSTGROUP-NOTES$05
The notes associated with either 1) the hostgroup name passed as an on_demand macroargument or 2) the primary hostgroup associated with the current host (if not used in thecontext of an on_demand macro). This value is taken from the notes directive in thehostgroup definition.
$HOSTGROUP-NOTESURL$05
The notes URL associated with either 1) the hostgroup name passed as an on_demandmacro argument or 2) the primary hostgroup associated with the current host (if not used inthe context of an on_demand macro). This value is taken from the notes_url directive in thehostgroup definition.
$HOST-GROUPACTIONURL$05
The action URL associated with either 1) the hostgroup name passed as an on_demandmacro argument or 2) the primary hostgroup associated with the current host (if not used inthe context of an on_demand macro). This value is taken from the action_url directive in thehostgroup definition.
Service Macros
$SERVICEDESC$ The long name/description of the service (i.e. “Main Website”). This value is taken from the description directive of the service definition.$SERVICEDISPLAYNAME$ An alternate display name for the service. This value is taken from the display_name directive in the service definition.$SERVICESTATE$ A string indicating the current state of the service (“OK”, “WARNING”, “UNKNOWN”, or “CRITICAL”).
Continued on next page
70 Chapter 5. The Basics

Shinken Documentation, Release 2.4
Table 5.3 – continued from previous page$SERVICESTATEID$ A number that corresponds to the current state of the service: 0=OK, 1=WARNING, 2=CRITICAL, 3=UNKNOWN.$LASTSERVICESTATE$ A string indicating the last state of the service (“OK”, “WARNING”, “UNKNOWN”, or “CRITICAL”).$LASTSERVICESTATEID$ A number that corresponds to the last state of the service: 0=OK, 1=WARNING, 2=CRITICAL, 3=UNKNOWN.$SERVICESTATETYPE$ A string indicating the state type for the current service check (“HARD” or “SOFT”). Soft states occur when service checks return a non-OK state and are in the process of being retried. Hard states result when service checks have been checked a specified maximum number of times.$SERVICEATTEMPT$ The number of the current service check retry. For instance, if this is the second time that the service is being rechecked, this will be the number two. Current attempt number is really only useful when writing service event handlers for “soft” states that take a specific action based on the service retry number.$MAXSERVICEATTEMPTS$ The max check attempts as defined for the current service. Useful when writing host event handlers for “soft” states that take a specific action based on the service retry number.$SERVICEISVOLATILE$ Indicates whether the service is marked as being volatile or not: 0 = not volatile, 1 = volatile.$SERVICEEVENTID$ A globally unique number associated with the service’s current state. Every time a a service (or host) experiences a state change, a global event ID number is incremented by one (1). If a service has experienced no state changes, this macro will be set to zero (0).$LASTSERVICEEVENTID$ The previous (globally unique) event number that given to the service.$SERVICEPROBLEMID$ A globally unique number associated with the service’s current problem state. Every time a service (or host) transitions from an OK or UP state to a problem state, a global problem ID number is incremented by one (1). This macro will be non-zero if the service is currently a non-OK state. State transitions between non-OK states (e.g. WARNING to CRITICAL) do not cause this problem id to increase. If the service is currently in an OK state, this macro will be set to zero (0). Combined with event handlers, this macro could be used to automatically open trouble tickets when services first enter a problem state.$LASTSERVICEPROBLEMID$ The previous (globally unique) problem number that was given to the service. Combined with event handlers, this macro could be used for automatically closing trouble tickets, etc. when a service recovers to an OK state.$SERVICELATENCY$ A (floating point) number indicating the number of seconds that a scheduled service check lagged behind its scheduled check time. For instance, if a check was scheduled for 03:14:15 and it didn’t get executed until 03:14:17, there would be a check latency of 2.0 seconds.$SERVICEEXECUTIONTIME$ A (floating point) number indicating the number of seconds that the service check took to execute (i.e. the amount of time the check was executing).$SERVICEDURATION$ A string indicating the amount of time that the service has spent in its current state. Format is “XXh YYm ZZs”, indicating hours, minutes and seconds.$SERVICEDURATIONSEC$ A number indicating the number of seconds that the service has spent in its current state.$SERVICEDOWNTIME$ A number indicating the current “downtime depth” for the service. If this service is currently in a period of scheduled downtime, the value will be greater than zero. If the service is not currently in a period of downtime, this value will be zero.$SERVICEPERCENTCHANGE$ A (floating point) number indicating the percent state change the service has undergone. Percent state change is used by the flap detection algorithm.$SERVICEGROUPNAME$ The short name of the servicegroup that this service belongs to. This value is taken from the servicegroup_name directive in the servicegroup definition. If the service belongs to more than one servicegroup this macro will contain the name of just one of them.$SERVICEGROUPNAMES$ A comma separated list of the short names of all the servicegroups that this service belongs to.$LASTSERVICECHECK$ This is a timestamp in time_t format (seconds since the UNIX epoch) indicating the time at which a check of the service was last performed.$LASTSERVICESTATECHANGE$ This is a timestamp in time_t format (seconds since the UNIX epoch) indicating the time the service last changed state.$LASTSERVICEOK$ This is a timestamp in time_t format (seconds since the UNIX epoch) indicating the time at which the service was last detected as being in an OK state.$LASTSERVICEWARNING$ This is a timestamp in time_t format (seconds since the UNIX epoch) indicating the time at which the service was last detected as being in a WARNING state.$LASTSERVICEUNKNOWN$ This is a timestamp in time_t format (seconds since the UNIX epoch) indicating the time at which the service was last detected as being in an UNKNOWN state.$LASTSERVICECRITICAL$ This is a timestamp in time_t format (seconds since the UNIX epoch) indicating the time at which the service was last detected as being in a CRITICAL state.$SERVICEOUTPUT$ The first line of text output from the last service check (i.e. “Ping OK”).$LONGSERVICEOUTPUT$ The full text output (aside from the first line) from the last service check.$SERVICEPERFDATA$ This macro contains any performance data that may have been returned by the last service check.$SERVICECHECKCOMMAND$ This macro contains the name of the command (along with any arguments passed to it) used to perform the service check.$SERVICEACKAUTHOR$ 08 A string containing the name of the user who acknowledged the service problem. This macro is only valid in notifications where the $NOTIFICATIONTYPE$ macro is set to “ACKNOWLEDGEMENT”.$SERVICEACKAUTHORNAME$ 08 A string containing the short name of the contact (if applicable) who acknowledged the service problem. This macro is only valid in notifications where the $NOTIFICATIONTYPE$ macro is set to “ACKNOWLEDGEMENT”.$SERVICEACKAUTHORALIAS$ 08 A string containing the alias of the contact (if applicable) who acknowledged the service problem. This macro is only valid in notifications where the $NOTIFICATIONTYPE$ macro is set to “ACKNOWLEDGEMENT”.$SERVICEACKCOMMENT$ 08 A string containing the acknowledgement comment that was entered by the user who acknowledged the service problem. This macro is only valid in notifications where the $NOTIFICATIONTYPE$ macro is set to “ACKNOWLEDGEMENT”.$SERVICEACTIONURL$ Action URL for the service. This macro may contain other macros (e.g. $HOSTNAME$ or $SERVICEDESC$), which can be useful when you want to pass the service name to a web page.$SERVICENOTESURL$ Notes URL for the service. This macro may contain other macros (e.g. $HOSTNAME$ or $SERVICEDESC$), which can be useful when you want to pass the service name to a web page.$SERVICENOTES$ Notes for the service. This macro may contain other macros (e.g. $HOSTNAME$ or $SERVICESTATE$), which can be useful when you want to service-specific status information, etc. in the description$SERVICEBUSINESSIMPACT$ A number indicating the business impact for the service.
5.4. Standard Macros in Shinken 71

Shinken Documentation, Release 2.4
Service Group Macros 06
$SERVICE-GROUPALIAS$06
The long name / alias of either 1) the servicegroup name passed as an on_demand macroargument or 2) the primary servicegroup associated with the current service (if not used inthe context of an on_demand macro). This value is taken from the alias directive in theservicegroup definition.
$SERVICE-GROUPMEM-BERS$06
A comma-separated list of all services that belong to either 1) the servicegroup namepassed as an on-demand macro argument or 2) the primary servicegroup associated withthe current service (if not used in the context of an on-demand macro).
$SERVICE-GROUPNOTES$06
The notes associated with either 1) the servicegroup name passed as an on_demand macroargument or 2) the primary servicegroup associated with the current service (if not used inthe context of an on_demand macro). This value is taken from the notes directive in theservicegroup definition.
$SERVICE-GROUP-NOTESURL$06
The notes URL associated with either 1) the servicegroup name passed as an on_demandmacro argument or 2) the primary servicegroup associated with the current service (if notused in the context of an on_demand macro). This value is taken from the notes_urldirective in the servicegroup definition.
$SERVICE-GROUPACTIONURL$06
The action URL associated with either 1) the servicegroup name passed as an on_demandmacro argument or 2) the primary servicegroup associated with the current service (if notused in the context of an on_demand macro). This value is taken from the action_urldirective in the servicegroup definition.
Contact Macros
$CONTACT-NAME$
Short name for the contact (i.e. “jdoe”) that is being notified of a host or service problem.This value is taken from the contact_name directive in the contact definition.
$CONTACTAL-IAS$
Long name/description for the contact (i.e. “John Doe”) being notified. This value is takenfrom the alias directive in the contact definition.
$CON-TACTEMAIL$
Email address of the contact being notified. This value is taken from the email directive in thecontact definition.
$CONTACT-PAGER$
Pager number/address of the contact being notified. This value is taken from the pagerdirective in the contact definition.
$CONTACTAD-DRESSn$
Address of the contact being notified. Each contact can have six different addresses (inaddition to email address and pager number). The macros for these addresses are$CONTACTADDRESS1$ - $CONTACTADDRESS6$. This value is taken from the addressxdirective in the contact definition.
$CONTACT-GROUPNAME$
The short name of the contactgroup that this contact is a member of. This value is taken fromthe contactgroup_name directive in the contactgroup definition. If the contact belongs tomore than one contactgroup this macro will contain the name of just one of them.
$CONTACT-GROUP-NAMES$
A comma separated list of the short names of all the contactgroups that this contact is amember of.
72 Chapter 5. The Basics

Shinken Documentation, Release 2.4
Contact Group Macros 05
$CONTACT-GROUPALIAS$07
The long name / alias of either 1) the contactgroup name passed as an on_demand macroargument or 2) the primary contactgroup associated with the current contact (if not used inthe context of an on_demand macro). This value is taken from the alias directive in thecontactgroup definition.
$CONTACT-GROUPMEM-BERS$07
A comma-separated list of all contacts that belong to either 1) the contactgroup namepassed as an on-demand macro argument or 2) the primary contactgroup associated withthe current contact (if not used in the context of an on-demand macro).
5.4. Standard Macros in Shinken 73

Shinken Documentation, Release 2.4
Summary Macros
$TOTALHOSTSUP$This macro reflects the total number of hosts that are currently in an UP state.
$TOTALHOSTSDOWN$This macro reflects the total number of hosts that are currently in a DOWN state.
$TOTALHOSTSUN-REACHABLE$
This macro reflects the total number of hosts that are currently in anUNREACHABLE state.
$TOTALHOSTSDOW-NUNHANDLED$
This macro reflects the total number of hosts that are currently in a DOWN state thatare not currently being “handled”. Unhandled host problems are those that are notacknowledged, are not currently in scheduled downtime, and for which checks arecurrently enabled.
$TOTALHOSTSUN-REACHABLEUNHAN-DLED$
This macro reflects the total number of hosts that are currently in anUNREACHABLE state that are not currently being “handled”. Unhandled hostproblems are those that are not acknowledged, are not currently in scheduleddowntime, and for which checks are currently enabled.
$TOTALHOSTPROB-LEMS$
This macro reflects the total number of hosts that are currently either in a DOWN oran UNREACHABLE state.
$TOTALHOSTPROB-LEMSUNHANDLED$
This macro reflects the total number of hosts that are currently either in a DOWN oran UNREACHABLE state that are not currently being “handled”. Unhandled hostproblems are those that are not acknowledged, are not currently in scheduleddowntime, and for which checks are currently enabled.
$TOTALSERVICESOK$This macro reflects the total number of services that are currently in an OK state.
$TOTALSER-VICESWARNING$
This macro reflects the total number of services that are currently in a WARNINGstate.
$TOTALSERVICES-CRITICAL$
This macro reflects the total number of services that are currently in a CRITICALstate.
$TOTALSERVICESUN-KNOWN$
This macro reflects the total number of services that are currently in an UNKNOWNstate.
$TOTALSER-VICESWARNINGUN-HANDLED$
This macro reflects the total number of services that are currently in a WARNINGstate that are not currently being “handled”. Unhandled services problems are thosethat are not acknowledged, are not currently in scheduled downtime, and for whichchecks are currently enabled.
$TOTALSERVICES-CRITICALUNHAN-DLED$
This macro reflects the total number of services that are currently in a CRITICALstate that are not currently being “handled”. Unhandled services problems are thosethat are not acknowledged, are not currently in scheduled downtime, and for whichchecks are currently enabled.
$TOTALSERVICESUN-KNOWNUNHAN-DLED$
This macro reflects the total number of services that are currently in an UNKNOWNstate that are not currently being “handled”. Unhandled services problems are thosethat are not acknowledged, are not currently in scheduled downtime, and for whichchecks are currently enabled.
$TOTALSERVI-CEPROBLEMS$
This macro reflects the total number of services that are currently either in aWARNING, CRITICAL, or UNKNOWN state.
$TOTALSERVI-CEPROBLEMSUNHAN-DLED$
This macro reflects the total number of services that are currently either in aWARNING, CRITICAL, or UNKNOWN state that are not currently being“handled”. Unhandled services problems are those that are not acknowledged, arenot currently in scheduled downtime, and for which checks are currently enabled.
74 Chapter 5. The Basics

Shinken Documentation, Release 2.4
5.4. Standard Macros in Shinken 75

Shinken Documentation, Release 2.4
Notification Macros
$NOTIFICATION-TYPE$
A string identifying the type of notification that is being sent (“PROBLEM”,“RECOVERY”, “ACKNOWLEDGEMENT”, “FLAPPINGSTART”,“FLAPPINGSTOP”, “FLAPPINGDISABLED”, “DOWNTIMESTART”,“DOWNTIMEEND”, or “DOWNTIMECANCELLED”).
$NOTIFICATION-RECIPIENTS$
A comma-separated list of the short names of all contacts that are being notified about thehost or service.
$NOTIFICA-TIONISESCA-LATED$
An integer indicating whether this was sent to normal contacts for the host or service or ifit was escalated. 0 = Normal (non-escalated) notification , 1 = Escalated notification.
$NOTIFICATIO-NAUTHOR$
A string containing the name of the user who authored the notification. If the$NOTIFICATIONTYPE$ macro is set to “DOWNTIMESTART” or“DOWNTIMEEND”, this will be the name of the user who scheduled downtime for thehost or service. If the $NOTIFICATIONTYPE$ macro is “ACKNOWLEDGEMENT”,this will be the name of the user who acknowledged the host or service problem. If the$NOTIFICATIONTYPE$ macro is “CUSTOM”, this will be name of the user whoinitated the custom host or service notification.
$NOTIFICATIO-NAUTHORNAME$
A string containing the short name of the contact (if applicable) specified in the$NOTIFICATIONAUTHOR$ macro.
$NOTIFICATIO-NAUTHORALIAS$
A string containing the alias of the contact (if applicable) specified in the$NOTIFICATIONAUTHOR$ macro.
$NOTIFICATION-COMMENT$
A string containing the comment that was entered by the notification author. If the$NOTIFICATIONTYPE$ macro is set to “DOWNTIMESTART” or“DOWNTIMEEND”, this will be the comment entered by the user who scheduleddowntime for the host or service. If the $NOTIFICATIONTYPE$ macro is“ACKNOWLEDGEMENT”, this will be the comment entered by the user whoacknowledged the host or service problem. If the $NOTIFICATIONTYPE$ macro is“CUSTOM”, this will be comment entered by the user who initated the custom host orservice notification.
$HOSTNOTIFICA-TIONNUMBER$
The current notification number for the host. The notification number increases by one(1) each time a new notification is sent out for the host (except for acknowledgements).The notification number is reset to 0 when the host recovers (after the recoverynotification has gone out). Acknowledgements do not cause the notification number toincrease, nor do notifications dealing with flap detection or scheduled downtime.
$HOSTNOTIFICA-TIONID$
A unique number identifying a host notification. Notification ID numbers are uniqueacross both hosts and service notifications, so you could potentially use this uniquenumber as a primary key in a notification database. Notification ID numbers shouldremain unique across restarts of the Nagios process, so long as you have state retentionenabled. The notification ID number is incremented by one (1) each time a new hostnotification is sent out, and regardless of how many contacts are notified.
$SERVICENOTIFI-CATIONNUMBER$
The current notification number for the service. The notification number increases by one(1) each time a new notification is sent out for the service (except for acknowledgements).The notification number is reset to 0 when the service recovers (after the recoverynotification has gone out). Acknowledgements do not cause the notification number toincrease, nor do notifications dealing with flap detection or scheduled downtime.
$SERVICENOTIFI-CATIONID$
A unique number identifying a service notification. Notification ID numbers are uniqueacross both hosts and service notifications, so you could potentially use this uniquenumber as a primary key in a notification database. Notification ID numbers shouldremain unique across restarts of the Nagios process, so long as you have state retentionenabled. The notification ID number is incremented by one (1) each time a new servicenotification is sent out, and regardless of how many contacts are notified.
76 Chapter 5. The Basics
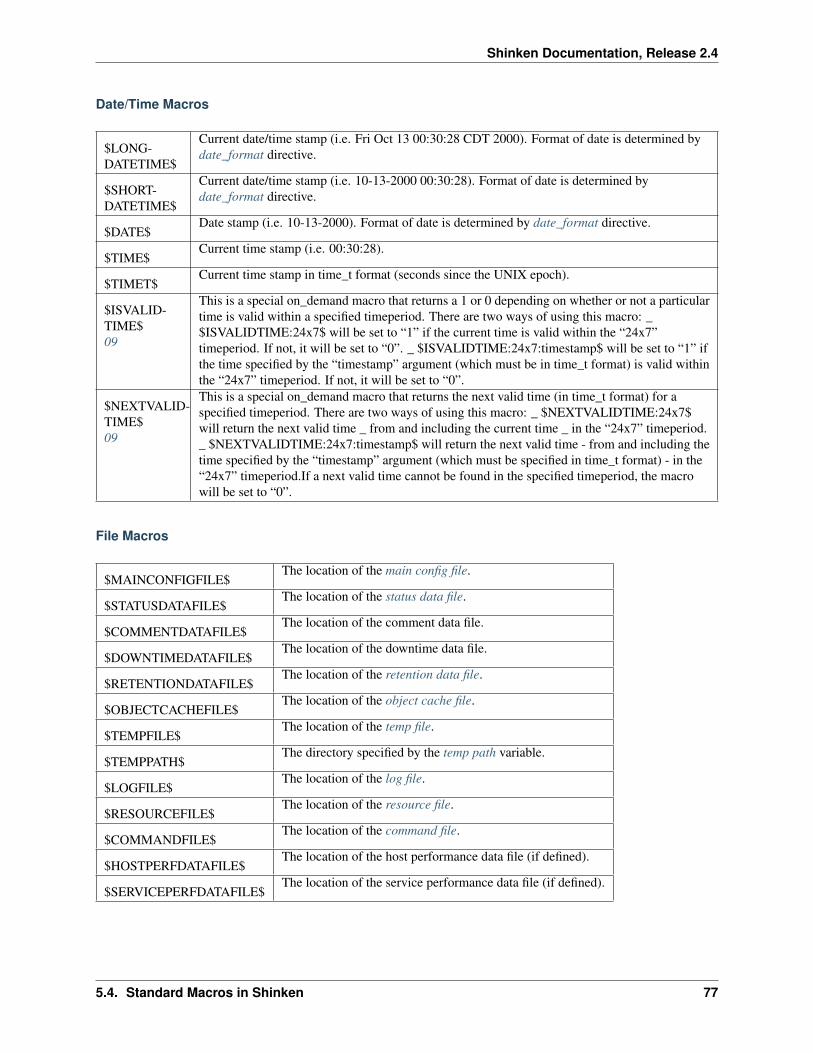
Shinken Documentation, Release 2.4
Date/Time Macros
$LONG-DATETIME$
Current date/time stamp (i.e. Fri Oct 13 00:30:28 CDT 2000). Format of date is determined bydate_format directive.
$SHORT-DATETIME$
Current date/time stamp (i.e. 10-13-2000 00:30:28). Format of date is determined bydate_format directive.
$DATE$Date stamp (i.e. 10-13-2000). Format of date is determined by date_format directive.
$TIME$Current time stamp (i.e. 00:30:28).
$TIMET$Current time stamp in time_t format (seconds since the UNIX epoch).
$ISVALID-TIME$09
This is a special on_demand macro that returns a 1 or 0 depending on whether or not a particulartime is valid within a specified timeperiod. There are two ways of using this macro: _$ISVALIDTIME:24x7$ will be set to “1” if the current time is valid within the “24x7”timeperiod. If not, it will be set to “0”. _ $ISVALIDTIME:24x7:timestamp$ will be set to “1” ifthe time specified by the “timestamp” argument (which must be in time_t format) is valid withinthe “24x7” timeperiod. If not, it will be set to “0”.
$NEXTVALID-TIME$09
This is a special on_demand macro that returns the next valid time (in time_t format) for aspecified timeperiod. There are two ways of using this macro: _ $NEXTVALIDTIME:24x7$will return the next valid time _ from and including the current time _ in the “24x7” timeperiod._ $NEXTVALIDTIME:24x7:timestamp$ will return the next valid time - from and including thetime specified by the “timestamp” argument (which must be specified in time_t format) - in the“24x7” timeperiod.If a next valid time cannot be found in the specified timeperiod, the macrowill be set to “0”.
File Macros
$MAINCONFIGFILE$The location of the main config file.
$STATUSDATAFILE$The location of the status data file.
$COMMENTDATAFILE$The location of the comment data file.
$DOWNTIMEDATAFILE$The location of the downtime data file.
$RETENTIONDATAFILE$The location of the retention data file.
$OBJECTCACHEFILE$The location of the object cache file.
$TEMPFILE$The location of the temp file.
$TEMPPATH$The directory specified by the temp path variable.
$LOGFILE$The location of the log file.
$RESOURCEFILE$The location of the resource file.
$COMMANDFILE$The location of the command file.
$HOSTPERFDATAFILE$The location of the host performance data file (if defined).
$SERVICEPERFDATAFILE$The location of the service performance data file (if defined).
5.4. Standard Macros in Shinken 77

Shinken Documentation, Release 2.4
Misc Macros
$PRO-CESSSTART-TIME$
Time stamp in time_t format (seconds since the UNIX epoch) indicating when the Nagiosprocess was last (re)started. You can determine the number of seconds that Nagios has beenrunning (since it was last restarted) by subtracting $PROCESSSTARTTIME$ from $TIMET$.
$EVENTSTART-TIME$
Time stamp in time_t format (seconds since the UNIX epoch) indicating when the Nagiosprocess starting process events (checks, etc.). You can determine the number of seconds that ittook for Nagios to startup by subtracting $PROCESSSTARTTIME$ from$EVENTSTARTTIME$.
$ADMINE-MAIL$(unused)
Global administrative email address. This value is taken from the admin_email directive.
$ADMIN-PAGER$(unused)
Global administrative pager number/address. This value is taken from the admin_pagerdirective.
$ARGn$The nth argument passed to the command (notification, event handler, service check, etc.).Nagios supports up to 32 argument macros ($ARG1$ through $ARG32$).
$USERn$The nth user-definable macro. User macros can be defined in one or more resource files.Nagios supports up to 32 user macros ($USER1$ through $USER32$).
5.4.4 Notes
• 01 These macros are not valid for the host they are associated with when that host is being checked (i.e. theymake no sense, as they haven’t been determined yet).
• 02 These macros are not valid for the service they are associated with when that service is being checked (i.e.they make no sense, as they haven’t been determined yet).
• 03 When host macros are used in service-related commands (i.e. service notifications, event handlers, etc) theyrefer to the host that the service is associated with.
• 04 When host and service summary macros are used in notification commands, the totals are filtered to reflectonly those hosts and services for which the contact is authorized (i.e. hosts and services they are configured toreceive notifications for).
• 05 These macros are normally associated with the first/primary hostgroup associated with the current host. Theycould therefore be considered host macros in many cases. However, these macros are not available as on-demandhost macros. Instead, they can be used as on-demand hostgroup macros when you pass the name of a hostgroupto the macro. For example: $HOSTGROUPMEMBERS:hg1$ would return a comma-delimited list of all (host)members of the hostgroup hg1.
• 06 These macros are normally associated with the first/primary servicegroup associated with the current service.They could therefore be considered service macros in many cases. However, these macros are not availableas on-demand service macros. Instead, they can be used as on-demand servicegroup macros when you passthe name of a servicegroup to the macro. For example: $SERVICEGROUPMEMBERS:sg1$ would return acomma-delimited list of all (service) members of the servicegroup sg1.
• 07 These macros are normally associated with the first/primary contactgroup associated with the current contact.They could therefore be considered contact macros in many cases. However, these macros are not available ason-demand contact macros. Instead, they can be used as on-demand contactgroup macros when you pass thename of a contactgroup to the macro. For example: $CONTACTGROUPMEMBERS:cg1$ would return acomma-delimited list of all (contact) members of the contactgroup cg1.
78 Chapter 5. The Basics

Shinken Documentation, Release 2.4
• 08 These acknowledgement macros are deprecated. Use the more generic $NOTIFICATIONAUTHOR$, $NO-TIFICATIONAUTHORNAME$, $NOTIFICATIONAUTHORALIAS$ or $NOTIFICATIONAUTHORCOM-MENT$ macros instead.
• 09 These macro are only available as on-demand macros - e.g. you must supply an additional argument withthem in order to use them. These macros are not available as environment variables.
• 10 Summary macros are not available as environment variables if the use_large_installation_tweaks option isenabled, as they are quite CPU-intensive to calculate.
5.5 Host Checks
5.5.1 Introduction
The basic workings of host checks are described here...
5.5.2 When Are Host Checks Performed?
Hosts are checked by the Shinken daemon:
• At regular intervals, as defined by the check_interval and retry_interval options in your host definitions.
• On-demand when a service associated with the host changes state.
• On-demand as needed as part of the host reachability logic.
• On-demand as needed for predictive host dependency checks.
Regularly scheduled host checks are optional. If you set the check_interval option in your host definition to zero (0),Shinken will not perform checks of the hosts on a regular basis. It will, however, still perform on-demand checks ofthe host as needed for other parts of the monitoring logic.
On-demand checks are made when a service associated with the host changes state because Shinken needs to knowwhether the host has also changed state. Services that change state are often an indicator that the host may have alsochanged state. For example, if Shinken detects that the “HTTP” service associated with a host just changed from aCRITICAL to an OK state, it may indicate that the host just recovered from a reboot and is now back up and running.
On-demand checks of hosts are also made as part of the host reachability logic. Shinken is designed to detect networkoutages as quickly as possible, and distinguish between DOWN and UNREACHABLE host states. These are verydifferent states and can help an admin quickly locate the cause of a network outage.
On-demand checks are also performed as part of the predictive host dependency check logic. These checks help ensurethat the dependency logic is as accurate as possible.
5.5.3 Cached Host Checks
The performance of on-demand host checks can be significantly improved by implementing the use of cached checks,which allow Shinken to forgo executing a host check if it determines a relatively recent check result will do instead.More information on cached checks can be found here.
5.5.4 Dependencies and Checks
You can define host execution dependencies that prevent Shinken from checking the status of a host depending on thestate of one or more other hosts. More information on dependencies can be found here.
5.5. Host Checks 79

Shinken Documentation, Release 2.4
5.5.5 Parallelization of Host Checks
All checks are run in parallel.
5.5.6 Host States
Hosts that are checked can be in one of three different states:
• UP
• DOWN
• UNREACHABLE
5.5.7 Host State Determination
Host checks are performed by plugins, which can return a state of OK, WARNING, UNKNOWN, or CRITICAL. Howdoes Shinken translate these plugin return codes into host states of UP, DOWN, or UNREACHABLE? Lets see...
The table below shows how plugin return codes correspond with preliminary host states. Some post-processing (whichis described later) is done which may then alter the final host state.
Plugin Result Preliminary Host StateOK UPWARNING DOWN*UNKNOWN DOWNCRITICAL DOWN
If the preliminary host state is DOWN, Shinken will attempt to see if the host is really DOWN or if it is UNREACH-ABLE. The distinction between DOWN and UNREACHABLE host states is important, as it allows admins to deter-mine root cause of network outages faster. The following table shows how Shinken makes a final state determinationbased on the state of the hosts parent(s). A host’s parents are defined in the parents directive in host definition.
Preliminary Host State Parent Host State Final Host StateDOWN At least one parent is UP DOWNDOWN All parents are either DOWN or UNREACHABLE UNREACHABLE
More information on how Shinken distinguishes between DOWN and UNREACHABLE states can be found here.
5.5.8 Host State Changes
As you are probably well aware, hosts don’t always stay in one state. Things break, patches get applied, and serversneed to be rebooted. When Shinken checks the status of hosts, it will be able to detect when a host changes betweenUP, DOWN, and UNREACHABLE states and take appropriate action. These state changes result in different statetypes (HARD or SOFT), which can trigger event handlers to be run and notifications to be sent out. Detecting anddealing with state changes is what Shinken is all about.
When hosts change state too frequently they are considered to be “flapping”. A good example of a flapping host wouldbe server that keeps spontaneously rebooting as soon as the operating system loads. That’s always a fun scenario tohave to deal with. Shinken can detect when hosts start flapping, and can suppress notifications until flapping stops andthe host’s state stabilizes. More information on the flap detection logic can be found here.
80 Chapter 5. The Basics
Shinken Documentation, Release 2.4
5.6 Service Checks
5.6.1 Introduction
The basic workings of service checks are described here...
5.6.2 When Are Service Checks Performed?
Services are checked by the Shinken daemon:
• At regular intervals, as defined by the “check_interval” and “retry_interval” options in your service definitions.
• On-demand as needed for predictive service dependency checks.
On-demand checks are performed as part of the predictive service dependency check logic. These checks help ensurethat the dependency logic is as accurate as possible. If you don’t make use of service dependencies, Shinken won’tperform any on-demand service checks.
5.6.3 Cached Service Checks
The performance of on-demand service checks can be significantly improved by implementing the use of cachedchecks, which allow Shinken to forgo executing a service check if it determines a relatively recent check result willdo instead. Cached checks will only provide a performance increase if you are making use of service dependencies.More information on cached checks can be found here.
5.6.4 Dependencies and Checks
You can define service execution dependencies that prevent Shinken from checking the status of a service dependingon the state of one or more other services. More information on dependencies can be found here.
5.6.5 Parallelization of Service Checks
Scheduled service checks are run in parallel.
5.6.6 Service States
Services that are checked can be in one of four different states:
• OK
• WARNING
• UNKNOWN
• CRITICAL
5.6.7 Service State Determination
Service checks are performed by plugins, which can return a state of OK, WARNING, UNKNOWN, or CRITICAL.These plugin states directly translate to service states. For example, a plugin which returns a WARNING state willcause a service to have a WARNING state.
5.6. Service Checks 81

Shinken Documentation, Release 2.4
5.6.8 Services State Changes
When Shinken checks the status of services, it will be able to detect when a service changes between OK, WARNING,UNKNOWN, and CRITICAL states and take appropriate action. These state changes result in different state types(HARD or SOFT), which can trigger event handlers to be run and notifications to be sent out. Service state changescan also trigger on-demand host checks. Detecting and dealing with state changes is what Shinken is all about.
When services change state too frequently they are considered to be “flapping”. Shinken can detect when servicesstart flapping, and can suppress notifications until flapping stops and the service’s state stabilizes. More informationon the flap detection logic can be found here.
5.7 Active Checks
5.7.1 Introduction
Shinken is capable of monitoring hosts and services in two ways: actively and passively. Passive checks are describedelsewhere, so we’ll focus on active checks here. Active checks are the most common method for monitoring hosts andservices. The main features of actives checks are as follows:
• Active checks are initiated by the Shinken process
• Active checks are run on a regularly scheduled basis
5.7.2 How Are Active Checks Performed?
Active checks are initiated by the check logic in the Shinken daemon. When Shinken needs to check the status of ahost or service it will execute a plugin and pass it information about what needs to be checked. The plugin will thencheck the operational state of the host or service and report the results back to the Shinken daemon. Shinken willprocess the results of the host or service check and take appropriate action as necessary (e.g. send notifications, runevent handlers, etc).
82 Chapter 5. The Basics

Shinken Documentation, Release 2.4
More information on how plugins work can be found here.
5.7.3 When Are Active Checks Executed?
Active check are executed:
• At regular intervals, as defined by the “check_interval” and “retry_interval” options in your host and servicedefinitions
• On-demand as needed
Regularly scheduled checks occur at intervals equaling either the “check_interval” or the “retry_interval” in your hostor service definitions, depending on what type of state the host or service is in. If a host or service is in a HARD state,it will be actively checked at intervals equal to the “check_interval” option. If it is in a SOFT state, it will be checkedat intervals equal to the retry_interval option.
On-demand checks are performed whenever Shinken sees a need to obtain the latest status information about a par-ticular host or service. For example, when Shinken is determining the reachability of a host, it will often performon-demand checks of parent and child hosts to accurately determine the status of a particular network segment. On-demand checks also occur in the predictive dependency check logic in order to ensure Shinken has the most accuratestatus information.
5.8 Passive Checks
5.8.1 Introduction
In most cases you’ll use Shinken to monitor your hosts and services using regularly scheduled active checks. Activechecks can be used to “poll” a device or service for status information every so often. Shinken also supports a way tomonitor hosts and services passively instead of actively. They key features of passive checks are as follows:
• Passive checks are initiated and performed by external applications/processes
• Passive check results are submitted to Shinken for processing
The major difference between active and passive checks is that active checks are initiated and performed by Shinken,while passive checks are performed by external applications.
5.8.2 Uses For Passive Checks
Passive checks are useful for monitoring services that are:
• Asynchronous in nature, they cannot or would not be monitored effectively by polling their status on a regularlyscheduled basis
• Located behind a firewall and cannot be checked actively from the monitoring host
Examples of asynchronous services that lend themselves to being monitored passively include:
• “SNMP” traps and security alerts. You never know how many (if any) traps or alerts you’ll receive in a giventime frame, so it’s not feasible to just monitor their status every few minutes.
• Aggregated checks from a host running an agent. Checks may be run at much lower intervals on hosts runningan agent.
• Submitting check results that happen directly within an application without using an intermediate log file(syslog,event log, etc.).
5.8. Passive Checks 83

Shinken Documentation, Release 2.4
Passive checks are also used when configuring distributed or redundant monitoring installations.
5.8.3 How Passive Checks Work
DEPRECATED IMAGE - TODO REPLACE WITH MOE ACCURATE DEPTICTION
Here’s how passive checks work in more detail...
• An external application checks the status of a host or service.
• The external application writes the results of the check to the external command named pipe (a named pipe is a“memory pipe”, so there is no disk IO involved).
• Shinken reads the external command file and places the results of all passive checks into a queue for processingby the appropriate process in the Shinken cloud.
• Shinken will execute a check result reaper event each second and scan the check result queue. Each servicecheck result that is found in the queue is processed in the same manner - regardless of whether the check wasactive or passive. Shinken may send out notifications, log alerts, etc. depending on the check result information.
The processing of active and passive check results is essentially identical. This allows for seamless integration ofstatus information from external applications with Shinken.
5.8.4 Enabling Passive Checks
In order to enable passive checks in Shinken, you’ll need to do the following:
• Set “accept_passive_service_checks” directive is set to 1 (in nagios.cfg).
• Set the “passive_checks_enabled” directive in your host and service definitions is set to 1.
If you want to disable processing of passive checks on a global basis, set the “accept_passive_service_checks” direc-tive to 0.
84 Chapter 5. The Basics

Shinken Documentation, Release 2.4
If you would like to disable passive checks for just a few hosts or services, use the “passive_checks_enabled” directivein the host and/or service definitions to do so.
5.8.5 Submitting Passive Service Check Results
External applications can submit passive service check results to Shinken by writing a PRO-CESS_SERVICE_CHECK_RESULT external command to the external command pipe, which is essentially afile handle that you write to as you would a file.
The format of the command is as follows: “[<timestamp>] PROCESS_SERVICE_CHECK_RESULT;<configobjects/host_name>;<svc_description>;<return_code>;<plugin_output>”where...
• timestamp is the time in time_t format (seconds since the UNIX epoch) that the service check was perfomed (orsubmitted). Please note the single space after the right bracket.
• host_name is the short name of the host associated with the service in the service definition
• svc_description is the description of the service as specified in the service definition
• return_code is the return code of the check (0=OK, 1=WARNING, 2=CRITICAL, 3=UNKNOWN)
• plugin_output is the text output of the service check (i.e. the plugin output)
A service must be defined in Shinken before Shinken will accept passive check results for it! Shinken will ignore allcheck results for services that have not been configured before it was last (re)started.
An example shell script of how to submit passive service check results to Shinken can be found in the documentationon volatile services.
5.8.6 Submitting Passive Host Check Results
External applications can submit passive host check results to Shinken by writing a PRO-CESS_HOST_CHECK_RESULT external command to the external command file.
The format of the command is as follows: “[<timestamp>]PROCESS_HOST_CHECK_RESULT;<configobjects/host_name>;<configobjects/host_status>;<plugin_output>”where...
• timestamp is the time in time_t format (seconds since the UNIX epoch) that the host check was perfomed (orsubmitted). Please note the single space after the right bracket.
• host_name is the short name of the host (as defined in the host definition)
• host_status is the status of the host (0=UP, 1=DOWN, 2=UNREACHABLE)
• plugin_output is the text output of the host check
A host must be defined in Shinken before you can submit passive check results for it! Shinken will ignore all checkresults for hosts that had not been configured before it was last (re)started.
Once data has been received by the Arbiter process, either directly or through a Receiver daemon, it will forward thecheck results to the appropriate Scheduler to apply check logic.
5.8.7 Passive Checks and Host States
Unlike with active host checks, Shinken does not (by default) attempt to determine whether or host is DOWN orUNREACHABLE with passive checks. Rather, Shinken takes the passive check result to be the actual state the host isin and doesn’t try to determine the hosts’ actual state using the reachability logic. This can cause problems if you aresubmitting passive checks from a remote host or you have a distributed monitoring setup where the parent/child hostrelationships are different.
5.8. Passive Checks 85

Shinken Documentation, Release 2.4
You can tell Shinken to translate DOWN/UNREACHABLE passive check result states to their “proper” state by usingthe “translate_passive_host_checks” variable. More information on how this works can be found here.
Passive host checks are normally treated as HARD states, unless the “passive_host_checks_are_soft” option is en-abled.
5.8.8 Submitting Passive Check Results From Remote Hosts
DEPRECATED IMAGE - TODO REPLACE WITH MORE ACCURATE DEPICTION
If an application that resides on the same host as Shinken is sending passive host or service check results, it can simplywrite the results directly to the external command named pipe file as outlined above. However, applications on remotehosts can’t do this so easily.
In order to allow remote hosts to send passive check results to the monitoring host, there a multiple modules to thatcan send and accept passive check results. NSCA, TSCA, Shinken WebService and more.
Learn more about the different passive check result/command protocols and how to configure them.
5.9 State Types
5.9.1 Introduction
The current state of monitored services and hosts is determined by two components:
• The status of the service or host (i.e. OK, WARNING, UP, DOWN, etc.)
• The type of state the service or host is in.
There are two state types in Shinken - SOFT states and HARD states. These state types are a crucial part of themonitoring logic, as they are used to determine when event handlers are executed and when notifications are initiallysent out.
This document describes the difference between SOFT and HARD states, how they occur, and what happens whenthey occur.
5.9.2 Service and Host Check Retries
In order to prevent false alarms from transient problems, Shinken allows you to define how many times a service or hostshould be (re)checked before it is considered to have a “real” problem. This is controlled by the max_check_attemptsoption in the host and service definitions. Understanding how hosts and services are (re)checked in order to determineif a real problem exists is important in understanding how state types work.
86 Chapter 5. The Basics

Shinken Documentation, Release 2.4
5.9.3 Soft States
Soft states occur in the following situations...
• When a service or host check results in a non-OK or non-UP state and the service check has not yet been(re)checked the number of times specified by the max_check_attempts directive in the service or host definition.This is called a soft error.
• When a service or host recovers from a soft error. This is considered a soft recovery.
The following things occur when hosts or services experience SOFT state changes:
• The SOFT state is logged.
• Event handlers are executed to handle the SOFT state.
SOFT states are only logged if you enabled the log_service_retries or log_host_retries options in your main configu-ration file.
The only important thing that really happens during a soft state is the execution of event handlers. Using eventhandlers can be particularly useful if you want to try and proactively fix a problem before it turns into a HARD state.The $HOSTSTATETYPE$ or $SERVICESTATETYPE$ macros will have a value of “SOFT” when event handlers areexecuted, which allows your event handler scripts to know when they should take corrective action. More informationon event handlers can be found here.
5.9.4 Hard States
Hard states occur for hosts and services in the following situations:
• When a host or service check results in a non-UP or non-OK state and it has been (re)checked the number oftimes specified by the max_check_attempts option in the host or service definition. This is a hard error state.
• When a host or service transitions from one hard error state to another error state (e.g. WARNING to CRITI-CAL).
• When a service check results in a non-OK state and its corresponding host is either DOWN or UNREACHABLE.
• When a host or service recovers from a hard error state. This is considered to be a hard recovery.
• When a passive host check is received. Passive host checks are treated as HARD unless the pas-sive_host_checks_are_soft option is enabled.
The following things occur when hosts or services experience HARD state changes:
• The HARD state is logged.
• Event handlers are executed to handle the HARD state.
• Contacts are notifified of the host or service problem or recovery.
The $HOSTSTATETYPE$ or $SERVICESTATETYPE$ macros will have a value of “HARD” when event handlers areexecuted, which allows your event handler scripts to know when they should take corrective action. More informationon event handlers can be found here.
5.9.5 Example
Here’s an example of how state types are determined, when state changes occur, and when event handlers andnotifications are sent out. The table below shows consecutive checks of a service over time. The service has amax_check_attempts value of 3.
5.9. State Types 87
Shinken Documentation, Release 2.4
Time Check#
State StateType
StateChange
Notes
0 1 OK HARD No Initial state of the service1 1 CRIT-
ICALSOFT Yes First detection of a non-OK state. Event handlers execute.
2 2 WARN-ING
SOFT Yes Service continues to be in a non-OK state. Event handlers execute.
3 3 CRIT-ICAL
HARD Yes Max check attempts has been reached, so service goes into a HARD state.Event handlers execute and a problem notification is sent out. Check # isreset to 1 immediately after this happens.
4 1 WARN-ING
HARD Yes Service changes to a HARD WARNING state. Event handlers execute anda problem notification is sent out.
5 1 WARN-ING
HARD No Service stabilizes in a HARD problem state. Depending on what thenotification interval for the service is, another notification might be sent out.
6 1 OK HARD Yes Service experiences a HARD recovery. Event handlers execute and arecovery notification is sent out.
7 1 OK HARD No Service is still OK.8 1 UN-
KNOWNSOFT Yes Service is detected as changing to a SOFT non-OK state. Event handlers
execute.9 2 OK SOFT Yes Service experiences a SOFT recovery. Event handlers execute, but
notification are not sent, as this wasn’t a “real” problem. State type is setHARD and check # is reset to 1 immediately after this happens.
10 1 OK HARD No Service stabilizes in an OK state.
5.10 Time Periods
Abstract
or...“Is This a Good Time?”
5.10.1 Introduction
Timeperiod definitions allow you to control when various aspects of the monitoring and alerting logic can operate. Forinstance, you can restrict:
• When regularly scheduled host and service checks can be performed
• When notifications can be sent out
• When notification escalations can be used
• When dependencies are valid
88 Chapter 5. The Basics

Shinken Documentation, Release 2.4
5.10.2 Precedence in Time Periods
Timeperod definitions may contain multiple types of directives, including weekdays, days of the month, and calen-dar dates. Different types of directives have different precedence levels and may override other directives in yourtimeperiod definitions. The order of precedence for different types of directives (in descending order) is as follows:
• Calendar date (2008-01-01)
• Specific month date (January 1st)
• Generic month date (Day 15)
• Offset weekday of specific month (2nd Tuesday in December)
• Offset weekday (3rd Monday)
• Normal weekday (Tuesday)
Examples of different timeperiod directives can be found here.
5.10.3 How Time Periods Work With Host and Service Checks
Host and service definitions have an optional “check_period” directive that allows you to specify a timeperiod thatshould be used to restrict when regularly scheduled, active checks of the host or service can be made.
If you do not use the “check_period directive” to specify a timeperiod, Shinken will be able to schedule active checksof the host or service anytime it needs to. This is essentially a 24x7 monitoring scenario.
Specifying a timeperiod in the “check_period directive” allows you to restrict the time that Shinken perform regularlyscheduled, active checks of the host or service. When Shinken attempts to reschedule a host or service check, it willmake sure that the next check falls within a valid time range within the defined timeperiod. If it doesn’t, Shinken willadjust the next check time to coincide with the next “valid” time in the specified timeperiod. This means that the hostor service may not get checked again for another hour, day, or week, etc.
On-demand checks and passive checks are not restricted by the timeperiod you specify in the “check_period directive”.Only regularly scheduled active checks are restricted.
A service’s timeperiod is inherited from its host only if it’s not already defined. In a new shinken installation, it’sdefined to “24x7” in generic-service. If you want service notifications stopped when the host is outside its notificationperiod, you’ll want to comment “notification_period” and/or “notification_enabled” in templates.cfg:generic-service1.
Unless you have a good reason not to do so, I would recommend that you monitor all your hosts and services usingtimeperiods that cover a 24x7 time range. If you don’t do this, you can run into some problems during “blackout”times (times that are not valid in the timeperiod definition):
• The status of the host or service will appear unchanged during the blackout time.
• Contacts will mostly likely not get re-notified of problems with a host or service during blackout times.
• If a host or service recovers during a blackout time, contacts will not be immediately notified of the recovery.
5.10.4 How Time Periods Work With Contact Notifications
By specifying a timeperiod in the “notification_period” directive of a host or service definition, you can control whenShinken is allowed to send notifications out regarding problems or recoveries for that host or service. When a hostnotification is about to get sent out, Shinken will make sure that the current time is within a valid range in the “noti-fication_period” timeperiod. If it is a valid time, then Shinken will attempt to notify each contact of the problem orrecovery.
5.10. Time Periods 89

Shinken Documentation, Release 2.4
You can also use timeperiods to control when notifications can be sent out to individual contacts. By using the “ser-vice_notification_period” and “host_notification_period” directives in contact definitions, you’re able to essentiallydefine an “on call” period for each contact. Contacts will only receive host and service notifications during the timesyou specify in the notification period directives.
Examples of how to create timeperiod definitions for use for on-call rotations can be found here.
5.10.5 How Time Periods Work With Notification Escalations
Service and host Notification Escalations have an optional escalation_period directive that allows you to specify atimeperiod when the escalation is valid and can be used. If you do not use the “escalation_period” directive in an esca-lation definition, the escalation is considered valid at all times. If you specify a timeperiod in the “escalation_period”directive, Shinken will only use the escalation definition during times that are valid in the timeperiod definition.
5.10.6 How Time Periods Work With Dependencies
Host and Service Dependencies have an optional “dependency_period” directive that allows you to specify a timepe-riod when the dependendies are valid and can be used. If you do not use the “dependency_period” directive in a de-pendency definition, the dependency can be used at any time. If you specify a timeperiod in the “dependency_period”directive, Shinken will only use the dependency definition during times that are valid in the timeperiod definition.
5.11 Determining Status and Reachability of Network Hosts
5.11.1 Introduction
If you’ve ever work in tech support, you’ve undoubtedly had users tell you “the Internet is down”. As a techie, you’repretty sure that no one pulled the power cord from the Internet. Something must be going wrong somewhere betweenthe user’s chair and the Internet.
Assuming its a technical problem, you begin to search for the problem. Perhaps the user’s computer is turned off,maybe their network cable is unplugged, or perhaps your organization’s core router just took a dive. Whatever theproblem might be, one thing is most certain - the Internet isn’t down. It just happens to be unreachable for that user.
Shinken is able to determine whether the hosts you’re monitoring are in a DOWN or UNREACHABLE state. Theseare very different (although related) states and can help you quickly determine the root cause of network problems. Toachieve this goal you must first and foremost define a check_command for the host you are monitoring. From there,here’s how the reachability logic works to distinguish between these two states...
5.11.2 Example Network
Take a look at the simple network diagram below. For this example, let us assume you’re monitoring all the hosts(server, routers, switches, etc) that are pictured, meaning you have defined check_commands for each of the varioushosts. Shinken is installed and running on the Shinken host.
If you have not defined a check_command for your host, Shinken will assume that the host is always UP. Mean-ing that the logic described will NOT kick-in.
90 Chapter 5. The Basics

Shinken Documentation, Release 2.4
5.11.3 Defining Parent/Child Relationships
In order for Shinken to be able to distinguish between DOWN and UNREACHABLE states for the hosts that are beingmonitored, you’ll need to tell Shinken how those hosts are connected to each other - from the standpoint of the Shinkendaemon. To do this, trace the path that a data packet would take from the Shinken daemon to each individual host.Each switch, router, and server the packet encounters or passes through is considered a “hop” and will require that youdefine a parent/child host relationship in Shinken. Here’s what the host parent/child relationships look like from theviewpoint of Shinken:
5.11. Determining Status and Reachability of Network Hosts 91

Shinken Documentation, Release 2.4
Now that you know what the parent/child relationships look like for hosts that are being monitored, how do youconfigure Shinken to reflect them? The parents directive in your host definitions allows you to do this. Here’s what the(abbreviated) host definitions with parent/child relationships would look like for this example:
define host{host_name Shinken ; <-- The local host has no parent - it is the topmost host
}
define host{host_name Switch1parents Shinken
}
define host{host_name Webparents Switch1
}
define host{host_name FTPparents Switch1
92 Chapter 5. The Basics

Shinken Documentation, Release 2.4
}
define host{host_name Router1parents Switch1
}
define host{host_name Switch2parents Router1
}
define host{host_name Wkstn1parents Switch2
}
define host{host_name HPLJ2605parents Switch2
}
define host{host_name Router2parents Router1
}
define host{host_name somewebsite.comparents Router2
}
5.11.4 Reachability Logic in Action
Now that you’re configured Shinken with the proper parent/child relationships for your hosts, let’s see what happenwhen problems arise. Assume that two hosts - Web and Router1 - go offline...
5.11. Determining Status and Reachability of Network Hosts 93

Shinken Documentation, Release 2.4
When hosts change state (i.e. from UP to DOWN), the host reachability logic in Shinken kicks in. The reachabilitylogic will initiate parallel checks of the parents and children of whatever hosts change state. This allows Shinken toquickly determine the current status of your network infrastructure when changes occur.
94 Chapter 5. The Basics

Shinken Documentation, Release 2.4
In this example, Shinken will determine that Web and Router1 are both in DOWN states because the “path” to thosehosts is not being blocked.
Shinken will determine that all the hosts “beneath” Router1 are all in an UNREACHABLE state because Shinkencan’t reach them. Router1 is DOWN and is blocking the path to those other hosts. Those hosts might be running fine,or they might be offline - Shinken doesn’t know because it can’t reach them. Hence Shinken considers them to beUNREACHABLE instead of DOWN.
5.11.5 UNREACHABLE States and Notifications
By default, Shinken will notify contacts about both DOWN and UNREACHABLE host states. As an admin/tech, youmight not want to get notifications about hosts that are UNREACHABLE. You know your network structure, and ifShinken notifies you that your router/firewall is down, you know that everything behind it is unreachable.
If you want to spare yourself from a flood of UNREACHABLE notifications during network outages, you canexclude the unreachable (u) option from the “notification_options” directive in your host definitions and/or the“host_notification_options” directive in your contact definitions.
5.11. Determining Status and Reachability of Network Hosts 95

Shinken Documentation, Release 2.4
5.12 Notifications
5.12.1 Introduction
I’ve had a lot of questions as to exactly how notifications work. This will attempt to explain exactly when and howhost and service notifications are sent out, as well as who receives them.
Notification escalations are explained here.
5.12.2 When Do Notifications Occur?
The decision to send out notifications is made in the service check and host check logic. Host and service notificationsoccur in the following instances...
• When a hard state change occurs. More information on state types and hard state changes can be found here.
• When a host or service remains in a hard non-OK state and the time specified by the “notification_interval”option in the host or service definition has passed since the last notification was sent out (for that specified hostor service).
5.12.3 Who Gets Notified?
Each host and service definition has a “contact_groups” option that specifies what contact groups receive notificationsfor that particular host or service. Contact groups can contain one or more individual contacts.
When Shinken sends out a host or service notification, it will notify each contact that is a member of any contactgroups specified in the “contact_groups” option of the service definition. Shinken realizes that a contact may be amember of more than one contact group, so it removes duplicate contact notifications before it does anything.
5.12.4 What Filters Must Be Passed In Order For Notifications To Be Sent?
Just because there is a need to send out a host or service notification doesn’t mean that any contacts are going to getnotified. There are several filters that potential notifications must pass before they are deemed worthy enough to besent out. Even then, specific contacts may not be notified if their notification filters do not allow for the notification tobe sent to them. Let’s go into the filters that have to be passed in more detail...
5.12.5 Program-Wide Filter:
The first filter that notifications must pass is a test of whether or not notifications are enabled on a program-wide basis.This is initially determined by the “enable_notifications” directive in the main config file, but may be changed duringruntime from the web interface. If notifications are disabled on a program-wide basis, no host or service notificationscan be sent out - period. If they are enabled on a program-wide basis, there are still other tests that must be passed...
96 Chapter 5. The Basics
Shinken Documentation, Release 2.4
5.12.6 Service and Host Filters:
The first filter for host or service notifications is a check to see if the host or service is in a period of scheduleddowntime. It it is in a scheduled downtime, no one gets notified. If it isn’t in a period of downtime, it gets passed on tothe next filter. As a side note, notifications for services are suppressed if the host they’re associated with is in a periodof scheduled downtime.
The second filter for host or service notification is a check to see if the host or service is flapping (if you enabled flapdetection). If the service or host is currently flapping, no one gets notified. Otherwise it gets passed to the next filter.
The third host or service filter that must be passed is the host- or service-specific notification options. Each servicedefinition contains options that determine whether or not notifications can be sent out for warning states, critical states,and recoveries. Similarly, each host definition contains options that determine whether or not notifications can be sentout when the host goes down, becomes unreachable, or recovers. If the host or service notification does not pass theseoptions, no one gets notified. If it does pass these options, the notification gets passed to the next filter...
Notifications about host or service recoveries are only sent out if a notification was sent out for the original problem.It doesn’t make sense to get a recovery notification for something you never knew was a problem.
The fourth host or service filter that must be passed is the time period test. Each host and service definition has a“notification_period” option that specifies which time period contains valid notification times for the host or service.If the time that the notification is being made does not fall within a valid time range in the specified time period, noone gets contacted. If it falls within a valid time range, the notification gets passed to the next filter...
If the time period filter is not passed, Shinken will reschedule the next notification for the host or service (if its ina non-OK state) for the next valid time present in the time period. This helps ensure that contacts are notified ofproblems as soon as possible when the next valid time in time period arrives.
The last set of host or service filters is conditional upon two things: (1) a notification was already sent out about aproblem with the host or service at some point in the past and (2) the host or service has remained in the same non-OKstate that it was when the last notification went out. If these two criteria are met, then Shinken will check and makesure the time that has passed since the last notification went out either meets or exceeds the value specified by the“notification_interval” option in the host or service definition. If not enough time has passed since the last notification,no one gets contacted. If either enough time has passed since the last notification or the two criteria for this filter werenot met, the notification will be sent out! Whether or not it actually is sent to individual contacts is up to another setof filters...
5.12.7 Contact Filters:
At this point the notification has passed the program mode filter and all host or service filters and Shinken starts tonotify all the people it should. Does this mean that each contact is going to receive the notification? No! Each contacthas their own set of filters that the notification must pass before they receive it.
Contact filters are specific to each contact and do not affect whether or not other contacts receive notifications.
The first filter that must be passed for each contact are the notification options. Each contact definition contains optionsthat determine whether or not service notifications can be sent out for warning states, critical states, and recoveries.Each contact definition also contains options that determine whether or not host notifications can be sent out when thehost goes down, becomes unreachable, or recovers. If the host or service notification does not pass these options, thecontact will not be notified. If it does pass these options, the notification gets passed to the next filter...
Notifications about host or service recoveries are only sent out if a notification was sent out for the original problem.It doesn’t make sense to get a recovery notification for something you never knew was a problem...
The last filter that must be passed for each contact is the time period test. Each contact definition has a “notifica-tion_period” option that specifies which time period contains valid notification times for the contact. If the time thatthe notification is being made does not fall within a valid time range in the specified time period, the contact will notbe notified. If it falls within a valid time range, the contact gets notified!
5.12. Notifications 97

Shinken Documentation, Release 2.4
5.12.8 Notification Methods
You can have Shinken notify you of problems and recoveries pretty much anyway you want: pager, cellphone, email,instant message, audio alert, electric shocker, etc. How notifications are sent depends on the notification commandsthat are defined in your object definition files.
If you install Shinken according to the quickstart guide, it should be configured to send email notifications.You can see the email notification commands that are used by viewing the contents of the following file:“/etc/shinken/objects/commands.cfg”.
Specific notification methods (paging, etc.) are not directly incorporated into the Shinken code as it just doesn’t makemuch sense. The “core” of Shinken is not designed to be an all-in-one application. If service checks were embedded inShinken’s core it would be very difficult for users to add new check methods, modify existing checks, etc. Notificationswork in a similar manner. There are a thousand different ways to do notifications and there are already a lot of packagesout there that handle the dirty work, so why re-invent the wheel and limit yourself to a bike tire? Its much easier tolet an external entity (i.e. a simple script or a full-blown messaging system) do the messy stuff. Some messagingpackages that can handle notifications for pagers and cellphones are listed below in the resource section.
5.12.9 Notification Type Macro
When crafting your notification commands, you need to take into account what type of notification is occurring. The$NOTIFICATIONTYPE$ macro contains a string that identifies exactly that. The table below lists the possible valuesfor the macro and their respective descriptions:
Value DescriptionPROBLEM A service or host has just entered (or is still in) a problem state. If this is a service notification,
it means the service is either in a WARNING, UNKNOWN or CRITICAL state. If this is ahost notification, it means the host is in a DOWN or UNREACHABLE state.
RECOVERY A service or host recovery has occurred. If this is a service notification, it means the servicehas just returned to an OK state. If it is a host notification, it means the host has just returned toan UP state.
ACKNOWL-EDGEMENT
This notification is an acknowledgement notification for a host or service problem.Acknowledgement notifications are initiated via the web interface by contacts for the particularhost or service.
FLAP-PINGSTART
The host or service has just started flapping.
FLAP-PINGSTOP
The host or service has just stopped flapping.
FLAP-PINGDIS-ABLED
The host or service has just stopped flapping because flap detection was disabled..
DOWNTIMES-TART
The host or service has just entered a period of scheduled downtime. Future notifications willbe suppressed.
DOWN-TIMESTOP
The host or service has just exited from a period of scheduled downtime. Notifications aboutproblems can now resume.
DOWNTIME-CANCELLED
The period of scheduled downtime for the host or service was just cancelled. Notificationsabout problems can now resume.
5.12.10 Detailled Notification Macros
Shinken introduces optional hosts and services macros that adds informations about which impacts have an object andwhat to do. That can be usefull when users that are notified, works for many customers and don’t know very wellevery services. So that help users without knowledge to take a decision about it.
98 Chapter 5. The Basics

Shinken Documentation, Release 2.4
There are 3 objects macros to add on host or service object definition :
• _DETAILLEDESC : provides detailled informations about monitored object.
• _IMPACT : describes impacts that will have on infrastructure and help to specify severity.
• _FIXACTIONS : How resolved the problem. Only available on service type objects.
define service{service_description Oracle-$KEY$-tnspinguse oracle-serviceregister 0host_name oraclecheck_command check_oracle_tnsping!$KEY$duplicate_foreach _databasesbusiness_impact 5aggregation /oracle/$KEY$/connectivity
_DETAILLEDESC Ping Oracle Listener_IMPACT Critical: Can't network connect to database_FIXACTIONS Start listener !
}
define host{host_name hostAuse generic_host
_DETAILLEDESC This is control all the IT !!!_IMPACT Critical: Nothing can work without it !
}
Then all you got to do is to change notificationways of your contact to get detailled email notification, example :
define contact{contact_name hotlineuse generic-contactemail [email protected]_submit_commands 1notificationways detailled-email
}
5.12.11 Helpful Resources
There are many ways you could configure Shinken to send notifications out. Its up to you to decide which method(s)you want to use. Once you do that you’ll have to install any necessary software and configure notification commandsin your config files before you can use them. Here are just a few possible notification methods:
• Pager
• Phone (SMS)
• WinPopup message
• Yahoo, ICQ, or MSN instant message
• Audio alerts
• etc...
5.12. Notifications 99

Shinken Documentation, Release 2.4
Basically anything you can do from a command line can be tailored for use as a notification command.
If you’re looking for an alternative to using email for sending messages to your pager or cellphone, check out thesepackages. They could be used in conjunction with Shinken to send out a notification via a modem when a problemarises. That way you don’t have to rely on email to send notifications out (remember, email may not work if there arenetwork problems). I haven’t actually tried these packages myself, but others have reported success using them...
• Gnokii (SMS software for contacting Nokia phones via GSM network)
• QuickPage (alphanumeric pager software)
• Sendpage (paging software)
If you want to try out a non-traditional method of notification, you might want to mess around with audio alerts. If youwant to have audio alerts played on the monitoring server (with synthesized speech), check out Festival. If you’d ratherleave the monitoring box alone and have audio alerts played on another box, check out the Network Audio System(NAS) and rplay projects.
5.13 Active data acquisition modules
5.13.1 Overview
An integrated acquisition module is an optional piece of software that is launched by a Shinken daemon. The moduleis responsible for doing data acquisition using a specific protocol in a very high performance method. This is preferredover repeatedly calling plugin scripts.
100 Chapter 5. The Basics
Shinken Documentation, Release 2.4
5.13.2 SNMP data acquisition module
Shinken provides an integrated SNMP data acquisition module: SnmpBooster
• What is the SnmpBooster module
• Install and configure the SNMP acquisition module.
• Reference - SnmpBooster troubleshooting
• Reference - SnmpBooster Design specification
• Reference - SnmpBooster configuration dictionnary
5.13.3 NRPE data acquisition module
Shinken provides an integrated NRPE data acquisition module. NRPE is a protocol used to communicate with agentsinstalled on remote hosts. It is implemented in the poller daemon to transparently execute NRPE data acquisition.It reads the check command and opens the connection itself. This provides a big performance boost for launchingcheck_nrpe based checks.
The command definitions are identical to the check_nrpe calls.
• Install and configure the NRPE acquisition module.
5.13.4 Notes on community Packs
Community provided monitoring packs may use the integrated acquisition modules.
Community provided plugins are complimentary to the integrated acquisition modules.
5.14 Setup Network and logical dependencies in Shinken
5.14.1 Network dependencies
What are network dependencies ?
If you’ve ever worked in tech support, you’ve undoubtedly had users tell you “the Internet is down”. As a techie,you’re pretty sure that no one pulled the power cord from the Internet. Something must be going wrong somewherebetween the user’s chair and the Internet.
Assuming its a technical problem, you begin to search for the root problem. Perhaps the user’s computer is turnedoff, maybe their network cable is unplugged, or perhaps your organization’s core router just took a dive. Whatever theproblem might be, one thing is most certain - the Internet isn’t down. It just happens to be unreachable for that user.
Shinken is able to determine whether the hosts you’re monitoring are in a DOWN or UNREACHABLE state. To dothis simply define a check_command for your host. These are very different (although related) states and can help youquickly determine the root cause of network problems. Such dependencies are also possible for applications problems,like your web app is not available because your database is down.
5.14. Setup Network and logical dependencies in Shinken 101

Shinken Documentation, Release 2.4
Example Network
Take a look at the simple network diagram below. For this example, lets assume you’re monitoring all the hosts (server,routers, switches, etc) that are pictured by defining a check_command for each host. Shinken is installed and runningon the Shinken host. If you have not defined a check_command for your host, Shinken will assume that the hostis always UP. Meaning that the logic described will NOT kick-in.
Defining Parent/Child Relationships
The network dependencies will be named “parent/child” relationship. The parent is the switch for example, and thechild will be the server.
In order for Shinken to be able to distinguish between DOWN and UNREACHABLE states for the hosts that are beingmonitored, you’ll first need to tell Shinken how those hosts are connected to each other - from the standpoint of theShinken daemon. To do this, trace the path that a data packet would take from the Shinken daemon to each individualhost. Each switch, router, and server the packet encounters or passes through is considered a “hop” and will requirethat you define a parent/child host relationship in Shinken. Here’s what the host parent/child relationships looks likefrom the viewpoint of Shinken:
102 Chapter 5. The Basics

Shinken Documentation, Release 2.4
Now that you know what the parent/child relationships look like for hosts that are being monitored, how do youconfigure Shinken to reflect them? The parents directive in your host definitions allows you to do this. Here’s what the(abbreviated) host definitions with parent/child relationships would look like for this example:
define host{host_name Shinken ; <-- The local host has no parent - it is the topmost host
}
define host{host_name Switch1parents Shinken
}
define host{host_name Webparents Switch1
}
define host{host_name FTPparents Switch1
5.14. Setup Network and logical dependencies in Shinken 103

Shinken Documentation, Release 2.4
}
define host{host_name Router1parents Switch1
}
define host{host_name Switch2parents Router1
}
define host{host_name Wkstn1parents Switch2
}
define host{host_name HPLJ2605parents Switch2
}
define host{host_name Router2parents Router1
}
define host{host_name somewebsite.comparents Router2
}
So basically: in your “child”, you declare who is your parent(s).
Reachability Logic in Action
Now that you’re configured Shinken with the proper parent/child relationships for your hosts, let’s see what happenwhen problems arise. Assume that two hosts - Web and Router1 - go offline...
104 Chapter 5. The Basics
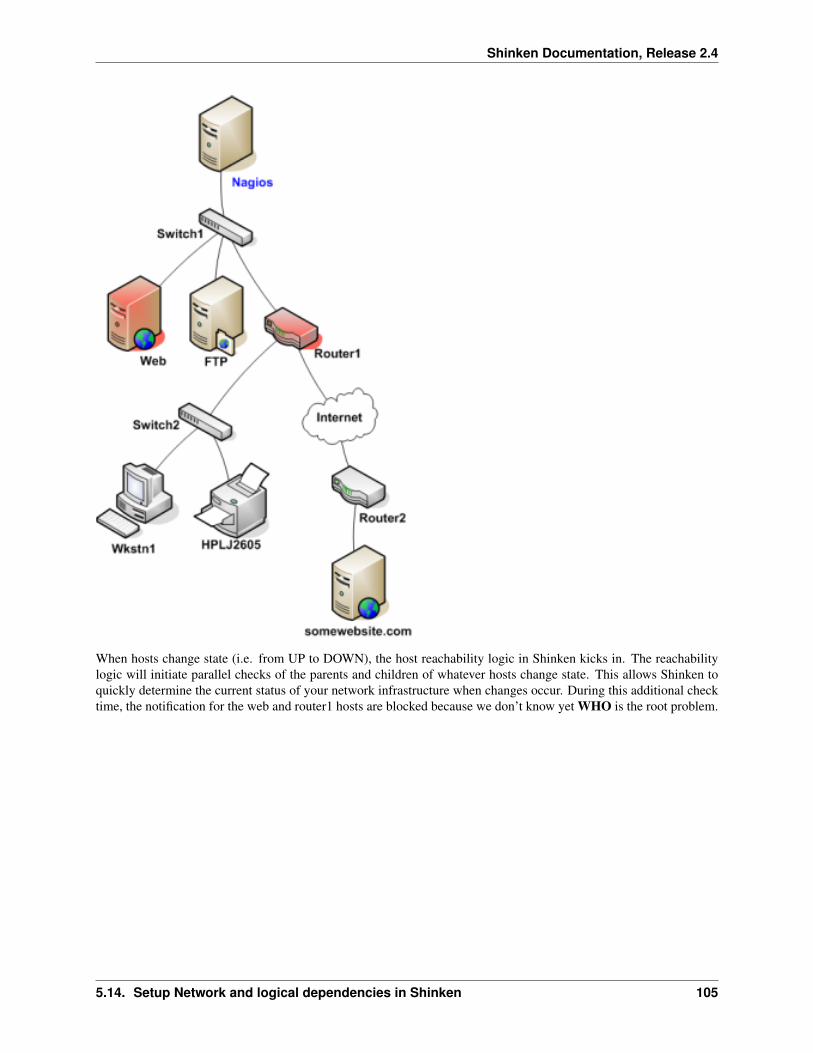
Shinken Documentation, Release 2.4
When hosts change state (i.e. from UP to DOWN), the host reachability logic in Shinken kicks in. The reachabilitylogic will initiate parallel checks of the parents and children of whatever hosts change state. This allows Shinken toquickly determine the current status of your network infrastructure when changes occur. During this additional checktime, the notification for the web and router1 hosts are blocked because we don’t know yet WHO is the root problem.
5.14. Setup Network and logical dependencies in Shinken 105

Shinken Documentation, Release 2.4
In this example, Shinken will determine that Web and Router1 are both in DOWN states because the “path” to thosehosts is not being blocked (switch1 is still alive), and so it will allow web and router1 notifications to be sent.
Shinken will determine that all the hosts “beneath” Router1 are all in an UNREACHABLE state because Shinkencan’t reach them. Router1 is DOWN and is blocking the path to those other hosts. Those hosts might be runningfine, or they might be offline - Shinken doesn’t know because it can’t reach them. Hence Shinken considers them tobe UNREACHABLE instead of DOWN, and won’t send notifications about them. Such hosts and services beneathrouter1 are the impacts of the root problem “router1”
What about more than one parent for a host?
You see that there is a ‘s’ in parents. Because you can define as many parent as you want for a host (like if you gotan active/passive switch setup). The host will be UNREACHABLE only, and only if all it’s parents are down orunreachable. If one is still alive, it will be down. See this as a big OR rule.
106 Chapter 5. The Basics

Shinken Documentation, Release 2.4
UNREACHABLE States and Notifications
One important point to remember is Shinken only notifies about root problems. If we allow it to notify for rootproblems AND impacts you will receive too many notifications to quickly find and solve the root problems. That’swhy Shinken will notify contacts about DOWN hosts, but not for UNREACHABLE ones.
What about notification about services of a down or unreachable hosts?
You will not be notified about all critical or warning errors on a down or unreachable host, because such service statesare the impacts of the host root problem. You don’t have to configure anything, Shinken will suppress these uselessnotifications automatically. The official documentation provides more information on how notifications work.
5.14.2 Logical dependencies
Network is not the only element that can have problems. Applications can too.
Service and host dependencies are an advanced feature of Shinken that allows you to control the behavior of hosts andservices based on the status of one or more other hosts or services. This section explains how dependencies work,along with the differences between host and service dependencies.
Let’s starts with service dependencies. We can take the sample of a Web application service that will depend upon adatabase service. If the database is failed, it’s useless to notify about the web application one, because you alreadyknow it’s failed. So Shinken will notify you about your root problem, the database failed, and not about all itsimpacts, here your web application.
With only useful notifications, you will be able to find and fix them quickly and not take one hour to find the rootproblem in your mails.
Service Dependencies Overview
There are a few things you should know about service dependencies:
• A service can be dependent on one or more other services
• A service can be dependent on services which are not associated with the same host
• Advanced service dependencies can be used to cause service check execution and service notifications to besuppressed under different circumstances (OK, WARNING, UNKNOWN, and/or CRITICAL states)
• Advanced service dependencies might only be valid during specific timeperiods
Defining simple advanced dependencies
Define a service dependency is quite easy in fact. All you need is to define in your Web application service that it isdependent upon the database service.
define service{host_name srv-webservice_description Httpservice_dependencies srv-db,mysql
}
So here the web service Http on the host srv-web will depend upon the database service mysql on the host srv-db. Ifthe mysql service has failed, there will be no notifications for service srv-web. If Shinken gets an error state check onthe Http service, it will raised a mysql check and suppress the http notification until it knows if the Http service is aroot problem or an impact.
5.14. Setup Network and logical dependencies in Shinken 107
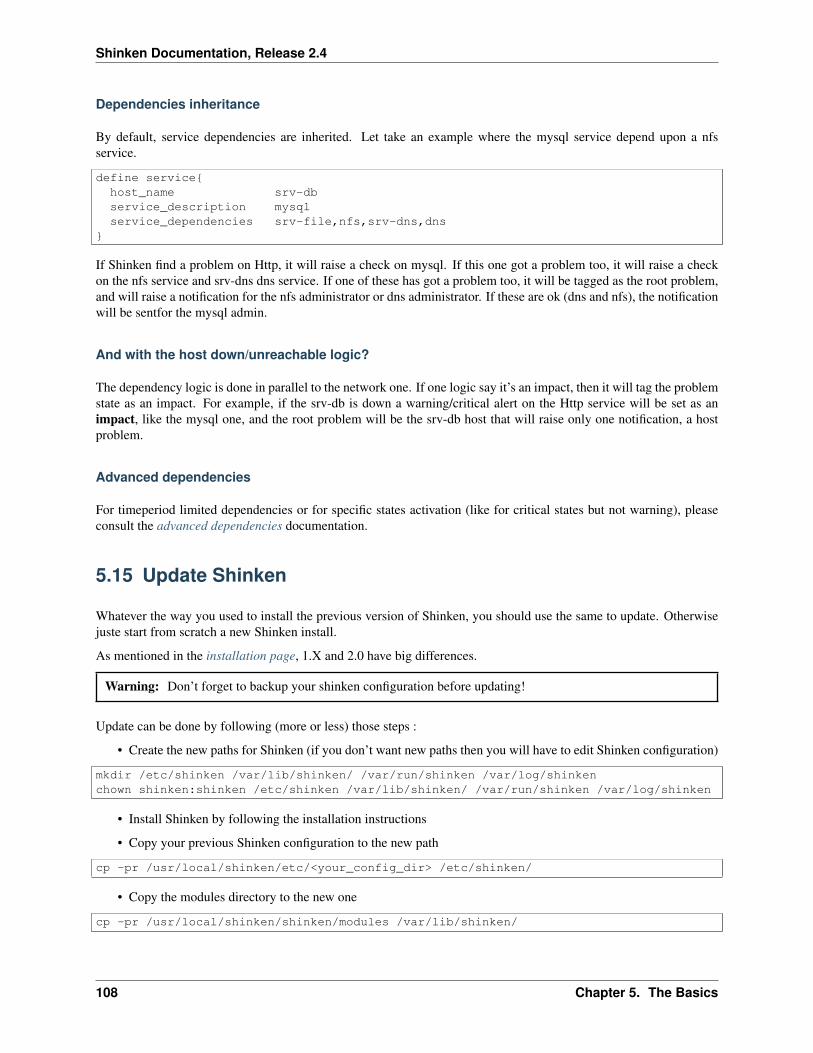
Shinken Documentation, Release 2.4
Dependencies inheritance
By default, service dependencies are inherited. Let take an example where the mysql service depend upon a nfsservice.
define service{host_name srv-dbservice_description mysqlservice_dependencies srv-file,nfs,srv-dns,dns
}
If Shinken find a problem on Http, it will raise a check on mysql. If this one got a problem too, it will raise a checkon the nfs service and srv-dns dns service. If one of these has got a problem too, it will be tagged as the root problem,and will raise a notification for the nfs administrator or dns administrator. If these are ok (dns and nfs), the notificationwill be sentfor the mysql admin.
And with the host down/unreachable logic?
The dependency logic is done in parallel to the network one. If one logic say it’s an impact, then it will tag the problemstate as an impact. For example, if the srv-db is down a warning/critical alert on the Http service will be set as animpact, like the mysql one, and the root problem will be the srv-db host that will raise only one notification, a hostproblem.
Advanced dependencies
For timeperiod limited dependencies or for specific states activation (like for critical states but not warning), pleaseconsult the advanced dependencies documentation.
5.15 Update Shinken
Whatever the way you used to install the previous version of Shinken, you should use the same to update. Otherwisejuste start from scratch a new Shinken install.
As mentioned in the installation page, 1.X and 2.0 have big differences.
Warning: Don’t forget to backup your shinken configuration before updating!
Update can be done by following (more or less) those steps :
• Create the new paths for Shinken (if you don’t want new paths then you will have to edit Shinken configuration)
mkdir /etc/shinken /var/lib/shinken/ /var/run/shinken /var/log/shinkenchown shinken:shinken /etc/shinken /var/lib/shinken/ /var/run/shinken /var/log/shinken
• Install Shinken by following the installation instructions
• Copy your previous Shinken configuration to the new path
cp -pr /usr/local/shinken/etc/<your_config_dir> /etc/shinken/
• Copy the modules directory to the new one
cp -pr /usr/local/shinken/shinken/modules /var/lib/shinken/
108 Chapter 5. The Basics

Shinken Documentation, Release 2.4
• Edit the Shinken configuration to match you need. Basically you will need to remove the default shinkenconfiguration of daemons and put the previous one. Shinken-specific is now split into several files. Be carfulwith the ini ones, you may merge them if you modified them. Careful to put the right cfg_dir statement in theshinken.cfg.
Important: Modules directories have changed a lot in Shinken 2.0. If you copy paste the previous one it will workBUT you may have trouble if you use Shinken CLI.
5.15. Update Shinken 109

Shinken Documentation, Release 2.4
110 Chapter 5. The Basics

CHAPTER 6
Medium
111

Shinken Documentation, Release 2.4
6.1 Business rules
6.1.1 View your infrastructure from a business perspective
The main role of this feature is to allow users to have in one “indicator” the aggregation of other states. This indicatorcan provide a unique view for users focused on different roles.
Typical roles:
• Service delivery Management
• Business Management
• Engineering
• IT support
Let’s take a simple example of a service delivery role for an ERP application. It mainly consists of the following ITcomponents:
• 2 databases, in high availability, so with one database active, the service is considered up
• 2 web servers, in load sharing, so with one web server active, the service is considered up
• 2 load balancers, again in high availability
These IT components (Hosts in this example) will be the basis for the ERP service.
With business rules, you can have an “indicator” representing the “aggregated service” state for the ERP service!Shinken already checks all of the IT components one by one including processing for root cause analysis from a hostand service perspective.
6.1.2 How to define Business Rules?
It’s a simple service (or a host) with a “special” check_command named bp_rule. :)
This makes it compatible with all your current habits and UIs. As the service aggregation is considered as any otherstate from a host or service, you can get notifications, actions and escalations. This means you can have contacts thatwill receive only the relevant notifications based on their role.
Warning: You do not have to define “bp_rule” command, it’s purely internal. You should NOT define it in youcheckcommands.cfg file, or the configuration will be invalid due to duplicate commands!
Here is a configuration for the ERP service example, attached to a dummy host named “servicedelivery”.
define service{use standard-servicehost_name servicedeliveryservice_description ERPcheck_command bp_rule!(h1,database1 | h2,database2) & (h3,Http1 | h4,Http4) & (h5,IPVS1 | h6,IPVS2)
}
That’s all!
Note: A complete service delivery view should include an aggregated view of the end user availability perspectivestates, end user performance perspective states, IT component states, application error states, application performancestates. This aggregated state can then be used as a metric for Service Management (basis for defining an SLA).
112 Chapter 6. Medium

Shinken Documentation, Release 2.4
6.1.3 With “need at least X elements” clusters
In some cases, you know that in a cluster of N elements, you need at least X of them to run OK. This is easily defined,you just need to use the “X of:” operator.
Here is an example of the same ERP but with 3 http web servers, and you need at least 2 of them (to handle the load):
define service{use standard-servicehost_name servicedeliveryservice_description ERPcheck_command bp_rule!(h1,database1 | h2,database2) & (2 of: h3,Http1 & h4,Http4 & h5,Http5) & (h6,IPVS1 | h7,IPVS2)
}
It’s done :)
Possible values of X in X of: expressions
The X of: expression may be configured different values depending on the needs. The supported expressions aredescribed below:
• A positive integer, which means “at least X host/servicices should be up“
• A positive percentage, which means “at least X percents of hosts/services should be up”. This percentageexpression may be combined with Groupping expression expansion to build expressions such as “95 percentsof the web front ends shoud be up”. This way, adding hosts in the web frontend hostgroup is sufficient, and theQoS remains the same.
• A negative integer, which means “at most X host/servicices may be down“
• A negative percentage, which means “at most X percents of hosts/services should may be down”. This percent-age expression may be combined with Groupping expression expansion to build expressions such as “5 percentsof the web front ends may be down”. This way, adding hosts in the web frontend hostgroup is sufficient, and theQoS remains the same.
Example:
define service{use standard-servicehost_name servicedeliveryservice_description ERPcheck_command bp_rule!(h1,database1 | h2,database2) & (h6,IPVS1 | h7,IPVS2) & 95% of: g:frontend,Http
}
6.1.4 The NOT rule
You can define a not state rule. It can be useful for active/passive setups for example. You just need to add a ! beforeyour element name.
Example:
define service{use generic-servicehost_name servicedeliveryservice_description Cluster_statecheck_command bp_rule!(h1,database1 & !h2,database2)
}
Aggregated state will be ok if database1 is ok and database2 is warning or critical (stopped).
6.1. Business rules 113
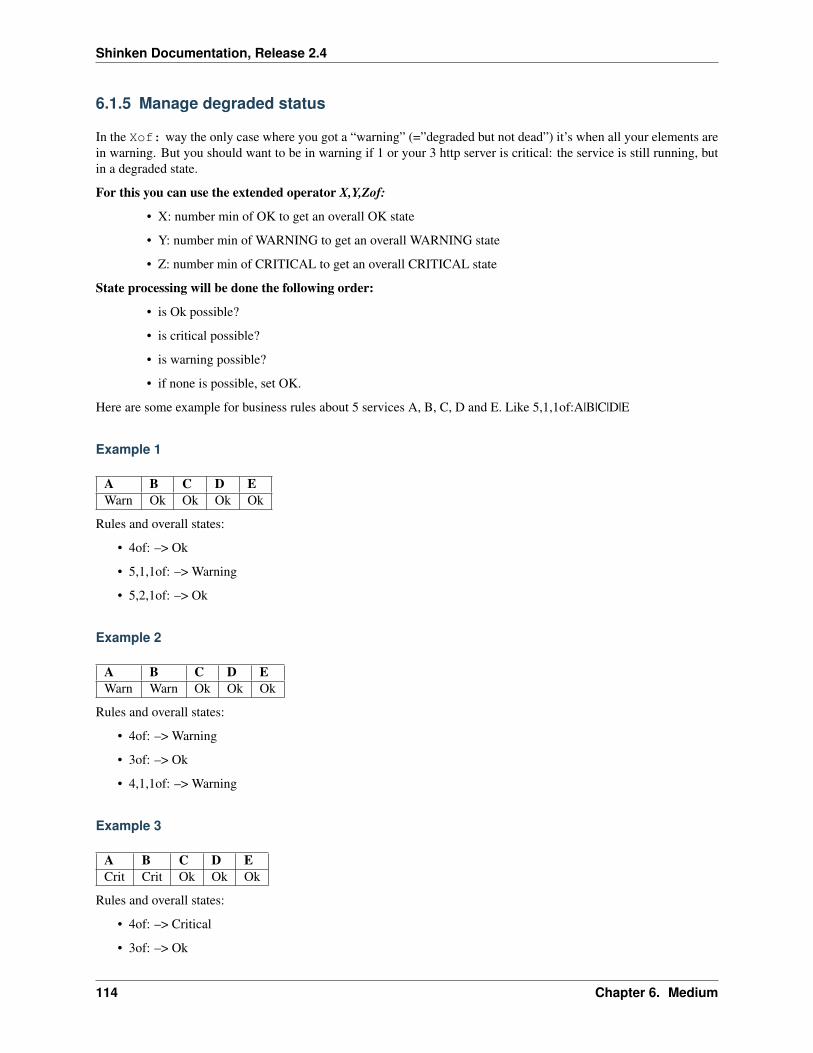
Shinken Documentation, Release 2.4
6.1.5 Manage degraded status
In the Xof: way the only case where you got a “warning” (=”degraded but not dead”) it’s when all your elements arein warning. But you should want to be in warning if 1 or your 3 http server is critical: the service is still running, butin a degraded state.
For this you can use the extended operator X,Y,Zof:
• X: number min of OK to get an overall OK state
• Y: number min of WARNING to get an overall WARNING state
• Z: number min of CRITICAL to get an overall CRITICAL state
State processing will be done the following order:
• is Ok possible?
• is critical possible?
• is warning possible?
• if none is possible, set OK.
Here are some example for business rules about 5 services A, B, C, D and E. Like 5,1,1of:A|B|C|D|E
Example 1
A B C D EWarn Ok Ok Ok Ok
Rules and overall states:
• 4of: –> Ok
• 5,1,1of: –> Warning
• 5,2,1of: –> Ok
Example 2
A B C D EWarn Warn Ok Ok Ok
Rules and overall states:
• 4of: –> Warning
• 3of: –> Ok
• 4,1,1of: –> Warning
Example 3
A B C D ECrit Crit Ok Ok Ok
Rules and overall states:
• 4of: –> Critical
• 3of: –> Ok
114 Chapter 6. Medium

Shinken Documentation, Release 2.4
• 4,1,1of: –> Critical
Example 4
A B C D EWarn Crit Ok Ok Ok
Rules and overall states:
• 4of: –> Critical
• 4,1,1of: –> Critical
Example 5
A B C D EWarn Warn Crit Ok Ok
Rules and overall states:
• 2of: –> Ok
• 4,1,1of: –> Critical
Example 6
A B C D EWarn Crit Crit Ok Ok
Rules and overall states:
• 2of: –> Ok
• 2,4,4of: –> Ok
• 4,1,1of: –> Critical
• 4,1,2of: –> Critical
• 4,1,3of: –> Warning
Classic cases
Let’s look at some classic setups, for MAX elements.
• ON/OFF setup: MAXof: <=> MAX,MAX,MAXof:
• Warning as soon as problem, and critical if all criticals: MAX,1,MAXof:
• Worse state: MAX,1,1
6.1.6 Grouping expression expansion
Sometimes, you do not want to specify explicitly the hosts/services contained in a business rule, but prefer use agrouping expression such as hosts from the hostgroup xxx, services holding lablel yyy or hosts which name matchesregex zzz.
6.1. Business rules 115

Shinken Documentation, Release 2.4
To do so, it is possible to use a grouping expression which is expanded into hosts or services. The supported expressionsuse the following syntax:
flag:expression
The flag is a single character qualifying the expansion type. The supported types (and associated flags) are describedin the table below.
Host flags
F Expansion Example Equivalent tog Content of the hostgroup g:webs web-srv1 & web-srv2 & ...l Hosts which are holding label l:front web-srv1 & db-srv1 & ...r Hosts which name matches regex r:^web web-srv1 & web-srv2 & ...t Hosts which are holding tag t:http web-srv1 & web-srv2 & ...
Service flags
F Expansion Example Equivalent tog Content of the servicegroup g:web web-srv1,HTTP & web-srv2,HTTP & ...l Services which are holding label l:front web-srv1,HTTP & db-srv1,MySQL & ...r Services which description matches regex r:^HTTPS? web-srv1,HTTP & db-srv2,HTTPS & ...t Services which are holding tag t:http web-srv1,HTTP & db-srv2,HTTPS & ...
• Labels are arbitrary names which may be set on any host or service using the label directive.
• Tags are the template names inherited by hosts or services, generally coming from packs.
It is possible to combine both host and service expansion expression to build complex business rules.
Note: A business rule expression always has to be made of a host expression (selector if you prefer) AND a ser-vice expression (still selector) separated by a coma when looking at service status. If not so, there is no meanto distinguish a host status from a service status in the expression. In servicegroup flag case, as you do not wantto apply any filter on the host (you want ALL services which are member of the XXX service group, whicheverhost they are bound to), you may use the * host selector expression. The correct expression syntax should be:bp_rule!*,g:my-servicegroup The same rule applies to other service selectors (l, r, t, and so on).
Examples of combined expansion expression
You want to build a business rule including all web servers composing the application frontend.
l:front,r:HTTPS?
which is equivalent to:
web-srv1,HTTP & web-srv3,HTTPS
You may obviously combine expression expansion with standard expressions.
l:front,h:HTTPS? & db-srv1,MySQL
which is equivalent to:
(web-srv1,HTTP & web-srv3,HTTPS) & db-srv1,MySQL
116 Chapter 6. Medium

Shinken Documentation, Release 2.4
6.1.7 Smart notifications
As of any host or service check, a business rule having its state in a non OK state may send notifications depending onits notification_options directive. But what if the underlying problems are known, and may be acknowledged? The default behaviour is to continue sending notifications.
This may be what you need, but what if you want the business rule to stop sending notifications ?
Imagine your business rule is composed of all your site’s web front ends. If a host fails, you want to know it, butonce someone starts to fix the issue, you don’t want to be notified anymore. A possible solution is to acknowledgethe business rule itself. But if you do so, any other failing host won’t get notified. Another solution is to enable smartnotification on the business rule check.
Smart notifications is a way to disable notifications on a business rule having all its problems acknowledged. If a newproblem occurs, notifications will be enabled back while it has not been acknowledged.
To enable smart notifications, simply set the business_rule_smart_notifications to 1.
Downtimes management
Downtimes are a bit more tricky to handle. While acknowledgement are necessarily set by humans, downtimes may beset automatically (for instance, by maintenance periods). You may still want to be notified during downtime periods.As a consequence, downtimes are not taken into account by smart notification processing, unless explicitly told to doso.
To enable downtimes in smart notifications processing, simply set the business_rule_downtime_as_ack to1.
6.1.8 Consolidated services
Another useful usage of business rules is consolidated services. Imagine you have a large web cluster, composed ofhundreds of nodes. If a small portion of the nodes fail, you may receive a large number of notifications, which isnot convenient. To prevent this, you may use a business rule looking like bp_rule!g:web,.... If you disablenotifications by setting notification_options to n on the underlying hosts or services, you would receive asingle notification with all the failing nodes in one time, which may be clearer.
To avoid having to manually set notification_options on each node, you may use two convenient directiveson the business rule side: business_rule_host_notification_options which enforces notification op-tions of underlying hosts, and business_rule_service_notification_options which does the same forservices.
This feature, combined with the convenience of packs and Smart notifications allows to build large consolidatedservices very easily.
Example:
define host {use httphost_name web-01hostgroups web...}
define host {use httphost_name web-02hostgroups web
6.1. Business rules 117

Shinken Documentation, Release 2.4
...}
define host {host_name meta...}
define service {host_name metaservice_description Web clustercheck_command bp_rule!g:web,g:HTTPS?business_rule_service_notification_options n...}
In the previous example, HTTP/HTTPS services come from the http pack. If one or more http servers fail, a singlenotification would be sent, rather than one per failing service.
Warning: It would be very tempting in this situation to acknowledge the consolidated service if a notification issent. Never do so, as any, as any new failure would not be reported. You still have to acknowledge each independentfailure. Take care to explain this to people in charge of the operations.
6.1.9 Macro expansion
It is possible in a business rule expression to include macros, as you would do for normal check command defini-tion. You may for instance define a custom macro on the host or service holding the business rule, and use it in theexpression.
Combined with macro modulation, this allows to define consolidated services with variable fault tolerance thresholdsdepending on the timeperiod.
Imagine your web frontend cluster composed of dozens servers serving the web site. If one is failing, this would notimpact the service so much. During the day, when the complete team is at work, a single failure should be notified andfixed immediately. But during the night, you may consider that losing let’s say up to 5% of the cluster has no impacton the QoS: thus waking up the on-call guy is not useful.
You may handle that with a consolidated service using macro modulation combined with an Xof: expression.
Example:
define macromodulation{macromodulation_name web-xofmodulation_period night_XOF_WEB -5% of:}
define host {use httphost_name web-01hostgroups web...}
define host {use httphost_name web-02
118 Chapter 6. Medium

Shinken Documentation, Release 2.4
hostgroups web...}
define host {host_name metamacromodulations web-xof...}
define service {host_name metaservice_description Web clustercheck_command bp_rule!$_HOSTXOF_WEB$ g:web,g:HTTPS?business_rule_service_notification_options n...}
In the previous example, during the day, we’re outside the modulation period. The _XOF_WEB is not defined, so theresulting business rule is g:web,g:HTTPS?. During the night, the macro is set a value, then the resulting businessrule is -5% of: g:web,g:HTTPS?, allowing to lose 5% of the cluster silently.
6.1.10 Business rule check output
By default, business rules checks have no output as there’s no real script or binary behind. But it is still possible tocontrol their output using a templating system.
To do so, you may set the business_rule_output_template option on the host or service holding the businessrule. This attribute may contain any macro. Macro expansion works as follows:
• All macros outside the $( and )$ sequences are expanded using attributes set on the host or service holdingthe business rule.
• All macros between the $( and )$ sequences are expanded for each underlying problem using its attributes.
All macros defined on hosts or services composing or holding the business rule may be used in the outer or inner partof the template respectively.
To ease writing output template for business rules made of both hosts and services, 3 convinience macros hav-ing the same meaning for each type may be used: STATUS, SHORTSTATUS, and FULLNAME, which expand re-spectively to the host or service status, its status abreviated form and its full name (host_name for hosts, orhost_name/service_description for services).
Example:
Imagine you want to build a consolidated service which notifications contain links to the underlying problems in theWebUI, allowing to acknowledge them without having to search. You may use a template looking like:
define service {host_name metaservice_description Web clustercheck_command bp_rule!$_HOSTXOF_WEB$ g:web,g:HTTPS?business_rule_output_template Down web services: $(<a href='http://webui.url/service/$HOSTNAME$/$SERVICEDESC$'>($SHORTSTATUS$) $HOSTNAME$</a> )$...}
The resulting output would look like Down web services: link1 link2 link3 ... where linkN areurls leading to the problem in the WebUI.
6.1. Business rules 119

Shinken Documentation, Release 2.4
6.2 Monitoring a DMZ
There is two ways for monitoring a DMZ network:
• got a poller on the LAN, and launch check from it, so the firewall should allow monitoring traffic (likenrpe, snmp, etc)
• got a poller on the DMZ, so only the Shinken communications should be open through the firewall
If you can take the first, use it :)
If you can’t because your security manager is not happy about it, you should put a poller in the DMZ. So look at thepage distributed shinken first, because you will need a distributed architecture.
Pollers a “dumb” things. They look for jobs to all scheduler (of their realm, if you don’t know what is it from now,it’s not important). So if you just put a poller in the DMZ network aside another in the LAN, some checks for the dmzwill be take by the LAN one, and some for the lan will be take by the DMZ one. It’s not a good thing of course :)
6.2.1 Tag your hosts and pollers for being “in the DMZ”
So we will need to “tag” checks, so they will be able to run only in the dmz poller, or the lan one.
This tag is done with the poller_tag parameter. It can be applied on the following objects:
• pollers
• commands
• services
• hosts
It’s quite simple: you ‘tag’ objects, and the pollers have got tags too. You’ve got an implicit inheritance in this order:hosts->services->commands. If a command doesn’t have a poller_tag, it will take the one from the service. And if thisservice doesn’t have one neither, it will take the tag from its host.
You just need to install a poller with the ‘DMZ’ tag in the DMZ and then add it to all hosts (or services) in the DMZ.They will be taken by this poller and you just need to open the port to this poller fom the LAN. Your network adminswill be happier :)
6.2.2 Configuration part
So you need to declare in the /etc/pollers/poller-master.cfg (or c:shinkenetcpollerspoller-master.cfg):
define poller{
poller_name poller-DMZaddress server-dmzport 7771poller_tags DMZ
}
And “tag” some hosts and/or some services.
define host{
host_name server-DMZ-1[...]poller_tag DMZ
120 Chapter 6. Medium
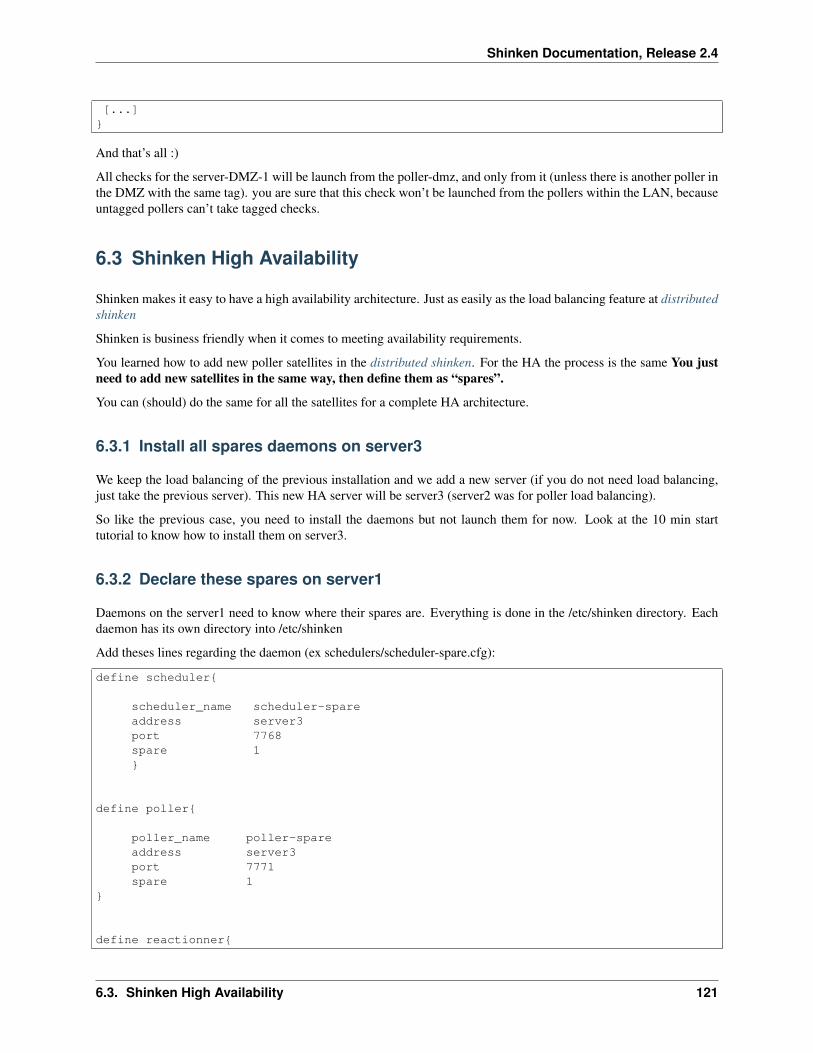
Shinken Documentation, Release 2.4
[...]}
And that’s all :)
All checks for the server-DMZ-1 will be launch from the poller-dmz, and only from it (unless there is another poller inthe DMZ with the same tag). you are sure that this check won’t be launched from the pollers within the LAN, becauseuntagged pollers can’t take tagged checks.
6.3 Shinken High Availability
Shinken makes it easy to have a high availability architecture. Just as easily as the load balancing feature at distributedshinken
Shinken is business friendly when it comes to meeting availability requirements.
You learned how to add new poller satellites in the distributed shinken. For the HA the process is the same You justneed to add new satellites in the same way, then define them as “spares”.
You can (should) do the same for all the satellites for a complete HA architecture.
6.3.1 Install all spares daemons on server3
We keep the load balancing of the previous installation and we add a new server (if you do not need load balancing,just take the previous server). This new HA server will be server3 (server2 was for poller load balancing).
So like the previous case, you need to install the daemons but not launch them for now. Look at the 10 min starttutorial to know how to install them on server3.
6.3.2 Declare these spares on server1
Daemons on the server1 need to know where their spares are. Everything is done in the /etc/shinken directory. Eachdaemon has its own directory into /etc/shinken
Add theses lines regarding the daemon (ex schedulers/scheduler-spare.cfg):
define scheduler{
scheduler_name scheduler-spareaddress server3port 7768spare 1}
define poller{
poller_name poller-spareaddress server3port 7771spare 1
}
define reactionner{
6.3. Shinken High Availability 121
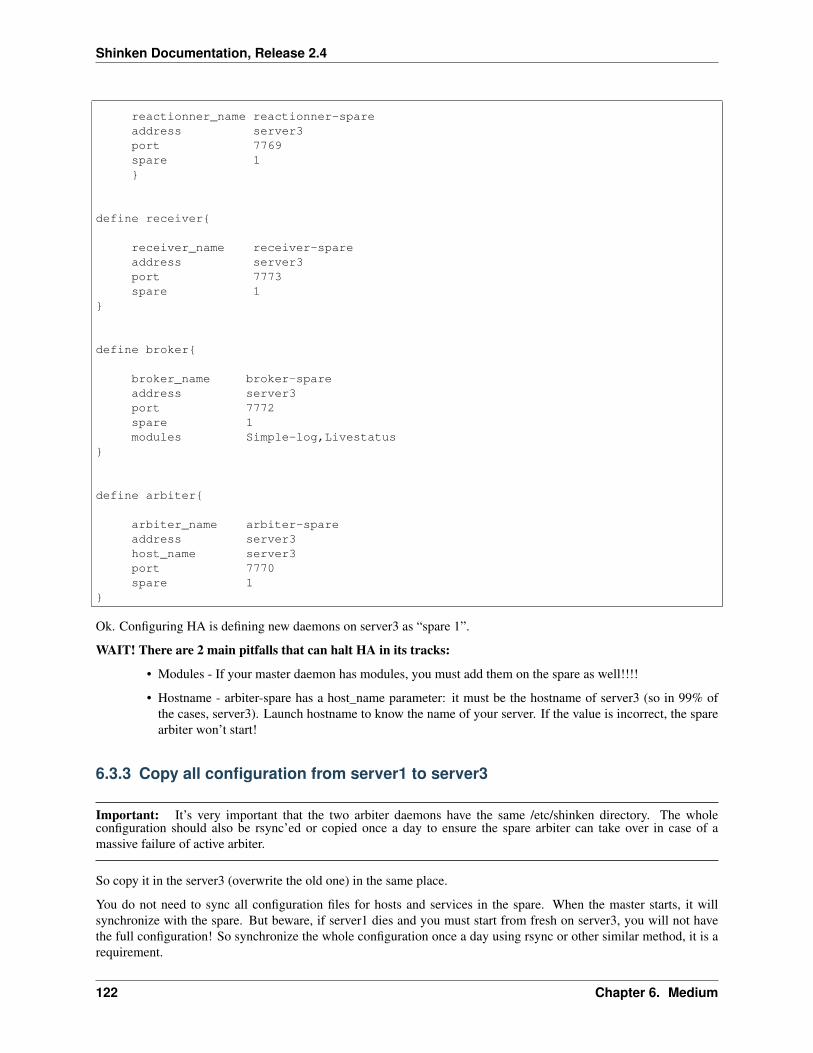
Shinken Documentation, Release 2.4
reactionner_name reactionner-spareaddress server3port 7769spare 1}
define receiver{
receiver_name receiver-spareaddress server3port 7773spare 1
}
define broker{
broker_name broker-spareaddress server3port 7772spare 1modules Simple-log,Livestatus
}
define arbiter{
arbiter_name arbiter-spareaddress server3host_name server3port 7770spare 1
}
Ok. Configuring HA is defining new daemons on server3 as “spare 1”.
WAIT! There are 2 main pitfalls that can halt HA in its tracks:
• Modules - If your master daemon has modules, you must add them on the spare as well!!!!
• Hostname - arbiter-spare has a host_name parameter: it must be the hostname of server3 (so in 99% ofthe cases, server3). Launch hostname to know the name of your server. If the value is incorrect, the sparearbiter won’t start!
6.3.3 Copy all configuration from server1 to server3
Important: It’s very important that the two arbiter daemons have the same /etc/shinken directory. The wholeconfiguration should also be rsync’ed or copied once a day to ensure the spare arbiter can take over in case of amassive failure of active arbiter.
So copy it in the server3 (overwrite the old one) in the same place.
You do not need to sync all configuration files for hosts and services in the spare. When the master starts, it willsynchronize with the spare. But beware, if server1 dies and you must start from fresh on server3, you will not havethe full configuration! So synchronize the whole configuration once a day using rsync or other similar method, it is arequirement.
122 Chapter 6. Medium

Shinken Documentation, Release 2.4
6.3.4 Start :)
Ok, everything is ready. All you need now is to start all the daemons:
$server1: sudo /etc/init.d/shinken start$server3: sudo /etc/init.d/shinken start
If an active daemon die, the spare will take over. This is detected in a minute or 2 (you can change it in thedaemons/deamon-spare.cfg, for each daemon).
Note: For stateful fail-over of a scheduler, link one of the distributed retention modules such as memcache or redis toyour schedulers. This will avoid losing the current state of the checks handled by a failed scheduler. Without a retentionmodule, the spare scheduler taking over will need to reschedule all checks and check states will be PENDING untilthis has completed.
Note: You now have a high availability architecture.
6.4 Mixed GNU/linux AND Windows pollers
There can be as many pollers as you want. And Shinken runs under a lot of systems, like GNU/Linux and Windows.It could be useful to make windows hosts checks using windows pollers (by a server IN the domain), and all the othersby a GNU/Linux one (like all pure network based checks).
And in fact you can, and again it’s quite easy :) Its important to remember that all pollers connect to all schedulers, sowe must have a way to distinguish ‘windows’ checks from ‘gnu/linux’ ones.
The poller_tag/poller_tags parameter is useful here. It can be applied on the following objects:
• pollers
• commands
• services
• hosts
It’s quite simple: you ‘tag’ objects, and the pollers have got tags too. You’ve got an implicit inheritance betweenhosts->services->commands. If a command doesn’t have a poller_tag, it will take the one from the service. And ifthis service doesn’t have one neither, it will take the tag from its host. It’s all like the “DMZ” case, but here apply foranother purpose.
Let take an example with a ‘windows’ tag:
define command{
command_name CheckWMIcommand_line c:\shinken\libexec\check_wmi.exe -H $HOSTADRESS$ -r $ARG1$poller_tag Windows
}
define poller{
poller_name poller-windowsaddress 192.168.0.4port 7771
6.4. Mixed GNU/linux AND Windows pollers 123

Shinken Documentation, Release 2.4
poller_tags Windows}
And the magic is here: all checks launched with this command will be taken by the poller-windows (or another thathas such a tag). A poller with no tags will only take ‘untagged’ commands.
6.5 Notifications and escalations
6.5.1 Escalations
Shinken supports optional escalation of contact notifications for hosts and services. Escalation of host and servicenotifications is accomplished by defining escalations and call them from your hosts and services definitions.
Tip: Legacy Nagios host_escalations and service_escalations objects are still managed, but it’s advised to migrateand simplify your configuration with simple escalations objects.
6.5.2 Definition and sample
Notifications are escalated if and only if one or more escalation linked to your host/service matches the current notifi-cation that is being sent out. Look at the example below:
define escalation{escalation_name To_level_2first_notification_time 60last_notification_time 240notification_interval 60contact_groups level2
}
And then you can call it from a service (or a host):
define service{use webservicehost_name webserverservice_description HTTPescalations To_level_2contact_groups level1
}
Here, notifications sent before the fist_notification_time (60 = 60*interval_length*seconds = 60*60s = 1h) will be sendto the contact_groups of the service, and between one hour and 4 hours (last_notification_time) it will be escalated tothe level2 contact group.
If there is no escalations available (like after 4 hours) it fail back to the default service contact_groups, level1 here.
124 Chapter 6. Medium

Shinken Documentation, Release 2.4
6.5.3 Lower contact groups
When defining notification escalations, look if it’s interesting that were members of “lower” escalations (i.e. thosewith lower notification time ranges) should also be included in “higher” escalation definitions or not. This can be doneto ensure that anyone who gets notified of a problem continues to get notified as the problem is escalated.
In our previous example it becomes:
define escalation{escalation_name To_level_2first_notification_time 60last_notification_time 240notification_interval 60contact_groups level1,level2
}
6.5.4 Multiple escalations levels
It can be interesting to have more than one level for escalations. Like if problems are send to your level1, and after 1hour it’s send to your level2 and after 4 hours it’s send to the level3 until it’s resolved.
All you need is to define theses two escalations and link them to your host/service:
define escalation{escalation_name To_level_2first_notification_time 60last_notification_time 240notification_interval 60contact_groups level2
}
define escalation{escalation_name To_level_3first_notification_time 240last_notification_time 0notification_interval 60contact_groups level3
}
And for your service:
define service{use webservicehost_name webserverservice_description HTTPescalations To_level_2,To_level_3contact_groups level1
}
6.5.5 Overlapping Escalation Ranges
Notification escalation definitions can have notification ranges that overlap. Take the following example:
define escalation{escalation_name To_level_2first_notification_time 60last_notification_time 240
6.5. Notifications and escalations 125
Shinken Documentation, Release 2.4
notification_interval 60contact_groups level2
}
define escalation{escalation_name To_level_3first_notification_time 120last_notification_time 0notification_interval 60contact_groups level3
}
In the example above:
• The level2 is notified at one hour
• level 2 and 3 are notified at 2 hours
• Only the level 3 is notified after 4 hours
6.5.6 Recovery Notifications
Recovery notifications are slightly different than problem notifications when it comes to escalations. If the problemwas escalated, or was about to reach a new level, who notified for the recovery?
The rule is very simple: we notify about the recovery every one that was notified about the problem, and only them.
6.5.7 Short escalations and long notification Intervals
It’s also interesting to see that with escalation, if the notification interval is longer than the next escalation time, it’sthis last value that will be taken into account.
Let take an example where your service got:
define service{notification_interval 1440escalations To_level_2,To_level_3
}
Then with the escalations objects:
define escalation{escalation_name To_level2first_notification_time 60last_notification_time 120contact_groups level2
}
define escalation{escalation_name To_level_3first_notification_time 120last_notification_time 0contact_groups level3
}
Here let say you have a problem HARD on the service at t=0. It will notify the level1. The next notification should beat t=1440 minutes, so tomorrow. It’s okay for classic services (too much notification is DANGEROUS!) but not forescalated ones.
126 Chapter 6. Medium

Shinken Documentation, Release 2.4
Here, at t=60 minutes, the escalation will raise, you will notify the level2 contact group, and then at t=120 minutesyou will notify the level3, and here one a day until they solve it!
So you can put large notification_interval and still have quick escalations times, it’s not a problem :)
6.5.8 Time Period Restrictions
Under normal circumstances, escalations can be used at any time that a notification could normally be sent out for thehost or service. This “notification time window” is determined by the “notification_period” directive in the host orservice definition.
You can optionally restrict escalations so that they are only used during specific time periods by using the “esca-lation_period” directive in the host or service escalation definition. If you use the “escalation_period” directive tospecify a Time Period Definition during which the escalation can be used, the escalation will only be used duringthat time. If you do not specify any “escalation_period” directive, the escalation can be used at any time within the“notification time window” for the host or service.
Escalated notifications are still subject to the normal time restrictions imposed by the “notification_period” directivein a host or service definition, so the timeperiod you specify in an escalation definition should be a subset of that larger“notification time window”.
6.5.9 State Restrictions
If you would like to restrict the escalation definition so that it is only used when the host or service is in a particularstate, you can use the “escalation_options” directive in the host or service escalation definition. If you do not use the“escalation_options” directive, the escalation can be used when the host or service is in any state.
6.5.10 Legacy definitions: host_escalations and service_escalations based on no-tification number
The Nagios legacy escalations definitions are still managed, but it’s strongly advice to switch to escalations based ontime and call by host/services because it’s far more flexible.
Hera are example of theses legacy definitions:
define serviceescalation{host_name webserverservice_description HTTPfirst_notification 3last_notification 5notification_interval 45contact_groups nt-admins,managers
}
define hostescalation{host_name webserverfirst_notification 6last_notification 0notification_interval 60contact_groups nt-admins,managers,everyone
}
It’s based on notification number to know if the escalation should be raised or not. Remember that with this form youcannot mix long notification_interval and short escalations time!
6.5. Notifications and escalations 127

Shinken Documentation, Release 2.4
6.6 The Notification Ways, AKA mail 24x7, SMS only the night for asame contact
Let take a classical example: you want email notification 24x7 but SMS only the night and for critical alerts only.How do this with contacts definitions? You have to duplicate the contact. One with notification_period of 24x7 andthe email command, and one other with send-by-sms for the night. Duplicate contacts can be hard to manage inservices definitions afterward !
That why notification ways are useful: you defined some notification ways (that look really like contacts) and youlinked them to your contact.
6.6.1 Example
For example, you can have the below configuration: your contact, a happy admin:
define contact{contact_name happy_adminalias happy_adminemail admin@localhostpager +33699999999notificationways email_in_day,sms_the_night
}
And now define our notification ways:
# Email the whole 24x7 is okaydefine notificationway{
notificationway_name email_in_dayservice_notification_period 24x7host_notification_period 24x7service_notification_options w,u,c,r,fhost_notification_options d,u,r,f,sservice_notification_commands notify-servicehost_notification_commands notify-host
}
# But SMS only at nightdefine notificationway{
notificationway_name sms_at_nightservice_notification_period nighthost_notification_period nightservice_notification_options c ; so only CRITICALhost_notification_options d ; and DOWNservice_notification_commands notify-service-smshost_notification_commands notify-host-sms
}
And you can call theses ways from several contacts :)
The contact is valid because he’s got valid notificationways. For each notification, we ask for all notification_ways togive us the commands to send. If their notification options or timeperiod is not good, they just do not give one.
6.6.2 Mix old contact with new notification says
Of course, you can still have “old school” contact definition, and even with the notificationways parameters. Theservice_notification_period parameter of the contact will just be used to create a notificationways like the others, that’s
128 Chapter 6. Medium

Shinken Documentation, Release 2.4
all.
6.7 Passive data acquisition
6.7.1 Overview
Definition
Passive check results are received from external source in an unsolicited manner.
Data routing of Passive check results
Passive check results are received by the Arbiter daemon or the Receiver daemon. Modules loaded on either of thedaemons permit receiving various types of data formats. The Arbiter is the only one who knows which Scheduleris responsible for the data received. The Arbiter is tasked with administrative blocking functions that can inhibit theresponsiveness of the acquisition from a Receiver. This is not an issue for small Shinken installations, as the Arbiterdaemon will be blocked for very very short periods of time. In large Shinken installations with tens of thousands ofservices the Arbiter may induce delays related to passive check result routing.
Shinken 1.2 Shinken uses a direct routing method from the Receiver daemon directly to the appropriate Scheduler forcheck results and to the Arbiter daemon for external commands.
In all cases, should the Arbiter or Scheduler process be busy doing another task data from the Receiver will NOT belost. It will be queued in the Receiver until the remote daemon can process them.
Configuration Reference
The basics of enabling passive check results in the Shinken configuration
State handling for passive check results
6.7.2 Passive acquisition protocols
NSCA protocol
The NSCA addon consists of a daemon that runs on the Shinken host and a client that is executed from remotehosts. The daemon will listen for connections from remote clients, performs basic validation on the results beingsubmitted, and then write the check results directly into the external command named pipe file (as described in thebasics of passive check results configuration) of the Arbiter process or the Receiver process when scaling passive resultprocessing.
The only consideration here is to make sure to configure Shinken Receiver daemons. These will receive the NSCAmessages and queue them to be sent to the Arbiter or Scheduler for processing. Benefit from the most commondenominator, C compiled cross platform executable, UDP transport, single line output, raw text transmission.
Learn how to configure the NSCA module.
6.7. Passive data acquisition 129
Shinken Documentation, Release 2.4
TSCA protocol
Using TSCA, you can directly embed in your programs check result submission using a variety of programminglanguages. Languages such as, but not limited to, Perl, Java and Ruby. Benefit from direct access to Shinken, TCPtransport, multi line output and high performance binary transmission.
Learn how to configure the TSCA module.
Shinken WebService protocol
Shinken has its own Python web service module to receive passive data via HTTP(s) using the bottle.py Pythonmodule. The Web Service is considered experimental, but is being used in production environments. The WS moduleis very simple and can be extended or improved easily. It is Python after all.
Benefit from direct access to Shinken, HTTP protocol, TCP transport, firewall friendly, multi line output and highperformance binary transmission.
Learn how to configure the Shinken WebService.
NSCAweb protocol
A much more evolved protocol for sending data than NSCA. Use curl from the command line to send your data, orsubmit check results using an HTTP post in your software.
The python NSCAweb listener, http://github.com/smetj/nscaweb, can be hacked to act as a Shinken Receiver module.It might also be possible to wrestle the current Web Service receiver module to process NSCAweb sent messages, theformat is the same. .. important:: Should someone be interested in implementing an NSCAweb Shinken Receivermodule, support will be provided.
SNMP Traps
Net-SNMP’s snmptrapd and SNMP trap translator are typically used to receive, process, and trigger an alerts. Oncean alert has been identified an execution is launched of send_nsca, or other method to send result data to a ShinkenReceiver daemon. There is no actual Shinken receiver module to receive SNMP traps, but the point is to get the datasent to the Shinken Receiver daemon.
Learn more about SNMP trap handling.
The snmptt documentation has a good writeup on integrating with Nagios, which also applies to Shinken.
There is also a new project by the Check MK team to build an Event console that will process Traps and Syslogmessages to create Nagios/Shinken passive check results. It is experimental at this time.
OPC protocol
Various open source and commercial SDKs are available to implement a Shinken Receiver module for getting datefrom OPC-DA or OPC-UA servers. There is a planned implementations of this module in 2013 for OPC-DA v2 andOPC-UA, but should someone be interested in implementing one, support will be provided.
AMQP protocol
Adding a Shinken Receiver module to act as a consumer of AMQP messages can be implemented without much fuss.There are no planned implementations of this module, but should someone be interested in implementing one, supportwill be provided. A new broker module for the Canopsis Hypervisor acts as an AMQP endpoint, so this can be used
130 Chapter 6. Medium
Shinken Documentation, Release 2.4
to develop an AMQP consumer or provider. There is also a Python MQ implementation called Krolyk by Jelle Smetthat submits check results from AMQP to the Shinken command pipe.
6.8 Snapshots
6.8.1 Overview
Definition
Snapshots are on demand command launch to dump a larger state of one host/service when there is a problem in aperiod when the administrator is not available (night). It to not enter to the notification logic, it’s only to export aquick-view/snapshot of the element during a problem (like a list of processes) into a databse so the admin will be ableto look at the problem with more data when he/she will came back.
Data routing of Snapshots commands
Snapshots are like event handlers. They are launched from the reactionner with the same properties (reactionner_tag)than the event handlers. It’s up to the command to connect to the distant host and grab data. The scheduler is grabbingthe output and create a specific brok object from it so the brokers can get them and export it to modules.
Configuration Reference
Snapshots are command that can be called by hosts and/or services. They are disabled by default, and should be setto named hosts/services. It’s a very bad idea to enable them on all hosts and services as it will add lot of load on yourdistant hosts :)
Exporting the data
The data is exported from the scheduler as a brok (host_snapshot_brok/service_snapshot_brok) and can be grab bybroker modules to exporting to somewhere (like database, flat file, whatever you prefer).
6.8. Snapshots 131

Shinken Documentation, Release 2.4
132 Chapter 6. Medium

CHAPTER 7
Advanced Topics
133

Shinken Documentation, Release 2.4
7.1 External Commands
7.1.1 Introduction
Shinken can process commands from external applications (including the CGIs and others UIs) and alter variousaspects of its monitoring functions based on the commands it receives. External applications can submit commandsby writing to the command file, which is periodically processed by the Nagios daemon.
7.1.2 Enabling External Commands
In order to have Shinken process external commands, make sure you do the following:
• Enable external command checking with the check_external_commands option.
• Specify the location of the command file with the command_file option.
• Setup proper permissions on the directory containing the external command file, as described in the quickstartguide.
7.1.3 When Does Shinken Check For External Commands?
In fact every loop it look at it and reap all it can have in the pipe.
7.1.4 Using External Commands
External commands can be used to accomplish a variety of things while Shinken is running. Example of what can bedone include temporarily disabling notifications for services and hosts, temporarily disabling service checks, forcing
134 Chapter 7. Advanced Topics
Shinken Documentation, Release 2.4
immediate service checks, adding comments to hosts and services, etc.
7.1.5 Command Format
External commands that are written to the command file have the following format...
[time] command_id;command_arguments
...where time is the time (in “time_t” format) that the external application submitted the external command to the com-mand file. The values for the “command_id” and “command_arguments” arguments will depend on what command isbeing submitted to Shinken.
A full listing of external commands that can be used (along with examples of how to use them) can be found online atthe following URL:
http://www.nagios.org/developerinfo/externalcommands/
7.2 Event Handlers
7.2.1 Introduction
Event handlers are optional system commands (scripts or executables) that are run whenever a host or service statechange occurs.
An obvious use for event handlers is the ability for Shinken to proactively fix problems before anyone is notified.Some other uses for event handlers include:
• Restarting a failed service
• Entering a trouble ticket into a helpdesk system
• Logging event information to a database
• Cycling power on a host*
• etc.
Cycling power on a host that is experiencing problems with an automated script should not be implemented lightly.Consider the consequences of this carefully before implementing automatic reboots. :-)
7.2. Event Handlers 135

Shinken Documentation, Release 2.4
7.2.2 When Are Event Handlers Executed?
Event handlers are executed when a service or host:
• Is in a SOFT problem state
• Initially goes into a HARD problem state
• Initially recovers from a SOFT or HARD problem state
SOFT and HARD states are described in detail here .
7.2.3 Event Handler Types
There are different types of optional event handlers that you can define to handle host and state changes:
• Global host event handler
• Global service event handler
• Host-specific event handlers
• Service-specific event handlers
Global host and service event handlers are run for every host or service state change that occurs, immediately prior toany host- or service-specific event handler that may be run.
Event handlers offer functionality similar to notifications (launch some command) but are called each state change,soft or hard. This allows to call handler function and react to problems before Shinken raises a hard state and startssending out notifications.
You can specify global event handler commands by using the global_host_event_handler andglobal_service_event_handler options in your main configuration file.
Individual hosts and services can have their own event handler command that should be run to handle state changes.You can specify an event handler that should be run by using the “event_handler” directive in your host and servicedefinitions. These host- and service-specific event handlers are executed immediately after the (optional) global hostor service event handler is executed.
Important: Global event handlers are currently not launched as of April 2013:https://github.com/naparuba/shinken/issues/717
7.2.4 Enabling Event Handlers
Event handlers can be enabled or disabled on a program-wide basis by using the enable_event_handlers in your mainconfiguration file.
Host- and service-specific event handlers can be enabled or disabled by using the “event_handler_enabled” directivein your host and service definitions. Host- and service-specific event handlers will not be executed if the globalenable_event_handlers option is disabled.
7.2.5 Event Handler Execution Order
As already mentioned, global host and service event handlers are executed immediately before host- or service-specificevent handlers.
Event handlers are executed for HARD problem and recovery states immediately after notifications are sent out.
136 Chapter 7. Advanced Topics
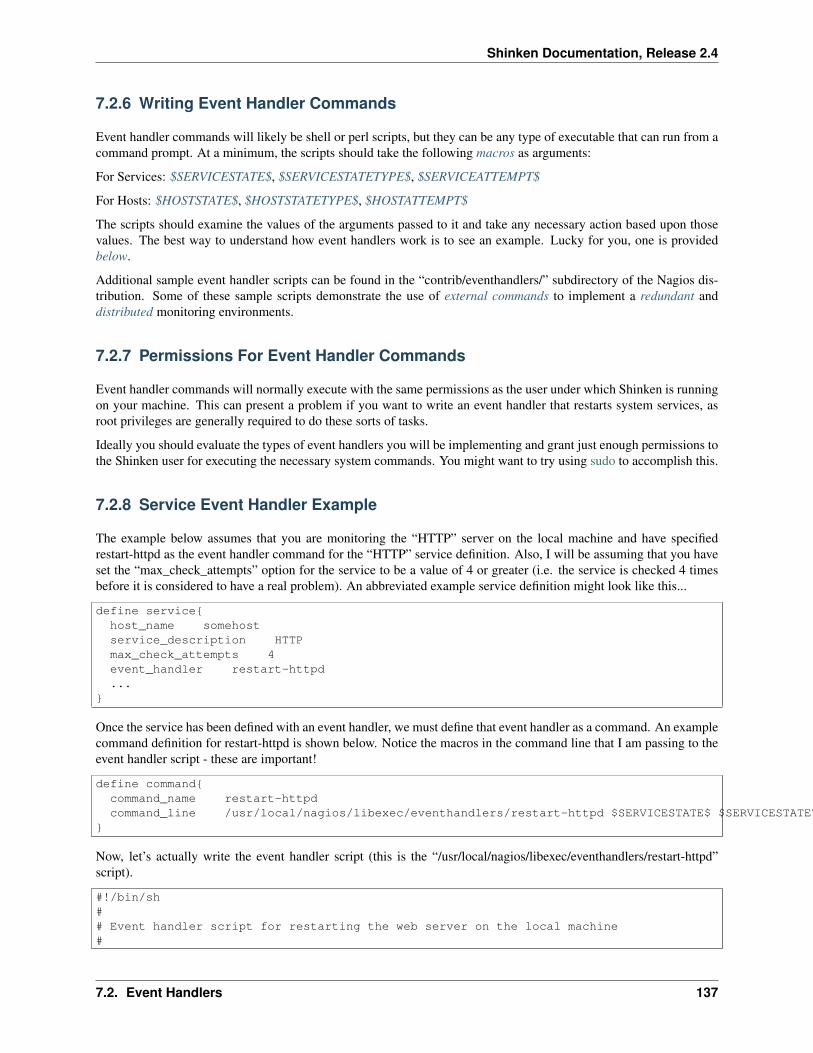
Shinken Documentation, Release 2.4
7.2.6 Writing Event Handler Commands
Event handler commands will likely be shell or perl scripts, but they can be any type of executable that can run from acommand prompt. At a minimum, the scripts should take the following macros as arguments:
For Services: $SERVICESTATE$, $SERVICESTATETYPE$, $SERVICEATTEMPT$
For Hosts: $HOSTSTATE$, $HOSTSTATETYPE$, $HOSTATTEMPT$
The scripts should examine the values of the arguments passed to it and take any necessary action based upon thosevalues. The best way to understand how event handlers work is to see an example. Lucky for you, one is providedbelow.
Additional sample event handler scripts can be found in the “contrib/eventhandlers/” subdirectory of the Nagios dis-tribution. Some of these sample scripts demonstrate the use of external commands to implement a redundant anddistributed monitoring environments.
7.2.7 Permissions For Event Handler Commands
Event handler commands will normally execute with the same permissions as the user under which Shinken is runningon your machine. This can present a problem if you want to write an event handler that restarts system services, asroot privileges are generally required to do these sorts of tasks.
Ideally you should evaluate the types of event handlers you will be implementing and grant just enough permissions tothe Shinken user for executing the necessary system commands. You might want to try using sudo to accomplish this.
7.2.8 Service Event Handler Example
The example below assumes that you are monitoring the “HTTP” server on the local machine and have specifiedrestart-httpd as the event handler command for the “HTTP” service definition. Also, I will be assuming that you haveset the “max_check_attempts” option for the service to be a value of 4 or greater (i.e. the service is checked 4 timesbefore it is considered to have a real problem). An abbreviated example service definition might look like this...
define service{host_name somehostservice_description HTTPmax_check_attempts 4event_handler restart-httpd...
}
Once the service has been defined with an event handler, we must define that event handler as a command. An examplecommand definition for restart-httpd is shown below. Notice the macros in the command line that I am passing to theevent handler script - these are important!
define command{command_name restart-httpdcommand_line /usr/local/nagios/libexec/eventhandlers/restart-httpd $SERVICESTATE$ $SERVICESTATETYPE$ $SERVICEATTEMPT$
}
Now, let’s actually write the event handler script (this is the “/usr/local/nagios/libexec/eventhandlers/restart-httpd”script).
#!/bin/sh## Event handler script for restarting the web server on the local machine#
7.2. Event Handlers 137

Shinken Documentation, Release 2.4
# Note: This script will only restart the web server if the service is# retried 3 times (in a "soft" state) or if the web service somehow# manages to fall into a "hard" error state.## What state is the HTTP service in?case "$1" inOK)
# The service just came back up, so don't do anything...;;
WARNING)# We don't really care about warning states, since the service is probably still running...;;
UNKNOWN)# We don't know what might be causing an unknown error, so don't do anything...;;
CRITICAL)# Aha! The HTTP service appears to have a problem - perhaps we should restart the server...# Is this a "soft" or a "hard" state?case "$2" in
# We're in a "soft" state, meaning that Nagios is in the middle of retrying the# check before it turns into a "hard" state and contacts get notified...SOFT)
# What check attempt are we on? We don't want to restart the web server on the first# check, because it may just be a fluke!
case "$3" in
# Wait until the check has been tried 3 times before restarting the web server.# If the check fails on the 4th time (after we restart the web server), the state# type will turn to "hard" and contacts will be notified of the problem.# Hopefully this will restart the web server successfully, so the 4th check will# result in a "soft" recovery. If that happens no one gets notified because we# fixed the problem!3)echo -n "Restarting HTTP service (3rd soft critical state)..."
# Call the init script to restart the HTTPD server/etc/rc.d/init.d/httpd restart;;
esac;;
# The HTTP service somehow managed to turn into a hard error without getting fixed.# It should have been restarted by the code above, but for some reason it didn't.# Let's give it one last try, shall we?# Note: Contacts have already been notified of a problem with the service at this# point (unless you disabled notifications for this service)HARD)
echo -n "Restarting HTTP service..."# Call the init script to restart the HTTPD server/etc/rc.d/init.d/httpd restart;;
esac;;
esacexit 0
The sample script provided above will attempt to restart the web server on the local machine in two different instances:
138 Chapter 7. Advanced Topics

Shinken Documentation, Release 2.4
• After the service has been rechecked for the 3rd time and is in a SOFT CRITICAL state
• After the service first goes into a HARD CRITICAL state
The script should theoretically restart and web server and fix the problem before the service goes into a HARD problemstate, but we include a fallback case in the event it doesn’t work the first time. It should be noted that the event handlerwill only be executed the first time that the service falls into a HARD problem state. This prevents Shinken fromcontinuously executing the script to restart the web server if the service remains in a HARD problem state. You don’twant that. :-)
That’s all there is to it! Event handlers are pretty simple to write and implement, so give it a try and see what you cando.
Note: you may need to:
• disable event handlers during downtimes (either by setting no_event_handlers_during_downtimes=1, orby checking $HOSTDOWNTIME$ and $SERVICEDOWNTIME$)
• make sure you want event handlers to be run even outside of the notification_period
7.3 Volatile Services
7.3.1 Introduction
Shinken has the ability to distinguish between “normal” services and “volatile” services. The is_volatile option in eachservice definition allows you to specify whether a specific service is volatile or not. For most people, the majority ofall monitored services will be non-volatile (i.e. “normal”). However, volatile services can be very useful when usedproperly...
7.3.2 What Are They Useful For?
Volatile services are useful for monitoring...
• Things that automatically reset themselves to an “OK” state each time they are checked
• Events such as security alerts which require attention every time there is a problem (and not just the first time)
7.3.3 What’s So Special About Volatile Services?
Volatile services differ from “normal” services in three important ways. Each time they are checked when they are ina hard non-OK state, and the check returns a non-OK state (i.e. no state change has occurred)...
• The non-OK service state is logged
• Contacts are notified about the problem (if that’s what should be done). Notification intervals are ignored forvolatile services.
• The event handler for the service is run (if one has been defined)
These events normally only occur for services when they are in a non-OK state and a hard state change has justoccurred. In other words, they only happen the first time that a service goes into a non-OK state. If future checks ofthe service result in the same non-OK state, no hard state change occurs and none of the events mentioned take placeagain.
Tip: If you are only interested in logging, consider using stalking options instead.
7.3. Volatile Services 139
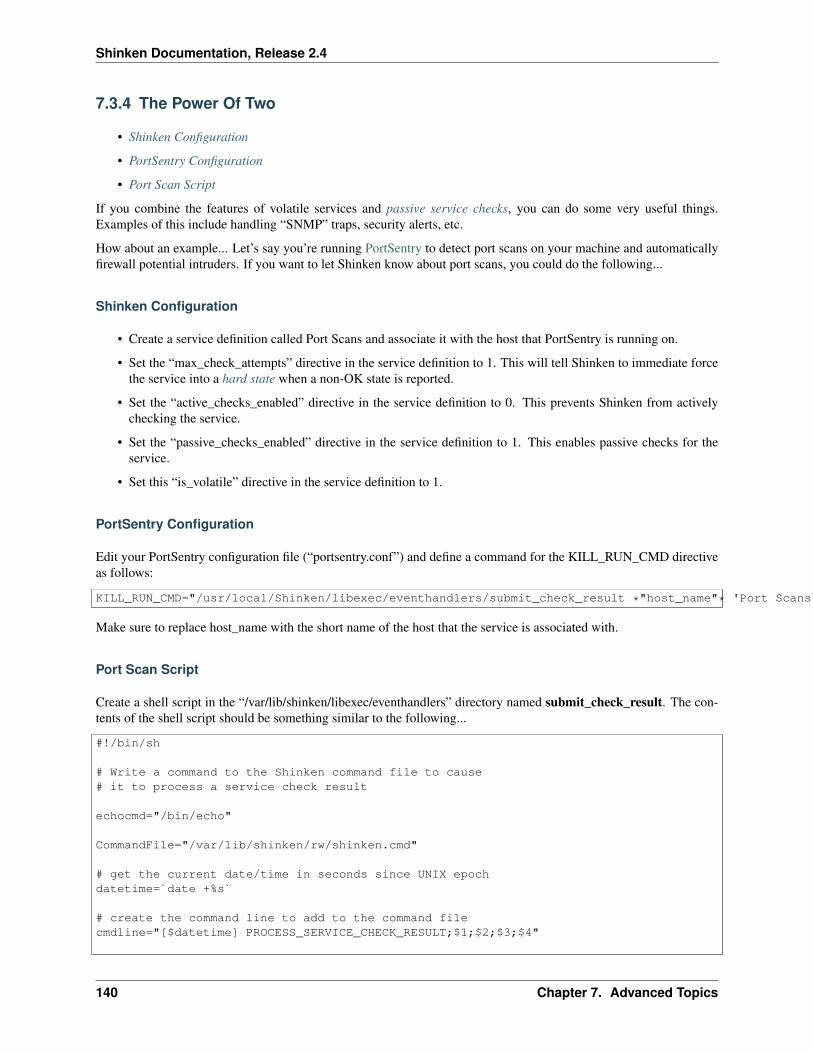
Shinken Documentation, Release 2.4
7.3.4 The Power Of Two
• Shinken Configuration
• PortSentry Configuration
• Port Scan Script
If you combine the features of volatile services and passive service checks, you can do some very useful things.Examples of this include handling “SNMP” traps, security alerts, etc.
How about an example... Let’s say you’re running PortSentry to detect port scans on your machine and automaticallyfirewall potential intruders. If you want to let Shinken know about port scans, you could do the following...
Shinken Configuration
• Create a service definition called Port Scans and associate it with the host that PortSentry is running on.
• Set the “max_check_attempts” directive in the service definition to 1. This will tell Shinken to immediate forcethe service into a hard state when a non-OK state is reported.
• Set the “active_checks_enabled” directive in the service definition to 0. This prevents Shinken from activelychecking the service.
• Set the “passive_checks_enabled” directive in the service definition to 1. This enables passive checks for theservice.
• Set this “is_volatile” directive in the service definition to 1.
PortSentry Configuration
Edit your PortSentry configuration file (“portsentry.conf”) and define a command for the KILL_RUN_CMD directiveas follows:
KILL_RUN_CMD="/usr/local/Shinken/libexec/eventhandlers/submit_check_result *"host_name"* 'Port Scans' 2 'Port scan from host $TARGET$ on port $PORT$. Host has been firewalled.'"
Make sure to replace host_name with the short name of the host that the service is associated with.
Port Scan Script
Create a shell script in the “/var/lib/shinken/libexec/eventhandlers” directory named submit_check_result. The con-tents of the shell script should be something similar to the following...
#!/bin/sh
# Write a command to the Shinken command file to cause# it to process a service check result
echocmd="/bin/echo"
CommandFile="/var/lib/shinken/rw/shinken.cmd"
# get the current date/time in seconds since UNIX epochdatetime=`date +%s`
# create the command line to add to the command filecmdline="[$datetime] PROCESS_SERVICE_CHECK_RESULT;$1;$2;$3;$4"
140 Chapter 7. Advanced Topics

Shinken Documentation, Release 2.4
# append the command to the end of the command file`$echocmd $cmdline >> $CommandFile`
What will happen when PortSentry detects a port scan on the machine in the future?
• PortSentry will firewall the host (this is a function of the PortSentry software)
• PortSentry will execute the submit_check_result shell script and send a passive check result to Shinken
• Shinken will read the external command file and see the passive service check submitted by PortSentry
• Shinken will put the Port Scans service in a hard CRITICAL state and send notifications to contacts
Pretty neat, huh?
7.4 Service and Host Freshness Checks
7.4.1 Introduction
Shinken supports a feature that does “freshness” checking on the results of host and service checks. The purpose offreshness checking is to ensure that host and service checks are being provided passively by external applications on aregular basis.
Freshness checking is useful when you want to ensure that passive checks are being received as frequently as youwant. This can be very useful in distributed and failover monitoring environments.
7.4.2 How Does Freshness Checking Work?
Shinken periodically checks the freshness of the results for all hosts services that have freshness checking enabled.
• A freshness threshold is calculated for each host or service.
• For each host/service, the age of its last check result is compared with the freshness threshold.
• If the age of the last check result is greater than the freshness threshold, the check result is considered “stale”.
• If the check results is found to be stale, Shinken will force an active check of the host or service by executingthe command specified by in the host or service definition.
An active check is executed even if active checks are disabled on a program-wide or host- or service-specific basis.
For example, if you have a freshness threshold of 60 for one of your services, Shinken will consider that service to bestale if its last check result is older than 60 seconds.
7.4. Service and Host Freshness Checks 141

Shinken Documentation, Release 2.4
7.4.3 Enabling Freshness Checking
Here’s what you need to do to enable freshness checking...
• Enable freshness checking on a program-wide basis with the check_service_freshness and check_host_freshnessdirectives.
• Use service_freshness_check_interval and host_freshness_check_interval options to tell Shinken how often itshould check the freshness of service and host results.
• Enable freshness checking on a host- and service-specific basis by setting the “check_freshness” option in yourhost and service definitions to a value of 1.
• Configure freshness thresholds by setting the “freshness_threshold” option in your host and service definitions.
• Configure the “check_command” option in your host or service definitions to reflect a valid command thatshould be used to actively check the host or service when it is detected as stale.
• The “check_period” option in your host and service definitions is used when Shinken determines when a hostor service can be checked for freshness, so make sure it is set to a valid timeperiod.
If you do not specify a host- or service-specific “freshness_threshold” value (or you set it to zero), Shinken willautomatically calculate a threshold automatically, based on a how often you monitor that particular host or service. Iwould recommended that you explicitly specify a freshness threshold, rather than let Shinken pick one for you.
7.4.4 Example
An example of a service that might require freshness checking might be one that reports the status of your nightlybackup jobs. Perhaps you have a external script that submit the results of the backup job to Shinken once the backup iscompleted. In this case, all of the checks/results for the service are provided by an external application using passivechecks. In order to ensure that the status of the backup job gets reported every day, you may want to enable freshnesschecking for the service. If the external script doesn’t submit the results of the backup job, you can have Shinken fakea critical result by doing something like this...
Here’s what the definition for the service might look like (some required options are omitted)...
define service{host_name backup-serverservice_description ArcServe Backup Jobactive_checks_enabled 0 ; active checks are NOT enabledpassive_checks_enabled 1 ; passive checks are enabled (this is how results are reported)check_freshness 1freshness_threshold 93600 ; 26 hour threshold, since backups may not always finish at the same timecheck_command no-backup-report ; this command is run only if the service results are “stale"...other options...}
Notice that active checks are disabled for the service. This is because the results for the service are only made by anexternal application using passive checks. Freshness checking is enabled and the freshness threshold has been set to 26hours. This is a bit longer than 24 hours because backup jobs sometimes run late from day to day (depending on howmuch data there is to backup, how much network traffic is present, etc.). The “no-backup-report” command is executedonly if the results of the service are determined to be stale. The definition of the “no-backup-report” command mightlook like this...
define command{command_name no-backup-reportcommand_line /var/lib/shinken/libexec/check_dummy 2 "CRITICAL: Results of backup job were not reported!"}
142 Chapter 7. Advanced Topics
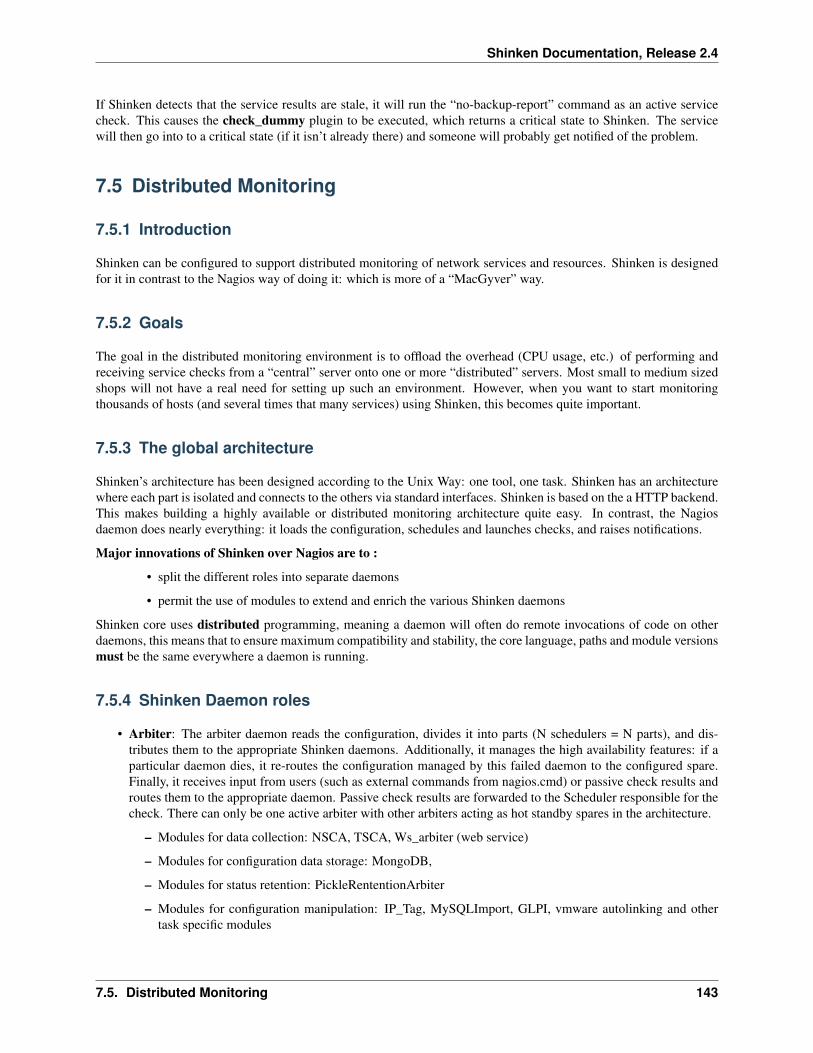
Shinken Documentation, Release 2.4
If Shinken detects that the service results are stale, it will run the “no-backup-report” command as an active servicecheck. This causes the check_dummy plugin to be executed, which returns a critical state to Shinken. The servicewill then go into to a critical state (if it isn’t already there) and someone will probably get notified of the problem.
7.5 Distributed Monitoring
7.5.1 Introduction
Shinken can be configured to support distributed monitoring of network services and resources. Shinken is designedfor it in contrast to the Nagios way of doing it: which is more of a “MacGyver” way.
7.5.2 Goals
The goal in the distributed monitoring environment is to offload the overhead (CPU usage, etc.) of performing andreceiving service checks from a “central” server onto one or more “distributed” servers. Most small to medium sizedshops will not have a real need for setting up such an environment. However, when you want to start monitoringthousands of hosts (and several times that many services) using Shinken, this becomes quite important.
7.5.3 The global architecture
Shinken’s architecture has been designed according to the Unix Way: one tool, one task. Shinken has an architecturewhere each part is isolated and connects to the others via standard interfaces. Shinken is based on the a HTTP backend.This makes building a highly available or distributed monitoring architecture quite easy. In contrast, the Nagiosdaemon does nearly everything: it loads the configuration, schedules and launches checks, and raises notifications.
Major innovations of Shinken over Nagios are to :
• split the different roles into separate daemons
• permit the use of modules to extend and enrich the various Shinken daemons
Shinken core uses distributed programming, meaning a daemon will often do remote invocations of code on otherdaemons, this means that to ensure maximum compatibility and stability, the core language, paths and module versionsmust be the same everywhere a daemon is running.
7.5.4 Shinken Daemon roles
• Arbiter: The arbiter daemon reads the configuration, divides it into parts (N schedulers = N parts), and dis-tributes them to the appropriate Shinken daemons. Additionally, it manages the high availability features: if aparticular daemon dies, it re-routes the configuration managed by this failed daemon to the configured spare.Finally, it receives input from users (such as external commands from nagios.cmd) or passive check results androutes them to the appropriate daemon. Passive check results are forwarded to the Scheduler responsible for thecheck. There can only be one active arbiter with other arbiters acting as hot standby spares in the architecture.
– Modules for data collection: NSCA, TSCA, Ws_arbiter (web service)
– Modules for configuration data storage: MongoDB,
– Modules for status retention: PickleRententionArbiter
– Modules for configuration manipulation: IP_Tag, MySQLImport, GLPI, vmware autolinking and othertask specific modules
7.5. Distributed Monitoring 143
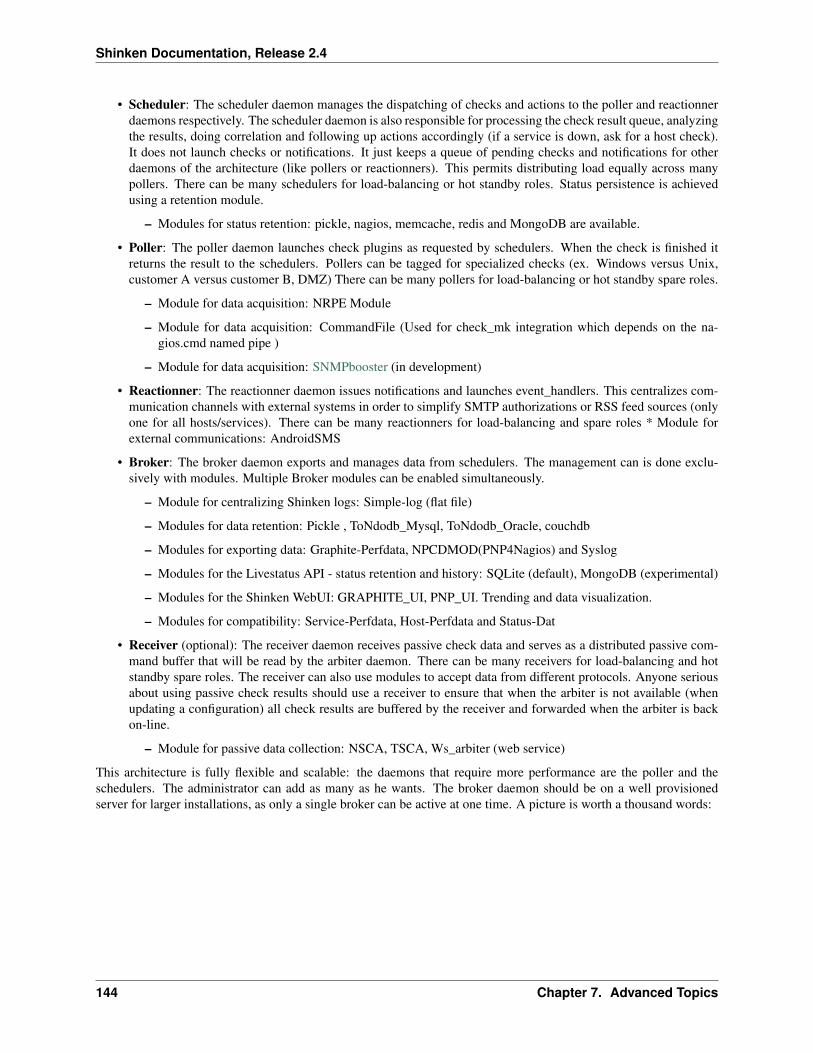
Shinken Documentation, Release 2.4
• Scheduler: The scheduler daemon manages the dispatching of checks and actions to the poller and reactionnerdaemons respectively. The scheduler daemon is also responsible for processing the check result queue, analyzingthe results, doing correlation and following up actions accordingly (if a service is down, ask for a host check).It does not launch checks or notifications. It just keeps a queue of pending checks and notifications for otherdaemons of the architecture (like pollers or reactionners). This permits distributing load equally across manypollers. There can be many schedulers for load-balancing or hot standby roles. Status persistence is achievedusing a retention module.
– Modules for status retention: pickle, nagios, memcache, redis and MongoDB are available.
• Poller: The poller daemon launches check plugins as requested by schedulers. When the check is finished itreturns the result to the schedulers. Pollers can be tagged for specialized checks (ex. Windows versus Unix,customer A versus customer B, DMZ) There can be many pollers for load-balancing or hot standby spare roles.
– Module for data acquisition: NRPE Module
– Module for data acquisition: CommandFile (Used for check_mk integration which depends on the na-gios.cmd named pipe )
– Module for data acquisition: SNMPbooster (in development)
• Reactionner: The reactionner daemon issues notifications and launches event_handlers. This centralizes com-munication channels with external systems in order to simplify SMTP authorizations or RSS feed sources (onlyone for all hosts/services). There can be many reactionners for load-balancing and spare roles * Module forexternal communications: AndroidSMS
• Broker: The broker daemon exports and manages data from schedulers. The management can is done exclu-sively with modules. Multiple Broker modules can be enabled simultaneously.
– Module for centralizing Shinken logs: Simple-log (flat file)
– Modules for data retention: Pickle , ToNdodb_Mysql, ToNdodb_Oracle, couchdb
– Modules for exporting data: Graphite-Perfdata, NPCDMOD(PNP4Nagios) and Syslog
– Modules for the Livestatus API - status retention and history: SQLite (default), MongoDB (experimental)
– Modules for the Shinken WebUI: GRAPHITE_UI, PNP_UI. Trending and data visualization.
– Modules for compatibility: Service-Perfdata, Host-Perfdata and Status-Dat
• Receiver (optional): The receiver daemon receives passive check data and serves as a distributed passive com-mand buffer that will be read by the arbiter daemon. There can be many receivers for load-balancing and hotstandby spare roles. The receiver can also use modules to accept data from different protocols. Anyone seriousabout using passive check results should use a receiver to ensure that when the arbiter is not available (whenupdating a configuration) all check results are buffered by the receiver and forwarded when the arbiter is backon-line.
– Module for passive data collection: NSCA, TSCA, Ws_arbiter (web service)
This architecture is fully flexible and scalable: the daemons that require more performance are the poller and theschedulers. The administrator can add as many as he wants. The broker daemon should be on a well provisionedserver for larger installations, as only a single broker can be active at one time. A picture is worth a thousand words:
144 Chapter 7. Advanced Topics

Shinken Documentation, Release 2.4
7.5.5 The smart and automatic load balancing
• Creating independent packs
• The packs aggregations into scheduler configurations
• The configurations sending to satellites
Shinken is able to cut the user configuration into parts and dispatch it to the schedulers. The load balancing is doneautomatically: the administrator does not need to remember which host is linked with another one to create packs,Shinken does it for him.
The dispatch is a host-based one: that means that all services of a host will be in the same scheduler as this host. Themajor advantage of Shinken is the ability to create independent configurations: an element of a configuration will nothave to call an element of another pack. That means that the administrator does not need to know all relations amongelements like parents, hostdependencies or service dependencies: Shinken is able to look at these relations and putthese related elements into the same packs.
This action is done in two parts:
• create independent packs of elements
• paste packs to create N configurations for the N schedulers
Creating independent packs
The cutting action is done by looking at two elements: hosts and services. Services are linked with their host so theywill be in the same pack. Other relations are taken into account :
• parent relationship for hosts (like a distant server and its router)
7.5. Distributed Monitoring 145
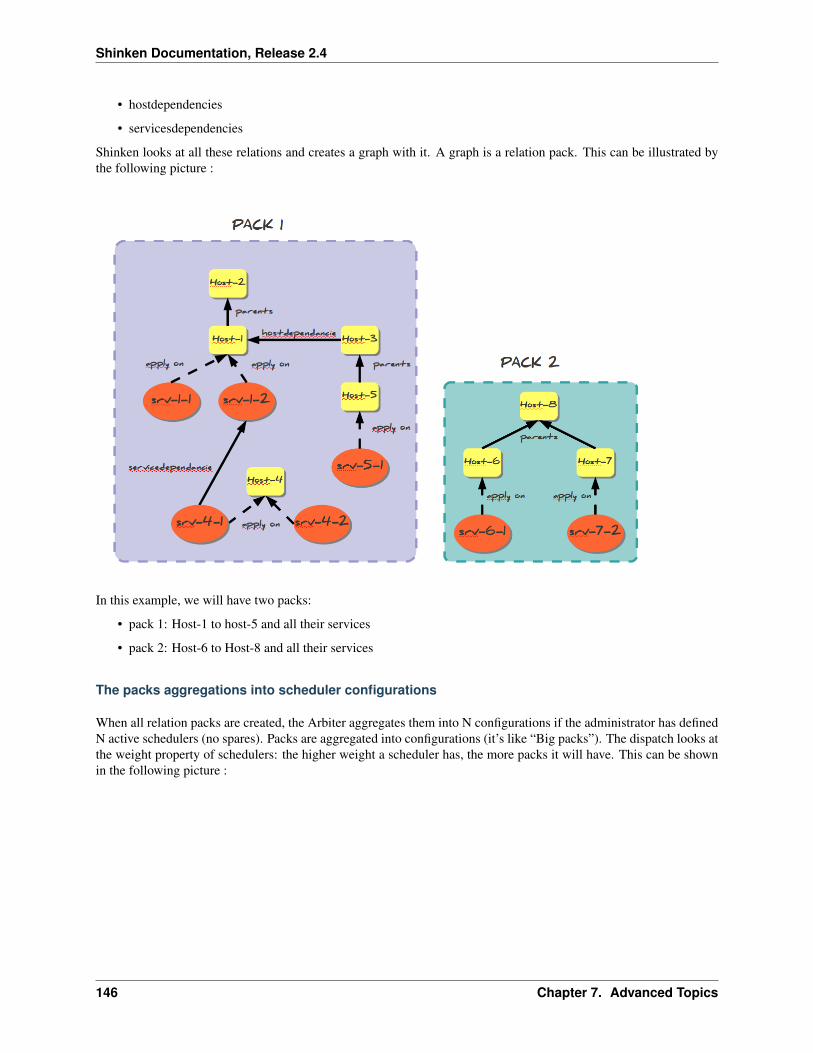
Shinken Documentation, Release 2.4
• hostdependencies
• servicesdependencies
Shinken looks at all these relations and creates a graph with it. A graph is a relation pack. This can be illustrated bythe following picture :
In this example, we will have two packs:
• pack 1: Host-1 to host-5 and all their services
• pack 2: Host-6 to Host-8 and all their services
The packs aggregations into scheduler configurations
When all relation packs are created, the Arbiter aggregates them into N configurations if the administrator has definedN active schedulers (no spares). Packs are aggregated into configurations (it’s like “Big packs”). The dispatch looks atthe weight property of schedulers: the higher weight a scheduler has, the more packs it will have. This can be shownin the following picture :
146 Chapter 7. Advanced Topics

Shinken Documentation, Release 2.4
The configurations sending to satellites
When all configurations are created, the Arbiter sends them to the N active Schedulers. A Scheduler can start process-ing checks once it has received and loaded it’s configuration without having to wait for all schedulers to be ready(v1.2).For larger configurations, having more than one Scheduler, even on a single server is highly recommended, as theywill load their configurations(new or updated) faster. The Arbiter also creates configurations for satellites (pollers,reactionners and brokers) with links to Schedulers so they know where to get jobs to do. After sending the configu-rations, the Arbiter begins to watch for orders from the users and is responsible for monitoring the availability of thesatellites.
7.5.6 The high availability
• When a node dies
The shinken architecture is a high availability one. Before looking at how this works,let’s take a look at how the loadbalancing works if it’s now already done.
When a node dies
Nobody is perfect. A server can crash, an application too. That is why administrators have spares: they can takeconfigurations of failing elements and reassign them. For the moment the only daemon that does not have a spare isthe Arbiter, but this will be added in the future. The Arbiter regularly checks if everyone is available. If a scheduler oranother satellite is dead, it sends its conf to a spare node, defined by the administrator. All satellites are informed by thischange so they can get their jobs from the new element and do not try to reach the dead one. If a node was lost due to anetwork interruption and it comes back up, the Arbiter will notice and ask the old system to drop its configuration. Theavailability parameters can be modified from the default settings when using larger configurations as the Schedulers
7.5. Distributed Monitoring 147
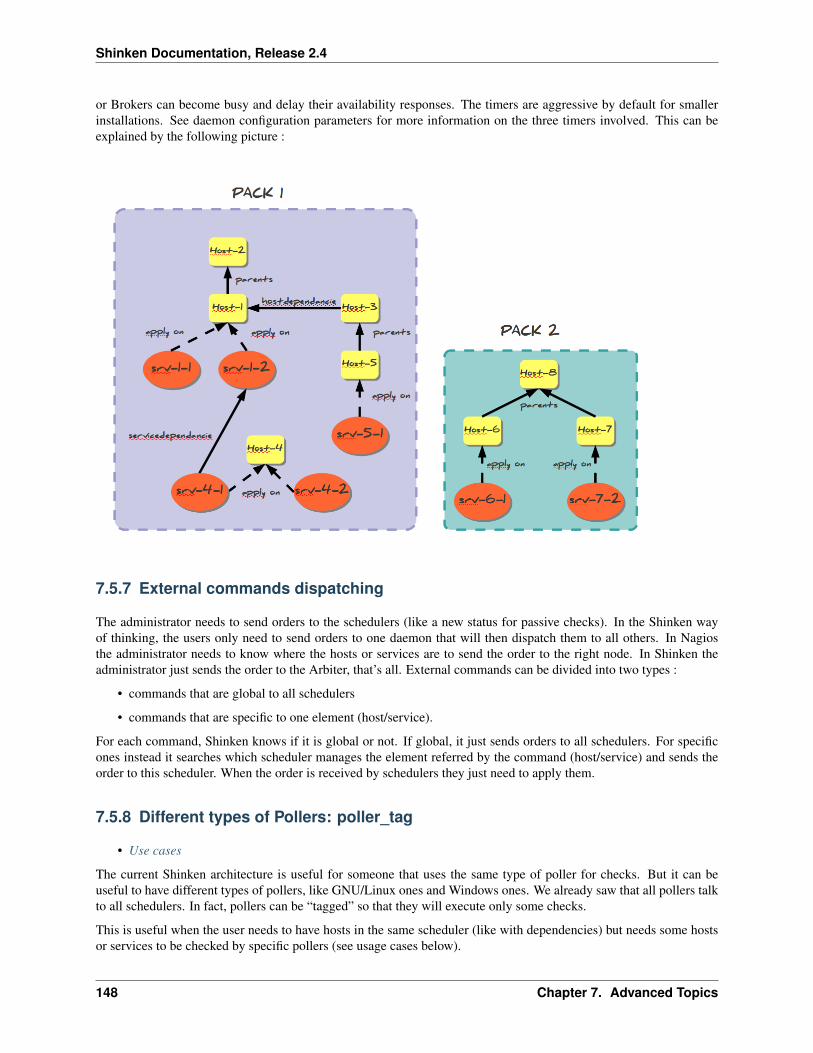
Shinken Documentation, Release 2.4
or Brokers can become busy and delay their availability responses. The timers are aggressive by default for smallerinstallations. See daemon configuration parameters for more information on the three timers involved. This can beexplained by the following picture :
7.5.7 External commands dispatching
The administrator needs to send orders to the schedulers (like a new status for passive checks). In the Shinken wayof thinking, the users only need to send orders to one daemon that will then dispatch them to all others. In Nagiosthe administrator needs to know where the hosts or services are to send the order to the right node. In Shinken theadministrator just sends the order to the Arbiter, that’s all. External commands can be divided into two types :
• commands that are global to all schedulers
• commands that are specific to one element (host/service).
For each command, Shinken knows if it is global or not. If global, it just sends orders to all schedulers. For specificones instead it searches which scheduler manages the element referred by the command (host/service) and sends theorder to this scheduler. When the order is received by schedulers they just need to apply them.
7.5.8 Different types of Pollers: poller_tag
• Use cases
The current Shinken architecture is useful for someone that uses the same type of poller for checks. But it can beuseful to have different types of pollers, like GNU/Linux ones and Windows ones. We already saw that all pollers talkto all schedulers. In fact, pollers can be “tagged” so that they will execute only some checks.
This is useful when the user needs to have hosts in the same scheduler (like with dependencies) but needs some hostsor services to be checked by specific pollers (see usage cases below).
148 Chapter 7. Advanced Topics
Shinken Documentation, Release 2.4
These checks can in fact be tagged on 3 levels :
• Host
• Service
• Command
The parameter to tag a command, host or service, is “poller_tag”. If a check uses a “tagged” or “untagged” commandin a untagged host/service, it takes the poller_tag of this host/service. In a “untagged” host/service, it’s the commandtag that is taken into account.
The pollers can be tagged with multiple poller_tags. If they are tagged, they will only take checks that are tagged, notthe untagged ones, unless they defined the tag “None”.
Use cases
This capability is useful in two cases:
• GNU/Linux and Windows pollers
• DMZ
In the first case, it can be useful to have a windows box in a domain with a poller daemon running under a domainaccount. If this poller launches WMI queries, the user can have an easy Windows monitoring.
The second case is a classic one: when you have a DMZ network, you need to have a dedicated poller that is in theDMZ, and return results to a scheduler in LAN. With this, you can still have dependencies between DMZ hosts andLAN hosts, and still be sure that checks are done in a DMZ-only poller.
7.5.9 Different types of Reactionners: reactionner_tag
• Use cases
Like for the pollers, reactionners can also have ‘tags’. So you can tag your host/service or commands with “reaction-ner_tag”. If a notification or an event handler uses a “tagged” or “untagged” command in a untagged host/service,it takes the reactionner_tag of this host/service. In a “untaged” host/service, it’s the command tag that is taken intoaccount.
The reactionners can be tagged with multiple reactionner_tags. If they are tagged, they will only take checks that aretagged, not the untagged ones, unless they defined the tag “None”.
Like for the poller case, it’s mainly useful for DMZ/LAN or GNU/Linux/Windows cases.
7.5.10 Advanced architectures: Realms
• Realms in few words
• Realms are not poller_tags!
• Sub realms
• Example of realm usage
Shinken’s architecture allows the administrator to have a unique point of administration with numerous schedulers,pollers, reactionners and brokers. Hosts are dispatched with their own services to schedulers and the satellites(pollers/reactionners/brokers) get jobs from them. Everyone is happy.
Or almost everyone. Think about an administrator who has a distributed architecture around the world. With thecurrent Shinken architecture the administrator can put a couple scheduler/poller daemons in Europe and another set
7.5. Distributed Monitoring 149
Shinken Documentation, Release 2.4
in Asia, but he cannot “tag” hosts in Asia to be checked by the asian scheduler . Also trying to check an asian serverwith an european scheduler can be very sub-optimal, read very sloooow. The hosts are dispatched to all schedulersand satellites so the administrator cannot be sure that asian hosts will be checked by the asian monitoring servers.
In the normal Shinken Architecture is useful for load balancing with high availability, for single site.
Shinken provides a way to manage different geographic or organizational sites.
We will use a generic term for this site management, Realms.
Realms in few words
A realm is a pool of resources (scheduler, poller, reactionner and broker) that hosts or hostgroups can be attached to.A host or hostgroup can be attached to only one realm. All “dependancies” or parents of this hosts must be in the samerealm. A realm can be tagged “default”’ and realm untagged hosts will be put into it. In a realm, pollers, reactionnersand brokers will only get jobs from schedulers of the same realm.
Realms are not poller_tags!
Make sure to undestand when to use realms and when to use poller_tags.
• realms are used to segregate schedulers
• poller_tags are used to segregate pollers
For some cases poller_tag functionality could also be done using Realms. The question you need to ask yourself: Is apoller_tag “enough”, or do you need to fully segregate a the scheduler level and use Realms. In realms, schedulers donot communicate with schedulers from other Realms.
If you just need a poller in a DMZ network, use poller_tag.
If you need a scheduler/poller in a customer LAN, use realms.
Sub realms
A realm can contain another realm. It does not change anything for schedulers: they are only responsible for hosts oftheir realm not the ones of the sub realms. The realm tree is useful for satellites like reactionners or brokers: they canget jobs from the schedulers of their realm, but also from schedulers of sub realms. Pollers can also get jobs from subrealms, but it’s less useful so it’s disabled by default. Warning: having more than one broker in a scheduler is not agood idea. The jobs for brokers can be taken by only one broker. For the Arbiter it does not change a thing: there isstill only one Arbiter and one configuration whatever realms you have.
Example of realm usage
Let’s take a look at two distributed environnements. In the first case the administrator wants totally distinct daemons.In the second one he just wants the schedulers/pollers to be distincts, but still have one place to send notifications(reactionners) and one place for database export (broker).
Distincts realms :
150 Chapter 7. Advanced Topics
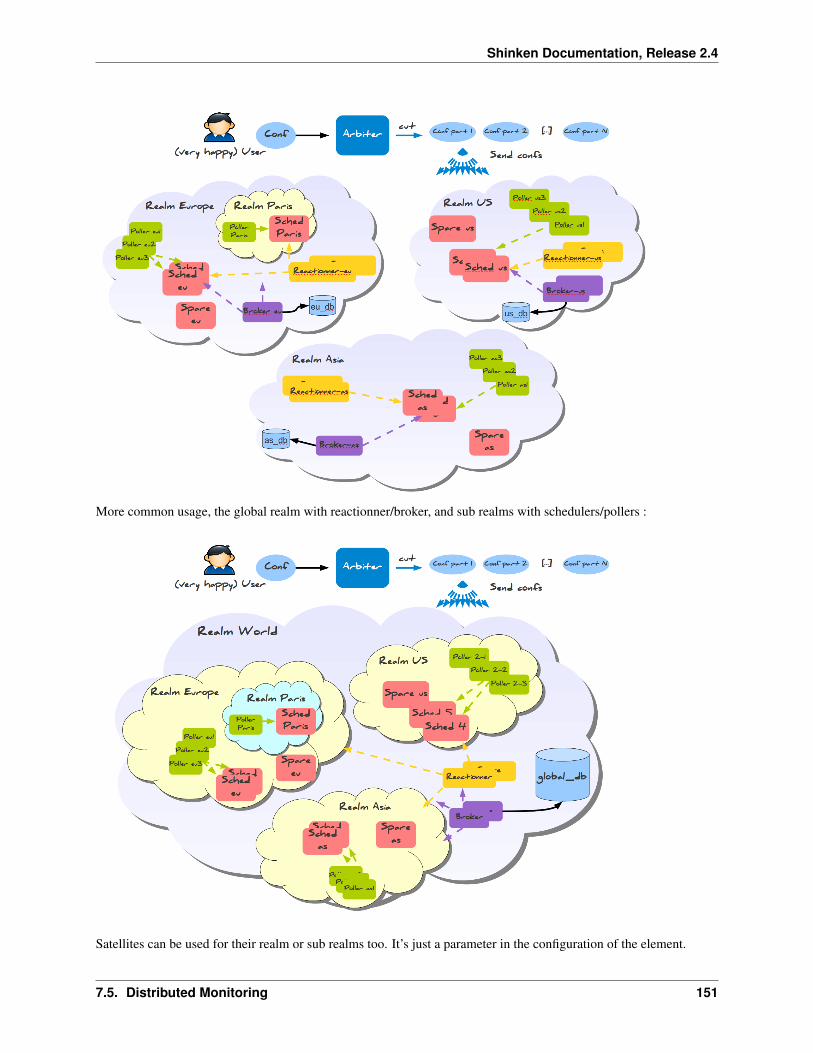
Shinken Documentation, Release 2.4
More common usage, the global realm with reactionner/broker, and sub realms with schedulers/pollers :
Satellites can be used for their realm or sub realms too. It’s just a parameter in the configuration of the element.
7.5. Distributed Monitoring 151

Shinken Documentation, Release 2.4
7.6 Redundant and Failover Network Monitoring
7.6.1 Introduction
This topic is managed in the distributed section because it’s a part of the Shinken architecture.
7.7 Detection and Handling of State Flapping
7.7.1 Introduction
Shinken supports optional detection of hosts and services that are “flapping”. Flapping occurs when a service or hostchanges state too frequently, resulting in a storm of problem and recovery notifications. Flapping can be indicative ofconfiguration problems (i.e. thresholds set too low), troublesome services, or real network problems.
7.7.2 How Flap Detection Works
Before I get into this, let me say that flapping detection has been a little difficult to implement. How exactly does onedetermine what “too frequently” means in regards to state changes for a particular host or service? When I first startedthinking about implementing flap detection I tried to find some information on how flapping could/should be detected.I couldn’t find any information about what others were using (where they using any?), so I decided to settle with whatseemed to me to be a reasonable solution...
Whenever Shinken checks the status of a host or service, it will check to see if it has started or stopped flapping. Itdoes this by.
• Storing the results of the last 21 checks of the host or service
• Analyzing the historical check results and determine where state changes/transitions occur
• Using the state transitions to determine a percent state change value (a measure of change) for the host or service
• Comparing the percent state change value against low and high flapping thresholds
A host or service is determined to have started flapping when its percent state change first exceeds a high flappingthreshold.
A host or service is determined to have stopped flapping when its percent state goes below a low flapping threshold(assuming that is was previously flapping).
7.7.3 Example
Let’s describe in more detail how flap detection works with services...
The image below shows a chronological history of service states from the most recent 21 service checks. OK statesare shown in green, WARNING states in yellow, CRITICAL states in red, and UNKNOWN states in orange.
152 Chapter 7. Advanced Topics

Shinken Documentation, Release 2.4
The historical service check results are examined to determine where state changes/transitions occur. State changesoccur when an archived state is different from the archived state that immediately precedes it chronologically. Sincewe keep the results of the last 21 service checks in the array, there is a possibility of having at most 20 state changes.The 20 value can be changed in the main configuration file, see flap_history. In this example there are 7 state changes,indicated by blue arrows in the image above.
The flap detection logic uses the state changes to determine an overall percent state change for the service. This is ameasure of volatility/change for the service. Services that never change state will have a 0% state change value, whileservices that change state each time they’re checked will have 100% state change. Most services will have a percentstate change somewhere in between.
When calculating the percent state change for the service, the flap detection algorithm will give more weight to newstate changes compare to older ones. Specifically, the flap detection routines are currently designed to make the newestpossible state change carry 50% more weight than the oldest possible state change. The image below shows how recentstate changes are given more weight than older state changes when calculating the overall or total percent state changefor a particular service.
Using the images above, lets do a calculation of percent state change for the service. You will notice that there are atotal of 7 state changes (at t3, t4, t5, t9, t12, t16, and t19). Without any weighting of the state changes over time, thiswould give us a total state change of 35%:
(7 observed state changes / possible 20 state changes) * 100 = 35 %
Since the flap detection logic will give newer state changes a higher rate than older state changes, the actual calculatedpercent state change will be slightly less than 35% in this example. Let’s say that the weighted percent of state changeturned out to be 31%...
The calculated percent state change for the service (31%) will then be compared against flapping thresholds to see
7.7. Detection and Handling of State Flapping 153

Shinken Documentation, Release 2.4
what should happen:
• If the service was not previously flapping and 31% is equal to or greater than the high flap threshold, Shinkenconsiders the service to have just started flapping.
• If the service was previously flapping and 31% is less than the low flap threshold, Shinken considers the serviceto have just stopped flapping.
If neither of those two conditions are met, the flap detection logic won’t do anything else with the service, since it iseither not currently flapping or it is still flapping.
7.7.4 Flap Detection for Services
Shinken checks to see if a service is flapping whenever the service is checked (either actively or passively).
The flap detection logic for services works as described in the example above.
7.7.5 Flap Detection for Hosts
Host flap detection works in a similar manner to service flap detection, with one important difference: Shinken willattempt to check to see if a host is flapping whenever:
• The host is checked (actively or passively)
• Sometimes when a service associated with that host is checked. More specifically, when at least x amount oftime has passed since the flap detection was last performed, where x is equal to the average check interval of allservices associated with the host.
Why is this done? With services we know that the minimum amount of time between consecutive flap detectionroutines is going to be equal to the service check interval. However, you might not be monitoring hosts on a regularbasis, so there might not be a host check interval that can be used in the flap detection logic. Also, it makes sense thatchecking a service should count towards the detection of host flapping. Services are attributes of or things associatedwith host after all... At any rate, that’s the best method I could come up with for determining how often flap detectioncould be performed on a host, so there you have it.
7.7.6 Flap Detection Thresholds
Shinken uses several variables to determine the percent state change thresholds is uses for flap detection. For both hostsand services, there are global high and low thresholds and host- or service-specific thresholds that you can configure.Shinken will use the global thresholds for flap detection if you to not specify host- or service- specific thresholds.
The table below shows the global and host- or service-specific variables that control the various thresholds used in flapdetection.
Object Type Global Variables Object-Specific VariablesHost low_host_flap_threshold high_host_flap_threshold low_flap_threshold
high_flap_thresholdService low_service_flap_threshold
high_service_flap_thresholdlow_flap_thresholdhigh_flap_threshold
7.7.7 States Used For Flap Detection
Normally Shinken will track the results of the last 21 checks of a host or service, regardless of the check result(host/service state), for use in the flap detection logic.
154 Chapter 7. Advanced Topics

Shinken Documentation, Release 2.4
You can exclude certain host or service states from use in flap detection logic by using the “flap_detection_options”directive in your host or service definitions. This directive allows you to specify what host or service states (i.e. “UP,“DOWN”, “OK, “CRITICAL”) you want to use for flap detection. If you don’t use this directive, all host or servicestates are used in flap detection.
7.7.8 Flap Handling
When a service or host is first detected as flapping, Shinken will:
• Log a message indicating that the service or host is flapping.
• Add a non-persistent comment to the host or service indicating that it is flapping.
• Send a “flapping start” notification for the host or service to appropriate contacts.
• Suppress other notifications for the service or host (this is one of the filters in the notification logic).
When a service or host stops flapping, Shinken will:
• Log a message indicating that the service or host has stopped flapping.
• Delete the comment that was originally added to the service or host when it started flapping.
• Send a “flapping stop” notification for the host or service to appropriate contacts.
• Remove the block on notifications for the service or host (notifications will still be bound to the normal notifi-cation logic).
7.7.9 Enabling Flap Detection
In order to enable the flap detection features in Shinken, you’ll need to:
• Set enable_flap_detection directive is set to 1.
• Set the “flap_detection_enabled” directive in your host and service definitions is set to 1.
If you want to disable flap detection on a global basis, set the enable_flap_detection directive to 0.
If you would like to disable flap detection for just a few hosts or services, use the “flap_detection_enabled” directivein the host and/or service definitions to do so.
7.8 Notification Escalations
7.8.1 Introduction
Shinken supports optional escalation of contact notifications for hosts and services. Escalation of host and service noti-fications is accomplished by defining host escalations and service escalations in your Object Configuration Overview.
7.8. Notification Escalations 155

Shinken Documentation, Release 2.4
The examples I provide below all make use of service escalation definitions, but host escalations work the same way.Except, of course, that they’re for hosts instead of services. :-)
7.8.2 When Are Notifications Escalated?
Notifications are escalated if and only if one or more escalation definitions matches the current notification that isbeing sent out. If a host or service notification does not have any valid escalation definitions that applies to it, thecontact group(s) specified in either the host group or service definition will be used for the notification. Look at theexample below:
define serviceescalation{host_name webserverservice_description HTTPfirst_notification 3last_notification 5notification_interval 90contact_groups nt-admins,managers
}
define serviceescalation{host_name webserverservice_description HTTPfirst_notification 6last_notification 10notification_interval 60contact_groups nt-admins,managers,everyone
}
Notice that there are “holes” in the notification escalation definitions. In particular, notifications 1 and 2 are nothandled by the escalations, nor are any notifications beyond 10. For the first and second notification, as well as allnotifications beyond the tenth one, the default contact groups specified in the service definition are used. For all theexamples I’ll be using, I’ll be assuming that the default contact groups for the service definition is called nt-admins.
7.8.3 Contact Groups
When defining notification escalations, it is important to keep in mind that any contact groups that were members of“lower” escalations (i.e. those with lower notification number ranges) should also be included in “higher” escalationdefinitions. This should be done to ensure that anyone who gets notified of a problem continues to get notified as theproblem is escalated. Example:
define serviceescalation{host_name webserverservice_description HTTPfirst_notification 3last_notification 5notification_interval 90contact_groups nt-admins,managers
}
define serviceescalation{host_name webserverservice_description HTTPfirst_notification 6last_notification 0notification_interval 60
156 Chapter 7. Advanced Topics

Shinken Documentation, Release 2.4
contact_groups nt-admins,managers,everyone}
The first (or “lowest”) escalation level includes both the nt-admins and managers contact groups. The last (or “high-est”) escalation level includes the nt-admins, managers, and everyone contact groups. Notice that the nt-adminscontact group is included in both escalation definitions. This is done so that they continue to get paged if there arestill problems after the first two service notifications are sent out. The managers contact group first appears in the“lower” escalation definition - they are first notified when the third problem notification gets sent out. We want themanagers group to continue to be notified if the problem continues past five notifications, so they are also included inthe “higher” escalation definition.
7.8.4 Overlapping Escalation Ranges
Notification escalation definitions can have notification ranges that overlap. Take the following example:
define serviceescalation{host_name webserverservice_description HTTPfirst_notification 3last_notification 5notification_interval 20contact_groups nt-admins,managers
}
define serviceescalation{host_name webserverservice_description HTTPfirst_notification 4last_notification 0notification_interval 30contact_groups on-call-support
}
In the example above:
• The nt-admins and managers contact groups get notified on the third notification
• All three contact groups get notified on the fourth and fifth notifications
• Only the on-call-support contact group gets notified on the sixth (or higher) notification
7.8.5 Recovery Notifications
Recovery notifications are slightly different than problem notifications when it comes to escalations. Take the follow-ing example:
define serviceescalation{host_name webserverservice_description HTTPfirst_notification 3last_notification 5notification_interval 20contact_groups nt-admins,managers
}
define serviceescalation{host_name webserver
7.8. Notification Escalations 157

Shinken Documentation, Release 2.4
service_description HTTPfirst_notification 4last_notification 0notification_interval 30contact_groups on-call-support
}
If, after three problem notifications, a recovery notification is sent out for the service, who gets notified? The recoveryis actually the fourth notification that gets sent out. However, the escalation code is smart enough to realize that onlythose people who were notified about the problem on the third notification should be notified about the recovery. Inthis case, the nt-admins and managers contact groups would be notified of the recovery.
7.8.6 Notification Intervals
You can change the frequency at which escalated notifications are sent out for a particular host or service by using thenotification_interval option of the hostgroup or service escalation definition. Example:
define serviceescalation{host_name webserverservice_description HTTPfirst_notification 3last_notification 5notification_interval 45contact_groups nt-admins,managers
}
define serviceescalation{host_name webserverservice_description HTTPfirst_notification 6last_notification 0notification_interval 60contact_groups nt-admins,managers,everyone
}
In this example we see that the default notification interval for the services is 240 minutes (this is the value in theservice definition). When the service notification is escalated on the 3rd, 4th, and 5th notifications, an interval of 45minutes will be used between notifications. On the 6th and subsequent notifications, the notification interval will be60 minutes, as specified in the second escalation definition.
Since it is possible to have overlapping escalation definitions for a particular hostgroup or service, and the fact thata host can be a member of multiple hostgroups, Shinken has to make a decision on what to do as far as the notifica-tion interval is concerned when escalation definitions overlap. In any case where there are multiple valid escalationdefinitions for a particular notification, Shinken will choose the smallest notification interval. Take the followingexample:
define serviceescalation{host_name webserverservice_description HTTPfirst_notification 3last_notification 5notification_interval 45contact_groups nt-admins,managers
}
define serviceescalation{host_name webserver
158 Chapter 7. Advanced Topics
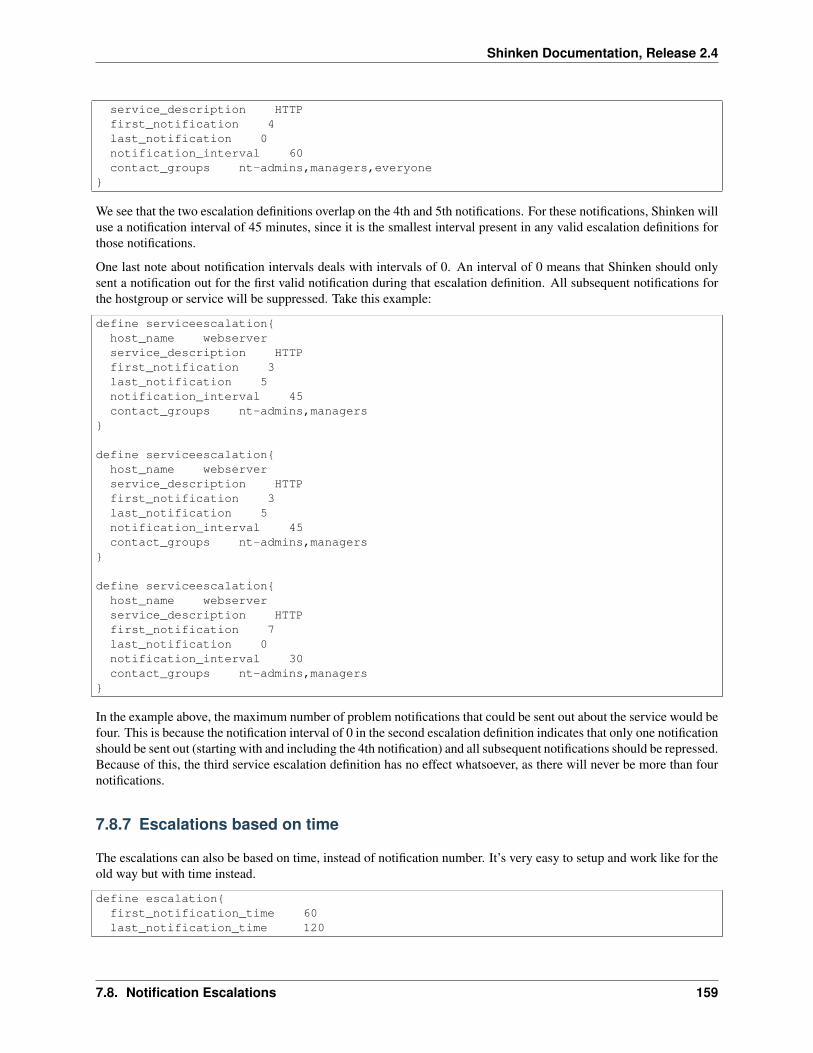
Shinken Documentation, Release 2.4
service_description HTTPfirst_notification 4last_notification 0notification_interval 60contact_groups nt-admins,managers,everyone
}
We see that the two escalation definitions overlap on the 4th and 5th notifications. For these notifications, Shinken willuse a notification interval of 45 minutes, since it is the smallest interval present in any valid escalation definitions forthose notifications.
One last note about notification intervals deals with intervals of 0. An interval of 0 means that Shinken should onlysent a notification out for the first valid notification during that escalation definition. All subsequent notifications forthe hostgroup or service will be suppressed. Take this example:
define serviceescalation{host_name webserverservice_description HTTPfirst_notification 3last_notification 5notification_interval 45contact_groups nt-admins,managers
}
define serviceescalation{host_name webserverservice_description HTTPfirst_notification 3last_notification 5notification_interval 45contact_groups nt-admins,managers
}
define serviceescalation{host_name webserverservice_description HTTPfirst_notification 7last_notification 0notification_interval 30contact_groups nt-admins,managers
}
In the example above, the maximum number of problem notifications that could be sent out about the service would befour. This is because the notification interval of 0 in the second escalation definition indicates that only one notificationshould be sent out (starting with and including the 4th notification) and all subsequent notifications should be repressed.Because of this, the third service escalation definition has no effect whatsoever, as there will never be more than fournotifications.
7.8.7 Escalations based on time
The escalations can also be based on time, instead of notification number. It’s very easy to setup and work like for theold way but with time instead.
define escalation{first_notification_time 60last_notification_time 120
7.8. Notification Escalations 159

Shinken Documentation, Release 2.4
contact_groups nt-admins,managers}
It will use the interval length for the value you set for first/last notification time. Here, it will escalate after 1 hourproblem, and stop at 2 hours. You cannot have in the same escalation time and number escalation rules. But of courseyou can have escalations based on time and escalation based on notification number applied on hosts and services.
7.8.8 Escalations based on time short time
It’s also interesting to see that with escalation based on time, if the notification interval is longer than the next escalationtime, it’s this last value that will be taken into account.
Let take an example where your service got:
define service{notification_interval 1440escalations ToLevel2,ToLevel3
}
Then with the escalations objects:
define escalation {escalation_name ToLevel2first_notification_time 60last_notification_time 120contact_groups level2
}
define escalation {escalation_name ToLevel3first_notification_time 120last_notification_time 0contact_groups level3
}
Here let say you have a problem HARD on the service at t=0. It will notify the level1. The next notification shouldbe at t=1440 minutes, so tomorrow. It’s ok for classic services (too much notification is DANGEROUS!) but not forescalated ones.
Here, at t=60 minutes, the escalation will raise, you will notify the level2 contact group, and then at t=120 minutesyou will notify the level3, and here one a day until they solve it!
So you can put large notification_interval and still have quick escalations times, it’s not a problem :)
7.8.9 Time Period Restrictions
Under normal circumstances, escalations can be used at any time that a notification could normally be sent out for thehost or service. This “notification time window” is determined by the “notification_period” directive in the host orservice definition.
You can optionally restrict escalations so that they are only used during specific time periods by using the “esca-lation_period” directive in the host or service escalation definition. If you use the “escalation_period” directive tospecify a Time Period Definition during which the escalation can be used, the escalation will only be used duringthat time. If you do not specify any “escalation_period” directive, the escalation can be used at any time within the“notification time window” for the host or service.
160 Chapter 7. Advanced Topics

Shinken Documentation, Release 2.4
Escalated notifications are still subject to the normal time restrictions imposed by the “notification_period” directivein a host or service definition, so the timeperiod you specify in an escalation definition should be a subset of that larger“notification time window”.
7.8.10 State Restrictions
If you would like to restrict the escalation definition so that it is only used when the host or service is in a particularstate, you can use the “escalation_options” directive in the host or service escalation definition. If you do not use the“escalation_options” directive, the escalation can be used when the host or service is in any state.
7.9 On-Call Rotations
7.9.1 Introduction
Admins often have to shoulder the burden of answering pagers, cell phone calls, etc. when they least desire them. Noone likes to be woken up at 4 am to fix a problem. But its often better to fix the problem in the middle of the night,rather than face the wrath of an unhappy boss when you stroll in at 9 am the next morning.
For those lucky admins who have a team of gurus who can help share the responsibility of answering alerts, on-callrotations are often setup. Multiple admins will often alternate taking notifications on weekends, weeknights, holidays,etc.
I’ll show you how you can create timeperiod definitions in a way that can facilitate most on-call notification rotations.These definitions won’t handle human issues that will inevitably crop up (admins calling in sick, swapping shifts, orthrowing their pagers into the river), but they will allow you to setup a basic structure that should work the majority ofthe time.
7.9.2 Scenario 1: Holidays and Weekends
Two admins - John and Bob - are responsible for responding to Shinken alerts. John receives all notifications for week-days (and weeknights) - except for holidays - and Bob gets handles notifications during the weekends and holidays.Lucky Bob. Here’s how you can define this type of rotation using timeperiods...
First, define a timeperiod that contains time ranges for holidays:
7.9. On-Call Rotations 161

Shinken Documentation, Release 2.4
define timeperiod{name holidaystimeperiod_name holidaysjanuary 1 00:00-24:00 ; New Year's Day2008-03-23 00:00-24:00 ; Easter (2008)2009-04-12 00:00-24:00 ; Easter (2009)monday -1 may 00:00-24:00 ; Memorial Day (Last Monday in May)july 4 00:00-24:00 ; Independence Daymonday 1 september 00:00-24:00 ; Labor Day (1st Monday in September)thursday 4 november 00:00-24:00 ; Thanksgiving (4th Thursday in November)december 25 00:00-24:00 ; Christmasdecember 31 17:00-24:00 ; New Year's Eve (5pm onwards)
}
Next, define a timeperiod for John’s on-call times that include weekdays and weeknights, but excludes the dates/timesdefined in the holidays timeperiod above:
define timeperiod{timeperiod_name john-oncallmonday 00:00-24:00tuesday 00:00-24:00wednesday 00:00-24:00thursday 00:00-24:00friday 00:00-24:00exclude holidays ; Exclude holiday dates/times defined elsewhere
}
You can now reference this timeperiod in John’s contact definition:
define contact{contact_name john...host_notification_period john-oncallservice_notification_period john-oncall
}
Define a new timeperiod for Bob’s on-call times that include weekends and the dates/times defined in the holidaystimeperiod above:
define timeperiod{timeperiod_name bob-oncallfriday 00:00-24:00saturday 00:00-24:00use holidays ; Also include holiday date/times defined elsewhere
}
You can now reference this timeperiod in Bob’s contact definition:
define contact{contact_name bob...host_notification_period bob-oncallservice_notification_period bob-oncall
}
162 Chapter 7. Advanced Topics
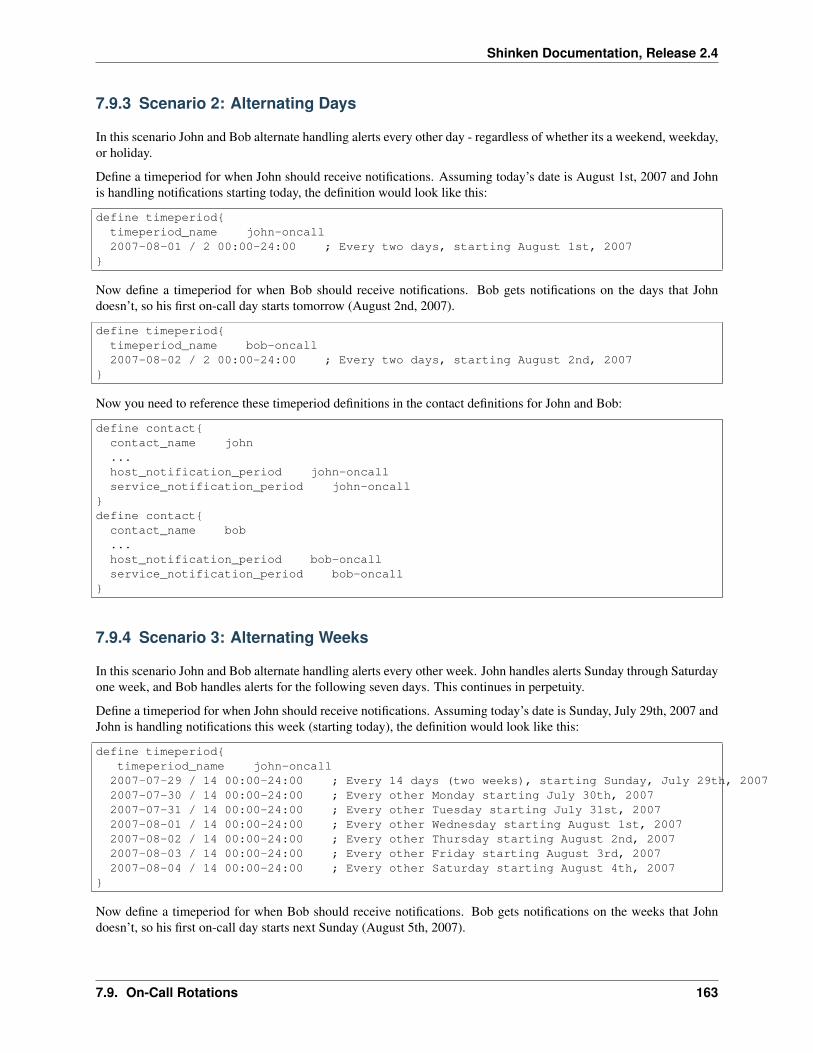
Shinken Documentation, Release 2.4
7.9.3 Scenario 2: Alternating Days
In this scenario John and Bob alternate handling alerts every other day - regardless of whether its a weekend, weekday,or holiday.
Define a timeperiod for when John should receive notifications. Assuming today’s date is August 1st, 2007 and Johnis handling notifications starting today, the definition would look like this:
define timeperiod{timeperiod_name john-oncall2007-08-01 / 2 00:00-24:00 ; Every two days, starting August 1st, 2007
}
Now define a timeperiod for when Bob should receive notifications. Bob gets notifications on the days that Johndoesn’t, so his first on-call day starts tomorrow (August 2nd, 2007).
define timeperiod{timeperiod_name bob-oncall2007-08-02 / 2 00:00-24:00 ; Every two days, starting August 2nd, 2007
}
Now you need to reference these timeperiod definitions in the contact definitions for John and Bob:
define contact{contact_name john...host_notification_period john-oncallservice_notification_period john-oncall
}define contact{
contact_name bob...host_notification_period bob-oncallservice_notification_period bob-oncall
}
7.9.4 Scenario 3: Alternating Weeks
In this scenario John and Bob alternate handling alerts every other week. John handles alerts Sunday through Saturdayone week, and Bob handles alerts for the following seven days. This continues in perpetuity.
Define a timeperiod for when John should receive notifications. Assuming today’s date is Sunday, July 29th, 2007 andJohn is handling notifications this week (starting today), the definition would look like this:
define timeperiod{timeperiod_name john-oncall2007-07-29 / 14 00:00-24:00 ; Every 14 days (two weeks), starting Sunday, July 29th, 20072007-07-30 / 14 00:00-24:00 ; Every other Monday starting July 30th, 20072007-07-31 / 14 00:00-24:00 ; Every other Tuesday starting July 31st, 20072007-08-01 / 14 00:00-24:00 ; Every other Wednesday starting August 1st, 20072007-08-02 / 14 00:00-24:00 ; Every other Thursday starting August 2nd, 20072007-08-03 / 14 00:00-24:00 ; Every other Friday starting August 3rd, 20072007-08-04 / 14 00:00-24:00 ; Every other Saturday starting August 4th, 2007
}
Now define a timeperiod for when Bob should receive notifications. Bob gets notifications on the weeks that Johndoesn’t, so his first on-call day starts next Sunday (August 5th, 2007).
7.9. On-Call Rotations 163

Shinken Documentation, Release 2.4
define timeperiod{timeperiod_name bob-oncall2007-08-05 / 14 00:00-24:00 ; Every 14 days (two weeks), starting Sunday, August 5th, 20072007-08-06 / 14 00:00-24:00 ; Every other Monday starting August 6th, 20072007-08-07 / 14 00:00-24:00 ; Every other Tuesday starting August 7th, 20072007-08-08 / 14 00:00-24:00 ; Every other Wednesday starting August 8th, 20072007-08-09 / 14 00:00-24:00 ; Every other Thursday starting August 9th, 20072007-08-10 / 14 00:00-24:00 ; Every other Friday starting August 10th, 20072007-08-11 / 14 00:00-24:00 ; Every other Saturday starting August 11th, 2007
}
Now you need to reference these timeperiod definitions in the contact definitions for John and Bob:
define contact{contact_name mjohn...host_notification_period john-oncallservice_notification_period john-oncall
}define contact{
contact_name bob...host_notification_period bob-oncallservice_notification_period bob-oncall
}
7.9.5 Scenario 4: Vacation Days
In this scenarios, John handles notifications for all days except those he has off. He has several standing days off eachmonth, as well as some planned vacations. Bob handles notifications when John is on vacation or out of the office.
First, define a timeperiod that contains time ranges for John’s vacation days and days off:
define timeperiod{name john-out-of-officetimeperiod_name john-out-of-officeday 15 00:00-24:00 ; 15th day of each monthday -1 00:00-24:00 ; Last day of each month (28th, 29th, 30th, or 31st)day -2 00:00-24:00 ; 2nd to last day of each month (27th, 28th, 29th, or 30th)january 2 00:00-24:00 ; January 2nd each yearjune 1 - july 5 00:00-24:00 ; Yearly camping trip (June 1st - July 5th)2007-11-01 - 2007-11-10 00:00-24:00 ; Vacation to the US Virgin Islands (November 1st-10th, 2007)
}
Next, define a timeperiod for John’s on-call times that excludes the dates/times defined in the timeperiod above:
define timeperiod{timeperiod_name john-oncallmonday 00:00-24:00tuesday 00:00-24:00wednesday 00:00-24:00thursday 00:00-24:00friday 00:00-24:00exclude john-out-of-office ; Exclude dates/times John is out
}
You can now reference this timeperiod in John’s contact definition:
164 Chapter 7. Advanced Topics
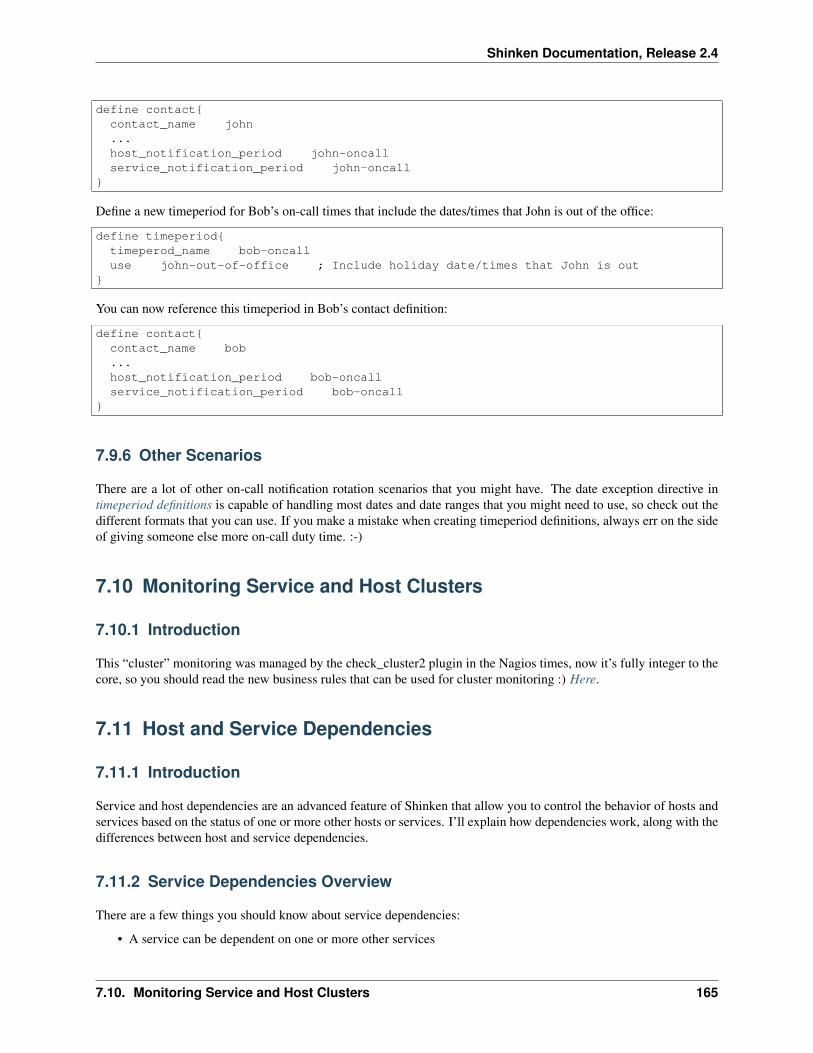
Shinken Documentation, Release 2.4
define contact{contact_name john...host_notification_period john-oncallservice_notification_period john-oncall
}
Define a new timeperiod for Bob’s on-call times that include the dates/times that John is out of the office:
define timeperiod{timeperod_name bob-oncalluse john-out-of-office ; Include holiday date/times that John is out
}
You can now reference this timeperiod in Bob’s contact definition:
define contact{contact_name bob...host_notification_period bob-oncallservice_notification_period bob-oncall
}
7.9.6 Other Scenarios
There are a lot of other on-call notification rotation scenarios that you might have. The date exception directive intimeperiod definitions is capable of handling most dates and date ranges that you might need to use, so check out thedifferent formats that you can use. If you make a mistake when creating timeperiod definitions, always err on the sideof giving someone else more on-call duty time. :-)
7.10 Monitoring Service and Host Clusters
7.10.1 Introduction
This “cluster” monitoring was managed by the check_cluster2 plugin in the Nagios times, now it’s fully integer to thecore, so you should read the new business rules that can be used for cluster monitoring :) Here.
7.11 Host and Service Dependencies
7.11.1 Introduction
Service and host dependencies are an advanced feature of Shinken that allow you to control the behavior of hosts andservices based on the status of one or more other hosts or services. I’ll explain how dependencies work, along with thedifferences between host and service dependencies.
7.11.2 Service Dependencies Overview
There are a few things you should know about service dependencies:
• A service can be dependent on one or more other services
7.10. Monitoring Service and Host Clusters 165

Shinken Documentation, Release 2.4
• A service can be dependent on services which are not associated with the same host
• Service dependencies are not inherited (unless specifically configured to)
• Service dependencies can be used to cause service check execution and service notifications to be suppressedunder different circumstances (OK, WARNING, UNKNOWN, and/or CRITICAL states)
• Service dependencies might only be valid during specific timeperiods
7.11.3 Defining Service Dependencies
First, the basics. You create service dependencies by adding service dependency definitions in your object configfile(s). In each definition you specify the dependent service, the service you are depending on, and the criteria (if any)that cause the execution and notification dependencies to fail (these are described later).
You can create several dependencies for a given service, but you must add a separate service dependency definition foreach dependency you create.
7.11.4 Example Service Dependencies
The image below shows an example logical layout of service notification and execution dependencies. Differentservices are dependent on other services for notifications and check execution.
In this example, the dependency definitions for Service F on Host C would be defined as follows:
define servicedependency{host_name Host B
166 Chapter 7. Advanced Topics

Shinken Documentation, Release 2.4
service_description Service Ddependent_host_name Host Cdependent_service_description Service Fexecution_failure_criteria onotification_failure_criteria w,u
}
define servicedependency{host_name Host Bservice_description Service Edependent_host_name Host Cdependent_service_description Service Fexecution_failure_criteria nnotification_failure_criteria w,u,c
}
define servicedependency{host_name Host Bservice_description Service Cdependent_host_name Host Cdependent_service_description Service Fexecution_failure_criteria wnotification_failure_criteria c
}
The other dependency definitions shown in the image above would be defined as follows:
define servicedependency{host_name Host Aservice_description Service Adependent_host_name Host Bdependent_service_description Service Dexecution_failure_criteria unotification_failure_criteria n
}
define servicedependency{host_name Host Aservice_description Service Bdependent_host_name Host Bdependent_service_description Service Eexecution_failure_criteria w,unotification_failure_criteria c
}
define servicedependency{host_name Host Bservice_description Service Cdependent_host_name Host Bdependent_service_description Service Eexecution_failure_criteria nnotification_failure_criteria w,u,c
}
7.11. Host and Service Dependencies 167

Shinken Documentation, Release 2.4
7.11.5 How Service Dependencies Are Tested
Before Shinken executes a service check or sends notifications out for a service, it will check to see if the servicehas any dependencies. If it doesn’t have any dependencies, the check is executed or the notification is sent out as itnormally would be. If the service does have one or more dependencies, Shinken will check each dependency entry asfollows:
• Shinken gets the current status of the service that is being depended upon.
• Shinken compares the current status of the service that is being depended upon against either the execution ornotification failure options in the dependency definition (whichever one is relevant at the time).
• If the current status of the service that is being depended upon matches one of the failure options, the dependencyis said to have failed and Shinken will break out of the dependency check loop.
• If the current state of the service that is being depended upon does not match any of the failure options for thedependency entry, the dependency is said to have passed and Shinken will go on and check the next dependencyentry.
This cycle continues until either all dependencies for the service have been checked or until one dependency checkfails.
• One important thing to note is that by default, Shinken will use the most current hard state of the service(s) thatis/are being depended upon when it does the dependency checks. If you want Shinken to use the most currentstate of the services (regardless of whether its a soft or hard state), enable the soft_state_dependencies option.
7.11.6 Execution Dependencies
Execution dependencies are used to restrict when active checks of a service can be performed. Passive checks are notrestricted by execution dependencies.
If all of the execution dependency tests for the service passed, Shinken will execute the check of the service as itnormally would. If even just one of the execution dependencies for a service fails, Shinken will temporarily preventthe execution of checks for that (dependent) service. At some point in the future the execution dependency tests forthe service may all pass. If this happens, Shinken will start checking the service again as it normally would. Moreinformation on the check scheduling logic can be found here.
In the example above, Service E would have failed execution dependencies if Service B is in a WARNING or UN-KNOWN state. If this was the case, the service check would not be performed and the check would be scheduled for(potential) execution at a later time.
7.11.7 Notification Dependencies
If all of the notification dependency tests for the service passed, Shinken will send notifications out for the service as itnormally would. If even just one of the notification dependencies for a service fails, Shinken will temporarily repressnotifications for that (dependent) service. At some point in the future the notification dependency tests for the servicemay all pass. If this happens, Shinken will start sending out notifications again as it normally would for the service.More information on the notification logic can be found here.
In the example above, Service F would have failed notification dependencies if Service C is in a CRITICAL state,and/or Service D is in a WARNING or UNKNOWN state, and/or/ if Service E is in a WARNING, UNKNOWN, orCRITICAL state. If this were the case, notifications for the service would not be sent out.
168 Chapter 7. Advanced Topics

Shinken Documentation, Release 2.4
7.11.8 Dependency Inheritance
As mentioned before, service dependencies are not inherited by default. In the example above you can see that ServiceF is dependent on Service E. However, it does not automatically inherit Service E’s dependencies on Service B andService C. In order to make Service F dependent on Service C we had to add another service dependency definition.There is no dependency definition for Service B, so Service F is not dependent on Service B.
If you do wish to make service dependencies inheritable, you must use the inherits_parent directive in the servicedependency definition. When this directive is enabled, it indicates that the dependency inherits dependencies of theservice that is being depended upon (also referred to as the master service). In other words, if the master service isdependent upon other services and any one of those dependencies fail, this dependency will also fail.
In the example above, imagine that you want to add a new dependency for service F to make it dependent on serviceA. You could create a new dependency definition that specified service F as the dependent service and service A asbeing the master service (i.e. the service that is being dependend on). You could alternatively modify the dependencydefinition for services D and F to look like this:
define servicedependency{host_name Host Bservice_description Service Ddependent_host_name Host Cdependent_service_description Service Fexecution_failure_criteria onotification_failure_criteria ninherits_parent 1
}
Since the inherits_parent directive is enabled, the dependency between services A and D will be tested when thedependency between services F and D are being tested.
Dependencies can have multiple levels of inheritance. If the dependency definition between A and D had its inher-its_parent directive enable and service A was dependent on some other service (let’s call it service G), the service Fwould be dependent on services D, A, and G (each with potentially different criteria).
7.11.9 Host Dependencies
As you’d probably expect, host dependencies work in a similar fashion to service dependencies. The difference is thatthey’re for hosts, not services.
Do not confuse host dependencies with parent/child host relationships. You should be using parent/child host rela-tionships (defined with the parents directive in host definitions) for most cases, rather than host dependencies. Adescription of how parent/child host relationships work can be found in the documentation on network reachability.
Here are the basics about host dependencies:
• A host can be dependent on one or more other host
• Host dependencies are not inherited (unless specifically configured to)
• Host dependencies can be used to cause host check execution and host notifications to be suppressed underdifferent circumstances (UP, DOWN, and/or UNREACHABLE states)
• Host dependencies might only be valid during specific timeperiods
7.11.10 Example Host Dependencies
The image below shows an example of the logical layout of host notification dependencies. Different hosts are depen-dent on other hosts for notifications.
7.11. Host and Service Dependencies 169
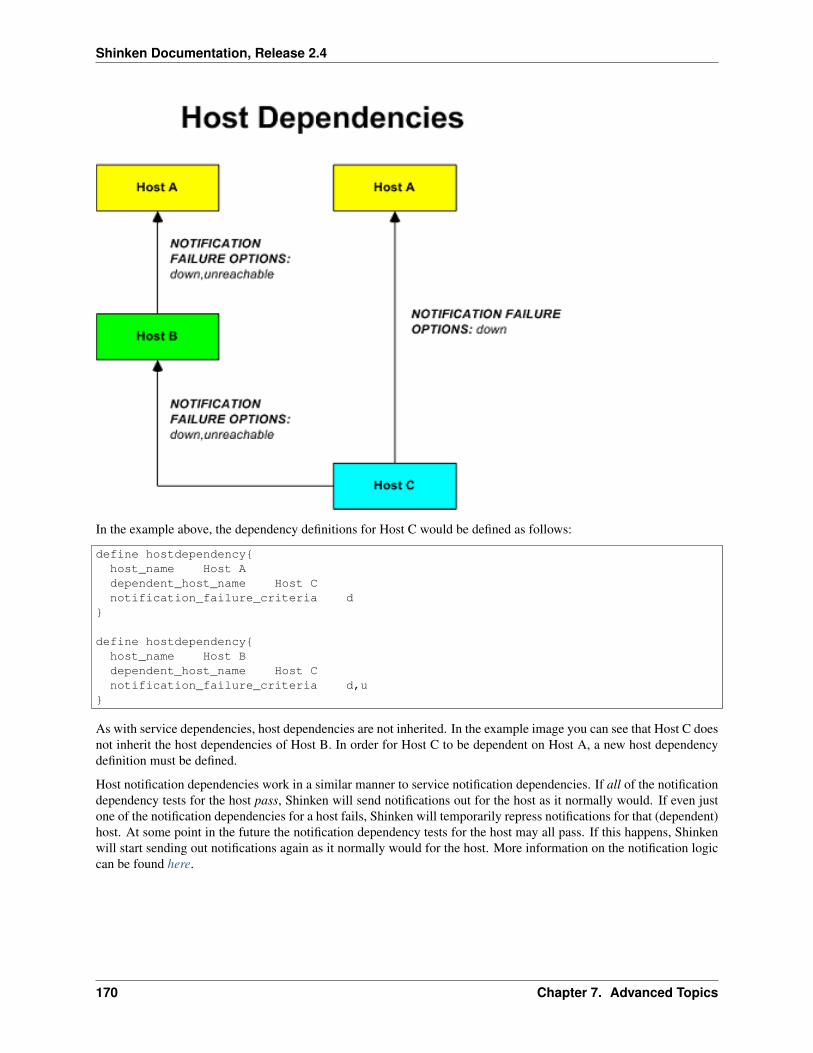
Shinken Documentation, Release 2.4
In the example above, the dependency definitions for Host C would be defined as follows:
define hostdependency{host_name Host Adependent_host_name Host Cnotification_failure_criteria d
}
define hostdependency{host_name Host Bdependent_host_name Host Cnotification_failure_criteria d,u
}
As with service dependencies, host dependencies are not inherited. In the example image you can see that Host C doesnot inherit the host dependencies of Host B. In order for Host C to be dependent on Host A, a new host dependencydefinition must be defined.
Host notification dependencies work in a similar manner to service notification dependencies. If all of the notificationdependency tests for the host pass, Shinken will send notifications out for the host as it normally would. If even justone of the notification dependencies for a host fails, Shinken will temporarily repress notifications for that (dependent)host. At some point in the future the notification dependency tests for the host may all pass. If this happens, Shinkenwill start sending out notifications again as it normally would for the host. More information on the notification logiccan be found here.
170 Chapter 7. Advanced Topics

Shinken Documentation, Release 2.4
7.12 State Stalking
7.12.1 Introduction
State “stalking” is a feature which is probably not going to used by most users. When enabled, it allows you to logchanges in the output service and host checks even if the state of the host or service does not change. When stalkingis enabled for a particular host or service, Shinken will watch that host or service very carefully and log any changesit sees in the output of check results. As you’ll see, it can be very helpful to you in later analysis of the log files.
7.12.2 How Does It Work?
Under normal circumstances, the result of a host or service check is only logged if the host or service has changedstate since it was last checked. There are a few exceptions to this, but for the most part, that’s the rule.
If you enable stalking for one or more states of a particular host or service, Shinken will log the results of the hostor service check if the output from the check differs from the output from the previous check. Take the followingexample of eight consecutive checks of a service:
Service Check #: Service State: Service Check Out-put:
Logged Normally Logged With Stalking
x OK RAID array optimal • •
x+1 OK RAID array optimal • •
x+2 WARNING RAID array degraded(1 drive bad, 1 hotspare rebuilding)
x+3 CRITICAL RAID array degraded(2 drives bad, 1 hostspare online, 1 hotspare rebuilding)
x+4 CRITICAL RAID array degraded(3 drives bad, 2 hotspares online)
•
x+5 CRITICAL RAID array failed •
x+6 CRITICAL RAID array failed • •
x+7 CRITICAL RAID array failed • •
Given this sequence of checks, you would normally only see two log entries for this catastrophe. The first one wouldoccur at service check x+2 when the service changed from an OK state to a WARNING state. The second log entrywould occur at service check x+3 when the service changed from a WARNING state to a CRITICAL state.
For whatever reason, you may like to have the complete history of this catastrophe in your log files. Perhaps to helpexplain to your manager how quickly the situation got out of control, perhaps just to laugh at it over a couple of drinksat the local pub...
7.12. State Stalking 171

Shinken Documentation, Release 2.4
Well, if you had enabled stalking of this service for CRITICAL states, you would have events at x+4 and x+5 loggedin addition to the events at x+2 and x+3. Why is this? With state stalking enabled, Shinken would have examined theoutput from each service check to see if it differed from the output of the previous check. If the output differed andthe state of the service didn’t change between the two checks, the result of the newer service check would get logged.
A similar example of stalking might be on a service that checks your web server. If the check_http plugin first returnsa WARNING state because of a 404 error and on subsequent checks returns a WARNING state because of a particularpattern not being found, you might want to know that. If you didn’t enable state stalking for WARNING states of theservice, only the first WARNING state event (the 404 error) would be logged and you wouldn’t have any idea (lookingback in the archived logs) that future WARNING states were not due to a 404, but rather some text pattern that couldnot be found in the returned web page.
7.12.3 Should I Enable Stalking?
First, you must decide if you have a real need to analyze archived log data to find the exact cause of a problem. Youmay decide you need this feature for some hosts or services, but not for all. You may also find that you only have aneed to enable stalking for some host or service states, rather than all of them. For example, you may decide to enablestalking for WARNING and CRITICAL states of a service, but not for OK and UNKNOWN states.
The decision to to enable state stalking for a particular host or service will also depend on the plugin that you use tocheck that host or service. If the plugin always returns the same text output for a particular state, there is no reason toenable stalking for that state.
7.12.4 How Do I Enable Stalking?
You can enable state stalking for hosts and services by using the stalking_options directive in host and service defini-tions.
7.12.5 How Does Stalking Differ From Volatile Services?
Volatile services are similar, but will cause notifications and event handlers to run. Stalking is purely for loggingpurposes.
7.12.6 Caveats
You should be aware that there are some potential pitfalls with enabling stalking. These all relate to the reportingfunctions found in various CGIs (histogram, alert summary, etc.). Because state stalking will cause additional alertentries to be logged, the data produced by the reports will show evidence of inflated numbers of alerts.
As a general rule, I would suggest that you not enable stalking for hosts and services without thinking things through.Still, it’s there if you need and want it.
7.13 Performance Data
7.13.1 Introduction
Shinken is designed to allow plugins to return optional performance data in addition to normal status data, as well asallow you to pass that performance data to external applications for processing. A description of the different types ofperformance data, as well as information on how to go about processing that data is described below...
172 Chapter 7. Advanced Topics

Shinken Documentation, Release 2.4
7.13.2 Types of Performance Data
There are two basic categories of performance data that can be obtained from Shinken:
• Check performance data
• Plugin performance data
Check performance data is internal data that relates to the actual execution of a host or service check. This mightinclude things like service check latency (i.e. how “late” was the service check from its scheduled execution time)and the number of seconds a host or service check took to execute. This type of performance data is available for allchecks that are performed. The $HOSTEXECUTIONTIME$ and $SERVICEEXECUTIONTIME$ macros can be usedto determine the number of seconds a host or service check was running and the $HOSTLATENCY$ and $SERVICE-LATENCY$ macros can be used to determine how “late” a regularly-scheduled host or service check was.
Plugin performance data is external data specific to the plugin used to perform the host or service check. Plugin-specific data can include things like percent packet loss, free disk space, processor load, number of current users, etc. -basically any type of metric that the plugin is measuring when it executes. Plugin-specific performance data is optionaland may not be supported by all plugins. Plugin-specific performance data (if available) can be obtained by using the$HOSTPERFDATA$ and $SERVICEPERFDATA$ macros. Read on for more information on how plugins can returnperformance data to Shinken for inclusion in the $HOSTPERFDATA$ and $SERVICEPERFDATA$ macros.
7.13.3 Plugin Performance Data
At a minimum, Shinken plugins must return a single line of human-readable text that indicates the status of some typeof measurable data. For example, the check_ping plugin might return a line of text like the following:
PING ok - Packet loss = 0%, RTA = 0.80 ms
With this simple type of output, the entire line of text is available in the $HOSTOUTPUT$ or $SERVICEOUTPUT$macros (depending on whether this plugin was used as a host check or service check).
Plugins can return optional performance data in their output by sending the normal, human-readable text string thatthey usually would, followed by a pipe character (|), and then a string containing one or more performance data metrics.Let’s take the check_ping plugin as an example and assume that it has been enhanced to return percent packet lossand average round trip time as performance data metrics. Sample output from the plugin might look like this:
PING ok - Packet loss = 0%, RTA = 0.80 ms | percent_packet_loss=0, rta=0.80
When Shinken sees this plugin output format it will split the output into two parts:
• Everything before the pipe character is considered to be the normal” plugin output and will be stored in eitherthe $HOSTOUTPUT$ or $SERVICEOUTPUT$ macro
• Everything after the pipe character is considered to be the plugin-specific performance data and will be storedin the $HOSTPERFDATA$ or $SERVICEPERFDATA$ macro
In the example above, the $HOSTOUTPUT$ or $SERVICEOUTPUT$ macro would contain “PING ok - Packet loss =0%, RTA = 0.80 ms” (without quotes) and the $HOSTPERFDATA$ or $SERVICEPERFDATA$ macro would contain“percent_packet_loss=0, rta=0.80” (without quotes).
Multiple lines of performace data (as well as normal text output) can be obtained from plugins, as described in theplugin API documentation.
The Shinken daemon doesn’t directly process plugin performance data, so it doesn’t really care what the performancedata looks like. There aren’t really any inherent limitations on the format or content of the performance data. However,if you are using an external addon to process the performance data (i.e. PerfParse), the addon may be expecting thatthe plugin returns performance data in a specific format. Check the documentation that comes with the addon for moreinformation.
7.13. Performance Data 173

Shinken Documentation, Release 2.4
7.13.4 Processing Performance Data
If you want to process the performance data that is available from Shinken and the plugins, you’ll need to do thefollowing:
• Enable the process_performance_data option.
• Configure Shinken so that performance data is either written to files and/or processed by executing commands.
Read on for information on how to process performance data by writing to files or executing commands.
7.13.5 Processing Performance Data Using Commands
The most flexible way to process performance data is by having Shinken execute commands (that you specify) to pro-cess or redirect the data for later processing by external applications. The commands that Shinken executes to processhost and service performance data are determined by the host_perfdata_command and service_perfdata_commandoptions, respectively.
An example command definition that redirects service check performance data to a text file for later processing byanother application is shown below:
define command{command_name store-service-perfdatacommand_line /bin/echo -e "$LASTSERVICECHECK$\t$HOSTNAME$\t$SERVICEDESC$\t$SERVICESTATE$\t$SERVICEATTEMPT$\t$SERVICESTATETYPE$\t$SERVICEEXECUTIONTIME$\t$SERVICELATENCY$\t$SERVICEOUTPUT$\t$SERVICEPERFDATA$" >> /var/lib/shinken/service-perfdata.dat
}
This method, while flexible, comes with a relatively high CPU overhead. If you’re processing performance data fora large number of hosts and services, you’ll probably want Shinken to write performance data to files instead. Thismethod is described in the next section.
7.13.6 Writing Performance Data To Files
You can have Shinken write all host and service performance data directly to text files using the host_perfdata_fileand service_perfdata_file options. The format in which host and service performance data is written to those files isdetermined by the host_perfdata_file_template and service_perfdata_file_template options.
An example file format template for service performance data might look like this:
service_perfdata_file_template=[SERVICEPERFDATA]\t$TIMET$\t$HOSTNAME$\t$SERVICEDESC$\t$SERVICEEXECUTIONTIME$\t$SERVICELATENCY$\t$SERVICEOUTPUT$\t$SERVICEPERFDATA$
By default, the text files will be opened in “append” mode. If you need to change the modes to “write” or “non-blockingread/write” (useful when writing to pipes), you can use the host_perfdata_file_mode and service_perfdata_file_modeoptions.
Additionally, you can have Shinken periodically execute commands to periocially process the per-formance data files (e.g. rotate them) using the host_perfdata_file_processing_command and ser-vice_perfdata_file_processing_command options. The interval at which these commands are executed are governedby the host_perfdata_file_processing_interval and service_perfdata_file_processing_interval options, respectively.
174 Chapter 7. Advanced Topics
Shinken Documentation, Release 2.4
7.14 Scheduled Downtime
7.14.1 Introduction
Shinken allows you to schedule periods of planned downtime for hosts and service that you’re monitoring. This isuseful in the event that you actually know you’re going to be taking a server down for an upgrade, etc.
7.14.2 Scheduling Downtime
You can schedule downtime with your favorite UI or as an external command in cli.
Once you schedule downtime for a host or service, Shinken will add a comment to that host/service indicating that itis scheduled for downtime during the period of time you indicated. When that period of downtime passes, Shinkenwill automatically delete the comment that it added. Nice, huh?
7.14.3 Fixed vs. Flexible Downtime
When you schedule downtime for a host or service through the web interface you’ll be asked if the downtime is fixedor flexible. Here’s an explanation of how “fixed” and “flexible” downtime differs:
“Fixed” downtime starts and stops at the exact start and end times that you specify when you schedule it. Okay, thatwas easy enough...
“Flexible” downtime is intended for times when you know that a host or service is going to be down for X minutes(or hours), but you don’t know exactly when that’ll start. When you schedule flexible downtime, Shinken will startthe scheduled downtime sometime between the start and end times you specified. The downtime will last for as longas the duration you specified when you scheduled the downtime. This assumes that the host or service for whichyou scheduled flexible downtime either goes down (or becomes unreachable) or goes into a non-OK state sometimebetween the start and end times you specified. The time at which a host or service transitions to a problem statedetermines the time at which Shinken actually starts the downtime. The downtime will then last for the duration youspecified, even if the host or service recovers before the downtime expires. This is done for a very good reason. Aswe all know, you might think you’ve got a problem fixed, but then have to restart a server ten times before it actuallyworks right. Smart, eh?
7.14. Scheduled Downtime 175

Shinken Documentation, Release 2.4
7.14.4 Triggered Downtime
When scheduling host or service downtime you have the option of making it “triggered” downtime. What is triggereddowntime, you ask? With triggered downtime the start of the downtime is triggered by the start of some other scheduledhost or service downtime. This is extremely useful if you’re scheduling downtime for a large number or hosts orservices and the start time of the downtime period depends on the start time of another downtime entry. For instance,if you schedule flexible downtime for a particular host (because its going down for maintenance), you might want toschedule triggered downtime for all of that hosts’s “children”.
7.14.5 How Scheduled Downtime Affects Notifications
When a host or service is in a period of scheduled downtime, Shinken will not allow normal notifications to be sentout for the host or service. However, a “DOWNTIMESTART” notification will get sent out for the host or service,which will serve to put any admins on notice that they won’t receive upcoming problem alerts.
When the scheduled downtime is over, Shinken will allow normal notifications to be sent out for the host or serviceagain. A “DOWNTIMEEND” notification will get sent out notifying admins that the scheduled downtime is over, andthey will start receiving normal alerts again.
If the scheduled downtime is cancelled prematurely (before it expires), a “DOWNTIMECANCELLED” notificationwill get sent out to the appropriate admins.
7.14.6 Overlapping Scheduled Downtime
I like to refer to this as the “Oh crap, its not working” syndrome. You know what I’m talking about. You take a serverdown to perform a “routine” hardware upgrade, only to later realize that the OS drivers aren’t working, the RAIDarray blew up, or the drive imaging failed and left your original disks useless to the world. Moral of the story is thatany routine work on a server is quite likely to take three or four times as long as you had originally planned...
Let’s take the following scenario:
• You schedule downtime for host A from 7:30pm-9:30pm on a Monday
• You bring the server down about 7:45pm Monday evening to start a hard drive upgrade
• After wasting an hour and a half battling with SCSI errors and driver incompatibilities, you finally get themachine to boot up
• At 9:15 you realize that one of your partitions is either hosed or doesn’t seem to exist anywhere on the drive
• Knowing you’re in for a long night, you go back and schedule additional downtime for host A from 9:20pmMonday evening to 1:30am Tuesday Morning.
If you schedule overlapping periods of downtime for a host or service (in this case the periods were 7:40pm-9:30pmand 9:20pm-1:30am), Shinken will wait until the last period of scheduled downtime is over before it allows notifica-tions to be sent out for that host or service. In this example notifications would be suppressed for host A until 1:30amTuesday morning.
7.15 Adaptive Monitoring
7.15.1 Introduction
Shinken allows you to change certain commands and host and service check attributes during runtime. I’ll refer to thisfeature as “adaptive monitoring”. Please note that the adaptive monitoring features found in Shinken will probably notbe of much use to 99% of users, but they do allow you to do some neat things.
176 Chapter 7. Advanced Topics

Shinken Documentation, Release 2.4
7.15.2 What Can Be Changed?
The following host/service check attributes can be changed during runtime:
• Check command (and command arguments)
• Check interval
• Max check attempts
• Check timeperiod
• Event handler command (and command arguments)
The following global attributes can be changed during runtime:
• Global host event handler command (and command arguments)
• Global service event handler command (and command arguments)
7.15.3 External Commands For Adaptive Monitoring
In order to change global or host- or service-specific attributes during runtime, you must submit the appropriateexternal command to Shinken. The table below lists the different attributes that may be changed during runtime, alongwith the external command to accomplish the job.
A full listing of external commands that can be used for adaptive monitoring (along with examples of how to use them)can be found online at the following URL: http://www.nagios.org/developerinfo/externalcommands/
• When changing check commands, check timeperiods, or event handler commands, it is important to note thatthe new values for these options must have been defined before shinken was started. Any request to change acommand or timeperiod to one which had not been defined when it was started is ignored.
• You can specify command arguments along with the actual command name - just separate individual argumentsfrom the command name (and from each other) using bang (!) characters. More information on how argumentsin command definitions are processed during runtime can be found in the documentation on macros.
7.16 Predictive Dependency Checks
Note: The predictive dependency check functionality is not managed from now in Shinken.
7.16.1 Introduction
Host and service dependencies can be defined to allow you greater control over when checks are executed and whennotifications are sent out. As dependencies are used to control basic aspects of the monitoring process, it is crucial toensure that status information used in the dependency logic is as up to date as possible.
Shinken allows you to enable predictive dependency checks for hosts and services to ensure that the dependencylogic will have the most up-to-date status information when it comes to making decisions about whether to send outnotifications or allow active checks of a host or service.
7.16. Predictive Dependency Checks 177
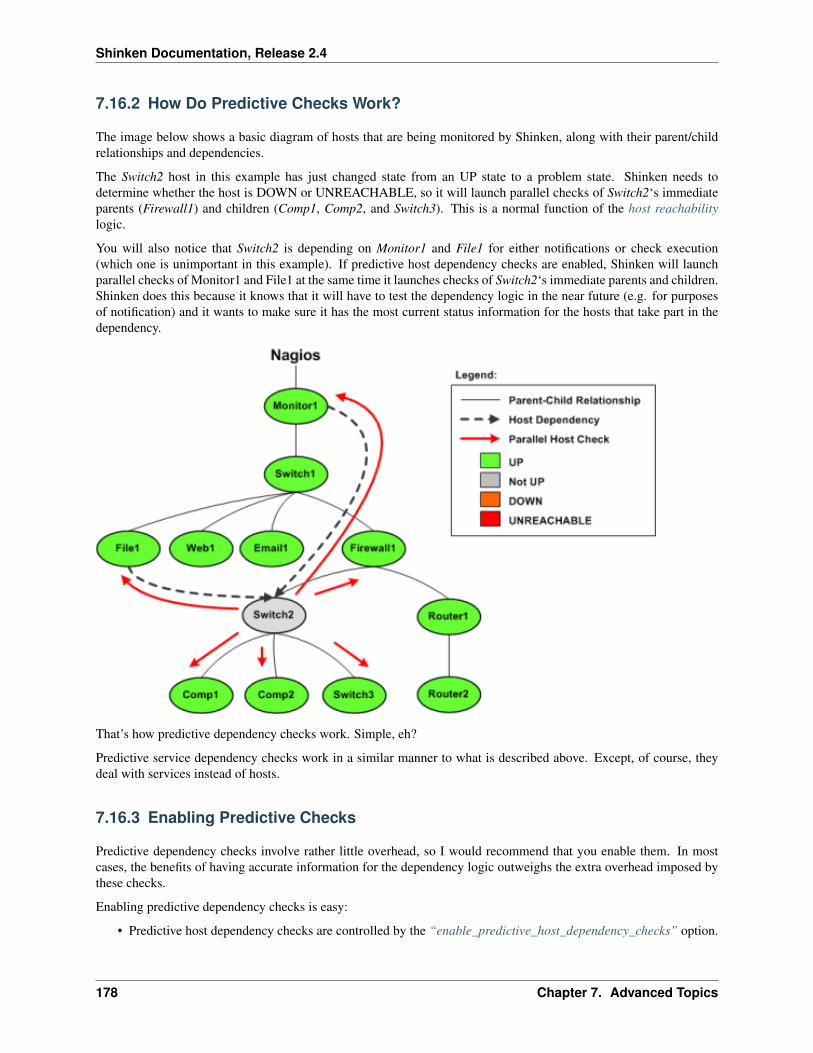
Shinken Documentation, Release 2.4
7.16.2 How Do Predictive Checks Work?
The image below shows a basic diagram of hosts that are being monitored by Shinken, along with their parent/childrelationships and dependencies.
The Switch2 host in this example has just changed state from an UP state to a problem state. Shinken needs todetermine whether the host is DOWN or UNREACHABLE, so it will launch parallel checks of Switch2‘s immediateparents (Firewall1) and children (Comp1, Comp2, and Switch3). This is a normal function of the host reachabilitylogic.
You will also notice that Switch2 is depending on Monitor1 and File1 for either notifications or check execution(which one is unimportant in this example). If predictive host dependency checks are enabled, Shinken will launchparallel checks of Monitor1 and File1 at the same time it launches checks of Switch2‘s immediate parents and children.Shinken does this because it knows that it will have to test the dependency logic in the near future (e.g. for purposesof notification) and it wants to make sure it has the most current status information for the hosts that take part in thedependency.
That’s how predictive dependency checks work. Simple, eh?
Predictive service dependency checks work in a similar manner to what is described above. Except, of course, theydeal with services instead of hosts.
7.16.3 Enabling Predictive Checks
Predictive dependency checks involve rather little overhead, so I would recommend that you enable them. In mostcases, the benefits of having accurate information for the dependency logic outweighs the extra overhead imposed bythese checks.
Enabling predictive dependency checks is easy:
• Predictive host dependency checks are controlled by the “enable_predictive_host_dependency_checks” option.
178 Chapter 7. Advanced Topics

Shinken Documentation, Release 2.4
• Predictive service dependency checks are controlled by the “enable_predictive_service_dependency_checks”option.
7.16.4 Cached Checks
Predictive dependency checks are on-demand checks and are therefore subject to the rules of cached checks. Cachedchecks can provide you with performance improvements by allowing Shinken to forgo running an actual host or servicecheck if it can use a relatively recent check result instead. More information on cached checks can be found here.
7.17 Cached Checks
7.17.1 Introduction
The performance of Shinken’s monitoring logic can be significantly improved by implementing the use of cachedchecks. Cached checks allow Shinken to forgo executing a host or service check command if it determines a relativelyrecent check result will do instead.
7.17.2 For On-Demand Checks Only
Regularly scheduled host and service checks will not see a performance improvement with use of cached checks.Cached checks are only useful for improving the performance of on-demand host and service checks. Scheduledchecks help to ensure that host and service states are updated regularly, which may result in a greater possibility theirresults can be used as cached checks in the future.
For reference, on-demand host checks occur...
• When a service associated with the host changes state.
• As needed as part of the host reachability logic.
• As needed for host dependency checks.
And on-demand service checks occur...
7.17. Cached Checks 179

Shinken Documentation, Release 2.4
• As needed for service dependency checks.
Unless you make use of service dependencies, Shinken will not be able to use cached check results to improve theperformance of service checks. Don’t worry about that - its normal. Cached host checks are where the big performanceimprovements lie, and everyone should see a benefit there.
7.17.3 How Caching Works
When Shinken needs to perform an on-demand host or service check, it will make a determination as to whether it canused a cached check result or if it needs to perform an actual check by executing a plugin. It does this by checking tosee if the last check of the host or service occurred within the last X seconds, where X is the cached host or servicecheck horizon.
If the last check was performed within the timeframe specified by the cached check horizon variable, Shinken will usethe result of the last host or service check and will not execute a new check. If the host or service has not yet beenchecked, or if the last check falls outside of the cached check horizon timeframe, Shinken will execute a new host orservice check by running a plugin.
7.17.4 What This Really Means
Shinken performs on-demand checks because it need to know the current state of a host or service at that exact momentin time. Utilizing cached checks allows you to make Shinken think that recent check results are “good enough” fordetermining the current state of hosts, and that it doesn’t need to go out and actually re-check the status of that host orservice.
The cached check horizon tells Shinken how recent check results must be in order to reliably reflect the current stateof a host or service. For example, with a cached check horizon of 30 seconds, you are telling Shinken that if a host’sstate was checked sometime in the last 30 seconds, the result of that check should still be considered the current stateof the host.
The number of cached check results that Shinken can use versus the number of on-demand checks it has to actuallyexecute can be considered the cached check “hit” rate. By increasing the cached check horizon to equal the regularcheck interval of a host, you could theoretically achieve a cache hit rate of 100%. In that case all on-demand checksof that host would use cached check results. What a performance improvement! But is it really? Probably not.
180 Chapter 7. Advanced Topics

Shinken Documentation, Release 2.4
The reliability of cached check result information decreases over time. Higher cache hit rates require that previouscheck results are considered “valid” for longer periods of time. Things can change quickly in any network scenario,and there’s no guarantee that a server that was functioning properly 30 seconds ago isn’t on fire right now. There’s thetradeoff - reliability versus speed. If you have a large cached check horizon, you risk having unreliable check resultvalues being used in the monitoring logic.
Shinken will eventually determine the correct state of all hosts and services, so even if cached check results prove tounreliably represent their true value, it will only work with incorrect information for a short period of time. Even shortperiods of unreliable status information can prove to be a nuisance for admins, as they may receive notifications aboutproblems which no longer exist.
There is no standard cached check horizon or cache hit rate that will be acceptable to every users. Some people willwant a short horizon timeframe and a low cache hit rate, while others will want a larger horizon timeframe and a largercache hit rate (with a low reliability rate). Some users may even want to disable cached checks altogether to obtaina 100% reliability rate. Testing different horizon timeframes, and their effect on the reliability of status information,is the only want that an individual user will find the “right” value for their situation. More information on this isdiscussed below.
7.17.5 Configuration Variables
The following variables determine the timeframes in which a previous host or service check result may be used as acached host or service check result:
• The cached_host_check_horizon variable controls cached host checks.
• The cached_service_check_horizon variable controls cached service checks.
7.17.6 Optimizing Cache Effectiveness
In order to make the most effective use of cached checks, you should:
• Schedule regular checks of your hosts
• Use MRTG to graph statistics for 1) on-demand checks and 2) cached checks
• Adjust cached check horizon variables to fit your needs
You can schedule regular checks of your hosts by specifying a value greater than 0 for check_interval option in yourhost definitions.
7.17. Cached Checks 181

Shinken Documentation, Release 2.4
A good way to determine the proper value for the cached check horizon options is to compare how many on-demandchecks Shinken has to actually run versus how may it can use cached values for. The nagiostats utility can produceinformation on cached checks, which can then be graphed with MRTG. Example MRTG graphs that show cached vs.actual on-demand checks are shown to the right.
The monitoring installation which produced the graphs above had:
• A total of 44 hosts, all of which were checked at regular intervals
• An average (regularly scheduled) host check interval of 5 minutes
• A cached_host_check_horizon of 15 seconds
The first MRTG graph shows how many regularly scheduled host checks compared to how many cached host checkshave occurred. In this example, an average of 53 host checks occur every five minutes. 9 of these (17%) are on-demandchecks.
The second MRTG graph shows how many cached host checks have occurred over time. In this example an averageof 2 cached host checks occurs every five minutes.
Remember, cached checks are only available for on-demand checks. Based on the 5 minute averages from the graphs,we see that Nagios is able to used cached host check results every 2 out of 9 times an on-demand check has to be run.That may not seem much, but these graphs represent a small monitoring environment. Consider that 2 out of 9 is 22%and you can start to see how this could significantly help improve host check performance in large environments. Thatpercentage could be higher if the cached host check horizon variable value was increased, but that would reduce thereliability of the cached host state information.
182 Chapter 7. Advanced Topics

Shinken Documentation, Release 2.4
Once you’ve had a few hours or days worth of MRTG graphs, you should see how many host and service checkswere done by executing plugins versus those that used cached check results. Use that information to adjust the cachedcheck horizon variables appropriately for your situation. Continue to monitor the MRTG graphs over time to see howchanging the horizon variables affected cached check statistics. Rinse and repeat as necessary.
7.18 Passive Host State Translation
7.18.1 Introduction
This Nagios option is no more useful in the Shinken architecture.
7.19 Service and Host Check Scheduling
7.19.1 The scheduling
The scheduling of Shinken is quite simple. The first scheduling take care of the max_service_check_spread andmax_host_check_spread so the time of the first schedule will be in the
start+max_*_check_spread*interval_length (60s in general)
if the check_timeperiod agree with it.
Note: Shinken do not take care about Nagios *_inter_check_delay_method : this is always ‘s’ (smart) because otheroptions are just useless for nearly everyone. And it also do not use the *_interleave_factor too.
Nagios make a average of service by host to make it’s dispatch of checks in the first check window. Shinken use arandom way of doing it : the check is between t=now and t=min(t from next timeperiod, max_*_check_spread), butin a random way. So you will will have the better distribution of checks in this period, instead of the nagios one wherehosts with differents number of services can be agresively checks.
After this first scheduling, the time for the next check is just t_check+check_interval if the timepriod is agree for it (orjust the next time available in the timeperiod). In the future, a little random value (like few seconds) will be add forsuch cases.
7.19.2 Aggressive Host Checking Option (Unused)
Format: use_aggressive_host_checking=<0/1>Example: use_aggressive_host_checking=0
Nagios tries to be smart about how and when it checks the status of hosts. In general, disabling this option will allowNagios to make some smarter decisions and check hosts a bit faster. Enabling this option will increase the amount oftime required to check hosts, but may improve reliability a bit. Unless you have problems with Nagios not recognizingthat a host recovered, I would suggest not enabling this option.
• 0 = Don’t use aggressive host checking (default)
• 1 = Use aggressive host checking
7.18. Passive Host State Translation 183

Shinken Documentation, Release 2.4
7.20 Object Inheritance
7.20.1 Introduction
This documentation attempts to explain object inheritance and how it can be used in your object definitions.
If you are confused about how recursion and inheritance work after reading this, take a look at the sample object configfiles provided in the Shinken distribution. If that still doesn’t help, have a look to the shinken resources for help.
7.20.2 Basics
There are three variables affecting recursion and inheritance that are present in all object definitions. They are indicatedin red as follows...
define someobjecttype{object-specific variables ...name template_nameuse name_of_template_to_useregister [0/1]}
The first variable is “name”. Its just a “template” name that can be referenced in other object definitions so they caninherit the objects properties/variables. Template names must be unique amongst objects of the same type, so youcan’t have two or more host definitions that have “hosttemplate” as their template name.
The second variable is “use”. This is where you specify the name of the template object that you want to inheritproperties/variables from. The name you specify for this variable must be defined as another object’s template named(using the name variable).
The third variable is “register”. This variable is used to indicate whether or not the object definition should be “reg-istered” with Shinken. By default, all object definitions are registered. If you are using a partial object definitionas a template, you would want to prevent it from being registered (an example of this is provided later). Values areas follows: 0 = do NOT register object definition, 1 = register object definition (this is the default). This variable isNOT inherited; every (partial) object definition used as a template must explicitly set the “register” directive to be 0.This prevents the need to override an inherited “register” directive with a value of 1 for every object that should beregistered.
7.20.3 Local Variables vs. Inherited Variables
One important thing to understand with inheritance is that “local” object variables always take precedence over vari-ables defined in the template object. Take a look at the following example of two host definitions (not all requiredvariables have been supplied):
define host{host_name bighost1check_command check-host-alivenotification_options d,u,rmax_check_attempts 5name hosttemplate1}
define host{host_name bighost2max_check_attempts 3
184 Chapter 7. Advanced Topics

Shinken Documentation, Release 2.4
use hosttemplate1}
You’ll note that the definition for host bighost1 has been defined as having hosttemplate1 as its template name. Thedefinition for host bighost2 is using the definition of bighost1 as its template object. Once Shinken processes this data,the resulting definition of host bighost2 would be equivalent to this definition:
define host{host_name bighost2check_command check-host-alivenotification_options d,u,rmax_check_attempts 3}
You can see that the “check_command” and “notification_options” variables were inherited from the template object(where host bighost1 was defined). However, the host_name and max_check_attempts variables were not inheritedfrom the template object because they were defined locally. Remember, locally defined variables override variablesthat would normally be inherited from a template object. That should be a fairly easy concept to understand.
If you would like local string variables to be appended to inherited string values, you can do so. Read more about howto accomplish this below.
7.20.4 Inheritance Chaining
Objects can inherit properties/variables from multiple levels of template objects. Take the following example:
define host{host_name bighost1check_command check-host-alivenotification_options d,u,rmax_check_attempts 5name hosttemplate1}
define host{host_name bighost2max_check_attempts 3use hosttemplate1name hosttemplate2}
define host{host_name bighost3use hosttemplate2}
You’ll notice that the definition of host bighost3 inherits variables from the definition of host bighost2, which in turninherits variables from the definition of host bighost1. Once Shinken processes this configuration data, the resultinghost definitions are equivalent to the following:
define host{host_name bighost1check_command check-host-alivenotification_options d,u,rmax_check_attempts 5}
define host{
7.20. Object Inheritance 185
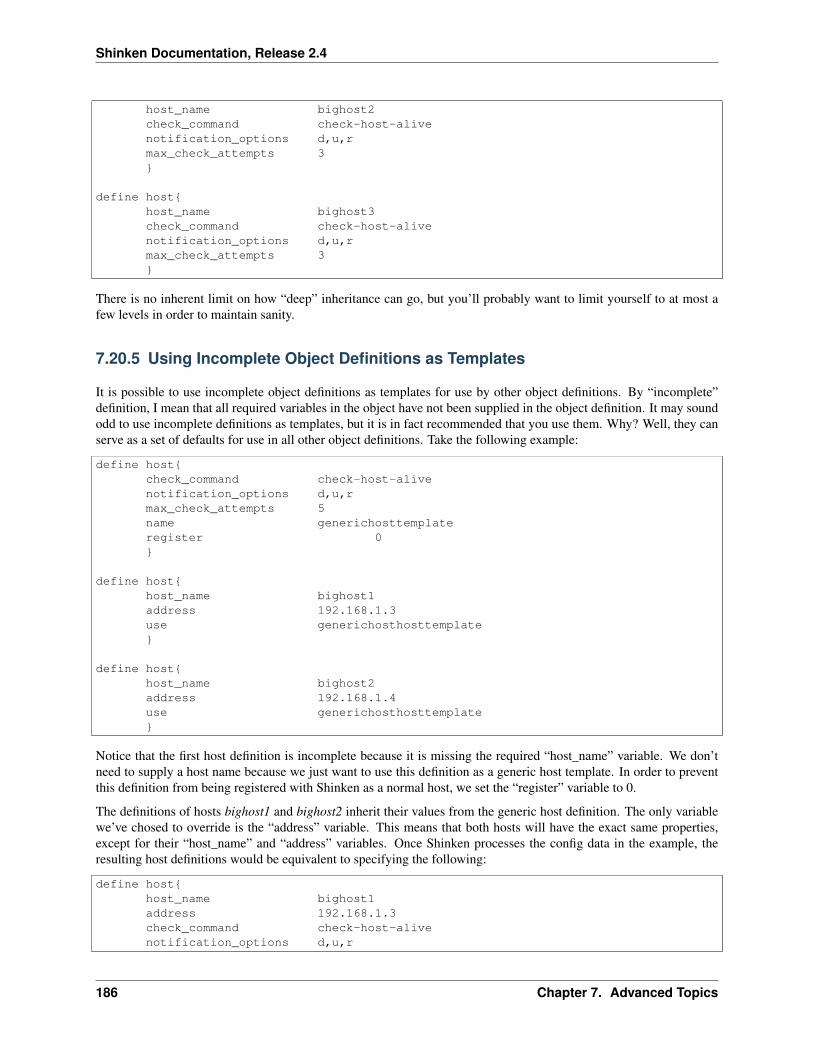
Shinken Documentation, Release 2.4
host_name bighost2check_command check-host-alivenotification_options d,u,rmax_check_attempts 3}
define host{host_name bighost3check_command check-host-alivenotification_options d,u,rmax_check_attempts 3}
There is no inherent limit on how “deep” inheritance can go, but you’ll probably want to limit yourself to at most afew levels in order to maintain sanity.
7.20.5 Using Incomplete Object Definitions as Templates
It is possible to use incomplete object definitions as templates for use by other object definitions. By “incomplete”definition, I mean that all required variables in the object have not been supplied in the object definition. It may soundodd to use incomplete definitions as templates, but it is in fact recommended that you use them. Why? Well, they canserve as a set of defaults for use in all other object definitions. Take the following example:
define host{check_command check-host-alivenotification_options d,u,rmax_check_attempts 5name generichosttemplateregister 0}
define host{host_name bighost1address 192.168.1.3use generichosthosttemplate}
define host{host_name bighost2address 192.168.1.4use generichosthosttemplate}
Notice that the first host definition is incomplete because it is missing the required “host_name” variable. We don’tneed to supply a host name because we just want to use this definition as a generic host template. In order to preventthis definition from being registered with Shinken as a normal host, we set the “register” variable to 0.
The definitions of hosts bighost1 and bighost2 inherit their values from the generic host definition. The only variablewe’ve chosed to override is the “address” variable. This means that both hosts will have the exact same properties,except for their “host_name” and “address” variables. Once Shinken processes the config data in the example, theresulting host definitions would be equivalent to specifying the following:
define host{host_name bighost1address 192.168.1.3check_command check-host-alivenotification_options d,u,r
186 Chapter 7. Advanced Topics

Shinken Documentation, Release 2.4
max_check_attempts 5}
define host{host_name bighost2address 192.168.1.4check_command check-host-alivenotification_options d,u,rmax_check_attempts 5}
At the very least, using a template definition for default variables will save you a lot of typing. It’ll also save you a lotof headaches later if you want to change the default values of variables for a large number of hosts.
7.20.6 Custom Object Variables
Any custom object variables that you define in your host, service, or contact definition templates will be inherited justlike other standard variables. Take the following example:
define host{_customvar1 somevalue ; <-- Custom host variable_snmp_community public ; <-- Custom host variablename generichosttemplateregister 0}
define host{host_name bighost1address 192.168.1.3use generichosthosttemplate}
The host bighost1 will inherit the custom host variables “_customvar1” and “_snmp_community”, as well as theirrespective values, from the generichosttemplate definition. The effective result is a definition for bighost1 that lookslike this:
define host{host_name bighost1address 192.168.1.3_customvar1 somevalue_snmp_community public}
7.20.7 Cancelling Inheritance of String Values
In some cases you may not want your host, service, or contact definitions to inherit values of string variables from thetemplates they reference. If this is the case, you can specify “null” (without quotes) as the value of the variable thatyou do not want to inherit. Take the following example:
define host{event_handler my-event-handler-commandname generichosttemplateregister 0}
define host{
7.20. Object Inheritance 187

Shinken Documentation, Release 2.4
host_name bighost1address 192.168.1.3event_handler nulluse generichosthosttemplate}
In this case, the host bighost1 will not inherit the value of the “event_handler” variable that is defined in the generi-chosttemplate. The resulting effective definition of bighost1 is the following:
define host{host_name bighost1address 192.168.1.3}
7.20.8 Additive Inheritance of String Values
Shinken gives preference to local variables instead of values inherited from templates. In most cases local variablevalues override those that are defined in templates. In some cases it makes sense to allow Shinken to use the values ofinherited and local variables together.
This “additive inheritance” can be accomplished by prepending the local variable value with a plus sign (+). Thisfeatures is only available for standard (non-custom) variables that contain string values. Take the following example:
define host{hostgroups all-serversname generichosttemplateregister 0}
define host{host_name linuxserver1hostgroups +linux-servers,web-serversuse generichosthosttemplate}
In this case, the host linuxserver1 will append the value of its local “hostgroups” variable to that from generichosttem-plate. The resulting effective definition of linuxserver1 is the following:
define host{host_name linuxserver1hostgroups all-servers,linux-servers,web-servers}
Important: If you use a field twice using several templates, the value of the field will be the first one found! In theexample above, fields values in all-servers won’t we be replaced. Be careful with overlaping field!
7.20.9 Implied Inheritance
Normally you have to either explicitly specify the value of a required variable in an object definition or inherit it froma template. There are a few exceptions to this rule, where Shinken will assume that you want to use a value that insteadcomes from a related object. For example, the values of some service variables will be copied from the host the serviceis associated with if you don’t otherwise specify them.
The following table lists the object variables that will be implicitly inherited from related objects if you don’t explicitlyspecify their value in your object definition or inherit them from a template.
188 Chapter 7. Advanced Topics
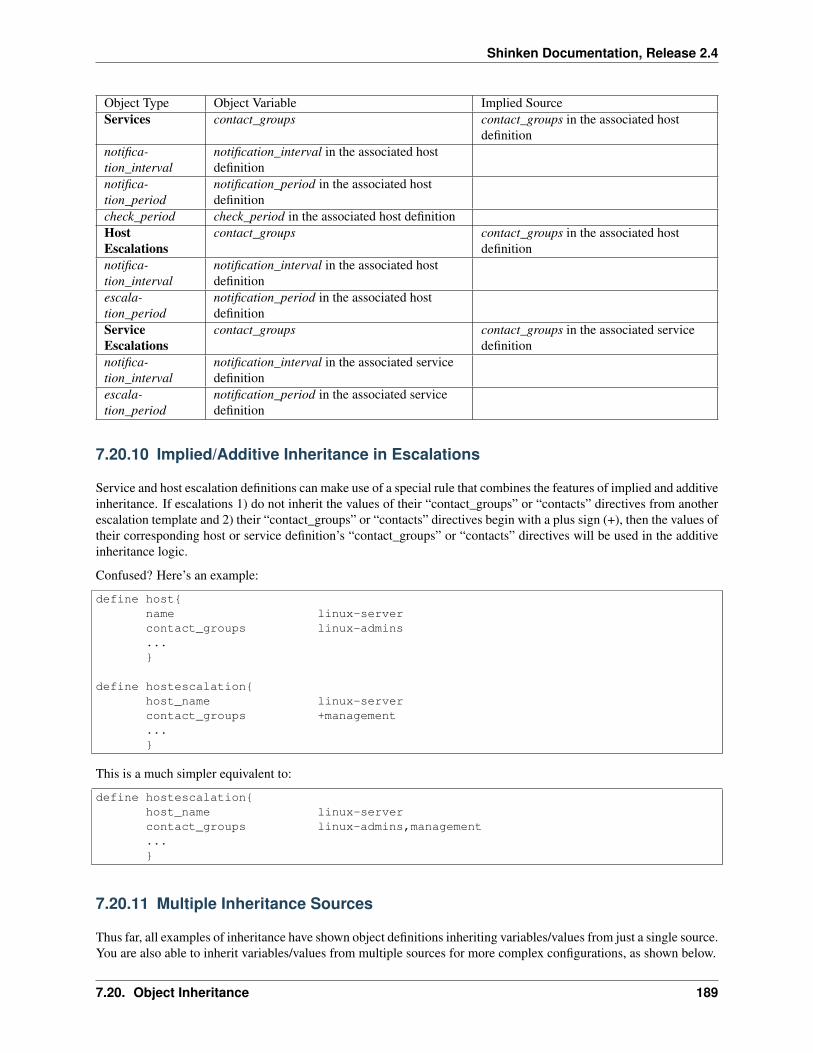
Shinken Documentation, Release 2.4
Object Type Object Variable Implied SourceServices contact_groups contact_groups in the associated host
definitionnotifica-tion_interval
notification_interval in the associated hostdefinition
notifica-tion_period
notification_period in the associated hostdefinition
check_period check_period in the associated host definitionHostEscalations
contact_groups contact_groups in the associated hostdefinition
notifica-tion_interval
notification_interval in the associated hostdefinition
escala-tion_period
notification_period in the associated hostdefinition
ServiceEscalations
contact_groups contact_groups in the associated servicedefinition
notifica-tion_interval
notification_interval in the associated servicedefinition
escala-tion_period
notification_period in the associated servicedefinition
7.20.10 Implied/Additive Inheritance in Escalations
Service and host escalation definitions can make use of a special rule that combines the features of implied and additiveinheritance. If escalations 1) do not inherit the values of their “contact_groups” or “contacts” directives from anotherescalation template and 2) their “contact_groups” or “contacts” directives begin with a plus sign (+), then the values oftheir corresponding host or service definition’s “contact_groups” or “contacts” directives will be used in the additiveinheritance logic.
Confused? Here’s an example:
define host{name linux-servercontact_groups linux-admins...}
define hostescalation{host_name linux-servercontact_groups +management...}
This is a much simpler equivalent to:
define hostescalation{host_name linux-servercontact_groups linux-admins,management...}
7.20.11 Multiple Inheritance Sources
Thus far, all examples of inheritance have shown object definitions inheriting variables/values from just a single source.You are also able to inherit variables/values from multiple sources for more complex configurations, as shown below.
7.20. Object Inheritance 189

Shinken Documentation, Release 2.4
# Generic host template
define host{name generic-hostactive_checks_enabled 1check_interval 10register 0}
# Development web server templatedefine host{
name development-servercheck_interval 15notification_options d,u,r...register 0}
# Development web serverdefine host{
use generic-host,development-serverhost_name devweb1...}
In the example above, devweb1 is inheriting variables/values from two sources: generic-host and development-server.You’ll notice that a check_interval variable is defined in both sources. Since generic-host was the first templatespecified in devweb1’s use directive, its value for the “check_interval” variable is inherited by the devweb1 host. Afterinheritance, the effective definition of devweb1 would be as follows:
# Development web servedefine host{
host_name devweb1active_checks_enabled 1check_interval 10notification_options d,u,r...}
190 Chapter 7. Advanced Topics

Shinken Documentation, Release 2.4
7.20.12 Precedence With Multiple Inheritance Sources
When you use multiple inheritance sources, it is important to know how Shinken handles variables that are defined inmultiple sources. In these cases Shinken will use the variable/value from the first source that is specified in the usedirective. Since inheritance sources can themselves inherit variables/values from one or more other sources, it can gettricky to figure out what variable/value pairs take precedence.
Consider the following host definition that references three templates:
# Development web serverdefine host{
use 1, 4, 8host_name devweb1...
}
If some of those referenced templates themselves inherit variables/values from one or more other templates, the pre-cendence rules are shown below. Testing, trial, and error will help you better understand exactly how things work incomplex inheritance situations like this. :-)
7.20. Object Inheritance 191

Shinken Documentation, Release 2.4
7.20.13 Inheritance overriding
Inheritance is a core feature allowing to factorize configuration. It is possible from a host or a service template tobuild a very large set of checks with relatively few lines. The drawback of this approach is that it requires all hostsor services to be consistent. But if it is easy to instanciate new hosts with their own definitions attributes sets, it isgenerally more complicated with services, because the order of magnitude is larger (hosts * services per host), andbecause few attributes may come from the host. This is is especially true for packs, which is a generalization of theinheritance usage.
If some hosts require special directives for the services they are hosting (values that are different from those defined attemplate level), it is generally necessary to define new service.
Imagine two web servers clusters, one for the frontend, the other for the backend, where the frontend servers shouldnotify any HTTP service in CRITICAL and WARNING state, and backend servers should only notify on CRITICALstate.
To implement this configuration, we may define 2 different HTTP services with different notification options.
Example:
define service {service_description HTTP Fronthostgroup_name front-webnotification_options c,w,r
...}
define service {service_description HTTP Backhostgroup_name front-backnotification_options c,r
...}
define host {host_name web-front-01hostgroups web-front...
}...
define host {host_name web-back-01hostgroups web-back...
}...
Another way is to inherit attributes on the service side directly from the host: some service attributes may be in-herited directly from the host if not defined on the service template side (see Implied Inheritance), but not all. Ournotification_options in our example cannot be picked up from the host.
If the attribute you want to be set a custom value cannot be inherited from the host, you may use theservice_overrides host directive. Its role is to enforce a service directive directly from the host. This allows todefine specific service instance attributes from a same generalized service definition.
Its syntax is:
service_overrides xxx,yyy zzz
192 Chapter 7. Advanced Topics

Shinken Documentation, Release 2.4
It could be summarized as “For the service bound to me, named ‘‘xxx‘‘, I want the directive ‘‘yyy‘‘ set to ‘‘zzz‘‘ rathertran the inherited value“
Example:
define service {service_description HTTPhostgroup_name webnotification_options c,w,r...
}
define host {host_name web-front-01hostgroups web...
}...
define host {host_name web-back-01hostgroups webservice_overrides HTTP,notification_options c,r...
}...
In the previous example, we defined only one instance of the HTTP service, and we enforced the servicenotification_options for the web servers composing the backend. The final result is the same, but the secondexample is shorter, and does not require the second service definition.
Using packs allows an even shorter configuration.
Example:
define host {use httphost_name web-front-01...
}...
define host {use httphost_name web-back-01service_overrides HTTP,notification_options c,r...
}...
In the packs example, the web server from the front-end cluster uses the value defined in the pack, and the one from thebackend cluster has its HTTP service (inherited from the HTTP pack also) enforced its notification_optionsdirective.
Important: The service_overrides attribute may himself be inherited from an upper host template. This is a multi-valued attribute wchich syntax requires that each value is set on its own line. If you add a line on a host instance, itwill not add it to the ones defined at template level, it will overlobad them. If some of the values on the template levelare needed, they have to be explicitely copied.
Example:
7.20. Object Inheritance 193
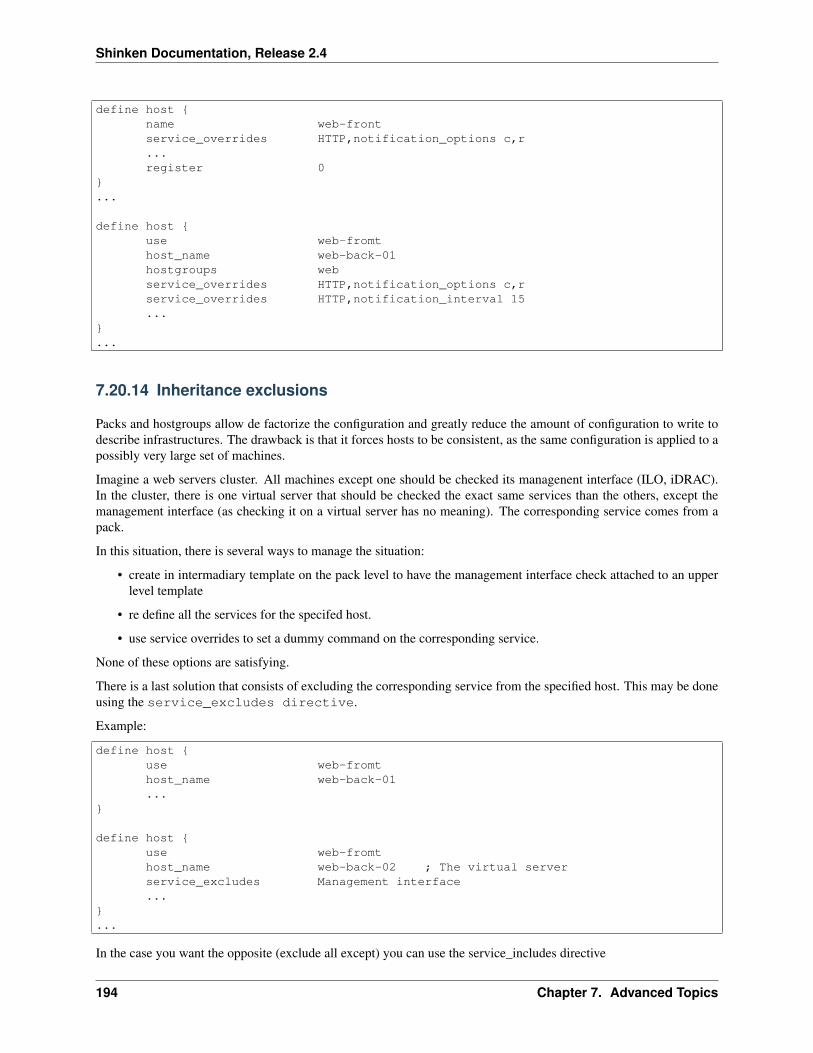
Shinken Documentation, Release 2.4
define host {name web-frontservice_overrides HTTP,notification_options c,r...register 0
}...
define host {use web-fromthost_name web-back-01hostgroups webservice_overrides HTTP,notification_options c,rservice_overrides HTTP,notification_interval 15...
}...
7.20.14 Inheritance exclusions
Packs and hostgroups allow de factorize the configuration and greatly reduce the amount of configuration to write todescribe infrastructures. The drawback is that it forces hosts to be consistent, as the same configuration is applied to apossibly very large set of machines.
Imagine a web servers cluster. All machines except one should be checked its managenent interface (ILO, iDRAC).In the cluster, there is one virtual server that should be checked the exact same services than the others, except themanagement interface (as checking it on a virtual server has no meaning). The corresponding service comes from apack.
In this situation, there is several ways to manage the situation:
• create in intermadiary template on the pack level to have the management interface check attached to an upperlevel template
• re define all the services for the specifed host.
• use service overrides to set a dummy command on the corresponding service.
None of these options are satisfying.
There is a last solution that consists of excluding the corresponding service from the specified host. This may be doneusing the service_excludes directive.
Example:
define host {use web-fromthost_name web-back-01...
}
define host {use web-fromthost_name web-back-02 ; The virtual serverservice_excludes Management interface...
}...
In the case you want the opposite (exclude all except) you can use the service_includes directive
194 Chapter 7. Advanced Topics
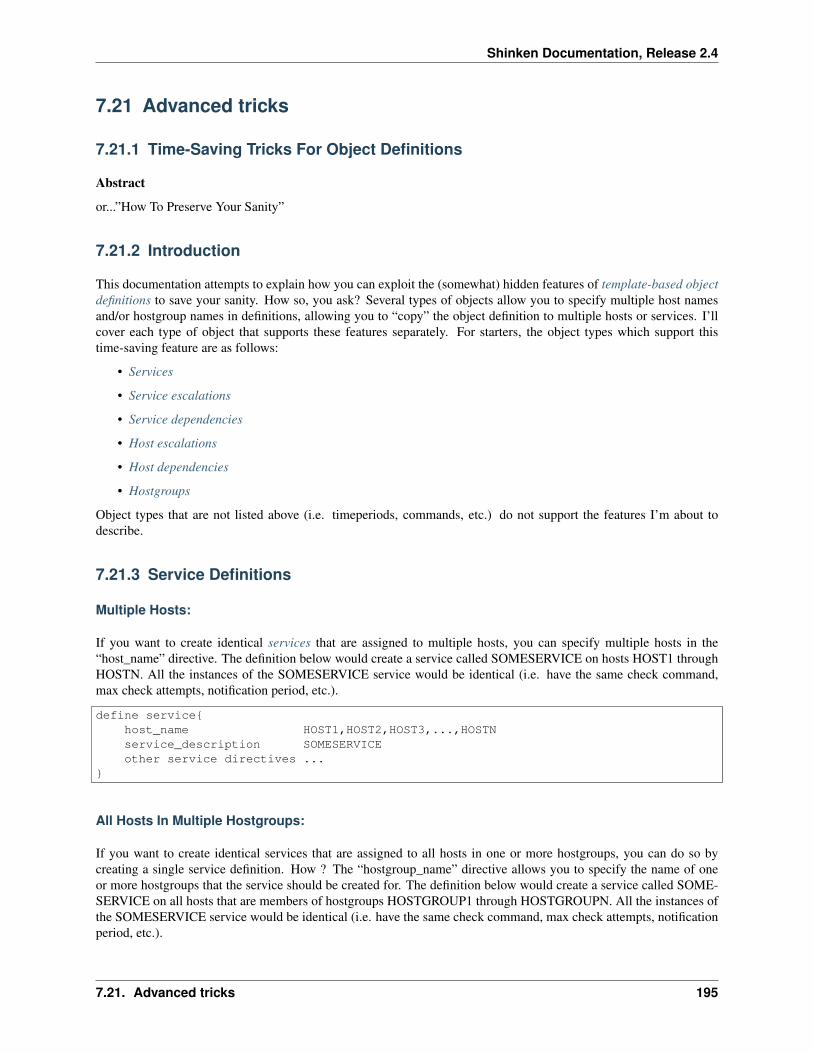
Shinken Documentation, Release 2.4
7.21 Advanced tricks
7.21.1 Time-Saving Tricks For Object Definitions
Abstract
or...”How To Preserve Your Sanity”
7.21.2 Introduction
This documentation attempts to explain how you can exploit the (somewhat) hidden features of template-based objectdefinitions to save your sanity. How so, you ask? Several types of objects allow you to specify multiple host namesand/or hostgroup names in definitions, allowing you to “copy” the object definition to multiple hosts or services. I’llcover each type of object that supports these features separately. For starters, the object types which support thistime-saving feature are as follows:
• Services
• Service escalations
• Service dependencies
• Host escalations
• Host dependencies
• Hostgroups
Object types that are not listed above (i.e. timeperiods, commands, etc.) do not support the features I’m about todescribe.
7.21.3 Service Definitions
Multiple Hosts:
If you want to create identical services that are assigned to multiple hosts, you can specify multiple hosts in the“host_name” directive. The definition below would create a service called SOMESERVICE on hosts HOST1 throughHOSTN. All the instances of the SOMESERVICE service would be identical (i.e. have the same check command,max check attempts, notification period, etc.).
define service{host_name HOST1,HOST2,HOST3,...,HOSTNservice_description SOMESERVICEother service directives ...
}
All Hosts In Multiple Hostgroups:
If you want to create identical services that are assigned to all hosts in one or more hostgroups, you can do so bycreating a single service definition. How ? The “hostgroup_name” directive allows you to specify the name of oneor more hostgroups that the service should be created for. The definition below would create a service called SOME-SERVICE on all hosts that are members of hostgroups HOSTGROUP1 through HOSTGROUPN. All the instances ofthe SOMESERVICE service would be identical (i.e. have the same check command, max check attempts, notificationperiod, etc.).
7.21. Advanced tricks 195

Shinken Documentation, Release 2.4
define service{hostgroup_name HOSTGROUP1,HOSTGROUP2,...,HOSTGROUPNservice_description SOMESERVICEother service directives ...
}
All Hosts:
If you want to create identical services that are assigned to all hosts that are defined in your configuration files, youcan use a wildcard in the “host_name” directive. The definition below would create a service called SOMESERVICEon all hosts that are defined in your configuration files. All the instances of the SOMESERVICE service would beidentical (i.e. have the same check command, max check attempts, notification period, etc.).
define service{host_name *service_description SOMESERVICEother service directives ...
}
Excluding Hosts:
If you want to create identical services on numerous hosts or hostgroups, but would like to exclude some hosts fromthe definition, this can be accomplished by preceding the host or hostgroup with a ! symbol.
define service{host_name HOST1,HOST2,!HOST3,!HOST4,...,HOSTNhostgroup_name HOSTGROUP1,HOSTGROUP2,!HOSTGROUP3,!HOSTGROUP4,...,HOSTGROUPNservice_description SOMESERVICEother service directives ...
}
7.21.4 Service Escalation Definitions
Multiple Hosts:
If you want to create service escalations for services of the same name/description that are assigned to multiple hosts,you can specify multiple hosts in the “host_name” directive. The definition below would create a service escalation forservices called SOMESERVICE on hosts HOST1 through HOSTN. All the instances of the service escalation wouldbe identical (i.e. have the same contact groups, notification interval, etc.).
define serviceescalation{host_name HOST1,HOST2,HOST3,...,HOSTNservice_description SOMESERVICEother escalation directives ...
}
All Hosts In Multiple Hostgroups:
If you want to create service escalations for services of the same name/description that are assigned to all hosts in inone or more hostgroups, you can do use the “hostgroup_name” directive. The definition below would create a serviceescalation for services called SOMESERVICE on all hosts that are members of hostgroups HOSTGROUP1 through
196 Chapter 7. Advanced Topics
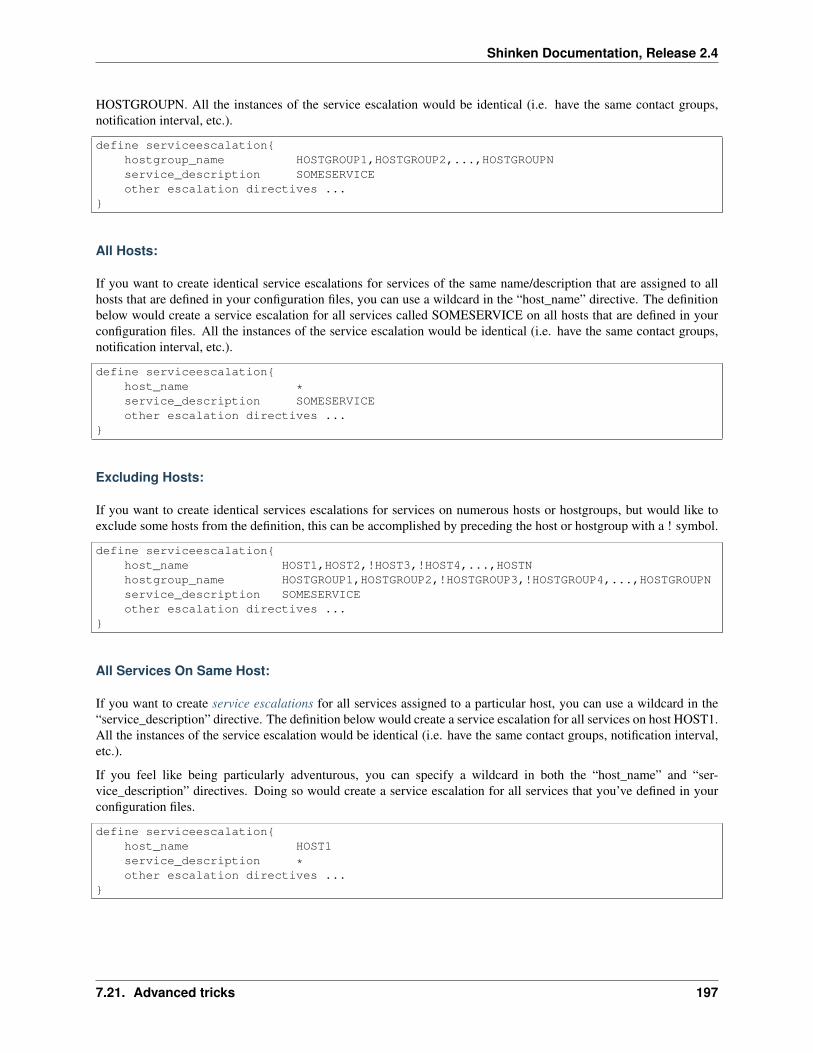
Shinken Documentation, Release 2.4
HOSTGROUPN. All the instances of the service escalation would be identical (i.e. have the same contact groups,notification interval, etc.).
define serviceescalation{hostgroup_name HOSTGROUP1,HOSTGROUP2,...,HOSTGROUPNservice_description SOMESERVICEother escalation directives ...
}
All Hosts:
If you want to create identical service escalations for services of the same name/description that are assigned to allhosts that are defined in your configuration files, you can use a wildcard in the “host_name” directive. The definitionbelow would create a service escalation for all services called SOMESERVICE on all hosts that are defined in yourconfiguration files. All the instances of the service escalation would be identical (i.e. have the same contact groups,notification interval, etc.).
define serviceescalation{host_name *service_description SOMESERVICEother escalation directives ...
}
Excluding Hosts:
If you want to create identical services escalations for services on numerous hosts or hostgroups, but would like toexclude some hosts from the definition, this can be accomplished by preceding the host or hostgroup with a ! symbol.
define serviceescalation{host_name HOST1,HOST2,!HOST3,!HOST4,...,HOSTNhostgroup_name HOSTGROUP1,HOSTGROUP2,!HOSTGROUP3,!HOSTGROUP4,...,HOSTGROUPNservice_description SOMESERVICEother escalation directives ...
}
All Services On Same Host:
If you want to create service escalations for all services assigned to a particular host, you can use a wildcard in the“service_description” directive. The definition below would create a service escalation for all services on host HOST1.All the instances of the service escalation would be identical (i.e. have the same contact groups, notification interval,etc.).
If you feel like being particularly adventurous, you can specify a wildcard in both the “host_name” and “ser-vice_description” directives. Doing so would create a service escalation for all services that you’ve defined in yourconfiguration files.
define serviceescalation{host_name HOST1service_description *other escalation directives ...
}
7.21. Advanced tricks 197

Shinken Documentation, Release 2.4
Multiple Services On Same Host:
If you want to create service escalations for all multiple services assigned to a particular host, you can use a specifymore than one service description in the “service_description” directive. The definition below would create a serviceescalation for services SERVICE1 through SERVICEN on host HOST1. All the instances of the service escalationwould be identical (i.e. have the same contact groups, notification interval, etc.).
define serviceescalation{host_name HOST1service_description SERVICE1,SERVICE2,...,SERVICENother escalation directives ...
}
All Services In Multiple Servicegroups:
If you want to create service escalations for all services that belong in one or more servicegroups, you can do use the“servicegroup_name” directive. The definition below would create service escalations for all services that are membersof servicegroups SERVICEGROUP1 through SERVICEGROUPN. All the instances of the service escalation wouldbe identical (i.e. have the same contact groups, notification interval, etc.).
define serviceescalation{servicegroup_name SERVICEGROUP1,SERVICEGROUP2,...,SERVICEGROUPNother escalation directives ...
}
7.21.5 Service Dependency Definitions
Multiple Hosts:
If you want to create service dependencies for services of the same name/description that are assigned to multiplehosts, you can specify multiple hosts in the “host_name” and or “dependent_host_name” directives. In the examplebelow, service SERVICE2 on hosts HOST3 and HOST4 would be dependent on service SERVICE1 on hosts HOST1and HOST2. All the instances of the service dependencies would be identical except for the host names (i.e. have thesame notification failure criteria, etc.).
define servicedependency{host_name HOST1,HOST2service_description SERVICE1dependent_host_name HOST3,HOST4dependent_service_description SERVICE2other dependency directives ...
}
All Hosts In Multiple Hostgroups:
If you want to create service dependencies for services of the same name/description that are assigned to all hosts inin one or more hostgroups, you can do use the “hostgroup_name” and/or “dependent_hostgroup_name” directives.In the example below, service SERVICE2 on all hosts in hostgroups HOSTGROUP3 and HOSTGROUP4 wouldbe dependent on service SERVICE1 on all hosts in hostgroups HOSTGROUP1 and HOSTGROUP2. Assuming therewere five hosts in each of the hostgroups, this definition would be equivalent to creating 100 single service dependencydefinitions ! All the instances of the service dependency would be identical except for the host names (i.e. have thesame notification failure criteria, etc.).
198 Chapter 7. Advanced Topics

Shinken Documentation, Release 2.4
define servicedependency{hostgroup_name HOSTGROUP1,HOSTGROUP2service_description SERVICE1dependent_hostgroup_name HOSTGROUP3,HOSTGROUP4dependent_service_description SERVICE2other dependency directives ...
}
All Services On A Host:
If you want to create service dependencies for all services assigned to a particular host, you can use a wildcard in the“service_description” and/or “dependent_service_description” directives. In the example below, all services on hostHOST2 would be dependent on all services on host HOST1. All the instances of the service dependencies would beidentical (i.e. have the same notification failure criteria, etc.).
define servicedependency{host_name HOST1service_description *dependent_host_name HOST2dependent_service_description *other dependency directives ...
}
Multiple Services On A Host:
If you want to create service dependencies for multiple services assigned to a particular host, you can specify more thanone service description in the “service_description” and/or “dependent_service_description” directives as follows:
define servicedependency{host_name HOST1service_description SERVICE1,SERVICE2,...,SERVICENdependent_host_name HOST2dependent_service_description SERVICE1,SERVICE2,...,SERVICENother dependency directives ...
}
All Services In Multiple Servicegroups:
If you want to create service dependencies for all services that belong in one or more servicegroups, you can do usethe “servicegroup_name” and/or “dependent_servicegroup_name” directive as follows:
define servicedependency{servicegroup_name SERVICEGROUP1,SERVICEGROUP2,...,SERVICEGROUPNdependent_servicegroup_name SERVICEGROUP3,SERVICEGROUP4,...SERVICEGROUPNother dependency directives ...
}
Same Host Dependencies:
If you want to create service dependencies for multiple services that are dependent on services on the same host, leavethe “dependent_host_name” and “dependent_hostgroup_name” directives empty. The example below assumes thathosts HOST1 and HOST2 have at least the following four services associated with them: SERVICE1, SERVICE2,SERVICE3, and SERVICE4. In this example, SERVICE3 and SERVICE4 on HOST1 will be dependent on both
7.21. Advanced tricks 199

Shinken Documentation, Release 2.4
SERVICE1 and SERVICE2 on HOST1. Similarly, SERVICE3 and SERVICE4 on HOST2 will be dependent on bothSERVICE1 and SERVICE2 on HOST2.
define servicedependency{host_name HOST1,HOST2service_description SERVICE1,SERVICE2dependent_service_description SERVICE3,SERVICE4other dependency directives ...
}
7.21.6 Host Escalation Definitions
Multiple Hosts:
If you want to create host escalations for multiple hosts, you can specify multiple hosts in the “host_name” directive.The definition below would create a host escalation for hosts HOST1 through HOSTN. All the instances of the hostescalation would be identical (i.e. have the same contact groups, notification interval, etc.).
define hostescalation{host_name HOST1,HOST2,HOST3,...,HOSTNother escalation directives ...
}
All Hosts In Multiple Hostgroups:
If you want to create host escalations for all hosts in in one or more hostgroups, you can do use the “hostgroup_name”directive. The definition below would create a host escalation on all hosts that are members of hostgroups HOST-GROUP1 through HOSTGROUPN. All the instances of the host escalation would be identical (i.e. have the samecontact groups, notification interval, etc.).
define hostescalation{hostgroup_name HOSTGROUP1,HOSTGROUP2,...,HOSTGROUPNother escalation directives ...
}
All Hosts:
If you want to create identical host escalations for all hosts that are defined in your configuration files, you can usea wildcard in the “host_name” directive. The definition below would create a hosts escalation for all hosts that aredefined in your configuration files. All the instances of the host escalation would be identical (i.e. have the samecontact groups, notification interval, etc.).
define hostescalation{host_name *other escalation directives ...
}
Excluding Hosts:
If you want to create identical host escalations on numerous hosts or hostgroups, but would like to exclude some hostsfrom the definition, this can be accomplished by preceding the host or hostgroup with a ! symbol.
200 Chapter 7. Advanced Topics

Shinken Documentation, Release 2.4
define hostescalation{host_name HOST1,HOST2,!HOST3,!HOST4,...,HOSTNhostgroup_name HOSTGROUP1,HOSTGROUP2,!HOSTGROUP3,!HOSTGROUP4,...,HOSTGROUPNother escalation directives ...
}
7.21.7 Host Dependency Definitions
Multiple Hosts:
If you want to create host dependencies for multiple hosts, you can specify multiple hosts in the “host_name” and/or“dependent_host_name” directives. The definition below would be equivalent to creating six separate host dependen-cies. In the example above, hosts HOST3, HOST4 and HOST5 would be dependent upon both HOST1 and HOST2.All the instances of the host dependencies would be identical except for the host names (i.e. have the same notificationfailure criteria, etc.).
define hostdependency{host_name HOST1,HOST2dependent_host_name HOST3,HOST4,HOST5other dependency directives ...
}
All Hosts In Multiple Hostgroups:
If you want to create host escalations for all hosts in in one or more hostgroups, you can do use the “hostgroup_name”and /or “dependent_hostgroup_name” directives. In the example below, all hosts in hostgroups HOSTGROUP3 andHOSTGROUP4 would be dependent on all hosts in hostgroups HOSTGROUP1 and HOSTGROUP2. All the instancesof the host dependencies would be identical except for host names (i.e. have the same notification failure criteria, etc.).
define hostdependency{hostgroup_name HOSTGROUP1,HOSTGROUP2dependent_hostgroup_name HOSTGROUP3,HOSTGROUP4other dependency directives ...
}
7.21.8 Hostgroups
All Hosts:
If you want to create a hostgroup that has all hosts that are defined in your configuration files as members, you can usea wildcard in the “members” directive. The definition below would create a hostgroup called HOSTGROUP1 that hasall all hosts that are defined in your configuration files as members.
define hostgroup{hostgroup_name HOSTGROUP1members *other hostgroup directives ...
}
7.21. Advanced tricks 201

Shinken Documentation, Release 2.4
7.22 Migrating from Nagios to Shinken
7.22.1 How to to import existing Nagios states
It’s possible with the nagios_retention_file module in fact.
The “migration” is done in two phases :
• First you launch shinken with both NagiosRetention and PickleRetention modules. It will load data from Na-giosRetention and save them in a more “efficient” file. So add in shinken-specififc.cfg file both modules for yourscheduler object:
modules NagiosRetention ,PickleRetention
• Then you remove the NagiosRetention (it’s a read only module, don’t fear for your nagios retention file) andrestart with just PickleRetention. <code>modules PickleRetention
You’re done.
//Source:// Topic on forum
Important: This method has met with limited success, further testing of the NagiosRetention module is required. Anissues encountered should be raised in the Shinken issue tracker on github.
7.22.2 How to to import Nagios reporting data
There is no out of the box migration path for Historical reports.
7.23 Multi layer discovery
Shinken provides a discovery mecanism in several steps. There are on a side the runners (cf Runners description)which are script that output in formatted way properties list of scanned host and on another side discovery rules whichuse properties list to tag hosts when some of these properties are meaningful.
There are two kinds of rules, those which generate a host definition and those which launch another runners morespecific to the scanned object. Better an image than a long speech :
202 Chapter 7. Advanced Topics

Shinken Documentation, Release 2.4
7.23.1 Runners available
Filesystems
Pre-requisites
To make this plugin works you must have snmp activated on targeted hosts. Take care to activate it and make HOST-RESSOURCES MIB OID available to it. Beginning OID of HOST-RESSOURCES MIB is : .1.3.6.1.2.1.25. Thedefault discovery runner rule trigger this runner on unix host with port 161 open.
How it works:
FS discovery runner provides two modes : __macros__ and __tags__ modes. First one, __macros__ mode, willoutput a comma-separated list of filesystems under host macro ‘_fs’, the other one will output tags with filesystemsmountpoint.
Important: All filesystems will output with character / replaced by an underscore _.
Macros mode.
It is the easiest mode. It will add a line into host definition with host macro ‘_fs’ with comma-separated list of filesys-tems. Then it is only needed to write a service definition using that macro with shinken directive “duplicate_foreach”.Here is an example :
7.23. Multi layer discovery 203

Shinken Documentation, Release 2.4
define service{service_description Disks$KEY$use generic-serviceregister 0host_name linuxcheck_command check_linux_disks!$KEY$
duplicate_foreach _fs}
$KEY$ will be replaced by ‘_fs’ host macros value.
Tag mode
This mode will let you more flexibility to monitor filesystems. Each filesystems will be a tag named with filesystemmountpoint then you need discovery rules to tag scanned host with filesystem name. Example if you want to monitor“/var” filesystem on a host with following filesystems “/usr”, “/var”, “/opt”, “/home”, “/”. You will need a discoveryrules to match “/var”, then a host template materializing the tag and a service applied to host template :
define discoveryrule {discoveryrule_name fs_varcreation_type hostfs var$+use fs_var
}
will match “/var” filesystem and tell to tag with “fs_var”.
define host{name fs_varregister 0
}
Host template used be scanned host.
define service{host_name fs_varuse 10min_shortservice_description Usage_varcheck_command check_snmp_storage!"var$$"!50!25icon_set diskregister 0
}
and service applied to “fs_var” host template, itself applied to scanned host.
Now, if you want to apply same treatment to several filesystems, like “/var” and “/home” by example :
define discoveryrule {discoveryrule_name fs_var_homecreation_type hostfs var$|home$+use fs_var_home
}
define host{name fs_var_homeregister 0
}
204 Chapter 7. Advanced Topics

Shinken Documentation, Release 2.4
define service{host_name fs_var_homeuse 10min_shortservice_description Usage_var_and_homecheck_command check_snmp_storage!"var$$|home$$"!50!25icon_set diskregister 0
}
Pay attention to double “$$”, it is needed cause macros interpretation. When more than one “$” is used just doublethem else in this example we gotten Shinken trying to interprate macro ‘$|home$’.
Cluster
Pre-requisites
SNMP needed to make this runner works. You have to activate SNMP daemon on host discovered and make OID ofclustering solution available to read. OID beginning for HACMP-MIB is : .1.3.6.1.4.1.2.3.1.2.1.5.1 and for Safekit is: .1.3.6.1.4.1.107.175.10.
How it works
Runner does only detects HACMP/PowerHA and Safekit clustering solutions for the moment. It will scan OID andreturn cluster name or module name list, depends on Safekit or HACMP. For a host with two Safekit modules test andprod, runner will output :
# ./cluster_discovery_runnner.py -H sydlrtsm1 -O linux -C publicsydlrtsm1::safekit=Test,Prod
7.24 Multiple action urls
Since version <insert the version number here>, multiple action urls can be set for a service.
Syntax is :
define service {service_description name of the service[...]action_url URL1,ICON1,ALT1|URL2,ICON2,ALT2|URL3,ICON3,ALT3
}
* URLx are the url you want to use
* ICONx are the images you want to display the link as. It can be either a local file, relative to the folder webui/plugins/eltdetail/htdocs/ or an url.
* ALTx are the alternative texts you want to display when the ICONx file is missing, or not set.
7.25 Aggregation rule
7.25.1 Goal
Got a way to define sort of agregation service for host services.
7.24. Multiple action urls 205

Shinken Documentation, Release 2.4
7.25.2 Sample 1
define host{_disks /,/var,/backup
}
define service {register 0description Disk $KEY$check_command check_disk!$KEY$
}
define service {description All Diskscheck_command bp_rule!., Disk $_HOSTDISKS$
}
ok this version sucks, we cannot parse this:
bp_rule!., Disk /,/var/backup</code>
7.25.3 version 2 (tag based agregation)
define host{name templateregister 0
}
define host{host_name host1use template_disks /,/var,/backup
}
define service {register 0description Disk $KEY$check_command check_disk!$KEY$duplicate_foreach _disksbusiness_rule_aggregate disks
}
define service {description All Diskshost_name anyhostcheck_command bp_rule!host1,a:disks
}
define service {description All Disks template basedhost_name templatecheck_command bp_rule!,a:disks
206 Chapter 7. Advanced Topics

Shinken Documentation, Release 2.4
register 0}
7.26 Scaling Shinken for large deployments
7.26.1 Planning your deployment
A monitoring system needs to meet the expected requirements. The first thing you, as the system/network administratorneed to do, is get management buy-in on deploying a supervisory and data acquisition system to meet corporate goals.The second is to define the scope of the monitoring system and its particularities.
• Number of services to supervise
• Service check frequency
• Method of supervising the services Passive versus Active
• Protocol used for data acquisition (ping, SSH, NSCA, TSCA, SNMP, NRPE, NSCAweb, collectd, scripts, etc)
• Retention duration for performance data
• Retention duration for status data
• For each status or performance data determine if it meets the scope and goals of the project.
• Can you live with interpolated data (RRD) or do you require exact representation of data (Graphite)
• Do you need to store performance data out of sequence (Graphite) or not (RRD)
• Do you need Active-Active HA for performance data (Graphite)
• Do you want to make use of Shinken’s store and forward inter-process communications architecture to not loseperformance data (Graphite) or not (RRD)
How scalable is Shinken
Shinken can scale out horizontally on multiple servers or vertically with more powerful hardware. Shinken dealsautomatically with distributed status retention. There is also no need to use external clustering or HA solutions.
Scalability can be described through a few key metrics
• Number of hosts + services supervised
• Number of active checks per second (type of active check having a major impact!)
• Number of check results per second (hosts and services combined)
And to a lesser extent, as performance data is not expected to overload a Graphite server instance (Which a singleserver can do up to 80K updates per second with millions of metrics) or even RRDTool+RRDcache with a hardwareRAID 10 of 10K RPM disks.
• Number of performance data points (if using an external time-series database to store performance data)
Passive versus Active
Passive checks do not need to be scheduled by the monitoring server. Data acquisition and processing is distributed tothe monitored hosts permitting lower acquisition intervals and more data points to be collected.
Active checks benefit from Shinken’s powerful availability algorithms for fault isolation and false positive elimination.
7.26. Scaling Shinken for large deployments 207
Shinken Documentation, Release 2.4
A typical installation should make use of both types of checks.
Scaling the data acquisition
Thought needs to be used in determining what protocol to use and how many data points need to be collected willinfluence the acquisition method. There are many ways to slice an apple, but only a few scale beyond a few thousandservices.
What is a big deployment? It depends on check frequency, number of services and check execution latency. 10K perminute NSCA based passive services is nothing for Shinken. 10K SSH checks per minute is unrealistic. 10K SNMPchecks per minute can grind a server to a halt if not using an efficient polling method. Large deployments could easilyask for 20K, 50K, 80K services per minute.
Large numbers of active checks need to use poller modules
• nrpe_booster
• snmp_booster
Other integrated poller modules can be easily developed as required for ICMP(ping), SSH, TCP probes, etc.
Check_mk also uses a daemonized poller for its Windows and Unix agents which also makes it a good choice forscaling data acquisition from hosts. Note that WATO, the configuration front-end is not compatible with Shinken atthis time. Check_mk is also limited to RRD backends.
Scaling the broker
The broker is a key component of the scalable architecture. Only a single broker can be active per scheduler. A brokercan process broks (messages) from multiple schedulers. In most modern deployments, Livestatus is the broker modulethat provides status information to the web frontends. (Nagvis, Multisite, Thruk, etc.) or Shinken’s own WebUImodule. The broker needs memory and processing power.
Avoid using any broker modules that write logs or performance data to disk as an intermediate step prior to submissionto the time series database. Use the Graphite broker module which will directly submit data to load-shared and/orredundant Graphite instances. Graphite is a time-series storage and retrieval database.
Make use of sqlite3 or mongodb to store Livestatus retention data. MongoDB integration with Livestatus is consideredsomewhat experimental, but can be very beneficial if performance and resiliency are desired. Especially when using aspare broker. MongoDB will ensure historical retention data is available to the spare broker, whereas with SQLite, itwill not, and manual syncing is required.
Important: Code optimizations, a new JSON encoder/decoder, indexing and other means of decreasing access timeto the in-memory data have been implemented in Shinken 1.2. These enhancements have improved markedly responsetime for small to extra large Livestatus instances.
Web Interface
MK Multisite and Nagvis are the only viable choices for very large installations. They can use multiple Nagios andShinken monitoring servers as data providers and are based on the Livestatus API. Livestatus is a networked API forefficient remote access to Shinken run time data.
Dependency model
Shinken has a great dependency resolution model. Automatic root cause isolation, at a host level, is one method thatShinken provides. This is based on explicitly defined parent/child relationships. This means that on a service or host
208 Chapter 7. Advanced Topics

Shinken Documentation, Release 2.4
failure, it will automatically reschedule an immediate check of the parent(s). Once the root failure(s) are found, anychildren will be marked as unknown status instead of soft down.
This model is very useful in reducing false positives. What needs to be understood is that it depends on defining adependency tree. A dependency tree is restricted to single scheduler. Shinken provides a distributed architecture, thatneeds at least two trees for it to make sense.
Splitting trees by a logical grouping makes sense. This could be groups of services, geographic location, networkhierarchy or other. Some elements may need to be duplicated at a host level (ex. ping check) like common criticalelements (core routers, datacenter routers, AD, DNS, DHCP, NTP, etc.). A typical tree will involve clients, servers,network paths and dependent services. Make a plan, see if it works. If you need help designing your architecture, aprofessional services offering is in the works by the Shinken principals and their consulting partners.
Scaling the acquisition daemons
Typically pollers and Schedulers use up the most network, CPU and memory resources. Use the distributed architec-ture to scale horizontally on multiple commodity servers. Use at least a pair of Scheduler daemons on each server.Your dependency model should permit at least two trees, preferably 4.
7.26.2 Active acquisition methods
Scaling SNMP acquisition
Typically for networking devices, SNMP v2c is the most efficient method of data acquisition. Security considerationsshould be taken into account on the device accepting snmpv2c requests so that they are filtered to specific hosts andrestricted to the required OIDs, this is device specific. Snmpv2c does not encrypt or protect the data or the passwords.
There is a myriad of SNMP monitoring scripts, most are utter garbage for scalable installations. This is simply dueto the fact that every time they are launched a perl or python interpreter needs to be launched, modules need to beimported, the script executed, results get returned and then the script is cleared from memory. Rinse and repeat, veryinefficient. Only two SNMP polling modules can meet high scalability requirements.
Shinken’s integrated SNMP poller can scale to thousands of SNMP checks per second.
Check_mk also has a good SNMP acquisition model.
Scaling NRPE acquisition
Shinken provides an integrated NRPE check launcher. It is implemented in the poller as a module that allows to bypassthe launch of the check_nrpe process. It reads the check command and opens the connection itself. It allows a bigperformance boost for launching check_nrpe calls.
The command definitions should be identical to the check_nrpe calls.
7.26.3 Passive acquisition methods
Scaling metric acquisition
Metrics or performance data (in Nagios speak) are embedded with check results. A check result can have zero or moreperformance metrics associated with it. Theses are transparently passed off to systems outside of Shinken using aBroker module. The Graphite broker module can easily send more than 2000 metrics per second. We have not testedthe upper limit. Graphite itself can be configured to reach upper bounds of 80K metrics per second.
7.26. Scaling Shinken for large deployments 209
Shinken Documentation, Release 2.4
If a metric does not need its own service, it should be combined with a similar natured check being run on theserver. Services are the expensive commodity, as they have all the intelligence like to them such as timeouts, retries,dependencies, etc. With Shinken 1.2 and fast servers, you should not exceed 60K services for optimum performance.
Recommended protocols for scalable passive acquisition
• TSCA (Used under Z/OS and embedded in applications)
• Ws_Arbiter (Used by GLPI)
• NSCA (generic collection)
• Collectd (metrics only, states are calculated from metrics by the Shinen Scheduler using Shinken Python Trig-gers)
7.26.4 Log management methods
System and application logs should be gathered from servers and network devices. For this a centralized logging andanalysis system is required.
Suggested centralized logging systems: OSSEC+Splunk for OSSEC, loglogic, MK Multisite log manager
Suggested windows agents:
• OSSEC agent
• Splunk universal forwarder
Suggested linux agent:
• OSSEC agent
• Splunk universal forwarder
Suggested Solaris agent:
• OSSEC agent
• Splunk universal forwarder
Splunk can aggregate the data, drop worthless data (unless mandated to log everything due to regulatory compliance),aggregate, analyze and alert back into Shinken. Log reporting and dashboards are a million times better in Splunk thananything else. If regulatory compliance causes too much data to be logged, look into using Kibana+logstash insteadof Splunk, because Splunk costs a wicked lot per year.
7.26.5 SLA reporting methods
Feed Shinken event data back into Splunk, Thruk, Canopsis to get SLA reports. Use MK Multisites Livestatus basedreporting.
7.26.6 Practical optimization tips
Chapter 59. Tuning Shinken For Maximum Performance
Internal Shinken metrics to monitor
210 Chapter 7. Advanced Topics

Shinken Documentation, Release 2.4
7.27 Defining advanced service dependencies
First, the basics. You create service dependencies by adding service dependency definitions in your object configfile(s). In each definition you specify the dependent service, the service you are depending on, and the criteria (if any)that cause the execution and notification dependencies to fail (these are described later).
You can create several dependencies for a given service, but you must add a separate service dependency definition foreach dependency you create.
7.27.1 Example Service Dependencies
The image below shows an example logical layout of service notification and execution dependencies. Differentservices are dependent on other services for notifications and check execution.
In this example, the dependency definitions for Service F on Host C would be defined as follows:
define servicedependency{host_name Host Bservice_description Service Ddependent_host_name Host Cdependent_service_description Service Fexecution_failure_criteria onotification_failure_criteria w,u
}
define servicedependency{
7.27. Defining advanced service dependencies 211

Shinken Documentation, Release 2.4
host_name Host Bservice_description Service Edependent_host_name Host Cdependent_service_description Service Fexecution_failure_criteria nnotification_failure_criteria w,u,c
}
define servicedependency{host_name Host Bservice_description Service Cdependent_host_name Host Cdependent_service_description Service Fexecution_failure_criteria wnotification_failure_criteria c
}
The other dependency definitions shown in the image above would be defined as follows:
define servicedependency{host_name Host Aservice_description Service Adependent_host_name Host Bdependent_service_description Service Dexecution_failure_criteria unotification_failure_criteria n
}
define servicedependency{host_name Host Aservice_description Service Bdependent_host_name Host Bdependent_service_description Service Eexecution_failure_criteria w,unotification_failure_criteria c
}
define servicedependency{host_name Host Bservice_description Service Cdependent_host_name Host Bdependent_service_description Service Eexecution_failure_criteria nnotification_failure_criteria w,u,c
}
7.27.2 How Service Dependencies Are Tested
Before Shinken executes a service check or sends notifications out for a service, it will check to see if the servicehas any dependencies. If it doesn’t have any dependencies, the check is executed or the notification is sent out as itnormally would be. If the service does have one or more dependencies, Shinken will check each dependency entry asfollows:
• Shinken gets the current status:ref:* <advanced/dependencies#advancedtopics_dependencies_hard_dependencies>of the service that is being depended upon.
• Shinken compares the current status of the service that is being depended upon against either the execution or
212 Chapter 7. Advanced Topics
Shinken Documentation, Release 2.4
notification failure options in the dependency definition (whichever one is relevant at the time).
• If the current status of the service that is being depended upon matches one of the failure options, the dependencyis said to have failed and Shinken will break out of the dependency check loop.
• If the current state of the service that is being depended upon does not match any of the failure options for thedependency entry, the dependency is said to have passed and Shinken will go on and check the next dependencyentry.
This cycle continues until either all dependencies for the service have been checked or until one dependency checkfails.
• One important thing to note is that by default, Shinken will use the most current hard state of the service(s) thatis/are being depended upon when it does the dependency checks. If you want Shinken to use the most currentstate of the services (regardless of whether its a soft or hard state), enable the soft_state_dependencies option.
7.27.3 Execution Dependencies
Execution dependencies are used to restrict when active checks of a service can be performed. Passive checks are notrestricted by execution dependencies.
If all of the execution dependency tests for the service passed, Shinken will execute the check of the service as itnormally would. If even just one of the execution dependencies for a service fails, Shinken will temporarily preventthe execution of checks for that (dependent) service. At some point in the future the execution dependency tests forthe service may all pass. If this happens, Shinken will start checking the service again as it normally would. Moreinformation on the check scheduling logic can be found here.
In the example above, Service E would have failed execution dependencies if Service B is in a WARNING or UN-KNOWN state. If this was the case, the service check would not be performed and the check would be scheduled for(potential) execution at a later time.
Warning: Execution dependencies will limit the load due to useless checks, but can limit some correlation logics,and so should be used only if you trully need them.
7.27.4 Notification Dependencies
If all of the notification dependency tests for the service passed, Shinken will send notifications out for the service as itnormally would. If even just one of the notification dependencies for a service fails, Shinken will temporarily repressnotifications for that (dependent) service. At some point in the future the notification dependency tests for the servicemay all pass. If this happens, Shinken will start sending out notifications again as it normally would for the service.More information on the notification logic can be found here.
In the example above, Service F would have failed notification dependencies if Service C is in a CRITICAL state,//and/or* Service D is in a WARNING or UNKNOWN state, and/or// if **Service E* is in a WARNING, UNKNOWN,or CRITICAL state. If this were the case, notifications for the service would not be sent out.
7.27.5 Dependency Inheritance
As mentioned before, service dependencies are not inherited by default. In the example above you can see that ServiceF is dependent on Service E. However, it does not automatically inherit Service E’s dependencies on Service B andService C. In order to make Service F dependent on Service C we had to add another service dependency definition.There is no dependency definition for Service B, so Service F is not dependent on Service B.
If you do wish to make service dependencies inheritable, you must use the inherits_parent directive in the servicedependency definition. When this directive is enabled, it indicates that the dependency inherits dependencies of the
7.27. Defining advanced service dependencies 213

Shinken Documentation, Release 2.4
service that is being depended upon (also referred to as the master service). In other words, if the master service isdependent upon other services and any one of those dependencies fail, this dependency will also fail.
In the example above, imagine that you want to add a new dependency for service F to make it dependent on serviceA. You could create a new dependency definition that specified service F as the dependent service and service A asbeing the master service (i.e. the service that is being dependend on). You could alternatively modify the dependencydefinition for services D and F to look like this:
define servicedependency{host_name Host Bservice_description Service Ddependent_host_name Host Cdependent_service_description Service Fexecution_failure_criteria onotification_failure_criteria ninherits_parent 1
}
Since the inherits_parent directive is enabled, the dependency between services A and D will be tested when thedependency between services F and D are being tested.
Dependencies can have multiple levels of inheritance. If the dependency definition between A and D had its inher-its_parent directive enable and service A was dependent on some other service (let’s call it service G), the service Fwould be dependent on services D, A, and G (each with potentially different criteria).
7.27.6 Host Dependencies
As you’d probably expect, host dependencies work in a similar fashion to service dependencies. The difference is thatthey’re for hosts, not services.
Do not confuse host dependencies with parent/child host relationships. You should be using parent/child host rela-tionships (defined with the parents directive in host definitions) for most cases, rather than host dependencies. Adescription of how parent/child host relationships work can be found in the documentation on network reachability.
Here are the basics about host dependencies:
• A host can be dependent on one or more other host
• Host dependencies are not inherited (unless specifically configured to)
• Host dependencies can be used to cause host check execution and host notifications to be suppressed underdifferent circumstances (UP, DOWN, and/or UNREACHABLE states)
• Host dependencies might only be valid during specific timeperiods
7.27.7 Example Host Dependencies
The image below shows an example of the logical layout of host notification dependencies. Different hosts are depen-dent on other hosts for notifications.
214 Chapter 7. Advanced Topics

Shinken Documentation, Release 2.4
In the example above, the dependency definitions for Host C would be defined as follows:
define hostdependency{host_name Host Adependent_host_name Host Cnotification_failure_criteria d
}
define hostdependency{host_name Host Bdependent_host_name Host Cnotification_failure_criteria d,u
}
As with service dependencies, host dependencies are not inherited. In the example image you can see that Host C doesnot inherit the host dependencies of Host B. In order for Host C to be dependent on Host A, a new host dependencydefinition must be defined.
Host notification dependencies work in a similar manner to service notification dependencies. If all of the notificationdependency tests for the host pass, Shinken will send notifications out for the host as it normally would. If even justone of the notification dependencies for a host fails, Shinken will temporarily repress notifications for that (dependent)host. At some point in the future the notification dependency tests for the host may all pass. If this happens, Shinkenwill start sending out notifications again as it normally would for the host. More information on the notification logiccan be found here.
7.27. Defining advanced service dependencies 215

Shinken Documentation, Release 2.4
7.28 Shinken’s distributed architecture
7.28.1 Shinken’s distributed architecture for load balancing
The load balancing feature is very easy to obtain with Shinken. If I say that the project’s name comes from it youshould believe me :)
If you use the distributed architecture for load balancing, know that load is typically present in 2 processes:
• pollers: they launch checks, they use a lot of CPU resources
• schedulers: they schedule, potentially lots of checks
For both, a limit of 150000 checks/5min is a reasonable goal on an average server(4 cores@3Ghz). Scaling can beachieved horizontally by simply adding more servers and declaring them as pollers or schedulers.
Tip: The scheduler is NOT a multi-threaded process, so even if you add cores to your server, it won’t change it’sperformances.
There are mainly two cases where load is a problem:
• using plugins that require lots of processing (check_esx3.pl is a good example)
• scheduling a very large number of checks (> 150000 checks in 5 minutes).
In the first case, you need to add more pollers. In the second, you need to add more schedulers. In this last case,you should also consider adding more pollers (more checks = more pollers) but that can be determined by the loadobserved on your poller(s).
From now, we will focus on the first case, typically installations have less than 150K checks in 5 minutes, and willonly need to scale pollers, not schedulers.
7.28.2 Setup a load balancing architecture with some pollers
Install the poller on the new server
But I already hear you asking “How to add new satellites?”. That’s very simple: you start by installing the applica-tion on a new server like you did in the 10 min starting tutorial but you can pass the discovery, the webUI andskip the /etc/init.d/shinken script (or Windows services).
Let say that this new server is called server2 and has the IP 192.168.0.2 and the “master” is called server1 with192.168.0.1 as its IP.
Tip: You need to have all plugins you use in server1 also installed on server2, this should already done if you followedthe 10 min tutorial.
On server2, you just need to start the poller service, not the whole Shinken stack.
On ubuntu/debian:update-rc.d shinken-poller defaultOn RedHat/Centos:
chkconfig --add shinken-pollerchkconfig shinken-poller on
Then start it:
216 Chapter 7. Advanced Topics

Shinken Documentation, Release 2.4
sudo /etc/init.d/shinken-poller start
Warning: DO NOT START the arbiter on the server2 for load balancing purpose. It can be done for highavailability. Unless you know what you are doing, don’t start the arbiter process!^_^
Declare the new poller on the main configuration file
Ok, now you have a brand new poller declared on your new server, server2. But server1 needs to know that it mustgive work to it. This is done by declaring the new poller in the pollers/poller-master.cfg file.
Edit your /etc/shinken/pollers/poller-master.cfg file (or c:shinkenetcpollerspoller-master.cfg under Windows) and de-fine your new poller under the existing poller-1 definition (on server1):
#Pollers launch checksdefine poller{
poller_name poller-2address server2port 7771
}
Be sure to have also those lines:
define scheduler{scheduler_name scheduler-1 ; just the nameaddress 192.168.0.1 ; ip or dns address of the daemonport 7768 ; tcp port of the daemon
The address has to be 192.168.0.1 or server1 but not localhost!
Important: Check that the line named host in the scheduler.ini is 0.0.0.0 in order to listen on all interfaces.
When it’s done, restart your arbiter:
Under Linux:sudo /etc/init.d/shinken-arbiter restartUnder Windows:net stop shinken-arbiternet start shinken-arbiter
It’s done! You can look at the global shinken.log file (should be under /var/lib/shinken/shinken.log orc:shinkenvarshinken.log) that the new poller is started and can reach scheduler-1. So look for lines like:
[All] poller satellite order: poller-2 (spare:False), poller-1 (spare:False),[All] Trying to send configuration to poller poller-2[All] Dispatch OK of for configuration 0 to poller poller-2
You can also look at the poller logs on server2. You may have lines like that:
Waiting for initial configuration[poller-2] Init de connection with scheduler-1 at PYROLOC://192.168.0.1:7768/Checks[poller-2] Connexion OK with scheduler scheduler-1We have our schedulers: {0: {'wait_homerun': {}, 'name': u'scheduler-1', 'uri': u'PYROLOC://192.168.0.1:7768/Checks', 'actions': {}, 'instance_id': 0, 'running_id': '1312996582.0', 'address': u'192.168.0.1', 'active': True, 'port': 7768, 'con': <DynamicProxy for PYROLOC://192.168.0.1:7768/Checks>}}I correctly loaded the modules: [][poller-2] Allocating new fork Worker: 0
7.28. Shinken’s distributed architecture 217

Shinken Documentation, Release 2.4
7.29 Shinken’s distributed architecture with realms
7.29.1 Multi customers and/or sites: REALMS
Shinken’s architecture like we saw allows us to have a unique administration and data location. All pollers the hostsare cut and sent to schedulers, and the pollers take jobs from all schedulers. Every one is happy.
Every one? In fact no. If an administrator got a continental distributed architecture he can have serious problems. Ifthe architecture is common to multiple customers network, a customer A scheduler can have a customer B poller thatasks him jobs. It’s not a good solution. Even with distributed network, distant pollers should not ask jobs to schedulersin the other continent, it’s not network efficient.
That is where the site/customers management is useful. In Shinken, it’s managed by the realms.
A realm is a group of resources that will manage hosts or hostgroups. Such a link will be unique: a host cannot be inmultiple realms. If you put a hostgroup in a realm, all hosts in this group will be in the realm (unless a host alreadyhas the realm set, the host value will be taken).
A realm is:
• at least a scheduler
• at least a poller
• can have a reactionner
• can have a broker
In a realm, all realm pollers will take all realm schedulers jobs.
Important: Very important: there is only ONE arbiter (and a spare of course) for ALL realms. The arbiter managesall realms and all that is inside.
7.29.2 Sub-realms
A realm can have sub-realms. It doesn’t change anything for schedulers, but it can be useful for other satellites andspares. Reactionners and brokers are linked to a realm, but they can take jobs from all sub-realms too. This way youcan have less reactionners and brokers (like we soon will see).
The fact that reactionners/brokers (and in fact pollers too) can take jobs from sub-schedulers is decided by the presenceof the manage_sub_realms parameter. For pollers the default value is 0, but it’s 1 for reactionners/brokers.
7.29.3 An example
To make it simple: you put hosts and/or hostgroups in a realm. This last one is to be considered as a resources pool.You don’t need to touch the host/hostgroup definition if you need more/less performances in the realm or if you wantto add a new satellites (a new reactionner for example).
Realms are a way to manage resources. They are the smaller clouds in your global cloud infrastructure :)
If you do not need this feature, that’s not a problem, it’s optional. There will be a default realm created and every onewill be put into.
It’s the same for hosts that don’t have a realm configured: they will be put in the realm that has the “default” parameter.
218 Chapter 7. Advanced Topics

Shinken Documentation, Release 2.4
7.29.4 Picture example
Diagrams are good :)
Let’s take two examples of distributed architectures around the world. In the first case, the administrator don’t wantto share resources between realms. They are distinct. In the second, the reactionners and brokers are shared with allrealms (so all notifications are send from a unique place, and so is all data).
Here is the isolated one:
And a more common way of sharing reactionner/broker:
7.29. Shinken’s distributed architecture with realms 219
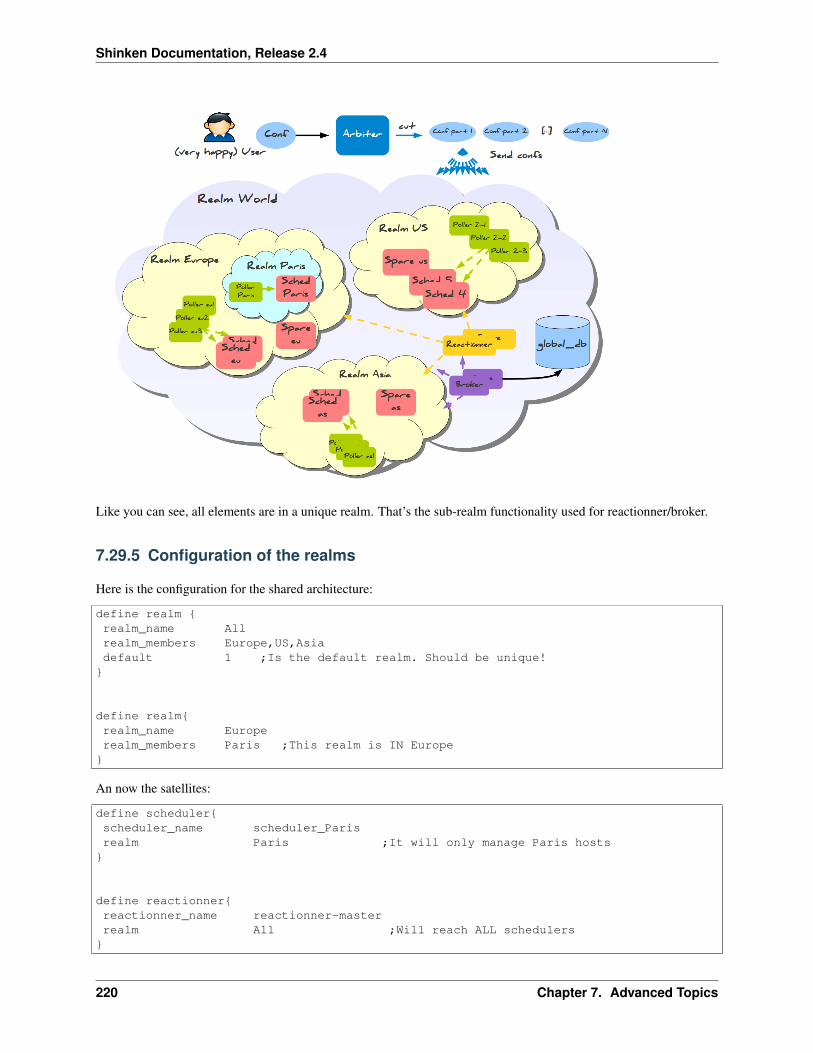
Shinken Documentation, Release 2.4
Like you can see, all elements are in a unique realm. That’s the sub-realm functionality used for reactionner/broker.
7.29.5 Configuration of the realms
Here is the configuration for the shared architecture:
define realm {realm_name Allrealm_members Europe,US,Asiadefault 1 ;Is the default realm. Should be unique!
}
define realm{realm_name Europerealm_members Paris ;This realm is IN Europe
}
An now the satellites:
define scheduler{scheduler_name scheduler_Parisrealm Paris ;It will only manage Paris hosts
}
define reactionner{reactionner_name reactionner-masterrealm All ;Will reach ALL schedulers
}
220 Chapter 7. Advanced Topics

Shinken Documentation, Release 2.4
And in host/hostgroup definition:
define host{host_name server-parisrealm Paris ;Will be put in the Paris realm[...]
}
define hostgroups{hostgroup_name linux-serversalias Linux Serversmembers srv1,srv2realm Europe ;Will be put in the Europe realm
}
7.29.6 Multi levels brokers
In the previous samples, if you put numerous brokers into the realm, each scheduler will have only one broker at thesame time. It was also impossible to have a common Broker in All, and one brokers in each sub-realms.
You can activate multi-brokers features with a realm parameter, the broker_complete_links option (0 by default).
You will have to enable this option in ALL your realms! For example:
define realm{realm_name Europebroker_complete_links 1
}
This will enable the fact that each scehduler will be linked with each brokers. This will make possible to havededicated brokers in a same realm (one for WebUI, another for Graphite for example). It will also make possibleto have a common Broker in “All”, and one broker in each of its sub-realms (Europe, US and Asia). Of course thesub-brokers will only see the data from their realms, and the sub-realms (like Paris for Europe for example).
7.30 Businessimpact modulations
7.30.1 How businessimpact modulations works
Depending on your configuration you may want to change the business impact of a specific host during the night. Forexample you don’t consider a specific application as critical for business during night because there are no users, soimpact is lower on errors.
7.30.2 How to define a businessimpact_modulation
define businessimpactmodulation{business_impact_modulation_name LowImpactOnNightbusiness_impact 1modulation_period night
}
define service{
7.30. Businessimpact modulations 221
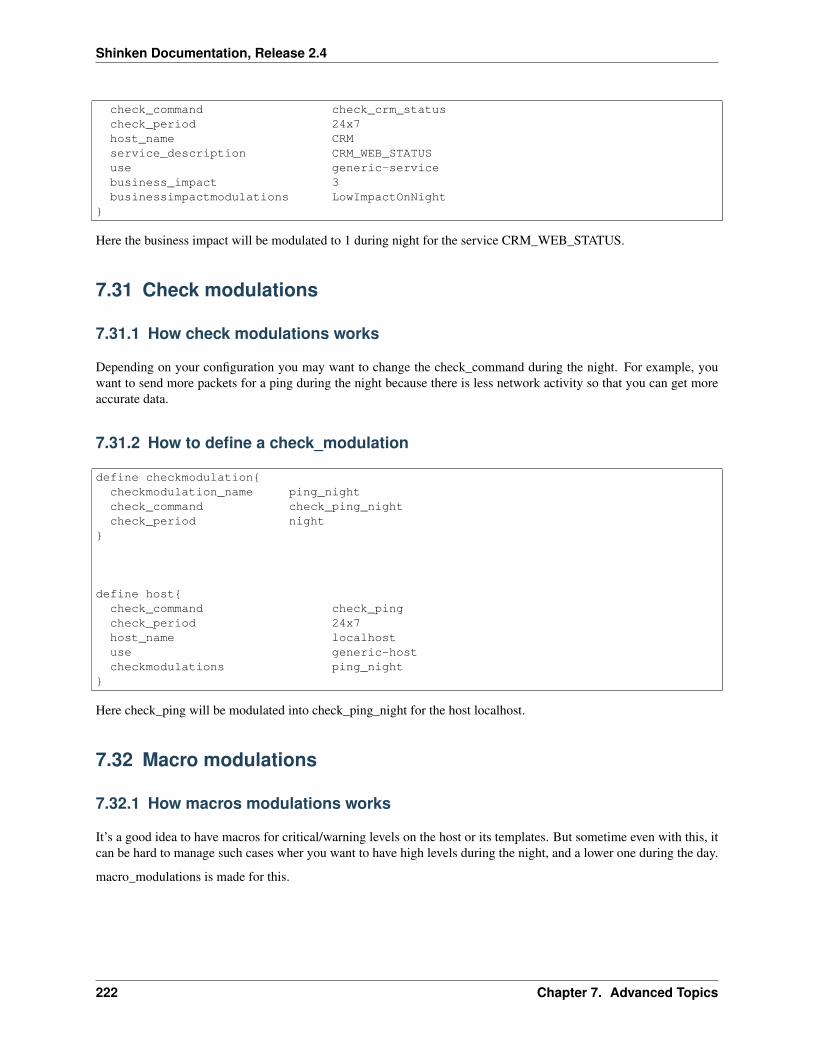
Shinken Documentation, Release 2.4
check_command check_crm_statuscheck_period 24x7host_name CRMservice_description CRM_WEB_STATUSuse generic-servicebusiness_impact 3businessimpactmodulations LowImpactOnNight
}
Here the business impact will be modulated to 1 during night for the service CRM_WEB_STATUS.
7.31 Check modulations
7.31.1 How check modulations works
Depending on your configuration you may want to change the check_command during the night. For example, youwant to send more packets for a ping during the night because there is less network activity so that you can get moreaccurate data.
7.31.2 How to define a check_modulation
define checkmodulation{checkmodulation_name ping_nightcheck_command check_ping_nightcheck_period night
}
define host{check_command check_pingcheck_period 24x7host_name localhostuse generic-hostcheckmodulations ping_night
}
Here check_ping will be modulated into check_ping_night for the host localhost.
7.32 Macro modulations
7.32.1 How macros modulations works
It’s a good idea to have macros for critical/warning levels on the host or its templates. But sometime even with this, itcan be hard to manage such cases wher you want to have high levels during the night, and a lower one during the day.
macro_modulations is made for this.
222 Chapter 7. Advanced Topics

Shinken Documentation, Release 2.4
7.32.2 How to define a macro_modulation
define macromodulation{macromodulation_name HighDuringNightmodulation_period night_CRITICAL 20_WARNING 10
}
define host{check_command check_pingcheck_period 24x7host_name localhostuse generic-hostmacromodulations HighDuringNight_CRITICAL 5_WARNING 2
}
With this, the services will get 5 and 2 for the threshold macros during the day, and will automatically get 20 and 10during the night timeperiod. You can have as many modulations as you want. The first modulation enabled will takethe lead.
7.33 Result modulations
7.33.1 How result modulations works
Depending on your configuration you may want to consider a critical state returned by plugin to be only a warning.For example if you don’t want a critical state to be emitted during the night (because it will wake someone up) thenyou can consider the critical state as a warning.
7.33.2 How to define a result_modulation
define resultmodulation{resultmodulation_name critical_is_warningexit_codes_match 2 ; list of code to changeexit_code_modulation 1 ; code that will be put if the code matchmodulation_period night ; period when to apply the modulation
}
define host{check_command check_pingcheck_period 24x7host_name localhostuse generic-hostresultmodulations critical_is_warning
}
Here critical from check_ping will be modulated into a warning for the host localhost.
7.33. Result modulations 223
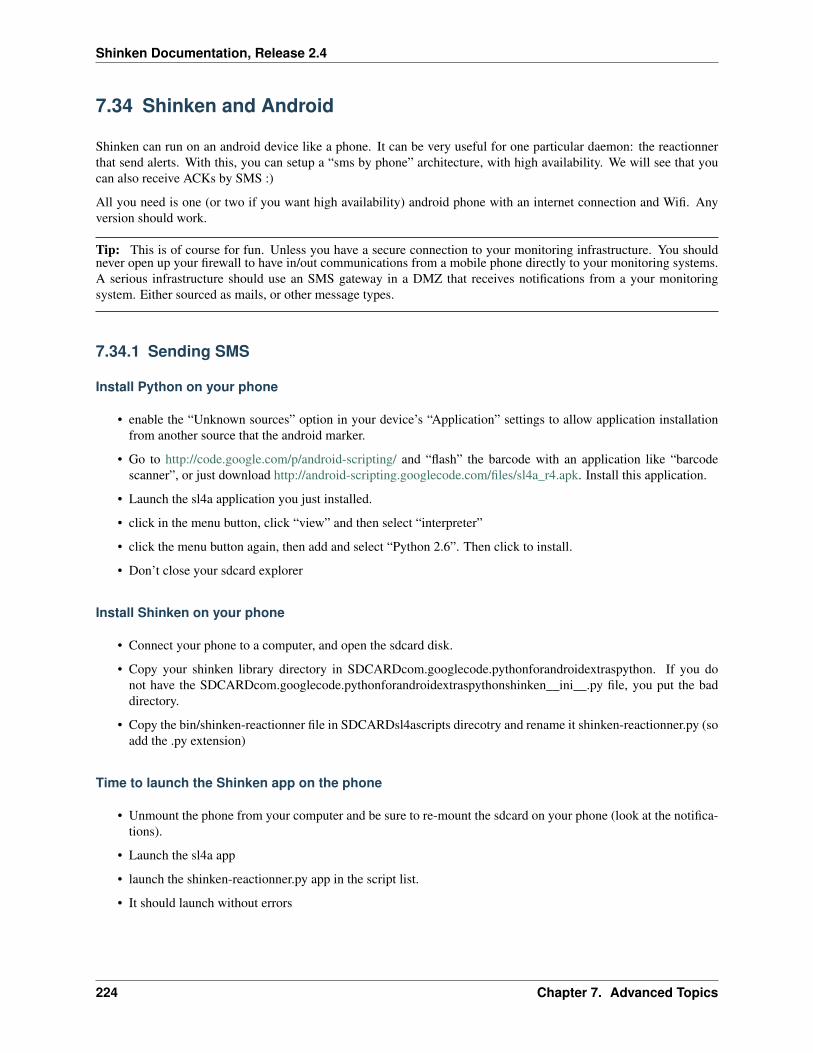
Shinken Documentation, Release 2.4
7.34 Shinken and Android
Shinken can run on an android device like a phone. It can be very useful for one particular daemon: the reactionnerthat send alerts. With this, you can setup a “sms by phone” architecture, with high availability. We will see that youcan also receive ACKs by SMS :)
All you need is one (or two if you want high availability) android phone with an internet connection and Wifi. Anyversion should work.
Tip: This is of course for fun. Unless you have a secure connection to your monitoring infrastructure. You shouldnever open up your firewall to have in/out communications from a mobile phone directly to your monitoring systems.A serious infrastructure should use an SMS gateway in a DMZ that receives notifications from a your monitoringsystem. Either sourced as mails, or other message types.
7.34.1 Sending SMS
Install Python on your phone
• enable the “Unknown sources” option in your device’s “Application” settings to allow application installationfrom another source that the android marker.
• Go to http://code.google.com/p/android-scripting/ and “flash” the barcode with an application like “barcodescanner”, or just download http://android-scripting.googlecode.com/files/sl4a_r4.apk. Install this application.
• Launch the sl4a application you just installed.
• click in the menu button, click “view” and then select “interpreter”
• click the menu button again, then add and select “Python 2.6”. Then click to install.
• Don’t close your sdcard explorer
Install Shinken on your phone
• Connect your phone to a computer, and open the sdcard disk.
• Copy your shinken library directory in SDCARDcom.googlecode.pythonforandroidextraspython. If you donot have the SDCARDcom.googlecode.pythonforandroidextraspythonshinken__ini__.py file, you put the baddirectory.
• Copy the bin/shinken-reactionner file in SDCARDsl4ascripts direcotry and rename it shinken-reactionner.py (soadd the .py extension)
Time to launch the Shinken app on the phone
• Unmount the phone from your computer and be sure to re-mount the sdcard on your phone (look at the notifica-tions).
• Launch the sl4a app
• launch the shinken-reactionner.py app in the script list.
• It should launch without errors
224 Chapter 7. Advanced Topics

Shinken Documentation, Release 2.4
Declare this daemon in the central configuration
The phone(s) will be a new reactionner daemon. You should want to only launch SMS with it, not mail commands ornother notifications. So you will have to define this reactionner to manage only the SMS commands.
define reactionner{reactionner_name reactionner-Androidaddress WIFIIPOFYOURPHONEport 7769spare 0
# Modulesmodules AndroidSMSreactionner_tags android_sms
}
# Reactionner can be launched under an android device# and can be used to send SMS with this moduledefine module{
module_name AndroidSMSmodule_type android_sms
}
The important lines are:
• address: put the Wifi address of your phone
• modules: load the Android module to be able to manage sms sent.
• reactionner_tags: only android_sms commands will be send to this reactionner.
In the commands.cfg, there are example of sms sending commands
# For Android SMS things# You need both reactionner_tag and module_type in most cases!define command{
command_name notify-host-by-android-smscommand_line android_sms $CONTACTPAGER$ Host: $HOSTNAME$\nAddress: $HOSTADDRESS$\nState: $HOSTSTATE$\nInfo: $OUTPUT$\nDate: $DATETIME$reactionner_tag android_smsmodule_type android_sms
}
define command{command_name notify-service-by-android-smscommand_line android_sms $CONTACTPAGER$ Service: $SERVICEDESC$\nHost: $HOSTNAME$\nAddress: $HOSTADDRESS$\nState: $SERVICESTATE$\nInfo: $OUTPUT$\nDate: $DATETIME$reactionner_tag android_smsmodule_type android_sms
}
The important part are the reactionner_tag and module_type lines. With this parameter, you are sure the command will be managed by:
• only the reactionner(s) with the tag android_sms, and in this reactionner, it will be managed by the moduleandroid_sms.
7.34. Shinken and Android 225
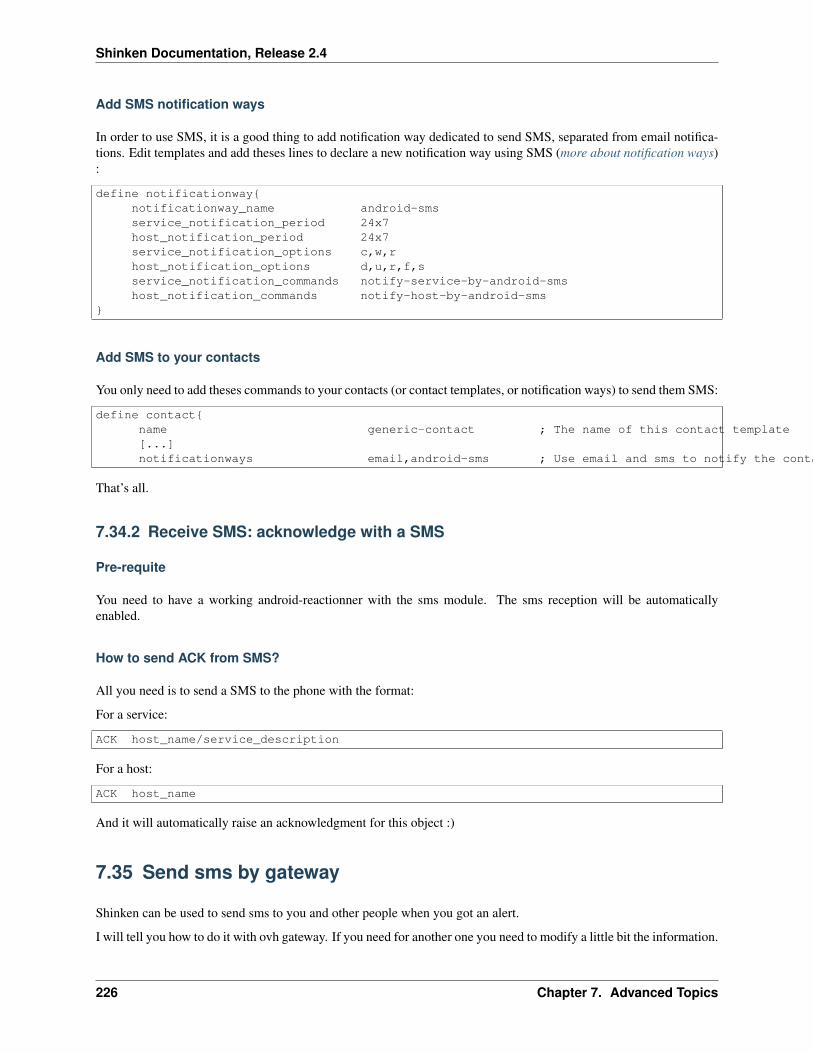
Shinken Documentation, Release 2.4
Add SMS notification ways
In order to use SMS, it is a good thing to add notification way dedicated to send SMS, separated from email notifica-tions. Edit templates and add theses lines to declare a new notification way using SMS (more about notification ways):
define notificationway{notificationway_name android-smsservice_notification_period 24x7host_notification_period 24x7service_notification_options c,w,rhost_notification_options d,u,r,f,sservice_notification_commands notify-service-by-android-smshost_notification_commands notify-host-by-android-sms
}
Add SMS to your contacts
You only need to add theses commands to your contacts (or contact templates, or notification ways) to send them SMS:
define contact{name generic-contact ; The name of this contact template[...]notificationways email,android-sms ; Use email and sms to notify the contact
That’s all.
7.34.2 Receive SMS: acknowledge with a SMS
Pre-requite
You need to have a working android-reactionner with the sms module. The sms reception will be automaticallyenabled.
How to send ACK from SMS?
All you need is to send a SMS to the phone with the format:
For a service:
ACK host_name/service_description
For a host:
ACK host_name
And it will automatically raise an acknowledgment for this object :)
7.35 Send sms by gateway
Shinken can be used to send sms to you and other people when you got an alert.
I will tell you how to do it with ovh gateway. If you need for another one you need to modify a little bit the information.
226 Chapter 7. Advanced Topics
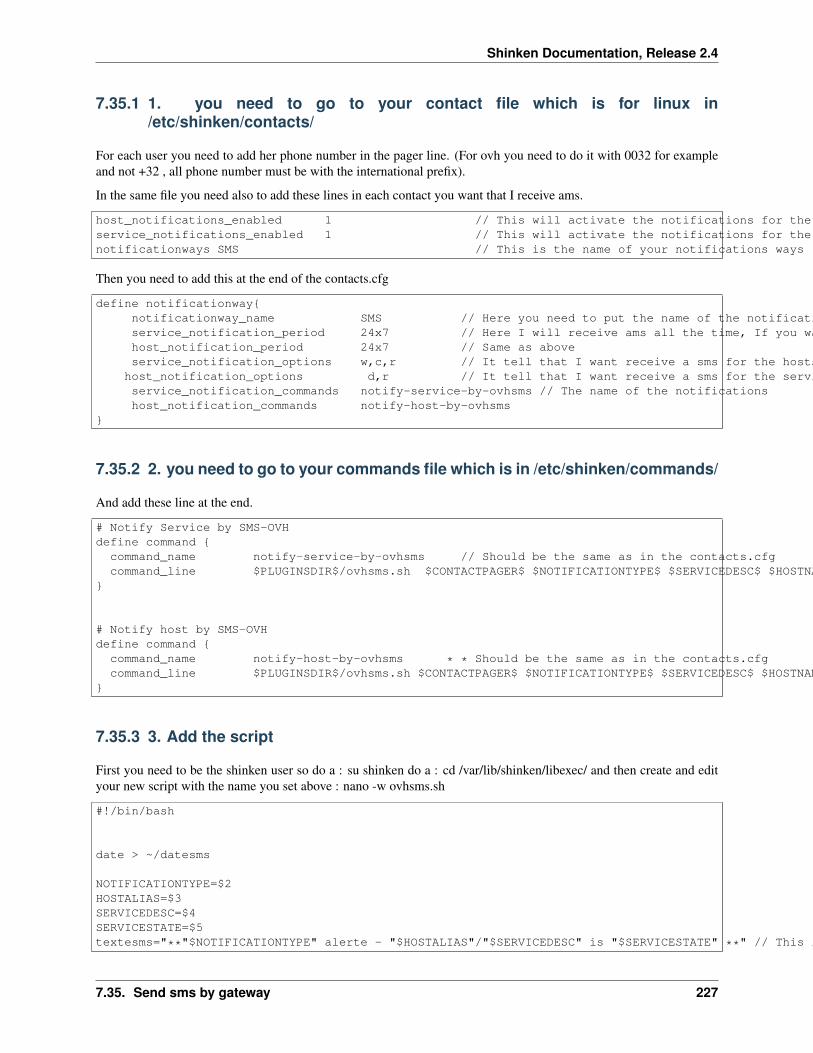
Shinken Documentation, Release 2.4
7.35.1 1. you need to go to your contact file which is for linux in/etc/shinken/contacts/
For each user you need to add her phone number in the pager line. (For ovh you need to do it with 0032 for exampleand not +32 , all phone number must be with the international prefix).
In the same file you need also to add these lines in each contact you want that I receive ams.
host_notifications_enabled 1 // This will activate the notifications for the hostsservice_notifications_enabled 1 // This will activate the notifications for the servicesnotificationways SMS // This is the name of your notifications ways ( You can write what you want but remember what you set )
Then you need to add this at the end of the contacts.cfg
define notificationway{notificationway_name SMS // Here you need to put the name of the notifications ways you write upservice_notification_period 24x7 // Here I will receive ams all the time, If you want to receive them for only the night replace 24x7 by night.host_notification_period 24x7 // Same as aboveservice_notification_options w,c,r // It tell that I want receive a sms for the hosts who are in warning / critical / recovery
host_notification_options d,r // It tell that I want receive a sms for the services who are down and recoveryservice_notification_commands notify-service-by-ovhsms // The name of the notificationshost_notification_commands notify-host-by-ovhsms
}
7.35.2 2. you need to go to your commands file which is in /etc/shinken/commands/
And add these line at the end.
# Notify Service by SMS-OVHdefine command {
command_name notify-service-by-ovhsms // Should be the same as in the contacts.cfgcommand_line $PLUGINSDIR$/ovhsms.sh $CONTACTPAGER$ $NOTIFICATIONTYPE$ $SERVICEDESC$ $HOSTNAME$ $SE$ // Tell which script shinken as to use to send sms. We will create it after.
}
# Notify host by SMS-OVHdefine command {
command_name notify-host-by-ovhsms * * Should be the same as in the contacts.cfgcommand_line $PLUGINSDIR$/ovhsms.sh $CONTACTPAGER$ $NOTIFICATIONTYPE$ $SERVICEDESC$ $HOSTNAME$ $SER$ // Tell which script shinken as to use to send sms. We will create it after.
}
7.35.3 3. Add the script
First you need to be the shinken user so do a : su shinken do a : cd /var/lib/shinken/libexec/ and then create and edityour new script with the name you set above : nano -w ovhsms.sh
#!/bin/bash
date > ~/datesms
NOTIFICATIONTYPE=$2HOSTALIAS=$3SERVICEDESC=$4SERVICESTATE=$5textesms="**"$NOTIFICATIONTYPE" alerte - "$HOSTALIAS"/"$SERVICEDESC" is "$SERVICESTATE" **" // This is the message who will be send. You can add something if you want.
7.35. Send sms by gateway 227

Shinken Documentation, Release 2.4
wget -o ~/logenvoisms -O ~/response "https://www.ovh.com/cgi-bin/sms/http2sms.cgi?smsAccount=sms-XXXXXXXX-1&login=XXXXXXXX&password=XXXXXXXX&from=XXXXXXXXXXX&to=$1&contentType=text/xml&message=$textesms" // This is the command who will send the sms. You need to adapt it with you gateway settings.
exit 0
7.35.4 4. Test It
Save your file and do : “exit” To exit the shinken user. Then set down one of your host or service to test if you receiveit.
7.36 Triggers
Warning: This is currently in Beta. DO NOT use in production.
7.36.1 Define and use triggers
A trigger object is something that can be called after a “change” on an object. It’s a bit like Zabbix trigger, and shouldbe used only if you need it. In most cases, direct check is easier to setup :)
Here is an example that will raise a critical check if the CPU is too loaded:
Note: If your trigger is made to edit output add the trigger_broker_raise_enabled parameter into the service definition.If not, Shinken will generate 2 broks (1 before and 1 after the trigger). This can lead to bad data in broker module(Graphite)
define service{use local-service ; Name of service template to usehost_name localhostservice_description Current Load triggercheck_command check_local_load!5.0,4.0,3.0!10.0,6.0,4.0trigger_name simple_cputrigger_broker_raise_enabled 1}
Then define your trigger in etc/trigger.d/yourtrigger.trig. here the file is simple_cpu.trig
try:
load = perf(self, 'load1')print "Founded load", loadif load >= 10:
critical(self, 'CRITICAL | load=%d' % load)elif load >= 5:
warning(self, 'WARNING | load=%d' % load)else:
ok(self, 'OK | load=%d' % load)except:
unknown(self, 'UNKNOWN | load=%d' % load)
Finally, add the triggers_dir=trigger.d statement to your shinken.cfg
228 Chapter 7. Advanced Topics

Shinken Documentation, Release 2.4
7.37 Unused nagios parameters
The parameters below are managed in Nagios but not in Shinken because they are useless in the architecture. If youreally need one of them, please use Nagios instead or send us a patch :)
Note: The title is quite ambiguous : a not implemented parameter is different from an unused parameter.
The difference has been done in this page, why about creating a not_implemented_nagios_parameters?
7.37.1 External Command Check Interval (Unused)
Format: command_check_interval=<xxx>[s]Example: command_check_interval=1
If you specify a number with an “s” appended to it (i.e. 30s), this is the number of seconds to wait between externalcommand checks. If you leave off the “s”, this is the number of “time units” to wait between external commandchecks. Unless you’ve changed the Timing Interval Length value (as defined below) from the default value of 60, thisnumber will mean minutes.
By setting this value to -1, Nagios will check for external commands as often as possible. Each time Nagios checksfor external commands it will read and process all commands present in the External Command File before continuingon with its other duties. More information on external commands can be found here.
7.37.2 External Command Buffer Slots (Not implemented)
Format: external_command_buffer_slots=<#>Example: external_command_buffer_slots=512
This is an advanced feature.
This option determines how many buffer slots Nagios will reserve for caching external commands that have been readfrom the external command file by a worker thread, but have not yet been processed by the main thread of the Nagiosdeamon. Each slot can hold one external command, so this option essentially determines how many commands canbe buffered. For installations where you process a large number of passive checks (e.g. distributed setups), you mayneed to increase this number. You should consider using MRTG to graph Nagios’ usage of external command buffers.
7.37.3 Use Retained Program State Option (Not implemented)
Format: use_retained_program_state=<0/1>Example: use_retained_program_state=1
This setting determines whether or not Nagios will set various program-wide state variables based on the values savedin the retention file. Some of these program-wide state variables that are normally saved across program restarts if stateretention is enabled include the Notifications Option, Flap Detection Option, Event Handler Option, Service CheckExecution Option, and Passive Service Check Acceptance Option !!!!!!!!!! options. If you do not have State RetentionOption enabled, this option has no effect.
• 0 = Don’t use retained program state
• 1 = Use retained program state (default)
7.37. Unused nagios parameters 229

Shinken Documentation, Release 2.4
7.37.4 Use Retained Scheduling Info Option (Not implemented)
Format: use_retained_scheduling_info=<0/1>Example: use_retained_scheduling_info=1
This setting determines whether or not Nagios will retain scheduling info (next check times) for hosts and serviceswhen it restarts. If you are adding a large number (or percentage) of hosts and services, I would recommend disablingthis option when you first restart Nagios, as it can adversely skew the spread of initial checks. Otherwise you willprobably want to leave it enabled.
• 0 = Don’t use retained scheduling info
• 1 = Use retained scheduling info (default)
7.37.5 Retained Host and Service Attribute Masks (Not implemented)
Format: retained_host_attribute_mask=<number>retained_service_attribute_mask=<number>
Example: retained_host_attribute_mask=0retained_service_attribute_mask=0
This is an advanced feature. You’ll need to read the Nagios source code to use this option effectively.
These options determine which host or service attributes are NOT retained across program restarts. The values forthese options are a bitwise AND of values specified by the “MODATTR_” definitions in the “include/common.h”source code file. By default, all host and service attributes are retained.
7.37.6 Retained Process Attribute Masks (Not implemented)
Format: retained_process_host_attribute_mask=<number>retained_process_service_attribute_mask=<number>
Exam-ple:
retained_process_host_attribute_mask=0retained_process_service_attribute_mask=0
This is an advanced feature. You’ll need to read the Nagios source code to use this option effectively.
These options determine which process attributes are NOT retained across program restarts. There are two masksbecause there are often separate host and service process attributes that can be changed. For example, host checkscan be disabled at the program level, while service checks are still enabled. The values for these options are a bitwiseAND of values specified by the “MODATTR_” definitions in the “include/common.h” source code file. By default,all process attributes are retained.
7.37.7 Retained Contact Attribute Masks (Not implemented)
Format: retained_contact_host_attribute_mask=<number>retained_contact_service_attribute_mask=<number>
Exam-ple:
retained_contact_host_attribute_mask=0iretained_contact_service_attribute_mask=0
This is an advanced feature. You’ll need to read the Nagios source code to use this option effectively.
These options determine which contact attributes are NOT retained across program restarts. There are two masksbecause there are often separate host and service contact attributes that can be changed. The values for these optionsare a bitwise AND of values specified by the “MODATTR_” definitions in the “include/common.h” source code file.By default, all process attributes are retained.
230 Chapter 7. Advanced Topics

Shinken Documentation, Release 2.4
7.37.8 Service Inter-Check Delay Method (Unused)
Format: service_inter_check_delay_method=<n/d/s/x.xx>Example: service_inter_check_delay_method=s
This option allows you to control how service checks are initially “spread out” in the event queue. Using a “smart”delay calculation (the default) will cause Nagios to calculate an average check interval and spread initial checks ofall services out over that interval, thereby helping to eliminate CPU load spikes. Using no delay is generally notrecommended, as it will cause all service checks to be scheduled for execution at the same time. This means thatyou will generally have large CPU spikes when the services are all executed in parallel. More information on how toestimate how the inter-check delay affects service check scheduling can be found here. Values are as follows:
• n = Don’t use any delay - schedule all service checks to run immediately (i.e. at the same time!)
• d = Use a “dumb” delay of 1 second between service checks
• s = Use a “smart” delay calculation to spread service checks out evenly (default)
• x.xx = Use a user-supplied inter-check delay of x.xx seconds
7.37.9 Inter-Check Sleep Time (Unused)
Format: sleep_time=<seconds>Example: sleep_time=1
This is the number of seconds that Nagios will sleep before checking to see if the next service or host check in thescheduling queue should be executed. Note that Nagios will only sleep after it “catches up” with queued service checksthat have fallen behind.
7.37.10 Service Interleave Factor (Unused)
Format: service_interleave_factor=<s/x>Example: service_interleave_factor=s
This variable determines how service checks are interleaved. Interleaving allows for a more even distribution of servicechecks, reduced load on remote hosts, and faster overall detection of host problems. Setting this value to 1 is equivalentto not interleaving the service checks (this is how versions of Nagios previous to 0.0.5 worked). Set this value to s(smart) for automatic calculation of the interleave factor unless you have a specific reason to change it. The best wayto understand how interleaving works is to watch the status CGI (detailed view) when Nagios is just starting. Youshould see that the service check results are spread out as they begin to appear. More information on how interleavingworks can be found here.
• x = A number greater than or equal to 1 that specifies the interleave factor to use. An interleave factor of 1 isequivalent to not interleaving the service checks.
• s = Use a “smart” interleave factor calculation (default)
7.37.11 Maximum Concurrent Service Checks (Unused)
Format: max_concurrent_checks=<max_checks>Example: max_concurrent_checks=20
This option allows you to specify the maximum number of service checks that can be run in parallel at any given time.Specifying a value of 1 for this variable essentially prevents any service checks from being run in parallel. Specifyinga value of 0 (the default) does not place any restrictions on the number of concurrent checks. You’ll have to modifythis value based on the system resources you have available on the machine that runs Nagios, as it directly affects the
7.37. Unused nagios parameters 231

Shinken Documentation, Release 2.4
maximum load that will be imposed on the system (processor utilization, memory, etc.). More information on how toestimate how many concurrent checks you should allow can be found here.
7.37.12 Check Result Reaper Frequency (Unused)
Format: check_result_reaper_frequency=<frequency_in_seconds>Example: check_result_reaper_frequency=5
This option allows you to control the frequency in seconds of check result “reaper” events. “Reaper” events processthe results from host and service checks that have finished executing. These events consitute the core of the monitoringlogic in Nagios.
7.37.13 Maximum Check Result Reaper Time
Note: Is it Unused or Not Implemeted??
Format: max_check_result_reaper_time=<seconds>Example: max_check_result_reaper_time=30
This option allows you to control the maximum amount of time in seconds that host and service check result “reaper”events are allowed to run. “Reaper” events process the results from host and service checks that have finished exe-cuting. If there are a lot of results to process, reaper events may take a long time to finish, which might delay timelyexecution of new host and service checks. This variable allows you to limit the amount of time that an individualreaper event will run before it hands control back over to Nagios for other portions of the monitoring logic.
7.37.14 Check Result Path (Unused)
Format: check_result_path=<path>Example: check_result_path=/var/spool/nagios/checkresults
This options determines which directory Nagios will use to temporarily store host and service check results beforethey are processed. This directory should not be used to store any other files, as Nagios will periodically clean thisdirectory of old file (see the :ref:Max Check Result File Age option above for more information).
Make sure that only a single instance of Nagios has access to the check result path. If multiple instances of Nagioshave their check result path set to the same directory, you will run into problems with check results being processed(incorrectly) by the wrong instance of Nagios!
7.37.15 Max Check Result File Age (Unused)
Format: max_check_result_file_age=<seconds>Example: max_check_result_file_age=3600
This options determines the maximum age in seconds that Nagios will consider check result files found in thecheck_result_path directory to be valid. Check result files that are older that this threshold will be deleted by Na-gios and the check results they contain will not be processed. By using a value of zero (0) with this option, Nagioswill process all check result files - even if they’re older than your hardware :-).
232 Chapter 7. Advanced Topics

Shinken Documentation, Release 2.4
7.37.16 Host Inter-Check Delay Method (Unused)
Format: host_inter_check_delay_method=<n/d/s/x.xx>Example: host_inter_check_delay_method=s
This option allows you to control how host checks that are scheduled to be checked on a regular basis are initially“spread out” in the event queue. Using a “smart” delay calculation (the default) will cause Nagios to calculate anaverage check interval and spread initial checks of all hosts out over that interval, thereby helping to eliminate CPUload spikes. Using no delay is generally not recommended. Using no delay will cause all host checks to be scheduledfor execution at the same time. More information on how to estimate how the inter-check delay affects host checkscheduling can be found here. Values are as follows:
• n = Don’t use any delay - schedule all host checks to run immediately (i.e. at the same time!)
• d = Use a “dumb” delay of 1 second between host checks
• s = Use a “smart” delay calculation to spread host checks out evenly (default)
• x.xx = Use a user-supplied inter-check delay of x.xx seconds
7.37.17 Auto-Rescheduling Option (Not implemented)
Format: auto_reschedule_checks=<0/1>Example: auto_reschedule_checks=1
This option determines whether or not Nagios will attempt to automatically reschedule active host and service checksto “smooth” them out over time. This can help to balance the load on the monitoring server, as it will attempt to keepthe time between consecutive checks consistent, at the expense of executing checks on a more rigid schedule.
THIS IS AN EXPERIMENTAL FEATURE AND MAY BE REMOVED IN FUTURE VERSIONS. ENABLING THISOPTION CAN DEGRADE PERFORMANCE - RATHER THAN INCREASE IT - IF USED IMPROPERLY!
7.37.18 Auto-Rescheduling Interval (Not implemented)
Format: auto_rescheduling_interval=<seconds>Example: auto_rescheduling_interval=30
This option determines how often (in seconds) Nagios will attempt to automatically reschedule checks. This optiononly has an effect if the Auto-Rescheduling Option option is enabled. Default is 30 seconds.
THIS IS AN EXPERIMENTAL FEATURE AND MAY BE REMOVED IN FUTURE VERSIONS. ENABLINGTHE AUTO-RESCHEDULING OPTION CAN DEGRADE PERFORMANCE - RATHER THAN INCREASE IT -IF USED IMPROPERLY!
7.37.19 Auto-Rescheduling Window (Not implemented)
Format: auto_rescheduling_window=<seconds>Example: auto_rescheduling_window=180
This option determines the “window” of time (in seconds) that Nagios will look at when automatically reschedulingchecks. Only host and service checks that occur in the next X seconds (determined by this variable) will be resched-uled. This option only has an effect if the Auto-Rescheduling Option option is enabled. Default is 180 seconds (3minutes).
7.37. Unused nagios parameters 233

Shinken Documentation, Release 2.4
THIS IS AN EXPERIMENTAL FEATURE AND MAY BE REMOVED IN FUTURE VERSIONS. ENABLINGTHE AUTO-RESCHEDULING OPTION CAN DEGRADE PERFORMANCE - RATHER THAN INCREASE IT -IF USED IMPROPERLY!
7.37.20 Translate Passive Host Checks Option (Not implemented)
Format: translate_passive_host_checks=<0/1>Example: translate_passive_host_checks=1
This option determines whether or not Nagios will translate DOWN/UNREACHABLE passive host check results totheir “correct” state from the viewpoint of the local Nagios instance. This can be very useful in distributed and failovermonitoring installations. More information on passive check state translation can be found here.
• 0 = Disable check translation (default)
• 1 = Enable check translation
7.37.21 Child Process Memory Option (Unused)
Format: free_child_process_memory=<0/1>Example: free_child_process_memory=0
This option determines whether or not Nagios will free memory in child processes when they are fork()ed off fromthe main process. By default, Nagios frees memory. However, if the use_large_installation_tweaks option is enabled,it will not. By defining this option in your configuration file, you are able to override things to get the behavior youwant.
• 0 = Don’t free memory
• 1 = Free memory
7.37.22 Child Processes Fork Twice (Unused)
Format: child_processes_fork_twice=<0/1>Example: child_processes_fork_twice=0
This option determines whether or not Nagios will fork() child processes twice when it executes host and servicechecks. By default, Nagios fork()s twice. However, if the use_large_installation_tweaks option is enabled, it will onlyfork() once. By defining this option in your configuration file, you are able to override things to get the behavior youwant.
• 0 = Fork() just once
• 1 = Fork() twice
7.37.23 Event Broker Options (Unused)
Format: event_broker_options=<#>Example: event_broker_options=-1
This option controls what (if any) data gets sent to the event broker and, in turn, to any loaded event broker modules.This is an advanced option. When in doubt, either broker nothing (if not using event broker modules) or brokereverything (if using event broker modules). Possible values are shown below.
• 0 = Broker nothing
234 Chapter 7. Advanced Topics

Shinken Documentation, Release 2.4
• -1 = Broker everything
• # = See BROKER_* definitions in source code (“include/broker.h”) for other values that can be OR’ed together
7.37.24 Event Broker Modules (Unused)
Format: broker_module=<modulepath> [moduleargs]Example: broker_module=/usr/local/nagios/bin/ndomod.o cfg_file=/usr/local/nagios/etc/ndomod.cfg
This directive is used to specify an event broker module that should by loaded by Nagios at startup. Use multipledirectives if you want to load more than one module. Arguments that should be passed to the module at startup areseparated from the module path by a space.
Do NOT overwrite modules while they are being used by Nagios or Nagios will crash in a fiery display of SEGFAULTglory. This is a bug/limitation either in “dlopen()”, the kernel, and/or the filesystem. And maybe Nagios...
The correct/safe way of updating a module is by using one of these methods:
• Shutdown Nagios, replace the module file, restart Nagios
• While Nagios is running... delete the original module file, move the new module file into place, restart Nagios
7.37.25 Debug File (Unused)
Format: debug_file=<file_name>Example: debug_file=/usr/local/nagios/var/nagios.debug
This option determines where Nagios should write debugging information. What (if any) information is written isdetermined by the Debug Level and Debug Verbosity options. You can have Nagios automaticaly rotate the debug filewhen it reaches a certain size by using the Maximum Debug File Size option.
7.37.26 Debug Level (Unused)
Format: debug_level=<#>Example: debug_level=24
This option determines what type of information Nagios should write to the Debug File. This value is a logical OR ofthe values below.
• -1 = Log everything
• 0 = Log nothing (default)
• 1 = Function enter/exit information
• 2 = Config information
• 4 = Process information
• 8 = Scheduled event information
• 16 = Host/service check information
• 32 = Notification information
• 64 = Event broker information
7.37. Unused nagios parameters 235
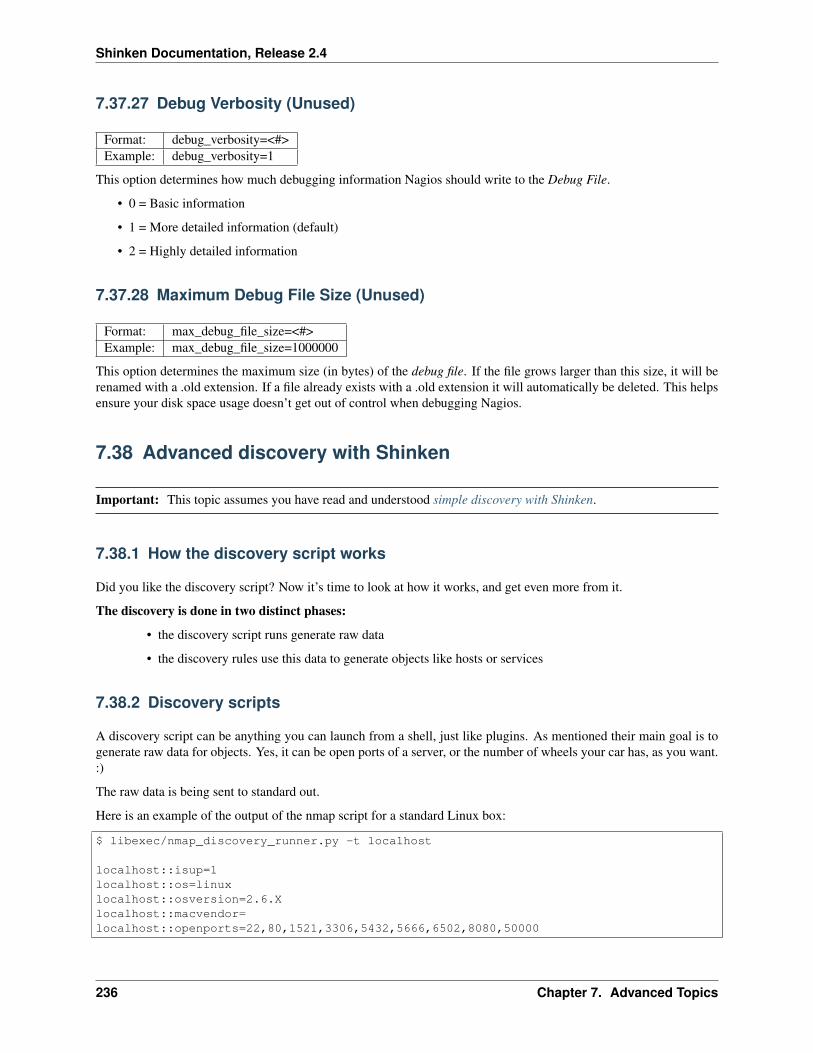
Shinken Documentation, Release 2.4
7.37.27 Debug Verbosity (Unused)
Format: debug_verbosity=<#>Example: debug_verbosity=1
This option determines how much debugging information Nagios should write to the Debug File.
• 0 = Basic information
• 1 = More detailed information (default)
• 2 = Highly detailed information
7.37.28 Maximum Debug File Size (Unused)
Format: max_debug_file_size=<#>Example: max_debug_file_size=1000000
This option determines the maximum size (in bytes) of the debug file. If the file grows larger than this size, it will berenamed with a .old extension. If a file already exists with a .old extension it will automatically be deleted. This helpsensure your disk space usage doesn’t get out of control when debugging Nagios.
7.38 Advanced discovery with Shinken
Important: This topic assumes you have read and understood simple discovery with Shinken.
7.38.1 How the discovery script works
Did you like the discovery script? Now it’s time to look at how it works, and get even more from it.
The discovery is done in two distinct phases:
• the discovery script runs generate raw data
• the discovery rules use this data to generate objects like hosts or services
7.38.2 Discovery scripts
A discovery script can be anything you can launch from a shell, just like plugins. As mentioned their main goal is togenerate raw data for objects. Yes, it can be open ports of a server, or the number of wheels your car has, as you want.:)
The raw data is being sent to standard out.
Here is an example of the output of the nmap script for a standard Linux box:
$ libexec/nmap_discovery_runner.py -t localhost
localhost::isup=1localhost::os=linuxlocalhost::osversion=2.6.Xlocalhost::macvendor=localhost::openports=22,80,1521,3306,5432,5666,6502,8080,50000
236 Chapter 7. Advanced Topics
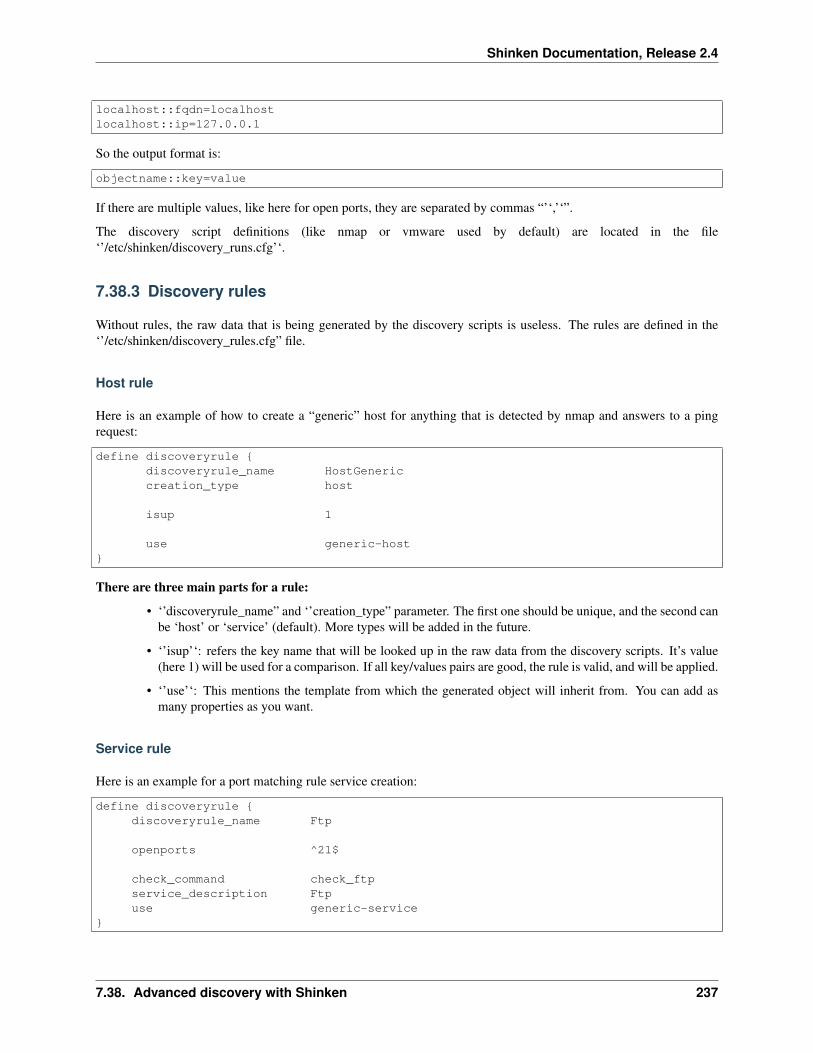
Shinken Documentation, Release 2.4
localhost::fqdn=localhostlocalhost::ip=127.0.0.1
So the output format is:
objectname::key=value
If there are multiple values, like here for open ports, they are separated by commas “’‘,’‘”.
The discovery script definitions (like nmap or vmware used by default) are located in the file‘’/etc/shinken/discovery_runs.cfg’‘.
7.38.3 Discovery rules
Without rules, the raw data that is being generated by the discovery scripts is useless. The rules are defined in the‘’/etc/shinken/discovery_rules.cfg” file.
Host rule
Here is an example of how to create a “generic” host for anything that is detected by nmap and answers to a pingrequest:
define discoveryrule {discoveryrule_name HostGenericcreation_type host
isup 1
use generic-host}
There are three main parts for a rule:
• ‘’discoveryrule_name” and ‘’creation_type” parameter. The first one should be unique, and the second canbe ‘host’ or ‘service’ (default). More types will be added in the future.
• ‘’isup’‘: refers the key name that will be looked up in the raw data from the discovery scripts. It’s value(here 1) will be used for a comparison. If all key/values pairs are good, the rule is valid, and will be applied.
• ‘’use’‘: This mentions the template from which the generated object will inherit from. You can add asmany properties as you want.
Service rule
Here is an example for a port matching rule service creation:
define discoveryrule {discoveryrule_name Ftp
openports ^21$
check_command check_ftpservice_description Ftpuse generic-service
}
7.38. Advanced discovery with Shinken 237

Shinken Documentation, Release 2.4
Here, if the port 21 is open. The ^and $ is for the regexp thing, so 21 and only 21 will be match, and not 210 forexample.
The service generated will be with FTP for the host_name the object_name send by the discovery script, thecheck_command check_ftp and it will use the generic-service template.
The ! (not) key
You can ask not to match a rule. It’s very easy, just add a ! character before the key name.
For example:
define discoveryrule {discoveryrule_name Ftp
openports ^21$!os linux
check_command check_ftpservice_description Ftpuse generic-service
}
This will create the Ftp service for all hosts that have port 21 open, but not for the linux ones.
Add something instead of replace
By default, when you put a new host/service property, it will replace all previously detected values. For some propertieslike templates or groups, this is not a good idea. That’s why you can say a property should be “added” by using thecharacter “+” before it.
For example, we want to add the “ftp” and “http” templates on the host, without removing all previously insertedvalues.
define discoveryrule {discoveryrule_name Ftpcreation_type hostopenports ^21$+use ftp
}
define discoveryrule {discoveryrule_name Httpcreation_type hostopenports ^21$+use http
}
If both ports are open, it will create a host with:
define host {host_name localhostuse ftp,http
}
Important: The rules order is important, here ftp apply before http. So put the “generic” template at the end of yourules file.
238 Chapter 7. Advanced Topics

Shinken Documentation, Release 2.4
Important: Why is the rule order important, explain the impact.
Delete something after add
Sometimes you need to simply remove a property that conflicts with a new one. For example, some routers are derivedfrom linux system but does not work with the linux template. That’s why you can say a property should be “remove”by using the character “-” before it.
For example we want to add the “router-os” template but not the “linux” template on the host and do not removepreviously inserted values.
define discoveryrule {discoveryrule_name Ftpcreation_type hostopenports ^21$+use ftp
}
define discoveryrule {discoveryrule_name Httpcreation_type hostopenports ^21$+use http
}
define discoveryrule {discoveryrule_name Linuxcreation_type hostos linux+use linux
}
define discoveryrule {discoveryrule_name RouterOScreation_type hostmacvendor routerboard+use router-os-use linux
}
If both ports are open, os detected is linux and the macvendor is routerboard it will create a host with:
define host {host_name myrouteruse ftp,http,router-os
}
7.39 Discovery with Shinken
7.39.1 DEPRATATION WARNING
BEWARE: The discovery part is depracted in the 2.4 version, and will be moved to a module in the next versions.
7.39. Discovery with Shinken 239

Shinken Documentation, Release 2.4
7.39.2 Simple use of the discovery tool
When Shinken is installed, the discovery script shinken-discovery can help you start your new monitoring tool andintegrate a large number of hosts. This does not replace extracting data from an authoritative CMDB/IT reference forprovisioning known hosts. It can be used to supplement the data from the authoritative references.
At this time, two “discovery” modules are available:
• Network based discovery using nmap
• VMware based discovery, using the check_esx3.pl script communicating with a vCenter installation.
It is suggested to execute both discovery modules in one pass, because one module can use data from the other.
Setup nmap discovery
The network discovery scans your network and sets up a basic monitoring configuration for all your hosts and networkservices. It uses the nmap tool.
Ubuntu:
sudo apt-get install nmap
RedHat/Centos:
yum install nmap
Windows: Not available at this time.
You need to setup the nmap targets in the file /etc/shinken/resource.d/nmap.cfg: For nmap:
$NMAPTARGETS$=localhost www.google.fr 192.168.0.1-254
This will scan the localhost, one of the numerous Google server and your LAN. Change it to your own LAN values ofcourse!
Tip: This value can be changed without modifying this file with the -m discovery script argument
Setup the VMware part
Tip: Of course, if you do not have a vCenter installation, skip this part ...
You will need the check_esx3.pl script. You can get it at http://www.op5.org/community/plugin-inventory/op5-projects/op5-plugins and install it in your standard plugin directory (should be /var/lib/plugins/nagios by default).
You need to setup vcenter acces in the file /etc/shinken/resource.d/vmware.cfg: Enter your server and credential (canbe an account domain)
$VCENTER$=vcenter.mydomain.com$VCENTERLOGIN$=someuser$VCENTERPASSWORD$=somepassowrd
Launch it!
Now, you are ready to run the discovery tool:
240 Chapter 7. Advanced Topics
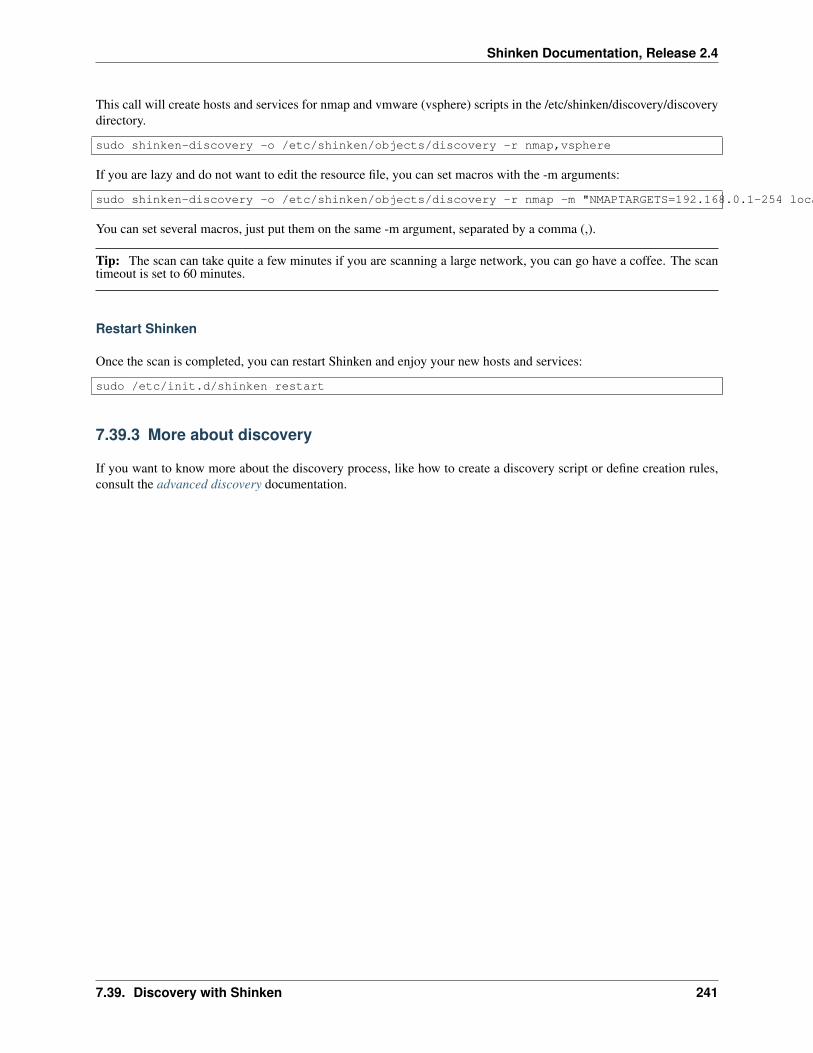
Shinken Documentation, Release 2.4
This call will create hosts and services for nmap and vmware (vsphere) scripts in the /etc/shinken/discovery/discoverydirectory.
sudo shinken-discovery -o /etc/shinken/objects/discovery -r nmap,vsphere
If you are lazy and do not want to edit the resource file, you can set macros with the -m arguments:
sudo shinken-discovery -o /etc/shinken/objects/discovery -r nmap -m "NMAPTARGETS=192.168.0.1-254 localhost 192.168.0.1-254"
You can set several macros, just put them on the same -m argument, separated by a comma (,).
Tip: The scan can take quite a few minutes if you are scanning a large network, you can go have a coffee. The scantimeout is set to 60 minutes.
Restart Shinken
Once the scan is completed, you can restart Shinken and enjoy your new hosts and services:
sudo /etc/init.d/shinken restart
7.39.3 More about discovery
If you want to know more about the discovery process, like how to create a discovery script or define creation rules,consult the advanced discovery documentation.
7.39. Discovery with Shinken 241

Shinken Documentation, Release 2.4
242 Chapter 7. Advanced Topics

CHAPTER 8
Config
243

Shinken Documentation, Release 2.4
8.1 Host Definition
8.1.1 Description
A host definition is used to define a physical server, workstation, device, etc. that resides on your network.
8.1.2 Definition Format
Bold directives are required, while the others are optional.
define host{host_name *host_name*alias aliasdisplay_name display_nameaddress *address*parents host_nameshostgroups hostgroup_namescheck_command command_nameinitial_state [o,d,u]max_check_attempts #check_interval #retry_interval #active_checks_enabled [0/1]passive_checks_enabled [0/1]check_period timeperiod_nameobsess_over_host [0/1]check_freshness [0/1]freshness_threshold #event_handler command_nameevent_handler_enabled [0/1]
low_flap_threshold #high_flap_threshold #flap_detection_enabled [0/1]flap_detection_options [o,d,u]process_perf_data [0/1]retain_status_information [0/1]retain_nonstatus_information [0/1]contacts *contacts*contact_groups *contact_groups*notification_interval #first_notification_delay #notification_period *timeperiod_name*notification_options [d,u,r,f,s]notifications_enabled [0/1]stalking_options [o,d,u]notes note_stringnotes_url urlaction_url urlicon_image image_fileicon_image_alt alt_string
Continued on next page
244 Chapter 8. Config

Shinken Documentation, Release 2.4
Table 8.1 – continued from previous pagevrml_image image_filestatusmap_image image_file2d_coords x_coord,y_coord3d_coords x_coord,y_coord,z_coordrealm realmpoller_tag poller_tagreactionner_tag reactionner_tagbusiness_impact [0/1/2/3/4/5]resultmodulations resultmodulationsescalations escalations namesbusiness_impact_modulations business_impact_modulations namesicon_set [database/disk/network_service/server/...]maintenance_period timeperiod_nameservice_overrides service_description,directive valueservice_excludes service_description,...service_includes service_description,...labels labelsbusiness_rule_output_template templatebusiness_rule_smart_notifications [0/1]business_rule_downtime_as_ack [0/1]business_rule_host_notification_options [d,u,r,f,s]business_rule_service_notification_options [w,u,c,r,f,s]snapshot_enabled [0/1]snapshot_command command_namesnapshot_period timeperiod_namesnapshot_criteria [d,u]snapshot_interval #trigger_name trigger_nametrigger_broker_raise_enabled [0/1]}
8.1.3 Example Definition
define host{host_name bogus-routeralias Bogus Router #1address 192.168.1.254parents server-backbonecheck_command check-host-alivecheck_interval 5retry_interval 1max_check_attempts 5check_period 24x7process_perf_data 0retain_nonstatus_information 0contact_groups router-adminsnotification_interval 30notification_period 24x7notification_options d,u,rrealm Europepoller_tag DMZicon_set server
8.1. Host Definition 245

Shinken Documentation, Release 2.4
}
8.1.4 Directive Descriptions
host_name This directive is used to define a short name used to identify the host. It is used in host group and servicedefinitions to reference this particular host. Hosts can have multiple services (which are monitored) associatedwith them. When used properly, the $HOSTNAME$ macro will contain this short name.
alias This directive is used to define a longer name or description used to identify the host. It is provided in order toallow you to more easily identify a particular host. When used properly, the $HOSTALIAS$ macro will containthis alias/description.
address This directive is used to define the address of the host. Normally, this is an IP address, although it couldreally be anything you want (so long as it can be used to check the status of the host). You can use a FQDNto identify the host instead of an IP address, but if “DNS” services are not available this could cause problems.When used properly, the $HOSTADDRESS$ macro will contain this address.
If you do not specify an address directive in a host definition, the name of the host will be used as its address.
A word of caution about doing this, however - if “DNS” fails, most of your service checks will fail because theplugins will be unable to resolve the host name.
display_name This directive is used to define an alternate name that should be displayed in the web interface for thishost. If not specified, this defaults to the value you specify for the host_name directive.
parents This directive is used to define a comma-delimited list of short names of the “parent” hosts for this particularhost. Parent hosts are typically routers, switches, firewalls, etc. that lie between the monitoring host and aremote hosts. A router, switch, etc. which is closest to the remote host is considered to be that host’s “parent”.Read the “Determining Status and Reachability of Network Hosts” document located here for more information.If this host is on the same network segment as the host doing the monitoring (without any intermediate routers,etc.) the host is considered to be on the local network and will not have a parent host. Leave this value blank ifthe host does not have a parent host (i.e. it is on the same segment as the Shinken host). The order in which youspecify parent hosts has no effect on how things are monitored.
hostgroups This directive is used to identify the short name(s) of the hostgroup(s) that the host belongs to. Multiplehostgroups should be separated by commas. This directive may be used as an alternative to (or in addition to)using the members directive in hostgroup definitions.
check_command This directive is used to specify the short name of the command that should be used to check if thehost is up or down. Typically, this command would try and ping the host to see if it is “alive”. The commandmust return a status of OK (0) or Shinken will assume the host is down. If you leave this argument blank, thehost will not be actively checked. Thus, Shinken will likely always assume the host is up (it may show up asbeing in a “PENDING” state in the web interface). This is useful if you are monitoring printers or other devicesthat are frequently turned off. The maximum amount of time that the notification command can run is controlledby the host_check_timeout option.
initial_state By default Shinken will assume that all hosts are in UP states when in starts. You can override the initialstate for a host by using this directive. Valid options are: o = UP, d = DOWN, and u = UNREACHABLE.
max_check_attempts This directive is used to define the number of times that Shinken will retry the host checkcommand if it returns any state other than an OK state. Setting this value to 1 will cause Shinken to generate analert without retrying the host check again.
If you do not want to check the status of the host, you must still set this to a minimum value of 1. To bypass thehost check, just leave the “check_command” option blank.
check_interval This directive is used to define the number of “time units” between regularly scheduled checks of thehost. Unless you’ve changed the interval_length directive from the default value of 60, this number will mean
246 Chapter 8. Config

Shinken Documentation, Release 2.4
minutes. More information on this value can be found in the check scheduling documentation.
retry_interval This directive is used to define the number of “time units” to wait before scheduling a re-check ofthe hosts. Hosts are rescheduled at the retry interval when they have changed to a non-UP state. Once the hosthas been retried max_check_attempts times without a change in its status, it will revert to being scheduled atits “normal” rate as defined by the check_interval value. Unless you’ve changed the interval_length directivefrom the default value of 60, this number will mean minutes. More information on this value can be found inthe check cheduling documentation.
active_checks_enabled This directive is used to determine whether or not active checks (either regularly scheduledor on-demand) of this host are enabled. Values: 0 = disable active host checks, 1 = enable active host checks.
passive_checks_enabled This directive is used to determine whether or not passive checks are enabled for this host.Values: 0 = disable passive host checks, 1 = enable passive host checks.
check_period This directive is used to specify the short name of the time period during which active checks of thishost can be made.
obsess_over_host This directive determines whether or not checks for the host will be “obsessed” over using theochp_command.
check_freshness This directive is used to determine whether or not freshness checks are enabled for this host. Values:0 = disable freshness checks, 1 = enable freshness checks.
freshness_threshold This directive is used to specify the freshness threshold (in seconds) for this host. If you set thisdirective to a value of 0, Shinken will determine a freshness threshold to use automatically.
event_handler This directive is used to specify the short name of the command that should be run whenever a changein the state of the host is detected (i.e. whenever it goes down or recovers). Read the documentation on eventhandlers for a more detailed explanation of how to write scripts for handling events. The maximum amount oftime that the event handler command can run is controlled by the event_handler_timeout option.
event_handler_enabled This directive is used to determine whether or not the event handler for this host is enabled.Values: 0 = disable host event handler, 1 = enable host event handler.
low_flap_threshold This directive is used to specify the low state change threshold used in flap detection for this host.More information on flap detection can be found here. If you set this directive to a value of 0, the program-widevalue specified by the low_host_flap_threshold directive will be used.
high_flap_threshold This directive is used to specify the high state change threshold used in flap detection for thishost. More information on flap detection can be found here. If you set this directive to a value of 0, the program-wide value specified by the high_host_flap_threshold directive will be used.
flap_detection_enabled This directive is used to determine whether or not flap detection is enabled for this host.More information on flap detection can be found here. Values: 0 = disable host flap detection, 1 = enable hostflap detection.
flap_detection_options This directive is used to determine what host states the flap detection logic will use for thishost. Valid options are a combination of one or more of the following: o = UP states, d = DOWN states, u =UNREACHABLE states.
process_perf_data This directive is used to determine whether or not the processing of performance data is enabledfor this host. Values: 0 = disable performance data processing, 1 = enable performance data processing.
retain_status_information This directive is used to determine whether or not status-related information about thehost is retained across program restarts. This is only useful if you have enabled state retention using the re-tain_state_information directive. Value: 0 = disable status information retention, 1 = enable status informationretention.
retain_nonstatus_information This directive is used to determine whether or not non-status information about thehost is retained across program restarts. This is only useful if you have enabled state retention using the re-
8.1. Host Definition 247
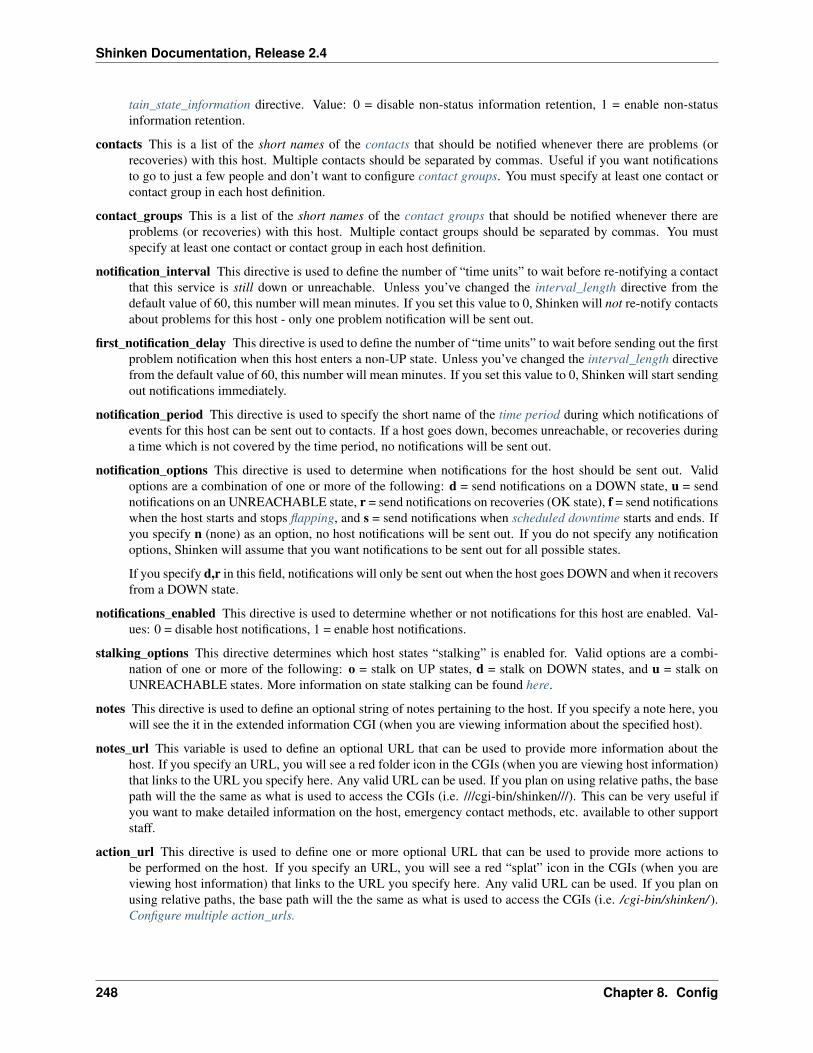
Shinken Documentation, Release 2.4
tain_state_information directive. Value: 0 = disable non-status information retention, 1 = enable non-statusinformation retention.
contacts This is a list of the short names of the contacts that should be notified whenever there are problems (orrecoveries) with this host. Multiple contacts should be separated by commas. Useful if you want notificationsto go to just a few people and don’t want to configure contact groups. You must specify at least one contact orcontact group in each host definition.
contact_groups This is a list of the short names of the contact groups that should be notified whenever there areproblems (or recoveries) with this host. Multiple contact groups should be separated by commas. You mustspecify at least one contact or contact group in each host definition.
notification_interval This directive is used to define the number of “time units” to wait before re-notifying a contactthat this service is still down or unreachable. Unless you’ve changed the interval_length directive from thedefault value of 60, this number will mean minutes. If you set this value to 0, Shinken will not re-notify contactsabout problems for this host - only one problem notification will be sent out.
first_notification_delay This directive is used to define the number of “time units” to wait before sending out the firstproblem notification when this host enters a non-UP state. Unless you’ve changed the interval_length directivefrom the default value of 60, this number will mean minutes. If you set this value to 0, Shinken will start sendingout notifications immediately.
notification_period This directive is used to specify the short name of the time period during which notifications ofevents for this host can be sent out to contacts. If a host goes down, becomes unreachable, or recoveries duringa time which is not covered by the time period, no notifications will be sent out.
notification_options This directive is used to determine when notifications for the host should be sent out. Validoptions are a combination of one or more of the following: d = send notifications on a DOWN state, u = sendnotifications on an UNREACHABLE state, r = send notifications on recoveries (OK state), f = send notificationswhen the host starts and stops flapping, and s = send notifications when scheduled downtime starts and ends. Ifyou specify n (none) as an option, no host notifications will be sent out. If you do not specify any notificationoptions, Shinken will assume that you want notifications to be sent out for all possible states.
If you specify d,r in this field, notifications will only be sent out when the host goes DOWN and when it recoversfrom a DOWN state.
notifications_enabled This directive is used to determine whether or not notifications for this host are enabled. Val-ues: 0 = disable host notifications, 1 = enable host notifications.
stalking_options This directive determines which host states “stalking” is enabled for. Valid options are a combi-nation of one or more of the following: o = stalk on UP states, d = stalk on DOWN states, and u = stalk onUNREACHABLE states. More information on state stalking can be found here.
notes This directive is used to define an optional string of notes pertaining to the host. If you specify a note here, youwill see the it in the extended information CGI (when you are viewing information about the specified host).
notes_url This variable is used to define an optional URL that can be used to provide more information about thehost. If you specify an URL, you will see a red folder icon in the CGIs (when you are viewing host information)that links to the URL you specify here. Any valid URL can be used. If you plan on using relative paths, the basepath will the the same as what is used to access the CGIs (i.e. ///cgi-bin/shinken///). This can be very useful ifyou want to make detailed information on the host, emergency contact methods, etc. available to other supportstaff.
action_url This directive is used to define one or more optional URL that can be used to provide more actions tobe performed on the host. If you specify an URL, you will see a red “splat” icon in the CGIs (when you areviewing host information) that links to the URL you specify here. Any valid URL can be used. If you plan onusing relative paths, the base path will the the same as what is used to access the CGIs (i.e. /cgi-bin/shinken/ ).Configure multiple action_urls.
248 Chapter 8. Config

Shinken Documentation, Release 2.4
icon_image This variable is used to define the name of a GIF, PNG, or JPG image that should be associated with thishost. This image will be displayed in the various places in the CGIs. The image will look best if it is 40x40pixels in size. Images for hosts are assumed to be in the logos/ subdirectory in your HTML images directory.
icon_image_alt This variable is used to define an optional string that is used in the ALT tag of the image specified bythe <icon_image> argument.
vrml_image This variable is used to define the name of a GIF, PNG, or JPG image that should be associated with thishost. This image will be used as the texture map for the specified host in the statuswrl CGI. Unlike the imageyou use for the <icon_image> variable, this one should probably not have any transparency. If it does, the hostobject will look a bit weird. Images for hosts are assumed to be in the logos/ subdirectory in your HTML imagesdirectory.
statusmap_image This variable is used to define the name of an image that should be associated with this host in thestatusmap CGI. You can specify a JPEG, PNG, and GIF image if you want, although I would strongly suggestusing a GD2 format image, as other image formats will result in a lot of wasted CPU time when the statusmapimage is generated. GD2 images can be created from PNG images by using the pngtogd2 utility supplied withThomas Boutell’s gd library. The GD2 images should be created in uncompressed format in order to minimizeCPU load when the statusmap CGI is generating the network map image. The image will look best if it is 40x40pixels in size. You can leave these option blank if you are not using the statusmap CGI. Images for hosts areassumed to be in the logos/ subdirectory in your HTML images directory.
2d_coords This variable is used to define coordinates to use when drawing the host in the statusmap CGI. Coordinatesshould be given in positive integers, as they correspond to physical pixels in the generated image. The originfor drawing (0,0) is in the upper left hand corner of the image and extends in the positive x direction (to theright) along the top of the image and in the positive y direction (down) along the left hand side of the image.For reference, the size of the icons drawn is usually about 40x40 pixels (text takes a little extra space). Thecoordinates you specify here are for the upper left hand corner of the host icon that is drawn.
Don’t worry about what the maximum x and y coordinates that you can use are. The CGI will automaticallycalculate the maximum dimensions of the image it creates based on the largest x and y coordinates you specify.
3d_coords This variable is used to define coordinates to use when drawing the host in the statuswrl CGI. Coordinatescan be positive or negative real numbers. The origin for drawing is (0.0,0.0,0.0). For reference, the size of thehost cubes drawn is 0.5 units on each side (text takes a little more space). The coordinates you specify here areused as the center of the host cube.
realm This variable is used to define the realm where the host will be put. By putting the host in a realm, it will bemanage by one of the scheduler of this realm.
poller_tag This variable is used to define the poller_tag of the host. All checks of this hosts will only take by pollersthat have this value in their poller_tags parameter.
By default the pollerag value is ‘None’, so all untagged pollers can take it because None is set by default forthem.
reactionner_tag This variable is used to define the reactionner_tag of notifications_commands from this service. Allof theses notifications will be taken by reactionners that have this value in their reactionner_tags parameter.
By default there is no reactionner_tag, so all untaggued reactionners can take it.
business_impact This variable is used to set the importance we gave to this host for the business from the lessimportant (0 = nearly nobody will see if it’s in error) to the maximum (5 = you lost your job if it fail). Thedefault value is 2.
resultmodulations This variable is used to link with resultmodulations objects. It will allow such modulation toapply, like change a warning in critical for this host.
escalations This variable is used to link with escalations objects. It will allow such escalations rules to appy. Look atescalations objects for more details.
8.1. Host Definition 249
Shinken Documentation, Release 2.4
business_impact_modulations This variable is used to link with business_impact_modulations objects. It will allowsuch modulation to apply (for example if the host is a payd server, it will be important only in a specifictimeperiod: near the payd day). Look at business_impact_modulations objects for more details.
icon_set This variable is used to set the icon in the Shinken Webui. For now, values are only : database, disk,network_service, server
maintenance_period Shinken-specific variable to specify a recurring downtime period. This works like a scheduleddowntime, so unlike a check_period with exclusions, checks will still be made (no “blackout” times). announce-ment
service_overrides This variable may be used to override services directives for a specific host. This is especiallyuseful when services are inherited (for instance from packs), because it allows to have a host attached ser-vice set one of its directives a specific value. For example, on a set of web servers, HTTP service (inheritedfrom http pack) on production servers should have notifications enabled 24x7, and staging server should onlynotify during workhours. To do so, staging server should be set the following directive: service_overridesHTTP,notification_period workhours. Several overrides may be specified, each override should be written ona single line. Caution, service_overrides may be inherited (through the use directive), but specifying an overrideon a host overloads all values inherited from parent hosts, it does not append it (as of any single valued attribute).See inheritance description for more details.
service_excludes This variable may be used to exclude a service from a host. It addresses the situations where a setof serices is inherited from a pack or attached from a hostgroup, and an identified host should NOT have one (ormore, comma separated) services defined. This allows to manage exceptions in the service asignment withouthaving to define intermediary templates/hostgroups. See inheritance description for more details. This will beignored if there is service_includes
service_includes This variable may be used to include only a service from a host. It addresses the situations wherea set of serices is inherited from a pack or attached from a hostgroup, and an identified host should have onlyone (or more, comma separated) services defined. This allows to manage exceptions in the service asignmentwithout having to define intermediary templates/hostgroups. See inheritance description for more details. Thisvariable is considered before service_excludes
labels This variable may be used to place arbitrary labels (separated by comma character). Those labels may be usedin other configuration objects such as business rules grouping expressions.
business_rule_output_template Classic host check output is managed by the underlying plugin (the check outputis the plugin stdout). For business rules, as there’s no real plugin behind, the output may be controlled by atemplate string defined in business_rule_output_template directive.
business_rule_smart_notifications This variable may be used to activate smart notifications on business rules. Thisallows to stop sending notification if all underlying problems have been acknowledged.
business_rule_smart_notifications By default, downtimes are not taken into account by business rules smart noti-fications processing. This variable allows to extend smart notifications to underlying hosts or service checksunder downtime (they are treated as if they were acknowledged).
business_rule_host_notification_options This option allows to enforce business rules underlying hosts notificationoptions to easily compose a consolidated meta check. This is especially useful for business rules relying ongrouping expansion.
business_rule_service_notification_options This option allows to enforce business rules underlying services notifi-cation options to easily compose a consolidated meta check. This is especially useful for business rules relyingon grouping expansion.
snapshot_enabled This option allows to enable snapshots snapshots on this element.
snapshot_command Command to launch when a snapshot launch occurs
snapshot_period Timeperiod when the snapshot call is allowed
250 Chapter 8. Config

Shinken Documentation, Release 2.4
snapshot_criteria List of states that enable the snapshot launch. Mainly bad states.
snapshot_interval Minimum interval between two launch of snapshots to not hammering the host, in interval_lengthunits (by default 60s) :)
trigger_name This options define the trigger that will be executed after a check result (passive or active). This filetrigger_name.trig has to exist in the trigger directory or sub-directories.
trigger_broker_raise_enabled This option define the behavior of the defined trigger (Default 0). If set to 1, thismeans the trigger will modify the output / return code of the check. If 0, this means the code executed by thetrigger does nothing to the check (compute something elsewhere ?) Basically, if you use one of the predefinedfunction (trigger_functions.py) set it to 1
8.2 Host Group Definition
8.2.1 Description
A host group definition is used to group one or more hosts together for simplifying configuration with object tricks ordisplay purposes in the CGIs .
8.2.2 Definition Format
Bold directives are required, while the others are optional.
define hostgroup{hostgroup_name *hostgroup_name*alias *alias*members hostshostgroup_members hostgroupsnotes note_stringnotes_url urlaction_url urlrealm realm}
8.2.3 Example Definition
define hostgroup{hostgroup_name novell-serversalias Novell Serversmembers netware1,netware2,netware3,netware4realm Europe
}
8.2.4 Directive Descriptions
hostgroup_name This directive is used to define a short name used to identify the host group.
alias This directive is used to define is a longer name or description used to identify the host group. It is provided inorder to allow you to more easily identify a particular host group.
8.2. Host Group Definition 251

Shinken Documentation, Release 2.4
members This is a list of the short names of hosts that should be included in this group. Multiple host names shouldbe separated by commas. This directive may be used as an alternative to (or in addition to) the hostgroupsdirective in host definitions.
hostgroup_members This optional directive can be used to include hosts from other “sub” host groups in this hostgroup. Specify a comma-delimited list of short names of other host groups whose members should be includedin this group.
notes This directive is used to define an optional string of notes pertaining to the host. If you specify a note here, youwill see the it in the extended information CGI (when you are viewing information about the specified host).
notes_url This variable is used to define an optional URL that can be used to provide more information about thehost group. If you specify an URL, you will see a red folder icon in the CGIs (when you are viewing hostgroupinformation) that links to the URL you specify here. Any valid URL can be used. If you plan on using relativepaths, the base path will the the same as what is used to access the CGIs (i.e. ///cgi-bin/nagios///). This canbe very useful if you want to make detailed information on the host group, emergency contact methods, etc.available to other support staff.
action_url This directive is used to define an optional URL that can be used to provide more actions to be performedon the host group. If you specify an URL, you will see a red “splat” icon in the CGIs (when you are viewinghostgroup information) that links to the URL you specify here. Any valid URL can be used. If you plan on usingrelative paths, the base path will the the same as what is used to access the CGIs (i.e. ///cgi-bin/shinken///).
realm This directive is used to define in which realm all hosts of this hostgroup will be put into. If the host are alreadytagged by a realm (and not the same), the value taken into account will the the one of the host (and a warningwill be raised). If no realm is defined, the default one will be take..
8.3 Service Definition
8.3.1 Description
A service definition is used to identify a “service” that runs on a host. The term “service” is used very loosely. It canmean an actual service that runs on the host (POP, “SMTP”, “HTTP”, etc.) or some other type of metric associatedwith the host (response to a ping, number of logged in users, free disk space, etc.). The different arguments to a servicedefinition are outlined below.
8.3.2 Definition Format
Bold directives are required, while the others are optional.
define service{host_name *host_name*hostgroup_name hostgroup_nameservice_description *service_description*display_name display_nameservicegroups servicegroup_namesis_volatile [0/1]check_command *command_name*initial_state [o,w,u,c]max_check_attempts #check_interval #retry_interval #
Continued on next page
252 Chapter 8. Config

Shinken Documentation, Release 2.4
Table 8.2 – continued from previous pageactive_checks_enabled [0/1]passive_checks_enabled [0/1]check_period *timeperiod_name*obsess_over_service [0/1]check_freshness [0/1]freshness_threshold #event_handler command_nameevent_handler_enabled [0/1]low_flap_threshold #high_flap_threshold #flap_detection_enabled [0/1]flap_detection_options [o,w,c,u]process_perf_data [0/1]retain_status_information [0/1]retain_nonstatus_information [0/1]notification_interval #first_notification_delay #notification_period *timeperiod_name*notification_options [w,u,c,r,f,s]notifications_enabled [0/1]contacts *contacts*contact_groups *contact_groups*stalking_options [o,w,u,c]notes note_stringnotes_url urlaction_url urlicon_image image_fileicon_image_alt alt_string
poller_tag poller_tagreactionner_tag reactionner_tagduplicate_foreach $MACRO$service_dependencies host,service_descriptionbusiness_impact [0/1/2/3/4/5]icon_set [database/disk/network_service/server]maintenance_period timeperiod_namehost_dependency_enabled [0/1]labels labelsbusiness_rule_output_template templatebusiness_rule_smart_notifications [0/1]business_rule_downtime_as_ack [0/1]business_rule_host_notification_options [d,u,r,f,s]business_rule_service_notification_options [w,u,c,r,f,s]snapshot_enabled [0/1]snapshot_command command_namesnapshot_period timeperiod_namesnapshot_criteria [w,c,u]snapshot_interval #trigger_name trigger_nametrigger_broker_raise_enabled [0/1]}
8.3. Service Definition 253
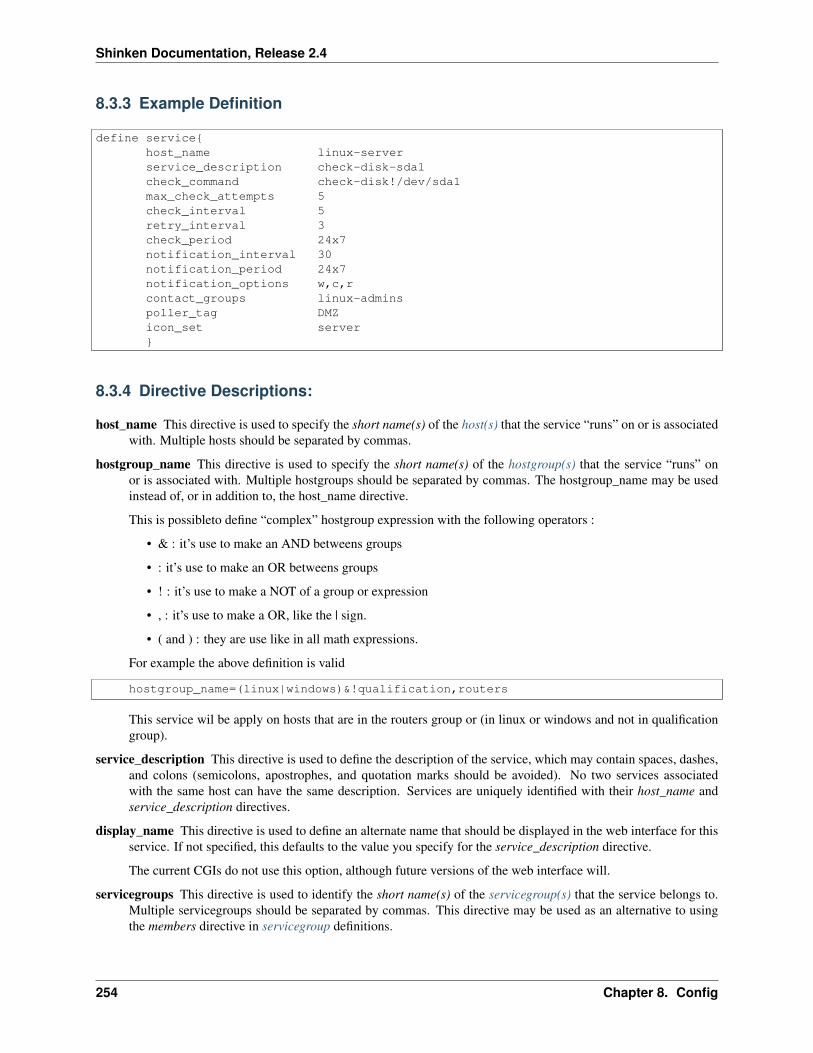
Shinken Documentation, Release 2.4
8.3.3 Example Definition
define service{host_name linux-serverservice_description check-disk-sda1check_command check-disk!/dev/sda1max_check_attempts 5check_interval 5retry_interval 3check_period 24x7notification_interval 30notification_period 24x7notification_options w,c,rcontact_groups linux-adminspoller_tag DMZicon_set server}
8.3.4 Directive Descriptions:
host_name This directive is used to specify the short name(s) of the host(s) that the service “runs” on or is associatedwith. Multiple hosts should be separated by commas.
hostgroup_name This directive is used to specify the short name(s) of the hostgroup(s) that the service “runs” onor is associated with. Multiple hostgroups should be separated by commas. The hostgroup_name may be usedinstead of, or in addition to, the host_name directive.
This is possibleto define “complex” hostgroup expression with the following operators :
• & : it’s use to make an AND betweens groups
• : it’s use to make an OR betweens groups
• ! : it’s use to make a NOT of a group or expression
• , : it’s use to make a OR, like the | sign.
• ( and ) : they are use like in all math expressions.
For example the above definition is valid
hostgroup_name=(linux|windows)&!qualification,routers
This service wil be apply on hosts that are in the routers group or (in linux or windows and not in qualificationgroup).
service_description This directive is used to define the description of the service, which may contain spaces, dashes,and colons (semicolons, apostrophes, and quotation marks should be avoided). No two services associatedwith the same host can have the same description. Services are uniquely identified with their host_name andservice_description directives.
display_name This directive is used to define an alternate name that should be displayed in the web interface for thisservice. If not specified, this defaults to the value you specify for the service_description directive.
The current CGIs do not use this option, although future versions of the web interface will.
servicegroups This directive is used to identify the short name(s) of the servicegroup(s) that the service belongs to.Multiple servicegroups should be separated by commas. This directive may be used as an alternative to usingthe members directive in servicegroup definitions.
254 Chapter 8. Config
Shinken Documentation, Release 2.4
is_volatile This directive is used to denote whether the service is “volatile”. Services are normally not volatile. Moreinformation on volatile service and how they differ from normal services can be found here. Value: 0 = serviceis not volatile, 1 = service is volatile.
check_command This directive is used to specify the short name of the command that Shinken will run in orderto check the status of the service. The maximum amount of time that the service check command can run iscontrolled by the service_check_timeout option. There is also a command with the reserved name “bp_rule”. Itis defined internally and has a special meaning. Unlike other commands it mustn’t be registered in a commanddefinition. It’s purpose is not to execute a plugin but to represent a logical operation on the statuses of otherservices. It is possible to define logical relationships with the following operators :
• & : it’s use to make an AND betweens statuses
• : it’s use to make an OR betweens statuses
• ! : it’s use to make a NOT of a status or expression
• , : it’s use to make a OR, like the | sign.
• ( and ) : they are used like in all math expressions
For example the following definition of a business process rule is valid
bp_rule!(websrv1,apache | websrv2,apache) & dbsrv1,oracle
If at least one of the apaches on servers websrv1 and websrv2 is OK and if the oracle database on dbsrv1 is OKthen the rule and thus the service is OK
initial_state By default Shinken will assume that all services are in OK states when in starts. You can override theinitial state for a service by using this directive. Valid options are:
• o = OK
• w = WARNING
• u = UNKNOWN
• c = CRITICAL.
max_check_attempts This directive is used to define the number of times that Shinken will retry the service checkcommand if it returns any state other than an OK state. Setting this value to 1 will cause Shinken to generate analert without retrying the service check again.
check_interval This directive is used to define the number of “time units” to wait before scheduling the next “regular”check of the service. “Regular” checks are those that occur when the service is in an OK state or when theservice is in a non-OK state, but has already been rechecked max_check_attempts number of times. Unlessyou’ve changed the interval_length directive from the default value of 60, this number will mean minutes. Moreinformation on this value can be found in the check scheduling documentation.
retry_interval This directive is used to define the number of “time units” to wait before scheduling a re-check of theservice. Services are rescheduled at the retry interval when they have changed to a non-OK state. Once the ser-vice has been retried max_check_attempts times without a change in its status, it will revert to being scheduledat its “normal” rate as defined by the check_interval value. Unless you’ve changed the interval_length directivefrom the default value of 60, this number will mean minutes. More information on this value can be found inthe check scheduling documentation.
active_checks_enabled * This directive is used to determine whether or not active checks of this service are enabled.Values:
• 0 = disable active service checks
• 1 = enable active service checks.
8.3. Service Definition 255

Shinken Documentation, Release 2.4
passive_checks_enabled * This directive is used to determine whether or not passive checks of this service are en-abled. Values:
• 0 = disable passive service checks
• 1 = enable passive service checks.
check_period This directive is used to specify the short name of the time period during which active checks of thisservice can be made.
obsess_over_service * This directive determines whether or not checks for the service will be “obsessed” over usingthe ocsp_command.
check_freshness * This directive is used to determine whether or not freshness checks are enabled for this service.Values:
• 0 = disable freshness checks
• 1 = enable freshness checks
freshness_threshold This directive is used to specify the freshness threshold (in seconds) for this service. If you setthis directive to a value of 0, Shinken will determine a freshness threshold to use automatically.
event_handler This directive is used to specify the short name of the command that should be run whenever a changein the state of the service is detected (i.e. whenever it goes down or recovers). Read the documentation on eventhandlers for a more detailed explanation of how to write scripts for handling events. The maximum amount oftime that the event handler command can run is controlled by the event_handler_timeout option.
event_handler_enabled * This directive is used to determine whether or not the event handler for this service isenabled. Values:
• 0 = disable service event handler
• 1 = enable service event handler.
low_flap_threshold This directive is used to specify the low state change threshold used in flap detection for thisservice. More information on flap detection can be found here. If you set this directive to a value of 0, theprogram-wide value specified by the low_service_flap_threshold directive will be used.
high_flap_threshold This directive is used to specify the high state change threshold used in flap detection for thisservice. More information on flap detection can be found here. If you set this directive to a value of 0, theprogram-wide value specified by the high_service_flap_threshold directive will be used.
flap_detection_enabled * This directive is used to determine whether or not flap detection is enabled for this service.More information on flap detection can be found here. Values:
• 0 = disable service flap detection
• 1 = enable service flap detection.
flap_detection_options This directive is used to determine what service states the flap detection logic will use forthis service. Valid options are a combination of one or more of the following :
• o = OK states
• w = WARNING states
• c = CRITICAL states
• u = UNKNOWN states.
process_perf_data * This directive is used to determine whether or not the processing of performance data is enabledfor this service. Values:
• 0 = disable performance data processing
256 Chapter 8. Config

Shinken Documentation, Release 2.4
• 1 = enable performance data processing
retain_status_information This directive is used to determine whether or not status-related information about theservice is retained across program restarts. This is only useful if you have enabled state retention using theretain_state_information directive. Value:
• 0 = disable status information retention
• 1 = enable status information retention.
retain_nonstatus_information This directive is used to determine whether or not non-status information about theservice is retained across program restarts. This is only useful if you have enabled state retention using theretain_state_information directive. Value:
• 0 = disable non-status information retention
• 1 = enable non-status information retention
notification_interval This directive is used to define the number of “time units” to wait before re-notifying a contactthat this service is still in a non-OK state. Unless you’ve changed the interval_length directive from the defaultvalue of 60, this number will mean minutes. If you set this value to 0, Shinken will not re-notify contacts aboutproblems for this service - only one problem notification will be sent out.
first_notification_delay This directive is used to define the number of “time units” to wait before sending out thefirst problem notification when this service enters a non-OK state. Unless you’ve changed the interval_lengthdirective from the default value of 60, this number will mean minutes. If you set this value to 0, Shinken willstart sending out notifications immediately.
notification_period This directive is used to specify the short name of the time period during which notifications ofevents for this service can be sent out to contacts. No service notifications will be sent out during times whichis not covered by the time period.
notification_options This directive is used to determine when notifications for the service should be sent out. Validoptions are a combination of one or more of the following:
• w = send notifications on a WARNING state
• u = send notifications on an UNKNOWN state
• c = send notifications on a CRITICAL state
• r = send notifications on recoveries (OK state)
• f = send notifications when the service starts and stops flapping
• s = send notifications when scheduled downtime starts and ends
• n (none) as an option, no service notifications will be sent out. If you do not specify any notificationoptions, Shinken will assume that you want notifications to be sent out for all possible states
If you specify w,r in this field, notifications will only be sent out when the service goes into a WARNING stateand when it recovers from a WARNING state.
notifications_enabled * This directive is used to determine whether or not notifications for this service are enabled.Values:
• 0 = disable service notifications
• 1 = enable service notifications.
contacts This is a list of the short names of the contacts that should be notified whenever there are problems (orrecoveries) with this service. Multiple contacts should be separated by commas. Useful if you want notificationsto go to just a few people and don’t want to configure contact groups. You must specify at least one contact orcontact group in each service definition.
8.3. Service Definition 257

Shinken Documentation, Release 2.4
contact_groups This is a list of the short names of the contact groups that should be notified whenever there areproblems (or recoveries) with this service. Multiple contact groups should be separated by commas. You mustspecify at least one contact or contact group in each service definition.
stalking_options This directive determines which service states “stalking” is enabled for. Valid options are a combi-nation of one or more of the following :
• o = stalk on OK states
• w = stalk on WARNING states
• u = stalk on UNKNOWN states
• c = stalk on CRITICAL states
More information on state stalking can be found here.
notes This directive is used to define an optional string of notes pertaining to the service. If you specify a note here,you will see the it in the extended information CGI (when you are viewing information about the specifiedservice).
notes_url This directive is used to define an optional URL that can be used to provide more information about theservice. If you specify an URL, you will see a red folder icon in the CGIs (when you are viewing serviceinformation) that links to the URL you specify here. Any valid URL can be used. If you plan on using relativepaths, the base path will the the same as what is used to access the CGIs (i.e. ///cgi-bin/shinken///). This can bevery useful if you want to make detailed information on the service, emergency contact methods, etc. availableto other support staff.
action_url This directive is used to define an optional URL that can be used to provide more actions to be performedon the service. If you specify an URL, you will see a red “splat” icon in the CGIs (when you are viewing serviceinformation) that links to the URL you specify here. Any valid URL can be used. If you plan on using relativepaths, the base path will the the same as what is used to access the CGIs (i.e. ///cgi-bin/shinken///).
icon_image This variable is used to define the name of a GIF, PNG, or JPG image that should be associated with thisservice. This image will be displayed in the status and extended information CGIs. The image will look best if itis 40x40 pixels in size. Images for services are assumed to be in the logos/ subdirectory in your HTML imagesdirectory.
icon_image_alt This variable is used to define an optional string that is used in the ALT tag of the image specified bythe <icon_image> argument. The ALT tag is used in the status, extended information and statusmap CGIs.
poller_tag This variable is used to define the poller_tag of checks from this service. All of theses checks will be takenby pollers that have this value in their poller_tags parameter.
By default there is no poller_tag, so all untaggued pollers can take it.
reactionner_tag This variable is used to define the reactionner_tag of notifications_commands from this service. Allof theses notifications will be taken by reactionners that have this value in their reactionner_tags parameter.
By default there is no reactionner_tag, so all untaggued reactionners can take it.
duplicate_foreach This is used to generate serveral service with only one service declaration. Shinken understandsthis statement as : “Create a service for earch key in the variable”. Usually, this statement come with a “$KEY$”string in the service_description (to have a differente name) and in the check_command (you want also a dif-ferent check) Moreover, one or several variables can be associated to each key. Then, values can be used in theservice definition with $VALUE$ or $VALUEn$ macros.
define host {host_name linux-server..._partitions var $(/var)$, root $(/)$_openvpns vpn1 $(tun1)$$(10.8.0.1)$, vpn2 $(tun2)$$(192.168.3.254)$...
258 Chapter 8. Config

Shinken Documentation, Release 2.4
}
define service{host_name linux-serverservice_description disk-$KEY$check_command check_disk!$VALUE$...duplicate_foreach _partitions
}
define service{host_name linux-serverservice_description openvpn-$KEY$-check-interfacecheck_command check_int!$VALUE1$...duplicate_foreach _openvpns
}
define service{host_name linux-serverservice_description openvpn-$KEY$-check-gatewaycheck_command check_ping!$VALUE2$...duplicate_foreach _openvpns
}
service_dependencies This variable is used to define services that this service is dependent of for notifications.It’s a comma separated list of services: host,service_description,host,service_description. For each service aservice_dependency will be created with default values (notification_failure_criteria as ‘u,c,w’ and no depen-dency_period). For more complex failure criteria or dpendency period you must create a service_dependencyobject, as described in advanced dependency configuraton. The host can be omitted from the configuration,which means that the service dependency is for the same host.
service_dependencies hostA,service_descriptionA,hostB,service_descriptionBservice_dependencies ,service_descriptionA,,service_descriptionB,hostC,service_descriptionC
By default this value is void so there is no linked dependencies. This is typically used to make a servicedependent on an agent software, like an NRPE check dependent on the availability of the NRPE agent.
business_impact This variable is used to set the importance we gave to this service from the less important (0 =nearly nobody will see if it’s in error) to the maximum (5 = you lost your job if it fail). The default value is 2.
icon_set This variable is used to set the icon in the Shinken Webui. For now, values are only : database, disk,network_service, server
maintenance_period Shinken-specific variable to specify a recurring downtime period. This works like a scheduleddowntime, so unlike a check_period with exclusions, checks will still be made (no “blackout” times). announce-ment
host_dependency_enabled This variable may be used to remove the dependency between a service and its parenthost. Used for volatile services that need notification related to itself and not depend on the host notifications.
labels This variable may be used to place arbitrary labels (separated by comma character). Those labels may be usedin other configuration objects such as business rules to identify groups of services.
business_rule_output_template Classic service check output is managed by the underlying plugin (the check outputis the plugin stdout). For business rules, as there’s no real plugin behind, the output may be controlled by atemplate string defined in business_rule_output_template directive.
8.3. Service Definition 259

Shinken Documentation, Release 2.4
business_rule_smart_notifications This variable may be used to activate smart notifications on business rules. Thisallows to stop sending notification if all underlying problems have been acknowledged.
business_rule_smart_notifications By default, downtimes are not taken into account by business rules smart noti-fications processing. This variable allows to extend smart notifications to underlying hosts or service checksunder downtime (they are treated as if they were acknowledged).
business_rule_host_notification_options This option allows to enforce business rules underlying hosts notificationoptions to easily compose a consolidated meta check. This is especially useful for business rules relying ongrouping expansion.
business_rule_service_notification_options This option allows to enforce business rules underlying services notifi-cation options to easily compose a consolidated meta check. This is especially useful for business rules relyingon grouping expansion.
snapshot_enabled This option allows to enable snapshots snapshots on this element.
snapshot_command Command to launch when a snapshot launch occurs
snapshot_period Timeperiod when the snapshot call is allowed
snapshot_criteria List of states that enable the snapshot launch. Mainly bad states.
snapshot_interval Minimum interval between two launch of snapshots to not hammering the host, in interval_lengthunits (by default 60s) :)
trigger_name This options define the trigger that will be executed after a check result (passive or active). This filetrigger_name.trig has to exist in the trigger directory or sub-directories.
trigger_broker_raise_enabled This option define the behavior of the defined trigger (Default 0). If set to 1, thismeans the trigger will modify the output / return code of the check. If 0, this means the code executed by thetrigger does nothing to the check (compute something elsewhere ?) Basically, if you use one of the predefinedfunction (trigger_functions.py) set it to 1
8.4 Service Group Definition
8.4.1 Description
A service group definition is used to group one or more services together for simplifying configuration with objecttricks or display purposes in the CGIs.
8.4.2 Definition Format
Bold directives are required, while the others are optional.
define servicegroup{servicegroup_name *servicegroup_name*alias *alias*members servicesservicegroup_members servicegroupsnotes note_stringnotes_url urlaction_url url}
260 Chapter 8. Config

Shinken Documentation, Release 2.4
8.4.3 Example Definition
define servicegroup{servicegroup_name dbservicesalias Database Servicesmembers ms1,SQL Server,ms1,SQL Serverc Agent,ms1,SQL DTC
}
8.4.4 Directive Descriptions:
servicegroup_name This directive is used to define a short name used to identify the service group.
alias This directive is used to define is a longer name or description used to identify the service group. It is providedin order to allow you to more easily identify a particular service group.
members This is a list of the descriptions of services (and the names of their corresponding hosts) that should beincluded in this group. Host and service names should be separated by commas. This directive may be usedas an alternative to the servicegroups directive in service definitions. The format of the member directive is asfollows (note that a host name must precede a service name/description):
members=<host1>,<service1>,<host2>,<service2>,...,<host*n*>,<service*n*>
servicegroup_members This optional directive can be used to include services from other “sub” service groups inthis service group. Specify a comma-delimited list of short names of other service groups whose membersshould be included in this group.
notes This directive is used to define an optional string of notes pertaining to the service group. If you specify a notehere, you will see the it in the extended information CGI (when you are viewing information about the specifiedservice group).
notes_url This directive is used to define an optional URL that can be used to provide more information about theservice group. If you specify an URL, you will see a red folder icon in the CGIs (when you are viewing servicegroup information) that links to the URL you specify here. Any valid URL can be used. If you plan on usingrelative paths, the base path will the the same as what is used to access the CGIs (i.e. ///cgi-bin/shinken///). Thiscan be very useful if you want to make detailed information on the service group, emergency contact methods,etc. available to other support staff.
action_url This directive is used to define an optional URL that can be used to provide more actions to be performedon the service group. If you specify an URL, you will see a red “splat” icon in the CGIs (when you are viewingservice group information) that links to the URL you specify here. Any valid URL can be used. If you plan onusing relative paths, the base path will the the same as what is used to access the CGIs (i.e. ///cgi-bin/shinken///).
8.5 Contact Definition
8.5.1 Description
A contact definition is used to identify someone who should be contacted in the event of a problem on your network.The different arguments to a contact definition are described below.
8.5.2 Definition Format
Bold directives are required, while the others are optional.
8.5. Contact Definition 261

Shinken Documentation, Release 2.4
define contact{contact_name *contact_name*alias aliascontactgroups contactgroup_nameshost_notifications_enabled [0/1]service_notifications_enabled [0/1]host_notification_period *timeperiod_name*service_notification_period *timeperiod_name*host_notification_options [d,u,r,f,s,n]service_notification_options [w,u,c,r,f,s,n]host_notification_commands *command_name*service_notification_commands *command_name*email email_addresspager pager_number or pager_email_gatewayaddress*x* additional_contact_addresscan_submit_commands [0/1]is_admin [0/1]retain_status_information [0/1]retain_nonstatus_information [0/1]min_business_impact [0/1/2/3/4/5]}
8.5.3 Example Definition
define contact{contact_name jdoealias John Doehost_notifications_enabled 1service_notifications_enabled 1service_notification_period 24x7host_notification_period 24x7service_notification_options w,u,c,rhost_notification_options d,u,rservice_notification_commands notify-service-by-emailhost_notification_commands notify-host-by-emailemail [email protected] [email protected] [email protected] 555-555-5555can_submit_commands 1
}
8.5.4 Directive Descriptions
contact_name This directive is used to define a short name used to identify the contact. It is referenced in contactgroup definitions. Under the right circumstances, the $CONTACTNAME$ macro will contain this value.
alias This directive is used to define a longer name or description for the contact. Under the rights circumstances, the$CONTACTALIAS$ macro will contain this value. If not specified, the contact_name will be used as the alias.
contactgroups This directive is used to identify the short name(s) of the contactgroup(s) that the contact belongs to.Multiple contactgroups should be separated by commas. This directive may be used as an alternative to (or inaddition to) using the members directive in contactgroup definitions.
262 Chapter 8. Config
Shinken Documentation, Release 2.4
host_notifications_enabled This directive is used to determine whether or not the contact will receive notificationsabout host problems and recoveries. Values :
• 0 = don’t send notifications
• 1 = send notifications
service_notifications_enabled This directive is used to determine whether or not the contact will receive notificationsabout service problems and recoveries. Values:
• 0 = don’t send notifications
• 1 = send notifications
host_notification_period This directive is used to specify the short name of the time period during which the contactcan be notified about host problems or recoveries. You can think of this as an “on call” time for host notificationsfor the contact. Read the documentation on time periods for more information on how this works and potentialproblems that may result from improper use.
service_notification_period This directive is used to specify the short name of the time period during which thecontact can be notified about service problems or recoveries. You can think of this as an “on call” time forservice notifications for the contact. Read the documentation on time periods for more information on how thisworks and potential problems that may result from improper use.
host_notification_commands This directive is used to define a list of the short names of the commands used to notifythe contact of a host problem or recovery. Multiple notification commands should be separated by commas. Allnotification commands are executed when the contact needs to be notified. The maximum amount of time that anotification command can run is controlled by the notification_timeout option.
host_notification_options This directive is used to define the host states for which notifications can be sent out tothis contact. Valid options are a combination of one or more of the following:
• d = notify on DOWN host states
• u = notify on UNREACHABLE host states
• r = notify on host recoveries (UP states)
• f = notify when the host starts and stops flapping,
• s = send notifications when host or service scheduled downtime starts and ends. If you specify n (none) asan option, the contact will not receive any type of host notifications.
service_notification_options This directive is used to define the service states for which notifications can be sent outto this contact. Valid options are a combination of one or more of the following:
• w = notify on WARNING service states
• u = notify on UNKNOWN service states
• c = notify on CRITICAL service states
• r = notify on service recoveries (OK states)
• f = notify when the service starts and stops flapping.
• n = (none) : the contact will not receive any type of service notifications.
service_notification_commands This directive is used to define a list of the short names of the commands used tonotify the contact of a service problem or recovery. Multiple notification commands should be separated bycommas. All notification commands are executed when the contact needs to be notified. The maximum amountof time that a notification command can run is controlled by the notification_timeout option.
8.5. Contact Definition 263

Shinken Documentation, Release 2.4
email This directive is used to define an email address for the contact. Depending on how you configure your noti-fication commands, it can be used to sendout an alert email to the contact. Under the right circumstances, the$CONTACTEMAIL$ macro will contain this value.
pager This directive is used to define a pager number for the contact. It can also be an email address to a pagergateway (i.e. [email protected] ). Depending on how you configure your notification commands, it can beused to send out an alert page to the contact. Under the right circumstances, the $CONTACTPAGER$ macrowill contain this value.
address*x* Address directives are used to define additional “addresses” for the contact. These addresses can be any-thing - cell phone numbers, instant messaging addresses, etc. Depending on how you configure your notificationcommands, they can be used to send out an alert o the contact. Up to six addresses can be defined using thesedirectives (address1 through address6). The $CONTACTADDRESS*x*$ macro will contain this value.
can_submit_commands This directive is used to determine whether or not the contact can submit external commandsto Shinken from the CGIs. Values:
• 0 = don’t allow contact to submit commands
• 1 = allow contact to submit commands.
is_admin This directive is used to determine whether or not the contact can see all object in WebUI. Values:
• 0 = normal user, can see all objects he is in contact
• 1 = allow contact to see all objects
retain_status_information This directive is used to determine whether or not status-related information about thecontact is retained across program restarts. This is only useful if you have enabled state retention using theretain_state_information directive. Value :
• 0 = disable status information retention
• 1 = enable status information retention.
retain_nonstatus_information This directive is used to determine whether or not non-status information about thecontact is retained across program restarts. This is only useful if you have enabled state retention using theretain_state_information directive. Value :
• 0 = disable non-status information retention
• 1 = enable non-status information retention
min_business_impact This directive is use to define the minimum business criticity level of a service/host the contactwill be notified. Please see root_problems_and_impacts for more details.
• 0 = less important
• 1 = more important than 0
• 2 = more important than 1
• 3 = more important than 2
• 4 = more important than 3
• 5 = most important
264 Chapter 8. Config

Shinken Documentation, Release 2.4
8.6 Contact Group Definition
8.6.1 Description
A contact group definition is used to group one or more contacts together for the purpose of sending out alert/recoverynotifications.
8.6.2 Definition Format:
Bold directives are required, while the others are optional.
define contactgroup{contactgroup_name contactgroup_namealias aliasmembers contactscontactgroup_members contactgroups}
8.6.3 Example Definition:
define contactgroup{contactgroup_name novell-adminsalias Novell Administratorsmembers jdoe,rtobert,tzach
}
8.6.4 Directive Descriptions:
contactgroup_name This directive is a short name used to identify the contact group.
alias This directive is used to define a longer name or description used to identify the contact group.
members This directive is used to define a list of the short names of contacts that should be included in this group.Multiple contact names should be separated by commas. This directive may be used as an alternative to (or inaddition to) using the contactgroups directive in contact definitions.
contactgroup_members This optional directive can be used to include contacts from other “sub” contact groups inthis contact group. Specify a comma-delimited list of short names of other contact groups whose membersshould be included in this group.
8.7 Time Period Definition
8.7.1 Description
A time period is a list of times during various days that are considered to be “valid” times for notifications and servicechecks. It consists of time ranges for each day of the week that “rotate” once the week has come to an end. Differenttypes of exceptions to the normal weekly time are supported, including: specific weekdays, days of generic months,days of specific months, and calendar dates.
8.6. Contact Group Definition 265

Shinken Documentation, Release 2.4
8.7.2 Definition Format
Bold directives are required, while the others are optional.
define timeperiod{timeperiod_name *timeperiod_name*alias *alias*[weekday] timeranges[exception] timerangesexclude [timeperiod1,timeperiod2,...,timeperiodn]}
8.7.3 Example Definitions
define timeperiod{timeperiod_name nonworkhoursalias Non-Work Hourssunday 00:00-24:00 ; Every Sunday of every weekmonday 00:00-09:00,17:00-24:00 ; Every Monday of every weektuesday 00:00-09:00,17:00-24:00 ; Every Tuesday of every weekwednesday 00:00-09:00,17:00-24:00 ; Every Wednesday of every weekthursday 00:00-09:00,17:00-24:00 ; Every Thursday of every weekfriday 00:00-09:00,17:00-24:00 ; Every Friday of every weeksaturday 00:00-24:00 ; Every Saturday of every week
}
define timeperiod{timeperiod_name misc-single-daysalias Misc Single Days1999-01-28 00:00-24:00 ; January 28th, 1999monday 3 00:00-24:00 ; 3rd Monday of every monthday 2 00:00-24:00 ; 2nd day of every monthfebruary 10 00:00-24:00 ; February 10th of every yearfebruary -1 00:00-24:00 ; Last day in February of every yearfriday -2 00:00-24:00 ; 2nd to last Friday of every monththursday -1 november 00:00-24:00 ; Last Thursday in November of every year
}
define timeperiod{timeperiod_name misc-date-rangesalias Misc Date Ranges2007-01-01 - 2008-02-01 00:00-24:00 ; January 1st, 2007 to February 1st, 2008monday 3 - thursday 4 00:00-24:00 ; 3rd Monday to 4th Thursday of every monthday 1 - 15 00:00-24:00 ; 1st to 15th day of every monthday 20 - -1 00:00-24:00 ; 20th to the last day of every monthjuly 10 - 15 00:00-24:00 ; July 10th to July 15th of every yearapril 10 - may 15 00:00-24:00 ; April 10th to May 15th of every yeartuesday 1 april - friday 2 may 00:00-24:00 ; 1st Tuesday in April to 2nd Friday in May of every year
}
define timeperiod{timeperiod_name misc-skip-rangesalias Misc Skip Ranges2007-01-01 - 2008-02-01 / 3 00:00-24:00 ; Every 3 days from January 1st, 2007 to February 1st, 20082008-04-01 / 7 00:00-24:00 ; Every 7 days from April 1st, 2008 (continuing forever)monday 3 - thursday 4 / 2 00:00-24:00 ; Every other day from 3rd Monday to 4th Thursday of every month
266 Chapter 8. Config

Shinken Documentation, Release 2.4
day 1 - 15 / 5 00:00-24:00 ; Every 5 days from the 1st to the 15th day of every monthjuly 10 - 15 / 2 00:00-24:00 ; Every other day from July 10th to July 15th of every yeartuesday 1 april - friday 2 may / 6 00:00-24:00 ; Every 6 days from the 1st Tuesday in April to the 2nd Friday in May of every year
}
8.7.4 Directive Descriptions
timeperiod_name This directives is the short name used to identify the time period.
alias This directive is a longer name or description used to identify the time period.
[weekday] The weekday directives (“sunday” through “saturday”)are comma-delimited lists of time ranges that are“valid” times for a particular day of the week. Notice that there are seven different days for which you candefine time ranges (Sunday through Saturday). Each time range is in the form of HH:MM-HH:MM, wherehours are Specified on a 24 hour clock. For example, 00:15-24:00 means 12:15am in the morning for this dayuntil 12:00am midnight (a 23 hour, 45 minute total time range). If you wish to exclude an entire day from thetimeperiod, simply do not include it in the timeperiod definition.
The daterange format are multiples :
• Calendar Daterange : look like a standard date, so like 2005-04-04 - 2008-09-19.
• Month Week Day: Then there are the month week day daterange same than before, but without the yearand with day names That give something like : tuesday 2 january - thursday 4 august / 5
• Now Month Date Daterange: It looks like : february 1 - march 15 / 3
• Now Month Day Daterange. It looks like day 13 - 14
• Now Standard Daterange: Ok this time it’s quite easy: monday
[exception] You can specify several different types of exceptions to the standard rotating weekday schedule. Excep-tions can take a number of different forms including single days of a specific or generic month, single weekdaysin a month, or single calendar dates. You can also specify a range of days/dates and even specify skip intervalsto obtain functionality described by “every 3 days between these dates”. Rather than list all the possible formatsfor exception strings, I’ll let you look at the example timeperiod definitions above to see what’s possible. :-)Weekdays and different types of exceptions all have different levels of precedence, so its important to understandhow they can affect each other. More information on this can be found in the documentation on timeperiods.
exclude This directive is used to specify the short names of other timeperiod definitions whose time ranges should beexcluded from this timeperiod. Multiple timeperiod names should be separated with a comma.
Note: The day skip functionality is not managed from now, so it’s like all is / 1
8.8 Command Definition
8.8.1 Description
A command definition is just that. It defines a command. Commands that can be defined include service checks,service notifications, service event handlers, host checks, host notifications, and host event handlers. Command def-initions can contain macros, but you must make sure that you include only those macros that are “valid” for thecircumstances when the command will be used. More information on what macros are available and when they are“valid” can be found here. The different arguments to a command definition are outlined below.
Tip: If, you need to have the ‘$’ character in one of your command (and not referring to a macro), please put “$$”
8.8. Command Definition 267

Shinken Documentation, Release 2.4
instead. Shinken will replace it well
8.8.2 Definition Format
Bold directives are required, while the others are optional.
define command{command_name *command_name*command_line *command_line*poller_tag poller_tag}
8.8.3 Example Definition
define command{command_name check_popcommand_line /var/lib/shinken/libexec/check_pop -H $HOSTADDRESS$
}
8.8.4 Directive Descriptions
command_name This directive is the short name used to identify the command. It is referenced in contact, host, andservice definitions (in notification, check, and event handler directives), among other places.
command_line This directive is used to define what is actually executed by Shinken when the command is used forservice or host checks, notifications, or event handlers. Before the command line is executed, all valid macrosare replaced with their respective values. See the documentation on macros for determining when you can usedifferent macros. Note that the command line is not surrounded in quotes. Also, if you want to pass a dollarsign ($) on the command line, you have to escape it with another dollar sign.
You may not include a semicolon (;) in the command_line directive, because everything after it will be ignoredas a config file comment. You can work around this limitation by setting one of the $USERn$ macros in yourresource file to a semicolon and then referencing the appropriate $USER$ macro in the command_line directivein place of the semicolon.
If you want to pass arguments to commands during runtime, you can use $ARGn$ macros in the command_linedirective of the command definition and then separate individual arguments from the command name (andfrom each other) using bang (!) characters in the object definition directive (host check command, serviceevent handler command, etc.) that references the command. More information on how arguments in commanddefinitions are processed during runtime can be found in the documentation on macros.
poller_tag This directive is used to define the poller_tag of this command. If the host/service that call this commanddo not override it with their own poller_tag, it will make this command if used in a check only taken by polelrsthat also have this value in their poller_tags parameter.
By default there is no poller_tag, so all untagged pollers can take it.
268 Chapter 8. Config

Shinken Documentation, Release 2.4
8.9 Service Dependency Definition
8.9.1 Description
Service dependencies are an advanced feature of Shinken that allow you to suppress notifications and active checks ofservices based on the status of one or more other services. Service dependencies are optional and are mainly targetedat advanced users who have complicated monitoring setups. More information on how service dependencies work(read this!) can be found here.
8.9.2 Definition Format
Bold directives are required, while the others are optional. However, you must supply at least one type of criteria forthe definition to be of much use.
define servicedependency{dependent_host_name *host_name*dependent_hostgroup_name hostgroup_namedependent_service_description *service_description*host_name *host_name*hostgroup_name hostgroup_nameservice_description *service_description*inherits_parent [0/1]execution_failure_criteria [o,w,u,c,p,n]notification_failure_criteria [o,w,u,c,p,n]dependency_period timeperiod_name}
8.9.3 Example Definition
define servicedependency{host_name WWW1service_description Apache Web Serverdependent_host_name WWW1dependent_service_description Main Web Siteexecution_failure_criteria nnotification_failure_criteria w,u,c
}
8.9.4 Directive Descriptions
dependent_host_name This directive is used to identify the short name(s) of the host(s) that the dependent service“runs” on or is associated with. Multiple hosts should be separated by commas. Leaving this directive blank canbe used to create “same host” dependencies.
dependent_hostgroup This directive is used to specify the short name(s) of the hostgroup(s) that the dependentservice “runs” on or is associated with. Multiple hostgroups should be separated by commas. The “depen-dent_hostgroup” may be used instead of, or in addition to, the “dependent_host” directive.
dependent_service_description This directive is used to identify the description of the dependent service.
host_name This directive is used to identify the short name(s) of the host(s) that the service that is being dependedupon (also referred to as the master service) “runs” on or is associated with. Multiple hosts should be separatedby commas.
8.9. Service Dependency Definition 269

Shinken Documentation, Release 2.4
hostgroup_name This directive is used to identify the short name(s) of the hostgroup(s) that the service that isbeing depended upon (also referred to as the master service) “runs” on or is associated with. Multiple host-groups should be separated by commas. The “hostgroup_name” may be used instead of, or in addition to, the“host_name” directive.
service_description This directive is used to identify the description of the service that is being depended upon (alsoreferred to as the master service).
inherits_parent This directive indicates whether or not the dependency inherits dependencies of the service that isbeing depended upon (also referred to as the master service). In other words, if the master service is dependentupon other services and any one of those dependencies fail, this dependency will also fail.
execution_failure_criteria This directive is used to specify the criteria that determine when the dependent serviceshould not be actively checked. If the master service is in one of the failure states we specify, the dependentservice will not be actively checked. Valid options are a combination of one or more of the following (multipleoptions are separated with commas):
• o = fail on an OK state
• w = fail on a WARNING state
• u = fail on an UNKNOWN state
• c = fail on a CRITICAL state
• p = fail on a pending state (e.g. the service has not yet been checked).
• n (none) : the execution dependency will never fail and checks of the dependent service will always beactively checked (if other conditions allow for it to be).
If you specify o,c,u in this field, the dependent service will not be actively checked if the master service is ineither an OK, a CRITICAL, or an UNKNOWN state.
notification_failure_criteria This directive is used to define the criteria that determine when notifications for thedependent service should not be sent out. If the master service is in one of the failure states we specify, notifi-cations for the dependent service will not be sent to contacts. Valid options are a combination of one or more ofthe following:
• o = fail on an OK state
• w = fail on a WARNING state
• u = fail on an UNKNOWN state
• c = fail on a CRITICAL state
• p = fail on a pending state (e.g. the service has not yet been checked).
• n = (none) : the notification dependency will never fail and notifications for the dependent service willalways be sent out.
If you specify w in this field, the notifications for the dependent service will not be sent out if the master serviceis in a WARNING state.
dependency_period This directive is used to specify the short name of the time period during which this dependencyis valid. If this directive is not specified, the dependency is considered to be valid during all times.
270 Chapter 8. Config

Shinken Documentation, Release 2.4
8.10 Service Escalation Definition
8.10.1 Description
Service escalations are completely optional and are used to escalate notifications for a particular service. More infor-mation on how notification escalations work can be found here.
8.10.2 Definition Format
Bold directives are required, while the others are optional.
define serviceescalation{host_name *host_name*hostgroup_name hostgroup_nameservice_description *service_description*contacts *contacts*contact_groups *contactgroup_name*first_notification #last_notification #first_notification_time #last_notification_time #notification_interval #escalation_period timeperiod_nameescalation_options [w,u,c,r]}
8.10.3 Example Definition
Here for an scalation that will escalade to “themanagers” after one hour problem and ends at 2 hours.
define serviceescalation{host_name nt-3service_description Processor Loadfirst_notification_time 60last_notification_time 120notification_interval 30contact_groups themanagers
}
8.10.4 Directive Descriptions
host_name This directive is used to identify the short name(s) of the host(s) that the service escalation should applyto or is associated with.
hostgroup_name This directive is used to specify the short name(s) of the hostgroup(s) that the service escala-tion should apply to or is associated with. Multiple hostgroups should be separated by commas. The “host-group_name” may be used instead of, or in addition to, the “host_name” directive.
service_description This directive is used to identify the description of the service the escalation should apply to.
first_notification This directive is a number that identifies the first notification for which this escalation is effective.For instance, if you set this value to 3, this escalation will only be used if the service is in a non-OK state longenough for a third notification to go out.
8.10. Service Escalation Definition 271

Shinken Documentation, Release 2.4
last_notification This directive is a number that identifies the last notification for which this escalation is effective.For instance, if you set this value to 5, this escalation will not be used if more than five notifications are sent outfor the service. Setting this value to 0 means to keep using this escalation entry forever (no matter how manynotifications go out).
first_notification_time This directive is the number of “time intervals” (60 seconds by default) until that makes thefirst notification for which this escalation is effective. For instance, if you set this value to 60, this escalationwill only be used if the service is in a non-OK state long enough for 60 minutes notification to go out.
last_notification_time This directive is a number of “time intervals” (60 seconds by default) until that makes the lastnotification for which this escalation is effective. For instance, if you set this value to 120, this escalation willnot be used if more than two hours after then notifications are sent out for the service. Setting this value to 0means to keep using this escalation entry forever (no matter how many notifications go out).
contacts This is a list of the short names of the contacts that should be notified whenever there are problems (orrecoveries) with this service. Multiple contacts should be separated by commas. Useful if you want notificationsto go to just a few people and don’t want to configure contact groups. You must specify at least one contact orcontact group in each service escalation definition.
contact_groups This directive is used to identify the short name of the contact group that should be notified whenthe service notification is escalated. Multiple contact groups should be separated by commas. You must specifyat least one contact or contact group in each service escalation definition.
notification_interval This directive is used to determine the interval at which notifications should be made while thisescalation is valid. If you specify a value of 0 for the interval, Shinken will send the first notification whenthis escalation definition is valid, but will then prevent any more problem notifications from being sent out forthe host. Notifications are sent out again until the host recovers. This is useful if you want to stop havingnotifications sent out after a certain amount of time.
If multiple escalation entries for a host overlap for one or more notification ranges, the smallest notificationinterval from all escalation entries is used.
escalation_period This directive is used to specify the short name of the time period during which this escalation isvalid. If this directive is not specified, the escalation is considered to be valid during all times.
escalation_options This directive is used to define the criteria that determine when this service escalation is used.The escalation is used only if the service is in one of the states specified in this directive. If this directive is notspecified in a service escalation, the escalation is considered to be valid during all service states. Valid optionsare a combination of one or more of the following:
• r = escalate on an OK (recovery) state
• w = escalate on a WARNING state
• u = escalate on an UNKNOWN state
• c = escalate on a CRITICAL state
If you specify w in this field, the escalation will only be used if the service is in a WARNING state.
Note: You can define generic escalation with the statement “define escalation” instead of serviceescalation. Thereare less required parameter (as there is not type) but you still have to defined them to make it work
272 Chapter 8. Config

Shinken Documentation, Release 2.4
8.11 Host Dependency Definition
8.11.1 Description
Host dependencies are an advanced feature of Shinken that allow you to suppress notifications for hosts based on thestatus of one or more other hosts. Host dependencies are optional and are mainly targeted at advanced users who havecomplicated monitoring setups. More information on how host dependencies work (read this!) can be found here.
8.11.2 Definition Format
Bold directives are required, while the others are optional.
define hostdependency{dependent_host_name *host_name*dependent_hostgroup_name hostgroup_namehost_name *host_name*hostgroup_name hostgroup_nameinherits_parent [0/1]execution_failure_criteria [o,d,u,p,n]notification_failure_criteria [o,d,u,p,n]dependency_period timeperiod_name}
8.11.3 Example Definition
define hostdependency{host_name WWW1dependent_host_name DBASE1notification_failure_criteria d,u
}
8.11.4 Directive Descriptions
dependent_host_name This directive is used to identify the short name(s) of the dependent host(s). Multiple hostsshould be separated by commas.
dependent_hostgroup_name This directive is used to identify the short name(s) of the dependent hostgroup(s).Multiple hostgroups should be separated by commas. The dependent_hostgroup_name may be used instead of,or in addition to, the dependent_host_name directive.
host_name This directive is used to identify the short name(s) of the host(s) that is being depended upon (also referredto as the master host). Multiple hosts should be separated by commas.
hostgroup_name This directive is used to identify the short name(s) of the hostgroup(s) that is being depended upon(also referred to as the master host). Multiple hostgroups should be separated by commas. The hostgroup_namemay be used instead of, or in addition to, the host_name directive.
inherits_parent This directive indicates whether or not the dependency inherits dependencies of the host that is beingdepended upon (also referred to as the master host). In other words, if the master host is dependent upon otherhosts and any one of those dependencies fail, this dependency will also fail.
execution_failure_criteria This directive is used to specify the criteria that determine when the dependent hostshould not be actively checked. If the master host is in one of the failure states we specify, the dependent
8.11. Host Dependency Definition 273

Shinken Documentation, Release 2.4
host will not be actively checked. Valid options are a combination of one or more of the following (multipleoptions are separated with commas):
• o = fail on an UP state
• d = fail on a DOWN state
• u = fail on an UNREACHABLE state
• p = fail on a pending state (e.g. the host has not yet been checked)
• n (none) : the execution dependency will never fail and the dependent host will always be actively checked(if other conditions allow for it to be).
If you specify u,d in this field, the dependent host will not be actively checked if the master host is in either anUNREACHABLE or DOWN state.
notification_failure_criteria This directive is used to define the criteria that determine when notifications for thedependent host should not be sent out. If the master host is in one of the failure states we specify, notificationsfor the dependent host will not be sent to contacts. Valid options are a combination of one or more of thefollowing:
• o = fail on an UP state
• d = fail on a DOWN state
• u = fail on an UNREACHABLE state
• p = fail on a pending state (e.g. the host has not yet been checked)
• n = (none) : the notification dependency will never fail and notifications for the dependent host will alwaysbe sent out.
If you specify d in this field, the notifications for the dependent host will not be sent out if the master host is ina DOWN state.
dependency_period This directive is used to specify the short name of the time period during which this dependencyis valid. If this directive is not specified, the dependency is considered to be valid during all times.
8.12 Host Escalation Definition
8.12.1 Description
Host escalations are completely optional and are used to escalate notifications for a particular host. More informationon how notification escalations work can be found here.
8.12.2 Definition Format
Bold directives are required, while the others are optional.
274 Chapter 8. Config
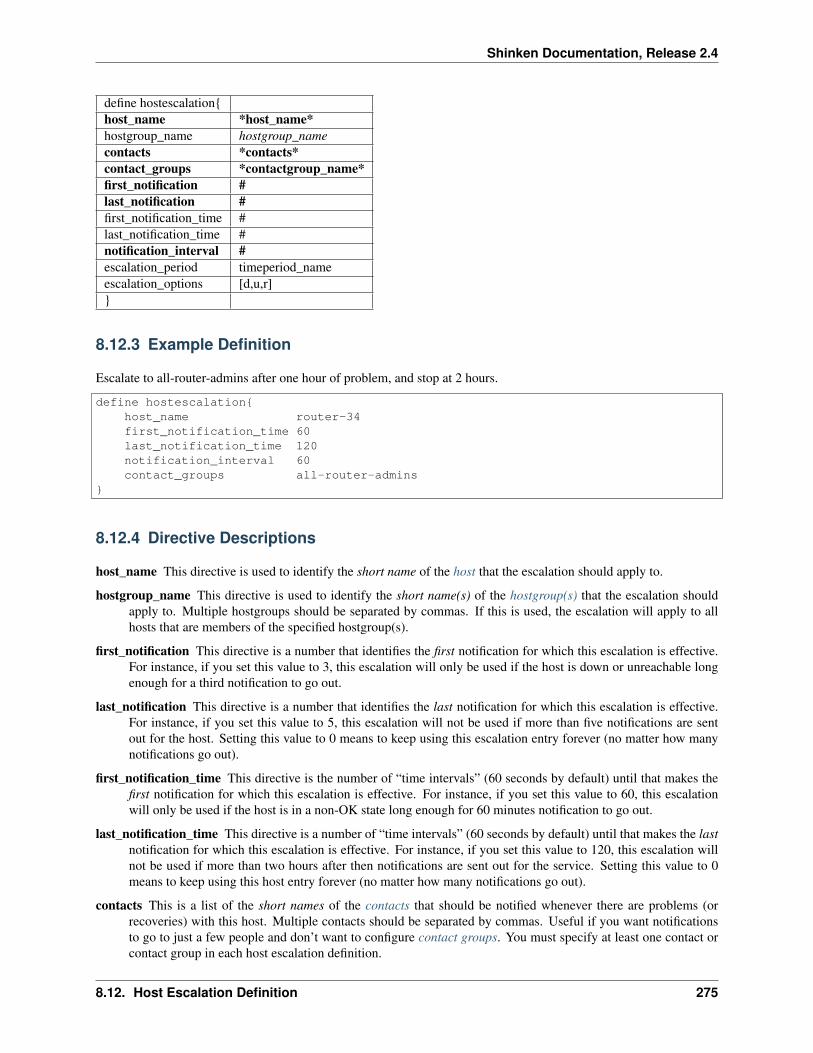
Shinken Documentation, Release 2.4
define hostescalation{host_name *host_name*hostgroup_name hostgroup_namecontacts *contacts*contact_groups *contactgroup_name*first_notification #last_notification #first_notification_time #last_notification_time #notification_interval #escalation_period timeperiod_nameescalation_options [d,u,r]}
8.12.3 Example Definition
Escalate to all-router-admins after one hour of problem, and stop at 2 hours.
define hostescalation{host_name router-34first_notification_time 60last_notification_time 120notification_interval 60contact_groups all-router-admins
}
8.12.4 Directive Descriptions
host_name This directive is used to identify the short name of the host that the escalation should apply to.
hostgroup_name This directive is used to identify the short name(s) of the hostgroup(s) that the escalation shouldapply to. Multiple hostgroups should be separated by commas. If this is used, the escalation will apply to allhosts that are members of the specified hostgroup(s).
first_notification This directive is a number that identifies the first notification for which this escalation is effective.For instance, if you set this value to 3, this escalation will only be used if the host is down or unreachable longenough for a third notification to go out.
last_notification This directive is a number that identifies the last notification for which this escalation is effective.For instance, if you set this value to 5, this escalation will not be used if more than five notifications are sentout for the host. Setting this value to 0 means to keep using this escalation entry forever (no matter how manynotifications go out).
first_notification_time This directive is the number of “time intervals” (60 seconds by default) until that makes thefirst notification for which this escalation is effective. For instance, if you set this value to 60, this escalationwill only be used if the host is in a non-OK state long enough for 60 minutes notification to go out.
last_notification_time This directive is a number of “time intervals” (60 seconds by default) until that makes the lastnotification for which this escalation is effective. For instance, if you set this value to 120, this escalation willnot be used if more than two hours after then notifications are sent out for the service. Setting this value to 0means to keep using this host entry forever (no matter how many notifications go out).
contacts This is a list of the short names of the contacts that should be notified whenever there are problems (orrecoveries) with this host. Multiple contacts should be separated by commas. Useful if you want notificationsto go to just a few people and don’t want to configure contact groups. You must specify at least one contact orcontact group in each host escalation definition.
8.12. Host Escalation Definition 275

Shinken Documentation, Release 2.4
contact_groups This directive is used to identify the short name of the contact group that should be notified whenthe host notification is escalated. Multiple contact groups should be separated by commas. You must specify atleast one contact or contact group in each host escalation definition.
notification_interval This directive is used to determine the interval at which notifications should be made while thisescalation is valid. If you specify a value of 0 for the interval, Shinken will send the first notification whenthis escalation definition is valid, but will then prevent any more problem notifications from being sent out forthe host. Notifications are sent out again until the host recovers. This is useful if you want to stop havingnotifications sent out after a certain amount of time.
If multiple escalation entries for a host overlap for one or more notification ranges, the smallest notificationinterval from all escalation entries is used.
escalation_period This directive is used to specify the short name of the time period during which this escalation isvalid. If this directive is not specified, the escalation is considered to be valid during all times.
escalation_options This directive is used to define the criteria that determine when this host escalation is used. Theescalation is used only if the host is in one of the states specified in this directive. If this directive is not specifiedin a host escalation, the escalation is considered to be valid during all host states. Valid options are a combinationof one or more of the following :
• r = escalate on an UP (recovery) state
• d = escalate on a DOWN state
• u = escalate on an UNREACHABLE state
If you specify d in this field, the escalation will only be used if the host is in a DOWN state.
Note: You can define generic escalation with the statement “define escalation” instead of hostescalation. There areless required parameter (as there is not type) but you still have to defined them to make it work
8.13 Extended Host Information Definition
8.13.1 Description
Extended host information entries are basically used to make the output from the status, statusmap, statuswrl, andextinfo CGIs look pretty. They have no effect on monitoring and are completely optional.
Note: Tip: As of Nagios 3.x, all directives contained in extended host information definitions are also available in hostdefinitions. Thus, you can choose to define the directives below in your host definitions if it makes your configurationsimpler. Separate extended host information definitions will continue to be supported for backward compatibility.
8.13.2 Definition Format
Bold directives are required, while the others are optional.
276 Chapter 8. Config

Shinken Documentation, Release 2.4
define hostextinfo{host_name *host_name*notes notesnotes_url notes_urlaction_url action_urlicon_image image_fileicon_image_alt alt_stringvrml_image image_filestatusmap_image image_file2d_coords x_coord,y_coord3d_coords x_coord,y_coord,z_coord}
8.13.3 Example Definition
define hostextinfo{host_name netware1notes This is the primary Netware file servernotes_url http://webserver.localhost.localdomain/hostinfo.pl?host=netware1icon_image novell40.pngicon_image_alt IntranetWare 4.11vrml_image novell40.pngstatusmap_image novell40.gd22d_coords 100,2503d_coords 100.0,50.0,75.0
}
8.13.4 Directive Descriptions
host_name This variable is used to identify the short name of the host which the data is associated with.
notes This directive is used to define an optional string of notes pertaining to the host. If you specify a note here, youwill see the it in the extended information CGI (when you are viewing information about the specified host).
notes_url This variable is used to define an optional URL that can be used to provide more information about thehost. If you specify an URL, you will see a link that says “Extra Host Notes” in the extended information CGI(when you are viewing information about the specified host). Any valid URL can be used. If you plan on usingrelative paths, the base path will the the same as what is used to access the CGIs (i.e. /cgi-bin/nagios/). This canbe very useful if you want to make detailed information on the host, emergency contact methods, etc. availableto other support staff.
action_url This directive is used to define an optional URL that can be used to provide more actions to be performedon the host. If you specify an URL, you will see a link that says “Extra Host Actions” in the extended informationCGI (when you are viewing information about the specified host). Any valid URL can be used. If you plan onusing relative paths, the base path will the the same as what is used to access the CGIs (i.e. /cgi-bin/nagios/).
icon_image This variable is used to define the name of a GIF, PNG, or JPG image that should be associated with thishost. This image will be displayed in the status and extended information CGIs. The image will look best if itis 40x40 pixels in size. Images for hosts are assumed to be in the logos/ subdirectory in your HTML imagesdirectory (i.e. /usr/local/nagios/share/images/logos).
icon_image_alt This variable is used to define an optional string that is used in the ALT tag of the image specified bythe <icon_image> argument. The ALT tag is used in the status, extended information and statusmap CGIs.
8.13. Extended Host Information Definition 277
Shinken Documentation, Release 2.4
vrml_image This variable is used to define the name of a GIF, PNG, or JPG image that should be associated with thishost. This image will be used as the texture map for the specified host in the statuswrl CGI. Unlike the imageyou use for the <icon_image> variable, this one should probably not have any transparency. If it does, the hostobject will look a bit weird. Images for hosts are assumed to be in the logos/ subdirectory in your HTML imagesdirectory (i.e. /usr/local/nagios/share/images/logos).
statusmap_image This variable is used to define the name of an image that should be associated with this host inthe statusmap CGI. You can specify a JPEG, PNG, and GIF image if you want, although I would stronglysuggest using a GD2 format image, as other image formats will result in a lot of wasted CPU time when thestatusmap image is generated. GD2 images can be created from PNG images by using the pngtogd2 util-ity supplied with Thomas Boutell’s gd library. The GD2 images should be created in uncompressed formatin order to minimize CPU load when the statusmap CGI is generating the network map image. The imagewill look best if it is 40x40 pixels in size. You can leave these option blank if you are not using the sta-tusmap CGI. Images for hosts are assumed to be in the logos/ subdirectory in your HTML images directory (i.e./usr/local/nagios/share/images/logos).
2d_coords This variable is used to define coordinates to use when drawing the host in the statusmap CGI. Coordinatesshould be given in positive integers, as they correspond to physical pixels in the generated image. The originfor drawing (0,0) is in the upper left hand corner of the image and extends in the positive x direction (to theright) along the top of the image and in the positive y direction (down) along the left hand side of the image.For reference, the size of the icons drawn is usually about 40x40 pixels (text takes a little extra space). Thecoordinates you specify here are for the upper left hand corner of the host icon that is drawn. Note: Don’t worryabout what the maximum x and y coordinates that you can use are. The CGI will automatically calculate themaximum dimensions of the image it creates based on the largest x and y coordinates you specify.
3d_coords This variable is used to define coordinates to use when drawing the host in the statuswrl CGI. Coordinatescan be positive or negative real numbers. The origin for drawing is (0.0,0.0,0.0). For reference, the size of thehost cubes drawn is 0.5 units on each side (text takes a little more space). The coordinates you specify here areused as the center of the host cube.
8.14 Extended Service Information Definition
8.14.1 Description
Extended service information entries are basically used to make the output from the status and extinfo CGIs lookpretty. They have no effect on monitoring and are completely optional.
Note: Tip: As of Nagios 3.x, all directives contained in extended service information definitions are also availablein service definitions. Thus, you can choose to define the directives below in your service definitions if it makes yourconfiguration simpler. Separate extended service information definitions will continue to be supported for backwardcompatibility.
8.14.2 Definition Format
Bold directives are required, while the others are optional.
278 Chapter 8. Config

Shinken Documentation, Release 2.4
define serviceextinfo{host_name *host_name*service_description *service_description*notes notesnotes_url notes_urlaction_url action_urlicon_image image_fileicon_image_alt alt_string}
8.14.3 Example Definition
define serviceextinfo{host_name linux2service_description Log Anomaliesnotes Security-related log anomalies on secondary Linux servernotes_url http://webserver.localhost.localdomain/serviceinfo.pl?host=linux2&service=Log+Anomaliesicon_image security.pngicon_image_alt Security-Related Alerts
}
8.14.4 Directive Descriptions
host_name This directive is used to identify the short name of the host that the service is associated with.
service_description This directive is description of the service which the data is associated with.
notes This directive is used to define an optional string of notes pertaining to the service. If you specify a note here,you will see the it in the extended information CGI (when you are viewing information about the specifiedservice).
notes_url This directive is used to define an optional URL that can be used to provide more information about theservice. If you specify an URL, you will see a link that says “Extra Service Notes” in the extended informationCGI (when you are viewing information about the specified service). Any valid URL can be used. If you planon using relative paths, the base path will the the same as what is used to access the CGIs (i.e. /cgi-bin/nagios/).This can be very useful if you want to make detailed information on the service, emergency contact methods,etc. available to other support staff.
action_url This directive is used to define an optional URL that can be used to provide more actions to be performedon the service. If you specify an URL, you will see a link that says “Extra Service Actions” in the extendedinformation CGI (when you are viewing information about the specified service). Any valid URL can be used.If you plan on using relative paths, the base path will the the same as what is used to access the CGIs (i.e./cgi-bin/nagios/).
icon_image This variable is used to define the name of a GIF, PNG, or JPG image that should be associated with thishost. This image will be displayed in the status and extended information CGIs. The image will look best if itis 40x40 pixels in size. Images for hosts are assumed to be in the logos/ subdirectory in your HTML imagesdirectory (i.e. /usr/local/nagios/share/images/logos).
icon_image_alt This variable is used to define an optional string that is used in the ALT tag of the image specified bythe <icon_image> argument. The ALT tag is used in the status, extended information and statusmap CGIs.
8.14. Extended Service Information Definition 279
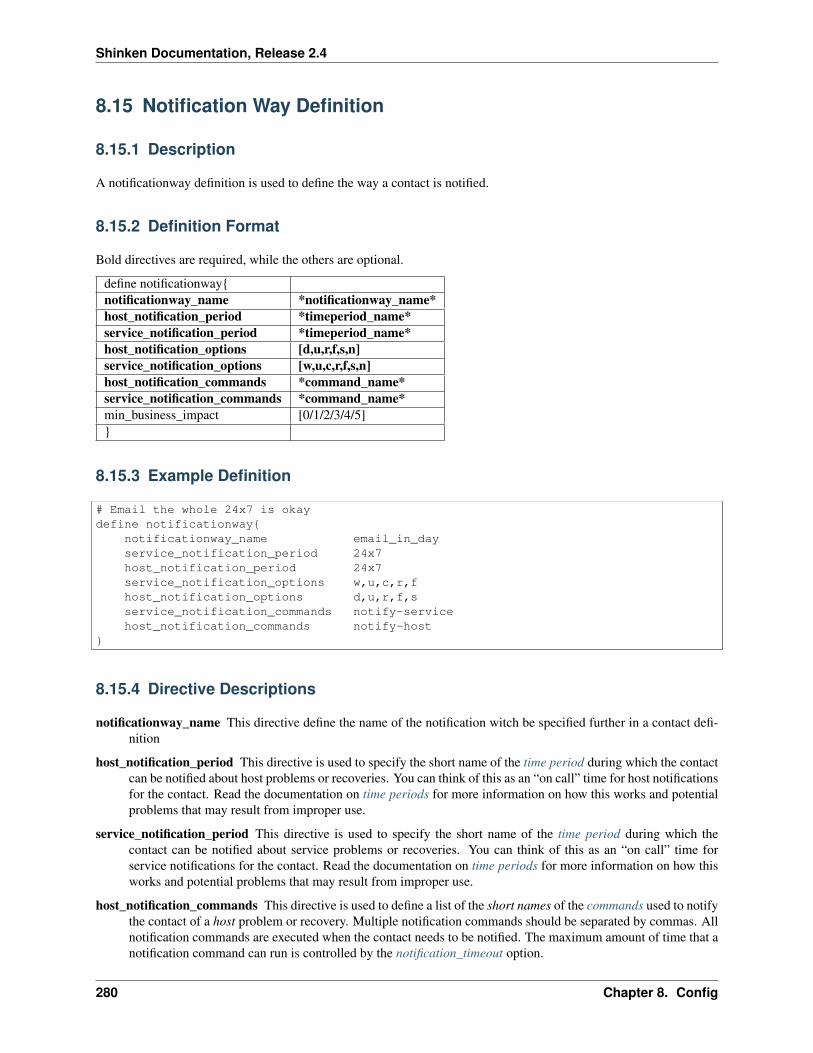
Shinken Documentation, Release 2.4
8.15 Notification Way Definition
8.15.1 Description
A notificationway definition is used to define the way a contact is notified.
8.15.2 Definition Format
Bold directives are required, while the others are optional.
define notificationway{notificationway_name *notificationway_name*host_notification_period *timeperiod_name*service_notification_period *timeperiod_name*host_notification_options [d,u,r,f,s,n]service_notification_options [w,u,c,r,f,s,n]host_notification_commands *command_name*service_notification_commands *command_name*min_business_impact [0/1/2/3/4/5]}
8.15.3 Example Definition
# Email the whole 24x7 is okaydefine notificationway{
notificationway_name email_in_dayservice_notification_period 24x7host_notification_period 24x7service_notification_options w,u,c,r,fhost_notification_options d,u,r,f,sservice_notification_commands notify-servicehost_notification_commands notify-host
}
8.15.4 Directive Descriptions
notificationway_name This directive define the name of the notification witch be specified further in a contact defi-nition
host_notification_period This directive is used to specify the short name of the time period during which the contactcan be notified about host problems or recoveries. You can think of this as an “on call” time for host notificationsfor the contact. Read the documentation on time periods for more information on how this works and potentialproblems that may result from improper use.
service_notification_period This directive is used to specify the short name of the time period during which thecontact can be notified about service problems or recoveries. You can think of this as an “on call” time forservice notifications for the contact. Read the documentation on time periods for more information on how thisworks and potential problems that may result from improper use.
host_notification_commands This directive is used to define a list of the short names of the commands used to notifythe contact of a host problem or recovery. Multiple notification commands should be separated by commas. Allnotification commands are executed when the contact needs to be notified. The maximum amount of time that anotification command can run is controlled by the notification_timeout option.
280 Chapter 8. Config
Shinken Documentation, Release 2.4
service_notification_commands This directive is used to define a list of the short names of the commands used tonotify the contact of a service problem or recovery. Multiple notification commands should be separated bycommas. All notification commands are executed when the contact needs to be notified. The maximum amountof time that a notification command can run is controlled by the notification_timeout option.
host_notification_options This directive is used to define the host states for which notifications can be sent out tothis contact. Valid options are a combination of one or more of the following:
• d = notify on DOWN host states
• u = notify on UNREACHABLE host states
• r = notify on host recoveries (UP states)
• f = notify when the host starts and stops flapping,
• s = send notifications when host or service scheduled downtime starts and ends. If you specify n (none) asan option, the contact will not receive any type of host notifications.
service_notification_options This directive is used to define the service states for which notifications can be sent outto this contact. Valid options are a combination of one or more of the following:
• w = notify on WARNING service states
• u = notify on UNKNOWN service states
• c = notify on CRITICAL service states
• r = notify on service recoveries (OK states)
• f = notify when the service starts and stops flapping.
• n = (none) : the contact will not receive any type of service notifications.
min_business_impact This directive is used to define the minimum business criticity level of a service/host thecontact will be notified. Please see root_problems_and_impacts for more details.
• 0 = less important
• 1 = more important than 0
• 2 = more important than 1
• 3 = more important than 2
• 4 = more important than 3
• 5 = most important
8.16 Realm Definition
8.16.1 Description
The realms are a optional feature useful if the administrator want to divide it’s resources like schedulers or pollers.
The Realm definition is optional. If no scheduler is defined, Shinken will “create” one for the user and will be thedefault one.
8.16. Realm Definition 281
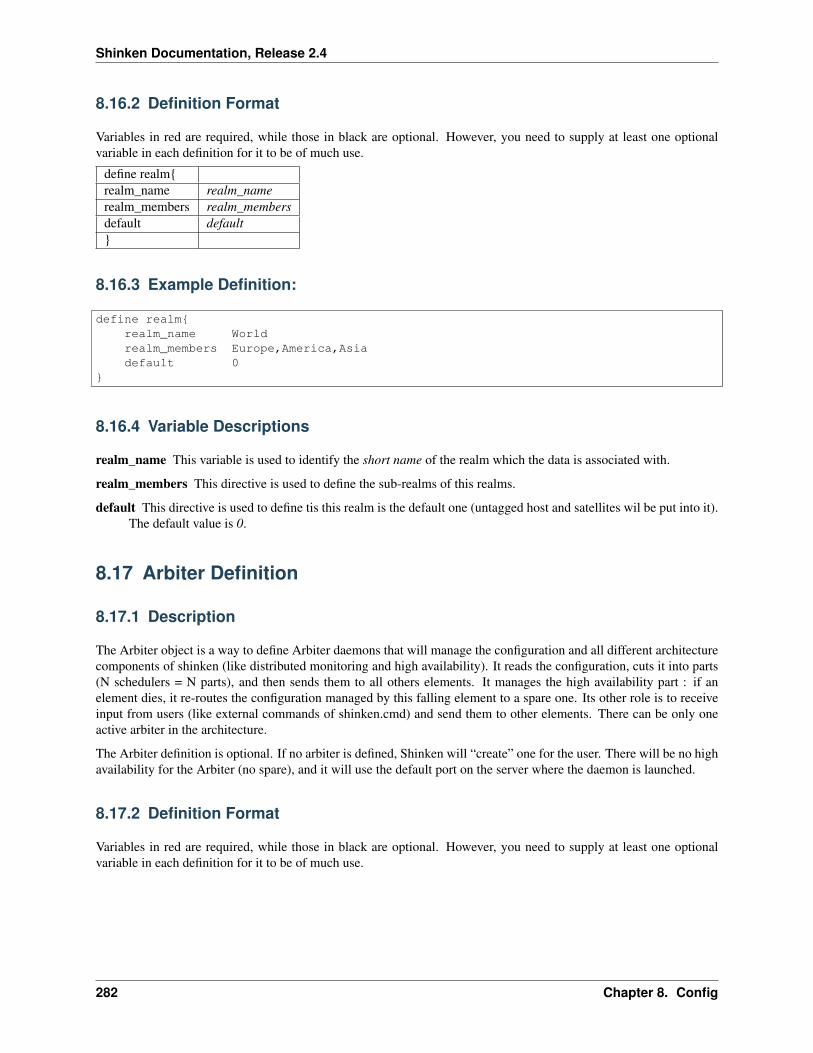
Shinken Documentation, Release 2.4
8.16.2 Definition Format
Variables in red are required, while those in black are optional. However, you need to supply at least one optionalvariable in each definition for it to be of much use.
define realm{realm_name realm_namerealm_members realm_membersdefault default}
8.16.3 Example Definition:
define realm{realm_name Worldrealm_members Europe,America,Asiadefault 0
}
8.16.4 Variable Descriptions
realm_name This variable is used to identify the short name of the realm which the data is associated with.
realm_members This directive is used to define the sub-realms of this realms.
default This directive is used to define tis this realm is the default one (untagged host and satellites wil be put into it).The default value is 0.
8.17 Arbiter Definition
8.17.1 Description
The Arbiter object is a way to define Arbiter daemons that will manage the configuration and all different architecturecomponents of shinken (like distributed monitoring and high availability). It reads the configuration, cuts it into parts(N schedulers = N parts), and then sends them to all others elements. It manages the high availability part : if anelement dies, it re-routes the configuration managed by this falling element to a spare one. Its other role is to receiveinput from users (like external commands of shinken.cmd) and send them to other elements. There can be only oneactive arbiter in the architecture.
The Arbiter definition is optional. If no arbiter is defined, Shinken will “create” one for the user. There will be no highavailability for the Arbiter (no spare), and it will use the default port on the server where the daemon is launched.
8.17.2 Definition Format
Variables in red are required, while those in black are optional. However, you need to supply at least one optionalvariable in each definition for it to be of much use.
282 Chapter 8. Config

Shinken Documentation, Release 2.4
define arbiter{arbiter_name arbiter_nameaddress dns name of ip addresshost_name hostnameport portspare //[0/1]//modules modulestimeout number of seconds to block the arbiter waiting for an answerdata_timeout seconds to wait when sending data to another satellite(daemon)max_check_attempts numbercheck_interval seconds to wait before issuing a new checkaccept_passive_unknown_check_results //[0/1]//}
8.17.3 Example Definition:
define arbiter{arbiter_name Main-arbiteraddress node1.mydomainhost_name node1port 7770spare 0modules module1,module2
}
8.17.4 Variable Descriptions
arbiter_name This variable is used to identify the short name of the arbiter with which the data will be associatedwith.
address This directive is used to define the address from where the main arbiter can reach this arbiter (that can beitself). This can be a DNS name or an IP address.
host_name This variable is used by the arbiters daemons to define which ‘arbiter’ object they are : all theses daemonson different servers use the same configuration, so the only difference is their server name. This value must beequal to the name of the server (like with the hostname command). If none is defined, the arbiter daemon willput the name of the server where it’s launched, but this will not be tolerated with more than one arbiter (becauseeach daemons will think it’s the master).
port This directive is used to define the TCP port used by the daemon. The default value is 7770.
spare This variable is used to define if the daemon matching this arbiter definition is a spare one or not. The defaultvalue is 0 (master/non-spare).
modules This variable is used to define all modules that the arbtier daemon matching this definition will load.
timeout This variable defines how much time the arbiter will block waiting for the response of a inter-process ping(Pyro). 3 seconds by default. This operation will become non blocking when Python 2.4 and 2.5 is dropped inShinken 1.4.
data_timeout Data send timeout. When sending data to another process. 120 seconds by default.
max_check_attempts If ping fails N or more, then the node is considered dead. 3 attempts by default.
check_interval Ping node every N seconds. 60 seconds by default.
8.17. Arbiter Definition 283

Shinken Documentation, Release 2.4
accept_passive_unknown_check_results If this is enabled, the arbiter will accept passive check results for uncon-figured hosts and will generate unknown host/service check result broks.
8.18 Scheduler Definition
8.18.1 Description
The Scheduler daemon is in charge of the scheduling checks, the analysis of results and follow up actions (like if aservice is down, ask for a host check). They do not launch checks or notifications. They keep a queue of pendingchecks and notifications for other elements of the architecture (like pollers or reactionners). There can be manyschedulers.
The Scheduler definition is optionnal. If no scheduler is defined, Shinken will “create” one for the user. There will beno high availability for it (no spare), and will use the default port in the server where the deamon is launched.
8.18.2 Definition Format
Variables in red are required, while those in black are optional. However, you need to supply at least one optionalvariable in each definition for it to be of much use.
define scheduler{scheduler_name scheduler_nameaddress dns name of ip addressport portspare //[0/1]//realm realm namemodules modulesaccept_passive_unknown_check_results //[0/1]//}
8.18.3 Example Definition:
define scheduler{scheduler_name Europe-scheduleraddress node1.mydomainport 7770spare 0realm Europe
# Optional parametersspare 0 ; 1 = is a spare, 0 = is not a spareweight 1 ; Some schedulers can manage more hosts than otherstimeout 3 ; Ping timeoutdata_timeout 120 ; Data send timeoutmax_check_attempts 3 ; If ping fails N or more, then the node is deadcheck_interval 60 ; Ping node every minutesmodules PickleRetention
# Skip initial broks creation for faster boot time. Experimental feature# which is not stable.skip_initial_broks 0
284 Chapter 8. Config
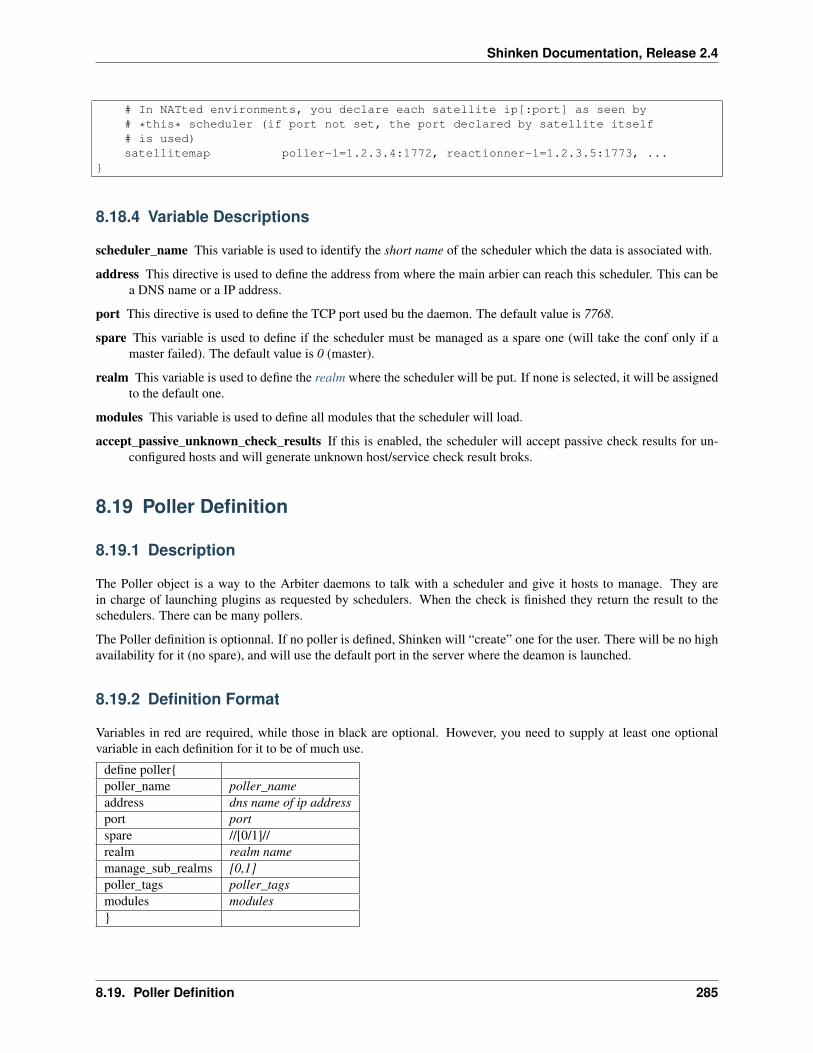
Shinken Documentation, Release 2.4
# In NATted environments, you declare each satellite ip[:port] as seen by# *this* scheduler (if port not set, the port declared by satellite itself# is used)satellitemap poller-1=1.2.3.4:1772, reactionner-1=1.2.3.5:1773, ...
}
8.18.4 Variable Descriptions
scheduler_name This variable is used to identify the short name of the scheduler which the data is associated with.
address This directive is used to define the address from where the main arbier can reach this scheduler. This can bea DNS name or a IP address.
port This directive is used to define the TCP port used bu the daemon. The default value is 7768.
spare This variable is used to define if the scheduler must be managed as a spare one (will take the conf only if amaster failed). The default value is 0 (master).
realm This variable is used to define the realm where the scheduler will be put. If none is selected, it will be assignedto the default one.
modules This variable is used to define all modules that the scheduler will load.
accept_passive_unknown_check_results If this is enabled, the scheduler will accept passive check results for un-configured hosts and will generate unknown host/service check result broks.
8.19 Poller Definition
8.19.1 Description
The Poller object is a way to the Arbiter daemons to talk with a scheduler and give it hosts to manage. They arein charge of launching plugins as requested by schedulers. When the check is finished they return the result to theschedulers. There can be many pollers.
The Poller definition is optionnal. If no poller is defined, Shinken will “create” one for the user. There will be no highavailability for it (no spare), and will use the default port in the server where the deamon is launched.
8.19.2 Definition Format
Variables in red are required, while those in black are optional. However, you need to supply at least one optionalvariable in each definition for it to be of much use.
define poller{poller_name poller_nameaddress dns name of ip addressport portspare //[0/1]//realm realm namemanage_sub_realms [0,1]poller_tags poller_tagsmodules modules}
8.19. Poller Definition 285

Shinken Documentation, Release 2.4
8.19.3 Example Definition:
define poller{poller_name Europe-polleraddress node1.mydomainport 7771spare 0
# Optional parametersmanage_sub_realms 0poller_tags DMZ, Another-DMZmodules module1,module2realm Europemin_workers 0 ; Starts with N processes (0 = 1 per CPU)max_workers 0 ; No more than N processes (0 = 1 per CPU)processes_by_worker 256 ; Each worker manages N checkspolling_interval 1 ; Get jobs from schedulers each N seconds
}
8.19.4 Variable Descriptions
poller_name This variable is used to identify the short name of the poller which the data is associated with.
address This directive is used to define the address from where the main arbier can reach this poller. This can be aDNS name or a IP address.
port This directive is used to define the TCP port used bu the daemon. The default value is 7771.
spare This variable is used to define if the poller must be managed as a spare one (will take the conf only if a masterfailed). The default value is 0 (master).
realm This variable is used to define the realm where the poller will be put. If none is selected, it will be assigned tothe default one.
manage_sub_realms This variable is used to define if the poller will take jobs from scheduler from the sub-realmsof it’s realm. The default value is 0.
poller_tags This variable is used to define the checks the poller can take. If no poller_tags is defined, poller will takeall untagued checks. If at least one tag is defined, it will take only the checks that are also taggued like it. Bydefault, there is no poller_tag, so poller can take all untagued checks (default).
modules This variable is used to define all modules that the scheduler will load.
8.20 Reactionner Definition
8.20.1 Description
The Reactionner daemon is in charge of notifications and launching event_handlers. There can be more than oneReactionner.
8.20.2 Definition Format
Variables in red are required, while those in black are optional. However, you need to supply at least one optionalvariable in each definition for it to be of much use.
286 Chapter 8. Config

Shinken Documentation, Release 2.4
define reactionner{reactionner_name reactionner_nameaddress dns name of ip addressport portspare //[0/1]//realm realm namemanage_sub_realms [0,1]modules modules}
8.20.3 Example Definition:
define reactionner{reactionner_name Main-reactionneraddress node1.mydomainport 7769spare 0realm All
# Optional parametersmanage_sub_realms 0 ; Does it take jobs from schedulers of sub-Realms?min_workers 1 ; Starts with N processes (0 = 1 per CPU)max_workers 15 ; No more than N processes (0 = 1 per CPU)polling_interval 1 ; Get jobs from schedulers each 1 secondtimeout 3 ; Ping timeoutdata_timeout 120 ; Data send timeoutmax_check_attempts 3 ; If ping fails N or more, then the node is deadcheck_interval 60 ; Ping node every minutesreactionner_tags tag1modules module1,module2
}
8.20.4 Variable Descriptions
reactionner_name This variable is used to identify the short name of the reactionner which the data is associatedwith.
address This directive is used to define the address from where the main arbier can reach this reactionner. This canbe a DNS name or a IP address.
port This directive is used to define the TCP port used bu the daemon. The default value is 7772.
spare This variable is used to define if the reactionner must be managed as a spare one (will take the conf only if amaster failed). The default value is 0 (master).
realm This variable is used to define the realm where the reactionner will be put. If none is selected, it will be assignedto the default one.
manage_sub_realms This variable is used to define if the poller will take jobs from scheduler from the sub-realmsof it’s realm. The default value is 1.
modules This variable is used to define all modules that the reactionner will load.
reactionner_tags This variable is used to define the checks the reactionner can take. If no reactionner_tags is defined,reactionner will take all untagued notifications and event handlers. If at least one tag is defined, it will take onlythe checks that are also taggued like it.
8.20. Reactionner Definition 287
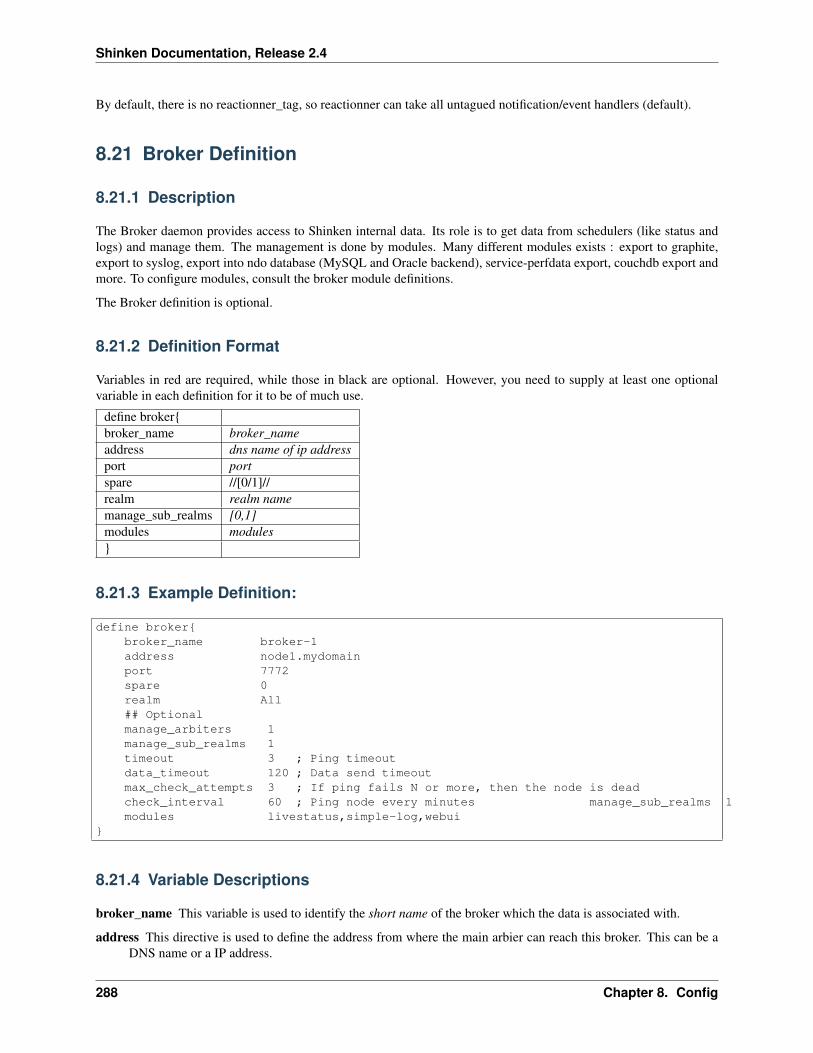
Shinken Documentation, Release 2.4
By default, there is no reactionner_tag, so reactionner can take all untagued notification/event handlers (default).
8.21 Broker Definition
8.21.1 Description
The Broker daemon provides access to Shinken internal data. Its role is to get data from schedulers (like status andlogs) and manage them. The management is done by modules. Many different modules exists : export to graphite,export to syslog, export into ndo database (MySQL and Oracle backend), service-perfdata export, couchdb export andmore. To configure modules, consult the broker module definitions.
The Broker definition is optional.
8.21.2 Definition Format
Variables in red are required, while those in black are optional. However, you need to supply at least one optionalvariable in each definition for it to be of much use.
define broker{broker_name broker_nameaddress dns name of ip addressport portspare //[0/1]//realm realm namemanage_sub_realms [0,1]modules modules}
8.21.3 Example Definition:
define broker{broker_name broker-1address node1.mydomainport 7772spare 0realm All## Optionalmanage_arbiters 1manage_sub_realms 1timeout 3 ; Ping timeoutdata_timeout 120 ; Data send timeoutmax_check_attempts 3 ; If ping fails N or more, then the node is deadcheck_interval 60 ; Ping node every minutes manage_sub_realms 1modules livestatus,simple-log,webui
}
8.21.4 Variable Descriptions
broker_name This variable is used to identify the short name of the broker which the data is associated with.
address This directive is used to define the address from where the main arbier can reach this broker. This can be aDNS name or a IP address.
288 Chapter 8. Config
Shinken Documentation, Release 2.4
port This directive is used to define the TCP port used bu the daemon. The default value is 7772.
spare This variable is used to define if the broker must be managed as a spare one (will take the conf only if a masterfailed). The default value is 0 (master).
realm This variable is used to define the realm where the broker will be put. If none is selected, it will be assigned tothe default one.
manage_arbiters Take data from Arbiter. There should be only one broker for the arbiter.
manage_sub_realms This variable is used to define if the broker will take jobs from scheduler from the sub-realmsof it’s realm. The default value is 1.
modules This variable is used to define all modules that the broker will load. The main goal ofthe Broker is to givestatus to theses modules.
8.21. Broker Definition 289

Shinken Documentation, Release 2.4
290 Chapter 8. Config

CHAPTER 9
Shinken Architecture
291

Shinken Documentation, Release 2.4
9.1 Arbiter supervision of Shinken processes
9.1.1 Introduction
Nobody is perfect, nor are OSes. A server can fail, and so does the network. That’s why you can (should) definemultiple processes as well as spares in the Shinken architecture.
9.1.2 Supervision method
The Arbiter daemon constantly checks that every one is alive. If a node is declared to be dead, the Arbiter will sendthe configuration of this node to a spare one. Other satellites get the address of this new node so they can change theirconnections.
The case where the daemon was still alive but that it was just a network interruption is also managed: There will be 2nodes with the same configuration, but the Arbiter will ask one (the old one) to become inactive.
The spare node that has become active will not preemptively fail back to the original node.
9.1.3 Adjusting timers for large configurations
Supervision parameters need to be adjusted with extra large configurations that may need more time to startup orprocess data. The arbiter periodically sends a verification to each process to see if it is alive. The timeouts and retryfor this can be adjusted.
Timeout should be left at 3 seconds, even for large configuration. Health checks are synchronous. This is due tocompatibility with Python 2.4. There will eventually become asynchronous as Python 2.6 support is dropped in thefuture. Retries should be multiplied as need. Data timeout should be left as is.
Important: TODO Put all of the arbiter supervisory parameters with formulas and examples.
9.1.4 Diagrams
It can be shown in the following diagram:
292 Chapter 9. Shinken Architecture

Shinken Documentation, Release 2.4
9.1. Arbiter supervision of Shinken processes 293

Shinken Documentation, Release 2.4
9.2 Advanced architectures
Shinken has got some cool features in term of configuration management or performance, but it’s true added value isin its architecture. It’s been designed to achieve easy distributed architecture and high availability.
9.2.1 Distributed architecture
The load balancing feature is very easy to obtain with Shinken. If I say that the project’s name comes from it youshould believe me :-)
In fact the load is present in 2 major places:
• pollers: they launch checks, they use a lot of resources
• schedulers: they schedule, potentially lots of checks
For both, a limit of 150000 checks/5min is a reasonable goal on an average server(4 cores@3Ghz). But remember thatis can be multiplied as much as you wish, just by adding another server.
There are 2 cases:
• checks that ask for a lot of performance (perl or shell scripts for example)
• a lot of scheduling (> 150000 checks in 5 minutes).
In the first case, you need to add more pollers. In the second, you need to add more schedulers. In this last case, youshould also add more pollers (more launch need more pollers) but that’s not compulsory.
But I already ear you asking “How to add new satellites?”. That’s very simple: You start by installing the applicationon a new server (don’t forget the sinken user + application files). Let say that this new server is called server-2 and hasthe IP 192.168.0.2 (remember that the “master” is called server-1 with 192.168.0.1 as IP).
Now you need to launch the scheduler and pollers (or just one of them if you want):
/etc/init.d/shinken-scheduler start/etc/init.d/shinken-poller start
It looks like the launch in the master server? Yes, it’s the same :-)
Here you just launch the daemons, now you need to declare them in their respectively directories on the master server(the one with the arbiter daemon). You need to add new entries for these satellites:
In /etc/shinken/schedulers/scheduler-master.cfg (create it if necessary):
define scheduler{
scheduler_name scheduler-2address 192.168.0.2port 7768spare 0}
In /etc/shinken/pollers/poller-master.cfg (create it if necessary):
define poller{
poller_name poller-2address 192.168.0.2port 7771
294 Chapter 9. Shinken Architecture
Shinken Documentation, Release 2.4
spare 0}
The differences with scheduler-1 and poller-1 are just the names and the address. Yep, that’s all :-)
Now you can restart the arbiter, and you’re done, the hosts will be distributed in both schedulers, and the checks willbe distributed to all pollers. Congrats :)
9.2.2 High availability architecture
Ok, a server can crash or a network can go down. The high availability is not a useless feature, you know?
With shinken, making a high availability architecture is very easy. Just as easy as the load balancing feature :)
You saw how to add new scheduler/poller satellites. For the HA it’s quite the same. You just need to add new satellitesin the same way you just did, and define them as “spares”. You can (should) do the same for all the satellites (a newarbiter, reactionner and broker) for a whole HA architecture.
We keep the load balancing previous installation and we add a new server (if you do not need load balancing, just takethe previous server). So like the previous case, you need to install the daemons and launch them.
/etc/init.d/shinken-scheduler start/etc/init.d/shinken-poller start
Nothing new here.
And we need to declare the new satellites in the directories near the arbiter:
In /etc/shinken/schedulers/scheduler-3.cfg (create it if necessary):
define scheduler{
scheduler_name scheduler-3address 192.168.0.3port 7768spare 1}
In /etc/shinken/pollers/poller-3.cfg (create it if necessary):
define poller{
poller_name poller-3address 192.168.0.3port 7771spare 1
}
Do you see a difference here? Aside from the name and address, there is a new parameter: spare. From the daemonpoint of view, they do not know if they are a spare or not. That’s the arbiter that says what they are.
You just need to restart the arbiter and you’ve got HA for the schedulers/pollers :)
Really?
Yes indeed, that’s all. Until one of the scheduler/poller fall, these two new daemons will just wait. If anyone falls, thespare daemon will take the configuration and start to work.
9.2. Advanced architectures 295

Shinken Documentation, Release 2.4
You should do the same for arbiter, reactionner and broker. Just install them in the server-3 and declare them in thereactionners and brokers directories file with a spare parameter. Now you’ve got a full HA architecture (and with loadbalancing if you keep the server-2 :) ).
Note: Here you have high availability, but if a scheduler dies, the spare takes the configuration, but not the savedstates. So it will have to reschedule all checks, and current states will be PENDING. To avoid this, you can linkdistributed retention modules such as memcache to your schedulers
9.2.3 Mixed Architecture (poller GNU/Linux and Windows or LAN/DMZ)
There can be as many pollers as you want. And Shinken runs under a lot of systems, like GNU/Linux and Windows.It could be useful to make windows hosts checks by a windows pollers (by a server IN the domain), and all the othersby a GNU/Linux one.
And in fact you can, and again it’s quite easy :) All pollers connect to all schedulers, so we must have a way todistinguish ‘windows’ checks from ‘gnu/linux’ ones.
The poller_tag/poller_tags parameter is useful here. It can be applied on the following objects:
• pollers
• commands
• services
• hosts
It’s quite simple: you ‘tag’ objects, and the pollers have got tags too. You’ve got an implicit inheritance betweenhosts->services->commands. If a command doesn’t have a poller_tag, it will take the one from the service. And if thisservice doesn’t have one neither, it will take the tag from its host.
Let take an example with a ‘windows’ tag:
define command{
command_namecommand_line c:\shinken\libexec\check_wmi.exe -H $HOSTADRESS$ -r $ARG1$poller_tag Windows
}
define poller{
poller_name poller-windowsaddress 192.168.0.4port 7771spare 0poller_tags Windows,DMZ
}
And the magic is here: all checks launched with this command will be taken by the poller-windows (or another thathas such a tag). A poller with no tags will only take ‘untagged’ commands.
It also works with a LAN/DMZ network. If you do not want to open all monitoring ports from the LAN to the DMZserver, you just need to install a poller with the ‘DMZ’ tag in the DMZ and then add it to all hosts (or services) in theDMZ. They will be taken by this poller and you just need to open the port to this poller from the LAN. Your networkadmins will be happier :)
define host{
296 Chapter 9. Shinken Architecture

Shinken Documentation, Release 2.4
host_name server-DMZ-1[...]poller_tag DMZ[...]
}
define service{
service_description CPUhost_name server-DMZ-2[...]poller_tag DMZ[...]
}
And that’s all :)
9.2.4 Multi customers and/or sites: REALMS
The shinken’s architecture like we saw allows us to have a unique administration and data location. All pollers thehosts are cut and sent to schedulers, and the pollers take jobs from all schedulers. Every one is happy.
Every one? In fact no. If an administrator got a continental distributed architecture he can have serious problems. Ifthe architecture is common to multile customers network, a customer A scheduler can have a customer B poller thatasks him jobs. It’s not a good solution. Even with distributed network, distant pollers should not ask jobs to schedulersin the other continent, it’s not network efficient.
That is where the site/customers management is useful. In Shinken, it’s managed by the realms.
A realm is a group of resources that will manage hosts or hostgroups. Such a link will be unique: a host cannot be inmultiple realms. If you put a hostgroup in a realm, all hosts in this group will be in the realm (unless a host alreadyhas the realm set, the host value will be taken).
A realm is:
• at least a scheduler
• at least a poller
• can have a reactionner
• can have a broker
In a realm, all realm pollers will take all realm schedulers jobs.
Important: Very important: there is only ONE arbiter (and a spare of couse) for ALL realms. The arbiter managesall realms and all that is inside.
9.2.5 Sub-realms
A realm can have sub-realms. It doesn’t change anything for schedulers, but it can be useful for other satellites andspares. Reactionners and brokers are linked to a realm, but they can take jobs from all sub-realms too. This way youcan have less reactionners and brokers (like we soon will see).
The fact that reactionners/brokers (and in fact pollers too) can take jobs from sub-schedulers is decided by the presenceof the manage_sub_realms parameter. For pollers the default value is 0, but it’s 1 for reactionners/brokers.
9.2. Advanced architectures 297

Shinken Documentation, Release 2.4
Important: WARNING: having multiple brokers for one scheduler is not a good idea: after the information is send,it’s deleted from the scheduler, so each brokers will only got partial data!
9.2.6 An example ?
To make it simple: you put hosts and/or hostgroups in a realm. This last one is to be considered as a resources pool.You don’t need to touch the host/hostgroup definition if you need more/less performances in the realm or if you wantto add a new satellites (a new reactionner for example).
Realms are a way to manage resources. They are the smaller clouds in your global cloud infrastructure :)
If you do not need this feature, that’s not a problem, it’s optional. There will be a default realm created and every onewill be put into.
It’s the same for hosts that don’t have a realm configured: they will be put in the realm that has the “default” parameter.
9.2.7 Picture example
Diagrams are good :)
Let’s take two examples of distributed architectures around the world. In the first case, the administrator don’t wantto share resources between realms. They are distinct. In the second, the reactionners and brokers are shared with allrealms (so all notifications are send from a unique place, and so is all data).
Here is the isolated one:
And a more common way of sharing reactionner/broker:
298 Chapter 9. Shinken Architecture

Shinken Documentation, Release 2.4
Like you can see, all elements are in a unique realm. That’s the sub-realm functionality used for reactionner/broker.
9.2.8 Configuration of the realms
Here is the configuration for the shared architecture:
define realm {
realm_name Allrealm_members Europe,US,Asiadefault 1 ;Is the default realm. Should be unique!
}define realm{
realm_name Europerealm_members Paris ;This realm is IN Europe
}
An now the satellites:
define scheduler{
scheduler_name scheduler_Parisrealm Paris ;It will only manage Paris hosts
}define reactionner{
reactionner_name reactionner-masterrealm All ;Will reach ALL schedulers
}
9.2. Advanced architectures 299

Shinken Documentation, Release 2.4
And in host/hostgroup definition:
define host{
host_name server-parisrealm Paris ;Will be put in the Paris realm[...]
}
define hostgroups{
hostgroup_name linux-serversalias Linux Serversmembers srv1,srv2realm Europe ;Will be put in the Europe realm
}
9.3 How are commands and configurations managed in Shinken
Let’s take a look at how the dispatching is managed.
Shinken uses different daemons: each one has it’s own task. The global master is the Arbiter: it reads the configuration,divides it into parts and sends the parts to various Shinken daemons. It also looks at which daemon are alive: if onedies, it will give the configuration of the dead one to another daemon so that it can replace it.
9.3.1 Configuration dispatching
It looks like this:
300 Chapter 9. Shinken Architecture
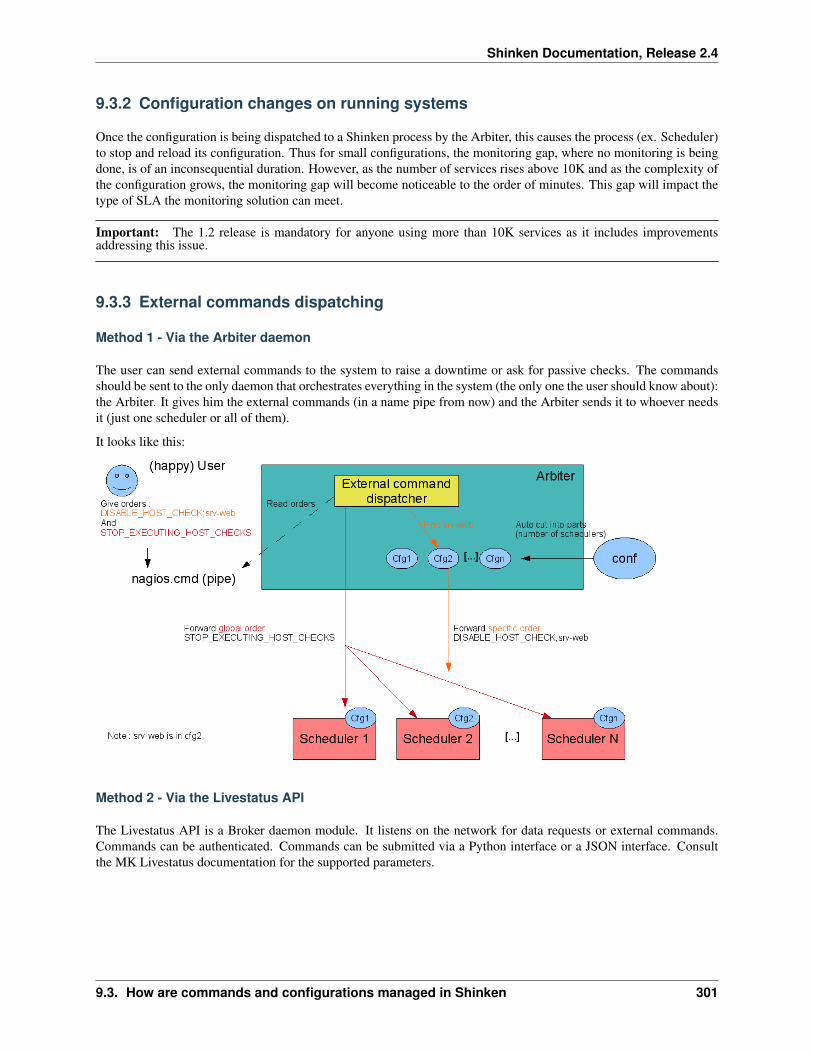
Shinken Documentation, Release 2.4
9.3.2 Configuration changes on running systems
Once the configuration is being dispatched to a Shinken process by the Arbiter, this causes the process (ex. Scheduler)to stop and reload its configuration. Thus for small configurations, the monitoring gap, where no monitoring is beingdone, is of an inconsequential duration. However, as the number of services rises above 10K and as the complexity ofthe configuration grows, the monitoring gap will become noticeable to the order of minutes. This gap will impact thetype of SLA the monitoring solution can meet.
Important: The 1.2 release is mandatory for anyone using more than 10K services as it includes improvementsaddressing this issue.
9.3.3 External commands dispatching
Method 1 - Via the Arbiter daemon
The user can send external commands to the system to raise a downtime or ask for passive checks. The commandsshould be sent to the only daemon that orchestrates everything in the system (the only one the user should know about):the Arbiter. It gives him the external commands (in a name pipe from now) and the Arbiter sends it to whoever needsit (just one scheduler or all of them).
It looks like this:
Method 2 - Via the Livestatus API
The Livestatus API is a Broker daemon module. It listens on the network for data requests or external commands.Commands can be authenticated. Commands can be submitted via a Python interface or a JSON interface. Consultthe MK Livestatus documentation for the supported parameters.
9.3. How are commands and configurations managed in Shinken 301

Shinken Documentation, Release 2.4
9.4 Problems and impacts correlation management
9.4.1 What is this correlation ?
The main role of this feature is to allow users to have the same correlation views in the console than they got in thenotifications.
From now, users won”t get notified if there was a dependency problem or example (a host in DOWN make the servicenotifications to not be send for example). But in the console, we still got some green and red indicators: the schedulerwaited for actual checks to put the elements in a UNKNOWN or UNREACHABLE state when he already know thatthere was a dependency problem.
Now it”s smart enough to put such states to elements that we know the check will fail. An example?
Imagine such a parent relations between hosts:
If gw is DOWN, all checks for others elements will put UNREACHABLE state. But if the fw and servers are checks 5minutes later, during this period, the console will still have green indicators for them. And are they really green? No.We know that future checks will put them in errors. That why the problems/impacts feature do: when the gateway isset in HARD/DOWN, it apply a UNREACHABLE (and UNKNOWN for services) states for others elements below.So the administrators in front of his desk saw directly that there is a problem, and what are the elements impacted.
It”s important to see that such state change do not interfere with the HARD/SOFT logic: it”s just a state change forconsole, but it”s not taken into account as a checks attempt.
Here gateway is already in DOWN/HARD. We can see that all servers do not have an output: they are not alreadychecked, but we already set the UNREACHABLE state. When they will be checks, there will be an output and theywill keep this state.
302 Chapter 9. Shinken Architecture
Shinken Documentation, Release 2.4
9.4.2 How to enable it?
It’s quite easy, all you need is to enable the parameter
enable_problem_impacts_states_change=1
See enable_problem_impacts_states_change for more information about it.
9.4.3 Dynamic Business Impact
There is a good thing about problems and impacts when you do not identify a parent devices Business Impact: yourproblem will dynamically inherit the maximum business impact of the failed child!
Let take an example: you have a switch with different children, one is a devel environment with a low business impact(0 or 1) and one with a huge business impact (4 or 5). The network administrator has set SMS notification at night butonly for HUGE business impacts (min_criticity=4 in the contact definition for example).
It’s important to say that the switch DOES NOT HAVE ITS OWN BUSINESS IMPACT DEFINED! A switch is thereto server applications, the only business impact it gets is the child hosts and services that are connected to it!
There are 2 nights:
• the first one, the switch got a problem, and only the devel environment is impacted. The switch will inheritthe maximum impact of its impacts (or it own value if it’s higher, it’s 3 by default for all elements). Herethe devel impact is 0, the switch one is 3, so its impact will stay at 3. It’s slower than the contact value, sothe notification will not be send, the admin will be able to sleep :)
• the second night, the switch got a problem, but this time it impacts the production environment! This time,the computed impact is set at 5 (the one of the max impact, here the production application), so it’s higherthan the min_criticity of the contact, so the notification is send. The admin is awaken, and can solve thisproblem before too many users are impacted :)
9.5 Shinken Architecture
9.5.1 Summary
Shinken’s architecture has been designed according to the Unix Way: one tool, one task. Shinken has an architecturewhere each part is isolated and connects to the others via standard interfaces. Shinken is based on a HTTP backend.This makes building a highly available or distributed monitoring architectures quite easy.
• Shinken gets data IN
– passively
– actively
– Networked API
• Shinken acts on the data
– Correlation
– Event suppression
– Event handlers
– Adding new poller daemons
– Runtime interaction
9.5. Shinken Architecture 303

Shinken Documentation, Release 2.4
• Shinken gets data OUT
– Networked API
– Notifications
– Logging
– Web/Mobile Frontend (via API and Native WebUI)
– Metrics databases
• Shinken manages configurations
– Discovery manager SkonfUI
– Multi-level discovery engine
– Configuration Packs (commands, config templates, graph templates, etc.)
– Text file management via configuration engines (cfengine, chef, puppet, salt)
9.5.2 Shinken innovative features
Learn more about the innovative features of Shinken.
9.5.3 Shinken data acquisition for monitoring
Shinken needs plugins to actually gather data. There exists **thousands** of plugins for every conceivable application.Shinken packages the configurations necessary to use common plugins in Packs. Plugins themselves need to beinstalled by the administrator of the monitoring solution(Shinken will install some common ones for you). This is agreat strength and flexibility of Shinken, but also an administrative responsibility to download and install the necessaryplugins.
304 Chapter 9. Shinken Architecture

Shinken Documentation, Release 2.4
9.5.4 Architecture diagram with all daemons illustrated
9.5.5 Shinken Daemon roles
• Arbiter: The arbiter daemon reads the configuration, divides it into parts (N schedulers = N parts), and distributesthem to the appropriate Shinken daemons. Additionally, it manages the high availability features: if a particulardaemon dies, it re-routes the configuration managed by this failed daemon to the configured spare. Finally, itcan receive input from users (such as external commands from nagios.cmd) or passive check results and routesthem to the appropriate daemon. Passive check results are forwarded to the Scheduler responsible for the check.There can only be one active arbiter with other arbiters acting as hot standby spares in the architecture.
– Modules for data collection: NSCA, TSCA, Ws_arbiter (web service)
– Modules for configuration data storage: MongoDB
– Modules for status retention: PickleRententionArbiter
– Modules for configuration import: MySQLImport, GLPI, Landscape(Ubuntu)
– Modules for configuration modification: vmware autolinking, IP_Tag, and other task specific modules
• Scheduler: The scheduler daemon manages the dispatching of checks and actions to the poller and reactionnerdaemons respectively. The scheduler daemon is also responsible for processing the check result queue, analyzingthe results, doing correlation and following up actions accordingly (if a service is down, ask for a host check).It does not launch checks or notifications. It just keeps a queue of pending checks and notifications for otherdaemons of the architecture (like pollers or reactionners). This permits distributing load equally across manypollers. There can be many schedulers for load-balancing or hot standby roles. Status persistence is achievedusing a retention module.
– Modules for status retention: pickle, nagios, memcache, redis and MongoDB are available.
9.5. Shinken Architecture 305

Shinken Documentation, Release 2.4
• Poller: The poller daemon launches check plugins as requested by schedulers. When the check is finished itreturns the result to the schedulers. Pollers can be tagged for specialized checks (ex. Windows versus Unix,customer A versus customer B, DMZ) There can be many pollers for load-balancing or hot standby spare roles.
– Module for data acquisition: NRPE Module
– Module for data acquisition: CommandFile (Used for check_mk integration which depends on the na-gios.cmd named pipe )
– Module for data acquisition: SnmpBooster (NEW)
• Reactionner: The reactionner daemon issues notifications and launches event_handlers. This centralizes com-munication channels with external systems in order to simplify SMTP authorizations or RSS feed sources (onlyone for all hosts/services). There can be many reactionners for load-balancing and spare roles
– Module for external communications: AndroidSMS
• Broker: The broker daemon exports and manages data from schedulers. The broker uses modules exclusivelyto get the job done. The main method of interacting with Shinken is through the Livestatus API. Learn how toconfigure the Broker modules.
– Modules for the Livestatus API - live state, status retention and history: SQLite (default), MongoDB(experimental)
– Module for centralizing Shinken logs: Simple-log (flat file)
– Modules for data retention: Pickle , ToNdodb_Mysql, ToNdodb_Oracle, <del>couchdb</del>
– Modules for exporting data: Graphite-Perfdata, NPCDMOD(PNP4Nagios), raw_tcp(Splunk), Syslog
– Modules for the Shinken WebUI: GRAPHITE_UI, PNP_UI. Trending and data visualization.
– Modules for compatibility/migration: Service-Perfdata, Host-Perfdata and Status-Dat
• Receiver (optional): The receiver daemon receives passive check data and serves as a distributed commandbuffer. There can be many receivers for load-balancing and hot standby spare roles. The receiver can also usemodules to accept data from different protocols. Anyone serious about using passive check results should usea receiver to ensure that check data does not go through the Arbiter (which may be busy doing administrativetasks) and is forwarded directly to the appropriate Scheduler daemon(s).
– Module for passive data collection: NSCA, TSCA, Ws_arbiter (web service)
Tip: The various daemons can be run on a single server for small deployments or split on different hardware for largerdeployments as performance or availability requirements dictate. For larger deployments, running multiple Schedulersis recommended, even if they are on the same server. Consult planning a large scale Shinken deployment for moreinformation.
9.5.6 Learn more about the Shinken Distributed Architecture
The Shinken distributed architecture, more features explained.
• Smart and automatic load balancing
• High availability
• Specialized Pollers
• Advanced architectures: Realms
If you are just starting out, you can continue on with the next tutorial, which will help you Configure a web front-end.
306 Chapter 9. Shinken Architecture

Shinken Documentation, Release 2.4
9.5.7 Planning a large scale Shinken deployment
If you wish to plan a large scale installation of Shinken, you can consult the Scaling Shinken reference.
This is essential to avoid making time consuming mistakes and aggravation.
9.5. Shinken Architecture 307

Shinken Documentation, Release 2.4
308 Chapter 9. Shinken Architecture

CHAPTER 10
Troubleshooting
309
Shinken Documentation, Release 2.4
10.1 FAQ - Shinken troubleshooting
10.1.1 FAQ Summary
Shinken users, developers, administrators possess a body of knowledge that usually provides a quick path to problemresolutions. The Frequently Asked Questions questions are compiled from user questions and issues developers mayrun into.
Have you consulted at all the resources available for users and developers.
__Before posting a question to the forum:__
• Read the through the Getting Started tutorials
• Search the documentation wiki
• Use this FAQ
• Bonus: Update this FAQ if you found the answer and think it would benefit someone else
Doing this will improve the quality of the answers and your own expertise.
Frequently asked questions
• How to set my daemons in debug mode to review the logs?
• I am getting an OSError read-only filesystem
• I am getting an OSError [Errno 24] Too many open files
• Notification emails have generic-host instead of host_name
General Shinken troubleshooting steps to resolve common issue
• Have you mixed installation methods! Cleanup and install using a single method.
• Have you installed the check scripts and addon software
• Is Shinken even running?
• Have you checked the Shinken pre-requisites?
• Have you configured the WebUI module in your brokers/broker-master.cfg file
• Have you completed the Shinken basic configuration and Shinken WebUI configuration
• Have you reviewed your Shinken centralized (Simple-log broker module) logs for errors
• Have you reviewed your Shinken daemon specific logs for errors or tracebacks (what the system was doing justbefore a crash)
• Have you reviewed your configuration syntax (keywords and values)
• Is what you are trying to use installed? Are its dependencies installed! Does it even work.
• Is what you are trying to use a supported version?
• Are you using the same Python Pyro module version on all your hosts running a Shinken daemon (You have to!)
• Are you using the same Python version on all your hosts running a Shinken daemon (You have to!)
• Have you installed Shinken with the SAME prefix (ex: /usr/local) on all your hosts running a Shinken daemon(You have to!)
310 Chapter 10. Troubleshooting

Shinken Documentation, Release 2.4
• Have you enabled debugging logs on your daemon(s)
• How to identify the source of a Pyro MemoryError
• Problem with Livestatus, did it start, is it listening on the expected TCP port, have you enabled and configuredthe module in /etc/shinken/modules/livestatus.cfg.
• Have you installed the check scripts as the shinken user and not as root
• Have you executed/tested your command as the shinken user
• Have you manually generated check results
• Can you connect to your remote agent NRPE, NSClient++, etc.
• Have you defined a module on the wrong daemon (ex. NSCA receiver module on a Broker)
• Have you created a diagram illustrating your templates and inheritance
• System logs (/var/messages, windows event log)
• Application logs (MongoDB, SQLite, Apache, etc)
• Security logs (Filters, Firewalls operational logs)
• Use top or Microsoft Task manager or process monitor (Microsoft sysinternals tools) to look for memory, cpuand process issues.
• Use nagiostat to check latency and other core related metrics.
• Is your check command timeout too long
• Have you looked at your Graphite Carbon metrics
• Can you connect to the Graphite web interface
• Are there gaps in your data
• Have you configured your storage schema (retention interval and aggregation rules) for Graphite collected data.
• Are you sending data more often than what is expected by your storage schema.
• Storing data to the Graphite databases, are you using the correct IP, port and protocol, are both modules enabled;Graphite_UI and graphite export.
10.1.2 FAQ Answers
Review the daemon logs
A daemon is a Shinken process. Each daemon generates a log file by default. If you need to learn more about whatis what, go back to the shinken architecture. The configuration of a daemon is set in the .ini configuration file(ex.brokerd.ini). Logging is enabled and set to level INFO by default.
Default log file location ‘’local_log=%(workdir)s/schedulerd.log’‘
The log file will contain information on the Shinken process and any problems the daemon encounters.
Changing the log level during runtime
shinken-admin is a command line script that can change the logging level of a running daemon.
‘’linux-server# ./shinken-admin ...’‘
10.1. FAQ - Shinken troubleshooting 311
Shinken Documentation, Release 2.4
Changing the log level in the configuration
Edit the <daemon-name>.ini file, where daemon name is pollerd, schedulerd, arbiterd, reactionnerd, receiverd. Set thelog level to: DEBUG Possible values: DEBUG,INFO,WARNING,ERROR,CRITICAL
Re-start the Shinken process.
OSError read-only filesystem error
You poller daemon and reactionner daemons are not starting and you get a traceback for an OSError in your logs.
‘’OSError [30] read-only filesystem’‘
Execute a ‘mount’ and verify if /tmp or /tmpfs is set to ‘ro’ (Read-only). As root modify your /etc/fstab to set thefilesystem to read-write.
OSError too many files open
The operating system cannot open anymore files and generates an error. Shinken opens a lot of files during runtime,this is normal. Increase the limits.
Google: changing the max number of open files linux / debian / centos / RHEL
cat /proc/sys/fs/file-max
# su - shinken $ ulimit -Hn $ ulimit -Sn
This typically changing a system wide file limit and potentially user specific file limits. (ulimit, limits.conf, sysctl,sysctl.conf, cat /proc/sys/fs/file-max)
# To immediately apply changes ulimit -n xxxxx now
Notification emails have generic-host instead of host_name
Try defining host_alias, which is often the field used by the notification methods.
Why does Shinken use both host_alias and host_name. Flexibility and historicaly as Nagios did it this way.
312 Chapter 10. Troubleshooting

CHAPTER 11
Integration With Other Software
313

Shinken Documentation, Release 2.4
11.1 Integration Overview
11.1.1 Introduction
One of the reasons that Shinken is such a popular monitoring application is the fact that it can be easily integrated intoyour existing infrastructure. There are several methods of integrating Shinken with the management software you’realready using and you can monitor almost any type of new or custom hardware, service, or application that you mighthave.
11.1.2 Integration Points
Important: This diagram is deprecated and illustrates legacy Nagios. Which has nothing to do with the new archi-tecture. eck.
To monitor new hardware, services, or applications, check out the docs on:
• Nagios Plugins
• Nagios Plugin API
• Passive Checks
• Event Handlers
It is also possible to use Shinken Poller daemon modules or Receiver daemon modules toprovide daemonized high performance acquisition. Consult the Shinken architecture to learnmore about poller modules. There are existing poller modules that can be usd as examples tofurther extend Shinken.
314 Chapter 11. Integration With Other Software

Shinken Documentation, Release 2.4
To get data into Nagios from external applications, check out the docs on:
• Passive Checks
• External Commands
To send status, performance, or notification information from Shinken to external applications, there are two typicalpaths. Through the Reactionner daemon which executes event handlers and modules or through the Broker daemon.The broker daemon provides access to all internal Shinken objects and state information. Thi data can be accessedthrough the Livestatus API. The data can also be forwarded by broker modules. Check out the docs on:
• Broker modules
• Event Handlers
• OCSP and OCHP Commands
• Performance Data
• Notifications
11.1.3 Integration Examples
I’ve documented some examples on how to integrate Shinken with external applications:
• TCP Wrappers Integration (security alerts)
• SNMP Trap Integration (Arcserve backup job status)
11.2 SNMP Trap Integration
11.2.1 Introduction
Nagios is not designed to be a replacement for a full-blown “SNMP” management application like HP OpenView orOpenNMS. However, you can set things up so that “SNMP” traps received by a host on your network can generatealerts in Nagios. Specific traps or groups of traps are associated with passive services.
As if designed to make the Gods of Hypocrisy die of laughter, “SNMP” is anything but simple. Translating “SNMP”traps and getting them into Nagios (as passive check results) can be a bit tedious. To make this task easier, I suggestyou check out Alex Burger’s “SNMP” Trap Translator project located at http://www.snmptt.org. When combined withNet-“SNMP”, SNMPTT provides an enhanced trap handling system that can be integrated with Nagios.
You are strongly suggested to eventually have a logging system, SNMP manager or Hypervisor to classify and identifynew alerts and events.
11.2. SNMP Trap Integration 315

Shinken Documentation, Release 2.4
11.3 TCP Wrappers Integration
11.3.1 Introduction
This document explains how to easily generate alerts in Shinken for connection attempts that are rejected by TCPwrappers. For example, if an unauthorized host attempts to connect to your “SSH” server, you can receive an alert inShinken that contains the name of the host that was rejected. If you implement this on your Linux/Unix boxes, you’llbe surprised how many port scans you can detect across your network.
These directions assume:
• You are already familiar with Passive Checks and how they work.
• You are already familiar with Volatile Services and how they work.
• The host which you are generating alerts for (i.e. the host you are using TCP wrappers on) is a remote host(called firestorm in this example). If you want to generate alerts on the same host that Shinken is running youwill need to make a few modifications to the examples I provide.
• You have installed the NSCA daemon on your monitoring server and the NSCA client (send_nsca) on theremote machine that you are generating TCP wrapper alerts from.
11.3.2 Defining A Service
If you haven’t done so already, create a host definition for the remote host (firestorm).
Next, define a service in one of your object configuration files for the TCP wrapper alerts on host firestorm. Theservice definition might look something like this:
define service {host_name firestormservice_description TCP Wrappersis_volatile 1active_checks_enabled 0passive_checks_enabled 1max_check_attempts 1check_command check_none...}
There are some important things to note about the above service definition:
316 Chapter 11. Integration With Other Software

Shinken Documentation, Release 2.4
• The volatile option enabled. We want this option enabled because we want a notification to be generated forevery alert that comes in.
• Active checks of the service as disabled, while passive checks are enabled. This means that the service willnever be actively checked by Shinken - all alert information will have to be received passively from an externalsource.
• The “max_check_attempts” value is set to “1”. This guarantees you will get a notification when the first alert isgenerated.
11.3.3 Configuring TCP Wrappers
Now you’re going to have to modify the /etc/hosts.deny file on firestorm. In order to have the TCP wrappers send analert to the monitoring host whenever a connection attempt is denied, you’ll have to add a line similar to the following:
ALL: ALL: RFC931: twist (/var/lib/shinken/libexec/eventhandlers/handle_tcp_wrapper %h %d)&
This line assumes that there is a script called handle_tcp_wrapper in the “/var/lib/shinken/libexec/eventhandlers/”directory on firestorm. We’ll write that script next.
11.3.4 Writing The Script
The last thing you need to do is write the handle_tcp_wrapper script on firestorm that will send the alert back to theShinken server. It might look something like this:
#!/bin/sh/var/lib/shinken/libexec/eventhandlers/submit_check_result firestorm "TCP Wrappers" 2 "Denied $2-$1" > /dev/null 2> /dev/null
Notice that the handle_tcp_wrapper script calls the submit_check_result script to actually send the alert back to themonitoring host. Assuming your Shinken server is called monitor, the submit_check_result script might look likethis:
#!/bin/sh# Arguments# $1 = name of host in service definition# $2 = name/description of service in service definition# $3 = return code# $4 = outputs
/bin/echo -e "$1\t$2\t$3\t$4\n" | /var/lib/shinken/libexec/send_nsca monitor -c /etc/shinken/send_nsca.cfg
11.3.5 Finishing Up
You’ve now configured everything you need to, so all you have to do is restart the inetd process on firestorm and restartShinken on your monitoring server. That’s it! When the TCP wrappers on firestorm deny a connection attempt, youshould be getting alerts in Shinken. The plugin output for the alert will look something like the following: “Deniedsshd2-sdn-ar-002mnminnP321.dialsprint.net”
11.3. TCP Wrappers Integration 317

Shinken Documentation, Release 2.4
11.4 Use Shinken with Thruk
11.4.1 Thruk
• Homepage: http://www.thruk.org/
• Screenshots: http://www.thruk.org/images/screenshots/screenshots.html
• Description: “Thruk is an independent multibackend monitoring webinterface which currently supports Nagios,Icinga and Shinken as backend using the Livestatus addon. It is designed to be a “dropin” replacement. Thetarget is to cover 100% of the original features plus additional enhancements for large installations.”
• License: GPL v2
• Shinken dedicated forum: http://forum.shinken-monitoring.org/forums/14-Use-with-Thruk
11.4.2 Install Thruk
See Thruk installation documentation.
Note: if you’re using SELinux, also run:
chcon -t httpd_sys_script_exec_t /usr/share/thruk/fcgid_env.shchcon -t httpd_sys_script_exec_t /usr/share/thruk/script/thruk_fastcgi.plchcon -R -t httpd_sys_content_rw_t /var/lib/thruk/chcon -R -t httpd_sys_content_rw_t /var/cache/thruk/chcon -R -t httpd_log_t /var/log/thruk/setsebool -P httpd_can_network_connect on
318 Chapter 11. Integration With Other Software

Shinken Documentation, Release 2.4
11.4.3 Using Shinken with Thruk
Thruk communicates with Shinken through the LiveStatus module. If you used the sample configuration, everythingshould be ready already. :)
You can review the configuration using the two following steps.
Enable Livestatus module
See enable Livestatus module.
Declare Shinken peer in Thruk
Edit ‘’/etc/thruk/thruk_local.conf” and declare the Shinken peer:
enable_shinken_features = 1<Component Thruk::Backend>
<peer>name = External Shinkentype = livestatus<options>
peer = 127.0.0.01:50000</options># Uncomment the following lines if you want to configure shinken through Thruk#<configtool># core_type = shinken# core_conf = /etc/shinken/shinken.cfg# obj_check_cmd = service shinken check# obj_reload_cmd = service shinken restart#</configtool>
</peer></Component>
Or use the backend wizard which starts automatically upon first installation.
Don’t forget to change the 127.0.0.1 with the IP/name of your broker if it is installed on an different host, or if you areusing a distributed architecture with multiple brokers!
Credit Shinken in the webpages title :-)
Edit ‘’/etc/thruk/thruk.conf’‘:
title_prefix = Shinken+Thruk-
Configure users
Passwords are stored in ‘’/etc/thruk/htpasswd” and may be modified using the ‘’htpasswd” command from Apache:
htpasswd /etc/thruk/htpasswd your_login
User permissions: modify ‘’templates.cfg:generic-contact’‘:
# I couldn't manage to get Thruk-level permissions to work, let's use Shinken admins privilegescan_submit_commands 0
11.4. Use Shinken with Thruk 319
Shinken Documentation, Release 2.4
and define some users as admins in the Shinken configuration:
define contact {
# ...
use generic-contactis_admin 1
# ...}
Allow Thruk to modify its configuration file:
chgrp apache /etc/thruk/cgi.cfgchmod g+w /etc/thruk/cgi.cfg
Set permissions for your users in Config Tool > User Settings > authorized_for_...
11.4.4 Using PNP4Nagios with Thruk
See PNP4Nagios. The parameters below are deprecated and are only useful if you use the old Nagios CGI UI.
11.5 Nagios CGI UI
11.5.1 Object Cache File
Format:
object_cache_file=<file_name>
Example:
object_cache_file=/var/lib/shinken/objects.cache
This directive is used to specify a file in which a cached copy of Object Configuration Overview should be stored. Thecache file is (re)created every time Shinken is (re)started.
11.5.2 Temp File
Format: temp_file=<file_name>Example: temp_file=/var/lib/shinken/nagios.tmp
This is a temporary file that Nagios periodically creates to use when updating comment data, status data, etc. The fileis deleted when it is no longer needed.
11.5.3 Temp Path
Format: temp_path=<dir_name>Example: temp_path=/tmp
This is a directory that Nagios can use as scratch space for creating temporary files used during the monitoring process.You should run tmpwatch, or a similar utility, on this directory occasionally to delete files older than 24 hours.
320 Chapter 11. Integration With Other Software

Shinken Documentation, Release 2.4
11.5.4 Status File
Format: status_file=<file_name>Example: status_file=/var/lib/shinken/status.dat
This is the file that Nagios uses to store the current status, comment, and downtime information. This file is used bythe CGIs so that current monitoring status can be reported via a web interface. The CGIs must have read access to thisfile in order to function properly. This file is deleted every time Nagios stops and recreated when it starts.
11.5.5 Status File Update Interval
Format: status_update_interval=<seconds>Example: status_update_interval=15
This setting determines how often (in seconds) that Nagios will update status data in the Status File. The minimumupdate interval is 1 second.
11.6 Thruk interface
Thruk is a web interface to get feedback about shinken status. You can also send command for asking shinken a newcheck, set a downtime on a host etc.
11.6. Thruk interface 321

Shinken Documentation, Release 2.4
11.7 Use Shinken with ...
11.7.1 Shinken interface
Administrators need a means to view status data and interact with the system.
If you install Shinken using the 10 minutes installation recommended method, you will have the Shinken WebUI in-stalled. But it is not mandatory to use it, and you may prefer another interface. There are open-source and commercialweb frontends using the Livestatus API or an SQL backend available to suit any needs.
11.7.2 Web interfaces
The choice of an interface starts with the method of data exchange: Those based on Livestatus and those based on anSQL backend.
322 Chapter 11. Integration With Other Software

Shinken Documentation, Release 2.4
The most responsive interfaces are the native WebUI and those based on Livestatus. The most scalable and flexibleare those based on Livestatus.
SkonfUI is a discovery and configuration management UI that is not production ready and is meant as a beta previewfor developers not users. Sorry.
11.7.3 Direct memory access based interface
• Shinken WebUI, included in the Shinken installation. Previews the Shinken features in an attractive package.Not meant for distributed deployments or scalability.
11.7.4 Livestatus based interfaces (Networked API)
• Thruk
11.7. Use Shinken with ... 323
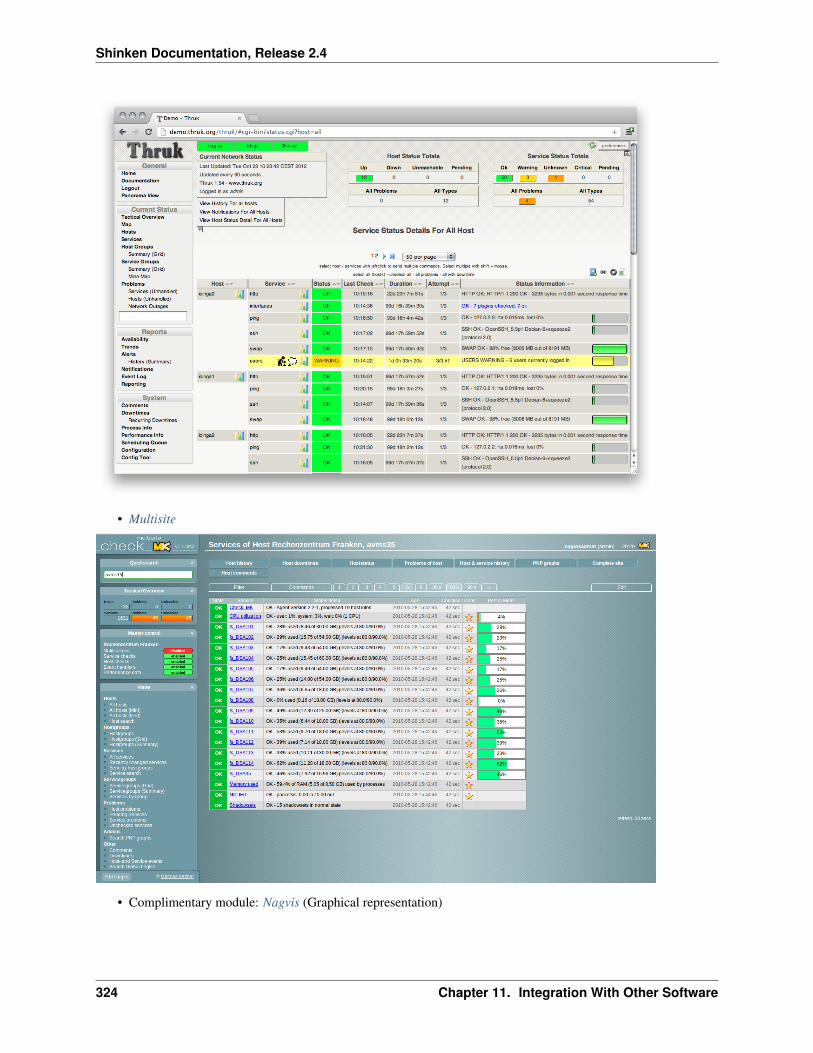
Shinken Documentation, Release 2.4
• Multisite
• Complimentary module: Nagvis (Graphical representation)
324 Chapter 11. Integration With Other Software
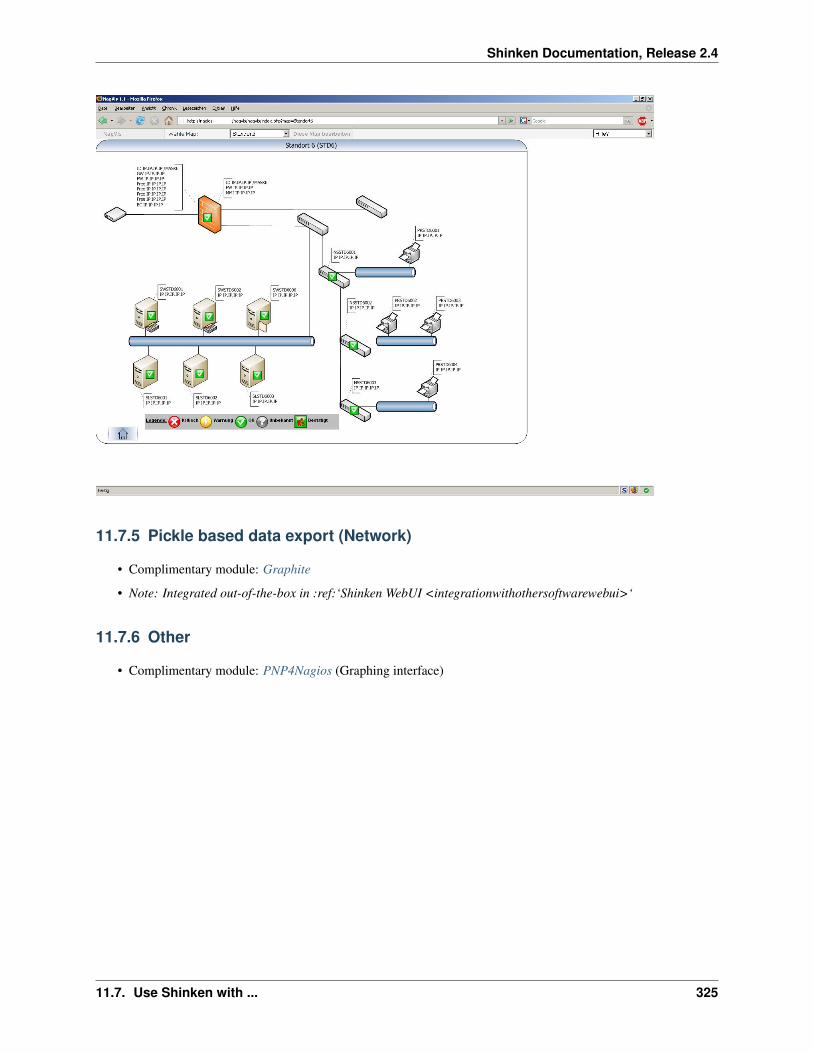
Shinken Documentation, Release 2.4
11.7.5 Pickle based data export (Network)
• Complimentary module: Graphite
• Note: Integrated out-of-the-box in :ref:‘Shinken WebUI <integrationwithothersoftwarewebui>‘
11.7.6 Other
• Complimentary module: PNP4Nagios (Graphing interface)
11.7. Use Shinken with ... 325
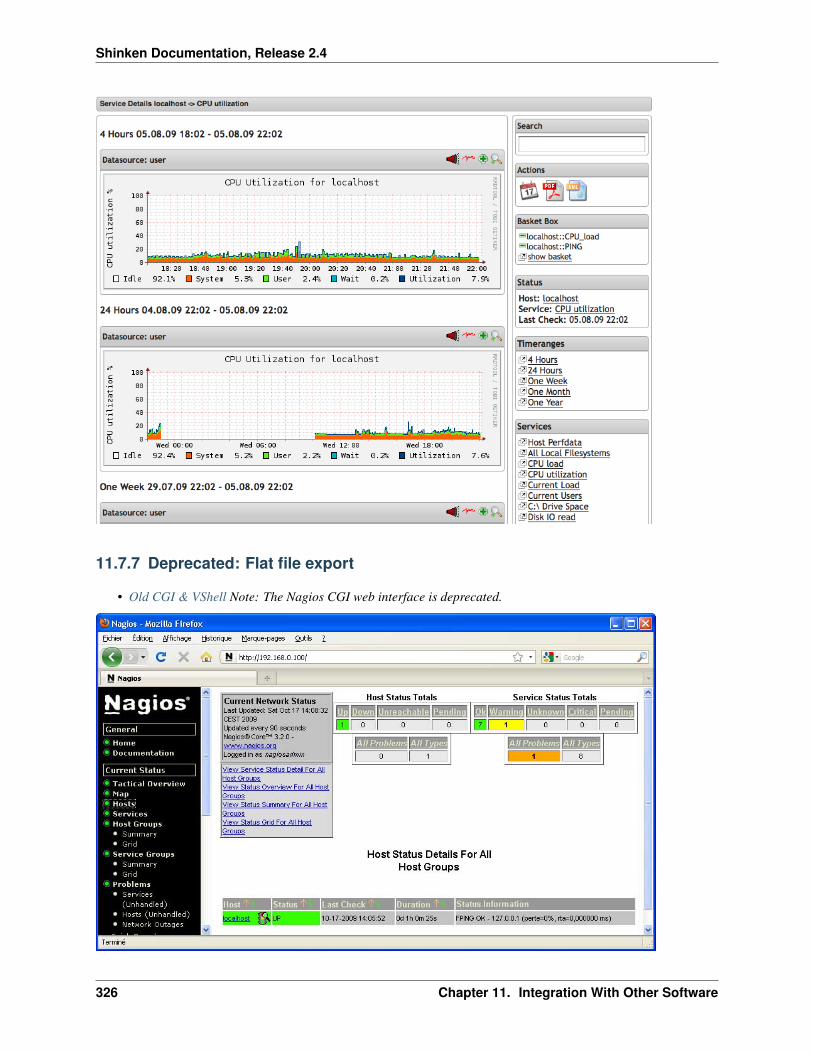
Shinken Documentation, Release 2.4
11.7.7 Deprecated: Flat file export
• Old CGI & VShell Note: The Nagios CGI web interface is deprecated.
326 Chapter 11. Integration With Other Software
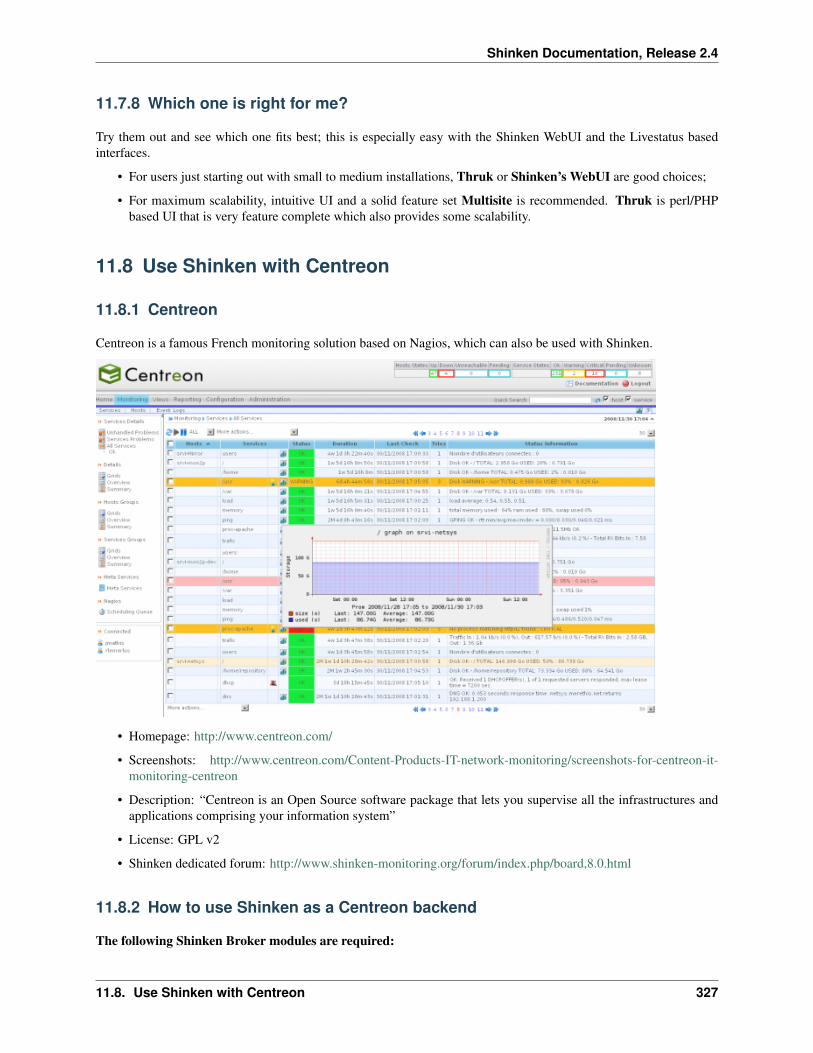
Shinken Documentation, Release 2.4
11.7.8 Which one is right for me?
Try them out and see which one fits best; this is especially easy with the Shinken WebUI and the Livestatus basedinterfaces.
• For users just starting out with small to medium installations, Thruk or Shinken’s WebUI are good choices;
• For maximum scalability, intuitive UI and a solid feature set Multisite is recommended. Thruk is perl/PHPbased UI that is very feature complete which also provides some scalability.
11.8 Use Shinken with Centreon
11.8.1 Centreon
Centreon is a famous French monitoring solution based on Nagios, which can also be used with Shinken.
• Homepage: http://www.centreon.com/
• Screenshots: http://www.centreon.com/Content-Products-IT-network-monitoring/screenshots-for-centreon-it-monitoring-centreon
• Description: “Centreon is an Open Source software package that lets you supervise all the infrastructures andapplications comprising your information system”
• License: GPL v2
• Shinken dedicated forum: http://www.shinken-monitoring.org/forum/index.php/board,8.0.html
11.8.2 How to use Shinken as a Centreon backend
The following Shinken Broker modules are required:
11.8. Use Shinken with Centreon 327

Shinken Documentation, Release 2.4
• NDO/MySQL
• Simple log
• Flat file perfdata
Below is the configuration you should set (there is already sample configuration files in your ‘’/etc/shinken/” directory)
Simple log
The module simple_log puts all Shinken’s logs (Arbiter, Scheduler, Poller, etc.) into a single file.
In ‘’/etc/shinken/modules/simple-log.cfg’‘:
define module{module_name Simple-logmodule_type simple_logpath /var/lib/shinken/shinken.logarchive_path /var/lib/shinken/archives/
}
It takes these parameters:
• module_name: name of the module called by the brokers
• module_type: simple_log
• path: path of the log file
NDO/MySQL
The module ndodb_mysql exports all data into a NDO MySQL database.
It needs the python module MySQLdb (Debian: ‘’sudo apt-get install python-mysqldb’‘, or ‘’easy_install MySQL-python’‘)
In ‘’/etc/shinken/modules/ndodb_mysql.cfg’‘:
define module{module_name ToNdodb_Mysqlmodule_type ndodb_mysqldatabase ndo ; database nameuser root ; user of the databasepassword root ; must be changedhost localhost ; host to connect tocharacter_set utf8 ;optional, default: utf8
}
It takes the following parameters:
• module_name: name of the module called by the brokers
• module_type: ndodb_mysql
• database: database name (ex ndo)
• user: database user
• password: database user passworddt
• host: database host
• character_set: utf8 is a good one
328 Chapter 11. Integration With Other Software
Shinken Documentation, Release 2.4
Service Perfdata
The module service_perfdata exports service’s perfdata to a flat file.
In ‘’/etc/shinken/modules/perfdata-service.cfg’‘:
define module{module_name Service-Perfdatamodule_type service_perfdatapath /var/lib/shinken/service-perfdata
}
It takes the following parameters:
• module_name: name of the module called by the brokers
• module_type: service_perfdata
• path: path to the service perfdata file you want
Configure Broker to use these modules
In ‘’/etc/shinken/brokers/broker-master.cfg” find the object Broker, and add the above modules to the modules line:
define broker{broker_name broker-1[...]modules Simple-log,ToNdodb_Mysql,Service-Perfdata
}
Configure Scheduler to match Centreon’s Poller
Shinken’s “Scheduler” is called a “Poller” in Centreon. If you keep the sample Scheduler name, you won’t see anydata in the Centreon interface.
So edit ‘’/etc/shinken/schedulers/scheduler-master.cfg” and change the Scheduler name to match the Centreon’s Pollername (“default”):
define scheduler{scheduler_name default[...]
}
11.9 Use Shinken with Graphite
11.9.1 Graphite
• Homepage: Graphite
• Screenshots:
• presentation: http://pivotallabs.com/talks/139-metrics-metrics-everywhere
• Description: “Graphite is an easy to use scalable time-series database and a web API that can provide raw datafor client rendering or server side rendering. It is the evolution of RRDtool.”
• License: GPL v2
11.9. Use Shinken with Graphite 329

Shinken Documentation, Release 2.4
• Shinken dedicated forum: http://www.shinken-monitoring.org/forum/index.php/board,9.0.html
• Graphite dedicated forum: https://answers.launchpad.net/graphite
11.9.2 Install graphite
The best installation guide is actually this youtube walkthrough from Jason Dixon (Obfuscurity). There is a Chefrecipe for the above demonstration.
See http://graphite.readthedocs.org/en/latest/install.html documentation tells what to install but not how to configureApache and Django.
See Installing Graphite version 0.9.8 example. Just update for version 0.9.10 it is the exact same installation steps.The vhost example also worked for me, while the wsgi examples did not for me.
Make sure you set the timezone properly in ‘’/opt/graphite/webapp/graphite/local_settings.py’‘, for instance:
TIME_ZONE = 'Europe/Paris'</code>
11.9.3 Using Shinken with Graphite
The Shinken Broker module graphite is in charge of exporting performance data from Shinken to theGraphite databases.
Configure graphite module
define module{module_name Graphite-Perfdatamodule_type graphite_perfdatahost localhostport 2003templates_path /var/lib/shinken/share/templates/graphite/
}
Additional list of options for the Graphite export module and more in-depth documentation.
Enable it
Edit ‘’/etc/shinken/brokers/broker-master.cfg” and find the Broker object, and add the graphite module to its modulesline:
define broker{broker_name broker-1
[...]modules Livestatus,Simple-log,WebUI,Graphite-Perfdata
}
Use it
With Shinken UI
Still in ‘’/etc/shinken/modules/graphite.cfg’‘, find the GRAPHITE_UI object and configure the URL to your Graphiteinstall. If you used a graphite_data_source in the Graphite-Perfdata section, make sure to specify it here as well.
330 Chapter 11. Integration With Other Software

Shinken Documentation, Release 2.4
define module {module_name GRAPHITE_UIuri http://monitoring.mysite.com/graphite/graphite_data_source shinken...
}
Then find the WebUI object, and add GRAPHITE_UI to its modules (you’ll want to replace PNP_UI):
define module {module_name WebUImodules Apache_passwd, ActiveDir_UI, Cfg_password, GRAPHITE_UI, Mongodb...
}
Restart Shinken to take the changes into account.
You have to possibility to use graphite template files. They are located in “templates_path”, (from the graphite_webuimodule) They are file containing graphite urls with shinken contextual variables. Ex :
‘’${uri}render/?width=586&height=308&target=alias(legendValue(${host}.${service}.’user’%2C%22last%22)%2C%22User%22)&target=alias(legendValue(${host}.${service}.’sys’%2C%22last%22)%2C%22Sys%22)&target=alias(legendValue(${host}.${service}.’softirq’%2C%22last%22)%2C%22SoftIRQ%22)&target=alias(legendValue(${host}.${service}.’nice’%2C%22last%22)%2C%22Nice%22)&target=alias(legendValue(${host}.${service}.’irq’%2C%22last%22)%2C%22IRQ%22)&target=alias(legendValue(${host}.${service}.’iowait’%2C%22last%22)%2C%22I%2FO%20Wait%22)&target=alias(legendValue(${host}.${service}.’idle’%2C%22last%22)%2C%22Idle%22)&fgcolor=000000&bgcolor=FFFFFF)&areaMode=stacked&yMax=100’‘
is used for check_cpu. Split this string using & as a separator to understand it. It’s quite easy. Use graphite uri api doc.
Shinken uses the templates tht matches the check_command, like pnp does.
Important: The suggested configuration below is not final and has just been created, the documentation needs to beupdated for the correct usage of the .graph templates used in WebUI. There are a number of the already created, seethe existing packs to learn how to use them properly. Sorry for the inconvenience.
with Thruk
Thruk offers a proper integration with PNP, but not with Graphite. Still, you can use graphite with Thruk. Simply usethe action_url for your service/host to link toward the graphite url you want. Use HOSTNAME and SERVICEDESCmacros. The action_url icon will be a link to the graph in Thruk UI. For ex :
‘’ http://MYGRAPHITE/render/?lineMode=connected&width=586&height=308&_salt=1355923874.899&target=cactiStyle($HOSTNAME$.$SERVICEDESC$.*)&xFormat=%25H%3A%25M&tz=Europe/Paris&bgcolor=DDDDDD&fgcolor=111111&majorGridLineColor=black&minorGridLineColor=grey‘’
is what I use in my Thruk.
A change has been pushed in thruk’s github to grant Thruk the features it has for pnp to graphite. The rule above (useaction_url) still applies. Graphite will be displayed when the action_url contains the keyword “render”.
Important: The graphite template files feature is not used in Thruk. It is a “shinken UI only” feature.
Enjoy it
Restart shinken-arbiter and you are done.
/etc/init.d/shinken-arbiter restart</code>
11.9. Use Shinken with Graphite 331

Shinken Documentation, Release 2.4
11.10 Use Shinken with Multisite
11.10.1 Check_MK Multisite
• Homepage: http://mathias-kettner.de/check_mk.html
• Screenshots: http://mathias-kettner.de/check_mk_multisite_screenshots.html
• Description: “A new general purpose Nagios-plugin for retrieving data.”
• License: GPL v2
• Shinken dedicated forum: http://forum.shinken-monitoring.org/forums/17-Use-with-Multisite
11.10.2 Using Shinken with Multisite
Multisite communicates with Shinken through the LiveStatus module. If you used the sample configuration, everythingshould be ready already. :)
You can review the configuration using the following steps.
Enable Livestatus module
See enable Livestatus module.
Configure Multisite
Latest versions of Multisite are included into Check_MK, which must be fully installed although we will only use theweb interface.
To install and configure Multisite manually, follow instructions at MK website.
332 Chapter 11. Integration With Other Software
Shinken Documentation, Release 2.4
Best choice is to use Shinken :ref:‘install script <gettingstarted/installations/shinken-installation#method_1the_easy_way>‘ (In Shinken versions >1.0). With addons installation option (‘’./install-a multisite’‘) it is fast and easy to install and configure it as Multisite’s default site.
Warning: If you get some error installing Multisite related with unknown paths (“can not find Multi-site_versionXXX”) perhaps you must edit ‘’init.d/shinken.conf” file and adjust MKVER variable (search for “ex-port MKVER”) with current stable available version of Check_MK as stated on MK website.
Check_MK install quick guide
• Install check_mk: Detailed instructions there. Shell driven install with a lot of questions related with Check_mkinstall paths and integration with Apache and existing “Nagios”. For Shinken some default answers must bechanged to accommodate Shinken install.
• Edit config file ‘’multisite.mk’‘, usually in ‘’/etc/check_mk’‘, to insert a new site pointing to Shinken andwrite Livestatus socket address as declared at Shinken’s Livestatus module. Socket may also be an unix socket(“unix:/some/other/path”).
• Restart Apache.
‘’/etc/check_mk/multisite.mk’‘:
sites = {"munich": {
"alias": "Munich"},"Shinken": {
"alias": "Shinken","socket": "tcp:127.0.0.1:50000","url_prefix": "http://shinken.fqdn/",
},}
Note: Replace “shinken.fqdn” with the complete URI to reach Shinken host from browser (not 127.0.0.1!). Used byPNP4Nagios’s mouse-over images.
If you plan to use Multisite only as web UI no more configuration is needed. Also you can disable WATO (WebAdministration TOol) by including the line wato_enabled = False in ‘’multisite.mk’‘.
11.10. Use Shinken with Multisite 333
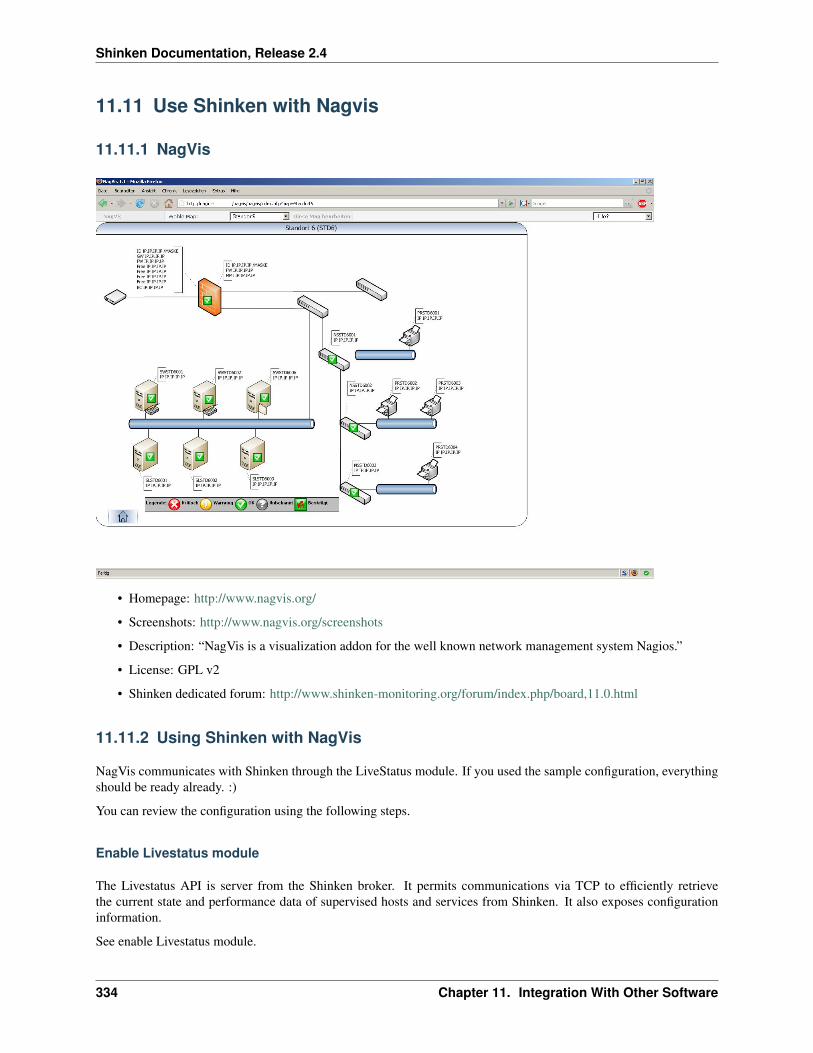
Shinken Documentation, Release 2.4
11.11 Use Shinken with Nagvis
11.11.1 NagVis
• Homepage: http://www.nagvis.org/
• Screenshots: http://www.nagvis.org/screenshots
• Description: “NagVis is a visualization addon for the well known network management system Nagios.”
• License: GPL v2
• Shinken dedicated forum: http://www.shinken-monitoring.org/forum/index.php/board,11.0.html
11.11.2 Using Shinken with NagVis
NagVis communicates with Shinken through the LiveStatus module. If you used the sample configuration, everythingshould be ready already. :)
You can review the configuration using the following steps.
Enable Livestatus module
The Livestatus API is server from the Shinken broker. It permits communications via TCP to efficiently retrievethe current state and performance data of supervised hosts and services from Shinken. It also exposes configurationinformation.
See enable Livestatus module.
334 Chapter 11. Integration With Other Software

Shinken Documentation, Release 2.4
Nagvis Installation
Download the software and follow the installation guide from http://www.nagvis.org/
NagVis configuration
Nagvis needs to know where the Shinken Livestatus API is hosted.
In NagVis configuration file ‘’/etc/nagvis/nagvis.ini.php’‘:
[backend_live_1]backendtype="mklivestatus"htmlcgi="/nagios/cgi-bin"socket="tcp:localhost:50000"
Important: If you are using a non local broker (or a distributed Shinken architecture with multiple brokers) youshould change localhost to the IP/Servername/FQDN of your broker!
11.12 Use Shinken with Old CGI and VShell
11.12.1 For the Old CGI & VShell
The Old CGI and VShell uses the old flat file export. Shinken can export to this file, but beware: this method is veryvery slooooow!
Warning: You should migrate to a Livestatus enabled web interface.
11.12.2 Declare the status_dat module
Export all status into a flat file in the old Nagios format. It’s for small/medium environment because it’s very slow toparse. It can be used by the Nagios CGI. It also exports the objects.cache file for this interface.
Edit your /etc/shinken/modules/status-dat.cfg file:
define module{
module_name Status-Datmodule_type status_datstatus_file /var/lib/shinken/status.dataobject_cache_file /var/lib/shinken/objects.cachestatus_update_interval 15 ; update status.dat every 15s
}
11.12.3 Enable it
Edit your /etc/shinken/brokers/broker-master.cfg file and find the object Broker:
define broker{broker_name broker-1
[...]
11.12. Use Shinken with Old CGI and VShell 335

Shinken Documentation, Release 2.4
modules Simple-log,Status-Dat}
11.13 Use Shinken with PNP4Nagios
11.13.1 PNP4Nagios
• Homepage: http://docs.pnp4nagios.org/pnp-0.6/start
• Screenshots: http://docs.pnp4nagios.org/pnp-0.6/gallery/start
• Description: “PNP is an addon to Nagios which analyzes performance data provided by plugins and stores themautomatically into RRD-databases (Round Robin Databases, see RRD Tool).”
• License: GPL v2
• Shinken dedicated forum: http://www.shinken-monitoring.org/forum/index.php/board,9.0.html
11.13.2 Install PNP4Nagios
See PHP4Nagios installation documentation.
In a nutshell:
336 Chapter 11. Integration With Other Software

Shinken Documentation, Release 2.4
./configure --with-nagios-user=shinken --with-nagios-group=shinkenmake allmake fullinstall
Don’t forget to make PNP4Nagios’ npcd daemon to start at boot, and launch it:
chkconfig --add npcd # On RedHat-likeupdate-rc.d npcd defaults # On Debian-like/etc/init.d/npcd start
Configure npcdmod
The module npcdmod is in charge to export performance data from Shinken to PNP.
define module{module_name NPCDMODmodule_type npcdmodconfig_file <PATH_TO_NPCD.CFG>
}
Don’t forget to replace “<PATH_TO_NPCD.CFG>” with your own value; By default something like‘’/usr/local/pnp4nagios/etc/npcd.cfg’‘.
11.13.3 Enable it
Edit ‘’/etc/shinken/brokers/broker-master.cfg” and find the object Broker to add above defined “NPCDMOD” to itsmodules line:
define broker{broker_name broker-1[...]modules Simple-log,NPCDMOD
}
Edit ‘’/etc/shinken/modules/webui.cfg” and find the object WebUI to add above defined “PNP_UI” to its modulesline:
define broker{module_name WebUI[...]modules Apache_passwd,ActiveDir_UI,Cfg_password,PNP_UI
}
Then restart broker :
# /etc/init.d/shinken-broker restart
11.13.4 Share users with Thruk
Edit /etc/httpd/conf.d/pnp4nagios.conf (RedHat path) and replace AuthName and AuthUserFile with:
AuthName "Thruk Monitoring"AuthUserFile /etc/thruk/htpasswd
Then restart Apache:
11.13. Use Shinken with PNP4Nagios 337

Shinken Documentation, Release 2.4
service httpd restart
11.13.5 Set the action_url option
In order to get the graphs displayed in Thruk, you need to set the action_url option in host and service definitions, andit must include the string “/pnp4nagios/” (Thruk doc).
If you want the link and the graph for all hosts and services, you could set the option directly in the default templates,in ‘’templates.cfg’‘:
define host{name generic-host[...]process_perf_data 1[...]#action_url http://<PNP4NAGIOS_HOST>/pnp4nagios/graph?host=$HOSTNAME$# If not an absolute URI, it must be relative to /cgi-bin/thruk/, not /thruk/!action_url ../../pnp4nagios/graph?host=$HOSTNAME$[...]
define service{name generic-service[...]process_perf_data 1[...]#action_url http://<PNP4NAGIOS_HOST>/pnp4nagios/graph?host=$HOSTNAME$&srv=$SERVICEDESC$# If not an absolute URI, it must be relative to /cgi-bin/thruk/, not /thruk/!action_url ../../pnp4nagios/graph?host=$HOSTNAME$&srv=$SERVICEDESC$
Don’t forget to replace “<PNP4NAGIOS_HOST>” with the server IP/name running PNP4Nagios (Don’t replace$HOSTNAME$ and $SERVICEDESC$!)
Make sure to also have process_perf_data set to 1 for both hosts and services.
11.13.6 Link back to Thruk
Ask PNP4Nagios to link to ‘’/thruk/cgi-bin” rather than ‘’/nagios/cgi-bin’‘:
sed -i -e 's,/nagios/cgi-bin,/thruk/cgi-bin,' /opt/pnp4nagios/etc/config_local.php
11.13.7 Enjoy it
Restart shinken-arbiter and you are done.
/etc/init.d/shinken-arbiter restart
11.14 Use Shinken with WebUI
11.14.1 Shinken WebUI
Shinken includes a self sufficient Web User Interface, which includes its own web server (No need to setup Apacheor Microsoft IIS) Shinken WebUI is started at the same time Shinken itself does, and is configured using the mainShinken configuration file by setting a few basic parameters.
338 Chapter 11. Integration With Other Software
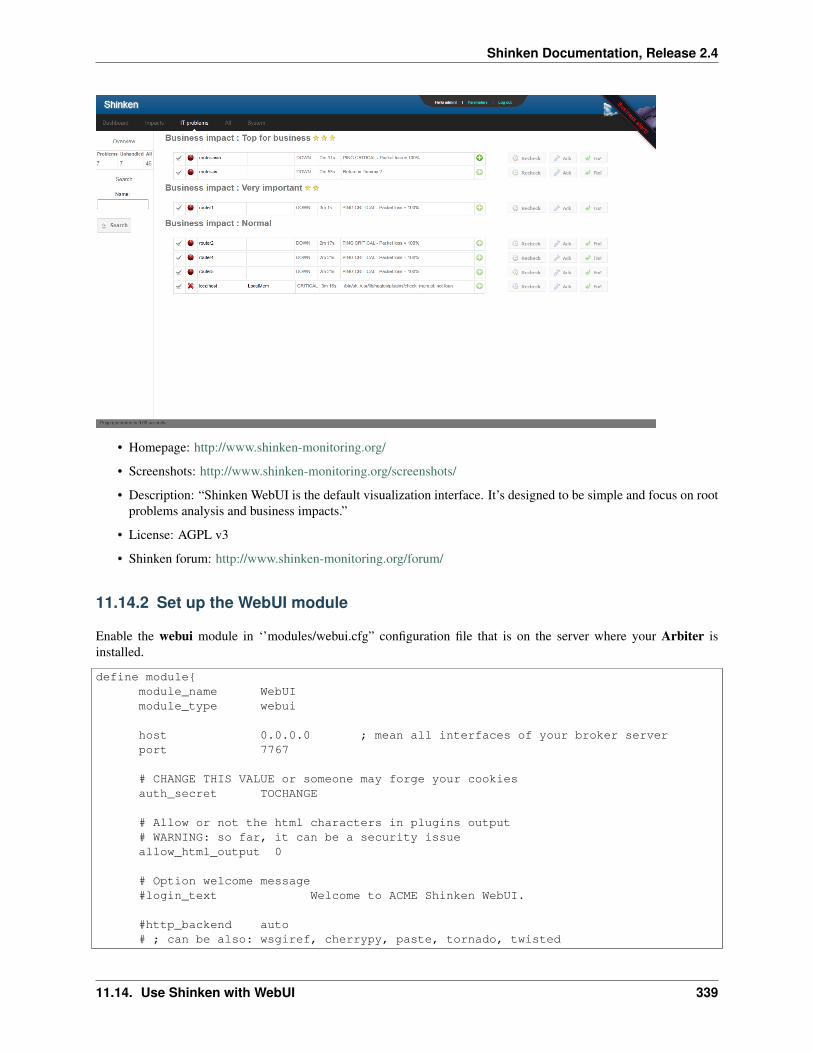
Shinken Documentation, Release 2.4
• Homepage: http://www.shinken-monitoring.org/
• Screenshots: http://www.shinken-monitoring.org/screenshots/
• Description: “Shinken WebUI is the default visualization interface. It’s designed to be simple and focus on rootproblems analysis and business impacts.”
• License: AGPL v3
• Shinken forum: http://www.shinken-monitoring.org/forum/
11.14.2 Set up the WebUI module
Enable the webui module in ‘’modules/webui.cfg” configuration file that is on the server where your Arbiter isinstalled.
define module{module_name WebUImodule_type webui
host 0.0.0.0 ; mean all interfaces of your broker serverport 7767
# CHANGE THIS VALUE or someone may forge your cookiesauth_secret TOCHANGE
# Allow or not the html characters in plugins output# WARNING: so far, it can be a security issueallow_html_output 0
# Option welcome message#login_text Welcome to ACME Shinken WebUI.
#http_backend auto# ; can be also: wsgiref, cherrypy, paste, tornado, twisted
11.14. Use Shinken with WebUI 339

Shinken Documentation, Release 2.4
# ; or gevent. auto means best match in the system.modules Apache_passwd,ActiveDir_UI,Cfg_password,Mongodb
# Modules available for the WebUI:## Note: Choose one or more authentication methods.## Apache_passwd: use an Apache htpasswd files for auth# ActiveDir_UI: use AD for auth and photo collect# Cfg_password: use passwords in contacts configuration for authentication## PNP_UI: Use PNP graphs in the UI# GRAPHITE_UI: Use graphs from Graphite## Mongodb: Necessary for enabling user preferences in WebUI
}
Important: Have you changed the auth_secret parameter already? No? Do it now!
Important: Also add the webui to the modules in the broker config in brokers/broker-master.cfg.
Note: The web-server handling HTTP Request to the WebUI is a Python process. You do not need any web-server(like Apache) to run the WebUI.
11.14.3 Authentification modules
The WebUI use modules to lookup your user password and allow to authenticate or not.
By default it is using the cfg_password_webui module, which will look into your contact definition for the passwordparameter.
Tip: You need to declare these modules in the modules property of WebUI.
Shinken contact - cfg_password_webui
The simpliest is to use the users added as Shinken contacts.
define module{module_name Cfg_passwordmodule_type cfg_password_webui
}
Apache htpasswd - passwd_webui
This module uses an Apache passwd file (htpasswd) as authentification backend. All it needs is the full path of the file(from a legacy Nagios CGI installation, for example).
define module{module_name Apache_passwdmodule_type passwd_webui
340 Chapter 11. Integration With Other Software
Shinken Documentation, Release 2.4
# WARNING: put the full PATH for this value!passwd /etc/shinken/htpasswd.users
}
Check the owner (must be Shinken user) and mode (must be readable) of this file.
If you don’t have such a file you can generate one with the “htpasswd” command (in Debian’s “apache2-utils” pack-age), or from websites like htaccessTools.
Important: To be able to log into the WebUI, users also have to be Shinken contacts! So adding an user in this filewithout adding it in the contacts will have no effect.
Active Directory / OpenLDAP - ad_webui
This module allows to lookup passwords into both Active Directory or OpenLDAP entries.
define module {module_name ActiveDir_UImodule_type ad_webuildap_uri ldaps://adserverusername userpassword passwordbasedn DC=google,DC=com
# For mode you can switch between ad (active dir)# and openldapmode ad
}
Change “adserver” by your own dc server, and set the “user/password” to an account with read access on the basednfor searching the user entries.
Change “mode” from “ad” to “openldap” to make the module ready to authenticate against an OpenLDAP directoryservice.
You could also find module sample in the modules directory.
User photos
In the WebUI users can see each others photos.
At this point only the “ad_webui” module allows to import and display photos in the WebUI. There is no configuration:if you add the “ad_webui” module it will import contact photos automatically.
11.14.4 User preferences modules
The WebUI use mongodb to store all user preferences, dashboards and other information.
To enable user preferences do the following:
• install mongodb
• add “Mongodb” to your WebUI module list as done in the example at the top of this page
11.14. Use Shinken with WebUI 341
Shinken Documentation, Release 2.4
11.14.5 Metrology graph modules
You can link the WebUI so it will present graphs from other tools, like PNP4Nagios or Graphite. All you need is todeclare such modules (there are already samples in the default configuration) and add them in the WebUI modulesdefinition.
PNP graphs
You can ask for a PNP integration with a pnp_webui module. Here is its definition:
# Use PNP graphs in the WebUIdefine module{
module_name PNP_UImodule_type pnp_webuiuri http://YOURSERVERNAME/pnp4nagios/ ; put the real PNP uri here. YOURSERVERNAME must be changed
; to the hostname of the PNP server}
Shinken will automatically replace YOURSERVERNAME with the broker hostname at runtime to try and make itwork for you, but you MUST change it to the appropriate value.
Graphite graphs
You can ask for Graphite graphs with the graphite_ui definition.
define module{module_name GRAPHITE_UImodule_type graphite_webuiuri http://YOURSERVERNAME/ ; put the real GRAPHITE uri here. YOURSERVERNAME must be changed
; to the hostname of the GRAPHITE server}
Shinken will automatically replace YOURSERVERNAME with the broker hostname at runtime to try and make itwork for you, but you MUST change it to the appropriate value.
11.14.6 Use it!
The next step is very easy: just access the WebUI URI (something like %%http://127.0.0.1:7767/%%) on log in withthe user/password set during the previous part! The default username and password is admin/admin
342 Chapter 11. Integration With Other Software

CHAPTER 12
Security and Performance Tuning
343

Shinken Documentation, Release 2.4
12.1 Security Considerations
12.1.1 Introduction
This is intended to be a brief overview of some things you should keep in mind when installing Shinken, so as set itup in a secure manner.
Your monitoring box should be viewed as a backdoor into your other systems. In many cases, the Shinken server mightbe allowed access through firewalls in order to monitor remote servers. In most all cases, it is allowed to query thoseremote servers for various information. Monitoring servers are always given a certain level of trust in order to queryremote systems. This presents a potential attacker with an attractive backdoor to your systems. An attacker might havean easier time getting into your other systems if they compromise the monitoring server first. This is particularly trueif you are making use of shared “SSH” keys in order to monitor remote systems.
If an intruder has the ability to submit check results or external commands to the Shinken daemon, they have thepotential to submit bogus monitoring data, drive you nuts you with bogus notifications, or cause event handler scriptsto be triggered. If you have event handler scripts that restart services, cycle power, etc. this could be particularlyproblematic.
Another area of concern is the ability for intruders to sniff monitoring data (status information) as it comes acrossthe wire. If communication channels are not encrypted, attackers can gain valuable information by watching yourmonitoring information. Take as an example the following situation: An attacker captures monitoring data on the wireover a period of time and analyzes the typical CPU and disk load usage of your systems, along with the number ofusers that are typically logged into them. The attacker is then able to determine the best time to compromise a systemand use its resources (CPU, etc.) without being noticed.
Here are some tips to help ensure that you keep your systems secure when implementing a Shinken-based monitoringsolution...
12.1.2 Best Practices
Use a Dedicated Monitoring Box I would recommend that you install Shinken on a server that is dedicated to mon-itoring (and possibly other admin tasks). Protect your monitoring server as if it were one of the most importantservers on your network. Keep running services to a minimum and lock down access to it via TCP wrappers,firewalls, etc. Since the Shinken server is allowed to talk to your servers and may be able to poke through yourfirewalls, allowing users access to your monitoring server can be a security risk. Remember, its always easier togain root access through a system security hole if you have a local account on a box.
344 Chapter 12. Security and Performance Tuning

Shinken Documentation, Release 2.4
Don’t Run Shinken As Root Shinken doesn’t need to run as root, so don’t do it. You can tell Shinken to dropprivileges after startup and run as another user/group by using the Shinken_user and Shinken_group directivesin the main config file. If you need to execute event handlers or plugins which require root access, you mightwant to try using sudo.
Lock Down The Check Result Directory Make sure that only the Shinken user is able to read/write in the check re-sult path. If users other than Shinken (or root) are able to write to this directory, they could send fake host/servicecheck results to the Shinken daemon. This could result in annoyances (bogus notifications) or security problems(event handlers being kicked off).
Lock Down The External Command File If you enable External Commands external commands, make sure youset proper permissions on the “/usr/local/Shinken/var/rw directory”. You only want the Shinken user (usuallyShinken) and the web server user (usually nobody, httpd, apache2, or www-data) to have permissions to write tothe command file. If you’ve installed Shinken on a machine that is dedicated to monitoring and admin tasks andis not used for public accounts, that should be fine. If you’ve installed it on a public or multi-user machine (notrecommended), allowing the web server user to have write access to the command file can be a security problem.After all, you don’t want just any user on your system controlling Shinken through the external command file.In this case, I would suggest only granting write access on the command file to the Shinken user and usingsomething like CGIWrap to run the CGIs as the Shinken user instead of nobody.
Use Full Paths In Command Definitions When you define commands, make sure you specify the full path (not arelative one) to any scripts or binaries you’re executing.
Hide Sensitive Information With “$USERn$” Macros The CGIs read the Main Configuration File Options mainconfig file and Object Configuration Overview Object config file(s), so you don’t want to keep any sensitiveinformation (usernames, passwords, etc) in there. If you need to specify a username and/or password in a com-mand definition use a “$USERn$” Understanding Macros and How They Work macro to hide it. “$USERn$”
12.1. Security Considerations 345

Shinken Documentation, Release 2.4
macros are defined in one or more resource files. The CGIs will not attempt to read the contents of resourcefiles, so you can set more restrictive permissions (600 or 660) on them. See the sample “resource.cfg” file in thebase of the Shinken distribution for an example of how to define $USERn$ macros.
Strip Dangerous Characters From Macros Use the illegal_macro_output_chars directive to strip dangerous char-acters from the “$HOSTOUTPUT$”, “$SERVICEOUTPUT$”, “$HOSTPERFDATA$”, and “$SERVI-CEPERFDATA$” macros before they’re used in notifications, etc. Dangerous characters can be anything thatmight be interpreted by the shell, thereby opening a security hole. An example of this is the presence of backtick(‘) characters in the “$HOSTOUTPUT$”, “$SERVICEOUTPUT$”, “$HOSTPERFDATA$”, and/or “$SERVI-CEPERFDATA$” macros, which could allow an attacker to execute an arbitrary command as the Shinken user(one good reason not to run Shinken as the root user).
Secure Access to Remote Agents Make sure you lock down access to agents (NRPE, NSClient, “SNMP”, etc.) onremote systems using firewalls, access lists, etc. You don’t want everyone to be able to query your systems forstatus information. This information could be used by an attacker to execute remote event handler scripts or todetermine the best times to go unnoticed.
Secure Communication Channels Make sure you encrypt communication channels between different Shinken in-stallations and between your Shinken servers and your monitoring agents whenever possible. You don’t wantsomeone to be able to sniff status information going across your network. This information could be used by anattacker to determine the best times to go unnoticed.
346 Chapter 12. Security and Performance Tuning
Shinken Documentation, Release 2.4
12.2 Tuning Shinken For Maximum Performance
12.2.1 Introduction
So you’ve finally got Shinken up and running and you want to know how you can tweak it a bit. Tuning Shinken toincrease performance can be necessary when you start monitoring a large number (> 10,000) of hosts and services.Here are the common optimization paths.
12.2.2 Designing your installation for scalability
Planning a large scale Shinken deployments starts before installing Shinken and monitoring agents.
Scaling Shinken for large deployments
12.2.3 Optimization Tips:
Graph your shinken server performance In order to keep track of how well your installation handles load over timeand how your configuration changes affect it, you should be graphing several important statistics. This is really,really, really useful when it comes to tuning the performance of an installation. Really. Information on how todo this can be found Graphing Performance Info With MRTG here.
Check service latencies to determine best value for maximum concurrent checks Nagios can restrict the numberof maximum concurrently executing service checks to the value you specify with the max_concurrent_checksoption. This is good because it gives you some control over how much load Nagios will impose on yourmonitoring host, but it can also slow things down. If you are seeing high latency values (> 10 or 15 seconds) forthe majority of your service checks. That’s not Shinken’s fault _ its yours. Under ideal conditions, all servicechecks would have a latency of 0, meaning they were executed at the exact time that they were scheduled tobe executed. However, it is normal for some checks to have small latency values. I would recommend takingthe minimum number of maximum concurrent checks reported when running Shinken with the _s commandline argument and doubling it. Keep increasing it until the average check latency for your services is fairly low.More information on service check scheduling can be found Service and Host Check Scheduling here.
Use passive checks when possible The overhead needed to process the results of passive checks is much lower thanthat of “normal” active checks, so make use of that piece of info if you’re monitoring a slew of services. Itshould be noted that passive service checks are only really useful if you have some external application doingsome type of monitoring or reporting, so if you’re having Nagios do all the work, this won’t help things.
Avoid using interpreted plugins One thing that will significantly reduce the load on your monitoring host is the useof compiled (C/C++, etc.) plugins rather than interpreted script (Perl, etc) plugins. While Perl scripts andsuch are easy to write and work well, the fact that they are compiled/interpreted at every execution instancecan significantly increase the load on your monitoring host if you have a lot of service checks. If you want touse Perl plugins, consider compiling them into true executables using perlcc(1) (a utility which is part of thestandard Perl distribution).
Optimize host check commands If you’re checking host states using the check_ping plugin you’ll find that hostchecks will be performed much faster if you break up the checks. Instead of specifying a max_attempts valueof 1 in the host definition and having the check_ping plugin send 10 “ICMP” packets to the host, it would bemuch faster to set the max_attempts value to 10 and only send out 1 “ICMP” packet each time. This is due tothe fact that Nagios can often determine the status of a host after executing the plugin once, so you want to makethe first check as fast as possible. This method does have its pitfalls in some situations (i.e. hosts that are slowto respond may be assumed to be down), but you’ll see faster host checks if you use it. Another option wouldbe to use a faster plugin (i.e. check_fping) as the host_check_command instead of check_ping.
12.2. Tuning Shinken For Maximum Performance 347

Shinken Documentation, Release 2.4
Don’t use aggressive host checking Unless you’re having problems with Shinken recognizing host recoveries, Iwould recommend not enabling the use_aggressive_host_checking option. With this option turned off hostchecks will execute much faster, resulting in speedier processing of service check results. However, host recov-eries can be missed under certain circumstances when this it turned off. For example, if a host recovers and allof the services associated with that host stay in non-OK states (and don’t “wobble” between different non-OKstates), Shinken may miss the fact that the host has recovered. A few people may need to enable this option, butthe majority don’t and I would recommendnot using it unless you find it necessary.
Optimize hardware for maximum performance Hardware performance shouldn’t be an issue unless:
• you’re monitoring thousands of services
• you are writing to a metric database such as RRDtool or Graphite. Disk access will be a very importantfactor.
• you’re doing a lot of post-processing of performance data, etc. Your system configuration and your hard-ware setup are going to directly affect how your operating system performs, so they’ll affect how Shinkenperforms. The most common hardware optimization you can make is with your hard drives, RAID, do notupdate attributes for access-time/write-time.
Shinken needs quite a bit of memory which is pre-allocated by the Python processes.
Move your Graphite metric databases to dedicated servers Use multiple carbon-relay and carbon-cache daemonsto split the load on a single server.
12.3 Scaling a Shinken installation
12.3.1 Introduction
Shinken is designed to scale horizontally, but carefully planning your deployment will improve chances of success.
12.3.2 Scalability guide
Learn how to prepare by reading the main scalability guide for large Shinken installations
12.4 Shinken performance statistics
12.4.1 Introduction
Shinken provides some statistics in the log files on the health of the Shinken services. These are not currently availablein the check_shinken check script. Support is planned in a future release. This will permit graphical review thatShinken :
• Operates efficiently
• Locate problem areas in the monitoring process
• Observe the performance impacts of changes in your Shinken configuration
Shinken internal metrics are collected in the poller log and scheduler logs when debug log level is enabled.
348 Chapter 12. Security and Performance Tuning

Shinken Documentation, Release 2.4
12.5 Graphing Performance Info With MRTG and nagiostats
Some basic info can be found on http://nagios.sourceforge.net/docs/3_0/mrtggraphs.html
12.5. Graphing Performance Info With MRTG and nagiostats 349

Shinken Documentation, Release 2.4
350 Chapter 12. Security and Performance Tuning

CHAPTER 13
How to monitor ...
351
Shinken Documentation, Release 2.4
13.1 Monitoring Active Directory
Abstract
This document describes how you can monitor domain controller. This monitoring covers typically:
• Domain replication
• etc...
13.1.1 Introduction
These instructions assume that you’ve installed Shinken according to the Installation tutorial. The sample configura-tion entries below reference objects that are defined in the sample config files (“commands.cfg”, “templates.cfg”, etc.)that was installed if you followed the quickstart.
13.1.2 Overview
Monitoring a domain controller is possible in an agentless way by polling via the network using the WMI protocol,like we proposed in the windows template.
13.1.3 Prerequisites
Have a valid account on the Microsoft Windows device (local or domain account) you will monitor using WMI queriesand already get the windows server monitor with the windows template.
13.1.4 Steps
There are several steps you’ll need to follow in order to monitor a Microsoft Exchange server.
• Add the good domain controller template to your windows host in the configuration
• Restart the Shinken Arbiter
13.1.5 What’s Already Been Done For You
To make your life a bit easier, configuration templates are provided as a starting point:
• A selection of check_ad_replication based commands definitions have been added to the “commands.cfg” file.This allows you to use the check_wmi_plus plugin.
• Some Exchange host templates are included the “templates.cfg” file. This allows you to add new host definitionsin a simple manner.
The above-mentioned config files can be found in the ///etc/shinken/packs/microsoft/dc// directory. You can modifythe definitions in these and other templates to suit your needs. However, wait until you’re more familiar with Shinkenbefore doing so. For the time being, just follow the directions outlined below and you’ll be monitoring your devicesin no time.
352 Chapter 13. How to monitor ...

Shinken Documentation, Release 2.4
13.1.6 Setup the check_wmi_plus plugin
If you already follow the windows monitoring tutorial, you should already got the check_wmi_plus plugin. If it’s notdone, please do it first.
13.1.7 Declare your host in Shinken
The domain controller template name is dc. All you need is to add it on your windws host.
Now it’s time to define some object definitions in your Shinken configuration files in order to monitor the new Windowsmachine.
We will suppose here that your server is named srv-win-1. Of course change this name with the real name of yourserver.
Find your host definition and edit it:
Under Linux:
linux:~ # vi /etc/shinken/hosts/srv-win-1.cfg
Or Windows:
c:\ wordpad c:\shinken\etc\hosts\srv-win-1.cfg
All you need it to add the good template for your host. For example for a Hub Transport server:
define host{use dc,windowshost_name srv-win-1address srv-win-1.mydomain.com
}
* The use dc is the "template" line. It mean that this host will **inherits** properties from this template.
* the host_name is the object name of your host. It must be **unique**.
* the address is ... the network address of your host :)
What is checked with a domain controller template?
At this point, you configure your host to be checked with a dc and windows templates. What does it means? In additionto the windows classic checks, it means that you got some checks already configured for you:
• Domain replication
13.1.8 Restarting Shinken
You’re done with modifying the Shinken configuration, so you’ll need to verify your configuration files and restartShinken.
If the verification process produces any errors messages, fix your configuration file before continuing. Make sure thatyou don’t (re)start Shinken until the verification process completes without any errors!
13.1. Monitoring Active Directory 353

Shinken Documentation, Release 2.4
13.2 Monitoring Asterisk servers
Abstract
This document describes how you can monitor an Asterisk server. This monitoring covers typically:
• overall state
13.2.1 Introduction
These instructions assume that you’ve installed Shinken according to the Installation tutorial. The sample configura-tion entries below reference objects that are defined in the sample config files (“commands.cfg”, “templates.cfg”, etc.)that was installed if you followed the quickstart.
13.2.2 Overview
Monitoring an asterisk server is possible with the check_sip plugin and an account on the Asterisk server.
13.2.3 Prerequisites
Have a valid account on the Asterisk device.
13.2.4 Steps
There are several steps you’ll need to follow:
• Setup the check_sip plugin
• Add the good asterisk template to your host in the configuration
• Restart the Shinken Arbiter
13.2.5 What’s Already Been Done For You
To make your life a bit easier, configuration templates are provided as a starting point:
• A selection of check_sip based commands definitions have been added to the “commands.cfg” file.
• An Asterisk host template is included the “templates.cfg” file. This allows you to add new host definitions in asimple manner.
The above-mentioned config files can be found in the ///etc/shinken/packs/network/services/asterisk// directory. Youcan modify the definitions in these and other templates to suit your needs. However, wait until you’re more familiarwith Shinken before doing so. For the time being, just follow the directions outlined below and you’ll be monitoringyour devices in no time.
13.2.6 Setup the check_sip plugin
As the shinken account in your shinken server run:
354 Chapter 13. How to monitor ...

Shinken Documentation, Release 2.4
wget "http://www.bashton.com/downloads/nagios-check_sip-1.3.tar.gz"tar xvfz nagios-check_sip-1.3.tar.gzcd nagios-check_sip-1.3/cp check_sip /var/lib/shinken/libexecchmod a+x /var/lib/nagios/plugins/check_sip
13.2.7 Add the SIP user credentials
In the file /etc/shinken/packs/network/services/asterisk/macros you can edit the SIPUSER that you want ot use for theconnection.
13.2.8 Declare your host in Shinken
The Asterisk template name is asterisk. All you need is to add it on yourhost.
Now it’s time to define some object definitions in your Shinken configuration files in order to monitor the new Windowsmachine.
We will suppose here that your server is named srv-sip-1. Of course change this name with the real name of yourserver.
Find your host definition and edit it:
Under Linux:
linux:~ # vi /etc/shinken/hosts/srv-sip-1.cfg
Or Windows:
c:\ wordpad c:\shinken\etc\hosts\srv-sip-1.cfg
All you need it to add the asterisk template for your host.
define host{use asterisk,windowshost_name srv-sip-1address srv-sip-1.mydomain.com
}
* The use sip is the "template" line. It mean that this host will **inherits** properties from this template.
* the host_name is the object name of your host. It must be **unique**.
* the address is ... the network address of your host :)
What is checked with an askterisk template?
At this point, you configure your host to be checked with an asterisk templates. What does it means? It means thatyou got some checks already configured for you:
• overall state of the asterisk server
13.2.9 Restarting Shinken
You’re done with modifying the Shinken configuration, so you’ll need to verify your configuration files and restartShinken.
13.2. Monitoring Asterisk servers 355

Shinken Documentation, Release 2.4
If the verification process produces any errors messages, fix your configuration file before continuing. Make sure thatyou don’t (re)start Shinken until the verification process completes without any errors!
13.3 Monitoring DHCP servers
Abstract
This document describes how you can monitor a DHCP service.
13.3.1 Introduction
These instructions assume that you’ve installed Shinken according to the Installation tutorial. The sample configura-tion entries below reference objects that are defined in the sample config files (“commands.cfg”, “templates.cfg”, etc.)that are installed if you follow the quickstart.
13.3.2 Overview
Note: TODO: draw a dhcp diag
Monitoring a DHCP server means ask for a DHCP query and wait for a response from this server. Don’t worry, theDHCP confirmation will never be send, so you won’t have a DHCP entry for this test.
13.3.3 Steps
There are some steps you’ll need to follow in order to monitor a new database machine. They are:
• Allow check_dhcp to run
• Update your server host definition for dhcp monitoring
• Restart the Shinken daemon
13.3.4 What’s Already Done For You
To make your life a bit easier, a few configuration tasks have already been done for you:
• Some check_dhcp commands definition has been added to the “commands.cfg” file.
• An DHCP host template (called “dhcp”) has already been created in the “templates.cfg” file.
The above-mentioned config files can be found in the //etc/shinken/packs/network/services/dhcp directory (orc:\shinken\etc\packs\network\services\dhcp under windows). You can modify the definitions in these and other def-initions to suit your needs better if you’d like. However, I’d recommend waiting until you’re more familiar withconfiguring Shinken before doing so. For the time being, just follow the directions outlined below and you’ll bemonitoring your DHCP boxes in no time.
Tip: We are supposing here that the DHCP server you want to monitor is named srv-lin-1 and is a linux. Pleasechange the above lines and commands with the real name of your server of course.
356 Chapter 13. How to monitor ...
Shinken Documentation, Release 2.4
13.3.5 Allow check_dhcp to run
The check_dhcp must be run under the root account to send a dhcp call on the network. To do this, you should launchon your shinken server:
chown root:root /usr/lib/nagios/plugins/check_dhcpchmod u+s /usr/lib/nagios/plugins/check_dhcp
13.3.6 Declare your host as an dhcp server
All you need to get all the DHCP service checks is to add the dhcp template to this host. We suppose you alreadymonitor the OS for this host, and so you already got the host configuration file for it.
Under Linux:
linux:~ # vi /etc/shinken/hosts/srv-lin-1.cfg
Or Windows:
c:\ wordpad c:\shinken\etc\hosts\srv-lin-1.cfg
And add:
define host{use dhcp,linuxhost_name srv-lin-1address srv-lin-1.mydomain.com
}
13.3.7 Restarting Shinken
You’re done with modifying the Shiknen configuration, so you’ll need to verify your configuration files and restartShinken.
If the verification process produces any errors messages, fix your configuration file before continuing. Make sure thatyou don’t (re)start Shinken until the verification process completes without any errors!
13.4 Monitoring IIS servers
Abstract
This document describes how you can monitor a IIS server. This monitoring covers typically:
• connections count
• number of errors
• number of logged users
• etc...
13.4. Monitoring IIS servers 357

Shinken Documentation, Release 2.4
13.4.1 Introduction
These instructions assume that you’ve installed Shinken according to the Installation tutorial. The sample configura-tion entries below reference objects that are defined in the sample config files (“commands.cfg”, “templates.cfg”, etc.)that was installed if you followed the quickstart.
13.4.2 Overview
Monitoring a domain controller is possible in an agentless way by polling via the network using the WMI protocol,like we proposed in the windows template.
13.4.3 Prerequisites
Have a valid account on the Microsoft Windows device (local or domain account) you will monitor using WMI queriesand already get the windows server monitor with the windows template.
13.4.4 Steps
There are several steps you’ll need to follow in order to monitor a Microsoft IIS server.
• Add the good iis template to your windows host in the configuration
• Restart the Shinken Arbiter
13.4.5 What’s Already Been Done For You
To make your life a bit easier, configuration templates are provided as a starting point:
• A selection of check_iis_** based commands definitions have been added to the “commands.cfg” file. Thisallows you to use the check_wmi_plus plugin.
• A IIS host template is included the “templates.cfg” file. This allows you to add new host definitions in a simplemanner.
The above-mentioned config files can be found in the ///etc/shinken/packs/microsoft/iis// directory. You can modifythe definitions in these and other templates to suit your needs. However, wait until you’re more familiar with Shinkenbefore doing so. For the time being, just follow the directions outlined below and you’ll be monitoring your devicesin no time.
13.4.6 Setup the check_wmi_plus plugin
If you already follow the windows monitoring tutorial, you should already got the check_wmi_plus plugin. If it’s notdone, please do it first.
13.4.7 Declare your host in Shinken
The IIS template name is iis. All you need is to add it on your windws host.
Now it’s time to define some object definitions in your Shinken configuration files in order to monitor the new Windowsmachine.
358 Chapter 13. How to monitor ...

Shinken Documentation, Release 2.4
We will suppose here that your server is named srv-win-1. Of course change this name with the real name of yourserver.
Find your host definition and edit it:
Under Linux:
linux:~ # vi /etc/shinken/hosts/srv-win-1.cfg
Or Windows:
c:\ wordpad c:\shinken\etc\hosts\srv-win-1.cfg
All you need it to add the good template for your host. For example for a Hub Transport server:
define host {use iis,windowshost_name srv-win-1address srv-win-1.mydomain.com}
* The use iis is the "template" line. It mean that this host will **inherits** properties from this template.
* the host_name is the object name of your host. It must be **unique**.
* the address is ... the network address of your host :)
What is checked with a IIS template?
At this point, you configure your host to be checked with a IIS and Windows templates. What does it means? Inaddition to the windows classic checks, it means that you got some checks already configured for you:
• connections count
• number of errors
• number of logged users
• etc ...
13.4.8 Restarting Shinken
You’re done with modifying the Shinken configuration, so you’ll need to verify your configuration files and restartShinken.
If the verification process produces any errors messages, fix your configuration file before continuing. Make sure thatyou don’t (re)start Shinken until the verification process completes without any errors!
13.5 Monitoring Linux devices
Abstract
This document describes how you can monitor “private” services and attributes of Linux devices, such as:
• Memory usage
• CPU load
• Disk usage
13.5. Monitoring Linux devices 359

Shinken Documentation, Release 2.4
• Running processes
• etc.
13.5.1 Introduction
Publicly available services that are provided by Linux devices (like “HTTP”, “FTP”, “POP3”, etc.) can be monitoredeasily by following the documentation on Monitoring publicly available services (HTTP, FTP, SSH, etc.).
These instructions assume that you’ve installed Shinken according to the Installation tutorial. The sample configura-tion entries below reference objects that are defined in the sample config files (“commands.cfg”, “templates.cfg”, etc.)that are installed if you followed the quickstart.
13.5.2 Overview
Note: TODO: draw a by snmp diag
You can monitor a Linux device with an snmp agent, with a local agent and via SSH.
• This tutorial will focus on the SNMP based method.
• A local agent can provide faster query interval, more flexibility, passive and active communication methods.
• SSH based communications and checks should only be executed for infrequent checks as these have a highimpact on the client and server cpu. These also are very slow to execute overall and will not scale when pollingthousands of devices.
13.5.3 Steps
Here are the steps you will need to follow in order to monitor a new Linux device:
• Install/configure SNMPd on the Linux device
• Create new host definition for monitoring this device
• Restart the Shinken daemon
13.5.4 What’s Already Been Done For You
To make your life a bit easier, a few configuration tasks have already been done for you:
• A selection of check_snmp_ command definitions has been added to the “commands.cfg” file.
• A Linux host template (called “linux”) has already been created in the “templates.cfg” file. This allows you toadd new host definitions with a simple keyword.
The above-mentioned configuration files can be found in the ///etc/shinken///packs/os/linux directory (orc:shinkenetcpacksoslinux under windows). You can modify the definitions in these and other configuration packsto suit your needs better. However, it is recommended to wait until you’re more familiar with Shinken before doingso. For the time being, just follow the directions outlined below and you’ll be securely monitoring your Linux boxesin no time.
Tip: In the example, the linux device being monitored is named srv-lin-1. To re-use the example, make sure to updatethe hostname to that of your server.
360 Chapter 13. How to monitor ...

Shinken Documentation, Release 2.4
13.5.5 Installing/setup snmpd on srv-lin-1
First connect as root under srv-lin-1 with SSH (or putty/SecureCRT under windows).
Note: Todo: check if shinken.sh can do this, or with a deploy command?
RedHat like:
yum install snmpd
Debian like:
apt-get install snmpd
Edit the /etc/snmp/snmpd.conf and comment the line:
agentAddress udp:127.0.0.1:161
and uncomment the line:
agentAddress udp:161,udp6:[::1]:161
You can change the SNMP community (password) for your host in the line by changing the default value “public” bywhat you prefer:
rocommunity public
Restart the snmpd daemon:
sudo /etc/init.d/snmpd restart
Test the connection
To see if the keys are working, just launch from your Shinken server. Change the “public” community value with yourone:
check_snmp -H srv-lin-1 -o .1.3.6.1.2.1.1.3.0 -C public
It should give you the uptime of the srv-lin-1 server.
13.5.6 Declare your new host in Shinken
If the SNMP community value is a global one you are using on all your hosts, you can configure it in the file/etc/shinken/resource.cfg (or c:shinkenresource.cfg under windows) in the line:
$SNMPCOMMUNITYREAD$=public
Now it’s time to define some object definitions in your Shinken configuration files in order to monitor the new Linuxdevice.
You can add the new host definition in an existing configuration file, but it’s a good idea to have one file per host, itwill be easier to manage in the future. So create a file with the name of your server.
Under Linux:
linux:~ # vi /etc/shinken/hosts/srv-lin-1.cfg
Or Windows:
13.5. Monitoring Linux devices 361

Shinken Documentation, Release 2.4
c:\ wordpad c:\shinken\etc\hosts\srv-lin-1.cfg
You need to add a new host definition for the Linux device that you’re going to monitor. Just copy/paste the abovedefinition Change the “host_name”, and “address” fields to appropriate values for this device.
define host{use linuxhost_name srv-lin-1address srv-lin-1.mydomain.com
}
* the "use linux" is the "template" line. It mean that this host will **inherits** properties from the linux template.
* the host_name is the object name of your host. It must be **unique**.
* the address is ... the network address of your linux server :)
If you are using a specific SNMP community for this host, you can configure it in the SNMPCOMUNITY host macrolike this:
define host{use linuxhost_name srv-lin-1address srv-lin-1.mydomain.com_SNMPCOMMUNITY password
}
To enable disk checking for the host, configure the filesystem macro:
define host{use linuxhost_name srv-lin-1address srv-lin-1.mydomain.com_SNMPCOMMUNITY password_fs /, /var
}
What is checked with a linux template?
At this point, you configure your host to be checked with a linux template. What does it means? It means that you gotsome checks already configured for you:
• host check each 5 minutes: check with a ping that the server is UP
• check disk spaces
• check load average
• check the CPU usage
• check physical memory and swap usage
• check network interface activities
13.5.7 Restarting Shinken
You’re done with modifying the Shiknen configuration, so you’ll need to verify your configuration files and restartShinken.
362 Chapter 13. How to monitor ...

Shinken Documentation, Release 2.4
If the verification process produces any errors messages, fix your configuration file before continuing. Make sure thatyou don’t (re)start Shinken until the verification process completes without any errors!
13.6 Monitoring Linux devices
This document describes how you can monitor “private” services and attributes of GNU/Linux devices, such as:
• Memory usage
• CPU load
• Disk usage
• Running processes
• etc.
13.6.1 Available Methods
Several methods to monitor GNU/Linux devices are available:
• SNMP – Install or activate the linux SNMP agent and configure it to serve system statistics;
• Local Agent – Provides faster query interval, more flexibility, passive and active communication methods;
• SSH – Should only be executed for infrequent checks as these have a high impact on the client and server CPU.It’s also very slow to execute overall, and will not scale when polling thousands of devices;
• Monitoring Publicly Available Services – Public services provided by GNU/Linux devices (like HTTP, FTP,POP3, etc.) can be easily monitored.
13.7 Monitoring Linux devices via a Local Agent
Note: TODO Documentation needs to be written
See:
• Chapter 9. Monitoring GNU/Linux & Unix Machines
13.7.1 NRPE
See:
13.6. Monitoring Linux devices 363

Shinken Documentation, Release 2.4
• Shinken Module to bypass check_nrpe tool: NRPE Module
13.7.2 NSCA
See:
• Shinken Module to natively receive NSCA messages : :ref:‘ <nsca_daemon_module>‘
13.8 Monitoring Linux devices via SNMP
Note: TODO: draw a by snmp diag
Instructions below assume that you’ve installed Shinken according to the 10 Minutes Installation Guide. The sampleconfiguration entries below reference objects that are defined in the sample config files (‘’commands.cfg’‘, ‘’tem-plates.cfg’‘, etc.) installed if you followed this quickstart.
13.8.1 Steps
Here are the steps you will need to follow in order to monitor a new GNU/Linux device:
• Install/configure SNMPd on the GNU/Linux device
• Create new host definition for monitoring this device
• Restart the Shinken daemon
13.8.2 What’s Already Been Done For You
To make your life a bit easier, a few configuration tasks have already been done for you:
• A selection of check_snmp_ command definitions has been added to the “commands.cfg” file.
• A Linux host template (called “linux”) has already been created in the “templates.cfg” file. This allows you toadd new host definitions with a simple keyword.
The above-mentioned configuration files can be found in the ///etc/shinken///packs/os/linux directory (orc:shinkenetcpacksoslinux under windows). You can modify the definitions in these and other configuration packsto suit your needs better. However, it is recommended to wait until you’re more familiar with Shinken before doingso. For the time being, just follow the directions outlined below and you’ll be securely monitoring your Linux boxesin no time.
Tip: In the example, the linux device being monitored is named srv-lin-1. To re-use the example, make sure to updatethe hostname to that of your server.
364 Chapter 13. How to monitor ...

Shinken Documentation, Release 2.4
13.8.3 Installing/setup snmpd on srv-lin-1
First connect as root under srv-lin-1 with SSH (or putty/SecureCRT under windows).
Note: Todo: check if shinken.sh can do this, or with a deploy command?
RedHat like:
yum install snmpd
Debian like:
apt-get install snmpd
Edit the /etc/snmp/snmpd.conf and comment the line:
agentAddress udp:127.0.0.1:161
and uncomment the line:
agentAddress udp:161,udp6:[::1]:161
You can change the SNMP community (password) for your host in the line by changing the default value “public” bywhat you prefer:
rocommunity public
Restart the snmpd daemon:
sudo /etc/init.d/snmpd restart
Test the connection
To see if the keys are working, just launch from your Shinken server. Change the “public” community value with yourone:
check_snmp -H srv-lin-1 -o .1.3.6.1.2.1.1.3.0 -C public
It should give you the uptime of the srv-lin-1 server.
13.8.4 Declare your new host in Shinken
If the SNMP community value is a global one you are using on all your hosts, you can configure it in the file/etc/shinken/resource.cfg (or c:shinkenresource.cfg under windows) in the line:
$SNMPCOMMUNITYREAD$=public
Now it’s time to define some object definitions in your Shinken configuration files in order to monitor the new Linuxdevice.
You can add the new host definition in an existing configuration file, but it’s a good idea to have one file per host, itwill be easier to manage in the future. So create a file with the name of your server.
Under Linux:
linux:~ # vi /etc/shinken/hosts/srv-lin-1.cfg
Or Windows:
13.8. Monitoring Linux devices via SNMP 365
Shinken Documentation, Release 2.4
c:\ wordpad c:\shinken\etc\hosts\srv-lin-1.cfg
You need to add a new host definition for the GNU/Linux device that you’re going to monitor. Just copy/paste theabove definition Change the host_name and address fields to appropriate values for this device.
define host{use linuxhost_name srv-lin-1address srv-lin-1.mydomain.com
}
* The use linux is the "template" line. It mean that this host will **inherits** properties from the linux template.
* the host_name is the object name of your host. It must be **unique**.
* the address is ... the network address of your linux server :)
If you are using a specific SNMP community for this host, you can configure it in the SNMPCOMUNITY host macrolike this:
define host{use linuxhost_name srv-lin-1address srv-lin-1.mydomain.com_SNMPCOMMUNITY password
}
What is checked with a linux template ?
At this point, you configure your host to be checked with a linux template. What does it means? It means that you gotsome checks already configured for you:
• host check each 5 minutes: check with a ping that the server is UP
• check disk spaces
• check load average
• check the CPU usage
• check physical memory and swap usage
• check network interface activities
13.8.5 Restarting Shinken
You’re done with modifying the Shinken configuration, so you’ll need to verify your configuration files and restartShinken.
If the verification process produces any error messages, fix your configuration file before continuing. Make sure thatyou don’t (re)start Shinken until the verification process completes without any errors!
13.9 Monitoring Microsoft Exchange
Abstract
This document describes how you can monitor devices running Microsoft Exchange. This monitoring covers typically:
366 Chapter 13. How to monitor ...

Shinken Documentation, Release 2.4
• Hub transport activity
• Hub transport queues
• Database activities
• Receive/send activities
• etc ...
13.9.1 Introduction
These instructions assume that you’ve installed Shinken according to the Installation tutorial. The sample configura-tion entries below reference objects that are defined in the sample config files (“commands.cfg”, “templates.cfg”, etc.)that was installed if you followed the quickstart.
13.9.2 Overview
Monitoring an Exchange device is possible the agentless by polling via the network using the WMI protocol, like weproposed in the windows template.
13.9.3 Prerequisites
Have a valid account on the Microsoft Windows device (local or domain account) you will monitor using WMI queriesand already get the windows server monitor with the windows template.
13.9.4 Steps
There are several steps you’ll need to follow in order to monitor a Microsoft Exchange server.
• Add the good exchange template to your windows host in the configuration
• Restart the Shinken Arbiter
13.9.5 What’s Already Been Done For You
To make your life a bit easier, configuration templates are provided as a starting point:
• A selection of check_exchange_* based commands definitions have been added to the “commands.cfg” file.This allows you to use the check_wmi_plus plugin.
• Some Exchange host templates are included the “templates.cfg” file. This allows you to add new host definitionsin a simple manner.
The above-mentioned config files can be found in the ///etc/shinken/packs/microsoft/exchange// directory. You canmodify the definitions in these and other templates to suit your needs. However, wait until you’re more familiar withShinken before doing so. For the time being, just follow the directions outlined below and you’ll be monitoring yourdevices in no time.
13.9.6 Setup the check_wmi_plus plugin
If you already followed the windows monitoring tutorial, you should have the check_wmi_plus plugin installed. If it’snot, please do it before activating this pack.
13.9. Monitoring Microsoft Exchange 367

Shinken Documentation, Release 2.4
13.9.7 Declare your host in Shinken
There are some templates available for the exchange monitoring, each for an exchange role.
• Hub transport: exchange-ht template
• Mail Box server: exchange-mb template
• CAS server: exchange-cas template
Now it’s time to define some object definitions in your Shinken configuration files in order to monitor the new Windowsmachine.
We will suppose here that your server is named srv-win-1. Of course change this name with the real name of yourserver.
Find your host definition and edit it:
Under Linux:
linux:~ # vi /etc/shinken/hosts/srv-win-1.cfg
Or Windows:
c:\ wordpad c:\shinken\etc\hosts\srv-win-1.cfg
All you need it to add the good template for your host. For example for a Hub Transport server:
define host{use exchange-ht,exchange,windowshost_name srv-win-1address srv-win-1.mydomain.com
}
* The use exchange-ht and exchange is the "template" line. It mean that this host will **inherits** properties from theses templates.
* the host_name is the object name of your host. It must be **unique**.
* the address is ... the network address of your host :)
The “exchange” template do not add any specific checks, but allow to link with the exchange contacts easily.
What is checked with an exchange template?
At this point, you configure your host to be checked with a windows template. What does it means? In addition to thewindows classic checks, it means that you got some checks already configured for you:
• Hub transport activity
• Hub transport queues
• Database activities
• Receive/send activities
The exchange-cas and exchange-mb do not have any specific checks from now.
Note: Any help is welcome here :)
368 Chapter 13. How to monitor ...

Shinken Documentation, Release 2.4
13.9.8 Restarting Shinken
You’re done with modifying the Shinken configuration, so you’ll need to verify your configuration files and restartShinken.
If the verification process produces any errors messages, fix your configuration file before continuing. Make sure thatyou don’t (re)start Shinken until the verification process completes without any errors!
13.10 Monitoring Microsoft SQL databases
Abstract
This document describes how you can monitor a Mssql server such as:
• Connection time
• A recent restart
• The number of connections
• Cache hit
• Dead locks
• etc ...
13.10.1 Introduction
These instructions assume that you’ve installed Shinken according to the Installation tutorial. The sample configura-tion entries below reference objects that are defined in the sample config files (“commands.cfg”, “templates.cfg”, etc.)that are installed if you follow the quickstart.
13.10.2 Overview
Note: TODO: draw a check_mssql diag
Monitoring a Mssql server need the plugin check_mssql_health available atlabs.consol.de/lang/en/nagios/check_mssql_health/ and a mssql user account for the connection.
13.10.3 Steps
There are some steps you’ll need to follow in order to monitor a new database machine. They are:
• Install check plugins
• setup the mssql user account
• Update your windows server host definition for mysql monitoring
• Restart the Shinken daemon
13.10. Monitoring Microsoft SQL databases 369
Shinken Documentation, Release 2.4
13.10.4 What’s Already Done For You
To make your life a bit easier, a few configuration tasks have already been done for you:
• Some check_mssql_ commands definition has been added to the “commands.cfg” file.
• A Mssql host template (called “mssql”) has already been created in the “templates.cfg” file.
The above-mentioned config files can be found in the ///etc/shinken/// directory (or c:shinkenetc under windows).You can modify the definitions in these and other definitions to suit your needs better if you’d like. However, I’drecommend waiting until you’re more familiar with configuring Shinken before doing so. For the time being, justfollow the directions outlined below and you’ll be monitoring your Mssql boxes in no time.
Tip: We are supposing here that the Mssql machine you want to monitor is named srv-win-1. Please change theabove lines and commands with the real name of your server of course.
13.10.5 Installing the check plugins on Shinken
First connect as root under you Shinken server (or all poller servers for a multi-box setup)
Note: Todo: Use shinken.sh for this
13.10.6 Setup the mssql user account
Look at the labs.consol.de/lang/en/nagios/check_mssql_health/ page about how to configure your user connection.
Then you will need to configure your user/password in the macros file so the plugins will have the good values for theconnction. So update the /etc/shinken/resource.cfg file or c:shinkenetcresource.cfg file to setup the new password:
$MSSQLUSER$=shinken$MSSQLPASSWORD$=shinkenpassword
Test the connection
To see if the connection is ok, just launch:
/var/lib/nagios/plugins/check_mssql_health --hostname srv-win-1 --username shinken --password shinkenpassword --mode connection-time
It should not return errors.
13.10.7 Declare your host as a mssql server
All you need to get all the Msql service checks is to add the mssql template to this host. We suppose you alreadymonitor the OS for this host, and so you already got the host configuration file for it.
Under Linux:
linux:~ # vi /etc/shinken/hosts/srv-win-1.cfg
Or Windows:
c:\ wordpad c:\shinken\etc\hosts\srv-win-1.cfg
370 Chapter 13. How to monitor ...
Shinken Documentation, Release 2.4
You need to add the mysql template in the use line. It’s better to follow the more precise template to the less one, likehere mssql first, and then windows.
define host{use mssql,windowshost_name srv-win-1address srv-win-1.mydomain.com
}
What is checked with a mssql template?
At this point, you configure your host to be checked with a mssql template. What does it means? It means that yougot some services checks already configured for you. Warning and alert levels are between ():
• connection-time: Measures how long it takes to login 0..n seconds (1, 5)
• connected-users: Number of connected users 0..n (50, 80)
• cpu-busy: CPU Busy Time 0%..100% (80, 90)
• io-busy: IO Busy Time 0%..100% (80, 90)
• full-scans: Number of Full Table Scans per second 0..n (100, 500)
• transactions: Number of Transactions per second 0..n (10000, 50000)
• batch-requests: Number of Batch Requests per second 0..n (100, 200)
• latches-waits: Number of Latch-Requests per second, which could not be fulfilled 0..n (10, 50)
• latches-wait-time: Average time a Latch-Request had to wait until it was granted 0..n ms (1, 5)
• locks-waits: Number of Lock-Requests per second, which could not be satisfied. 0..n (100, 500)
• locks-timeouts: Number of Lock-Requests per second, which resulted in a timeout. 0..n (1, 5)
• locks-deadlocks: Number of Deadlocks per second 0..n (1, 5)
• sql-recompilations: Number of Re-Compilations per second 0..n (1, 10)
• sql-initcompilations: Number of Initial Compilations per second 0..n (100, 200)
• total-server-memory: The main memory reserved for the SQL Server 0..n (nearly1G, 1G)
• mem-pool-data-buffer-hit-ratio: Data Buffer Cache Hit Ratio 0%..100% (90, 80:)
• lazy-writes: Number of Lazy Writes per second 0..n (20, 40)
• page-life-expectancy: Average time a page stays in main memory 0..n (300:, 180:)
• free-list-stalls: Number of Free List Stalls per second 0..n (4, 10)
• checkpoint-pages: Number of Flushed Dirty Pages per second 0..n ()
• database-free: Free space in a database (Default is percent, but –units can be used also). You can select a singledatabase with the name parameter. 0%..100% (5%, 2%)
• database-backup-age Elapsed time since a database was last backupped (in hours). The performancedata alsocover the time needed for the backup (in minutes). 0..n
13.10. Monitoring Microsoft SQL databases 371
Shinken Documentation, Release 2.4
13.10.8 Restarting Shinken
You’re done with modifying the Shiknen configuration, so you’ll need to verify your configuration files and restartShinken.
If the verification process produces any errors messages, fix your configuration file before continuing. Make sure thatyou don’t (re)start Shinken until the verification process completes without any errors!
13.11 Monitoring MySQL databases
Abstract
This document describes how you can monitor a MySQL server such as:
• Connection time
• A recent restart
• The number of connections
• Cache hit
• etc...
13.11.1 Introduction
These instructions assume that you’ve installed Shinken according to the Installation tutorial. The sample configura-tion entries below reference objects that are defined in the sample config files (“commands.cfg”, “templates.cfg”, etc.)that are installed if you follow the quickstart.
13.11.2 Overview
Note: TODO: draw a check_mysql diag
Monitoring a MySQL server need the plugin check_mysql_health available atlabs.consol.de/lang/en/nagios/check_mysql_health/ and a mysql user account for the connection.
13.11.3 Steps
There are some steps you’ll need to follow in order to monitor a new Linux machine. They are:
• Install check plugins
• setup the mysql user account
• Update your server host definition for mysql monitoring
• Restart the Shinken daemon
372 Chapter 13. How to monitor ...

Shinken Documentation, Release 2.4
13.11.4 What’s Already Done For You
To make your life a bit easier, a few configuration tasks have already been done for you:
• Some check_mysql_ commands definition has been added to the “commands.cfg” file.
• A Mysql host template (called “mysql”) has already been created in the “templates.cfg” file.
The above-mentioned config files can be found in the ///etc/shinken/// directory (or c:shinkenetc under windows).You can modify the definitions in these and other definitions to suit your needs better if you’d like. However, I’drecommend waiting until you’re more familiar with configuring Shinken before doing so. For the time being, justfollow the directions outlined below and you’ll be monitoring your Mysql boxes in no time.
Tip: We are supposing here that the Mysql machine you want to monitor is named srv-lin-1 and is a Linux. Pleasechange the above lines and commands with the real name of your server of course.
13.11.5 Installing the check plugins on Shinken
First connect as root under you Shinken server (or all poller servers for a multi-box setup) and launch:
shinken.sh -p check_mysql_health
13.11.6 Setup the mysql user account
Connect with a root account on your MySQL database. change ‘password’ with your mysql root password:
lin-srv-1:# mysql -u root -ppassword
And create a shinken user:
GRANT usage ON *.* TO 'shinken'@'%' IDENTIFIED BY 'shinkenpassword';
It’s a good thing to change the shinkenpassword to another password. Then you need to update the/etc/shinken/resource.cfg file or c:shinkenetcresource.cfg file to setup the new password:
$MYSQLUSER$=shinken$MYSQLPASSWORD$=shinkenpassword
Test the connection
To see if the connection is okay, just launch:
/var/lib/nagios/plugins/check_mysql_health --hostname srv-lin-1 --username shinken --password shinkenpassword --mode connection-time
It should not return errors.
13.11.7 Declare your host as a mysql server
All you need to get all the MySQL service checks is to add the mysql template to this host. We suppose you alreadymonitor the OS (linux or windows for example) for this host, and so you already got the host configuration file for it.
Under Linux:
13.11. Monitoring MySQL databases 373

Shinken Documentation, Release 2.4
linux:~ # vi /etc/shinken/hosts/srv-lin-1.cfg
Or Windows:
c:\ wordpad c:\shinken\etc\hosts\srv-lin-1.cfg
You need to add the mysql template in the use line. It’s better to follow the more precise template to the less one, likehere mysql first, and then linux.
define host{use mysql,linuxhost_name srv-lin-1address srv-lin-1.mydomain.com
}
What is checked with a mysql template?
At this point, you configure your host to be checked with a mysql template. What does it means? It means that yougot some services checks already configured for you. Warning and alert levels are between ():
• connection-time: Determines how long connection establishment and login take, 0..n Seconds (1, 5)
• uptime: Time since start of the database server (recognizes DB-Crash+Restart), 0..n Seconds (10:, 5: Minutes)
• threads-connected: Number of open connections, 1..n (10, 20)
• threadcache-hitrate: Hitrate in the Thread-Cache 0%..100% (90:, 80:)
• querycache-hitrate: Hitrate in the Query Cache 0%..100% (90:, 80:)
• querycache-lowmem-prunes: Displacement out of the Query Cache due to memory shortness n/sec (1, 10)
• keycache-hitrate: Hitrate in the Myisam Key Cache 0%..100% (99:, 95:)
• bufferpool-hitrate: Hitrate in the InnoDB Buffer Pool 0%..100% (99:, 95:)
• bufferpool-wait-free: Rate of the InnoDB Buffer Pool Waits 0..n/sec (1, 10)
• log-waits: Rate of the InnoDB Log Waits 0..n/sec (1, 10)
• tablecache-hitrate: Hitrate in the Table-Cache 0%..100% (99:, 95:)
• table-lock-contention: Rate of failed table locks 0%..100% (1, 2)
• index-usage: Sum of the Index-Utilization (in contrast to Full Table Scans) 0%..100% (90:, 80:)
• tmp-disk-tables: Percent of the temporary tables that were created on the disk instead in memory 0%..100% (25,50)
• slow-queries: Rate of queries that were detected as “slow” 0..n/sec (0.1, 1)
• long-running-procs: Sum of processes that are running longer than 1 minute 0..n (10, 20)
• slave-lag: Delay between Master and Slave 0..n Seconds
• slave-io-running: Checks if the IO-Thread of the Slave-DB is running
• slave-sql-running: Checks if the SQL-Thread of the Slave-DB is running
• open-files: Number of open files (of upper limit) 0%..100% (80, 95)
• cluster-ndb-running: Checks if all cluster nodes are running.
374 Chapter 13. How to monitor ...
Shinken Documentation, Release 2.4
13.11.8 Restarting Shinken
You’re done with modifying the Shinken configuration, so you’ll need to verify your configuration files and restartShinken.
If the verification process produces any errors messages, fix your configuration file before continuing. Make sure thatyou don’t (re)start Shinken until the verification process completes without any errors!
13.12 Monitoring Routers and Switches
Abstract
This document describes how you can monitor the status of network switches and routers. Some cheaper “unmanaged”switches and hubs don’t have IP addresses and are essentially invisible on your network, so there’s not any way tomonitor them. More expensive switches and routers have addresses assigned to them and can be monitored by pingingthem or using “SNMP” to query status information.
13.12.1 Introduction
I’ll describe how you can monitor the following things on managed switches, hubs, and routers:
• Packet loss, round trip average
• “SNMP” status information
• Bandwidth / traffic rate
These instructions assume that you’ve installed Shinken according to the quickstart guide. The sample configurationentries below reference objects that are defined in the sample config files (“commands.cfg”, “templates.cfg”, etc.) thatare installed when you follow the quickstart.
13.12. Monitoring Routers and Switches 375
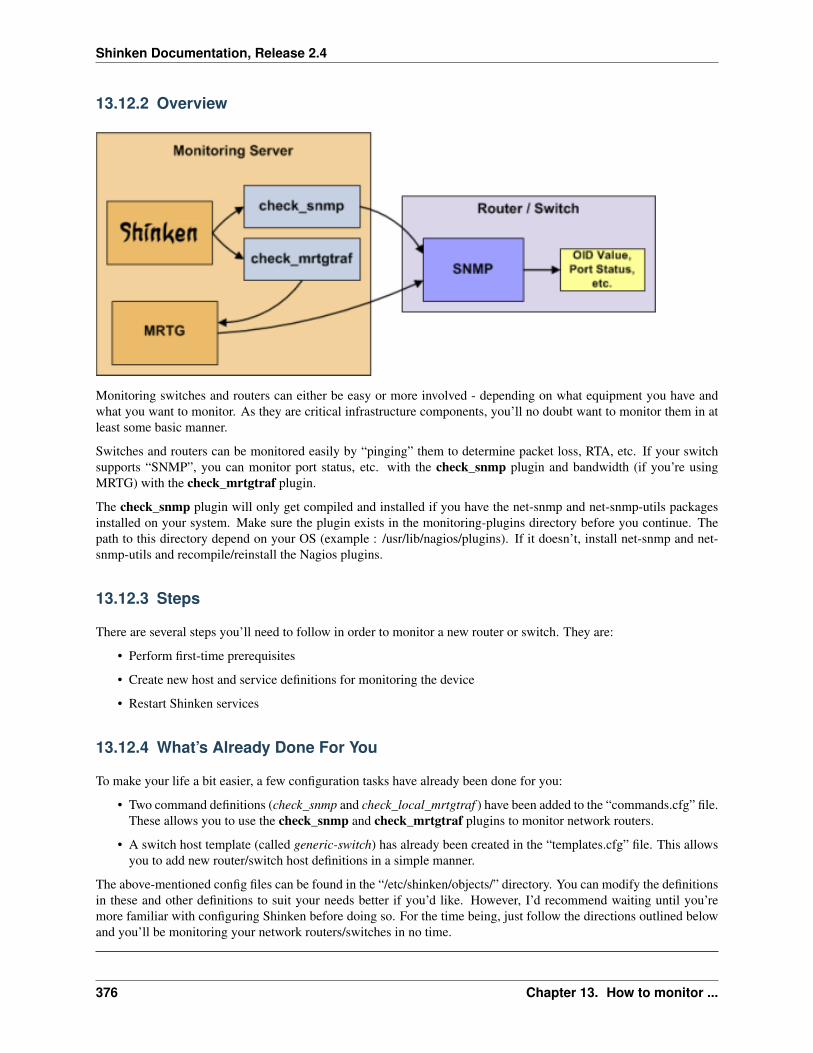
Shinken Documentation, Release 2.4
13.12.2 Overview
Monitoring switches and routers can either be easy or more involved - depending on what equipment you have andwhat you want to monitor. As they are critical infrastructure components, you’ll no doubt want to monitor them in atleast some basic manner.
Switches and routers can be monitored easily by “pinging” them to determine packet loss, RTA, etc. If your switchsupports “SNMP”, you can monitor port status, etc. with the check_snmp plugin and bandwidth (if you’re usingMRTG) with the check_mrtgtraf plugin.
The check_snmp plugin will only get compiled and installed if you have the net-snmp and net-snmp-utils packagesinstalled on your system. Make sure the plugin exists in the monitoring-plugins directory before you continue. Thepath to this directory depend on your OS (example : /usr/lib/nagios/plugins). If it doesn’t, install net-snmp and net-snmp-utils and recompile/reinstall the Nagios plugins.
13.12.3 Steps
There are several steps you’ll need to follow in order to monitor a new router or switch. They are:
• Perform first-time prerequisites
• Create new host and service definitions for monitoring the device
• Restart Shinken services
13.12.4 What’s Already Done For You
To make your life a bit easier, a few configuration tasks have already been done for you:
• Two command definitions (check_snmp and check_local_mrtgtraf ) have been added to the “commands.cfg” file.These allows you to use the check_snmp and check_mrtgtraf plugins to monitor network routers.
• A switch host template (called generic-switch) has already been created in the “templates.cfg” file. This allowsyou to add new router/switch host definitions in a simple manner.
The above-mentioned config files can be found in the “/etc/shinken/objects/” directory. You can modify the definitionsin these and other definitions to suit your needs better if you’d like. However, I’d recommend waiting until you’remore familiar with configuring Shinken before doing so. For the time being, just follow the directions outlined belowand you’ll be monitoring your network routers/switches in no time.
376 Chapter 13. How to monitor ...

Shinken Documentation, Release 2.4
Important: The commands are in fact not included yet in commands.cfg
13.12.5 Prerequisites
The first time you configure Shinken to monitor a network switch, you’ll need to do a bit of extra work. Remember,you only need to do this for the first switch you monitor.
Edit the main Shinken config file.
linux:~ # vi /etc/shinken/nagios.cfg
Remove the leading pound (#) sign from the following line in the main configuration file:
cfg_file=/etc/shinken/objects/switch.cfg
Save the file and exit.
What did you just do? You told Shinken to look to the “/etc/shinken/objects/switch.cfg” to find additional objectdefinitions. That’s where you’ll be adding host and service definitions for routers and switches. That configurationfile already contains some sample host, hostgroup, and service definitions. For the first router/switch you monitor, youcan simply modify the sample host and service definitions in that file, rather than creating new ones.
13.12.6 Configuring Shinken
You’ll need to create some object definitions in order to monitor a new router/switch.
Open the “switch.cfg” file for editing.
linux:~ # vi /etc/shinken/objects/switch.cfg
Add a new host definition for the switch that you’re going to monitor. If this is the first switch you’re monitoring, youcan simply modify the sample host definition in “switch.cfg”. Change the “host_name”, “alias”, and “address” fieldsto appropriate values for the switch.
define host{use generic-switch ; Inherit default values from a templatehost_name linksys-srw224p ; The name we're giving to this switchalias Linksys SRW224P Switch ; A longer name associated with the switchaddress 192.168.1.253 ; IP address of the switchhostgroups allhosts,switches ; Host groups this switch is associated with
}
13.12.7 Monitoring Services
Now you can add some service definitions (to the same configuration file) to monitor different aspects of the switch.If this is the first switch you’re monitoring, you can simply modify the sample service definition in “switch.cfg”.
Replace linksys-srw224p in the example definitions below with the name you specified in the “host_name” directiveof the host definition you just added.
13.12.8 Monitoring Packet Loss and RTA
Add the following service definition in order to monitor packet loss and round trip average between the Shinken hostand the switch every 5 minutes under normal conditions.
13.12. Monitoring Routers and Switches 377
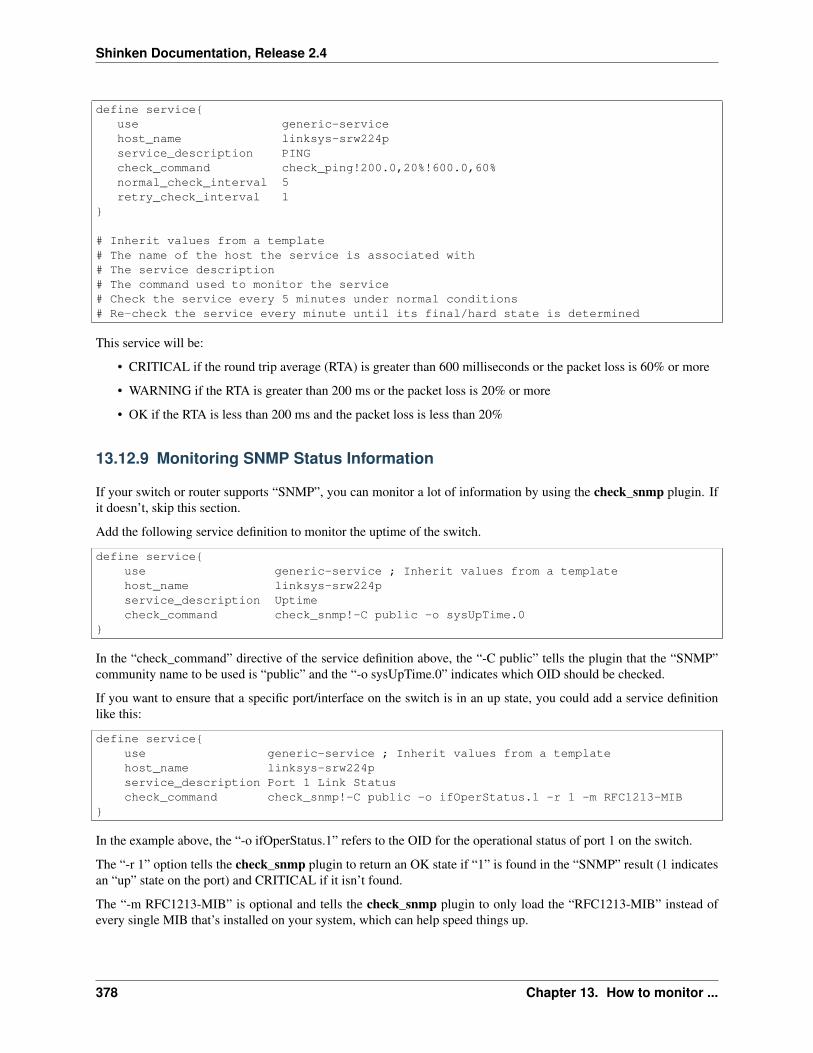
Shinken Documentation, Release 2.4
define service{use generic-servicehost_name linksys-srw224pservice_description PINGcheck_command check_ping!200.0,20%!600.0,60%normal_check_interval 5retry_check_interval 1
}
# Inherit values from a template# The name of the host the service is associated with# The service description# The command used to monitor the service# Check the service every 5 minutes under normal conditions# Re-check the service every minute until its final/hard state is determined
This service will be:
• CRITICAL if the round trip average (RTA) is greater than 600 milliseconds or the packet loss is 60% or more
• WARNING if the RTA is greater than 200 ms or the packet loss is 20% or more
• OK if the RTA is less than 200 ms and the packet loss is less than 20%
13.12.9 Monitoring SNMP Status Information
If your switch or router supports “SNMP”, you can monitor a lot of information by using the check_snmp plugin. Ifit doesn’t, skip this section.
Add the following service definition to monitor the uptime of the switch.
define service{use generic-service ; Inherit values from a templatehost_name linksys-srw224pservice_description Uptimecheck_command check_snmp!-C public -o sysUpTime.0
}
In the “check_command” directive of the service definition above, the “-C public” tells the plugin that the “SNMP”community name to be used is “public” and the “-o sysUpTime.0” indicates which OID should be checked.
If you want to ensure that a specific port/interface on the switch is in an up state, you could add a service definitionlike this:
define service{use generic-service ; Inherit values from a templatehost_name linksys-srw224pservice_description Port 1 Link Statuscheck_command check_snmp!-C public -o ifOperStatus.1 -r 1 -m RFC1213-MIB
}
In the example above, the “-o ifOperStatus.1” refers to the OID for the operational status of port 1 on the switch.
The “-r 1” option tells the check_snmp plugin to return an OK state if “1” is found in the “SNMP” result (1 indicatesan “up” state on the port) and CRITICAL if it isn’t found.
The “-m RFC1213-MIB” is optional and tells the check_snmp plugin to only load the “RFC1213-MIB” instead ofevery single MIB that’s installed on your system, which can help speed things up.
378 Chapter 13. How to monitor ...
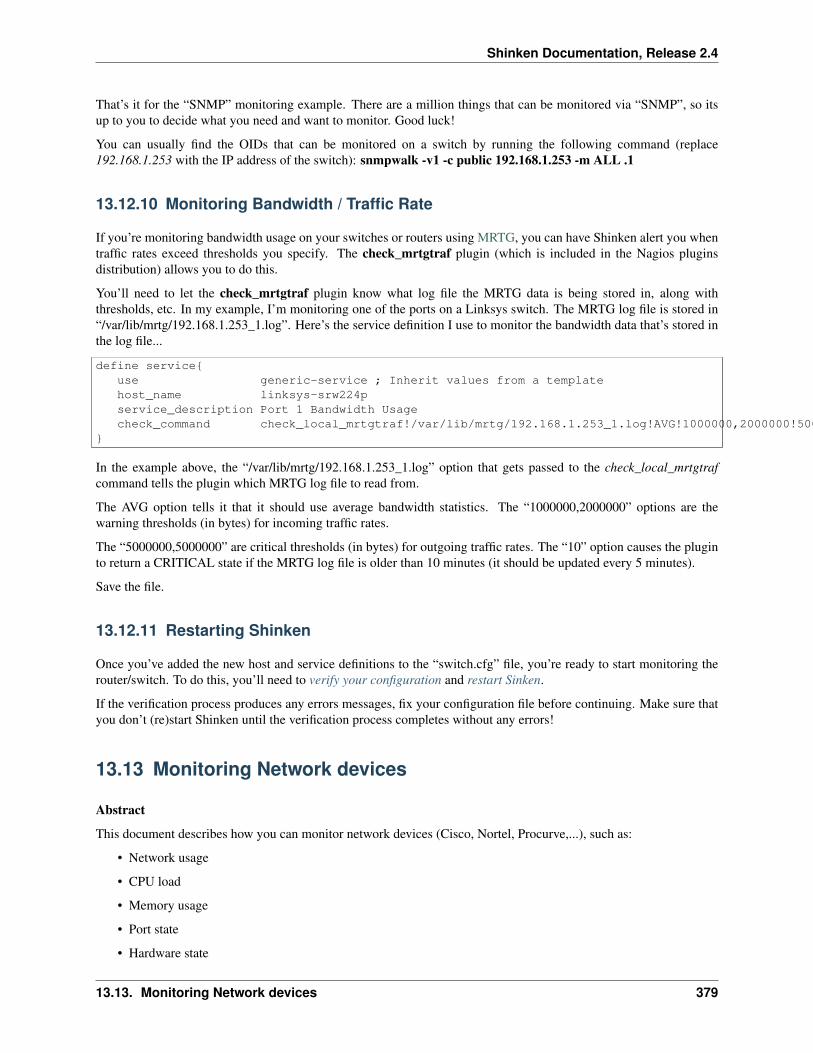
Shinken Documentation, Release 2.4
That’s it for the “SNMP” monitoring example. There are a million things that can be monitored via “SNMP”, so itsup to you to decide what you need and want to monitor. Good luck!
You can usually find the OIDs that can be monitored on a switch by running the following command (replace192.168.1.253 with the IP address of the switch): snmpwalk -v1 -c public 192.168.1.253 -m ALL .1
13.12.10 Monitoring Bandwidth / Traffic Rate
If you’re monitoring bandwidth usage on your switches or routers using MRTG, you can have Shinken alert you whentraffic rates exceed thresholds you specify. The check_mrtgtraf plugin (which is included in the Nagios pluginsdistribution) allows you to do this.
You’ll need to let the check_mrtgtraf plugin know what log file the MRTG data is being stored in, along withthresholds, etc. In my example, I’m monitoring one of the ports on a Linksys switch. The MRTG log file is stored in“/var/lib/mrtg/192.168.1.253_1.log”. Here’s the service definition I use to monitor the bandwidth data that’s stored inthe log file...
define service{use generic-service ; Inherit values from a templatehost_name linksys-srw224pservice_description Port 1 Bandwidth Usagecheck_command check_local_mrtgtraf!/var/lib/mrtg/192.168.1.253_1.log!AVG!1000000,2000000!5000000,5000000!10
}
In the example above, the “/var/lib/mrtg/192.168.1.253_1.log” option that gets passed to the check_local_mrtgtrafcommand tells the plugin which MRTG log file to read from.
The AVG option tells it that it should use average bandwidth statistics. The “1000000,2000000” options are thewarning thresholds (in bytes) for incoming traffic rates.
The “5000000,5000000” are critical thresholds (in bytes) for outgoing traffic rates. The “10” option causes the pluginto return a CRITICAL state if the MRTG log file is older than 10 minutes (it should be updated every 5 minutes).
Save the file.
13.12.11 Restarting Shinken
Once you’ve added the new host and service definitions to the “switch.cfg” file, you’re ready to start monitoring therouter/switch. To do this, you’ll need to verify your configuration and restart Sinken.
If the verification process produces any errors messages, fix your configuration file before continuing. Make sure thatyou don’t (re)start Shinken until the verification process completes without any errors!
13.13 Monitoring Network devices
Abstract
This document describes how you can monitor network devices (Cisco, Nortel, Procurve,...), such as:
• Network usage
• CPU load
• Memory usage
• Port state
• Hardware state
13.13. Monitoring Network devices 379

Shinken Documentation, Release 2.4
• etc.
13.13.1 Introduction
These instructions assume that you have installed Shinken according to the Installation tutorial. The sample config-uration entries below reference objects that are defined in the sample config files (“commands.cfg”, “templates.cfg”,etc.) that are installed if you followed the quickstart.
13.13.2 Overview
Note: TODO: draw a by snmp diag
Network devices are typically monitored using the SNMP and ICMP(ping) protocol.
13.13.3 Steps
Here are the steps you will need to follow in order to monitor a new device:
• Setup check_nwc_health and try a connection with the equipment
• Create new host definition to monitor this device
• Restart the Shinken daemon
13.13.4 What’s Already Been Done For You
To make your life a bit easier, a few configuration tasks have already been done for you:
• A selection of check_nwc_health command definitions have been added to the “commands.cfg” file.
• A network equipement host template (called “switch”) has already been created in the “templates.cfg” file. Thisallows you to add new host definitions with a simple keyword.
The above-mentioned configuration files can be found in the ///etc/shinken///packs/network/switch directory (orc:shinkenetcpacksnetworkswitch under windows). You can modify the definitions in these and other configurationpacks to suit your needs better. However, it is recommended to wait until you are familiar with Shinken before doingso. For the time being, just follow the directions outlined below and you will be securely monitoring your devices inno time.
Tip: In the example, the switch device being monitored is named switch-1. To re-use the example, make sure toupdate the hostname to that of your device.
13.13.5 Setup check_nwc_health and try a connection switch-1
First connect as the shinken user under your shinken host.
Unix like to install check_nwc_health:
install -p check_nwc_health
380 Chapter 13. How to monitor ...
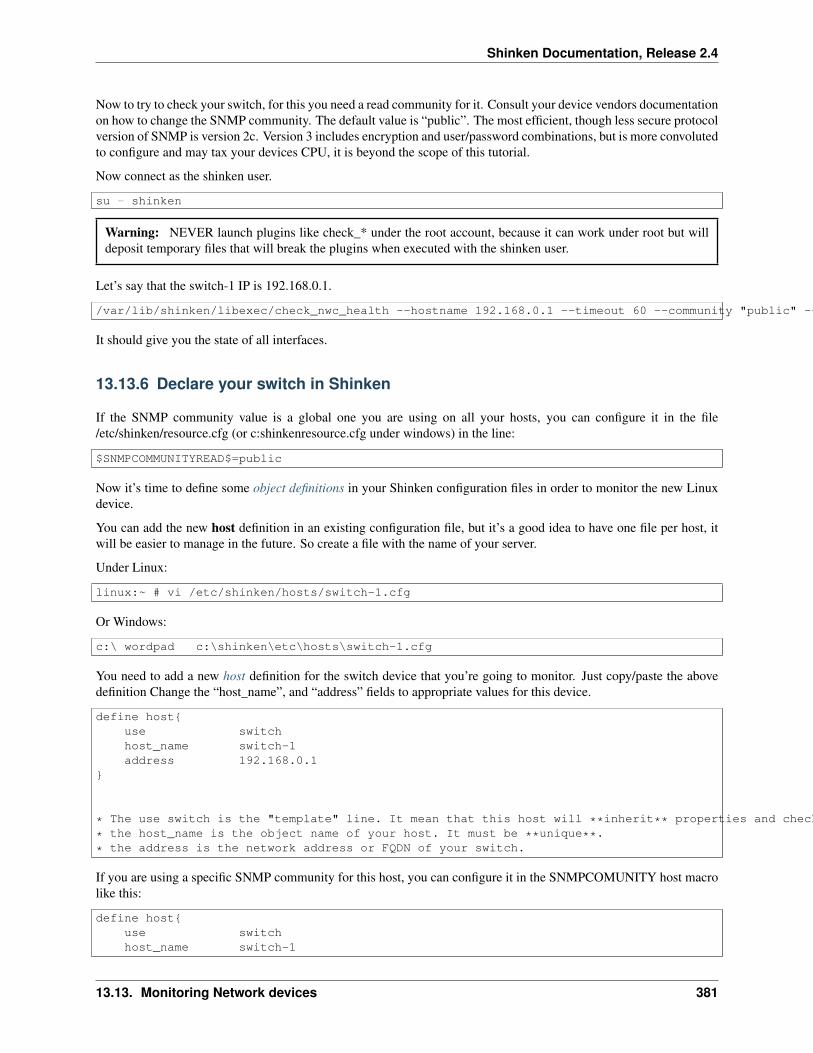
Shinken Documentation, Release 2.4
Now to try to check your switch, for this you need a read community for it. Consult your device vendors documentationon how to change the SNMP community. The default value is “public”. The most efficient, though less secure protocolversion of SNMP is version 2c. Version 3 includes encryption and user/password combinations, but is more convolutedto configure and may tax your devices CPU, it is beyond the scope of this tutorial.
Now connect as the shinken user.
su - shinken
Warning: NEVER launch plugins like check_* under the root account, because it can work under root but willdeposit temporary files that will break the plugins when executed with the shinken user.
Let’s say that the switch-1 IP is 192.168.0.1.
/var/lib/shinken/libexec/check_nwc_health --hostname 192.168.0.1 --timeout 60 --community "public" --mode interface-status
It should give you the state of all interfaces.
13.13.6 Declare your switch in Shinken
If the SNMP community value is a global one you are using on all your hosts, you can configure it in the file/etc/shinken/resource.cfg (or c:shinkenresource.cfg under windows) in the line:
$SNMPCOMMUNITYREAD$=public
Now it’s time to define some object definitions in your Shinken configuration files in order to monitor the new Linuxdevice.
You can add the new host definition in an existing configuration file, but it’s a good idea to have one file per host, itwill be easier to manage in the future. So create a file with the name of your server.
Under Linux:
linux:~ # vi /etc/shinken/hosts/switch-1.cfg
Or Windows:
c:\ wordpad c:\shinken\etc\hosts\switch-1.cfg
You need to add a new host definition for the switch device that you’re going to monitor. Just copy/paste the abovedefinition Change the “host_name”, and “address” fields to appropriate values for this device.
define host{use switchhost_name switch-1address 192.168.0.1
}
* The use switch is the "template" line. It mean that this host will **inherit** properties and checks from the switch template.
* the host_name is the object name of your host. It must be **unique**.
* the address is the network address or FQDN of your switch.
If you are using a specific SNMP community for this host, you can configure it in the SNMPCOMUNITY host macrolike this:
define host{use switchhost_name switch-1
13.13. Monitoring Network devices 381

Shinken Documentation, Release 2.4
address 192.168.0.1_SNMPCOMMUNITY password
}
What is checked with a switch template?
At this point, you configure your host to be checked with a switch template. What does it means? It means that yougot some checks already configured for you:
• host check each 5 minutes: check with a ping that the device is UP
• interface usage
• interface status
• interface errors
For CPU/memory/Hardware checks
Not all devices are managed by check_nwc_health. To know if yours is, just launch:
/var/lib/shinken/libexec/check_nwc_health --hostname 192.168.0.1 --timeout 60 --community "public" --mode hardware-health
If it’s ok, you can add the “cisco” template for your hosts (even if it’s not a cisco device, we are working on gettingmore templates configuration).
define host{use cisco,switchhost_name switch-1address 192.168.0.1_SNMPCOMMUNITY password
}
If it does not work, to learn more about your device, please launch the command:
snmpwalk -v2c -c public 192.168.0.1 | bzip2 > /tmp/device.bz2
And launch this this command as well:
nmap -T4 -O -oX /tmp/device.xml 192.168.0.1
Once you have done that, send us the device.bz2 and device.xml files (located in /tmp directory), we will add this newdevice to the check_nwc_health plugin in addition to the discovery module. With these files please also provide somegeneral information about the device, so we will incorporate it correctly into the discovery module.
13.13.7 Restarting Shinken
You’re done with modifying the Shinken configuration, you will need to verify your configuration files and restartShinken.
If the verification process produces any errors messages, fix your configuration file before continuing. Make sure thatyou don’t (re)start Shinken until the verification process completes without any errors!
382 Chapter 13. How to monitor ...

Shinken Documentation, Release 2.4
13.14 Monitoring Oracle databases
Abstract
This document describes how you can monitor an Oracle database server such as:
• Connection time
• A recent restart
• The number of connections
• Cache hit
• Dead locks
• etc ...
13.14.1 Introduction
These instructions assume that you’ve installed Shinken according to the Installation tutorial. The sample configura-tion entries below reference objects that are defined in the sample config files (“commands.cfg”, “templates.cfg”, etc.)that are installed if you follow the quickstart.
13.14.2 Overview
Note: TODO: draw a oracle diag
Monitoring an Oracle server need the plugin check_oracle_health available atlabs.consol.de/lang/en/nagios/check_oracle_health/ and an oracle user account for the connection.
13.14.3 Steps
There are some steps you’ll need to follow in order to monitor a new database machine. They are:
• Install dependencies
• Install check plugins
• Setup the oracle user account
• Creating an alias definition for Oracle databases
• Update your server host definition for oracle monitoring
• Restart the Shinken daemon
13.14.4 What’s Already Done For You
To make your life a bit easier, a few configuration tasks have already been done for you:
• Some check_oracle_ commands definition has been added to the “commands.cfg” file.
• An Oracle host template (called “oracle”) has already been created in the “templates.cfg” file.
13.14. Monitoring Oracle databases 383

Shinken Documentation, Release 2.4
The above-mentioned config files can be found in the ///etc/shinken/// directory (or c:shinkenetc under windows).You can modify the definitions in these and other definitions to suit your needs better if you’d like. However, I’drecommend waiting until you’re more familiar with configuring Shinken before doing so. For the time being, justfollow the directions outlined below and you’ll be monitoring your Oracle boxes in no time.
Tip: We are supposing here that the Oracle machine you want to monitor is named srv-lin-1 and is a linux. Pleasechange the above lines and commands with the real name of your server of course.
13.14.5 Installing dependencies
Installing SQL*Plus on the Shinken server
Check_oracle_health plugin needs sqlplus oracle client on the Shinken server, you can download packages on theOracle Technology Network website. You need to have these 3 packages: oracle-instantclient11.2-basic-11.2.0.3.0-1.x86_64.rpm oracle-instantclient11.2-devel-11.2.0.3.0-1.x86_64.rpm oracle-instantclient11.2-sqlplus-11.2.0.3.0-1.x86_64.rpm
You can install them like this:
linux:~ # rpm -Uvh oracle-instantclient11.2-*
Then you have to create some symbolic links in order to have commands in the path:
linux:~ # ln -s /usr/lib/oracle/11.2/client64/bin/adrci /usr/bin/adrcilinux:~ # ln -s /usr/lib/oracle/11.2/client64/bin/genezi /usr/bin/genezilinux:~ # ln -s /usr/lib/oracle/11.2/client64/bin/sqlplus /usr/bin/sqlplus
Also, you need to export Oracle environment variables in order to install CPAN modules:
linux:~ # export ORACLE_HOME=/usr/lib/oracle/11.2/client64linux:~ # export PATH=$PATH:$ORACLE_HOME/binlinux:~ # export LD_LIBRARY_PATH=$ORACLE_HOME/lib
Installing CPAN modules
linux:~ # perl -MCPAN -e shellcpan[1]> install DBIcpan[2]> force install DBD::Oracle
13.14.6 Installing the check plugins on Shinken
First connect as root under you Shinken server (or all poller servers for a multi-box setup) and launch:
shinken.sh -p check_oracle_health
13.14.7 Setup the oracle user account
Tip: You will need to configure the user for all your oracle databases.
Connect to your database as sysadmin on the oracle server:
384 Chapter 13. How to monitor ...

Shinken Documentation, Release 2.4
srv-lin-1:oracle# sqlplus "/ as sysdba"
And then create your shinken account on the database:
CREATE USER shinken IDENTIFIED BY shinkenpassword;GRANT CREATE SESSION TO shinken;GRANT SELECT any dictionary TO shinken;GRANT SELECT ON V_$SYSSTAT TO shinken;GRANT SELECT ON V_$INSTANCE TO shinken;GRANT SELECT ON V_$LOG TO shinken;GRANT SELECT ON SYS.DBA_DATA_FILES TO shinken;GRANT SELECT ON SYS.DBA_FREE_SPACE TO shinken;
And for old 8.1.7 database only:
---- if somebody still uses Oracle 8.1.7...GRANT SELECT ON sys.dba_tablespaces TO shinken;GRANT SELECT ON dba_temp_files TO shinken;GRANT SELECT ON sys.v_$Temp_extent_pool TO shinken;GRANT SELECT ON sys.v_$TEMP_SPACE_HEADER TO shinken;GRANT SELECT ON sys.v_$session TO shinken;
Then you will need to configure your user/password in the macros file so the plugins will have the good values for theconnction. So update the /etc/shinken/resource.cfg file or c:\shinken\etc\resource.cfg file to setup the new password:
$ORACLEUSER$=shinken$ORACLEPASSWORD$=shinkenpassword
13.14.8 Creating an alias definition for Oracle databases
First, you have to create a tnsnames.ora config file on the shinken server that will contain the alias definition for PRODdatabase:
linux:~ # mkdir -p /usr/lib/oracle/11.2/client64/network/adminlinux:~ # vim /usr/lib/oracle/11.2/client64/network/admin/tnsnames.oraPROD =(DESCRIPTION =
(ADDRESS = (PROTOCOL = TCP)(HOST = 192.168.0.X)(PORT = 1521))(CONNECT_DATA =(SERVER = DEDICATED)(SERVICE_NAME = PROD)
))
:wq
Note that you have to declare all databases that you want to monitor with Shinken in this file. For example, if youwant to monitor ERP and FINANCE databases, your config file will look like this:
ERP =(DESCRIPTION =
(ADDRESS = (PROTOCOL = TCP)(HOST = 192.168.0.X)(PORT = 1521))(CONNECT_DATA =(SERVER = DEDICATED)(SERVICE_NAME = ERP)
))
13.14. Monitoring Oracle databases 385

Shinken Documentation, Release 2.4
FINANCE =(DESCRIPTION =
(ADDRESS = (PROTOCOL = TCP)(HOST = 192.168.0.X)(PORT = 1521))(CONNECT_DATA =(SERVER = DEDICATED)(SERVICE_NAME = FINANCE)
))
Then, you need define an environment variable that will contain the path of this file with also all others variablesrelated to sqlplus:
linux:~ # vi /etc/profile.d/oracle.sh
export PATH=$PATH:/usr/lib/oracle/11.2/client64export LD_LIBRARY_PATH=/usr/lib/oracle/11.2/client64/libexport ORACLE_HOME=/usr/lib/oracle/11.2/client64export TNS_ADMIN=$ORACLE_HOME/network/admin
:wq
Adjust rights on the oracle client directory:
linux:~ # chown -R shinken:shinken /usr/lib/oracle
Optionally, we may have to force loading the oracle client lib like this:
linux:~ # vi /etc/ld.so.conf.d/oracle.conf/usr/lib/oracle/11.2/client64/lib:wqlinux:~ # ldconfig
Test the connection
To see if the connection to the database named PROD is ok, just launch:
/var/lib/nagios/plugins/check_oracle_health --connect "PROD" --hostname srv-lin-1 --username shinken --password shinkenpassword --mode connection-time
It should not return errors.
Edit shinken init script
Now, you have to edit the shinken init script for loading this new environment:
linux:~ # vim /etc/init.d/shinken(...)NAME="shinken"
AVAIL_MODULES="scheduler poller reactionner broker receiver arbiter skonf"
# Load environment variables. /etc/profile.d/oracle.sh
## SHINKEN_MODULE_FILE is set by shinken-* if it's one of these that's calling us.(...)
386 Chapter 13. How to monitor ...
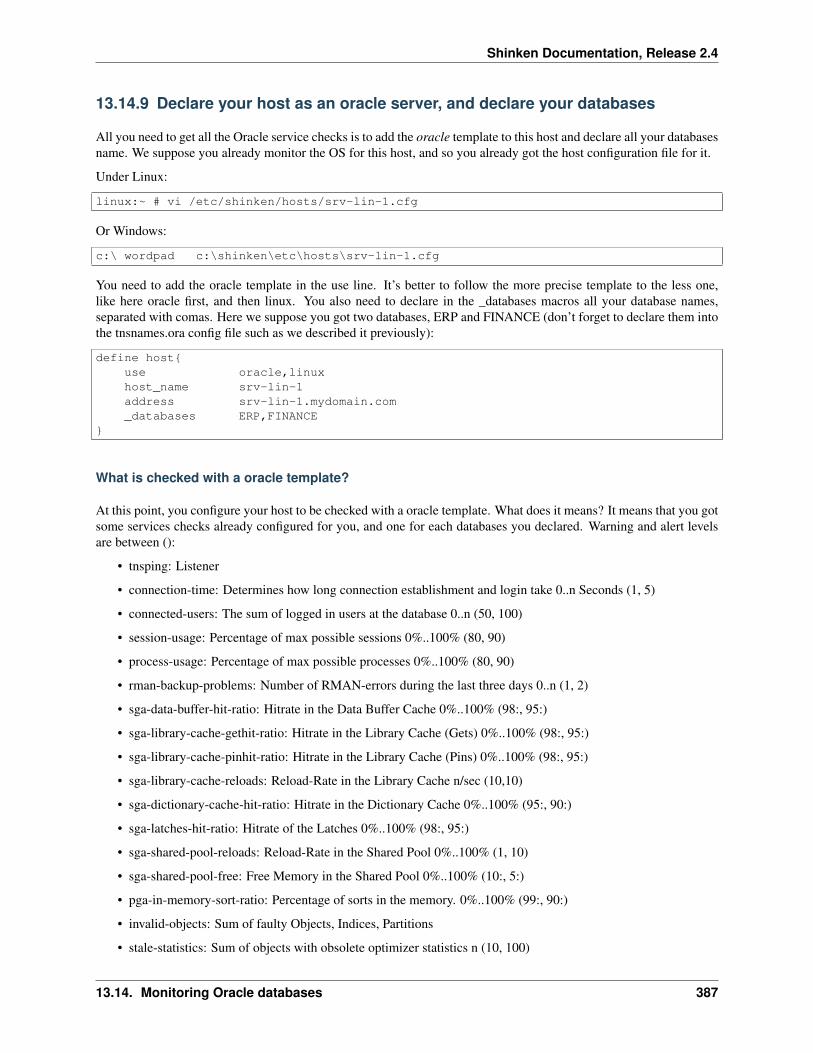
Shinken Documentation, Release 2.4
13.14.9 Declare your host as an oracle server, and declare your databases
All you need to get all the Oracle service checks is to add the oracle template to this host and declare all your databasesname. We suppose you already monitor the OS for this host, and so you already got the host configuration file for it.
Under Linux:
linux:~ # vi /etc/shinken/hosts/srv-lin-1.cfg
Or Windows:
c:\ wordpad c:\shinken\etc\hosts\srv-lin-1.cfg
You need to add the oracle template in the use line. It’s better to follow the more precise template to the less one,like here oracle first, and then linux. You also need to declare in the _databases macros all your database names,separated with comas. Here we suppose you got two databases, ERP and FINANCE (don’t forget to declare them intothe tnsnames.ora config file such as we described it previously):
define host{use oracle,linuxhost_name srv-lin-1address srv-lin-1.mydomain.com_databases ERP,FINANCE
}
What is checked with a oracle template?
At this point, you configure your host to be checked with a oracle template. What does it means? It means that you gotsome services checks already configured for you, and one for each databases you declared. Warning and alert levelsare between ():
• tnsping: Listener
• connection-time: Determines how long connection establishment and login take 0..n Seconds (1, 5)
• connected-users: The sum of logged in users at the database 0..n (50, 100)
• session-usage: Percentage of max possible sessions 0%..100% (80, 90)
• process-usage: Percentage of max possible processes 0%..100% (80, 90)
• rman-backup-problems: Number of RMAN-errors during the last three days 0..n (1, 2)
• sga-data-buffer-hit-ratio: Hitrate in the Data Buffer Cache 0%..100% (98:, 95:)
• sga-library-cache-gethit-ratio: Hitrate in the Library Cache (Gets) 0%..100% (98:, 95:)
• sga-library-cache-pinhit-ratio: Hitrate in the Library Cache (Pins) 0%..100% (98:, 95:)
• sga-library-cache-reloads: Reload-Rate in the Library Cache n/sec (10,10)
• sga-dictionary-cache-hit-ratio: Hitrate in the Dictionary Cache 0%..100% (95:, 90:)
• sga-latches-hit-ratio: Hitrate of the Latches 0%..100% (98:, 95:)
• sga-shared-pool-reloads: Reload-Rate in the Shared Pool 0%..100% (1, 10)
• sga-shared-pool-free: Free Memory in the Shared Pool 0%..100% (10:, 5:)
• pga-in-memory-sort-ratio: Percentage of sorts in the memory. 0%..100% (99:, 90:)
• invalid-objects: Sum of faulty Objects, Indices, Partitions
• stale-statistics: Sum of objects with obsolete optimizer statistics n (10, 100)
13.14. Monitoring Oracle databases 387
Shinken Documentation, Release 2.4
• tablespace-usage: Used diskspace in the tablespace 0%..100% (90, 98)
• tablespace-free: Free diskspace in the tablespace 0%..100% (5:, 2:)
• tablespace-fragmentation: Free Space Fragmentation Index 100..1 (30:, 20:)
• tablespace-io-balanc: IO-Distribution under the datafiles of a tablespace n (1.0, 2.0)
• tablespace-remaining-time: Sum of remaining days until a tablespace is used by 100%. The rate of increasewill be calculated with the values from the last 30 days. (With the parameter –lookback different periods can bespecified) Days (90:, 30:)
• tablespace-can-allocate-next: Checks if there is enough free tablespace for the next Extent.
• flash-recovery-area-usage: Used diskspace in the flash recovery area 0%..100% (90, 98)
• flash-recovery-area-free: Free diskspace in the flash recovery area 0%..100% (5:, 2:)
• datafile-io-traffic: Sum of IO-Operationes from Datafiles per second n/sec (1000, 5000)
• datafiles-existing: Percentage of max possible datafiles 0%..100% (80, 90)
• soft-parse-ratio: Percentage of soft-parse-ratio 0%..100%
• switch-interval: Interval between RedoLog File Switches 0..n Seconds (600:, 60:)
• retry-ratio: Retry-Rate in the RedoLog Buffer 0%..100% (1, 10)
• redo-io-traffic: Redolog IO in MB/sec n/sec (199,200)
• roll-header-contention: Rollback Segment Header Contention 0%..100% (1, 2)
• roll-block-contention: Rollback Segment Block Contention 0%..100% (1, 2)
• roll-hit-ratio: Rollback Segment gets/waits Ratio 0%..100% (99:, 98:)
• roll-extends: Rollback Segment Extends n, n/sec (1, 100)
• roll-wraps: Rollback Segment Wraps n, n/sec (1, 100)
• seg-top10-logical-reads: Sum of the userprocesses under the top 10 logical reads n (1, 9)
• seg-top10-physical-reads: Sum of the userprocesses under the top 10 physical reads n (1, 9)
• seg-top10-buffer-busy-waits: Sum of the userprocesses under the top 10 buffer busy waits n (1, 9)
• seg-top10-row-lock-waits: Sum of the userprocesses under the top 10 row lock waits n (1, 9)
• event-waits: Waits/sec from system events n/sec (10,100)
• event-waiting: How many percent of the elapsed time has an event spend with waiting 0%..100% (0.1,0.5)
• enqueue-contention: Enqueue wait/request-Ratio 0%..100% (1, 10)
• enqueue-waiting: How many percent of the elapsed time since the last run has an Enqueue spend with waiting0%..100% (0.00033,0.0033)
• latch-contention: Latch misses/gets-ratio. With –name a Latchname or Latchnumber can be passed over. (Seelist-latches) 0%..100% (1,2)
• latch-waiting: How many percent of the elapsed time since the last run has a Latch spend with waiting 0%..100%(0.1,1)
• sysstat: Changes/sec for any value from v$sysstat n/sec (10,10)
388 Chapter 13. How to monitor ...
Shinken Documentation, Release 2.4
13.14.10 Restarting Shinken
You’re done with modifying the Shiknen configuration, so you’ll need to verify your configuration files and restartShinken.
If the verification process produces any errors messages, fix your configuration file before continuing. Make sure thatyou don’t (re)start Shinken until the verification process completes without any errors!
13.15 Monitoring Printers
Abstract
This document describes how you can monitor a printer. Specifically, HP™ printers that have internal/external JetDi-rect® cards/devices, or other print servers (like the Troy™ PocketPro 100S® or the Netgear™ PS101®) that supportthe JetDirect protocol.
The check_hpjd plugin (which is part of the standard Nagios/Shinken plugins distribution) allows you to monitor thestatus of JetDirect-capable printers which have “SNMP” enabled. The plugin is capable of detecting the followingprinter states:
• Paper Jam
• Out of Paper
• Printer Offline
• Intervention Required
• Toner Low
• Insufficient Memory
• Open Door
• Output Tray is Full
• and more...
13.15.1 Introduction
These instructions assume that you’ve installed Shinken according to the Installation tutorial. The sample configura-tion entries below reference objects that are defined in the sample config files (“commands.cfg”, “templates.cfg”, etc.)that are installed if you follow the quickstart.
13.15. Monitoring Printers 389

Shinken Documentation, Release 2.4
13.15.2 Overview
Monitoring the status of a networked printer is pretty simple. JetDirect-enabled printers usually have “SNMP” enabled,which allows Shinken to monitor their status using the check_hpjd plugin.
The check_hpjd plugin will only get compiled and installed if you have the net-snmp and net-snmp-utils packagesinstalled on your system. Make sure the plugin exists in “/var/lib/nagios/” before you continue. If it doesn’t, installnet-snmp and net-snmp-utils and recompile/reinstall the Nagios plugins.
13.15.3 Steps
There are some steps you’ll need to follow in order to monitor a new printer machine. They are:
• Create new host definition for monitoring this machine
• Restart the Shinken daemon
13.15.4 What’s Already Done For You
To make your life a bit easier, a few configuration tasks have already been done for you:
• A check_hpjd command definition has been added to the “commands.cfg” file. This allows you to use thecheck_hpjd plugin to monitor network printers.
• A printer host template (called printer) has already been created in the “templates.cfg” file. This allows you toadd new printer host definitions in a simple manner.
The above-mentioned config files can be found in the ///etc/shinken/// directory (or c:shinkenetc under windows).You can modify the definitions in these and other definitions to suit your needs better if you’d like. However, I’drecommend waiting until you’re more familiar with configuring Shinken before doing so. For the time being, justfollow the directions outlined below and you’ll be monitoring your printers in no time.
Tip: We are supposing here that the printer machine you want to monitor is named printer-1. Please change the abovelines and commands with the real name of your printer of course.
13.15.5 Declare your new printer in Shinken
Now it’s time to define some object definitions in your Shinken configuration files in order to monitor the new Linuxmachine.
You can add the new host definition in an existing configuration file, but it’s a good idea to have one file by host, itwill be easier to manage in the future. So create a file with the name of your server.
Under Linux:
390 Chapter 13. How to monitor ...

Shinken Documentation, Release 2.4
linux:~ # vi /etc/shinken/hosts/printer-1.cfg
Or Windows:
c:\ wordpad c:\shinken\etc\hosts\printer-1.cfg
You need to add a new host definition for the Linux machine that you’re going to monitor. Just copy/paste the abovedefinition Change the “host_name”, and “address” fields to appropriate values for this machine.
define host{use printerhost_name printer-1address 192.160.0.1
}
* The use printer is the "template" line. It mean that this host will **inherits** properties from the printer template.
* the host_name is the object name of your host. It must be **unique**.
* the address is the network address of your printer. It can be a FQDN or an IP.
What is checked with a printer template?
At this point, you configure your host to be checked with a printer template. What does it means? It means that yougot some checks already configured for you:
• printer check each 5 minutes: check with a ping that the printer is UP
Note: TODO: fill what is checked with HPJD
13.15.6 Restarting Shinken
You’re done with modifying the Shinken configuration, so you will need to verify your configuration files and restartShinken.
If the verification process produces any errors messages, fix your configuration file before continuing. Make sure thatyou don’t (re)start Shinken until the verification process completes without any errors!
13.16 Monitoring Publicly Available Services
Abstract
This document describes how you can monitor publicly available services, applications and protocols. By “public” Imean services that are accessible across the network - either the local network or Internet. Examples of public servicesinclude “HTTP”, “POP3”, “IMAP”, “FTP”, and “SSH”. There are many more public services that you probably useon a daily basis. These services and applications, as well as their underlying protocols, can usually be monitored byShinken without any special access requirements.
13.16.1 Introduction
Private services, in contrast, cannot be monitored with Shinken without an intermediary agent of some kind. Examplesof private services associated with hosts are things like CPU load, memory usage, disk usage, current user count,process information, etc.
13.16. Monitoring Publicly Available Services 391

Shinken Documentation, Release 2.4
These instructions assume that you’ve installed Shinken according to the Installation tutorial. The sample configura-tion entries below reference objects that are defined in the sample config files (“commands.cfg”, “templates.cfg”, etc.)that are installed if you followed the quickstart.
13.16.2 Plugins For Monitoring Services
When you find yourself needing to monitor a particular application, service, or protocol, chances are good that a pluginexists to monitor it. The official Nagios/Shinken plugins distribution comes with plugins that can be used to monitora variety of services and protocols. There are also a large number of contributed plugins that can be found in the“contrib/” subdirectory of the plugin distribution. The Monitoringexchange.org website hosts a number of additionalplugins that have been written by users, so check it out when you have a chance.
If you don’t happen to find an appropriate plugin for monitoring what you need, you can always write your own.Plugins are easy to write, so don’t let this thought scare you off. Read the documentation on developing plugins formore information.
I’ll walk you through monitoring some basic services that you’ll probably use sooner or later. Each of these servicescan be monitored using one of the plugins that gets installed as part of the Nagios/Shinken plugins distribution. Let’sget started...
13.16.3 The host definition
Before you can monitor a service, you first need to define a host that is associated with the service. If you follow thewindows/linux/printer monitoring tutorial, you should be familiar with the process of creating a host and linking yourservices to it.
For this example, lets say you want to monitor a variety of services on a remote windows host. Let’s call that hostsrv-win-1. The host definition can be placed in its own file. Here’s what the host definition for remotehost might looklike if you followed the windows monitoring tutorial:
define host{use windowshost_name srv-win-1address srv-win-1.mydomain.com
}
13.16.4 Classic services definition with templates
For classic services like HTTP(s) or FTP, there are some ready to run template that you can use. The full servicedefinition is explained in another tutorial Services definitions.
The idea here is just to tag your host with what it is providing as network services and automatically get some defaultchecks like Http or Ftp ones.
13.16.5 Monitoring HTTP
Chances are you’re going to want to monitor web servers at some point - either yours or someone else’s. Thecheck_http plugin is designed to do just that. It understands the “HTTP” protocol and can monitor response time,error codes, strings in the returned HTML, server certificates, and much more.
There is already a http template for your host that will create for you a Http service. All you need is to add this templateon your host, with a comma for separating templates.
So you host definition will now look like:
392 Chapter 13. How to monitor ...
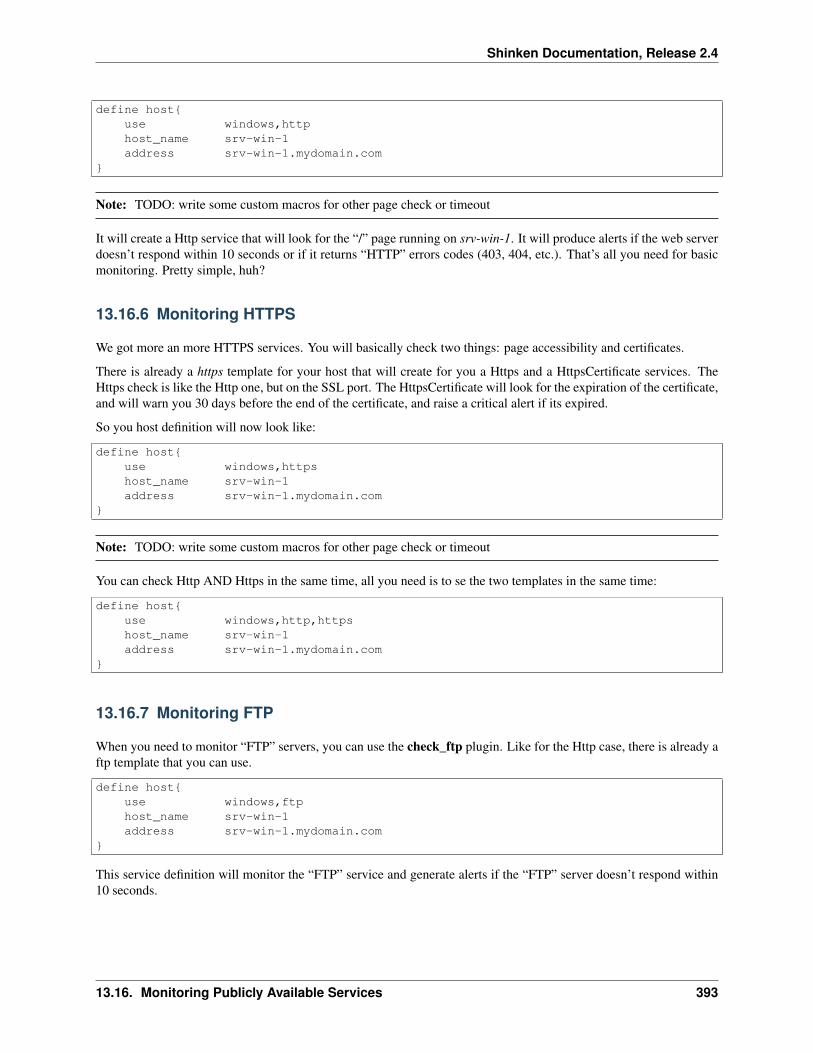
Shinken Documentation, Release 2.4
define host{use windows,httphost_name srv-win-1address srv-win-1.mydomain.com
}
Note: TODO: write some custom macros for other page check or timeout
It will create a Http service that will look for the “/” page running on srv-win-1. It will produce alerts if the web serverdoesn’t respond within 10 seconds or if it returns “HTTP” errors codes (403, 404, etc.). That’s all you need for basicmonitoring. Pretty simple, huh?
13.16.6 Monitoring HTTPS
We got more an more HTTPS services. You will basically check two things: page accessibility and certificates.
There is already a https template for your host that will create for you a Https and a HttpsCertificate services. TheHttps check is like the Http one, but on the SSL port. The HttpsCertificate will look for the expiration of the certificate,and will warn you 30 days before the end of the certificate, and raise a critical alert if its expired.
So you host definition will now look like:
define host{use windows,httpshost_name srv-win-1address srv-win-1.mydomain.com
}
Note: TODO: write some custom macros for other page check or timeout
You can check Http AND Https in the same time, all you need is to se the two templates in the same time:
define host{use windows,http,httpshost_name srv-win-1address srv-win-1.mydomain.com
}
13.16.7 Monitoring FTP
When you need to monitor “FTP” servers, you can use the check_ftp plugin. Like for the Http case, there is already aftp template that you can use.
define host{use windows,ftphost_name srv-win-1address srv-win-1.mydomain.com
}
This service definition will monitor the “FTP” service and generate alerts if the “FTP” server doesn’t respond within10 seconds.
13.16. Monitoring Publicly Available Services 393
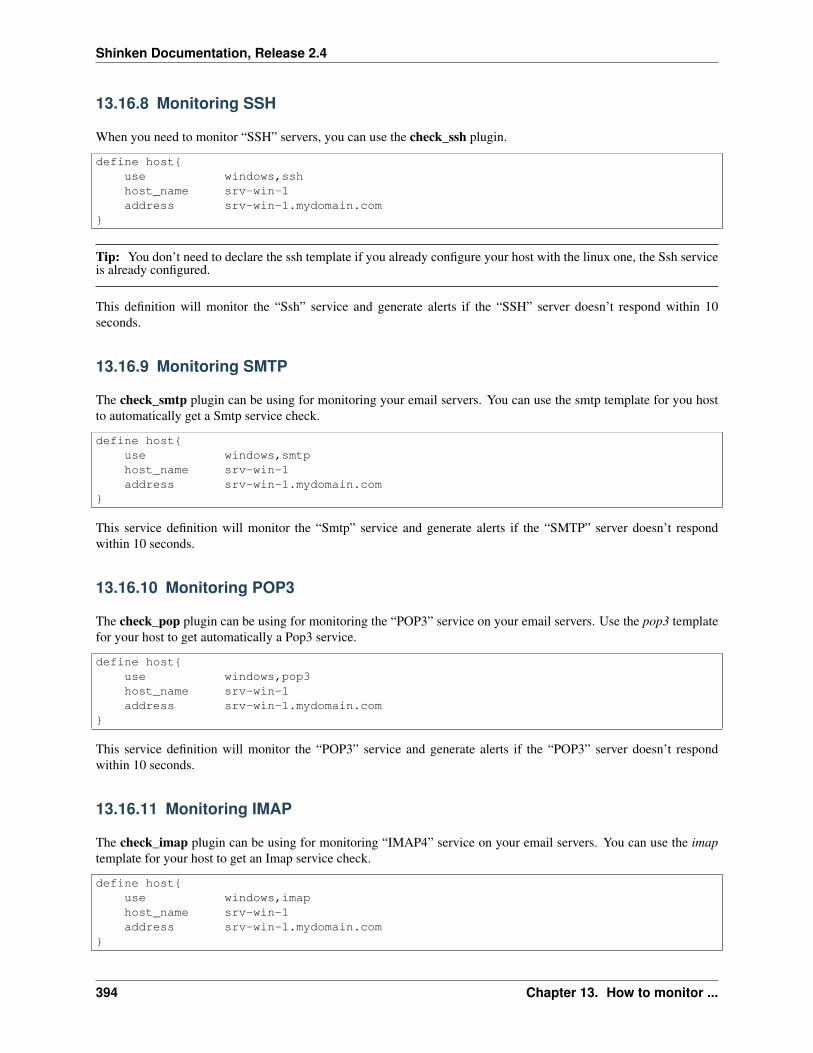
Shinken Documentation, Release 2.4
13.16.8 Monitoring SSH
When you need to monitor “SSH” servers, you can use the check_ssh plugin.
define host{use windows,sshhost_name srv-win-1address srv-win-1.mydomain.com
}
Tip: You don’t need to declare the ssh template if you already configure your host with the linux one, the Ssh serviceis already configured.
This definition will monitor the “Ssh” service and generate alerts if the “SSH” server doesn’t respond within 10seconds.
13.16.9 Monitoring SMTP
The check_smtp plugin can be using for monitoring your email servers. You can use the smtp template for you hostto automatically get a Smtp service check.
define host{use windows,smtphost_name srv-win-1address srv-win-1.mydomain.com
}
This service definition will monitor the “Smtp” service and generate alerts if the “SMTP” server doesn’t respondwithin 10 seconds.
13.16.10 Monitoring POP3
The check_pop plugin can be using for monitoring the “POP3” service on your email servers. Use the pop3 templatefor your host to get automatically a Pop3 service.
define host{use windows,pop3host_name srv-win-1address srv-win-1.mydomain.com
}
This service definition will monitor the “POP3” service and generate alerts if the “POP3” server doesn’t respondwithin 10 seconds.
13.16.11 Monitoring IMAP
The check_imap plugin can be using for monitoring “IMAP4” service on your email servers. You can use the imaptemplate for your host to get an Imap service check.
define host{use windows,imaphost_name srv-win-1address srv-win-1.mydomain.com
}
394 Chapter 13. How to monitor ...
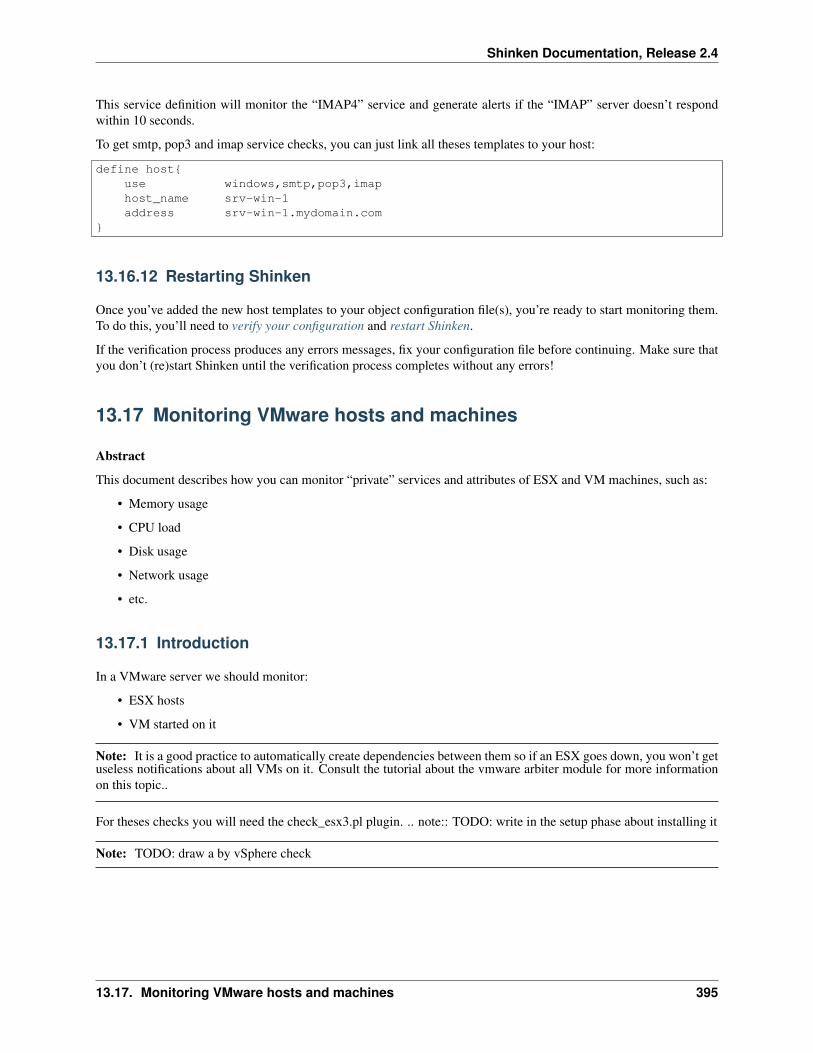
Shinken Documentation, Release 2.4
This service definition will monitor the “IMAP4” service and generate alerts if the “IMAP” server doesn’t respondwithin 10 seconds.
To get smtp, pop3 and imap service checks, you can just link all theses templates to your host:
define host{use windows,smtp,pop3,imaphost_name srv-win-1address srv-win-1.mydomain.com
}
13.16.12 Restarting Shinken
Once you’ve added the new host templates to your object configuration file(s), you’re ready to start monitoring them.To do this, you’ll need to verify your configuration and restart Shinken.
If the verification process produces any errors messages, fix your configuration file before continuing. Make sure thatyou don’t (re)start Shinken until the verification process completes without any errors!
13.17 Monitoring VMware hosts and machines
Abstract
This document describes how you can monitor “private” services and attributes of ESX and VM machines, such as:
• Memory usage
• CPU load
• Disk usage
• Network usage
• etc.
13.17.1 Introduction
In a VMware server we should monitor:
• ESX hosts
• VM started on it
Note: It is a good practice to automatically create dependencies between them so if an ESX goes down, you won’t getuseless notifications about all VMs on it. Consult the tutorial about the vmware arbiter module for more informationon this topic..
For theses checks you will need the check_esx3.pl plugin. .. note:: TODO: write in the setup phase about installing it
Note: TODO: draw a by vSphere check
13.17. Monitoring VMware hosts and machines 395

Shinken Documentation, Release 2.4
13.17.2 Steps
There are some steps you’ll need to follow in order to monitor a new vmware esx/vm machine. They are:
• Create an account on the vsphere console server
• Configure your vsphere server in Shinken
• Create new host definition for monitoring an esx server
• Create new host definition for monitoring a vm machine
• Restart the Shinken daemon
13.17.3 What’s already done for you
To make your life a bit easier, a few configuration tasks have already been done for you:
• Some check_esx_ commands definition has been added to the “commands.cfg” file.
• A VMware ESX host template (called “esx”) has already been created in the “templates.cfg” file. This allowsyou to add new host definitions in a simple manner.
• A VMware virtual machine host template (called “vm”) has already been created in the templates.cfg file.
The above-mentioned config files can be found in the ///etc/shinken/// directory (or c:shinkenetc under windows).You can modify the definitions in these and other definitions to suit your needs better if you’d like. However, I’drecommend waiting until you’re more familiar with configuring Shinken before doing so. For the time being, justfollow the directions outlined below and you’ll be monitoring your VMware boxes in no time.
Tip: We are supposing here that the esx machine you want to monitor is named srv-esx-1 and the virtual machine isa windows vm named srv-vm-1. Please change the above lines and commands with the real name of your server ofcourse.
13.17.4 Create a vSphere account for Shinken
Please ask your VMware administrator to create a Shinken account (can be a windows domain account) and give itread credential on the vSphere environment (on the root datacenter definition with inheritance).
13.17.5 Setup the vSphere console server connection
You need to configure in the “resource.cfg” file (“/etc/shinken/resource.cfg” under linux or“c:\shinken\etc\resource.cfg” under windows):
• the VSPHERE host connection
• the login for the connection
• the password
#### vSphere (ESX) part$VCENTER$=vcenter.mydomain.com$VCENTERLOGIN$=someuser$VCENTERPASSWORD$=somepassowrd
You can then try the connection if you already know about an esx host, like for example myesx:
396 Chapter 13. How to monitor ...

Shinken Documentation, Release 2.4
/var/lib/nagios/plugins/check_esx3.pl -D vcenter.mydomain.com -H myesx -u someuser -p somepassword -l cpu
Deploy the public keys on the linux host
When you got the public/private keys, you can deploy the public key to you linux servers.
ssh-copy-id -i /home/shinken/.ssh/id_rsa.pub shinken@srv-lin-1
Tip: Change srv-lin-1 with the name of your server.
Test the connection
To see if the keys are working, just launch:
check_by_ssh -H srv-lin-1 -C uptime
It should give you the uptime of the srv-lin-1 machine.
13.17.6 Declare your new host in Shinken
Now it’s time to define some object definitions in your Shinken configuration files in order to monitor the new Linuxmachine.
You can add the new host definition in an existing configuration file, but it’s a good idea to have one file by host, itwill be easier to manage in the future. So create a file with the name of your server.
Under Linux:
linux:~ # vi /etc/shinken/hosts/srv-lin-1.cfg
Or Windows:
c:\ wordpad c:\shinken\etc\hosts\srv-lin-1.cfg
You need to add a new host definition for the Linux machine that you’re going to monitor. Just copy/paste the abovedefinition Change the “host_name”, and “address” fields to appropriate values for this machine.
define host{use esxhost_name srv-lin-1address srv-lin-1.mydomain.com
}
* The use linux is the "template" line. It mean that this host will **inherits** properties from the linux template.
* the host_name is the object name of your host. It must be **unique**.
* the address is the network address of your linux server.
What is supervised by the linux template?
You have configured your host to the checks defined from the linux template. What does this mean? It means that youhave some checks pre-configured for you:
• host check each 5 minutes: check with a ping that the server is UP
13.17. Monitoring VMware hosts and machines 397
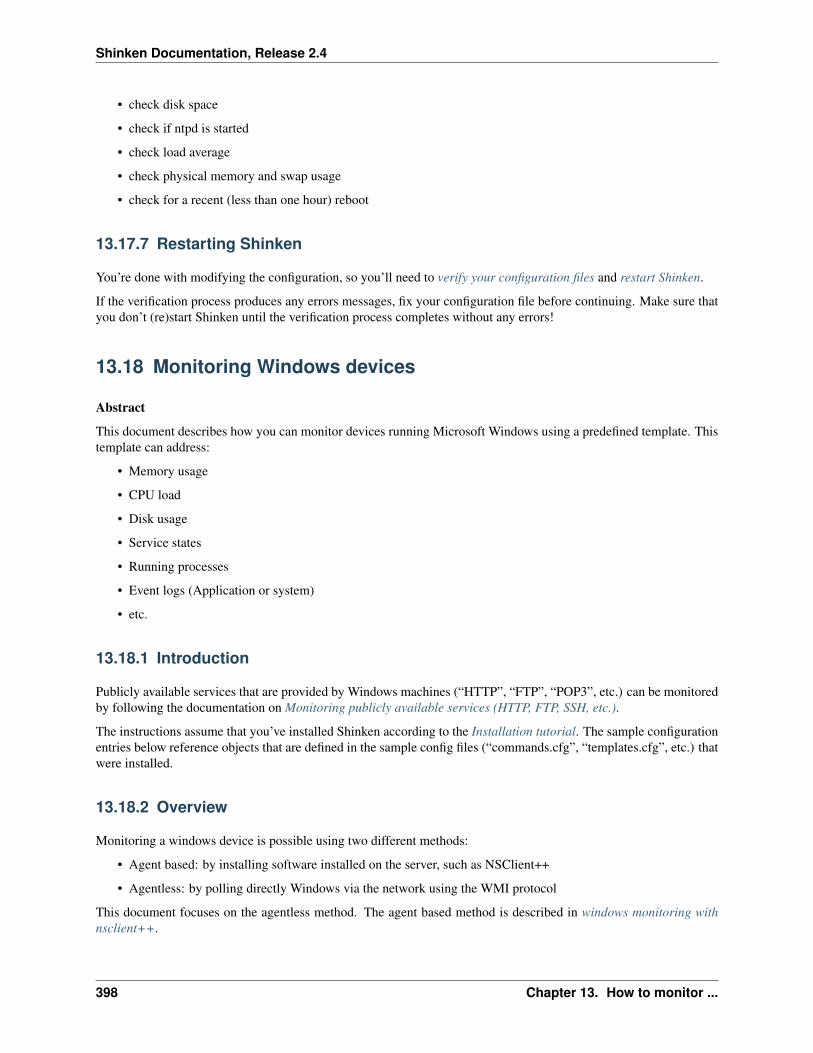
Shinken Documentation, Release 2.4
• check disk space
• check if ntpd is started
• check load average
• check physical memory and swap usage
• check for a recent (less than one hour) reboot
13.17.7 Restarting Shinken
You’re done with modifying the configuration, so you’ll need to verify your configuration files and restart Shinken.
If the verification process produces any errors messages, fix your configuration file before continuing. Make sure thatyou don’t (re)start Shinken until the verification process completes without any errors!
13.18 Monitoring Windows devices
Abstract
This document describes how you can monitor devices running Microsoft Windows using a predefined template. Thistemplate can address:
• Memory usage
• CPU load
• Disk usage
• Service states
• Running processes
• Event logs (Application or system)
• etc.
13.18.1 Introduction
Publicly available services that are provided by Windows machines (“HTTP”, “FTP”, “POP3”, etc.) can be monitoredby following the documentation on Monitoring publicly available services (HTTP, FTP, SSH, etc.).
The instructions assume that you’ve installed Shinken according to the Installation tutorial. The sample configurationentries below reference objects that are defined in the sample config files (“commands.cfg”, “templates.cfg”, etc.) thatwere installed.
13.18.2 Overview
Monitoring a windows device is possible using two different methods:
• Agent based: by installing software installed on the server, such as NSClient++
• Agentless: by polling directly Windows via the network using the WMI protocol
This document focuses on the agentless method. The agent based method is described in windows monitoring withnsclient++.
398 Chapter 13. How to monitor ...

Shinken Documentation, Release 2.4
13.18.3 Prerequisites
Have a valid account on the Microsoft Windows device (local or domain account) you will monitor using WMI queries.
13.18.4 Steps
There are several steps you’ll need to follow in order to monitor a Microsoft Windows device.
• Install check_wmi_plus plugin on the server running your poller daemons
• Setup an account on the monitored windows server for the WMI queries
• Declare your windows host in the configuration
• Restart the Shinken Arbiter
13.18.5 What’s Already Been Done For You
To make your life a bit easier, configuration templates are provided as a starting point:
• A selection of check_windows based command definitions have been added to the “commands.cfg” file. Thisallows you to use the check_wmi_plus plugin.
• A Windows host template (called “windows”) is included the “templates.cfg” file. This allows you to add newWindows host definitions in a simple manner.
The above-mentioned config files can be found in the /etc/shinken/packs/os/windows/ directory. You can modify thedefinitions in these and other templates to suit your needs. However, wait until you’re more familiar with Shinkenbefore doing so. For the time being, just follow the directions outlined below and you will be monitoring yourWindows devices in no time.
13.18.6 Setup the check_wmi_plus plugin
The plugin used for windows agent less monitoring is check_wmi_plus. Download the last version of check_wmi_plusavailable on the Check WMI Plus website
13.18.7 Setup a windows account for WMI queries
TODO: write on using less than server admin
You need to configure your user account int the /etc/shinken/resources.cfg file or the c:shinkenetcresource.cfg fileunder windows with the one you just configured:
$DOMAINUSER$=shinken_user$DOMAINPASSWORD$=superpassword
Tip: You can also consult the Nagios documentation which provides a very helpful write up on setting up the domainaccount and assigning permissions. Monitoring_Windows_Using_WMI.pdf
13.18. Monitoring Windows devices 399
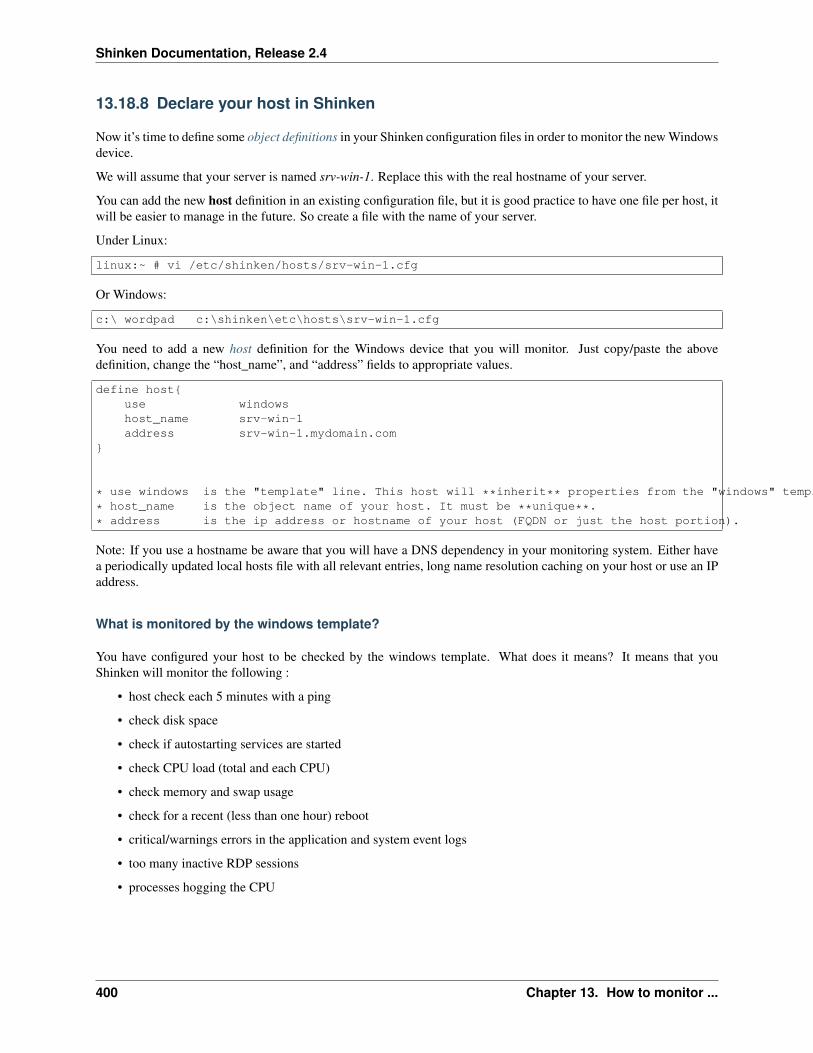
Shinken Documentation, Release 2.4
13.18.8 Declare your host in Shinken
Now it’s time to define some object definitions in your Shinken configuration files in order to monitor the new Windowsdevice.
We will assume that your server is named srv-win-1. Replace this with the real hostname of your server.
You can add the new host definition in an existing configuration file, but it is good practice to have one file per host, itwill be easier to manage in the future. So create a file with the name of your server.
Under Linux:
linux:~ # vi /etc/shinken/hosts/srv-win-1.cfg
Or Windows:
c:\ wordpad c:\shinken\etc\hosts\srv-win-1.cfg
You need to add a new host definition for the Windows device that you will monitor. Just copy/paste the abovedefinition, change the “host_name”, and “address” fields to appropriate values.
define host{use windowshost_name srv-win-1address srv-win-1.mydomain.com
}
* use windows is the "template" line. This host will **inherit** properties from the "windows" template.
* host_name is the object name of your host. It must be **unique**.
* address is the ip address or hostname of your host (FQDN or just the host portion).
Note: If you use a hostname be aware that you will have a DNS dependency in your monitoring system. Either havea periodically updated local hosts file with all relevant entries, long name resolution caching on your host or use an IPaddress.
What is monitored by the windows template?
You have configured your host to be checked by the windows template. What does it means? It means that youShinken will monitor the following :
• host check each 5 minutes with a ping
• check disk space
• check if autostarting services are started
• check CPU load (total and each CPU)
• check memory and swap usage
• check for a recent (less than one hour) reboot
• critical/warnings errors in the application and system event logs
• too many inactive RDP sessions
• processes hogging the CPU
400 Chapter 13. How to monitor ...
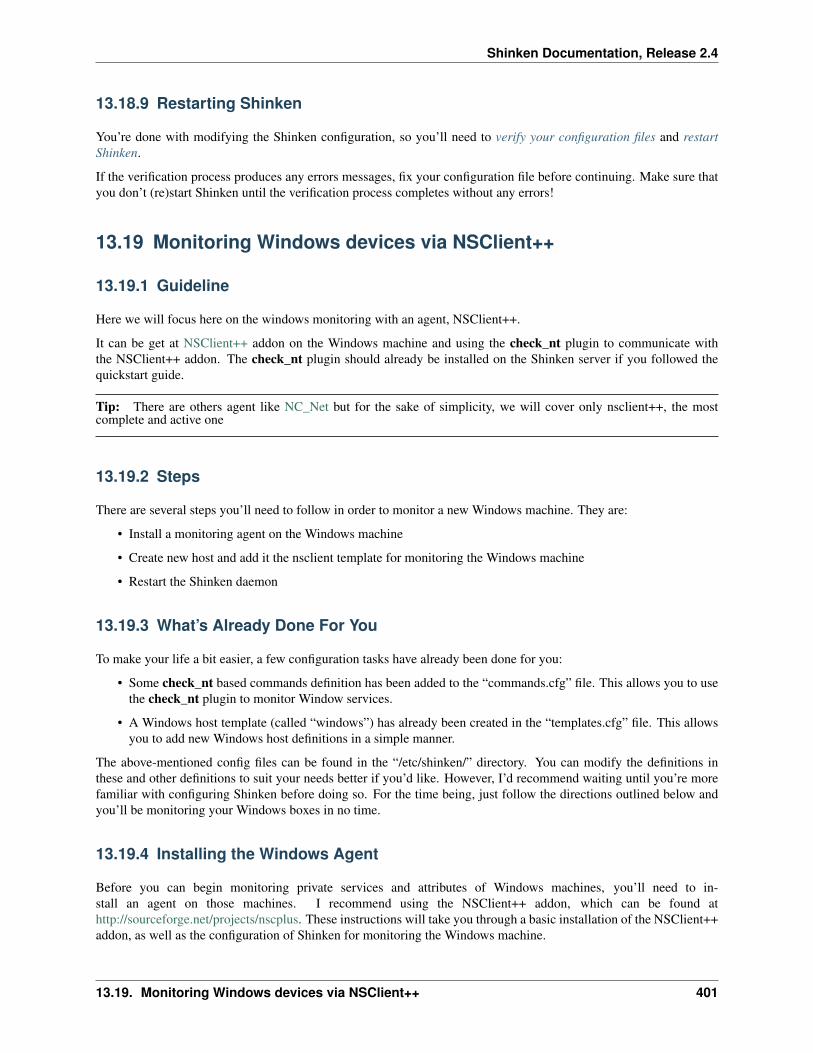
Shinken Documentation, Release 2.4
13.18.9 Restarting Shinken
You’re done with modifying the Shinken configuration, so you’ll need to verify your configuration files and restartShinken.
If the verification process produces any errors messages, fix your configuration file before continuing. Make sure thatyou don’t (re)start Shinken until the verification process completes without any errors!
13.19 Monitoring Windows devices via NSClient++
13.19.1 Guideline
Here we will focus here on the windows monitoring with an agent, NSClient++.
It can be get at NSClient++ addon on the Windows machine and using the check_nt plugin to communicate withthe NSClient++ addon. The check_nt plugin should already be installed on the Shinken server if you followed thequickstart guide.
Tip: There are others agent like NC_Net but for the sake of simplicity, we will cover only nsclient++, the mostcomplete and active one
13.19.2 Steps
There are several steps you’ll need to follow in order to monitor a new Windows machine. They are:
• Install a monitoring agent on the Windows machine
• Create new host and add it the nsclient template for monitoring the Windows machine
• Restart the Shinken daemon
13.19.3 What’s Already Done For You
To make your life a bit easier, a few configuration tasks have already been done for you:
• Some check_nt based commands definition has been added to the “commands.cfg” file. This allows you to usethe check_nt plugin to monitor Window services.
• A Windows host template (called “windows”) has already been created in the “templates.cfg” file. This allowsyou to add new Windows host definitions in a simple manner.
The above-mentioned config files can be found in the “/etc/shinken/” directory. You can modify the definitions inthese and other definitions to suit your needs better if you’d like. However, I’d recommend waiting until you’re morefamiliar with configuring Shinken before doing so. For the time being, just follow the directions outlined below andyou’ll be monitoring your Windows boxes in no time.
13.19.4 Installing the Windows Agent
Before you can begin monitoring private services and attributes of Windows machines, you’ll need to in-stall an agent on those machines. I recommend using the NSClient++ addon, which can be found athttp://sourceforge.net/projects/nscplus. These instructions will take you through a basic installation of the NSClient++addon, as well as the configuration of Shinken for monitoring the Windows machine.
13.19. Monitoring Windows devices via NSClient++ 401

Shinken Documentation, Release 2.4
• Download the latest stable version of the NSClient++ addon from http://sourceforge.net/projects/nscplus
• Unzip the NSClient++ files into a new C:NSClient++ directory
• Open a command prompt and change to the C:NSClient++ directory
• Register the NSClient++ system service with the following command (as an administrator):
cd C:\NSClient++nsclient++ /install
You can install the NSClient++ systray with the following command (‘SysTray’ is case-sensitive):
nsclient++ SysTray
Open the services manager and make sure the NSClientpp service is allowed to interact with the desktop (see the ‘LogOn’ tab of the services manager). If it isn’t already allowed to interact with the desktop, check the box to allow it to.
Edit the “NSC.INI file” (located in the “C:NSClient++” directory) and make the following changes:
• Uncomment all the modules listed in the [modules] section, except for “CheckWMI.dll” and “RemoteConfigu-ration.dll”
• Optionally require a password for clients by changing the “password” option in the [Settings] section.
• Uncomment the “allowed_hosts” option in the [Settings] section. Add the IP address of the Shinken server (oryou pollers serbers for a multi-host setup) to this line, or leave it blank to allow all hosts to connect.
• Make sure the “port” option in the [NSClient] section is uncommented and set to ‘12489’ (the default port).
Start the NSClient++ service with the following command:
402 Chapter 13. How to monitor ...
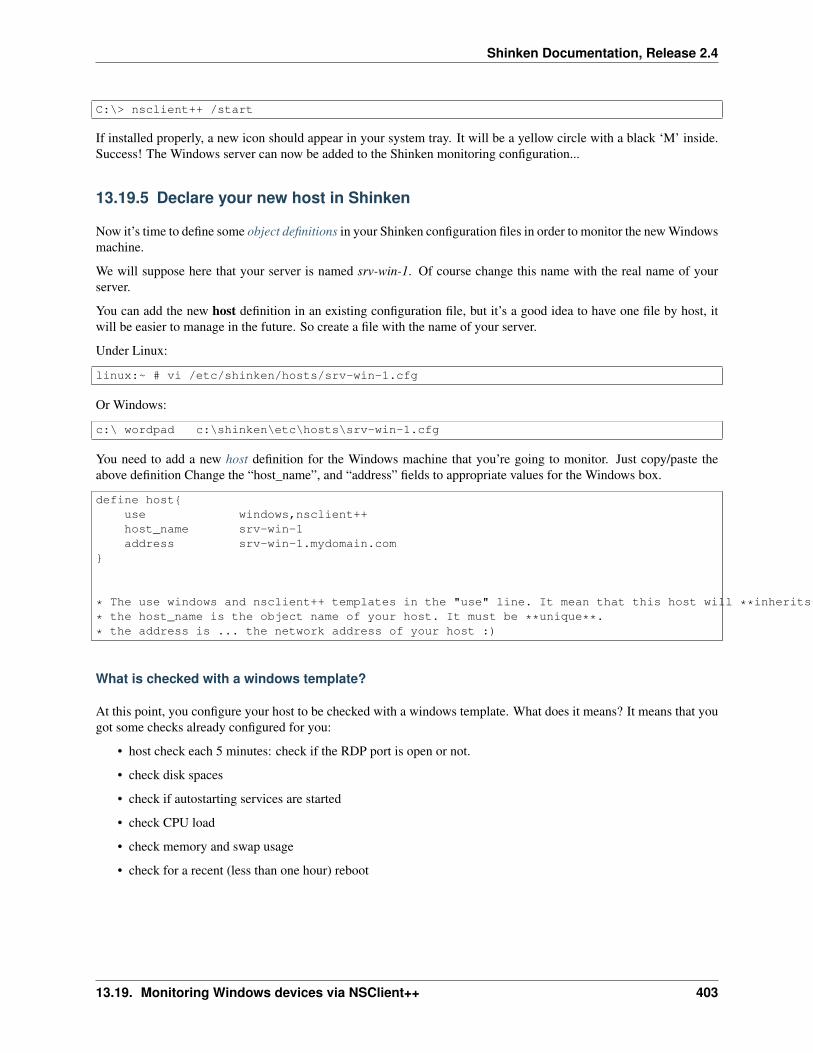
Shinken Documentation, Release 2.4
C:\> nsclient++ /start
If installed properly, a new icon should appear in your system tray. It will be a yellow circle with a black ‘M’ inside.Success! The Windows server can now be added to the Shinken monitoring configuration...
13.19.5 Declare your new host in Shinken
Now it’s time to define some object definitions in your Shinken configuration files in order to monitor the new Windowsmachine.
We will suppose here that your server is named srv-win-1. Of course change this name with the real name of yourserver.
You can add the new host definition in an existing configuration file, but it’s a good idea to have one file by host, itwill be easier to manage in the future. So create a file with the name of your server.
Under Linux:
linux:~ # vi /etc/shinken/hosts/srv-win-1.cfg
Or Windows:
c:\ wordpad c:\shinken\etc\hosts\srv-win-1.cfg
You need to add a new host definition for the Windows machine that you’re going to monitor. Just copy/paste theabove definition Change the “host_name”, and “address” fields to appropriate values for the Windows box.
define host{use windows,nsclient++host_name srv-win-1address srv-win-1.mydomain.com
}
* The use windows and nsclient++ templates in the "use" line. It mean that this host will **inherits** properties from the windows and nsclient++ templates.
* the host_name is the object name of your host. It must be **unique**.
* the address is ... the network address of your host :)
What is checked with a windows template?
At this point, you configure your host to be checked with a windows template. What does it means? It means that yougot some checks already configured for you:
• host check each 5 minutes: check if the RDP port is open or not.
• check disk spaces
• check if autostarting services are started
• check CPU load
• check memory and swap usage
• check for a recent (less than one hour) reboot
13.19. Monitoring Windows devices via NSClient++ 403

Shinken Documentation, Release 2.4
13.20 Monitoring Windows devices via WMI
The premier WMI check program, check_wmi_plus.pl, can now be used on the windows platform in association withthe shinken WMIC.EXE.
WMIC.EXE is not the native wmic of the windows system. It is a standalone program created to have the sameinput/output as the linux WMIC. This permits check_wmi_plus to use WMIC on windows with the same options asthe linux program. WMIC.EXE (binaries and sources) are included with Shinken (1.2.2 and newer).
WMIC.EXE and associated Shinken programs under Windows, use the .NET framework 2.0.
13.20.1 Pre-requisites for using check_wmi_plus.pl
Check_wmi_plus.pl needs a perl interpreter to work, we recommend activePerl. At this time, strawberry perl cannotbe used as a non interactive program. The Shinken poller starts programs in a non interactive mode, which means noStrawberrt perl.
• Download activeperl and select the 5.16.x Windows x64 version
• Download and install PERL Number::Format using CPAN
• Download and install PERL Config::Inifiles using CPAN
• Download and install PERL DataTime using CPAN
• Download and install .NET 2.0 framework from Microsoft (If it is not already installed). On Windows 2008 R2,install 3.5 (SP1) Framework. It includes the 2.0 version.
Important: PERL Dependencies for check_wmi_plus.pl (needed by check_wmi_plus and not installed by default.Please lookup the CPAN documentation if you don”t know how to install PERL modules)
After having installed all dependencies, you can now proceed to install check_wmi_plus.pl
• Download and install check_wmi_plus.pl
Make sure to change the references into the check_wmi_plus.conf file and the initial variables into thecheck_wmi_plus.pl (take a look to match the install folder and the WMIC.exe path)
13.20.2 Shinken configuration to use check_wmi_plus
At first you must configure monitoring parameters in the Shinken etc/resource.cfg file :
$DOMAIN$=domain$DOMAINUSERSHORT$=shinken_user$DOMAINUSER$=$DOMAIN$\\$DOMAINUSERSHORT$$DOMAINPASSWORD$=superpassword$LDAPBASE$=dc=eu,dc=society,dc=com
These options are set by default, but the poller will also use a « hidden » $DOMAINUSERSHORT$ parameter set inthe Shinken templates.cfg. Just set this parameter in the resource.cfg file to overload the template and make use of asingle configuration file.
These options are used by the check_wmi_plus plugin as credentials for WMI local or remote access. If you intend tomonitor hosts that are not controlled by a domain controller (simple workgroup members) it is necessary to overloadthe $DOMAINUSER$ parameter :
404 Chapter 13. How to monitor ...

Shinken Documentation, Release 2.4
$DOMAIN$=domain$DOMAINUSERSHORT$=shinken_user$DOMAINUSER$=$DOMAINUSERSHORT$$DOMAINPASSWORD$=superpassword$LDAPBASE$=dc=eu,dc=society,dc=com
You need to set the appropriate values for your environment, the above values (domain, shinken_user andsuperpassword) are simply examples. :-)
To test the settings, just add a host to be monitored by setting a new host in a cfg file named with the name of the hostfor example etchostsclishinken.cfg based on the windows template:
define host{use windowscontact_groups adminshost_name clishinkenaddress clishinkenicon_set server
}
Restart the Shinken windows services. The WebUI now checks a new windows host : clishinken ! In this configuration,the remote WMI is executed using the credentials set into the resource.cfg file. It”s working but is not really secure.
Warning: warningIf you look in the local configuration you will see check_wmi_plus. For Windows, it’s not allowed to use creden-tials for a local WMI request. As a workaround, WMIC.EXE will use the local credentials if the target host is setto localhost and the user is set to local. Check the etccommands-windows.cfg to see how it works. You will seesomething like this :
define command {command_name check_local_diskscommand_line $PLUGINSDIR$/check_wmi_plus.pl -H localhost -u "local" -p "local" -m checkdrivesize -a '.' -w 90 -c 95 -o 0 -3 0
}
13.20.3 Secure method to use check_wmi_plus on windows
There is a new option to use check_wmi_plus with shinken : Use the poller configuration service credentials.
For most sysadmins, putting an unencrypted password in a config file is not a best practice. IT secuirty will becompromised if someone can read the configuration file. The rights of this user on servers are also very high (WMIrequests need more configuration to be security compliant on windows server, including DCOM configuration oradmin rights. . . ) You can find a good idea of how to configure the remote wmi on windows here:
www.op5.com/how-to/agentless-monitoring-windows-wmi/
To set a “bypass” credential, only set the $DOMAINUSERSHORT$ to #### (4 sharp symbols without spaces) If theWMIC see this specific user,it just will use the caller credentials - in all cases the poller service user. By default, theShinken services are set to localsystem.
Stop the services (manually or using the binstop_allservices.cmd script).
Open the services.msc (or the server manager, and then the services part)
13.20. Monitoring Windows devices via WMI 405
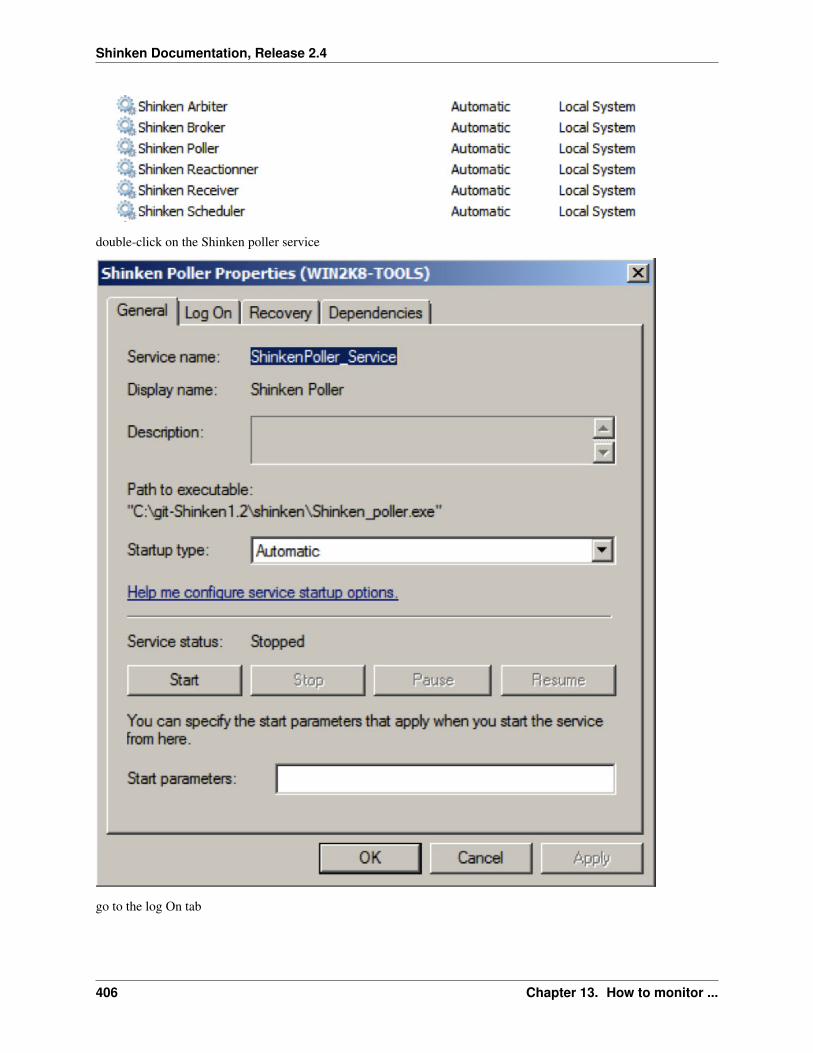
Shinken Documentation, Release 2.4
double-click on the Shinken poller service
go to the log On tab
406 Chapter 13. How to monitor ...
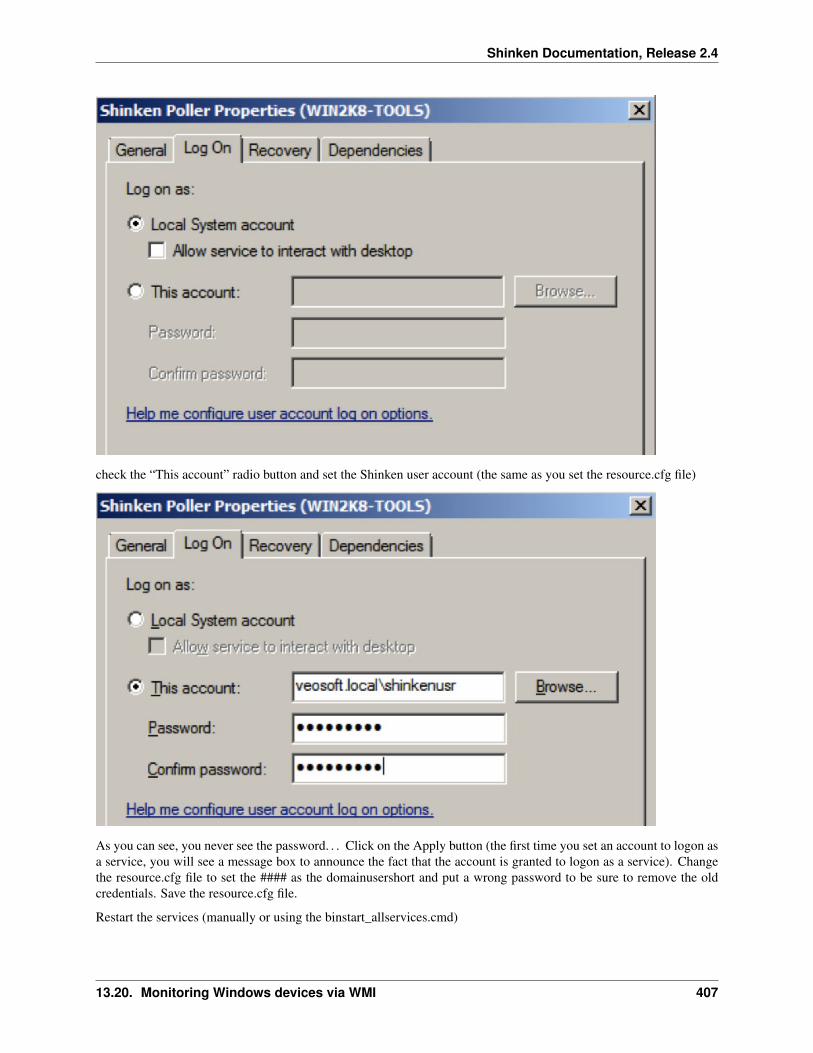
Shinken Documentation, Release 2.4
check the “This account” radio button and set the Shinken user account (the same as you set the resource.cfg file)
As you can see, you never see the password. . . Click on the Apply button (the first time you set an account to logon asa service, you will see a message box to announce the fact that the account is granted to logon as a service). Changethe resource.cfg file to set the #### as the domainusershort and put a wrong password to be sure to remove the oldcredentials. Save the resource.cfg file.
Restart the services (manually or using the binstart_allservices.cmd)
13.20. Monitoring Windows devices via WMI 407

Shinken Documentation, Release 2.4
The poller will now launch the WMI request under its own service account. . .
Important: Setting the remote WMI configuration on windows is not as easy as it seems.
The domains admins or other IT admins may set GPO or other tools to change the configuration of the system -including the right to enable or disable remote WMI. Please be patient, and change options one by one if your wmitests are not working.
408 Chapter 13. How to monitor ...

CHAPTER 14
How to contribute
409
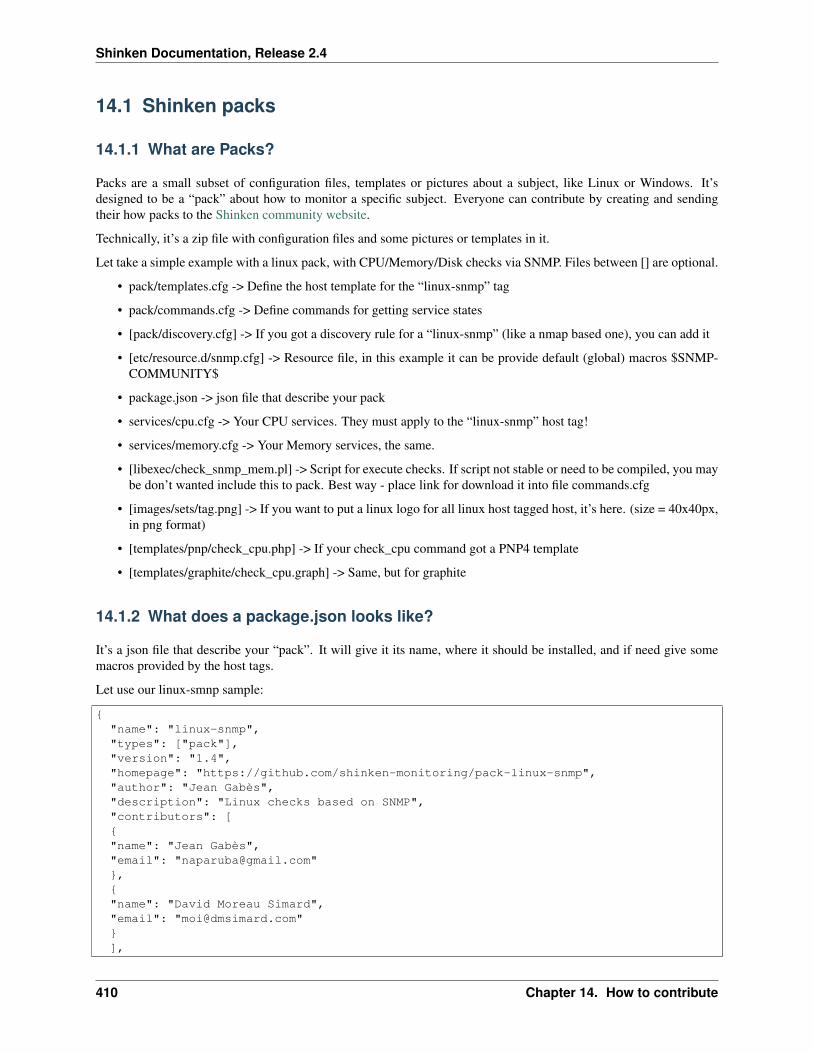
Shinken Documentation, Release 2.4
14.1 Shinken packs
14.1.1 What are Packs?
Packs are a small subset of configuration files, templates or pictures about a subject, like Linux or Windows. It’sdesigned to be a “pack” about how to monitor a specific subject. Everyone can contribute by creating and sendingtheir how packs to the Shinken community website.
Technically, it’s a zip file with configuration files and some pictures or templates in it.
Let take a simple example with a linux pack, with CPU/Memory/Disk checks via SNMP. Files between [] are optional.
• pack/templates.cfg -> Define the host template for the “linux-snmp” tag
• pack/commands.cfg -> Define commands for getting service states
• [pack/discovery.cfg] -> If you got a discovery rule for a “linux-snmp” (like a nmap based one), you can add it
• [etc/resource.d/snmp.cfg] -> Resource file, in this example it can be provide default (global) macros $SNMP-COMMUNITY$
• package.json -> json file that describe your pack
• services/cpu.cfg -> Your CPU services. They must apply to the “linux-snmp” host tag!
• services/memory.cfg -> Your Memory services, the same.
• [libexec/check_snmp_mem.pl] -> Script for execute checks. If script not stable or need to be compiled, you maybe don’t wanted include this to pack. Best way - place link for download it into file commands.cfg
• [images/sets/tag.png] -> If you want to put a linux logo for all linux host tagged host, it’s here. (size = 40x40px,in png format)
• [templates/pnp/check_cpu.php] -> If your check_cpu command got a PNP4 template
• [templates/graphite/check_cpu.graph] -> Same, but for graphite
14.1.2 What does a package.json looks like?
It’s a json file that describe your “pack”. It will give it its name, where it should be installed, and if need give somemacros provided by the host tags.
Let use our linux-smnp sample:
{"name": "linux-snmp","types": ["pack"],"version": "1.4","homepage": "https://github.com/shinken-monitoring/pack-linux-snmp","author": "Jean Gabès","description": "Linux checks based on SNMP","contributors": [{"name": "Jean Gabès","email": "[email protected]"},{"name": "David Moreau Simard","email": "[email protected]"}],
410 Chapter 14. How to contribute
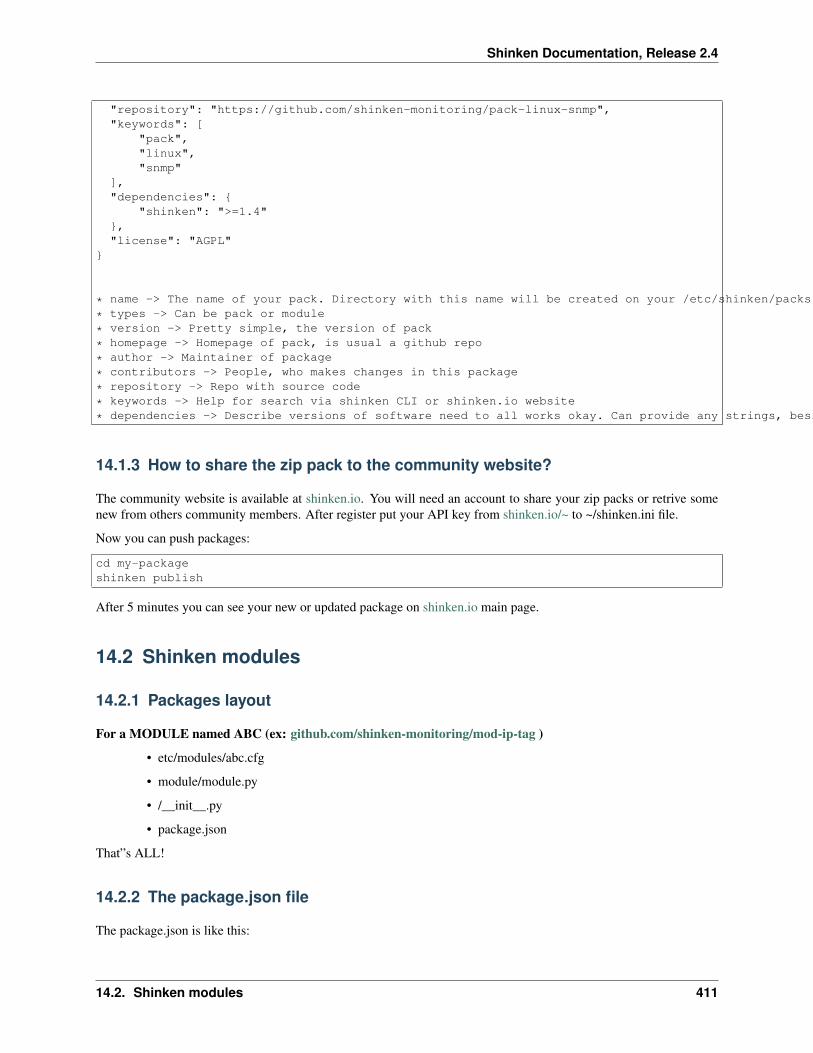
Shinken Documentation, Release 2.4
"repository": "https://github.com/shinken-monitoring/pack-linux-snmp","keywords": [
"pack","linux","snmp"
],"dependencies": {
"shinken": ">=1.4"},"license": "AGPL"
}
* name -> The name of your pack. Directory with this name will be created on your /etc/shinken/packs
* types -> Can be pack or module
* version -> Pretty simple, the version of pack
* homepage -> Homepage of pack, is usual a github repo
* author -> Maintainer of package
* contributors -> People, who makes changes in this package
* repository -> Repo with source code
* keywords -> Help for search via shinken CLI or shinken.io website
* dependencies -> Describe versions of software need to all works okay. Can provide any strings, besides shinken version
14.1.3 How to share the zip pack to the community website?
The community website is available at shinken.io. You will need an account to share your zip packs or retrive somenew from others community members. After register put your API key from shinken.io/~ to ~/shinken.ini file.
Now you can push packages:
cd my-packageshinken publish
After 5 minutes you can see your new or updated package on shinken.io main page.
14.2 Shinken modules
14.2.1 Packages layout
For a MODULE named ABC (ex: github.com/shinken-monitoring/mod-ip-tag )
• etc/modules/abc.cfg
• module/module.py
• /__init__.py
• package.json
That”s ALL!
14.2.2 The package.json file
The package.json is like this:
14.2. Shinken modules 411
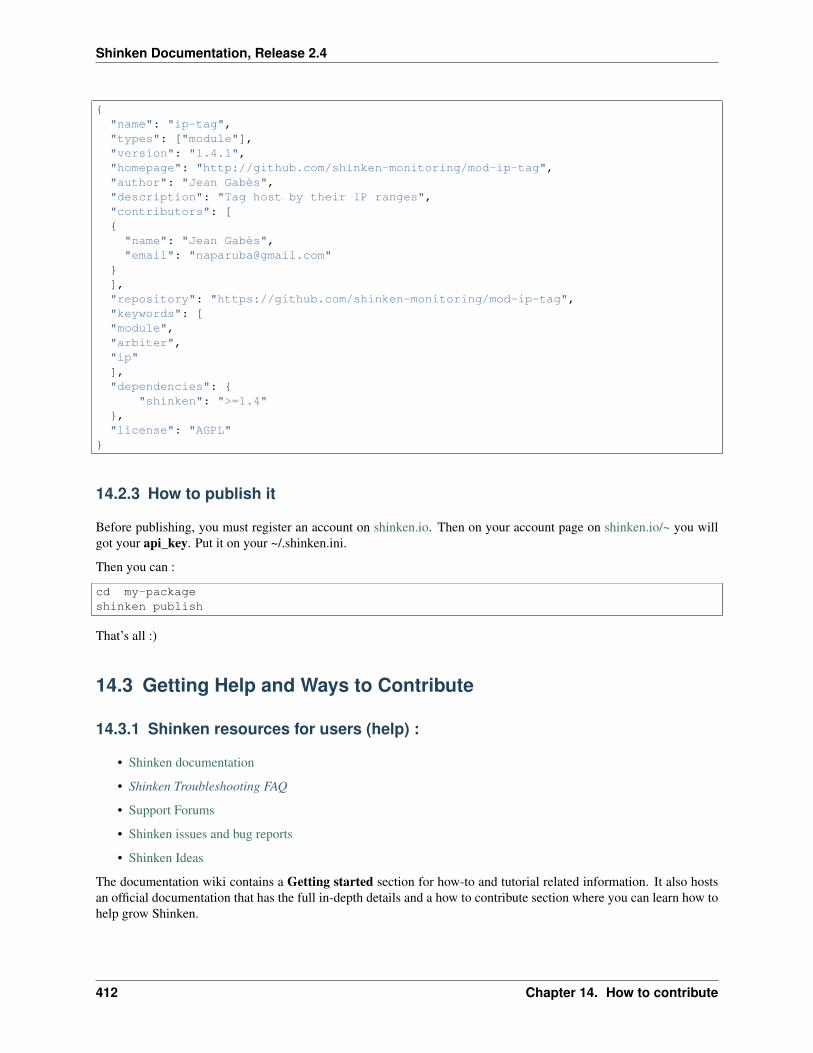
Shinken Documentation, Release 2.4
{"name": "ip-tag","types": ["module"],"version": "1.4.1","homepage": "http://github.com/shinken-monitoring/mod-ip-tag","author": "Jean Gabès","description": "Tag host by their IP ranges","contributors": [{"name": "Jean Gabès","email": "[email protected]"
}],"repository": "https://github.com/shinken-monitoring/mod-ip-tag","keywords": ["module","arbiter","ip"],"dependencies": {
"shinken": ">=1.4"},"license": "AGPL"
}
14.2.3 How to publish it
Before publishing, you must register an account on shinken.io. Then on your account page on shinken.io/~ you willgot your api_key. Put it on your ~/.shinken.ini.
Then you can :
cd my-packageshinken publish
That’s all :)
14.3 Getting Help and Ways to Contribute
14.3.1 Shinken resources for users (help) :
• Shinken documentation
• Shinken Troubleshooting FAQ
• Support Forums
• Shinken issues and bug reports
• Shinken Ideas
The documentation wiki contains a Getting started section for how-to and tutorial related information. It also hostsan official documentation that has the full in-depth details and a how to contribute section where you can learn how tohelp grow Shinken.
412 Chapter 14. How to contribute
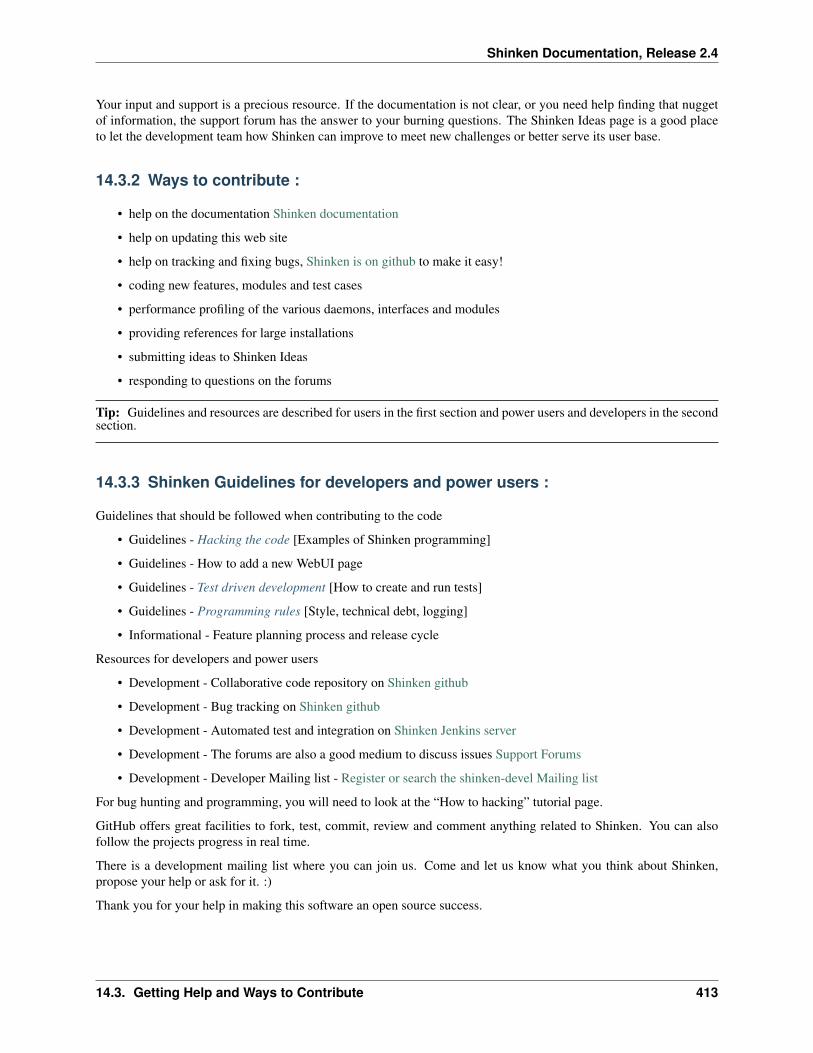
Shinken Documentation, Release 2.4
Your input and support is a precious resource. If the documentation is not clear, or you need help finding that nuggetof information, the support forum has the answer to your burning questions. The Shinken Ideas page is a good placeto let the development team how Shinken can improve to meet new challenges or better serve its user base.
14.3.2 Ways to contribute :
• help on the documentation Shinken documentation
• help on updating this web site
• help on tracking and fixing bugs, Shinken is on github to make it easy!
• coding new features, modules and test cases
• performance profiling of the various daemons, interfaces and modules
• providing references for large installations
• submitting ideas to Shinken Ideas
• responding to questions on the forums
Tip: Guidelines and resources are described for users in the first section and power users and developers in the secondsection.
14.3.3 Shinken Guidelines for developers and power users :
Guidelines that should be followed when contributing to the code
• Guidelines - Hacking the code [Examples of Shinken programming]
• Guidelines - How to add a new WebUI page
• Guidelines - Test driven development [How to create and run tests]
• Guidelines - Programming rules [Style, technical debt, logging]
• Informational - Feature planning process and release cycle
Resources for developers and power users
• Development - Collaborative code repository on Shinken github
• Development - Bug tracking on Shinken github
• Development - Automated test and integration on Shinken Jenkins server
• Development - The forums are also a good medium to discuss issues Support Forums
• Development - Developer Mailing list - Register or search the shinken-devel Mailing list
For bug hunting and programming, you will need to look at the “How to hacking” tutorial page.
GitHub offers great facilities to fork, test, commit, review and comment anything related to Shinken. You can alsofollow the projects progress in real time.
There is a development mailing list where you can join us. Come and let us know what you think about Shinken,propose your help or ask for it. :)
Thank you for your help in making this software an open source success.
14.3. Getting Help and Ways to Contribute 413

Shinken Documentation, Release 2.4
14.4 Shinken Package Manager
Important: I don’t now how you get here :) it’s a poc of the design of a shinken pack manager. A pack can be amodule, a configuration pack or what ever you want.
A pack can be about :
• configuration
• module
Each pack should have a pack.json file that describe it.
{"name": "linux","version": "1.2","description": "Standard linux checks, like CPU, RAM and disk space. Checks are done by SNMP.","type": "configuration","dependencies": {
"shinken" : ">1.2"},"repository": {
"type": "git","url": "git://github.com/naparuba/pack-cfg-linux.git"
},"keywords": [
"linux", "snmp"],"author": "Jean Gabès <[email protected]>","license": "Affero GPLv3","configuration":{
"path":"os/","macros":{
"_SNMPCOMMUNITY": {"type":"string","description":"The read snmp community allowed on the linux server"
},}
}}
And for a module one :
{"name": "logstore_mongodb","version": "1.2","description": "Log store module for LiveStatus. Will save the logs into Mongodb.","type": "module","dependencies": {
"shinken" : ">1.2","livestatus" : ">1.2"
},"repository": {
"type": "git","url": "git://github.com/naparuba/pack-module-logstore_mongodb.git"
},"keywords": [
"mongodb", "log", "livestatus"],
414 Chapter 14. How to contribute

Shinken Documentation, Release 2.4
"author": "Gerhard Lausser <>","license": "Affero GPLv3"
}
The spm command should be really simple to use.
:: spm install linux
This will download the linux pack and put the good files into the rigth place.
:: spm search linux
This will output all the pack with linux in the name or the description.
spm create
This will create a .tar.gz file with all inside.
spm publish
This will push the .tar.gz file to the registry.shinken-montioring.org website. Will use the ~/.spm/api.key for creden-tials.
spm adduser
This will try to register you to the registry website. If the username you propose is already defined, propose you tologin and get your API key.
14.4. Shinken Package Manager 415

Shinken Documentation, Release 2.4
416 Chapter 14. How to contribute

CHAPTER 15
Development
417

Shinken Documentation, Release 2.4
15.1 Shinken Programming Guidelines
The Shinken project aims to have good code quality. This is to the benefit of all. Easy to understand code, that isefficient and well documented can do wonders to introduce new developers to a great system and keep existing onehappy!
During scores of secret meetings at undisclosed locations in the heart of Eurodisney, the following guidelines weredocumented.
So here’s the how to keep the developers happy! __Follow these guidelines__
15.1.1 The python style guide
The python style guide provides coding conventions for Python programmers covering topics such as:
• Whitespace
• Comments
• Imports
• Classes
• Naming conventions
Keep it as a handy reference: PEP8 - Python Style guide. We use a relaxed version of PEP 8 with a maximum linelength of 100 instead of 79 and error 303 (too many blank lines) ignored.
15.1.2 Reference book
The Art of Readable Code, is a great book that provides a fast read and an immense value in improving the readabilityand maintainability of code.
15.1.3 The python docstring guide
The Python docstring guide provides insight in how to format and declare docstrings which are used to documentclasses and functions.
Read through it to provide better understanding for yourself and others: ‘ Python docstring guide‘_
15.1.4 Logging is your friend
Shinken provides a logger module, that acts as a wrapper to the Python logging facilities. This provides valuablefeedback to users, power users and developers.
The logging functions also provide different levels to distinguish the type logging level at which the messages shouldappear. This is similar to how syslog classifies messages based on severity levels.
Some log messages will not get the level printed, these are related to state data. Logging levels for logs generatedat system startup and displayed in STDOUT are set by default to display all messages. This is normal behaviour.Once logging is initialized buffered messages are logged to the appropriate level defined in the daemon INI files. (ex.reactionnerd.ini, brokerd.ini, etc.)
Some test cases depend on logging output, so change existing logging messages to your hearts content, but validate allchanges against the FULL test suite. Learn more about using the Shinken test suite.
418 Chapter 15. Development
Shinken Documentation, Release 2.4
Debug: This is the most verbose logging level (maximum volume setting). Consider Debug to be out-of-bounds fora production system and used it only for development and testing. I prefer to aim to get my logging levels justright so I have just enough information and endeavor to log this at the Information level or above.
Information: The Information level is typically used to output information that is useful to the running and manage-ment of your system. Information would also be the level used to log Entry and Exit points in key areas of yourapplication. However, you may choose to add more entry and exit points at Debug level for more granularityduring development and testing.
Warning: Warning is often used for handled ‘exceptions’ or other important log events. For example, if your appli-cation requires a configuration setting but has a default in case the setting is missing, then the Warning levelshould be used to log the missing configuration setting.
Error: Error is used to log all unhandled exceptions. This is typically logged inside a catch block at the boundary ofyour application.
Critical: Critical is reserved for special exceptions/conditions where it is imperative that you can quickly pick outthese events. I normally wouldn’t expect Fatal to be used early in an application’s development. It’s usuallyonly with experience I can identify situations worthy of the FATAL moniker experience do specific eventsbecome worth of promotion to Critical. After all, an error’s an error.
Log: This level has been deprecated for NON NAGIOS/SHINKEN STATE messages and should be replaced with oneof the approved logging levels listed above. The STATE messages are easy recognize as they are ALL CAPS.Do not mess with these unless you know what you are doing.
15.1.5 Technical debt must be paid
Coding in Shinken should be fun and rewarding.
“Technical debt”: all little hacks here and there. __There comes a time, technical debt must be paid__. We can havenew features very quickly, if authors do not have to bypass numerous hack. We must take some time before eachrelease to pay all technical debt we can. __The less we’ve got, the easier it is to service and extend the code__.
It’s the same for the core architecture. A solid and stable architecture allows developers to build on it and add value.A good example is being able to add a parameter with only a single line :)
We must be responsible with new features, if it means they can be used to build more innovation in the future withouthacks :)
15.1.6 Where does the fun happen
‘ GitHub offers great facilities to fork, test, commit, review and comment anything related to Shinken‘_.
You can also follow the project progress in real time.
15.2 Test Driven Development
15.2.1 Introduction
Test Driven Development
In a strict sense TDD is:
• Create the test case for your new function (valid and invalid input, limits, expected output)
• Run the test, make sure it fails as planned.
15.2. Test Driven Development 419
Shinken Documentation, Release 2.4
• Code your function, run the test against it and eventually have it succeed.
• Once the function works, re-factor the code for efficiency, readability, comments, logging and anything elserequired.
• Any scope changes should be handled by new functions, by adding new test cases or by modifying the existingtest case (dangerous for existing code).
• See the ‘ Wikipedia article about TDD‘_ for more information.
There are different test levels :
• Commit level tests : These should be as quick as possible, so everyone can launch them in a few seconds.
• Integration tests : Integration tests should be more extensive and can have longer execution periods as these arelaunched less often (before a release, or in an integration server).
TDD in Shinken
We think all functions and features should have a test case. Shinken has a system to run automated tests that pinpointany issues. This is used prior to commit, at regular intervals and when preparing a release.
Shinken uses Test Driven Development to achieve agility and stability in its software development process. Developersmust adhere to the described methods in order to maintain a high quality standard.
We know some functions will be hard to test (databases for example), so let’s do our best, we can’t have 100%coverage. Tests should cover the various input and expected output of a function. Tests can also cover end-to-endcases for performance, stability and features. Test can also be classified in their time to run, quick tests for commitlevel validation and integration tests that go in-depth.
We are not saying “all patches should be sent with tests”, but new features/functions should have tests. First, thesubmitter knows what his code is designed to do, second this will save us from having to create one or more test caseslater on when something gets broken. Test examples can be found in the /tests/ directory of the repository or your localinstallation.
15.2.2 Add test to Shinken
I guess you have come here to chew bubblegum and create tests ... and you are all out of bubblegum! Lucky you are,here is some help to create tests!
Create a test
Tests use standard python tools to run (unittest), so that they have to be well formatted. But don’t worry it’s quitesimple. All you have to know is something (a class or a method) containing the “test” string will be run. The typicalway to create a new test is to copy paste from a simple one. We suggest the test_bad_contact_call.py for examplewhich is very small.
Here is the file :
from shinken_test import *
class TestConfig(ShinkenTest):
def setUp(self):self.setup_with_file('etc/nagios_bad_contact_call.cfg')
def test_bad_contact_call(self):# The service got a unknow contact. It should raise an error
420 Chapter 15. Development

Shinken Documentation, Release 2.4
svc = self.conf.services.find_srv_by_name_and_hostname("test_host_0", "test_ok_0")print "Contacts:", svc.contactsself.assert_(svc.is_correct() == False)
if __name__ == '__main__':unittest.main()
Basically what unittest does (and nosetest too) is run every method containing “test” in all class containing “test”.Here there is only one test : test_bad_contact_call The setUp function is a special one : it is called before every testmethod to set up the test. You can also execute a special function after each test by defining a tearDown() method.
So the only thing you have to do is rename the function and write whatever you want to test inside!
This is more or less the only thing you have to do if you want to write a test from scratch. Seehttp://docs.python.org/2/library/unittest.html for more detail about unittest
If you are testing more complex stuff you may use other test as template. For example broker module tests are a lotdifferent and need some scheduling statement to simulate real beahvior.
Executing tests
Important: YOU NEED PYTHON 2.7 TO RUN THE TESTS. The test scripts use new Assert statements onlyavailable starting in Python 2.7.
Once you have done or edited the python file you have to run the test by typing :
python test_nameofyourtest.py
If there is no error then everything is correct. You can try to launch it with nosetests to double check it.
Note: nosetests has a different behavior than unittests, the jenkins integration is using nosetests, that’s why it’s a goodthing to check before comminting.
The automated tests permit developers to concentrate on what they do best, while making sure they don’t breakanything. That’s why the tests are critical to the success of the project. Shinken aims for “baseline zero bug” code andfailure by design development :) We all create bugs, it’s the coders life after all, lets at least catch them before theycreate havoc for users! The automated tests handle regression, performance, stability, new features and edge cases.
The test is ready for commit. The last thing to do is to run the test suit to ensure you do not create code regression.This can be a long step if you have made a big change.
Shell test run
There are basically two ways to run the test list. The first one (easiest) is to run the quick_test shell script. This willbasically iterate on a bunch of python files and run them
FIXME : update test list into git and edit end to end script
./quick_tests.sh
Then you can run the end to end one : \ FIXME : explain what the script does
./test_end_to_end.sh
It only takes a few seconds to run and you know that you did not break anything (or this will indicate you should runthe in-depth integration level tests :) ).
15.2. Test Driven Development 421

Shinken Documentation, Release 2.4
If you are adhering to TDD this will validate that your function fails by design or that you have successfully built yourfunction
Integration test run
The other way to do it is run the new_runtest script (which is run on the Jenkins ingration server)
Note: It can be difficult to make it work from scratch as the script create and install a python virtual enviromnt. Onthe distros, pip dependencies may be difficult to met. Don’t give up and ask help on the mailing list!
./test/jenkins/new_runtest ./test/jenkins/shorttests.txt ./test/moduleslist COVERAGE PYLINT PEP8
For short tests, coverage and python checking. Just put NOCOVERAGE or NOPYLINT or NOPEP8 instead to removeone.
This ensure that the Jenkins run won’t fail. It’s the best way to keep tests fine.
Tests and integration servers
The integration server is at http://shinken-monitoring.de:8080/
It use the following tests:
• test/jenkins/runtests[.bat]
It takes the arguments: “file with a list of test_-scripts” [NO]COVERAGE [NO]PYLINT
• test/test_end_to_end.sh
Other integration server is at https://test.savoirfairelinux.com/view/Shinken/
This one use the new_runtest script.
Automated test execution
The Hudson automated test jobs are:
• Shinken
– executed after each git commit
– runtests test/jenkins/shorttests.txt NOCOVERAGE NOPYLINT
– the scripts in shorttests.txt take a few minutes to run
– give the developer feedback as fast as possible (nobody should git-commit without running tests in hisprivate environment first)
• Shinken-Multiplatform
– runs 4 times per day
– runtests test/jenkins/longtests.txt NOCOVERAGE NOPYLINT
– linux-python-2.4,linux-python-2.6,linux-python-2.7,windows-python-2.7
– executes _all_ test_-scripts we have, so it takes a long time
• Shinken-End-to-End
– runs after each successful Shinken-Multiplatform
422 Chapter 15. Development
Shinken Documentation, Release 2.4
– executes the test/test_end_to_end.sh script
– try a direct launch, install then launch, and high availability environment launch.
• Shinken-Code-Quality
– runs once a day
– runtests test/jenkins/longtests.txt COVERAGE PYLINT
– collects metrics for coverage and pylint
On the Jenkins one :
• Shinken-Upstream-Commit-Short-Tests
– executed after each git commit
– ./test/jenkins/new_runtests ./test/jenkins/shorttests.txt ./test/moodulelist COVERAGE PYLINT PEP8
– test also module in a basic way.
– the scripts in shorttests.txt take a few minutes to run
– give the developer feedback as fast as possible (nobody should git-commit without running tests in hisprivate environment first)
• Shinken-Upstream-Daily-Full-Tests
– executed every 6 hours
– ./test/jenkins/new_runtest ./test/jenkins/all_tests.txt ./test/moduleslist COVERAGE PYLINT PEP8
– the all_test is regenerated every time (all test_*.py)
– run all test in all module listed
– give a full view of shinken coverage.
15.3 Shinken Plugin API
15.3.1 Other Resources
If you’re looking at writing your own plugins for Shinken or Nagios, please make sure to visit these other resources:
• The official Monitoring plugins project website
• The official Monitoring plugins development guidelines
15.3.2 Plugin Overview
Scripts and executables must do two things (at a minimum) in order to function as Shinken plugins:
• Exit with one of several possible return values
• Return at least one line of text output to “STDOUT”
The inner workings of your plugin are unimportant to Shinken, interface between them is important. Your plugincould check the status of a TCP port, run a database query, check disk free space, or do whatever else it needs to checksomething. The details will depend on what needs to be checked - that’s up to you.
15.3. Shinken Plugin API 423

Shinken Documentation, Release 2.4
If you are interested in having a plugin that is performant to use with Shinken, consider making it a Python or python+ C type plugin that is daemonized by the Shinken poller or receiver daemons. You can look at the existing pollerdaemons for how to create a module, it is very simple.
15.3.3 Return Code
Shinken determines the status of a host or service by evaluating the return code from plugins. The following tablesshows a list of valid return codes, along with their corresponding service or host states.
Plugin Return Code Service State Host State0 OK UP1 WARNING UP or DOWN/UNREACHABLE*2 CRITICAL DOWN/UNREACHABLE3 UNKNOWN DOWN/UNREACHABLE
If the use_aggressive_host_checking option is enabled, return codes of 1 will result in a host state of DOWN or UN-REACHABLE. Otherwise return codes of 1 will result in a host state of UP. The process by which Nagios determineswhether or not a host is DOWN or UNREACHABLE is discussed here.
15.3.4 Plugin Output Spec
At a minimum, plugins should return at least one of text output. Beginning with Nagios 3, plugins can optionallyreturn multiple lines of output. Plugins may also return optional performance data that can be processed by externalapplications. The basic format for plugin output is shown below:
TEXT OUTPUT | OPTIONAL PERFDATALONG TEXT LINE 1LONG TEXT LINE 2...LONG TEXT LINE N |PERFDATA LINE 2PERFDATA LINE 3...PERFDATA LINE N
The performance data is optional. If a plugin returns performance data in its output, it must separate the performancedata from the other text output using a pipe (|) symbol. Additional lines of long text output are also optional.
15.3.5 Plugin Output Examples
Let’s see some examples of possible plugin output...
Case 1: One line of output (text only)
Assume we have a plugin that returns one line of output that looks like this:
DISK OK - free space: / 3326 MB (56%);
If this plugin was used to perform a service check, the entire line of output will be stored in the $SERVICEOUTPUT$macro.
Case 2: One line of output (text and perfdata)
A plugin can return optional performance data for use by external applications. To do this, the performance data mustbe separated from the text output with a pipe (|) symbol like such:
DISK OK - free space: / 3326 MB (56%);
"|"
/=2643MB;5948;5958;0;5968
424 Chapter 15. Development

Shinken Documentation, Release 2.4
If this plugin was used to perform a service check, the”red”portion of output (left of the pipe separator) will be storedin the $SERVICEOUTPUT$ macro and the”orange”portion of output (right of the pipe separator) will be stored in the$SERVICEPERFDATA$ macro.
Case 3: Multiple lines of output (text and perfdata)
A plugin optionally return multiple lines of both text output and perfdata, like such:
DISK OK - free space: / 3326 MB (56%);"|"/=2643MB;5948;5958;0;5968/ 15272 MB (77%);/boot 68 MB (69%);/home 69357 MB (27%);/var/log 819 MB (84%);"|"/boot=68MB;88;93;0;98/home=69357MB;253404;253409;0;253414 /var/log=818MB;970;975;0;980
If this plugin was used to perform a service check, the red portion of first line of output (left of the pipe separator) willbe stored in the $SERVICEOUTPUT$ macro. The orange portions of the first and subsequent lines are concatenated(with spaces) are stored in the $SERVICEPERFDATA$ macro. The blue portions of the 2nd _ 5th lines of output willbe concatenated (with escaped newlines) and stored in $LONGSERVICEOUTPUT$ the macro.
The final contents of each macro are listed below:
Macro Value$SERVICEOUT-PUT$
DISK OK - free space: / 3326 MB (56%);
$SERVICEPERF-DATA$
/=2643MB;5948;5958;0;5968”/boot=68MB;88;93;0;98”/home=69357MB;253404;253409;0;253414”/var/log=818MB;970;975;0;980
$LONGSERVICE-OUTPUT$
/ 15272 MB (77%);n/boot 68 MB (69%);n/var/log 819 MB (84%);
With regards to multiple lines of output, you have the following options for returning performance data:
• You can choose to return no performance data whatsoever
• You can return performance data on the first line only
• You can return performance data only in subsequent lines (after the first)
• You can return performance data in both the first line and subsequent lines (as shown above)
15.3.6 Plugin Output Length Restrictions
Nagios will only read the first 4 KB of data that a plugin returns. This is done in order to prevent runaway pluginsfrom dumping megs or gigs of data back to Nagios. This 4 KB output limit is fairly easy to change if you need. Simplyedit the value of the MAX_PLUGIN_OUTPUT_LENGTH definition in the include/nagios.h.in file of the source codedistribution and recompile Nagios. There’s nothing else you need to change!
Shinken behaviour is pretty the same. The parameter can be specified in shinken.cfg. The default value is 8K
15.3.7 Examples
If you’re looking for some example plugins to study, we would recommend that you download the official Monitoringplugins and look through the code for various C, Perl, and shell script plugins. Information on obtaining the officialMonitoring plugins can be found here.
Otherwise go to the Shinken Github or look in your installation in shinken/modules and look for the NRPE and NSCAmodules for inspiration on create a new poller or receiver daemon module.
15.4 Developing Shinken Daemon Modules
How to develop daemon modules...
15.4. Developing Shinken Daemon Modules 425
Shinken Documentation, Release 2.4
Coming shortly.
15.5 Hacking the Shinken Code
15.5.1 Development goals
Shinken is an open source program.
Enhancements, optimization, fixes, these are all good reasons to create a patch and send it to the development mailinglist. Even if you are not sure about the quality of your patch or your ideas, submit them to the mailing list for reviewor comment. Having feedback is essential to any project.
This documentation will show how to add code to Shinken. Shinken is written in Python. If you are new to pythonplease consider reading this introduction / beginners guide.
15.5.2 Development rules
If you wish to commit code to the Shinken repository, you must strive to follow the Shinken development rules.
Before sending us a Pull Request please consider the following table
Contribution type Run test cases Add a test case Add documentation Do one commit per stepTypo fixing in comments YesTypo fixing in code Yes YesBug fixing Yes Yes YesNew feature Yes Yes Yes Yes
Depending on the contribution you should ensure the previous condition. If you don’t met one of those your pullrequest may take some time to be merged or simply be rejected. Ensuring stability is a top priority. Whenever a pieceof code is edit, test should ensure nothing is broken. Documentation is also important, undocumented features arealmost useless.
Please try to stick to that when contributing to Shinken. We will be happy to merge your work.
15.5.3 Best Practices
Note: This was move from the about section. Should be reworked
• “value first priority”
• Major changes are handled in github forks by each developer
• Very open to user submitted patches
• Comprehensive automated QA to enable a fast release cycle without sacrificing stability
• Tagging experimental unfinished features in the documentation
• Release soon and release often mentality
15.5.4 How is Shinken’s code organized
The Shinken code is in the shinken directory. All important source files are :
• bin/shinken-* : source files of daemons
426 Chapter 15. Development

Shinken Documentation, Release 2.4
• shinken/objects/item.py : base class for nearly all important objects like hosts, services and contacts.
• shinken/*link.py : class used by Arbiter to connect to daemons.
• shinken/modules/*/*py : modules for daemons (like the Broker).
• shinken/objects/schedulingitem.py : base class for host/service that defines all the algorithms for scheduling.
15.5.5 Datadriven programming in Shinken code
A very important thing in Shinken code is the data programming method : instead of hardcoding transformation forproperties, it’s better to have a array (dict in Python) that described all transformations we can use on these properties.
With this method, a developer only needs to add this description, and all transformations will be automatic (likeconfiguration parsing, inheritance application, etc).
Nearly all important classes have such an array. It’s named “properties” and is attached to the class, not the objectitself.
Global parameters of the application (like the one for nagios.cfg file) are in the properties of the Config class. Theyare defined like: ‘enable_notifications’ : {‘required’:False, ‘default’:‘1’, ‘pythonize’: to_bool, ‘class_inherit’ : [(Host,None), (Service, None), (Contact, None)]},
Here, this property is:
• not required
• It’s default value is 1
• We use the ‘to_bool’ function to transform the string from the configuration file to a Python object
• We put this value in the Host and Service class with the same name (None==keep the name). The string in placeof None, this string is used to access this property from the class.
Specific properties for objects like Hosts or Services are in a properties dict(dictionary), but without the ‘class_inherit’part. Instead of this, they have the “fill_brok” part. A “brok” is an inter process message. It’s used to know if theproperty must be sent in the following brok types:
• full_status : send a full status brok, like at daemon starting.
• check_result : send when a check came back
• next_schedule : send when a new check is scheduled
These classes also have another “properties” like dict : “running_properties”. It’s like the standard one, but for runningonly properties (aka no configuration based properties).
15.5.6 Programming with broker modules in Shinken
Modules are pieces of code that are executed by a daemon.
Module configuration and startup is controlled in the modules/*.cfg files
• The module is declared in a daemon
• The module itself is defined and its variables set
A shinken module class must have an _init_, init and documentation. A shinken module can use the following func-tions:
• managed_broks: A specific function that will dynamically build calls for functions for specific brok.types if thefunctions exist.
15.5. Hacking the Shinken Code 427

Shinken Documentation, Release 2.4
• manage_NAME-OF-BROK-TYPE_broks: The function that will process a specific type of brok
The brok types are created in the code and are not registered in a central repository. At this time the following broktypes exist and can be processed by broker modules.
• clean_all_my_instance_id
• host_check_resulthost_next_schedule
• initial
• initial_command_status
• initial_contactgroup_status
• initial_contact_status
• initial_hostgroup_status
• initial_host_status
• initial_poller_status
• initial_reactionner_status
• initial_receiver_status
• initial_scheduler_status
• initial_servicegroup_status
• initial_service_status
• initial_timeperiod_status
• log
• notification_raise
• program_status
• service_check_result
• service_check_resultup
• service_next_schedule
• update
• update_host_status
• update_poller_status
• update_program_status
• update_reactionner_status
• update_receiver_status
• update_scheduler_status
• update_service_status
15.5.7 Example of code hacking : add a parameter for the flapping history
• Configuration part
• Running part
428 Chapter 15. Development

Shinken Documentation, Release 2.4
• The perfect patch
In the Nagios code, the flapping state history size is hard coded (20). As in the first Shinken release. Let’S see how itworks to add such a parameter in the global file and use it in the scheduling part of the code.
We will see that adding such a parameter is very (very) easy. To do this, only 5 lines need to be changed in :
• config.py : manage the global configuration
• schedulingitem.py : manage the scheduling algorithms of host/services
Configuration part
In the first one (config.py) we add an entry to the properties dict :
"flap_history" : {"required":False, "default":'20", "pythonize": to_int, "class_inherit" : [(Host, None), (Service, None)]},
So this property will be an option, with 20 by default, and will be put in the Host and Service class with the name‘flap_history’.
That’s all for the configuration! Yes, no more add. Just one line :)
Running part
Now the scheduling part (schedulingitem.py). The hard code 20 was used in 2 functions : add_flapping_change andupdate_flapping. From this file, we are in an object named self in Python. To access the ‘flap_history’ of the Host orService class of this object, we just need to do :
flap_history = self.__class__.flap_history Then we change occurrences in the code : if len(self.flapping_changes)flap_history: [...] r += i*(1.2-0.8)/flap_history + 0.8 r = r / flap_history
That’s all. You can test and propose the patch in the devel list. We will thank you and after some patch proposals, youcan ask for a git access, you will be a Shinken developer :)
The perfect patch
If you can also add this property in the documentation (/doc directory)
If you followed the Python style guide. (See development rules)
If you created an automated test case for a new feature. (See development rules)
If you documented any new feature in the documentation wiki.
The patch will be perfect :)
15.6 Shinken documentation
15.6.1 About this documentation
This documentation uses Python-sphinx 1, which itself uses reStructuredText 2 syntax.
1 http://sphinx.pocoo.org/2 http://docutils.sourceforge.net/rst.html
15.6. Shinken documentation 429
Shinken Documentation, Release 2.4
The guidelines below are loosely based on the documentation-style-guide-sphinx 3 project and improve upon theconverted content of the numerous of contributors to the shinken wiki.
15.6.2 Contribute by...
• Removing all duplicate files / content from the source tree
• Split the configuration parameters that are unused from the unimplemented ones
• Remove the nagios and nagios-specific references (such as unused parameters) from the various pages
• Clean up the gettingstarted / installations section
• Fix the internal links on the “troubleshooting/troubleshooting-shinken” page
• Dedicate a basic page on how to use the shinken.io packs
• Shorten the directory names in the source directory for shorter links
• Find or create the correct targets for:
– the “configuringshinken/objectdefinitions#retention_notes” links, referenced multiple times by
* “configobjects/service”
* “configobjects/host”
– the “internal_metrics” links, or create the page based on http://www.shinken-monitoring.org/wiki/internal_metrics
– the original “thebasics/cgis” links spread across the documentation
15.6.3 Directory structure
15.6.4 Filenames
Use only lowercase alphanumeric characters and - (minus) symbol.
Suffix filenames with the .rst extension.
15.6.5 Indentation
Indent with 2 spaces.
Attention: Except the toctree directive, it requires a 3 spaces indentation.
15.6.6 Blank lines
Two blank lines before overlined sections, i.e. before H1 and H2. See Headings for an example.
One blank line to separate directives.
3 http://documentation-style-guide-sphinx.readthedocs.org/en/latest/index.html
430 Chapter 15. Development

Shinken Documentation, Release 2.4
Some text before.
.. note::
Some note.On multiple lines.
Exception: directives can be written without blank lines if they are only one line long.
.. note:: A short note.
15.6.7 Headings
Use the following symbols to create headings:
1. = with overline
2. =
3. -
4. ~
If you use more then 4 levels, it’s usually a sign that you should split the file into a subdirectory with multiple chapters.
As an example:
==================H1: document title==================
Introduction text.
Sample H2=========
Sample content.
Another H2==========
Sample H3---------
Sample H4~~~~~~~~~
And some text.
There should be only one H1 in a document.
Note: See also Sphinx’s documentation about sections 4.
4 http://sphinx.pocoo.org/rest.html#sections
15.6. Shinken documentation 431

Shinken Documentation, Release 2.4
15.6.8 Code blocks
Use the code-block directive and specify the programming language if appropriate. As an example:
.. code-block:: python
import this
The :: directive works for generic monospaced text as used in configuration files and shell commands
::
define {parameter
}
15.6.9 Links
The definition of a target for a link is done by placing an anchor.
.. _path-to-file/rst-filename: // placed on top of every file
.. _path-to-file/index: // placed in every index file, in every subdirectory of the source directory
.. _path-to-file/subdirectory/rst-filename: // placed on top of a file in a subdirectory
.. _path-to-file/rst-filename#anchor_on_the_page: // placed as an in-page anchor to a title
Anchor on the page------------------
Links to the above anchors are made with the :ref: directive
:ref:`this is a reference of the first anchor <path-to-file/rst-filename>`.:ref:`this is a reference of the last anchor <path-to-file/rst-filename#anchor_on_the_page>`
Note that we use underscores in the in-page anchors on titles, but use the - (minus) symbol in the rest of the links.This has the advantage that a part of the file path can be copy-pasted when building links and only in-page anchors ontitles need some extra care when making links.
15.6.10 References
Optional when using a lot of references: use reference footnotes with the target-notes directive. As an example:
=============Some document=============
Some text which includes links to `Example website`_ and many other links.
`Example website`_ can be referenced multiple times.
(... document content...)
And at the end of the document...
References==========
432 Chapter 15. Development

Shinken Documentation, Release 2.4
.. target-notes::
.. _`Example website`: http://www.example.com/
15.6.11 Documenting code
The documentation build process picks up your docstrings. See the python docstring guide.
15.6.12 References
15.6. Shinken documentation 433

Shinken Documentation, Release 2.4
434 Chapter 15. Development

CHAPTER 16
Deprecated
The following content is deprecated in this Shinken version and may be completely removed soon.
435
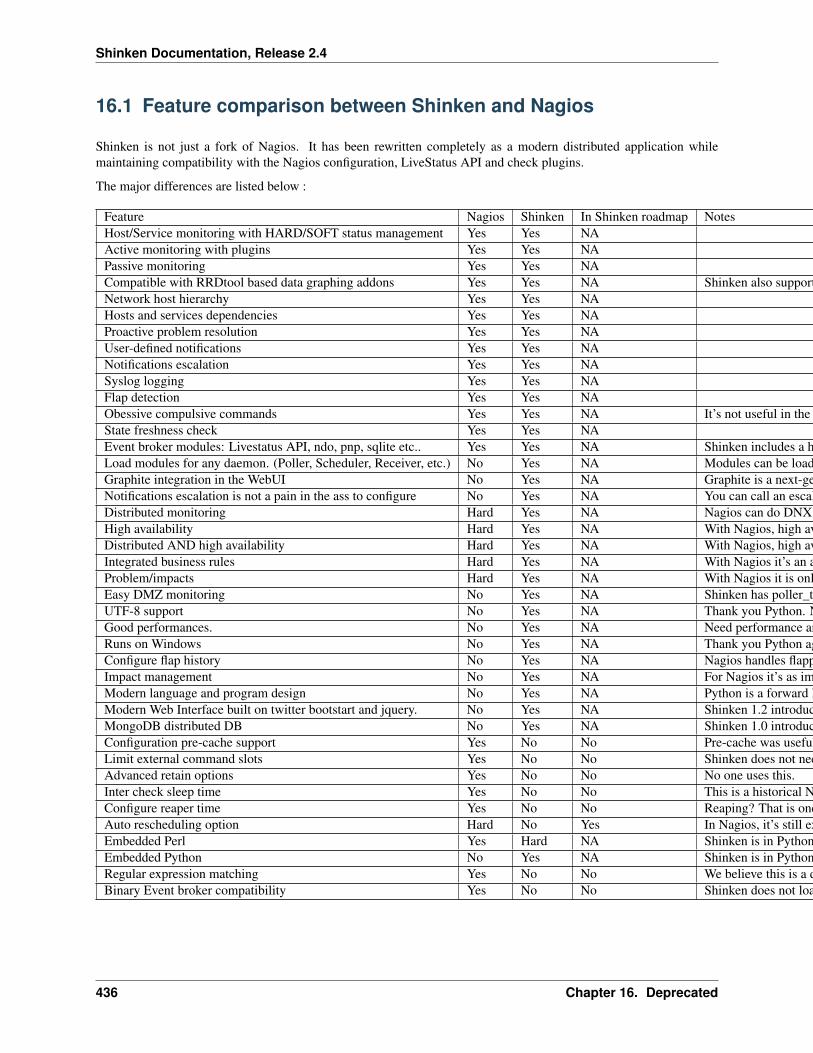
Shinken Documentation, Release 2.4
16.1 Feature comparison between Shinken and Nagios
Shinken is not just a fork of Nagios. It has been rewritten completely as a modern distributed application whilemaintaining compatibility with the Nagios configuration, LiveStatus API and check plugins.
The major differences are listed below :
Feature Nagios Shinken In Shinken roadmap NotesHost/Service monitoring with HARD/SOFT status management Yes Yes NAActive monitoring with plugins Yes Yes NAPassive monitoring Yes Yes NACompatible with RRDtool based data graphing addons Yes Yes NA Shinken also supports forwarding performance data to Graphite and has native Graphite template based graphs in the WebUI.Network host hierarchy Yes Yes NAHosts and services dependencies Yes Yes NAProactive problem resolution Yes Yes NAUser-defined notifications Yes Yes NANotifications escalation Yes Yes NASyslog logging Yes Yes NAFlap detection Yes Yes NAObessive compulsive commands Yes Yes NA It’s not useful in the Shinken architecture but it makes the switch to Shinken easier.State freshness check Yes Yes NAEvent broker modules: Livestatus API, ndo, pnp, sqlite etc.. Yes Yes NA Shinken includes a host of native Python modules to make it easy to extend and support. Other supported integration modules : Graphite time-series database, GLPI, MongoDB, memcached, redis and more.Load modules for any daemon. (Poller, Scheduler, Receiver, etc.) No Yes NA Modules can be loaded for any daemon. This makes supporting, extending and scaling Shinken very easy.Graphite integration in the WebUI No Yes NA Graphite is a next-generation time-series database and visualisation web application/API. It stores non interpolated data in a distributed and scalable manner. The current standard RRD interpolates all data limiting its applicability.Notifications escalation is not a pain in the ass to configure No Yes NA You can call an escalation from any host or service. That’s way easier to use!Distributed monitoring Hard Yes NA Nagios can do DNX, but it’s not as easy to manage than Shinken architecture, and not as efficient.You think “easy as in cloud”?That’s Shinken.High availability Hard Yes NA With Nagios, high availability implies a huge performance hit.Distributed AND high availability Hard Yes NA With Nagios, high availability implies a huge performance hit, and it is harder to get working and to maintain.Integrated business rules Hard Yes NA With Nagios it’s an addon, so it’s not easily manageable in a distributed configuration.Problem/impacts Hard Yes NA With Nagios it is only available in the notification part, but with Shinken it’s also available in the real time monitoring views!Easy DMZ monitoring No Yes NA Shinken has poller_tag that allow the user to put a poller in a DMZ and do all DMZhosts/services with it. It make less Firewall holes.UTF-8 support No Yes NA Thank you Python. Now %µ~@^-nöel is supported as a host name.Good performances. No Yes NA Need performance and scalability ? Try that with Nagios. . .Runs on Windows No Yes NA Thank you Python again. Flexible monitoring : direct WMI or Powershell queries!Configure flap history No Yes NA Nagios handles flapping for the 20 latest states only. It’s hard-coded. In Shinken it’s a configuration option.Impact management No Yes NA For Nagios it’s as important when an incident impacts a qualification application or a production one. Shinken computes dynamically the business impact of the root problem based on criticality!Modern language and program design No Yes NA Python is a forward looking and easy to program language. Shinken was developed using a TDD approach and makes use of modules with all the daemons to make it easy to extend and stability oriented.Modern Web Interface built on twitter bootstart and jquery. No Yes NA Shinken 1.2 introduces a rebuilt WebUI interface which exposes the unique features of the underlying monitoring system.MongoDB distributed DB No Yes NA Shinken 1.0 introduces mongoDB support for Livestatus and as the configuration database for the skonf preview.Configuration pre-cache support Yes No No Pre-cache was useful for host circular relation check. I corrected it in Nagios and in Shinken as well. Pre-cache is no longer a required feature.Limit external command slots Yes No No Shinken does not need to limit the number of external command in queue.Advanced retain options Yes No No No one uses this.Inter check sleep time Yes No No This is a historical Nagios option. Shinken has a real scheduler.Configure reaper time Yes No No Reaping? That is one reason which makes Nagios so slow. Shinken does everything in memory.Auto rescheduling option Hard No Yes In Nagios, it’s still experimental and not documented. This feature is in the roadmap. It can be useful to “smooth” the scheduling load.Embedded Perl Yes Hard NA Shinken is in Python. Perl checks can be loaded using persistent perl, which is a near equivalent to embedded perl, it requires changing the first line of each check. So you do this for the most used perl scripts.Embedded Python No Yes NA Shinken is in Python. Checks can be executed as poller or receiver modules for maximum scalability.Regular expression matching Yes No No We believe this is a dangerous feature for the configuration and that most administrators avoid using it.Binary Event broker compatibility Yes No No Shinken does not load binary modules like the ndomod.o file. It has its own loadable modules written in python : ndo, pnp, graphite, mongodb, sqlite, Livestatus API, NSCA, NRPE, TSCA, syslog, merlin and others
436 Chapter 16. Deprecated

Shinken Documentation, Release 2.4
16.1.1 Change Log
The Changelog file is included in the source root directory of the source code distribution.
16.1. Feature comparison between Shinken and Nagios 437

Shinken Documentation, Release 2.4
438 Chapter 16. Deprecated

CHAPTER 17
Shinken modules
This part must be splitted and sent in all module repositories
439

Shinken Documentation, Release 2.4
440 Chapter 17. Shinken modules

Python Module Index
sshinken.__init__, ??shinken.acknowledge, ??shinken.action, ??shinken.autoslots, ??shinken.bin, ??shinken.borg, ??shinken.brok, ??shinken.check, ??shinken.clients, ??shinken.clients.livestatus, ??shinken.clients.LSB, ??shinken.commandcall, ??shinken.comment, ??shinken.complexexpression, ??shinken.contactdowntime, ??shinken.daemons, ??shinken.daterange, ??shinken.db, ??shinken.db_mysql, ??shinken.db_oracle, ??shinken.db_sqlite, ??shinken.dependencynode, ??shinken.discovery, ??shinken.dispatcher, ??shinken.downtime, ??shinken.easter, ??shinken.eventhandler, ??shinken.graph, ??shinken.load, ??shinken.log, ??shinken.macroresolver, ??shinken.memoized, ??shinken.message, ??shinken.misc, ??shinken.misc.datamanager, ??shinken.misc.filter, ??shinken.misc.md5crypt, ??shinken.misc.perfdata, ??shinken.misc.sorter, ??
shinken.misc.termcolor, ??shinken.notification, ??shinken.objects, ??shinken.objects.businessimpactmodulation,
??shinken.objects.checkmodulation, ??shinken.objects.command, ??shinken.objects.contact, ??shinken.objects.contactgroup, ??shinken.objects.discoveryrule, ??shinken.objects.discoveryrun, ??shinken.objects.escalation, ??shinken.objects.host, ??shinken.objects.hostdependency, ??shinken.objects.hostescalation, ??shinken.objects.hostextinfo, ??shinken.objects.hostgroup, ??shinken.objects.item, ??shinken.objects.itemgroup, ??shinken.objects.macromodulation, ??shinken.objects.matchingitem, ??shinken.objects.module, ??shinken.objects.notificationway, ??shinken.objects.pack, ??shinken.objects.realm, ??shinken.objects.resultmodulation, ??shinken.objects.schedulingitem, ??shinken.objects.service, ??shinken.objects.servicedependency, ??shinken.objects.serviceescalation, ??shinken.objects.serviceextinfo, ??shinken.objects.servicegroup, ??shinken.objects.timeperiod, ??shinken.objects.trigger, ??shinken.property, ??shinken.sorteddict, ??shinken.trigger_functions, ??shinken.util, ??shinken.webui, ??shinken.webui.bottlecore, ??shinken.webui.bottlewebui, ??
441

Shinken Documentation, Release 2.4
shinken.worker, ??
442 Python Module Index