ship-based uav measurements of the marine atmospheric ... uav measurements of the marine atmospheric...
TRANSCRIPT

Ship-based UAV measurements of the marine atmospheric boundary layer in the equatorial Pacific
Luc Lenain, Ken Melville, Ben Reineman and Nick Statom Scripps Institution of Oceanography
Flight support: Lorenz Eber, Cyrus Roohi (NSWCDD)
UNOLS SCOAR meeting – WHOI, June 27 2013
AGOR / UAS Scientific Demonstration Integration during the EquatorMix experiment
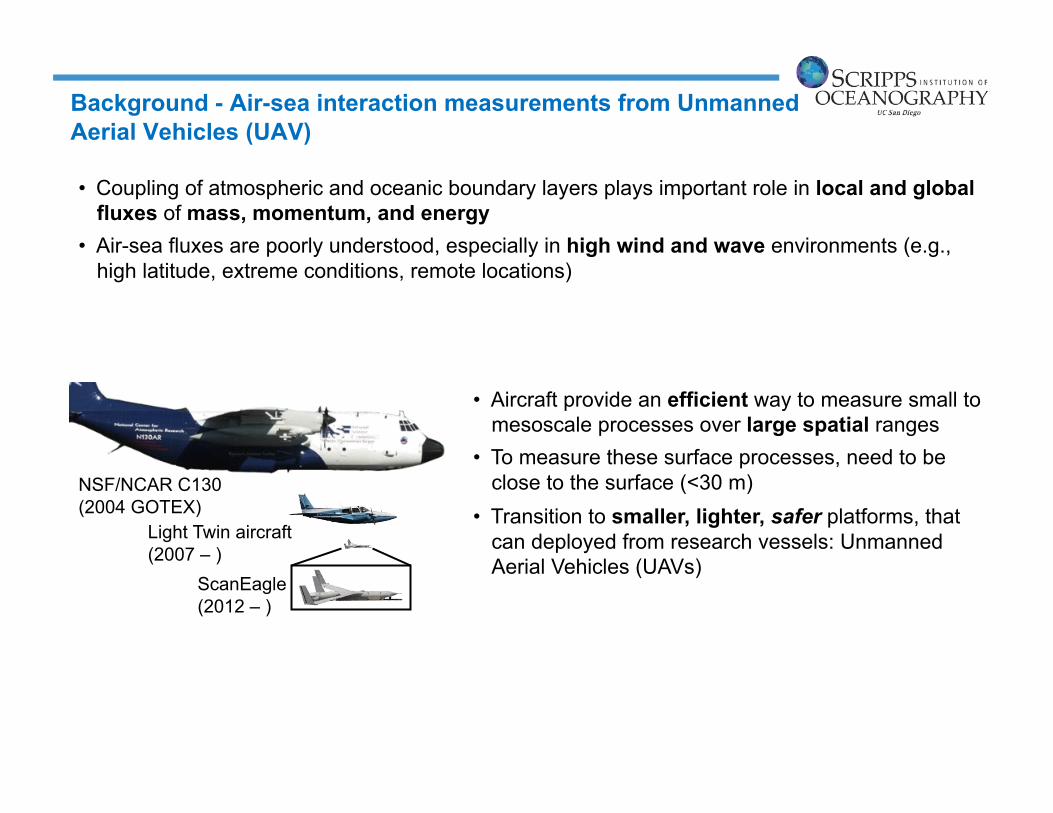
Background - Air-sea interaction measurements from Unmanned Aerial Vehicles (UAV)
• Coupling of atmospheric and oceanic boundary layers plays important role in local and global fluxes of mass, momentum, and energy
• Air-sea fluxes are poorly understood, especially in high wind and wave environments (e.g., high latitude, extreme conditions, remote locations)
NSF/NCAR C130 (2004 GOTEX)
Light Twin aircraft (2007 – )
ScanEagle (2012 – )
• Aircraft provide an efficient way to measure small to mesoscale processes over large spatial ranges
• To measure these surface processes, need to be close to the surface (<30 m)
• Transition to smaller, lighter, safer platforms, that can deployed from research vessels: Unmanned Aerial Vehicles (UAVs)
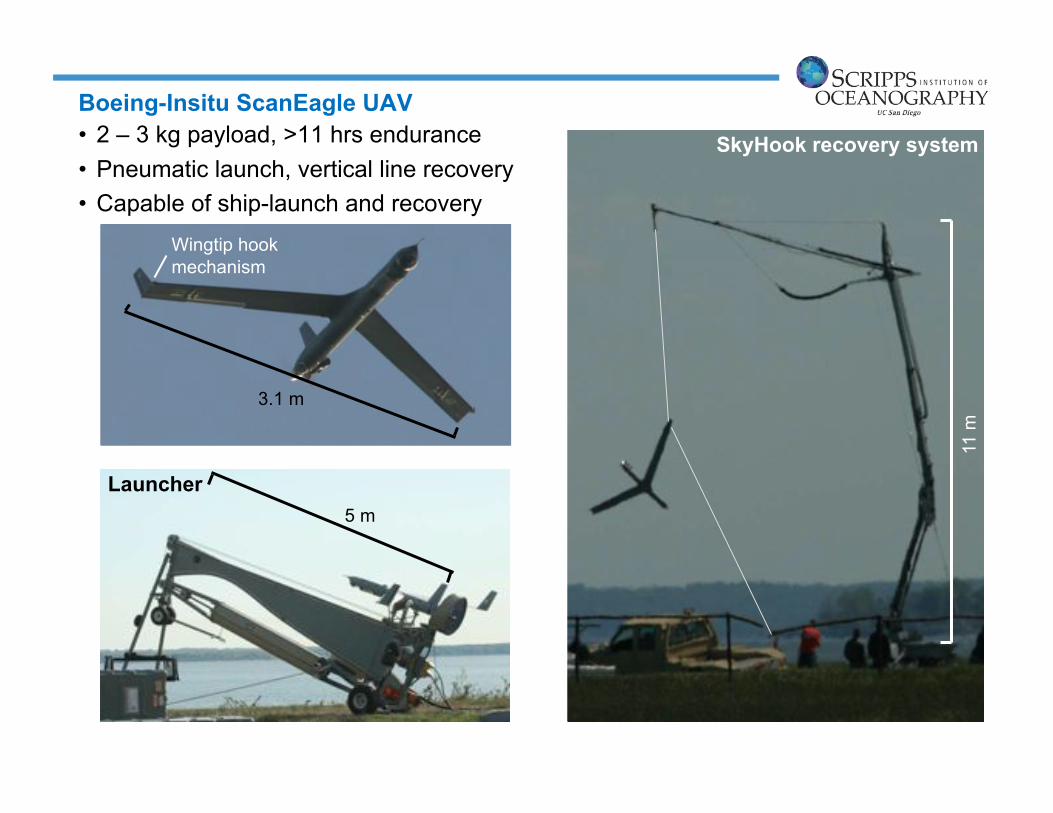
• 2 – 3 kg payload, >11 hrs endurance • Pneumatic launch, vertical line recovery • Capable of ship-launch and recovery
11 m
SkyHook recovery system
Launcher 5 m
3.1 m
Wingtip hook mechanism
Boeing-Insitu ScanEagle UAV

Coincident remote sensing and measurements of energy and momentum fluxes
30 m altitude
Met. package (P,T,RH) Turbulence probe (u,v,w) Fast-response temp., H2O vapor
Video Footprint
RF link to base station
(navigation and control, down-sampled measurements)
for wave measurements
Momentum flux, latent and sensible heat flux
Point lidar
Met. package (P,T,RH) IR/Visible imagery Radiometers
300 m altitude
Flight configuration: “stacked" UAV
ScanEagle
3.1-m wingspan 22-kg max takeoff weight >11hrs endurance (up to 24hr w/o payload)
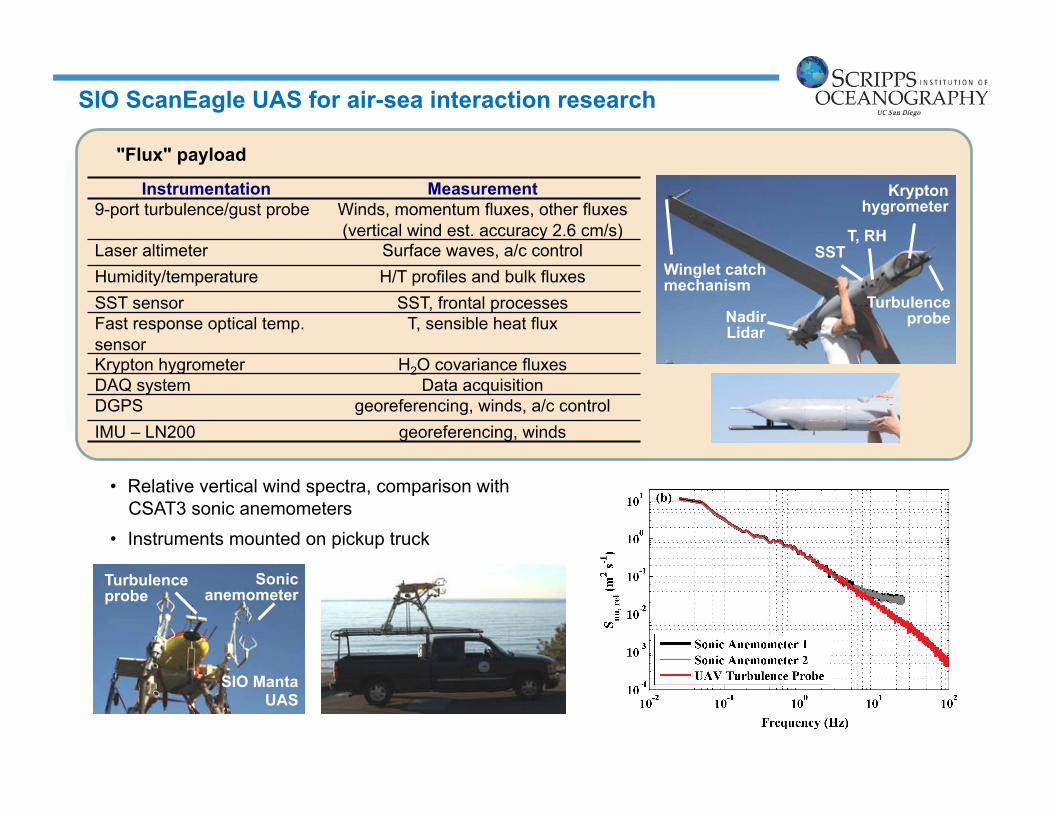
SIO ScanEagle UAS for air-sea interaction research
"Flux" payload
Instrumentation Measurement 9-port turbulence/gust probe Winds, momentum fluxes, other fluxes
(vertical wind est. accuracy 2.6 cm/s) Laser altimeter Surface waves, a/c control Humidity/temperature H/T profiles and bulk fluxes SST sensor SST, frontal processes Fast response optical temp. sensor
T, sensible heat flux
Krypton hygrometer H2O covariance fluxes DAQ system Data acquisition DGPS georeferencing, winds, a/c control IMU – LN200 georeferencing, winds
Turbulence probe Nadir
Lidar
SST T, RH
Winglet catch mechanism
Krypton hygrometer
• Relative vertical wind spectra, comparison with CSAT3 sonic anemometers
• Instruments mounted on pickup truck
Turbulence probe
Sonic anemometer
SIO Manta UAS
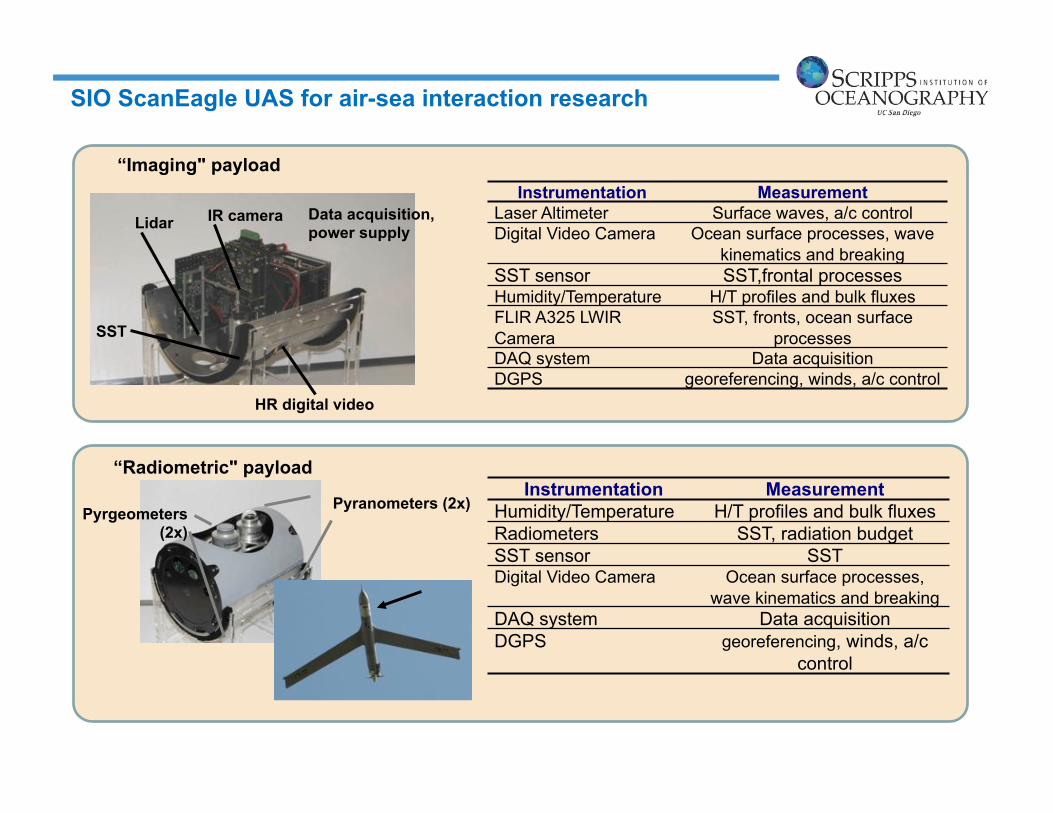
SIO ScanEagle UAS for air-sea interaction research
“Imaging" payload
Pyrgeometers (2x)
Pyranometers (2x) Instrumentation Measurement
Humidity/Temperature H/T profiles and bulk fluxes Radiometers SST, radiation budget SST sensor SST Digital Video Camera Ocean surface processes,
wave kinematics and breaking DAQ system Data acquisition DGPS georeferencing, winds, a/c
control
Instrumentation Measurement Laser Altimeter Surface waves, a/c control Digital Video Camera Ocean surface processes, wave
kinematics and breaking SST sensor SST,frontal processes Humidity/Temperature H/T profiles and bulk fluxes FLIR A325 LWIR Camera
SST, fronts, ocean surface processes
DAQ system Data acquisition DGPS georeferencing, winds, a/c control
HR digital video
IR camera
SST
Data acquisition, power supply Lidar
“Radiometric" payload

Deployment of instrumented ScanEagle UAVs from the R/V Revelle during the Papeete to Nuku Hiva, Tahiti cruise (4 - 22 Oct., 2012; Jerome Smith, Chief Scientist)
ScanEagles will extend the capabilities of the research vessel by measuring air-sea fluxes, marine atmospheric boundary layer (MABL) variables, and surface signatures of ocean boundary layer (OBL) processes.
A. Air-sea Fluxes and the Marine Atmospheric Boundary Layer - Measure momentum, heat, and moisture fluxes, atmospheric soundings, and surface wave measurements - Measure spatial decorrelation scales of the air-sea fluxes and related MABL variables relative to the research vessel.
B. Atmospheric Convection & Precipitation - Measure horizontal entrainment velocities approaching the perimeter of convective cells - Correlation of recently precipitated pools of cooler fresher water at the surface with the convective activity
C. The Diurnal Surface Layer - Coordinated flights with fast CTD profiling the DSL (air-sea fluxes, waves, met.)
D. Surface Wave Processes and Mixing
EquatorMix experiment overview
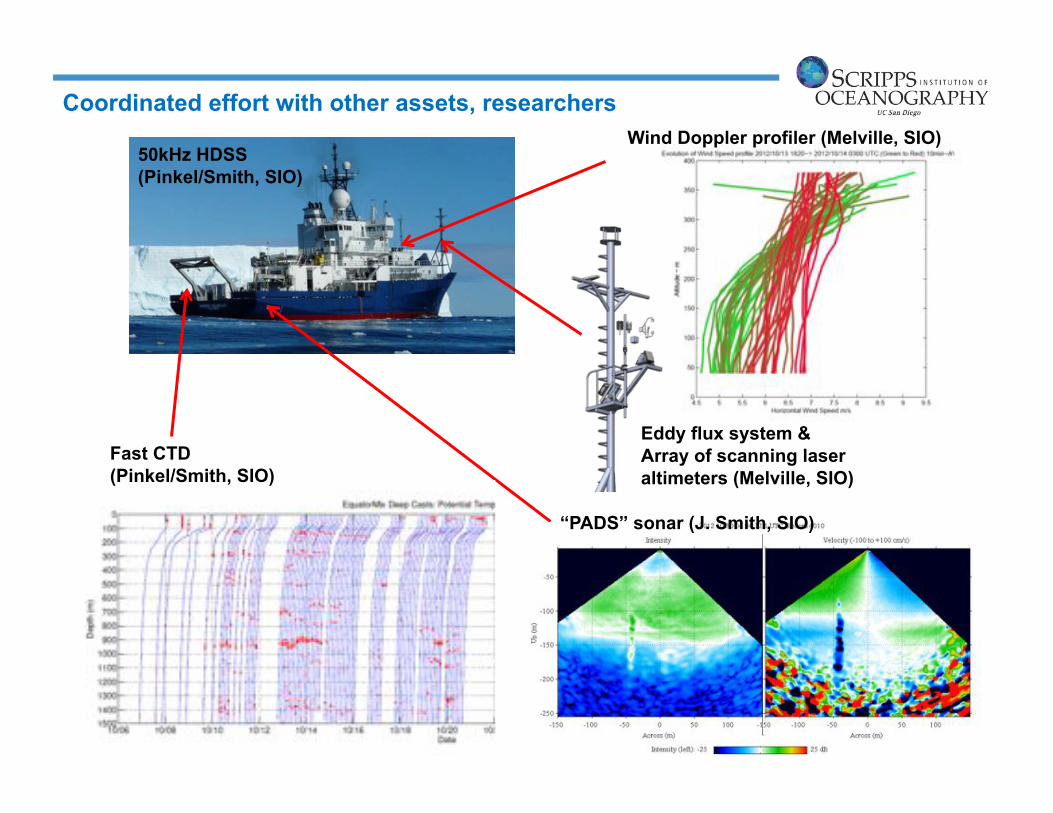
Coordinated effort with other assets, researchers
“PADS” sonar (J. Smith, SIO)
50kHz HDSS (Pinkel/Smith, SIO)
Eddy flux system & Array of scanning laser altimeters (Melville, SIO)
Fast CTD (Pinkel/Smith, SIO)
Wind Doppler profiler (Melville, SIO)

launcher
R/V Revelle UAV launch and recovery equipment
Launcher
SkyHook recovery
vertical line

Movie: EquatorMixSEVideo.mov
Movie: 20121008RecoveryLong.mov At-sea recovery “as seen from the ScanEagle”
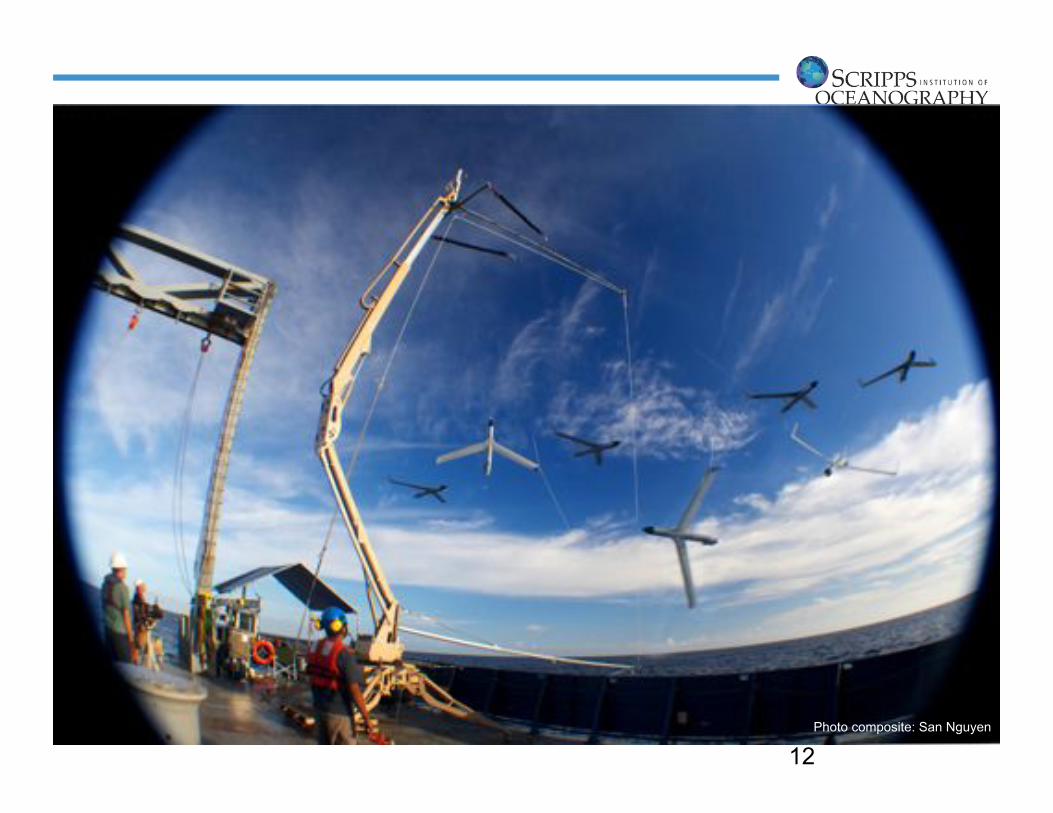
12 Photo composite: San Nguyen

Scientific payload monitoring workstation
UAV pilot workstations
Ground Control Station (GCS)
Tracking antenna (100 km line-of-sight)
Night operations
Inside the Ground Control Station:
ScanEagle
Ship-based UAV operations
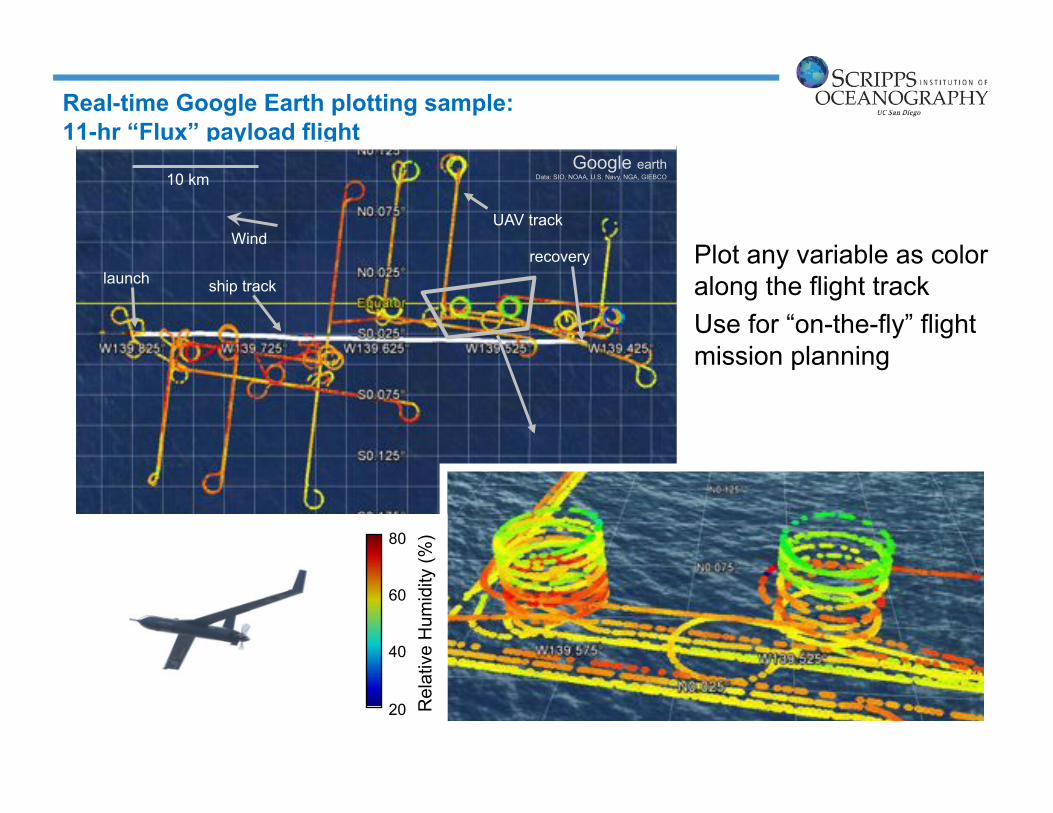
Real-time Google Earth plotting sample: 11-hr “Flux” payload flight
Plot any variable as color along the flight track Use for “on-the-fly” flight mission planning
Google earth Data: SIO, NOAA, U.S. Navy, NGA, GIEBCO
ship track launch recovery
10 km
UAV track Wind
80
60
40
20 Rel
ativ
e H
umid
ity (%
)

UAV profiles of wind, temperature, water vapor A
ltitu
de (m
)
Vertical profiles upwind of the Revelle, during one 11-hr flight (taking off in the middle of the night)

Positive correlation between vertical wind and water vapor, temperature
Verti
cal w
ind
(m/s
) Te
mpe
ratu
re (°
C)
Wat
er v
apor
den
sity
(g/m
3 )
Time (s), starting 16 Oct 2012, 08:12:00 (UTC-10)
Sample low-altitude (32-m) time series
Verti
cal w
ind
(m/s
)
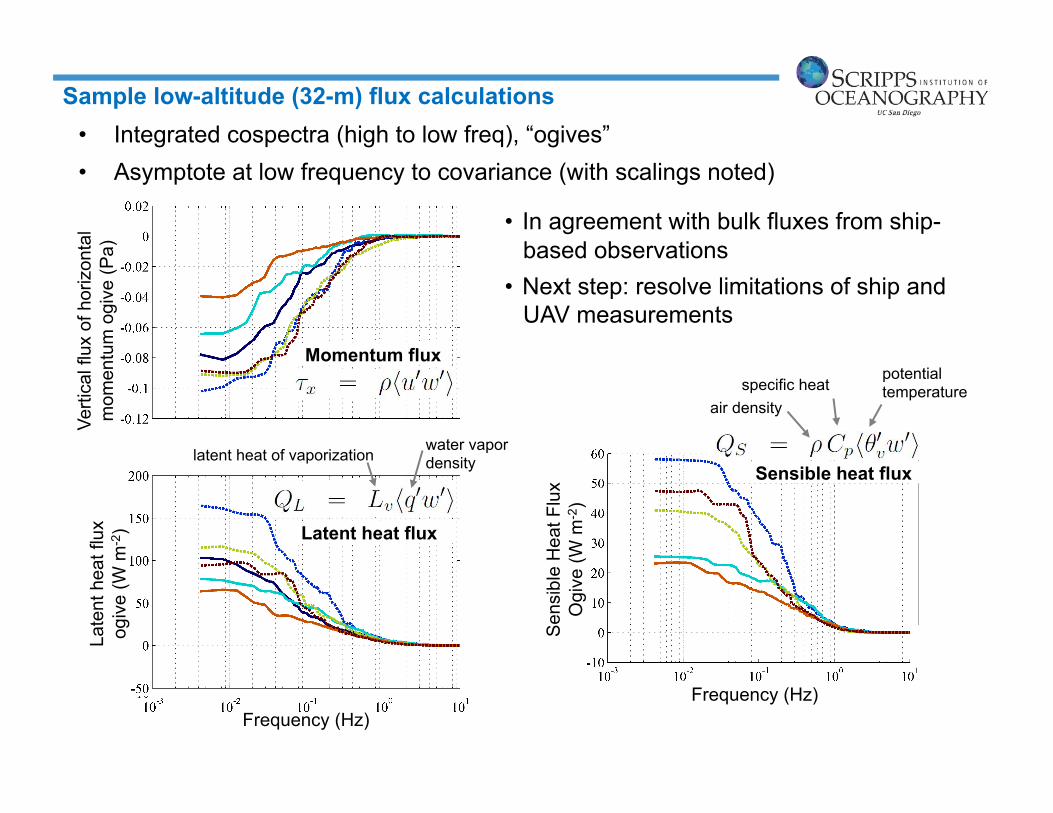
• Integrated cospectra (high to low freq), “ogives” • Asymptote at low frequency to covariance (with scalings noted)
Frequency (Hz) Frequency (Hz)
Late
nt h
eat f
lux
ogiv
e (W
m-2
)
Sen
sibl
e H
eat F
lux
Ogi
ve (W
m-2
)
Verti
cal f
lux
of h
oriz
onta
l m
omen
tum
ogi
ve (P
a)
Latent heat flux
Sensible heat flux
Momentum flux
• In agreement with bulk fluxes from ship-based observations
• Next step: resolve limitations of ship and UAV measurements
latent heat of vaporization
air density specific heat
potential temperature
water vapor density
Sample low-altitude (32-m) flux calculations
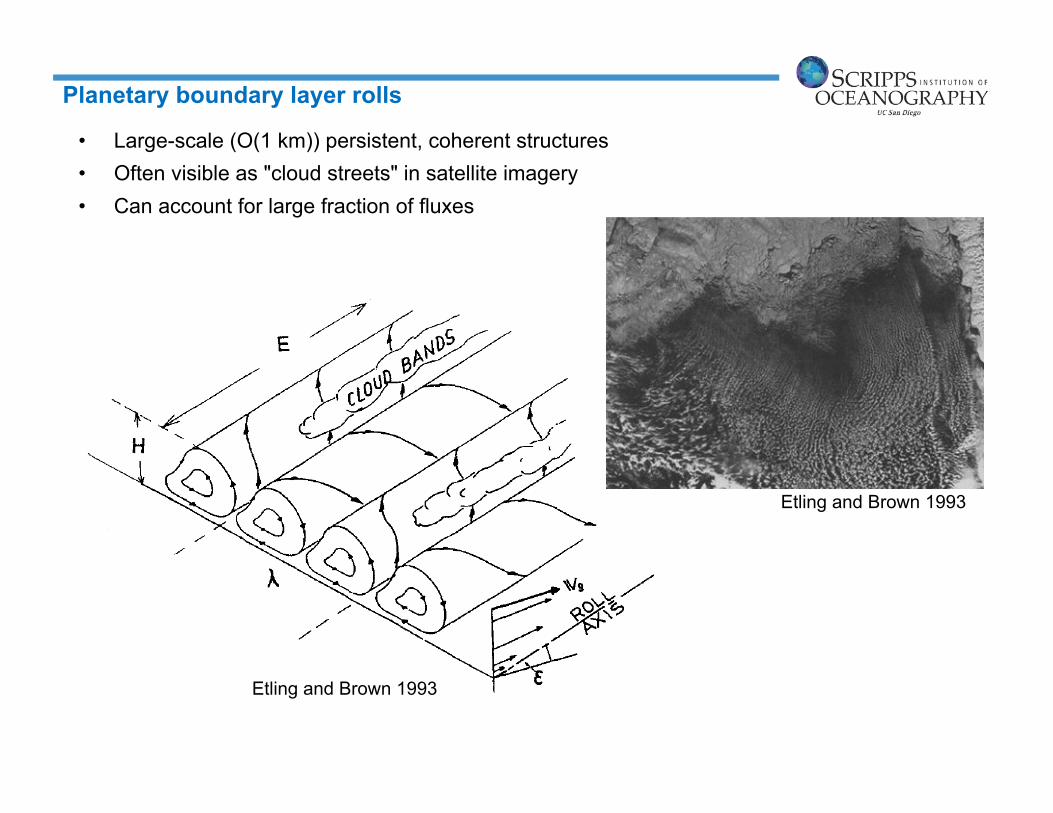
• Large-scale (O(1 km)) persistent, coherent structures • Often visible as "cloud streets" in satellite imagery • Can account for large fraction of fluxes
Etling and Brown 1993
Etling and Brown 1993
Planetary boundary layer rolls
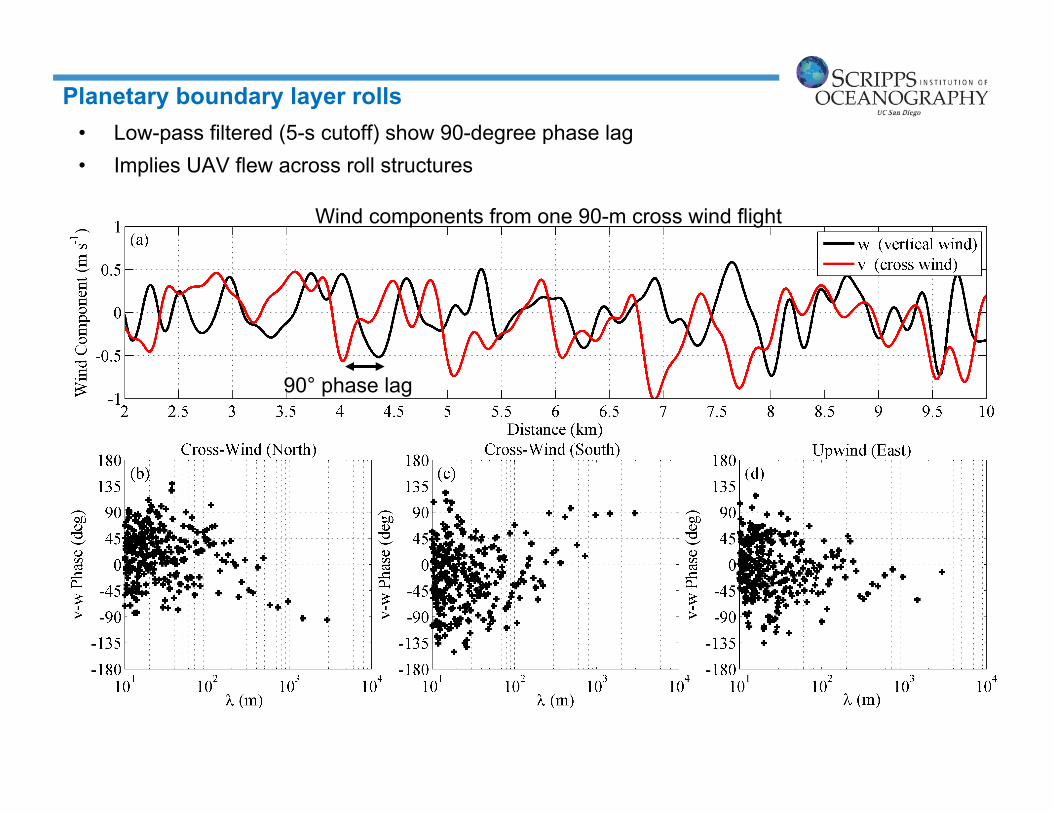
• Low-pass filtered (5-s cutoff) show 90-degree phase lag • Implies UAV flew across roll structures
Wind components from one 90-m cross wind flight
90° phase lag
Planetary boundary layer rolls

• Visible and infrared imagery captured by Imaging payload (300 m AGL)
• During vertically-stacked formation – Flux payload UAV (30 m) in field of view
• Permits analyses of surface fluxes in the context of surface kinematics
100 m
Visible Infrared
10-m wind = 9 m/s 100 m
whitecap
whitecap
Sample imagery, stacked ScanEagle flight

• Developed systems for measurement of momentum, energy fluxes within atmospheric boundary layer from UAVs
• Permit coincident remote sensing measurements of surface (imagery, IR, lidar)
• Advantages over manned aircraft experiments: – Introduces no significant human risk during low-altitude flights – Long endurance (> 11 hours) – No transit time (already on-site right after take off)
• First direct air-sea flux measurements from a ship-launched UAV during EquatorMix off R/V Revelle
• 71 flight-hours were accumulated over 12 days.
Reineman, B. D., L. Lenain, N. M. Statom, W. K. Melville, 2013. Development and testing of instrumentation for UAV-based flux measurements within terrestrial and marine atmospheric boundary layers. J. Atmos. Oceanic Technol., In press
Summary: UAV-based atmospheric, oceanic measurements from research vessels
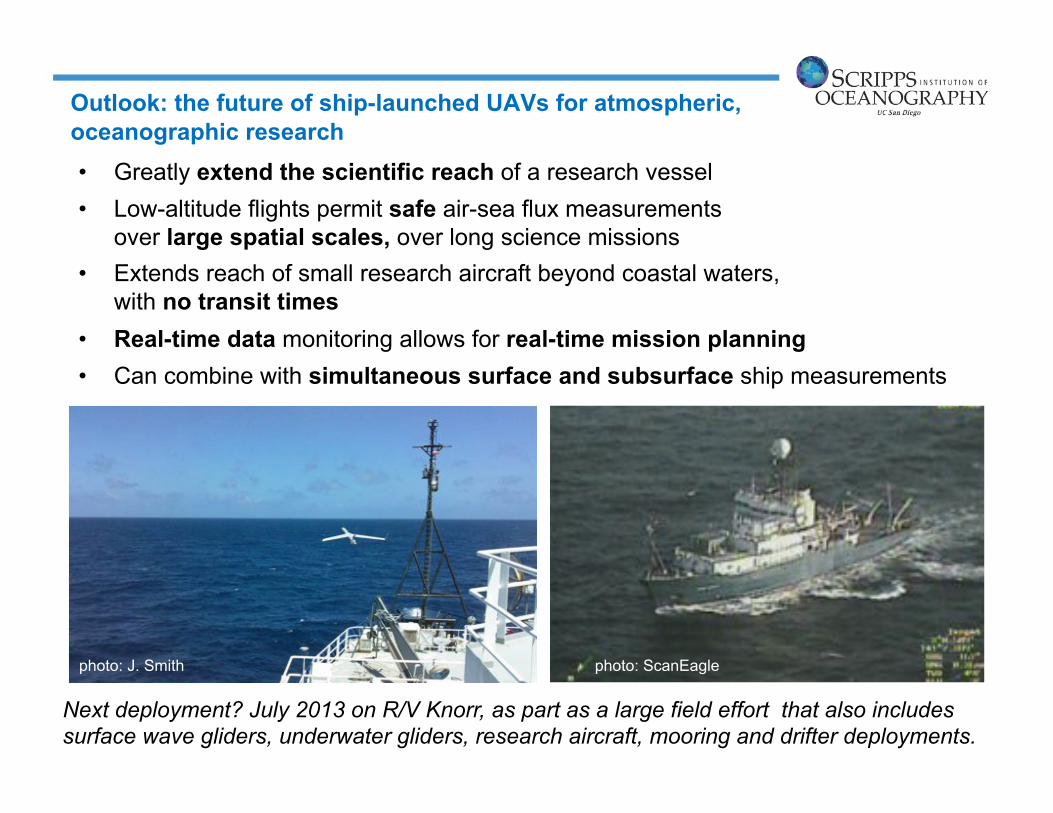
Outlook: the future of ship-launched UAVs for atmospheric, oceanographic research • Greatly extend the scientific reach of a research vessel • Low-altitude flights permit safe air-sea flux measurements
over large spatial scales, over long science missions • Extends reach of small research aircraft beyond coastal waters,
with no transit times • Real-time data monitoring allows for real-time mission planning • Can combine with simultaneous surface and subsurface ship measurements
photo: J. Smith photo: ScanEagle
Next deployment? July 2013 on R/V Knorr, as part as a large field effort that also includes surface wave gliders, underwater gliders, research aircraft, mooring and drifter deployments.

• Employ unmanned systems in forward operating areas: demonstration experiment aboard R/V Knorr
• Autonomous vehicles:
Instrumented wavegliders (SPAWAR), SLOCUM (OSU,NRL), ScanEagles (SIO/NSWCDD),
met. and wave buoys (NPS, SIO), profiling balloon and kite radiosondes (NPS)
• Science objectives, measurements:
– Time-varying 3D structure of MABL (vert. profiles wind, temp, humidity)
– Response of MABL to SST, subsurface structure, and visa versa
– Real-time data assimilation of measurements into Coupled Ocean/Atmosphere Prediction System (COAMPS) (NPS, NRL)
– Electromagnetic propagation monitoring, model evaluation (SPAWAR, SIO)
Skyhook and launcher installation today/tomorrow on R/V Knorr!
http://auvac.org
Trident Warrior 2013 (TW13), R/V Knorr July 13-18 2013

• “Inversions” in the M-profile:
– blind zones, Height errors (3D radar)
– “Clutter rings,” lower signal to noise
• EM waves “trapped” in evaporation duct
http://www.youtube.com/watch?feature=player_embedded&v=QjIxRMWM5do
Yardim 2007
without ducting
With ducting
EM propagation in evaporation ducts
Yardim 2007
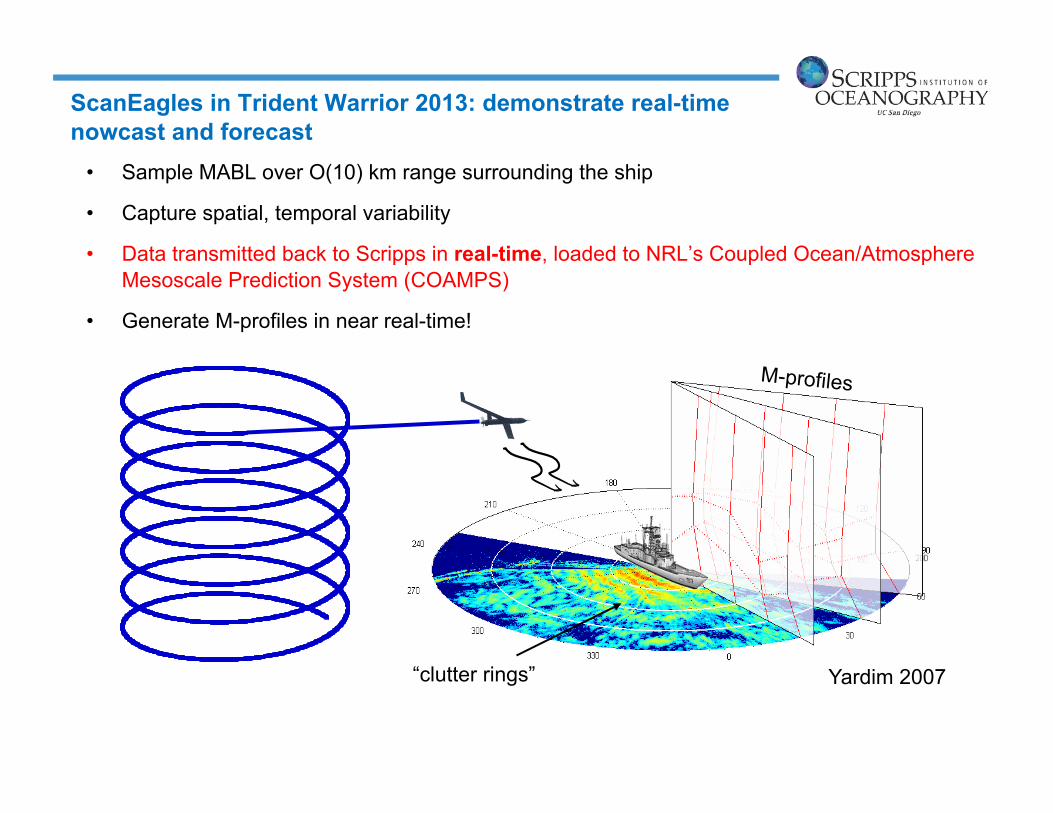
• Sample MABL over O(10) km range surrounding the ship
• Capture spatial, temporal variability
• Data transmitted back to Scripps in real-time, loaded to NRL’s Coupled Ocean/Atmosphere Mesoscale Prediction System (COAMPS)
• Generate M-profiles in near real-time!
M-profiles
“clutter rings”
ScanEagles in Trident Warrior 2013: demonstrate real-time nowcast and forecast

Thank you!
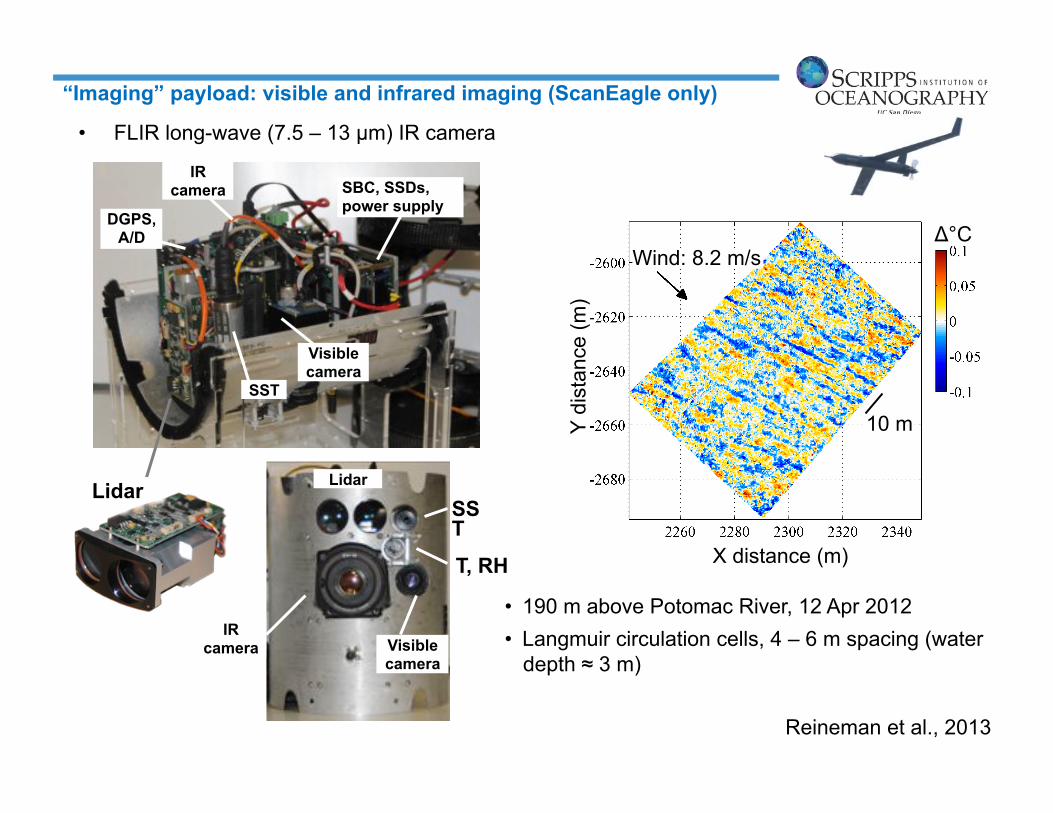
“Imaging” payload: visible and infrared imaging (ScanEagle only)
• FLIR long-wave (7.5 – 13 !m) IR camera
SST
Lidar
SBC, SSDs, power supply
DGPS, A/D
Visible camera
Lidar
SST
Visible camera
IR camera
T, RH
IR camera
• 190 m above Potomac River, 12 Apr 2012 • Langmuir circulation cells, 4 – 6 m spacing (water
depth " 3 m)
Wind: 8.2 m/s
X distance (m) Y
dist
ance
(m)
10 m
#°C
Reineman et al., 2013

Electromagnetic wave propagation: Modified refractivity profile
• Index of refraction, n = c/v
n ! 1.000250 – 1.000400
• Refractivity, N = (n ! 1) "106
N = N(Temperature, RH, Pressure)
• Modified refractivity, M
changes into a “flat earth” problem
"M/"z = 0 # rays stay at const. altitude (curve downward at same rate as earth’s curvature)
"M/"z > 0 # rays bend up
"M/"z < 0 # rays bend down
28
from AREPS Manual, 2005
Inversion
Mixed layer
Standard atmosphere
M-profile Humidity Temp.
Hei
ght
Yardim 2007
EM velocity
Speed of light in vacuum Trident Warrior 2013 (TW13), R/V Knorr July 13-18 2013