ship turnaround times in port: comparative analysis of ...ship turnaround times in port: comparative...
TRANSCRIPT
Ship Turnaround Times in Port: Comparative Analysis of Ocean Container Carriers Claude Comtois Brian Slack May 2019
CIRRELT-2019-20
Ship Turnaround Times in Port: Comparative Analysis of Ocean Container Carriers
Claude Comtois1,2,*, Brian Slack1,3
1 Interuniversity Research Centre on Enterprise Networks, Logistics and Transportation (CIRRELT)
2 Department of Geography, Université de Montréal, 520, Côte-Ste-Catherine, Montréal, Canada H2V 2B8
3 Department of Geography, Planning & Environment, Concordia University, Henry F. Hall Building, 1455 de Maisonneuve Blvd. W., Montreal, Canada, H3G 1M8
Abstract. There is general recognition that port turnaround times of container ships vary
considerably. Recent efforts to explain the differences have employed factors involving port
efficiency and the numbers of containers transferred, with only limited success. In this paper
the role of the shipping lines is considered. Eighteen global carriers are selected and their
average turnaround times (ATTs) in 20 ports on three East-West and one North-South trade
route are obtained. By comparing the ATT of each carrier in each port with the overall ATT
of that port provides a measure of relative carrier performance, thereby identifying a
standard of performance independent of overall port activity. A wide range of scores are
indicated, with several carriers recording much longer relative ATT scores overall, including
CMA-GGM, APL and UASC while Evergreen, Yang Ming and Maersk record the lowest
(and best) scores. The results suggest that carriers have a role to play in in port turnaround
times. Two factors are examined: on-time arrivals and ship stowage plans. The results of
the analysis are used to assess the recent round of restructuring of the global shipping
alliances and the extent to which the partnerships reflect differences in ATTs. Suggestions
for further research are presented.
Keywords. Times in port, differences between carriers, container carrier strategies.
Acknowledgment. This research was supported by grant 435-20914-1196 awarded by the
Social Science and Humanities Research Council of Canada.
Results and views expressed in this publication are the sole responsibility of the authors and do not necessarily reflect those of CIRRELT.
Les résultats et opinions contenus dans cette publication ne reflètent pas nécessairement la position du CIRRELT et n'engagent pas sa responsabilité. _____________________________ * Corresponding author: [email protected]
Dépôt légal – Bibliothèque et Archives nationales du Québec Bibliothèque et Archives Canada, 2019
© Comtois, Slack and CIRRELT, 2019
1 Introduction
Time is one of the most important factors shaping container shipping. The imperative of
providing weekly services helps determine the number of vessels deployed and the selection of
ports of call (Agarwal and Ergom 2008). For shippers, supply chains are shaped by arrival and
departure times of vessels, and their choice of port is often made on the basis of accessibility and
proximity, both of which have a time dimension (Tongzon 2009). From the perspective of the
shipping line there are two constituents of time: time at sea and time in port. In the academic
literature most attention has been given to the former, partly because transit times between ports
are usually the longest components of shipping services (Brouer et al 2013). Another reason
arises out of the recent adoption of slow steaming, precipitated by high fuel costs, that has
required adjustments in service configurations as well as the number of vessels deployed (Cariou
and Notteboom 2011). In this paper the focus is on time in port. An individual port call may be
of little more than 24 hours duration, but since most container services involve many port calls,
between 10 and 18 on most complete runs involving outbound and return legs, the cumulative
total of times in port represent a quite significant component of service duration.
The time consumed in each port call comprises several components: the process of attaching
mooring lines and securing the vessel at the berth, providing ship supplies and bunkering, but
most time consuming operation is that of unloading and loading containers between ship and
shore. The amount of time taken up with cargo handling depends upon the relative efficiency of
port operations, not just the ship-to-shore gantry cranes, but also the operations in the terminal
area from container stacks to berth-side and the patterns of arrival and departure of containers
through entry gates. Recent attempts to quantify the relationships between average terminal
turnaround times (ATTs) and port terminal efficiency variables at a global level (Ducruet et al.
2014; Slack et al 2018) the correlations have been found to be weak at best.
Slack et al (2018) observed that ATTs are differentiated regionally, with East and North Asian
ports having the shortest ATTs and the West Coast US and African ports generating the longest
ATTs. When ATTs were disaggregated regionally much higher levels of associations with
efficiency measures were obtained. Other research has revealed that transhipment ports
turnaround ships faster than others (Cullinane et al 2006) and mega ships require longer terminal
times than smaller vessels (Merk 2015), thus indicating that types of vessels or port functions
may influence ATTs.
Ship Turnaround Times in Port: Comparative Analysis of Ocean Container Carriers
CIRRELT-2019-20 1
The present paper seeks to extend and deepen understanding of ships time in port by considering
additional factors that influence ATTs. The length of time ships spend in port tends to be seen
as an outcome of port operational problems, but the shipping lines themselves may play a role
in explaining in ATTs. As confirmed in the following literature review different carriers have
different service orientations and approaches to service performance. It is suggested here that
these differences may impact on times in port, which leads to the first set of research questions:
to what extent do the ATTs of carriers differ? Are there differences between specific ports of
call or across the spectrum of service calls? After providing empirical evidence of differences in
ATTs of the container shipping lines the paper goes on to consider the principal carrier-induced
factors that give rise to slower ship turnarounds.
2 Literature Review
There is considerable evidence in the literature that individual container shipping lines engage
in different practices and strategies to serve customers and operate their fleet of ships. These
differences are in evidence in a range of situations, including the design of shipping networks
where there are contrasts in the use of transhipment hubs (Fremont 2007), in the extent of slot
sharing (Lam et al 2007), and in round the world services (Lim 1996). Differences have been
demonstrated in the form of ownership structures (Slack and Fremont 2009) and the timing of
involvement in strategic alliances (Panayedes and Weidmer 2011). The participation of carriers
in vertical integration with terminal operations (Olivier 2005; Soppe 2009) and their investments
in inland connections (Cariou 2008; Franc et al 2010) have been shown to be highly
differentiated among the global container shipping lines.
In a study comparing the relative levels of efficiency of major container shipping lines Wiegmans
et al (2013) revealed persistent differences between carriers on ranked input and output
performance criteria, such as average ship capacity, throughput per ships and profits per
throughput. The diversity was repeated in the Data Envelopement Analysis (DEA) scores which
led the authors to draw the following conclusions:
first, the differences between the respective container carriers are considerable;
and, secondly, there is no ‘clear’ efficient carrier in terms of cost minimisation
or sales maximisation. (Wiegmans et al 2013 p.71).
Ship Turnaround Times in Port: Comparative Analysis of Ocean Container Carriers
2 CIRRELT-2019-20
Regarding the issue of time differences among carriers the focus in the academic literature has
been on the issue of punctuality of vessel arrivals rather than the length of time spent in port.
One important corpus of research has employed mathematical programming and systems
analysis to analyse case study data drawn from a carrier or a terminal operator with the goal of
improving operational performance (Agarwal and Ergom 2008; Brouer et al 2012; Pani et al
2014; Song et al 2015; Reinhardt et al 2016). In most cases the data sources remain confidential.
Broader in scope are a number of studies that draw on data published annually by Drewry
Shipping Consultants. In 2006 Drewry began monitoring arrival times for 350 port pairs and
comparing them with published schedules. It provides quarterly reports on the punctuality scores
of all the major shipping lines and along major trade routes. Apart from some initial use of the
results by academic researchers, the reports appear to be mainly employed by industry, no doubt
because of their high subscription costs. Notteboom (2006) contrasted the strategies Maersk and
MSC concerning scheduled reliability, suggesting that the former goes out of its way to adhere
to published arrival and departure times, but charges higher rates, while the latter is less strict
but by “seemingly random skipping of one or more ports of call during a round voyage”
(Notteboom 2006 p.33) adjusts to disruptions and temporal dislocations. Other techniques to
ensure schedule reliability adopted by some carriers include the management of their own
terminals, where they may have greater control over vessel turnarounds rather than waiting in a
multi-user facility (Verminnen et al 2007).
While the literature on punctuality agrees that poor performance may be precipitated by
unavoidable issues such as mechanical breakdowns and weather conditions as well as issues in
the ports themselves including lack of berth availability due to congestion or labour disruptions,
it is still unclear what is the role of the carriers themselves.
Comprehensive differences between carriers regarding the length of times in port have been
difficult to analyse in part because of the lack of specific time metrics. In the mid-2000s two
different research teams headed by Saldanha in the USA and Ducruet in France began to use
data on shipping arrival and departures drawn from Lloyds Maritime Intelligence Unit (LMIU)
Shipping Movements Database. This source tracks commercial shipping movements and was
continuously updated by movement data delivered by Lloyds’ agents, Coastguards, Customs,
Port Authorities, and other trusted market sources. The subsequent studies published by Ducruet
(2010, 2012) focused on transit times for container shipping between for 1050 ports in the world
for one month in each of 1996, and 2006 and analysed the resultant network topological
Ship Turnaround Times in Port: Comparative Analysis of Ocean Container Carriers
CIRRELT-2019-20 3
structures, but did not differentiate between carriers on these networks. However, Saldanha et al
(2006) revealed differences in the transit times of different carriers between Busan and Los
Angeles, with COSCO exhibiting the worst transit time performance and Hyundai the best. In a
subsequent paper (Saldanha et al 2009) combined the ocean transit time data with inland
distribution times to markets and estimates of logistics costs. The results provided evidence that
ocean transit time and transit-time reliability have substantial influence on the overall door-to-
door process time and reliability:
Thus, the shippers who select ocean carriers’ services primarily for cost and
convenience are missing important opportunities to cut logistics costs by not making transit time a priority in their selection process. (Saldanha et al 2009, p. 30).
This review of the literature reveals that while the differences between shipping lines are
numerous and multi-dimensional there has been very little comprehensive examination of carrier
differences with regards ship’s time in port. Notteboom (2006) provides only a couple of cases
as examples, and Saldanha et al (2006) compared only the services of carriers between Busan
and Los Angeles. Part of the reason for this has been the difficulty of obtaining actual time
measurements at a comprehensive scale. Such opportunities are now available. In 2002 the
World Maritime Organisation required mandatory reporting of the real time positions of ships,
but was not until the end of the decade that commercial companies such Lloyds Intelligence Unit
began to assemble the data and make it available in comprehensive outputs. It was this data
source that was used in recent papers focusing on ships time in port (Ducruet et al (2014; and
Slack et al (2018). These papers focus exclusively on vessel turnaround times by port and explain
differences by examining port efficiency criteria.
3 Methodology
The Lloyds Intelligence Unit data is organised by individual vessel movements, including the
times of arrival and departure at ports of call. A wide range of vessel characteristics are
displayed, including vessel dimensions, registration, and ownership. In our original data
collection ship movements on three major East-West and one North-South trade routes were
extracted (Trans-Pacific, Trans-Atlantic, Asia-NW Europe, and NW Europe - East Coast of
South America) four months during 2013 (January, May, September and November). All
movements on these trade routes involving 20 selected ports were obtained. The time elapsed
between arrival and departure for each vessel call was calculated for each of the base ports and
Ship Turnaround Times in Port: Comparative Analysis of Ocean Container Carriers
4 CIRRELT-2019-20

50 other intermediate ports of call were calculated. The overall ATT for the 70 ports was 25.53
hrs. (Slack et al 2018).
Unfortunately the Lloyds data only identifies the ship owner of each vessel rather than the ship
operator. There are many vessels listed in the master file we created that belong to companies
that are involved in ship chartering such as Offen and E.R. Schiffahrt. Their ship porfolios are
large and many of their vessels are leased to major shipping lines. It is very complicated to follow
the vessel charters of the independent ship owners and for this reason only the vessels under the
ownership of major ship operating companies were selected. Even here some data manipulation
was required since many carriers possess vessels under different subsidiaries, and thus a merging
of details was required.
The 20 base ports were selected for analysis (see Table 1). To have considered all the
intermediate ports of call as well would have been unwieldy and would have included many
cases where only one carrier was providing service. The matrix of ATTs for the 20 ports contains
involving 18 carriers of the top 20 global container carriers’ average times of are displayed in
Table 1.
4 Analysis
The results reveal a picture of complexity, with differences in ATTs between carriers across all
the ports identified. This observation provides a clear answer to the first research question. It is
already established that there are important differences between the ATTs of individual ports
(Ducruet 2014), but the evidence presented in Table 1 provides indisputable evidence of
differences between the carriers as well. While some of this difference may be due to varying
numbers of containers discharged and loaded by each carrier, for which there are no data
available, the ATT scores are too differentiated between ports for this to provide a full
explanation. In order to further analyse the ATTs of the carriers an examination of the relative
scores of ATTs is undertaken, in which the ATT of each carrier in each port is compared with
the overall port ATT:
(1) Aj-aij, where Aj is the ATT of port j, and aij is the ATT of carrier i in port j
The results of such a comparison produces either a positive or negative score, with a positive
value indicating that the carrier spends less time in the port that than is average for the port (Table
2)
Ship Turnaround Times in Port: Comparative Analysis of Ocean Container Carriers
CIRRELT-2019-20 5

Tab
le 1
C
arrie
r ATT
s in
the
20 b
ase
ports
A
PL
CM
A
CG
M
CO
SCO
C
SCL
. Ev
erg
reen
Ham
bur
g Su
d H
anjin
H
apag
-Ll
oyd
HM
M
K
Line
M
aers
k M
OL
MSC
N
YK
O
OC
L U
ASC
Y
ang
Min
g Zi
m
Mea
n A
TT
Ant
wer
p 61
.43
30
.65
22.4
0 24
.63
21.5
2 40
.27
28.3
9
26.9
3 16
.69
18.1
1 42
.28
34.4
6 23
.56
26
.63
25.2
9 29
.69
Bue
nos
Aire
s
47.4
8
34.9
8 58
.37
38
.51
33
.77
42
.61
Bus
an
11.9
8 18
.06
9.
74
9.95
16.6
7 16
.22
15.2
5 9.
94
12.7
4 25
.05
11.9
1 12
.60
23.7
1
10.5
5 17
.67
14.8
6
Hal
ifax
12
.92
11.4
9
21
.33
15.2
4
Ham
burg
44
.65
44.4
5 45
.41
38.9
0 30
.96
31.0
6 41
.75
42.2
7 54
.40
38.6
6 24
.62
45.7
1 23
.07
35.5
8 45
.30
37.8
1 31
.40
36.4
2 39
.05
Hon
g K
ong
22.1
2 21
.05
15.5
6 19
.83
17.6
4
14.3
5 17
.02
20.0
4 16
.90
14.7
4 17
.85
10.8
2 20
.77
14.0
5 19
.64
14.8
6 14
.33
18.3
7
Le H
avre
20
.88
20.5
6
37.8
1 18
.70
18.6
4 13
.52
17.5
2
20
.78
17.2
3 19
.91
18
.31
41.9
4
23
.09
Long
Bea
ch
72
.22
61.7
6
68.0
6
71
.84
78.5
1
87.0
9
22
.37
60.2
4 Lo
s A
ngel
es
47.4
5
67
.82
49.4
3
73.9
4 19
.85
71.3
2 42
.72
59.9
7 64
.69
57.5
6 72
.78
59.6
9
65.4
5
Mon
treal
68.6
0
54
.58
67
.98
62
.01
63
.29
New
Yor
k
50.0
0
24
.01
31.3
9
23.7
9
19
.36
29.6
9 27
.86
26.0
0 29
.57
Nor
folk
23.3
3
13
.47
21.2
1
15.6
1
14
.97
12.4
3 10
.72
15
.96
Prin
ce
Rup
ert
30.0
3
24.0
0
17.0
6
30.3
2
25.3
5
Rot
terd
am
49.5
4 25
.18
34.1
2 31
.85
38.1
0 24
.49
33.5
8 27
.71
41.5
8 26
.63
22.6
5 29
.91
28.6
9 41
.34
37.6
1 33
.01
28.0
9 37
.86
34.5
8
Sant
os
24
.02
27
.80
32.3
0
24.1
5
18.0
9
25.2
8
Seat
tle
61.5
3 48
.86
28.9
1 35
.99
21.5
5
36.4
4 37
.09
55.6
3 17
.14
31.5
3
37.3
7
Shan
ghai
21
.31
24.1
0 24
.44
23.1
1 14
.90
21
.35
17.5
2 18
.61
20.2
5 18
.42
13.5
0 20
.40
14.1
9 19
.45
24.2
5 19
.37
19.1
8 19
.67
Sing
apor
e 37
.80
25.2
5 22
.83
18.9
0
25
.79
30.7
0 25
.67
23.6
7 28
.80
26.6
7 37
.53
30.0
4 32
.69
18
.79
35.0
6 28
.15
Taco
ma
28.7
6
32
.21
45.1
7 65
.67
34.1
7
42.9
8 37
.20
40.4
5
Van
couv
er
21.0
7 63
.09
28.6
1 49
.89
37.0
0
22.7
7 55
.29
36.1
6 37
.99
56.1
3 23
.84
80.0
8
34.3
8 73
.16
44.2
5
Sour
ce: o
wn
calc
ulat
ions
Ship Turnaround Times in Port: Comparative Analysis of Ocean Container Carriers
6 CIRRELT-2019-20
Tab
le 2
R
elat
ive
Car
rier p
erfo
rman
ce: c
ompa
ring
carri
er A
TTs w
ith p
ort m
ean
ATT
s
A
PL
CM
A
CG
M
CO
SCO
C
SCL.
Ev
ergr
een
Ham
burg
Su
d H
anjin
H
apag
-Ll
oyd
HM
M
K
Line
M
aers
k M
OL
MSC
N
YK
O
OC
L U
ASC
Y
ang
Min
g Zi
m
Ant
wer
p -3
1.74
-0.9
6 7.
29
5.06
8.
17
-10.
58
1.30
2.76
13
.00
11.5
8 -1
2.59
6.13
3.06
4.
40
Bue
nos A
ires
-4
.87
7.
63
-15.
76
4.
10
8.
84
-4.7
7
Bus
an
2.88
-3
.20
5.
12
4.91
-1.8
1 -1
.36
-0.3
9 4.
92
2.12
-1
0.19
2.
95
-8
.85
4.
31
-2.8
1
Hal
ifax
2.
32
3.75
2.
26
-6
.09
Ham
burg
-5
.60
-5.4
0 -6
.36
0.15
8.
09
7.99
-2
.70
-3.2
2 -1
5.35
0.
39
14.4
3 -6
.66
15.9
8
-6.2
5 1.
24
7.65
2.
63
Hon
g K
ong
-3.7
5 -2
.68
2.81
-1
.46
0.73
4.02
1.
35
-1.6
7 1.
47
3.63
0.
52
7.55
3.
47
4.32
-1
.27
3.51
4.
04
Le H
avre
2.
21
2.53
-14.
72
4.39
4.
45
9.57
5.
57
23.0
9
2.31
5.
86
3.18
-2
.40
4.78
-1
8.85
Long
Bea
ch
-1
1.98
-1
.52
-7
.82
-11.
60
-18.
27
-2
6.85
37
.87
Los A
ngel
es
18.0
0
-2
.37
16.0
2
-8.4
9 45
.60
-5.8
7 22
.73
5.48
0.
76
7.89
5.76
Mon
treal
-5.3
1
8.
71
-4
.69
-7.3
3 1.
28
New
Yor
k
-20.
43
5.56
-1
.82
5.
78
10.2
1 -0
.12
1.71
3.
57
Nor
folk
-7.3
7
2.
49
-5.2
5
0.35
0.
99
3.53
5.
24
Prin
ce R
uper
t
-4
.68
1.
35
8.
29
-4
.97
25.3
5
Rot
terd
am
-14.
96
9.40
0.
46
2.73
-3
.52
10.0
9 1.
00
6.87
-7
.00
7.95
11
.93
4.67
5.
89
-3
.03
1.57
6.
49
-3.2
8
Sant
os
1.
26
-2
.52
-7.0
2
1.13
7.19
-6
.76
Seat
tle
-24.
16
-11.
49
8.46
1.
38
15.8
2
0.93
0.
28
-18.
26
20.2
3
5.
84
Shan
ghai
-1
.64
-4.4
3 -4
.77
-3.4
4 4.
77
-1
.68
2.15
1.
06
-0.5
8 1.
25
6.17
-0
.73
5.48
0.
22
-4.5
8 0.
30
0.49
Sing
apor
e -9
.65
2.90
5.
32
9.25
2.
36
-2.5
5 2.
48
4.48
-0
.65
1.48
-9
.38
-1.8
9 -4
.54
9.
36
-6.9
1
Taco
ma
11.6
9
8.
24
-4.7
2 -2
5.22
6.
28
-2
.53
3.25
Van
couv
er
23.1
8
15.6
4 -5
.64
7.25
21.4
8 -1
1.04
6.26
-1
1.88
20
.40
-35.
83
9.
87
-28.
91
TOTA
L -4
5.25
-5
2.15
14
.40
-5.3
2 67
.44
28.7
5 -0
.26
56.0
6 -7
.44
13.8
3 52
.25
58.2
4 20
.76
-11.
94
-54.
06
-21.
89
48.6
4 33
.59
Ship Turnaround Times in Port: Comparative Analysis of Ocean Container Carriers
CIRRELT-2019-20 7
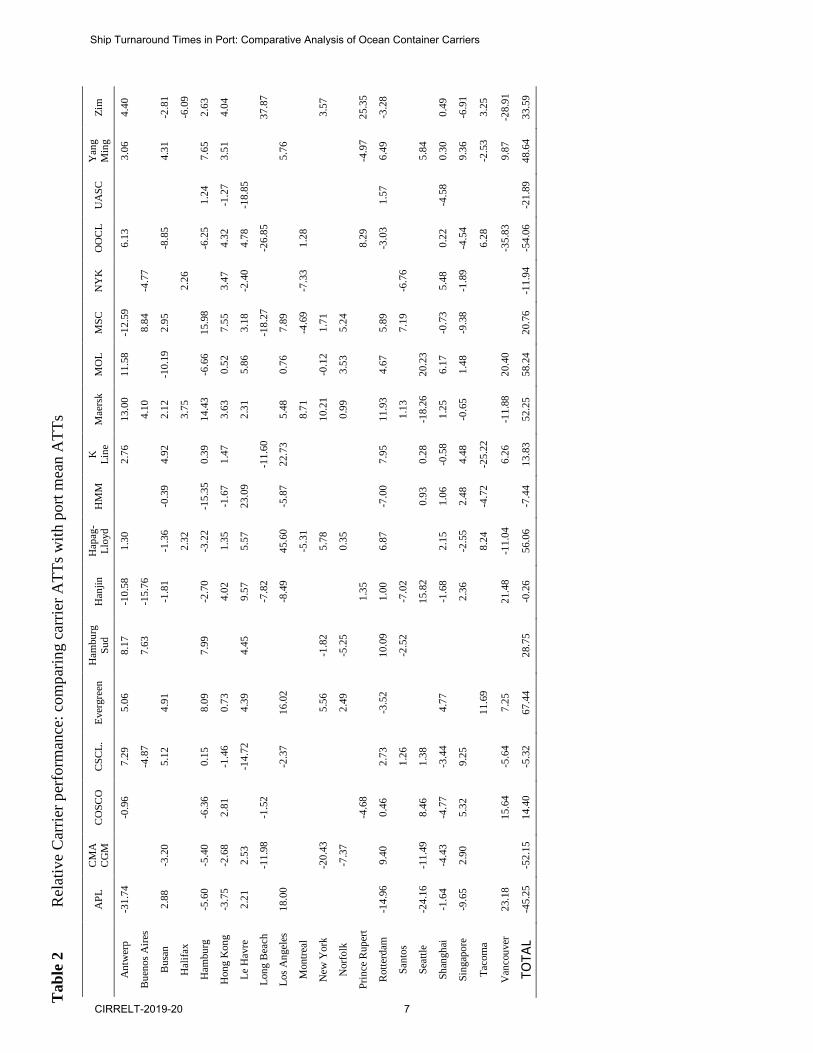
These relative scores are examined in two different ways. The first is a measure that is the sum of the
differences for carrier i in port j. There are thus positive and negative scores:
(2) Σ(Aj-aij), where Aj is the average ATT port j, and aij is the ATT of each carrier i in port j
The results reveal that there are important differences between the shipping lines (Tables 2 and 3). The
best performer is Evergreen while OOCL is the worst, representing a mean relative time difference of
120 hours. There appear to be several classes of performance, with OOCL, CMA-CGM, and APL
representing a group with the negative mean time differences in excess of 45 hours. Four other carriers
recorded negative values: CSCL, Hanjin, HMM and NYK, but their performance is not as poor as the
previously-mentioned carriers. Ten of the 18 carriers recorded positive levels of performance, but here
again there are differences, with COSCO, Hamburg Sud, K-Line, MSC and Zim all recording positive
values, but less than 35 hours above average. Evergreen, Hapag Lloyd, Maersk, MOL and Yang Ming
are revealed as a group with the best performance.
One difficulty with this measure is that a high or low relative score in a few ports of call only could
influence the total relative score. Examples include that of Hapag Lloyd where nearly all the total
+56.06 hours is due to a relative shorter than normal score at Los Angeles of +45.60 hours, and, at the
other extreme, OOCL, with a relative total score of -54.06 hours is influenced by the longer than
average of -35.83 hours recorded at Vancouver.
A different set of results are obtained when an ordinal-based score is calculated. In this approach the
number of times a carrier’s port call is negative or positive (longer or shorter than the average for that
port) is counted. For each carrier the number of positive cases is expressed as a percentage of the total
number of cases (see Table 3):
(3) n/N*100 where n= number of cases where aij >Ai , where Ai is the ATT of port i, and aij is the ATT
of carrier j in port i; and N=number of ports i served by carrier j
Table 3 indicates that the ordinal-based results contain there are fewer carriers performing poorly than
when the sum of the differences (in hours) is calculated per formula (2). This is indicative of the way
a few longer than average calls in a few ports can influence the results. The percentage values result
completely remove OOCL as the worst performer, with that dubious honour being conferred on CGM-
CMA. APL, HMM, NYK and USAC are other carriers with more port service times that are longer
than the port means. COSCO and Hanjin reveal a neutral performance with an equal number of shorter
Ship Turnaround Times in Port: Comparative Analysis of Ocean Container Carriers
8 CIRRELT-2019-20

and longer calls. CSCL which is identified as a poor performer in the sum of difference scoring is now
slightly positive.
Table 3 Relative port performance of carriers
CARRIER diff (hours) of calls positive APL -45.25 36.36
CMA-CGM -52.15 27.27 COSCO 14.4 50.00 CSCL -5.32 53.84
Evergreen 67.44 91.67 Hamburg-Sud 28.78 62.50
Hanjin -0.26 46.67 Hapag Lloyd 56.06 66.67
HMM -7.44 40.00 K-Line 13.83 75.00 Maersk 52.25 82.35 MOL 58.24 76.92 MSC 20.76 66.67 NYK -11.94 37.50
OOCL -54.06 53.84 UASC -21.89 40.00
Yang Ming 48.64 83.33 ZIM 33.59 61.54
Three carriers with the best percentage positive results are Evergreen, Yang Ming and Maersk.
Evergreen emerges as the leader with only one of the 12 ports of call whose times below the port
average. Yang Ming is in second place with 10 of its 12 port calls being shorter than the port averages.
Maersk is in third place with 14 out of 17 port calls being better than the port averages. Other carriers
revealing overall high performance include MOL, K-Line, MSC and Hapag-Lloyd.
Both measures of carrier turnaround times in port take into account the differences in port ATTs, so
that a carrier calling at a port with high ATTs is compared equally with all others calling at that port.
The fact that carriers such as Evergreen and Maersk call at ports who’s ATTs may be high and yet
consistently score faster turnarounds than other carriers is clear evidence of carrier performance
differentiation. We suggest that the ordinal-based score is the better indicator because it can dampen
strong negative or positive values that can occur. It emphasises the level of performance across the full
range of ports served. It is a metric that more clearly reveals the differences that exist between carriers,
Ship Turnaround Times in Port: Comparative Analysis of Ocean Container Carriers
CIRRELT-2019-20 9
with several achieving consistently shorter port turnarounds, while others appear to take spend longer
times to clear ports.
5 Interpretations
Explaining the differences between carriers represents a challenge. Most of the research on ships time
in port suggests that port inefficiencies are to blame. The evidence presented here, where some carriers
consistently achieve faster turnarounds even in ports where average ATTs are high, suggest that
carriers themselves may be a factor to be taken into account. Here, we consider two elements, based
on published research and discussions with four terminal operators on the West Coast of North
America, two in Western Europe and two in China, as well as with shipping company officials in the
head offices of two European carriers and one Chinese shipping line. First is the issue of transit time
delays, where there is academic research on carrier response differences with regards to service
disruptions. Second is that of container stowage plans, an issue that was raised in our industry
interviews.
5.1 Transit time delays
It is widely claimed extended ships time in port may be affected by that transit time delays (Slack and
Comtois 2013; Song et al 2015: Reinhardt et al 2016). Transit delays are caused a range of factors,
including weather, tidal conditions, mechanical failings and congestion in the previous port of call
(Pani et al 2014). Late arrival of a vessel due any one of these issues may result in the terminal being
unprepared to discharge and load containers in an optimal fashion: the berth may be already allocated
to another ship and cranes may have been deployed elsewhere. As discussed in the literature review
these factors may be largely beyond the direct control of the carriers, but both academic studies
(Notteboom 2006) and professional sources (Bonney 2015) suggest that some carriers pay particular
attention to service reliability while for others punctuality is less important than filling ships, and
accordingly may extend the times of departure to wait for more cargo with consequent impacts on the
subsequent ports of call.
Drewry Carrier Performance Reports are a source of carrier punctuality data. Unfortunately, its high
subscription cost has prohibited its use here. Many trade journals report the results of Drewry’s latest
survey. A search of trade journals reporting Drewry carrier scores for 2013 indicate that Maersk,
Evergreen and Yang Ming were the top three with regards punctuality (Journal of Commerce 2013).
This is a result that closely matches the ATT ranking obtained in this paper. Apart from listing the best
Ship Turnaround Times in Port: Comparative Analysis of Ocean Container Carriers
10 CIRRELT-2019-20
performers the trade magazines usually do not indicate the ranking of the other carriers. One of the
few times that a trade journal reported a poor performer was Maritime Executive (2013) revealing that
MSC and CSAV had the worst punctuality scores in 2013, a result that does not accord with ATT
rankings produced here.
Unfortunately, there are no means to test the relationship between punctuality and ATTs of all the
carriers from our data. It would have required a compilation of published schedules of all the carriers
in 2013 in order to compare expected arrival times with the actual times. This has been impossible ex
post facto. Thus, comparing carrier punctuality and ATT scores requires further research.
5.2 Stowage Plans
A common complaint levelled against most carriers by terminal operators is that on-board container
stowage plans do not consider operational conditions in the terminals. Stowage plans must consider
two issues. First, they must ensure that the loaded container ship is seaworthy. This requires the vessel
to have transversal stability when sailing, and its draft and trim must be within limits, and the weight
distribution must satisfy the stress limits of the structure (Delgado 2013; Pacino 2013). The positioning
of containers by bay, row and tier is critical to ensuring seaworthiness. The stowage of containers must
also consider the weight of individual containers, ensure the safe positioning of 20 and 40 foot
containers, and position refrigerated containers (reefers) near power plugs. Second, the stowage plans
must consider the order in which containers will be exchanged at each port of call. It will seek to ensure
that slot allocations minimise the amount of repositioning of containers as the ship sails from one port
to another and as containers are sequentially discharged and added during the voyage.
The range of considerations that have to be taken into account makes stowage planning very
challenging. In the past the plans were prepared by a designated officer on each ship, but with the
growth of the size of vessels and the complexity of voyages it became necessary to utilize software
and now stowage planning a head office activity. Because of the critical importance of the first set of
stowage considerations for the safety and security of the vessel these tend to be the primary
determinants in the software algorithms in allocating containers to slots. Even the goal of minimising
repositioning of containers may not take into account discharging and loading from a terminal
operator’s perspective. Our interviews revealed that STS cranes are called upon to make frequent
lateral moves in order to position themselves alongside the required container slots, moves that are
time consuming and reduce terminal efficiency.
Ship Turnaround Times in Port: Comparative Analysis of Ocean Container Carriers
CIRRELT-2019-20 11

While the general factors affecting stowage plans are known and measured, how individual plans of
different carriers are not. There is a need for a survey and comparative analysis of stowage plans in
order for their differences to be identified and evaluated. At a conference in London organised by the
Journal of Commerce on Port Productivity one paper provided a useful case study (Brant and Lambers
2014). The authors describe how the OOCL team involved in producing stowage plans in China were
brought to the British port of Southampton to meet with the terminal operator in order to understand
the particular issues it faced. The stowage planners were able to adjust existing configurations to help
improve terminal efficiency. At the same time the carrier met with the dock worker’s union to try to
coordinate vessel arrivals with the start of shifts in order to avoid situations that occurred previously
when vessel arrivals came in the middle of a shift, with resultant down time when the changes of shift
occurred during operations.
6 Perspectives on the restructuring of alliances
The results of the analysis provide an interesting perspective on the recent and ongoing restructuring
of the container shipping business. Since 2016 the former alliance structures have unravelled, and new
carrier groupings have been formed (Table 4).
Table 4 Container shipping alliances 2017
Alliances Members
2M Maersk (+Hamburg Sud), MSC
Ocean Alliance CMA-CGM, COSCO, Evergreen, OOCL
The Alliance Hapag Lloyd (+ UASC), K-Line, MOL, NYK, Yang Ming
(No name) HMM, Sinokor Merchant Marine, Heung-A Shipping
The 2M alliance comprises Maersk and MSC (two of the better performers in ATTs, and two European
carriers under complete or historic family ownership). Initially these carriers had formed an alliance
called Oceans 3 with the other major European carrier, CMA-CGM. Given the differences between
the time performance of CMA-CGM, which is among the worst, and Maersk and MSC which are
among the best, it was somewhat of a strange association in light of the results of this study. However,
that alliance was rejected by Chinese regulators, and when CMA-CGM purchased the Singaporean
carrier APL a decision was made to link CMA-CGM with the Chinese carriers COSCO (which had
merged with CSCL), OOCL and Evergreen. This alliance is now called the Ocean Alliance. It may be
Ship Turnaround Times in Port: Comparative Analysis of Ocean Container Carriers
12 CIRRELT-2019-20
noted that in July 2017 COSCO made an offer to purchase OOCL, that if approved would make
COSCO the third largest global container carrier by capacity, thereby replacing its alliance partner
CMA-CGM. These developments forced many of the remaining carriers that were in the G6 and
CKYHE alliances to come together as ‘The Alliance’ whose members were to have included Hapag-
Lloyd (that subsequently merged with UASC), K-Line, MOL, NYK, and Hanjin, but even this new
structure had be reformed with the financial collapse of Hanjin. HMM, having subsequently failed to
join the 2M alliance, has established an alliance with two smaller regional carriers: Sinokor Merchant
Marine and Heung-A Shipping. In late 2016 2M increased its capacity further with Maersk’s purchase
of Hamburg Sud, a former privately owned carrier involved in North-South trades, whose ATT
performance is close to those of Maersk and MSC.
The Ocean Alliance combines many of the worst performing carriers in terms of the duration of port
calls, but it also includes Evergreen, the best performing carrier according to our data and a company
that historically was reluctant to join alliances. Undoubtedly, the change in control of the carrier, with
the handing over of management of the company to professional executives by its founding owner is
a factor. Evergreen has moved closer to actions of other major carriers recently, by ordering super post
panamax vessels for example. The third alliance, ‘The Alliance’, is dominated to a greater degree than
the others by one carrier, Hapag-Lloyd, which after its merger with UASC in 2016 has the largest fleet
in the alliance by far, but with the exception of UASC and NYK all members had positive port time
performances. The remaining carrier, Zim, lies outside the proposed alliances, although it operates
with many of the other carriers in slot sharing agreements on specific trades. Zim tends to avoid
competition on the main routes, but has strength in specific regional markets.
7 Conclusions
The research confirms that there exist important differences in ATTs between carriers. While all
container shipping lines experience longer than average turnaround times in ports on occasion, it is
demonstrated that certain carriers exhibit consistently longer turnarounds across the spectrum of ports
of call. Others, in contrast, manage to achieve better than average turnarounds, even in in ports where
overall ATTs are longest.
The results suggest that long ATTs are not due entirely to problems in the port: lower STS crane
efficiencies, labour issues, congestion in the terminals and at the gate entrances etc. If this were the
case there would be narrower differences overall between carrier performance across the spectrum of
Ship Turnaround Times in Port: Comparative Analysis of Ocean Container Carriers
CIRRELT-2019-20 13

ports. It must be concluded that carriers themselves are partly responsible for the differences. For
example, while it is known that weather and delays in a previous port of call affect the punctuality of
vessel arrivals, there are differences between the carriers in their responses to these service
interruptions. Similarly, differences in vessel slot storage plans are identified as constraints on terminal
operations. Some carriers are evidently more oriented towards service regularity and reliability, while
others appear to be more tolerant of delays and adopt more flexible schedules that may result in longer
port stays.
The range of ATTs between carriers indicates that time and performance levels in the container
shipping industry must take into account internal operational and policy differences between the
companies. In this paper several factors have been put forward to account for the differences. Clearly
there is a need to explore further the relationships with quantitative testing and other forms of analysis.
Several lines of enquiry are suggested. Costing of different strategies employed to respond to service
disruptions would be very important. Achieving on-time arrivals may result in lower faster turnarounds
and therefore lower port costs, but it may require higher fuel costs as vessels have to catch up on
inevitable delays en route. Conversely, carriers operating in less rigid schedules with lower fuel costs
but experiencing longer ATTs must be facing higher terminal charges. Finally, because the
significance between propriety systems. To what extent are operational issues in the different ports of
call factored into the software?
Finally, we note that while AIS affords a comprehensive and accurate way to measure transits and time
in port it provides academic researchers with a new set of issues to explore and explain.
Acknowledgements
This research was supported by grant 435-20914-1196 awarded by the Social Science and Humanities
Research Council of Canada.
References
Agarwal, R., Ergun, Ö., 2008. Ship scheduling and network design for cargo routing in liner shipping.
Transportation Science 42(2), 175-196.
Bonney, J., 2015. Drewry: More container ships are arriving late. Journal of Commerce January 15.
Ship Turnaround Times in Port: Comparative Analysis of Ocean Container Carriers
14 CIRRELT-2019-20
Brant,T., Lambers, T. H.R., 2014. Carrier-Terminal Collaboration: The Key to Achieve Breakthrough
Improvements. Presentation at the Journal of Commerce Port Performance Conference, London.
Brouer, B.D., Dirksen, J., Pisinger, D., Plum, C.E.M., Vaaben, B., 2013. The vessel schedule recovery
problem (VSRP) – a MIP model for handling disruptions in liner shipping. European Journal of
Operation Research 224(2), 362–374.
Cariou, P., 2008. Liner shipping strategies: an overview. International Journal of Ocean Systems
Management 1(1), 2-13.
Notteboom, T., Cariou.C., 2011. Bunker Costs in Container Liner Shipping: Are Slow Steaming
Practices Reflected in Maritime Fuel Surcharges? In European Conference on Shipping & Ports-
ECONSHIP, 22-24.
Cullinane, K., Wang, T.F., Song, D.W. Ji, P., 2006. The technical efficiency of container ports:
comparing data envelopment analysis and stochastic frontier analysis. Transportation Research
Part A: Policy and Practice 40(4), 354-374.
Delgado, A., 2013. Models and Algorithms for Container Vessel Storage Optimization. Ph.D.
Dissertation, Technical University of Copenghagen, 133pp.
Ducruet, C., Rozenblat, C., Zaidi, F., 2010. Ports in multi-level maritime networks: evidence from the
Atlantic (1996–2006). Journal of Transport Geography, 18(4), 508-518.
Ducruet, C., Zaidi, F., 2012. Maritime constellations: A complex network approach to shipping and
ports. Maritime Policy and Management, 39(2), 151-168.
Ducruet, C., Itoh, H., Merk O., 2014. Time Efficiency at World Container Ports. International
Transport Forum/OECD. Paris. 30pp.
Franc, P., Van der Horst, M., 2010. Understanding hinterland service integration by shipping lines and
terminal operators: a theoretical and empirical analysis. Journal of Transport Geography 18(4),
557-566.
Fremont, A., 2007. Global Maritime Networks: the case of Maersk. Journal of Transport Geography,
15(6), 431-442.
Ship Turnaround Times in Port: Comparative Analysis of Ocean Container Carriers
CIRRELT-2019-20 15
Journal of Commerce 2013. Ocean Carriers Reliability Improves Slightly. Journal of Commerce
November 26.
Hoffstede G., 2001. Culture’s Consequences. (London: McGraw-Hill)
Lam, J.S., Yap, W.Y., Cullinane, K., 2007. Structure, conduct and performance on the major liner
shipping routes 1. Maritime Policy & Management, 34(4), 359-381.
Lim, S.M., 1996. Round-the-world service: The rise of Evergreen and the fall of US Lines. Maritime
Policy and Management, 23(2), 119-144.
Maritime Executive 2013. Drewry: Ship and Container reliability improve. Maritime Executive
February 7.
Merk,O., Busquet, B., Aronietis, R., 2015. The Impact of Mega Ships. International Transport
Forum/OECD, Paris. 108pp.
Notteboom, T., 2006. The Time Factor in Liner Shipping Services. Maritime Economics & Logistics,
8(1), 19–39.
Notteboom, T. and Vernimmen, B., 2009. The effect of high fuel costs on liner service configuration
in container shipping. Journal of Transport Geography, 17(5), 325-337.
Olivier, D., 2005. Private entry and emerging partnerships in container terminal operations: evidence
from Asia. Maritime Economics & Logistics, 7(2), 87-115.
Olivier, D., 2006. The globalisation of port business: an Asian perspective. Unpublished Ph.D.
dissertation, University of Hong Kong.
Pacino, D., 2013. An LNS Approach for Container Stowage Multi-port Master Planning. In D. Pacino,
S. Voss, R.M. Jensen, (Eds), Computational Logistics. Proceedings of the 4th International
Conference, ICCL. Heiedelberg: Springer, pp 35-44.
Panayides, P.M., Wiedmer, R., 2011. Strategic alliances in container liner shipping. Research in
Transportation Economics, 32(1), 25-38.
Pani, C., Fadda, P., Fancello, G., Frigau, L. and Mola, F., 2014. A data mining approach to forecast
late arrivals in a transhipment container terminal. Transport, 29(2), pp.175-184.
Ship Turnaround Times in Port: Comparative Analysis of Ocean Container Carriers
16 CIRRELT-2019-20

Reinhardt, L.B., Plum, C.E.M., Pisinger, D., Sigurd, M.M., Vial, G.T.P., 2016. The liner shipping
berth scheduling problem with transit times. Transportation Research Part E, 86(2), 116-128.
Saldanha, J.P., Russell, D.M.,Tyworth, J.E., 2006. A disaggregate analysis of ocean carriers' transit
time performance. Transportation Journal, 45(1), 39-60.
Saldanha, J.P., Tyworth, J.E., Swan, P.F., Russell, D.M., 2009. Cutting logistics costs with ocean
carrier selection. Journal of Business Logistics, 30(2), 175-195.
Scholte, J. A. (2000) Globalization. A critical introduction, (London: Palgrave).
Slack, B., Comtois, C., Wiegmans, B., Witte, P.A., 2018. Ships Time in Port. International Journal of
Shipping and Transport Logistics, 10(1), 45-62.
Slack, B. and Comtois, C., 2013. Measuring ocean transit times of container shipping: an empirical
study of the Trans Pacific trade. Paper Presented to the IAME Conference, Marseilles.
Slack, B., Frémont, A., 2009. Fifty years of organisational change in container shipping: regional shift
and the role of family firms. Geojournal, 74(1), 23-34.
Song D-P., Li, D., Drake, P., 2015. Multi-objective optimization for planning liner shipping service
with uncertain port times. Transportation Research Part E, 84(1), 1-22.
Soppé, M., Parola, F., Frémont, A., 2009. Emerging inter-industry partnerships between shipping lines
and stevedores: from rivalry to cooperation? Journal of Transport Geography, 17(1), 10-20.
Tongzon, J.L., 2009. ‘Port choice and freight forwarders’, Transportation Research Part E, 45(3),186–
195.
Vernimmen, B., Dullaert, W., Engelen, S., 2007. Schedule unreliability in liner shipping: Origins and
consequences for the hinterland supply chain. Maritime Economics & Logistics, 9(3), 193-213.
Wiegmans, B., Bu, L., Kim, N.S., 2013. Deep-sea container carrier performance: how efficient are the
respective container carriers? International. Journal of Shipping and Transport Logistics, 5(1),
55-75.
Yeung, H.Wc and Lin, G.C.S., 2003. Theorising Economic Geographies of Asia, Economic
Geography, 79(2), 107-128.
Ship Turnaround Times in Port: Comparative Analysis of Ocean Container Carriers
CIRRELT-2019-20 17

Ship Turnaround Times in Port: Comparative Analysis of Ocean Container Carriers
18 CIRRELT-2019-20