shipping eca finance - allenovery.com online... · welcome to the 2018 shipping export credit...
TRANSCRIPT
2018 editionShipping ECA finance
Cruise ship boom carries all before it
European ECAs crowd out Asian players, who continue to cover more sectors
Thin volumes for FPSOs and LNG vessels - but huge potential
In this issue:
Powered by
Supported by:

Welcome to the 2018 shipping export credit agency (ECA) finance report, produced by TXF Data with the support of Allen & Overy LLP.
This is the latest in a series of sector specific reports, and examines financing trends in the ECA supported shipping and offshore sectors
with a particular focus on overall trends and trends in regions and sub-sectors.
The years since the onset of the financial crisis in 2008 have revealed just how diverse shipping is, with different market segments
performing very differently in response to global events. Now more than ever, financing shipping and offshore vessels requires
considerable expertise and market knowledge.
Some sectors of the shipping market, have remained in the doldrums since the financial crisis, with shipyards having over-produced, ship
owners having over-ordered and lenders having lent too much. The assumption that there would be an ever-increasing amount of goods
to ship has been proved painfully wrong, with certain shipping sectors struggling to return to something resembling “normal”
profitability. Other sectors have demonstrated greater resilience and are now steaming ahead; for shipping companies in these sectors
the tide is definitely rising.
In this report we will look at the importance of ECA supported finance in three key market sectors: cruise ships, floating production
storage and offloading units (FPSOs) and liquefied natural gas (LNG) carriers.
Demand for ECA supported finance is often counter-cyclical; it becomes popular when financiers are more reluctant to lend because risks
appear too great and in transactions where the required financing amount outstrips the available commercial bank liquidity. In
shipbuilding it is also used by states to give their shipbuilding industries a competitive edge. This report focuses on the three sectors
referenced above, in part, because these vessels are often more expensive than traditional container, bulk carrier and tanker vessels. In
these circumstances, the backing of an ECA can make deals much more bankable for financiers and more affordable for owners and
sponsors.
We hope that you find the insights into the risks and opportunities in the markets that we are exploring in this report useful.
ForewordSupported by:
Shipping ECA finance 2018
Foreword: Allen & Overy
2
Kevin Young
Global Head, Shipping Finance
Tel +44 20 3088 4977

Contents
Allen & Overy LLP is a limited liability partnership established under the laws of England and Wales with registered number
OC306763. It is the parent company of an international legal practice comprising Allen & Overy LLP, its subsidiaries, subsidiary
undertakings and affiliates and the other partnerships, corporations and undertakings which are authorised to practise using the
name “Allen & Overy” (the A&O Group).
The A&O Group has not produced, checked nor verified any of the data that is contained within this report and does not make any
representation, warranty or guarantee, whether express or implied, that the content is complete, accurate or up to date.
This report is given without prejudice or liability on the part of the A&O Group. This report is for general guidance only and does
not constitute advice of any kind.
The A&O Group will not accept responsibility for any errors or omissions in this report or for any loss or damage, howsoever
caused, in connection with any use or reliance of any content in this report.
TXF Limited “TXF” makes no representation regarding the completeness, accuracy, or timeliness of any information and data
provided or that such information and data will be error-free. TXF assumes no responsibility for the consequences of use of the
information. In no event shall TXF be liable for any direct, indirect, special or incidental damage resulting from, arising out of or in
connection with the use of the information.
Users are encouraged to visit and review individual deal data on www.tagmydeals.com and contribute to the completeness and accuracy of our deal coverage.
Mailing address: Canterbury Court 1-3 Brixton Road London, SW9 6DE - Tel: +44 (0) 20 3735 5180
Registered office: TXF Limited 7-10 Chandos Street - London W1G 9DQ
Registered in England & Wales. Registered No: 08421624
© TXF Limited 2018 Copying without permission of the publisher is prohibited.
3
Contents
Supported by:Shipping ECA finance 2018
THIS REPORT
Alfonso Olivas
Data and art editor
Jonathan Bell
Editor-in-chief
Tom Nelthorpe
Content editor
TXF DATA
Alfonso Olivas
Head of data and analytics
James Petras
Chief technology officer
Dominik Kloiber
Commercial director
Dan Sheriff
Managing director
ALLEN & OVERY LLP
Kevin Young
Global Head, Shipping Finance
Mario Jacovides
Global Head, Asset Finance
Paul Nelson
Partner - London
Harry Upcott
Partner - London
Scott Neilson
Partner - Tokyo
Jason Humphreys
Partner - Singapore
1. Market at a glance 5
2.Cruise ships 9
3. FPSOs 14
4. LNG 17

Market at a glance
Find the methodology at: www.txfdata.com/methodology
No of deals44
Top vessel typeCruise ships
Total amountUSD 18.52bn
Avg tenor11.6 years2017
Q3 2016 Q4 2016 Q1 2017Q2 2016Q1 2016 Q2 2017 Q3 2017 Q4 2017
2,500
2.5 5 7.5 10 12.5 15 Years
5,000
7,500
12,500
USDm
Vol
10,000
TENOR vs. AMOUNT TRENDLINE
<250 500 750 1000 1250 1500 1500+
2017
Breakdown by volume range
2016 2017
Range (USDm) USDm No USDm No
1-250 3,573 40 2,410 25
251-500 2,564 7 1,805 5
501-750 3,388 6 4,519 7
751-1000 - - 2,580 3
1000-1250 2,087 2 1,057 1
1251-1500 1,433 1 - -
>1500 2,181 1 6,151 3
Deals by volume
2016
$7.27bn
$4.11bn
$3.85bn
$5.80bn
$3.38bn
$6.41bn
$2.18bn
$0.72bn
14
20
10
13
6
20
9 9
# of deals
Supported by:Shipping ECA finance 2018
4
Market at a glance
Shipping ECA finance 2018
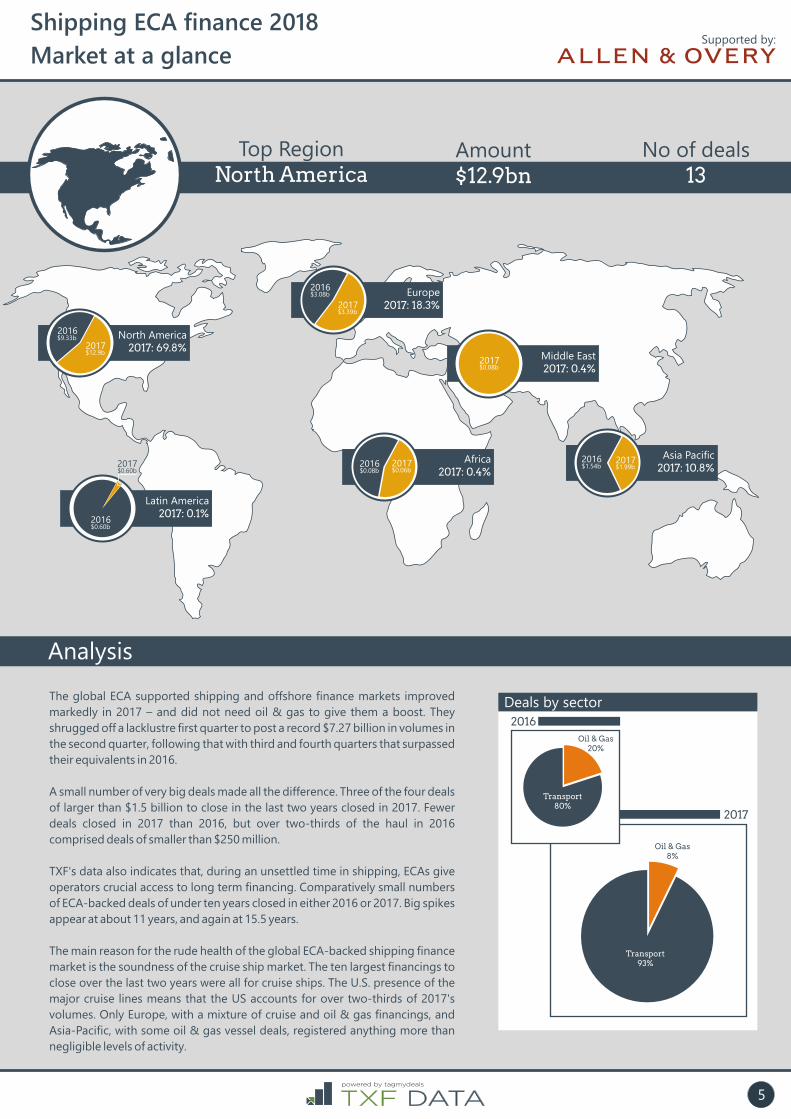
Top RegionNorth America
Amount$12.9bn
No of deals13
North America2017: 69.8%
Europe2017: 18.3%
Latin America2017: 0.1%
Transport80%
Transport93%
Oil & Gas20%
Oil & Gas8%
2016
2017
Deals by sectorThe global ECA supported shipping and offshore finance markets improved
markedly in 2017 – and did not need oil & gas to give them a boost. They
shrugged off a lacklustre first quarter to post a record $7.27 billion in volumes in
the second quarter, following that with third and fourth quarters that surpassed
their equivalents in 2016.
A small number of very big deals made all the difference. Three of the four deals
of larger than $1.5 billion to close in the last two years closed in 2017. Fewer
deals closed in 2017 than 2016, but over two-thirds of the haul in 2016
comprised deals of smaller than $250 million.
TXF's data also indicates that, during an unsettled time in shipping, ECAs give
operators crucial access to long term financing. Comparatively small numbers
of ECA-backed deals of under ten years closed in either 2016 or 2017. Big spikes
appear at about 11 years, and again at 15.5 years.
The main reason for the rude health of the global ECA-backed shipping finance
market is the soundness of the cruise ship market. The ten largest financings to
close over the last two years were all for cruise ships. The U.S. presence of the
major cruise lines means that the US accounts for over two-thirds of 2017's
volumes. Only Europe, with a mixture of cruise and oil & gas financings, and
Asia-Pacific, with some oil & gas vessel deals, registered anything more than
negligible levels of activity.
Analysis
2016
2017
2016
2017
2016
2017
$9.33b
$3.08b
$0.60b
$0.60b
$12.9b
$3.39b
Africa2017: 0.4%
2016 2017$0.08b $0.06b
Middle East2017: 0.4%
2017$0.08b
Asia Pacific2017: 10.8%
2016 2017$1.54b $1.99b
Supported by:
5
Market at a glance
Find the methodology at: www.txfdata.com/methodology
2016 2017
No of deals Vol ($m) No of deals Vol ($m)
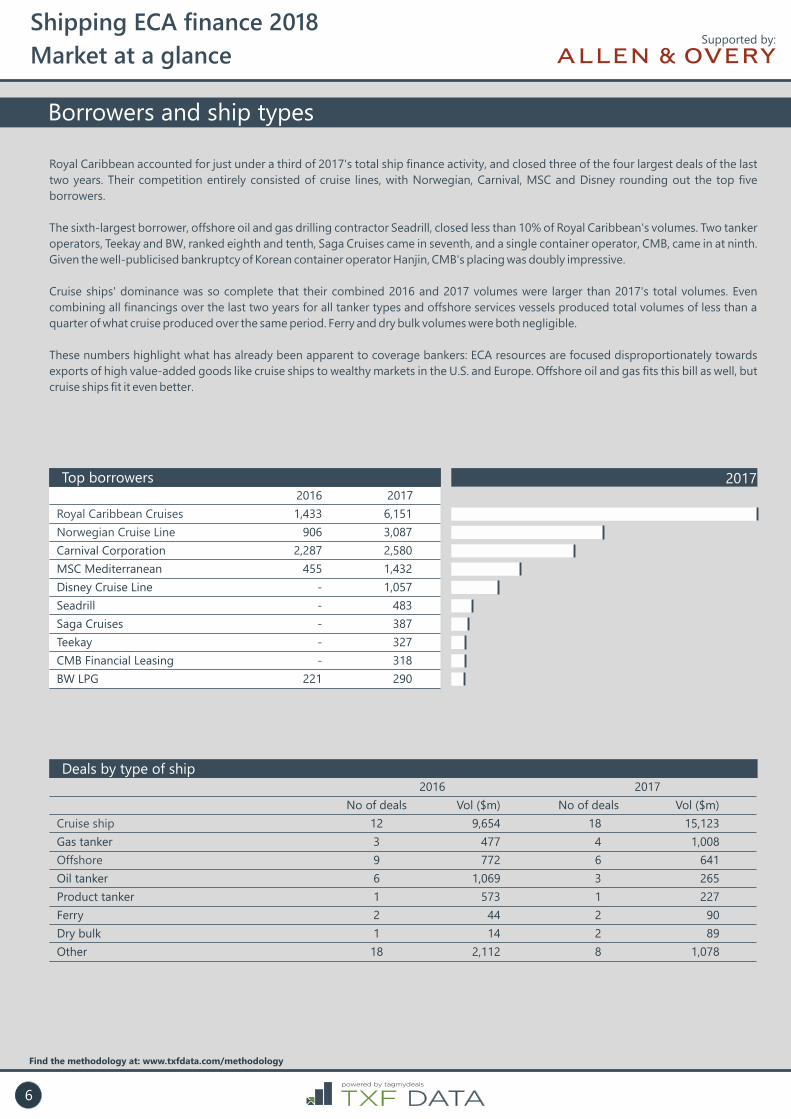
Cruise ship 12 9,654 18 15,123
Gas tanker 3 477 4 1,008
Offshore 9 772 6 641
Oil tanker 6 1,069 3 265
Product tanker 1 573 1 227
Ferry 2 44 2 90
Dry bulk 1 14 2 89
Other 18 2,112 8 1,078
2016 2017
Royal Caribbean Cruises 1,433 6,151
Norwegian Cruise Line 906 3,087
Carnival Corporation 2,287 2,580
MSC Mediterranean 455 1,432
Disney Cruise Line - 1,057
Seadrill - 483
Saga Cruises - 387
Teekay - 327
CMB Financial Leasing - 318
BW LPG 221 290
Deals by type of ship
Top borrowers
Borrowers and ship types
Royal Caribbean accounted for just under a third of 2017's total ship finance activity, and closed three of the four largest deals of the last
two years. Their competition entirely consisted of cruise lines, with Norwegian, Carnival, MSC and Disney rounding out the top five
borrowers.
The sixth-largest borrower, offshore oil and gas drilling contractor Seadrill, closed less than 10% of Royal Caribbean's volumes. Two tanker
operators, Teekay and BW, ranked eighth and tenth, Saga Cruises came in seventh, and a single container operator, CMB, came in at ninth.
Given the well-publicised bankruptcy of Korean container operator Hanjin, CMB's placing was doubly impressive.
Cruise ships' dominance was so complete that their combined 2016 and 2017 volumes were larger than 2017's total volumes. Even
combining all financings over the last two years for all tanker types and offshore services vessels produced total volumes of less than a
quarter of what cruise produced over the same period. Ferry and dry bulk volumes were both negligible.
These numbers highlight what has already been apparent to coverage bankers: ECA resources are focused disproportionately towards
exports of high value-added goods like cruise ships to wealthy markets in the U.S. and Europe. Offshore oil and gas fits this bill as well, but
cruise ships fit it even better.
Shipping ECA finance 2018 Supported by:
6
2017

Market at a glance
Find the methodology at: www.txfdata.com/methodology
$4,82b
$2.84b$2.73b
$4.43b
$1.21b
$0.68b
$0.41b $0.38b$0.13b $0.09b
Top ten countries by country of the ECA
2016 2017
$m % $m %
1 Italy 5,374 37.4% 4,827 27.1%
2 France 1,888 13.1% 4,433 24.9%
3 Finland 0 0.0% 2,843 15.9%
4 Germany 2,108 14.7% 2,734 15.3%
5 South Korea 2,483 17.3% 1,212 6.8%
6 China 654 4.5% 682 3.8%
7 Spain 34 0.2% 441 2.5%
8 Norway 940 6.5% 385 2.2%
9 Netherlands 715 5.0% 134 0.8%
10 Japan 133 0.9% 92 0.5%
Top ten countries by country of the Borrower
2016 2017
$m % $m %
1 United States 7,031 46.2% 12,876 69.5%
2 Switzerland 455 3.0% 1,432 7.7%
3 Singapore 411 2.7% 774 4.2%
4 Marshall Islands 672 4.4% 554 3.0%
5 United Kingdom 203 1.3% 515 2.8%
6 Hungary - 0.0% 483 2.6%
7 Spain - 0.0% 441 2.4%
8 Philippines - 0.0% 401 2.2%
9 Germany - 0.0% 247 1.3%
10 Hong Kong - 0.0% 200 1.1%
Top lenders on ECA-supported deals
2016 2017
$m % $m %
1 BNP Paribas 1,917 16.5% 3,056 19.9%
2 HSBC 1,044 9.0% 2,197 14.3%
3 KfW IPEX 586 5.0% 1,742 11.4%
4 Santander Bank 662 5.7% 1,512 9.9%
5 Société Générale 517 4.4% 1,214 7.9%
6 SMBC 886 7.6% 937 6.1%
7 Citi 556 4.8% 559 3.6%
8 Credit Agricole 787 6.8% 547 3.6%
9 Commerzbank 3 0.0% 470 3.1%
10 BayernLB 329 2.8% 422 2.8%
Lenders and guarantorsTo be an attractive destination for ECA financing, countries need either a wealthy population (e.g. the U.S. and its cruise market), an offshore
oil services industry (e.g. the UK and Singapore) or to offer advantages in terms of registration (e.g. the Marshall Islands and Panama). The
U.S. accounted for 69.5%of total volumes in 2017, and only two other countries — one of them landlocked — accounted for more than 3%.
Only five of 2016's busiest countries reappeared in 2016. The dominance of the U.S. aside, shipping finance activity can be unpredictable.
The competition between exporters was slightly less lopsided, but Italy, whose ECA SACE was active in support of powerhouse shipyard
Fincantieri, won out convincingly in 2016 and solidly in 2017. France, whose ECA Bpifrance stood behind the STX yard, came out second,
while Finland, whose Finnvera backed a single financing for a Meyer Turku cruise order, came in third.
Shipping ECA finance 2018 Supported by:
7
Vol in 2017
Vol in 2017
Vol in 2017

OPINION
Cruise ship market
Cruise Ship Market
Shipping ECA finance 2018Supported by:
Key risks
Financing any ship requires a skilful assessment of the ship, the ship owner and the market in which the ship is
trading. With cargo ships the earnings are, in theory, relatively predictable if there is a long-term charter in place.
There are also published indices and well-developed spot markets for most types of cargo ship. The lenders can
look at the numbers, work out if a ship is bankable and take security over the earnings.
Cruise ships are different. They do not simply move goods from A to B, reliant only on there being a regular
demand for those goods in B. Cruise operators are selling an experience; passengers do not need to go anywhere
in particular, but they do need to be kept happy, and happiness is much harder to ship than iron ore. Losing a few
containers overboard from a container ship on a rough voyage is not an uncommon event and does not prevent
people shipping goods by container. The same could not be said for cruise passengers. The reputation of the
operator and the ship is paramount to its future success.
The cruise voyage itself brings commercial risks that operators have to deal with – consider, for example, that the
cost of the Costa Concordia disaster is estimated at over $2 billion. The recent difficulties faced by air operators
flying to package holiday destinations in North Africa caused by a collapse in the numbers of tourists wanting to
visit serves as a reminder that once-popular holiday destinations can become no-go areas. Also, environmental
concerns are increasingly being raised by some popular cruise destinations, as a result of the impact that a visit
from a large cruise ship can have on the local environment. The concerns relate to both passenger numbers and
air pollution. If popular destinations limit the size of cruise ships or require them to clean up their emissions, this
could adversely affect the profitability of some ships. It is also harder for financiers to take security over the cash
flows that cruising generates as these are the result of thousands of individual payments rather than a monthly
payment of charter hire. It is not surprising that these factors and the very high cost of building cruise ships means
that ship owners and financiers often turn to ECAs for support as a method of supporting financing for these ships.
Key opportunities
Cruising is clearly a growth market. The key players are large often well rated businesses with strong brands. The
cruise operators' intentions of building a virtuous circle of loyal returning customers who start with a family fun
cruise and then mature into cultural or nature cruises and end with more leisure trips seems to be borne out by the
rising passenger numbers, particularly in the younger age groups. If operators can grapple with the
environmental and terrorist issues and maintain passenger interest, ageing populations and the increasing
affluence of countries like China will present huge opportunities.
ECA finance is likely to remain important for this sector because of the high cost of fitting out and maintaining the
ships, a difficult secondary market in cruise ships and the practical difficulties of using the cash flows as security.
The ECAs in the main cruise ship building countries will also be keen to preserve their national industries as
competition from other countries will inevitably grow.
Current and future cruise ships will also need to comply with increasingly strict environmental regulation, and the
cost of retrofitting these ships with cleaner engines and more advanced clean power systems may also present
opportunities for financiers. This has been shown with cruise operators turning to LNG as a fuel and this is a trend
which is set to continue in cruise and other shipping sectors.
8

Cruise market top borrowers & exporters
Top borrowers for cruise ships
Top exporters for cruise ships
2016 ($m) 2017 ($m)
1 Royal Caribbean 1,433 6,151
2 Norwegian Cruise Line 906 3,087
3 Carnival Corporation 2,287 2,580
4 MSC Cruises 455 1,432
5 Disney Cruises 2,087 1,057
6 Saga Cruises - 387
7 Hapag Lloyd - 247
8 Ritz Carlton - 182
9 Virgin 2,181 -
10 Compangnie Du Ponant 305 -
2016 ($m) 2017 ($m)
1 Fincantieri 5,374 4,827
2 STX 1,433 4,351
3 Meyer Turku - 3,232
4 Meyer Werft 2,087 2,285
5 Vard 305 247
Q3 2016 Q4 2016 Q1 2017Q2 2016Q1 2016 Q2 2017 Q3 2017 Q4 2017
$0.91bn
$4.17bn
$2.18bn
$2.39bn
$6.38bn
$2.91bn
$5.82mn
2 deals
6 deals
1deal
3 deals
0 deals
$bn
2
2
4
4
6
8
8
10
12
14
15
2013 2014 2015 2016 2017
11 deals
6 deals
1 deal
$bn
Cruise ship market
Fincantieri
STX
Meyer Turku
Meyer Werft
Vard
$4.8b
$4.3b$3.2b
$2.2b
Top borrowers 2017
ECA Cruise ship deals by year
RoyalCaribbean
Norwegian Cruise
line
MSCCruises
Carnival
DisneyCruises
SagaCruises
HapagLloyd
RitzCarlton
Shipping ECA finance 2018 Supported by:
9
Top ECAs in the Cruise market
Currency breakdown in the ECA market
Cruise sector market lenders
ECAs by volume
Top currencies
2016 ($m) 2017 ($m)
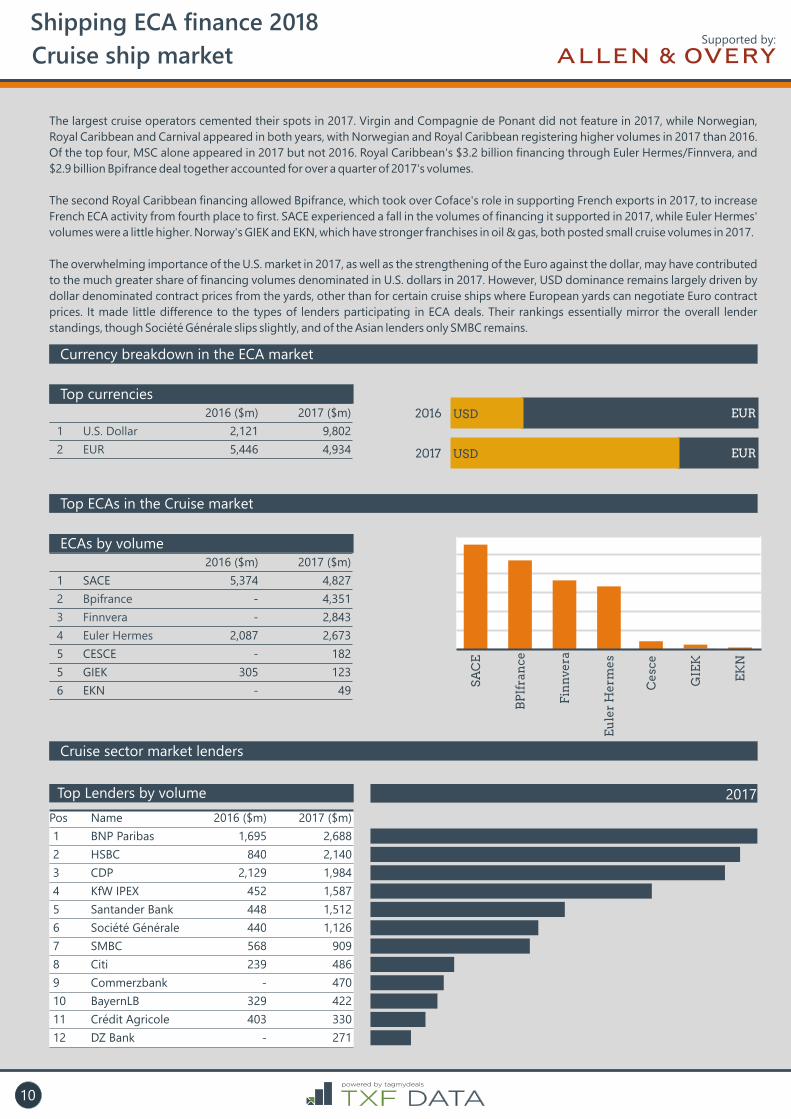
1 SACE 5,374 4,827
2 Bpifrance - 4,351
3 Finnvera - 2,843
4 Euler Hermes 2,087 2,673
5 CESCE - 182
5 GIEK 305 123
6 EKN - 49
2016 ($m) 2017 ($m)
1 U.S. Dollar 2,121 9,802
2 EUR 5,446 4,934
Top Lenders by volume
Pos Name 2016 ($m) 2017 ($m)
1 BNP Paribas 1,695 2,688
2 HSBC 840 2,140
3 CDP 2,129 1,984
4 KfW IPEX 452 1,587
5 Santander Bank 448 1,512
6 Société Générale 440 1,126
7 SMBC 568 909
8 Citi 239 486
9 Commerzbank - 470
10 BayernLB 329 422
11 Crédit Agricole 403 330
12 DZ Bank - 271
2016
2017
BP
Ifra
nc
e
SA
CE
Fin
nv
era
Eu
ler
He
rme
s
Ce
sce
GIE
K
EK
N
EUR
EUR
USD
USD
The largest cruise operators cemented their spots in 2017. Virgin and Compagnie de Ponant did not feature in 2017, while Norwegian,
Royal Caribbean and Carnival appeared in both years, with Norwegian and Royal Caribbean registering higher volumes in 2017 than 2016.
Of the top four, MSC alone appeared in 2017 but not 2016. Royal Caribbean's $3.2 billion financing through Euler Hermes/Finnvera, and
$2.9 billion Bpifrance deal together accounted for over a quarter of 2017's volumes.
The second Royal Caribbean financing allowed Bpifrance, which took over Coface's role in supporting French exports in 2017, to increase
French ECA activity from fourth place to first. SACE experienced a fall in the volumes of financing it supported in 2017, while Euler Hermes'
volumes were a little higher. Norway's GIEK and EKN, which have stronger franchises in oil & gas, both posted small cruise volumes in 2017.
The overwhelming importance of the U.S. market in 2017, as well as the strengthening of the Euro against the dollar, may have contributed
to the much greater share of financing volumes denominated in U.S. dollars in 2017. However, USD dominance remains largely driven by
dollar denominated contract prices from the yards, other than for certain cruise ships where European yards can negotiate Euro contract
prices. It made little difference to the types of lenders participating in ECA deals. Their rankings essentially mirror the overall lender
standings, though Société Générale slips slightly, and of the Asian lenders only SMBC remains.
Cruise ship market
Shipping ECA finance 2018Supported by:
10
2017

Cruise ship market
The top four shipyards over the last two years were Fincantieri, STX, and Meyer Werft and its 70% subsidiary Meyer Turku. They are likely to
remain the top four yards over the next five years, though Fincantieri is likely to account for almost as many orders as the next three yards
combined. However, there is likely to be a significant drop in volumes from the fall in orders from 2019 to 2020, but the years after 2023
look promising for ship orders.
ECA debt likely?
Given the top four yards' importance to ECA financing volumes, this order book suggests that ECA financing is likely to remain a mainstay
of cruise ship financing over the next five years. The profile of customers over the next three years also, in general, inspires confidence in the
health of the ECA finance market. The four largest sources of orders have all used ECA finance over the last two years, though the top
source, Viking Ocean, has used ECA debt less recently.
Whether the market broadens in the medium term will depend on the tier of customers below them. Costa and Celebrity are both large
operators that have not closed ECA financings since 2012, but may use ECA financing depending on market conditions.
Cruise operators may have access to the bond market or uncovered bank debt depending on relative pricing levels. The continued health
of credit markets will probably be key to their financing levels. Of the remaining operators, only four outside the top ten have used ECA
debt since 2012. Whether these operators are prepared to go through the processes necessary to raise ECA debt — and ECAs can get
comfortable providing them with credit — will decide whether this broadening takes place.
Order books
*Previous users of ECA debt since 2012. Source: www.tagmydeals.com
Used ECA* Cruise line 2019 2020 2021 2022 2023+ Total
Yes Viking Ocean 1 - 1 2 7 11
Yes MSC Cruises 2 1 1 1 4 9
Yes Norwegian Cruise 1 - - 1 3 5
Yes Royal Caribbean 1 1 1 1 1 5
No Costa Cruises 2 1 1 - - 4
Yes Virgin Cruises - 1 1 1 - 3
No Celebrity 1 1 1 - 3
No Princess 1 1 - 1 - 3
Yes Ponant 2 - 1 - - 3
Yes Disney - - 1 1 1 3
Yes Carnival 1 1 - 1 - 3
Yes Hapag-Lloyd 2 - - - - 2
No Carnival China - - - - 2 2
No P&O Cruises - 1 - 1 - 2
Yes AIDA Cruises - - 1 - 1 2
Yes TUI Cruises¹ 1 - - 1 - 2
No Rest 2 1 1 1 - 5
16 9 10 13 19 67
Cruise vessel orders by customer
1 TUI Cruises is a joint venture between TUI and Royal Caribbean
Source of the order book: www.cruiseindustrynews.com, wikipedia, cruise line statements
Yard 2019 2020 2021 2022 2023+ Total
Fincantieri 4 4 4 5 11 28
STX France 2 2 2 2 3 11
Meyer Werft 3 2 2 2 2 11
Meyer Turku 2 1 1 2 2 8
VARD 5 - 1 - - 6
China State Shipbuilding Corp. - - - - 2 2
Total 16 9 10 12 20 67
Cruise ship orders by yard
Source of the order book: www.cruiseindustrynews.com, wikipedia, cruise line statements
Shipping ECA finance 2018 Supported by:
Total
311

Demand growth for cruises has been very robust over the
last seven years. Operators have kept occupancy rates
under fairly tight control, so much so that rates ticked up
sharply in 2017, though the recent boom in orders, and
therefore financings, may alter that picture over the next
several years.
Slower growth in 2012 and 2013 followed a boom in
2010, but since 2014 growth has been at least 4% per
year. The Cruise Lines International Association, an
industry trade body, has forecast $6.8 billion in
investment in the industry in 2017, passenger capacity
additions of around 30,000 in each of 2017 and 2018, and
52,000 in capacity added in 2019.
Older and wealthier passengers have driven this growth
in the cruise market, as well as speciality cruises built
around niche interests. The growth in disposable income
in emerging markets, thanks to a growing middle class in
those countries, may be the secret to longer-term
growth in the cruise market. China, in particular, and to a
lesser extent India and Japan, are of interest to operators.
If established operators can learn to cater to this
emerging demographic, then the established pattern of
orders, by top-tier operators from top-tier yards, will
continue. If upstart operators show a keener
understanding of this demographic's needs, then
different financing methods, and a different cast of ECAs
and lenders, might find a foothold.
¹Carnival group, Royal Caribbean Group and Norwegian Group. We estimate that they could
represent around 75-80% of the market.
²Occupancy is the result of the available passenger cruise days (days of cruise multiplied by the
number of cabins, based on the assumption that all the cabins are double) divided by passenger
cruise days (number of passengers multiplied by the number of nights). Occupancy rate can
exceed 100% if cabins are occupied by more than two people (i.e. a family).
Demand for cruises
Cruise ship market
0
4
8
12
16
20
24
2010 2017
Aggregated key stats from the main cruise lines¹
2015 2016
0%
2%
4%
6%
8%
10%
12%
2014201320122011
No of passengers (millions)
% year on year passenger growth
2Occupancy rate
106.2%
106.3%
107.0%
106.2%
106.3%
105.8%
106.4%
105.0%
Shipping ECA finance 2018 Supported by:
Could ECAs back refurbishment?
Refurbishments of vessels could lead to capital-intensive works to operators' existing fleets, as cruise customers come to expect better
facilities and vessel performance, and operators compete ever more intensely for older and wealthier customers.
Whether these refurbishments lead to substantial orders for the established shipyard, and therefore their ECA backers, is a more open
question. Some works may be large enough to justify a financing package, though these are unlikely to register on volumes to the same
extent as new-builds. If banks and ECAs can creatively support a multitude of smaller contracts this may open up a profitable new financing
class.
12
OPINION
FPSO market
FPSO market
Shipping ECA finance 2018 Supported by:
Key risks
Fluctuations in the price of oil during and since the global financial crisis have had a dramatic effect on the FPSO
and offshore shipping markets more generally. From highs of USD147 a barrel in July 2008 to lows of USD40 a
barrel in February 2009, oil prices then recovered to the USD90 to USD120 a barrel range in the three years prior to
2014. From July 2014, however, a more prolonged decline in the price of oil began, culminating in sub USD30 a
barrel in February 2016. This was fuelled by significant increases in the amount and efficiency of shale oil
production in the US and an uncertain macro-economic environment (particularly in key economies such as
China).
This decline has led to the offshore oil industry embarking on a period of restructuring in conjunction with weak or
non-existent new tendering activity which has left many offshore operators with laid-up vessels and financial
headaches.
ECA supported FPSO financings are often concluded on the basis of security provided over long term charter
contracts with credit worthy counterparties. However, care has to be taken by financiers even where long term
cashflow is available. Recent events in Brazil and elsewhere have shown that charterers are willing to terminate
long term arrangements where the right to do so presents itself and many 'house' forms of charter insisted on by
national and international oil companies in FPSO tenders are charterer friendly. Detailed diligence should be
carried out on project documents with a particular focus on: (a) charterer termination rights, (b) tax risk sharing, (c)
counterparty assignment rights, (d) FX risks, (e) charter rate adjustments and (f) local content requirements.
FPSOs consist of a hull, which can either be purpose-built, or converted from a former oil tanker, and topsides
which include hydrocarbon processing equipment for separation and treatment of crude oil, water and gases.
Topsides are highly specialised and expensive, and present an element of redeployment risk for a financier as,
depending on the location of any redeployment, they may need to be specially tailored to the field where the
FPSO is to be used. This can be a very expensive process and vessel costs more generally of USD 1 billion plus are
not uncommon.
Key opportunities
A gradual recovery is being reported in the FPSO sector as oil prices have begun a sustained recovery. This is
making some mothballed offshore oil reserves economically viable again and prompting renewed interest in
using FPSOs. An expansion of deepwater development activity (to which FPSOs are naturally suited) will likely
further drive activity. We are also starting to see some relaxation of local content regimes which may encourage
projects in certain key production jurisdictions.
Despite the risks identified above regarding redeployments, a number of FPSOs have been moved multiple times
and may (depending on the redeployment location and reservoir characteristics) represent the most cost
effective and, because of their mobility, fastest solution to develop a marginal field. Rising oil prices may also
mean further development of existing fields becomes feasible, increasing the likelihood of extension options
being triggered and potentially in turn triggering refinancing.
As in other shipping sectors, we are also seeing interest from FPSO operators in constructing vessels in China both
to take advantage of the yard capacity there but also as a way of accessing Chinese investment and financing.
Overall we expect comparatively strong growth, compared to recent activity levels, over the next few years with
Brazil continuing to be active and offshore Africa a growth market.
313

Top sponsors 2014-2017
Top ECAs 2014-2017
Top exporters 2014-2017
Total volume for FPSOs 2014-2017
Vol ($m) No of deals
1 SBM Offshore 1,550 1
2 Modec/Mitsui/Marubeni 1,262 1
3 Teekay Corp. 903 2
Vol ($m)
1 Atradius 888
2 NEXI 400
3 K-SURE 308
4 JBIC 252
5 GIEK 120
6 KEXIM 118
Vol ($m) No of deals
1 SBM 1,550 1
2 Keppel 1,262 1
3 Samsung 815 1
4 Damen 88 1
FPSO
2015
GIEK Kexim
$Mn2014
NEXI Ksure JBICAtradius
3,000
1,000
1,000
500
2,000
750
250
0
0
FPSO market
Floating production, storage and offloading vessels are
extremely popular with lenders. They are adapted to use far
offshore at a particular field, and since they cannot easily be
repurposed, are usually financed off the back of long-term
charters with field operators. They usually comprise an existing
tanker hull fitted out with new storage and processing
equipment. The conversion and the installation of the additional
equipment can usually attract solid ECA support.
These vessels are often found in emerging markets, which may
lack the infrastructure needed to carry oil ashore. The
undisputed leader in the procurement of FPSOs was, until
recently, the Brazilian national oil company Petrobras, which is
dependent on FPSOs to exploit its promising pre-salt
discoveries.
Until recently, Petrobras was so popular that FPSO operators
with Petrobras charters could turn to bond and private
placement markets to fund conversions. Commercial banks
would compete strongly enough with the capital markets, and
financing requirements were low enough, that ECAs became less
vital. But when Petrobras' fortunes started to turn in 2015, in the
wake of a corruption scandal that eventually engulfed the rest of
Latin America, financing activity worldwide slowed rather than
migrating to the ECA market.
The most recent deal, SBM's $720 million ten year financing for
its Liza vessel, came from 12 banks at pricing of 165bp over Libor.
The counterparties on the vessel's charter are Exxon, Hess and
CNOOC, which will use the vessel at their Stabroek field offshore
Guyana. In January 2017 Malaysian FPSO operator Yinson used a
$780 million Islamic murabahah facility to refinance its
construction loan for use at the Offshore Cape Three Points field
in Ghana.
SBM sponsored the last ECA-supported FPSO deal to close to
date. That was the $1.55 billion Cidade de Saquarema financing,
in which NEXI, Atradius, SACE and UKEF all participated, and
which closed in July 2015. Saquarema needed that depth of ECA
support in part, because of the presence of Petrobras as an
offtaker and market perception in the wake of Brazil's corruption
scandals.
Three deals closed in 2015 – Saquarema, the $1.2 billion
financing for Modec's Tartaruga MV29, and a small Atradius-
supported refurbishment project for Teekay – and one in 2014 –
Teekay's $815 million Knarr acquisition in the UK North Sea.
However Atradius' ticket on Saquarema was enough to make it
the most successful ECA backer of FPSO financings of the last
four years, and SBM the top sponsor.
In contrast to the cruise ship sector, Asian sponsors, yards and
ECAs enjoy a strong competitive position, even if operators are a
mix of Asian, European and U.S. firms. FPSOs can be a lumpy,
cyclical business. Between 2015 and 2017 annual fleet additions
doubled, as orders signed before the oil price downturn translate
into deliveries in a very different market.
Shipping ECA finance 2018 Supported by:
14
FPSO ownership details
FPSO fleet by age
FPSO fleet by owner
FPSO
LNG market
CN
OO
C
SB
M O
ffsh
ore
BW
Off
sho
re
Te
ek
ay
To
tal
Bu
mi
Arm
ad
a
Sh
ell
Ch
ev
ron
Ex
xo
nM
ob
il
Wo
od
sid
e
BP
Str
ato
il
Yin
son
Ho
ldin
gs
MIS
C
2
2
4
6
8
10
12
14
16
4
6
8
10
12
14
16
18
87 89 91 93 95 97 99 01 03 05 07 09 11 13 15 1786 88 90 92 94 96 98 00 02 04 06 08 10 12 14 16
No of ships
Year
Pe
tro
bra
s
MO
DE
C
Contractor49%
Owned45%
Operator51%
Leased55%
Pending orders
Year Name Operator Field country
1 2018 Cidade de Campos MV29 Petrobras Brazil
2 2020 Liza Exxonmobil Guyana
3 2021 Carioca MV30 Petrobras Brazil
4 2021 Guanabara MV31 Petrobras Brazil
5 2021 Penguins Shell UK
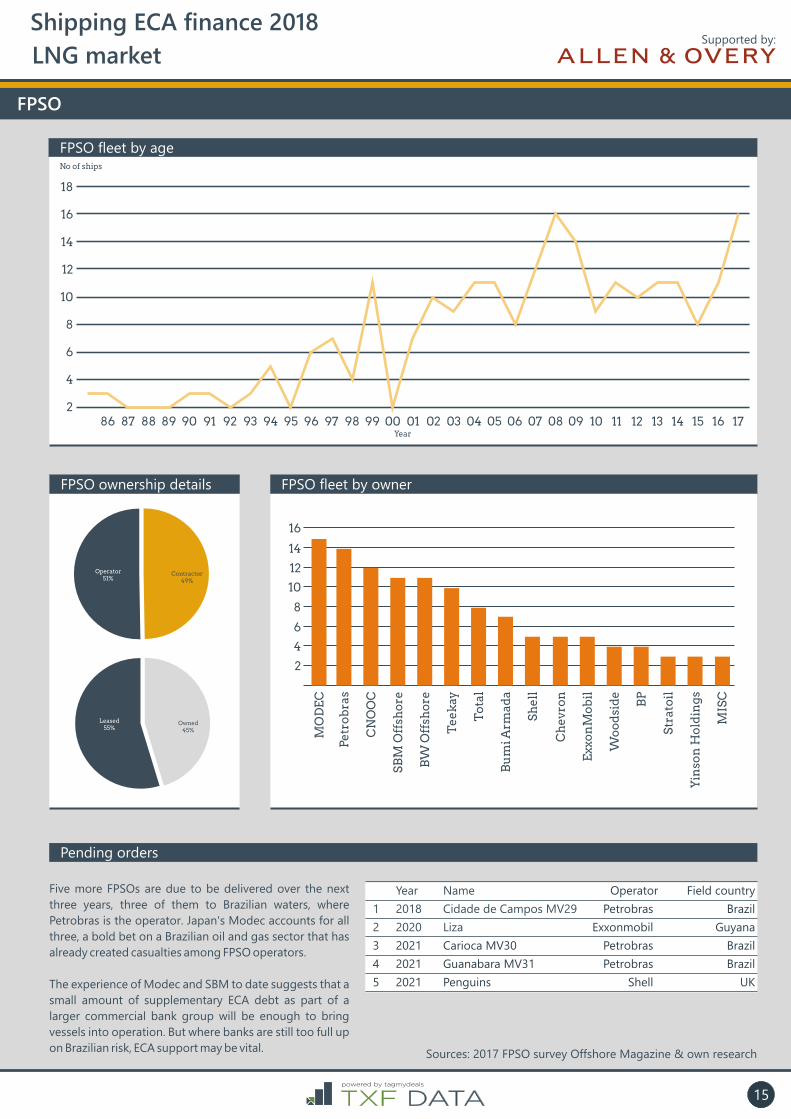
Five more FPSOs are due to be delivered over the next
three years, three of them to Brazilian waters, where
Petrobras is the operator. Japan's Modec accounts for all
three, a bold bet on a Brazilian oil and gas sector that has
already created casualties among FPSO operators.
The experience of Modec and SBM to date suggests that a
small amount of supplementary ECA debt as part of a
larger commercial bank group will be enough to bring
vessels into operation. But where banks are still too full up
on Brazilian risk, ECA support may be vital.Sources: 2017 FPSO survey Offshore Magazine & own research
Shipping ECA finance 2018 Supported by:
315

LNG market
LNG market
Shipping ECA finance 2018 Supported by:
LNG is now firmly established as an essential element of the domestic energy supply in Europe, Asia and the USA.
In the biggest markets, Japan has had to shift away from nuclear and Korea has recently made policy decisions to
move away from nuclear and coal. In China, the government is providing subsidies to encourage the conversion of
industrial boilers and district heating plants from coal to gas in the main urban areas and has recently overtaken
Korea as the second largest importer of LNG. Gas to power projects to fuel the power needs of a growing middle
class in South East Asia are adding new countries as LNG importers.
In Europe, concerns over the security of the gas pipelines from Russian gas fields, have strengthened LNG's
position as a clean and affordable source of energy. As a fuel, it releases a small fraction of the air pollutants
compared to coal and releases less carbon into the atmosphere. In addition, gas fired power plants are easier to
ramp up and down than coal fired power plants and hence gas fired power plants are a useful source of standby or
back up power for the increased level of renewables in the power mix. This has seen gas replacing coal for power
generation purposes. In addition, gas is used for industrial production which requires high heat levels.
LNG is already making inroads into fuelling the world's shipping fleets with several major shipping companies
undertaking to introduce LNG-fuelled ships and hundreds of LNG fuelled vessels already on the world's oceans.
Battery technology increasingly used in cars currently takes up too much space and is too heavy to be feasible as
an energy source for heavy transport. LNG powered trucking is on the rise for the same reason.
Key risks
The LNG shipping market's biggest handicap is that it is very dependent on costly infrastructure for liquefaction at
the start of the voyage, regasification at the end of the voyage and storage at both ends. This is a significant factor
in slowing the establishment of LNG bunkering for ships. The entry of China into the market may have a
disrupting influence, as it did in container and bulk shipping, by providing cheaper alternatives to existing ships;
good for consumers, but a headache for those owning and financing expensive older ships.
Key opportunities
Demand for LNG is dependent in part on infrastructure being in place to store and distribute it to end-users. As
this infrastructure improves, demand is likely to increase. Outside the domestic heat and electricity generation
markets, bunkering ships may become a growth market for LNG, requiring bunkering vessels and storage
facilities. Both cargo and cruise ships are under considerable pressure to stop using sulphurous oil-based
bunkers and to lower their CO2 emissions; LNG offers great potential in this area and since LNG is transported by
sea, establishing local supplies should not present an insurmountable challenge to the shipping industry. For
instance, floating storage and regasification units (FSRUs) can be designed to provide the flexibility to bunker
LNG.
In fact, FSRUs have been a game changer in the regasification market. Technical innovation has led to units which
are reliable, faster to market and cheaper than onshore regasification terminals and flexible, in that they are
capable of being redeployed as owners and operators such as Excelerate have shown. They are opening up new
LNG markets which previously had no established regasification infrastructure, particularly in South East Asia and
Latin America.
Furthermore, the political risk of pipeline gas to Europe from Russia has become apparent during the last few
winters, perhaps prompting governments to look to LNG for a secure energy supply. This has seen FSRUs
deployed in places such as Lithuania.
16
OPINION

LNG market
Shipping ECA finance 2018 Supported by:
317
Demand for floating liquefaction storage and offloading units (FLSOs) or floating LNG (FLNG) units, the LNG
equivalent of FPSOs is rapidly increasing. Whilst the low oil price environment held a number of these projects
back, two newbuilds and one LNG vessel conversion are now onsite and either in commissioning or operation. The
relatively smaller production capacities mean that it is easier to secure offtakers for an FLNG project to proceed to
final investment decision, as the market has seen with the Coral South FLNG project. In addition, FLNG units can
be deployed to access stranded or small gas fields which would otherwise be uneconomical to develop. They can
also be deployed near-shore, reducing the implications of having to build a large scale LNG project onshore.
The Coral South FLNG project was recently financed by five ECAs and a large number of commercial banks. It was
the largest project financing in African history and the first project financing of an FLNG unit. The units to date,
have been built in the Korean shipyards (with one barge based unit yet to be deployed having been built and
commissioned in a Chinese shipyard) or converted in the Keppel shipyard in Singapore. FLNG units have highly
complicated topsides and can have hulls larger than aircraft carriers. In addition, there is no standardisation, with
the entire unit having to be built to meet the gas field specifications. ECAs have shown a strong willingness to
support their shipyards and investors involved in FLNG projects.
ECA finance is vital for LNG to succeed: the liquefaction, shipping and regasification elements of projects require
massive long-term investment. As with many shipping transactions, financing the shipping element requires
skilled sponsors and shipyards and creditworthy offtaker or charter contracts in place to generate steady and
reliable returns. The ships are also highly technical to construct, giving the experienced Korean and Japanese
shipbuilding industries an edge. Their ECAs dominate the market, although the recent entry of China into both
building and financing LNG carriers and a barge based FLNG unit points to increased competition and the
possibility that Chinese shipping companies will be vying with the established ones to transport gas in the not too
distant future.
Whilst global demand for, and production of, LNG continues to increase, there is not a deep spot market and LNG
does not easily trade as a “commodity” given the limited supply sources and demand locations, often
geographically spread and there is not currently a “market” for resale of FLNG units, LNG vessels and FSRUs. As
such, we expect units and vessels built to service different parts of the LNG value chain to continue to be financed
on the basis of long term offtake or charter contracts. ECAs will continue to play a significant part in this market
given the scale and costs of the units and vessels and the desire to support their shipyards, assist with the
development of developing countries and decarbonisation of economies and secure LNG supplies.
317

The LNG market is changing, with new producers in the U.S. putting pressure on prices, and new consumers in Europe looking to diversify
their supply base. Asia remains a key LNG market, and Asian ECAs, whether as consumers of LNG or manufacturers of LNG tankers, are
active in financing tanker fleets. After a subdued 2016 and first quarter of 2017, financing activity improved sharply. The three most active
operators over the last two years all closed their financings in 2017, and all three were buying Asian-made vessels.
Top borrowers & exporters
Top borrowers for LNG ships
Top exporters for LNG ships
2016 ($m) 2017 ($m)
1 Teekay - 327
2 EXMAR NV - 200
3 BW Gas - 192
4 NYK 190 -
5 Navig8 Group 66 -
2017 ($m)
1 Daewoo 327
2 Wison Nantong 200
3 Samsung 192
LNG Ships
Q3 2016 Q4 2016 Q1 2017Q2 2016Q1 2016 Q2 2017 Q3 2017 Q4 2017
$0mn
$190mn
$0mn $0mn
$200mn
$192mn
$327mn
$66mn
$Mn Exmar NVTeekay BW Gas
450
300
150
0
LNG market
Shipping ECA finance 2018 Supported by:
18

Top ECAs in the LNG vessel market
LNG shipping market lenders
Active ECAs in the LNG market
JBIC34.4%
KSURE33.8%
KEXIM29.4%2016 ($m) 2017 ($m)
1 KEXIM - 218
2 Sinosure - 200
3 K-SURE 53 135
4 JBIC 133 0
Top Lenders by volume
Pos Name Vol (USDm) Share (%)
1 Bank of China 150 21%
2 Crédit Agricole 114 16%
3 KfW IPEX 96 13%
4 Deutsche Bank 50 7%
5 ABN AMRO 18 3%
6 Société Générale 18 3%
The recent boom in LNG liquefaction capacity, most of it concentrated in Australia and on the U.S. Gulf Coast, has led to an increase in the
demand for transportation capacity. The most exciting opportunities so far have been in floating storage and regasification units, which
are cheaper and more flexible alternatives to land-based LNG receiving terminals.
The largest deal to close in the last two years, and the only one to close in 2017, was the $200 million Sinosure-backed financing for a
floating liquefaction vessel sponsored by Belgian operator EXMAR That deal, for which Bank of China and Deutsche Bank were lenders,
supported a final instalment payment for the construction at the Wison Nantong yard of the Caribbean LNG vessel.
The financing closed even though the customer for the vessel, Pacific Exploration and Production, cancelled its contract in March 2016.
The unit has been on the market for same time and has recently been linked with a potential Iranian export project.
The other high-profile LNG financing to close in the last two years has a more robust contractual structure. The $190 million financing by
JBIC and MUFG for NYK's Rosewood backed the construction of vessels serving the Cameron LNG liquefaction facility in the U.S., which
has a suite of strong Japanese offtakers.
LNG Shipping market review
LNG market
Shipping ECA finance 2018 Supported by:
319
Introduction: a volatile market
Volume

Gas-fired power generation has driven the growth in the
global LNG trade, as coal gets progressively less
attractive to power producers because of its high cost
and carbon emissions. Renewables may start to displace
gas in some circumstances, but for now gas has a crucial
role in balancing renewables.
So, despite the transaction record recently, transporting
gas from regions where demand is weak, or production is
booming, looks like a winning industry. Short-term
charter rates certainly seem to reflect a growing
tightness of vessel supply, climbing above break-even by
the end of 2017. The challenge for exporters and, by
extension, vessel owners, is that the structure of the
global LNG market is shifting.
The long-standing linkage between LNG contract pricing
and crude oil prices has been progressively weakening,
with customers increasingly demanding linkages to gas
price benchmarks like Henry Hub instead. Some
producers are even willing to sell cargoes on a spot basis
rather than under contract. A growth in LNG spot trading
volumes may weaken the credit profile of LNG vessel
financings.
Shipping lenders who have looked to long term charter
based cashflow volumes before residual value have
suffered lower losses than asset-based lenders, and will
be wary of supporting riskier LNG carrier deals.
That said, Asian ECAs, which have ruthlessly supported
shipyards focusing on LNG, may be asked to look at
financing vessels either without charters or with much
shorter-term charters than has been common until now.
With Korean yards accounting for the bulk of orders, the
attitude of KEXIM and K-Sure towards spot risk will be
worth following.
20
40
60
80
100
120
140
160
180
1,000 per day
Source: 5 Estimated break even point
20162015 2017 2018
Short term rates for LNG carriers
A volatile market
LNG market
Spot & short-term contracts by %
2010 2011 2012 2013 2014 2015 2016 20172009
15%
20%
25%
30%
35%
Global trade vs. spot & short-term contractsGlobal trade Spot & short term %
2017 289.8 77.6 26.8%
2016 263.6 74.6 28.3%
2015 245.2 68.4 27.9%
2014 241.1 69.6 28.9%
2013 236.8 65.0 27.4%
2012 237.7 59.2 24.9%
2011 241.5 61.2 25.4%
2010 217.3 41.1 18.9%
2019 179.4 29.3 16.3%Source: 3
Shipping ECA finance 2018 Supported by:
LNG Shipping market review
Sources:
1. TXF research
2. International Gas Union annual reports
3. International Group of Liquified Gas Importers annual report
4. www.tagmydeals.com
5. Teekay annual report 2017
20
LNG trains by status
Source: 1,3
For the first 15 years of its life, liquefied natural gas was
little more than a niche option for gas producers. It wasn't
until 1994 that more than 10 million cubic metres of
capacity came online in one year. The LNG market
changed drastically this century. Annual additions have
only dropped below 10 million cubic metres twice since
2000.
As costs fell and lenders and offtakers got more
comfortable with producing countries like Qatar, Trinidad,
Nigeria and Indonesia, LNG became mainstream. It was
from 2008 — the same year as the last major financial crisis
— that additions peaked, largely on the back of an
increase in supply from Australia, including coal-bed
methane projects on Australia's East Coast. The U.S., once
predicted to be a large importer, is now poised to be a
massive exporter.
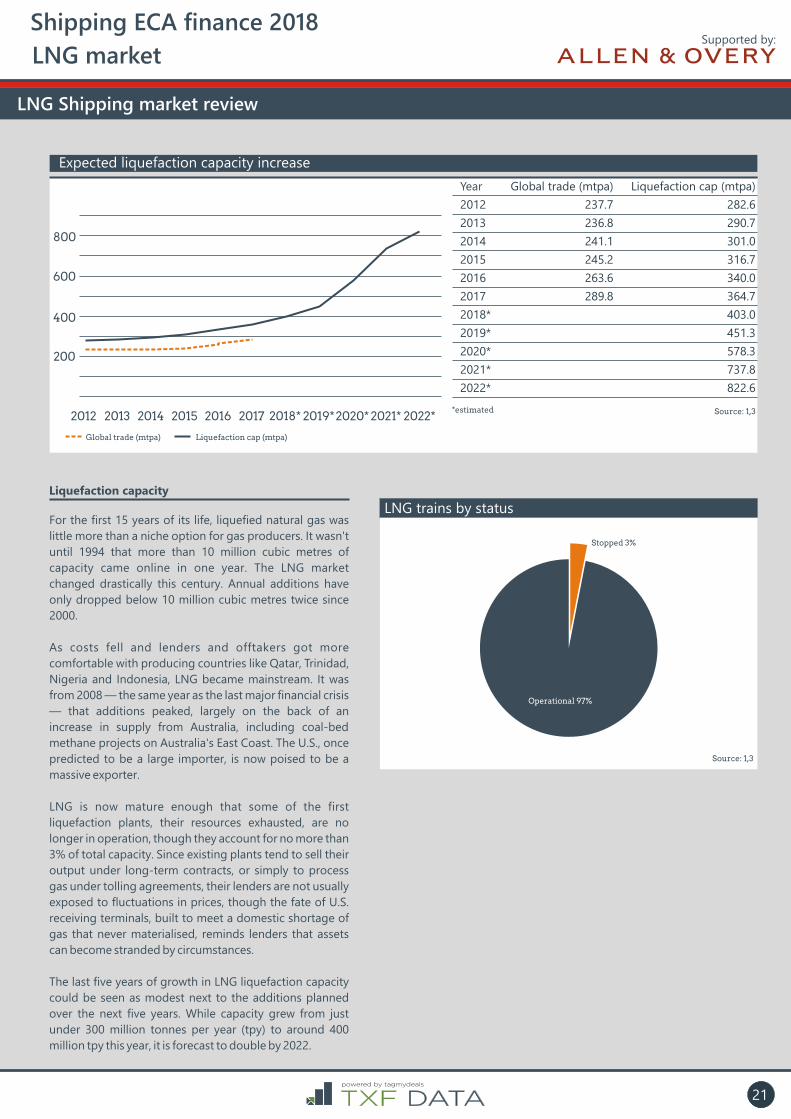
LNG is now mature enough that some of the first
liquefaction plants, their resources exhausted, are no
longer in operation, though they account for no more than
3% of total capacity. Since existing plants tend to sell their
output under long-term contracts, or simply to process
gas under tolling agreements, their lenders are not usually
exposed to fluctuations in prices, though the fate of U.S.
receiving terminals, built to meet a domestic shortage of
gas that never materialised, reminds lenders that assets
can become stranded by circumstances.
The last five years of growth in LNG liquefaction capacity
could be seen as modest next to the additions planned
over the next five years. While capacity grew from just
under 300 million tonnes per year (tpy) to around 400
million tpy this year, it is forecast to double by 2022.
Liquefaction capacity
Operational 97%
Stopped 3%
Year Global trade (mtpa) Liquefaction cap (mtpa)
2012 237.7 282.6
2013 236.8 290.7
2014 241.1 301.0
2015 245.2 316.7
2016 263.6 340.0
2017 289.8 364.7
2018* 403.0
2019* 451.3
2020* 578.3
2021* 737.8
2022* 822.6
*estimated Source: 1,3
LNG market
Shipping ECA finance 2018 Supported by:
LNG Shipping market review
Expected liquefaction capacity increase
201420132012
200
400
600
800
2015 2016 2017 2018* 2019*2020* 2021* 2022*
Global trade (mtpa) Liquefaction cap (mtpa)
321
Shipping ECA finance 2018
LNG market
15 16 1714131211100908070605040302010099989796959493<93
10
10
20
20
30
30
40
40
50
50
60
60
70
80
90
100
LNG fleet by age
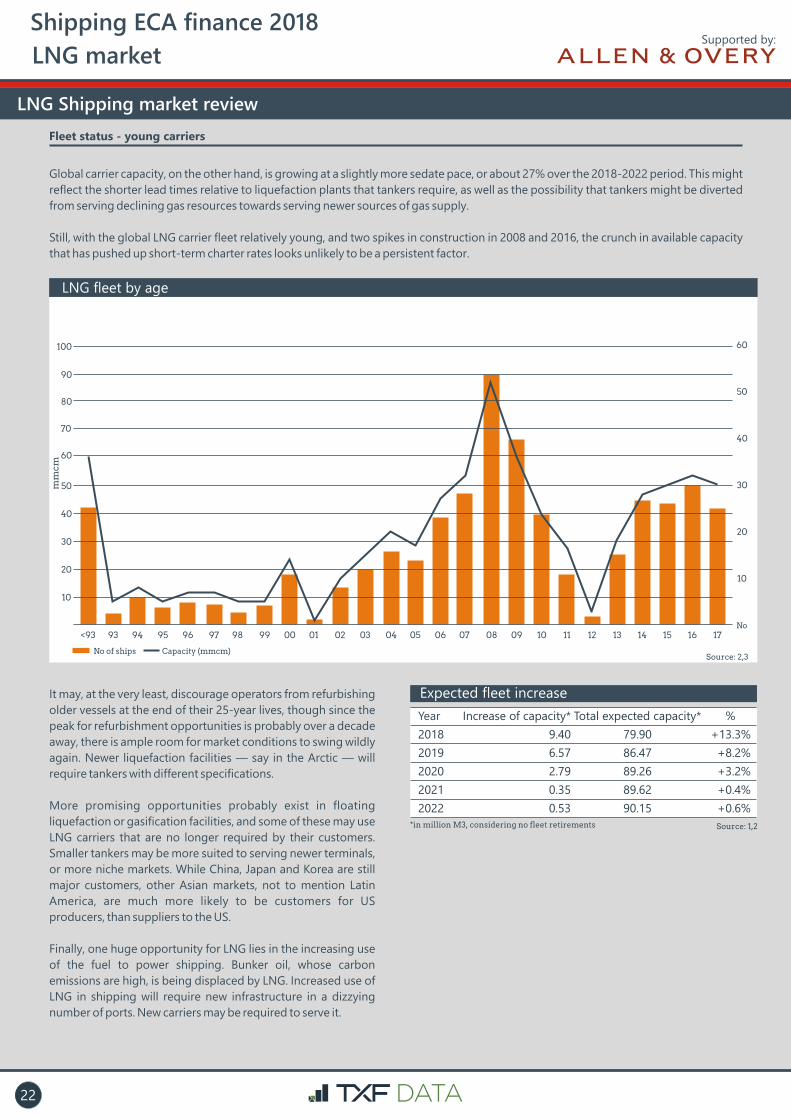
Global carrier capacity, on the other hand, is growing at a slightly more sedate pace, or about 27% over the 2018-2022 period. This might
reflect the shorter lead times relative to liquefaction plants that tankers require, as well as the possibility that tankers might be diverted
from serving declining gas resources towards serving newer sources of gas supply.
Still, with the global LNG carrier fleet relatively young, and two spikes in construction in 2008 and 2016, the crunch in available capacity
that has pushed up short-term charter rates looks unlikely to be a persistent factor.
It may, at the very least, discourage operators from refurbishing
older vessels at the end of their 25-year lives, though since the
peak for refurbishment opportunities is probably over a decade
away, there is ample room for market conditions to swing wildly
again. Newer liquefaction facilities — say in the Arctic — will
require tankers with different specifications.
More promising opportunities probably exist in floating
liquefaction or gasification facilities, and some of these may use
LNG carriers that are no longer required by their customers.
Smaller tankers may be more suited to serving newer terminals,
or more niche markets. While China, Japan and Korea are still
major customers, other Asian markets, not to mention Latin
America, are much more likely to be customers for US
producers, than suppliers to the US.
Finally, one huge opportunity for LNG lies in the increasing use
of the fuel to power shipping. Bunker oil, whose carbon
emissions are high, is being displaced by LNG. Increased use of
LNG in shipping will require new infrastructure in a dizzying
number of ports. New carriers may be required to serve it.
Supported by:
Fleet status - young carriers
Year Increase of capacity* Total expected capacity* %
2018 9.40 79.90 +13.3%
2019 6.57 86.47 +8.2%
2020 2.79 89.26 +3.2%
2021 0.35 89.62 +0.4%
2022 0.53 90.15 +0.6%
Expected fleet increase
*in million M3, considering no fleet retirements Source: 1,2
Source: 2,3No of ships Capacity (mmcm)
mm
cm
No
LNG Shipping market review
22

Yards in Korea, and to a lesser extent, Japan, will continue to
supply the bulk of new LNG carriers. However, there is much less
visibility about their long-term order books than there is in
cruise ships. Only Japan's Imabari can point to orders after 2021,
and Japan's other yards, with the exception of Mitsubishi,
cannot point to any orders after 2019.
Korea remains the powerhouse in LNG carrier construction.
Daewoo accounts for just under a third of all announced orders
between now and 2022, and Samsung and Hyundai account for
another third. LNG is well placed to compensate for falling
orders for conventional tankers, dry bulk carriers and container
ships. The container sector, in particular, has been a source of
problems for Korea's official agencies, thanks to widespread
distress among Korean shipping lines.
Korea's ECAs have been happy to fund the construction of LNG
vessels. Both KEXIM and K-SURE, for instance, supported Golar's
$1.125 billion financing for a clutch of floating regas units in
2013. The financing, for which Citi was bookrunner, was notable
for not having charters for the vessels in place.
ECA financings for LNG vessels have been so rare that only half
of the operators with more than three vessels on order between
now and 2022 have used ECA debt in the past. But the demand
for LNG carriers is much more diverse and less concentrated
than the supply and might point to greater variety in financing
type. With these operators having a diverse risk profile, and
serving an increasingly diverse mix of customers, newer sources
of financing are likely to emerge.
Since LNG carrier ECA financings are infrequent, the market is
unlikely to settle on a single enduring template, though Korean
ECA involvement is likely as long as these agencies have the
resources to support Korean yards, and Korean yards continue
to win new orders.
Order books: enter the ECAs
Yard 2018 2019 2020 2021 2022 Total
Daewoo 15 19 6 - - 40
Samsung 10 8 1 1 - 20
Hyundai 8 6 5 - - 19
Hundong-Zhonghua 4 2 4 1 - 11
Mitsubishi 8 2 - - - 10
Kawasaki 6 1 - - - 7
Imabari 2 1 - 1 3 6
Japan Marine 2 2 - - - 4
Dalian 1 - - 2 - 2
Total 56 40 16 3 3 118
Used ECA* Owner 2018 2019 2020 2021 2022 Total
No MOL 4 2 3 - - 9
Yes Maran Gas 1 5 2 - - 8
Yes GasLog 3 4 - - - 7
No Flex LNG 4 2 - - - 6
No BP 3 3 - - - 6
Yes Teekay 3 3 - - - 6
No Dynagas - 3 1 1 - 5
Yes BW 2 2 - - - 4
Yes NYK 2 2 - - - 4
No SK Shipping - - 3 - - 3
No TMS Cardiff - - - - 3 3
Yes Hoegh 2 1 - - - 3
Source: 1,2
Source: 1,2
Orders for LNG carriers by yard
Top orderbooks for LNG vessels by customer¹
LNG market
The health of the order book in turn will
depend on whether global LNG demand
lives up to analysts’ predictions and
seriously outpaces additions. In the 2011-
14 period a small gap between trade
levels and available capacity led to spikes
in charter rates. After that, rates dropped
back rapidly, before climbing sharply in
2017 as the increase in trading volumes
again started to outstrip capacity.
The LNG market has proved in the past to
be very sensitive to these mismatches.
Customers have increasing variety and
optionality in how they source cargoes,
and technologies like floating regas are
only adding to their options.
Charter rates likely to rebound after additions
*considering no fleet retirements Sources: 1, 2, 3, 5
*Previous users of ECA debt since 2012. Source: www.tagmydeals.com
1 Sole venture orders only
Shipping ECA finance 2018 Supported by:
LNG Shipping market review
201120102009 2012 2013 2014 2015 2016 2017 2018 2019 2020 2021Global trade (mtpa) Fleet cap (mmcm)* Charter rates per day
200
225
250
275
300
mtpa mmcm
100
90
80
70
600
50
40
30
20
10
323
Estimated break even point
