shipping market review november 2020 - ship finance
TRANSCRIPT

SHIPPING MARKET REVIEW – NOVEMBER 2020
1Shipping Market Review – November 2020
DISCLAIMER
The persons named as the authors of this report hereby certify that: (i) all of the viewsexpressed in the research report accurately reflect the personal views of the authors on thesubjects; and (ii) no part of their compensation was, is, or will be, directly or indirectly, relatedto the specific recommendations or views expressed in the research report. This report has beenprepared by Danish Ship Finance A/S (“DSF”).
This report is provided to you for information purposes only. Whilst every effort has been takento make the information contained herein as reliable as possible, DSF does not represent theinformation as accurate or complete, and it should not be relied upon as such. Any opinionsexpressed reflect DSF’s judgment at the time this report was prepared and are subject tochange without notice. DSF will not be responsible for the consequences of reliance upon anyopinion or statement contained in this report. This report is based on information obtained fromsources which DSF believes to be reliable, but DSF does not represent or warrant suchinformation’s accuracy, completeness, timeliness, merchantability or fitness for a particularpurpose. The information in this report is not intended to predict actual results, and actualresults may differ substantially from forecasts and estimates provided in this report. This reportmay not be reproduced, in whole or in part, without the prior written permission of DSF. To Non-Danish residents: The contents hereof are intended for the use of non-private customers andmay not be issued or passed on to any person and/or institution without the prior writtenconsent of DSF. Additional information regarding this publication will be furnished upon request.
2Shipping Market Review – November 2020
HEAD OF INNOVATION & RESEARCH
Christopher Rex, [email protected]
ANALYTICAL TEAM
Jonas Stenbjerg, Senior Analyst
Tore Hjelmager, Analyst
Jonas Hoffmann, Analyst
Sebastian Müllertz, Analyst
3Shipping Market Review – November 2020
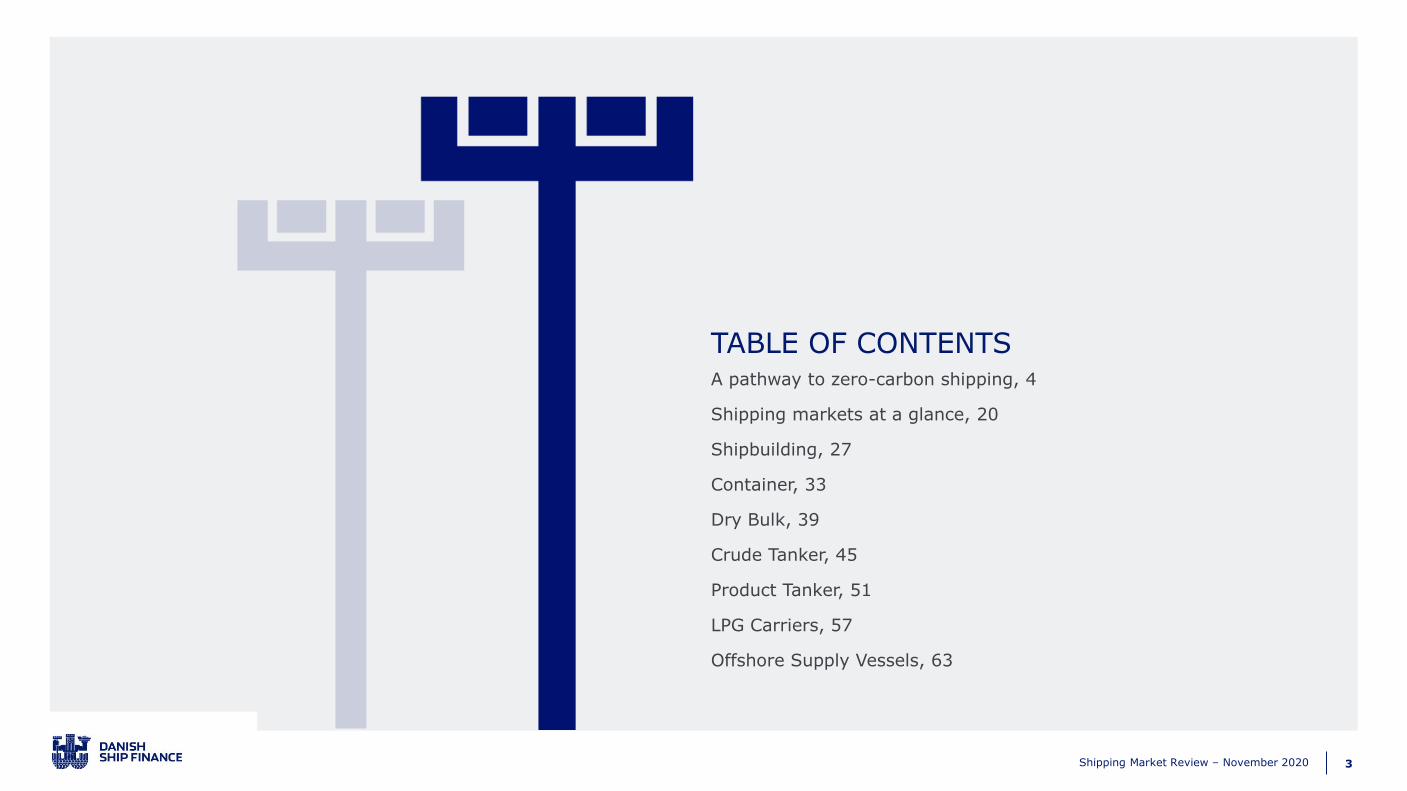
TABLE OF CONTENTSA pathway to zero-carbon shipping, 4
Shipping markets at a glance, 20
Shipbuilding, 27
Container, 33
Dry Bulk, 39
Crude Tanker, 45
Product Tanker, 51
LPG Carriers, 57
Offshore Supply Vessels, 63
4Shipping Market Review – November 2020
A PATHWAY TO ZERO-CARBON SHIPPING
5Shipping Market Review – November 2020
The shipping industry is struggling to identify a clear pathway towards decarbonisation.
The asset base is owned by small and medium-sized players. The fragmented industry
structure complicates the articulation and development of an industry-wide strategy for
zero-carbon fuels. Many initiatives are currently being reviewed. Costs remain a major
issue. There is currently no zero-carbon fuel that can offer a global distribution network at
scale which is price competitive with current bunker fuels.
The short- and medium-term outlook is shrouded in uncertainty. The industry’s low return
on invested capital combined with the increased need to invest has dried up the supply of
equity investors and created an environment where there are more sellers than buyers of
vessels. We foresee a bumpy transition in the absence of clear long-term guidance from
regulators that works to bridge and facilitate the energy transition.
The long-term value play is about reducing the global economy’s CO2 footprint by
decarbonising the underlying industries and sectors. To some extent, this means
replacing the oil and gas industry, which requires a standardised, scalable and cost-
competitive zero-carbon fuel solution that can work across sectors to be identified. The
transformation is likely to reshape industries and redistribute value creation.
Shipowners’ access to cargo, capital and ports could be at risk if they are considered not
to be doing enough to reduce their CO2 footprint. Their ability to offer a cost-competitive
zero-carbon service to their customers will, at some point, be a critical element in the
renewal of their licence to operate.
We set out a vision for the future that aims to turn the climate agenda into a business
opportunity. The next-generation zero-carbon-fuelled vessels could emerge as an
attractive asset class. The route to additional value creation is primarily cost savings
through standardisation and economies of scale.
The barriers to entry could be raised – if only for a period – via the development of a
zero-carbon fuel supply available to players that actively engage in sector integration.
Sector integration is about pooling various sectors’ fuel demand to reach critical mass and
allow prices to come down. The zero-carbon fuel choice of the future is a global challenge
facing all industries and sectors of the economy, not just maritime players. The shipping
industry is unlikely to be the trailblazer, but some maritime players actively engaging in
the decarbonisation process would be likely to benefit from the change.
The transition is strategically not a fuel-type problem. Shifting to zero-carbon fuel will
not, in isolation, form a clear pathway to the future; the ability to yield a return on
invested capital will not improve just because the fuel mix changes. The forces at play are
more fundamental and will – at some point – begin to redesign the competitive landscape
by changing value drivers and business models.
There is little doubt that the first spark will need to come from new regulation, a carbon
tax and/or government subsidies, but incentives alone will not be enough. We aim to
stimulate a discussion on value drivers and business models that can help reduce existing
vulnerabilities and allow additional value to be created.
EXECUTIVE SUMMARYHow to turn the climate agenda into a business opportunity
We present a vision that aims to identify how ships, as an asset class, can re-emerge as an attractive investment opportunity in a
zero-carbon future. This is, to some extent, a discussion of end-game scenarios. Whether or not the scenarios actually materialise is
not that important; the key thing is that exploring them may allow us to open our minds to alternative trajectories and help us
escape the rut of linear thinking.
6Shipping Market Review – November 2020
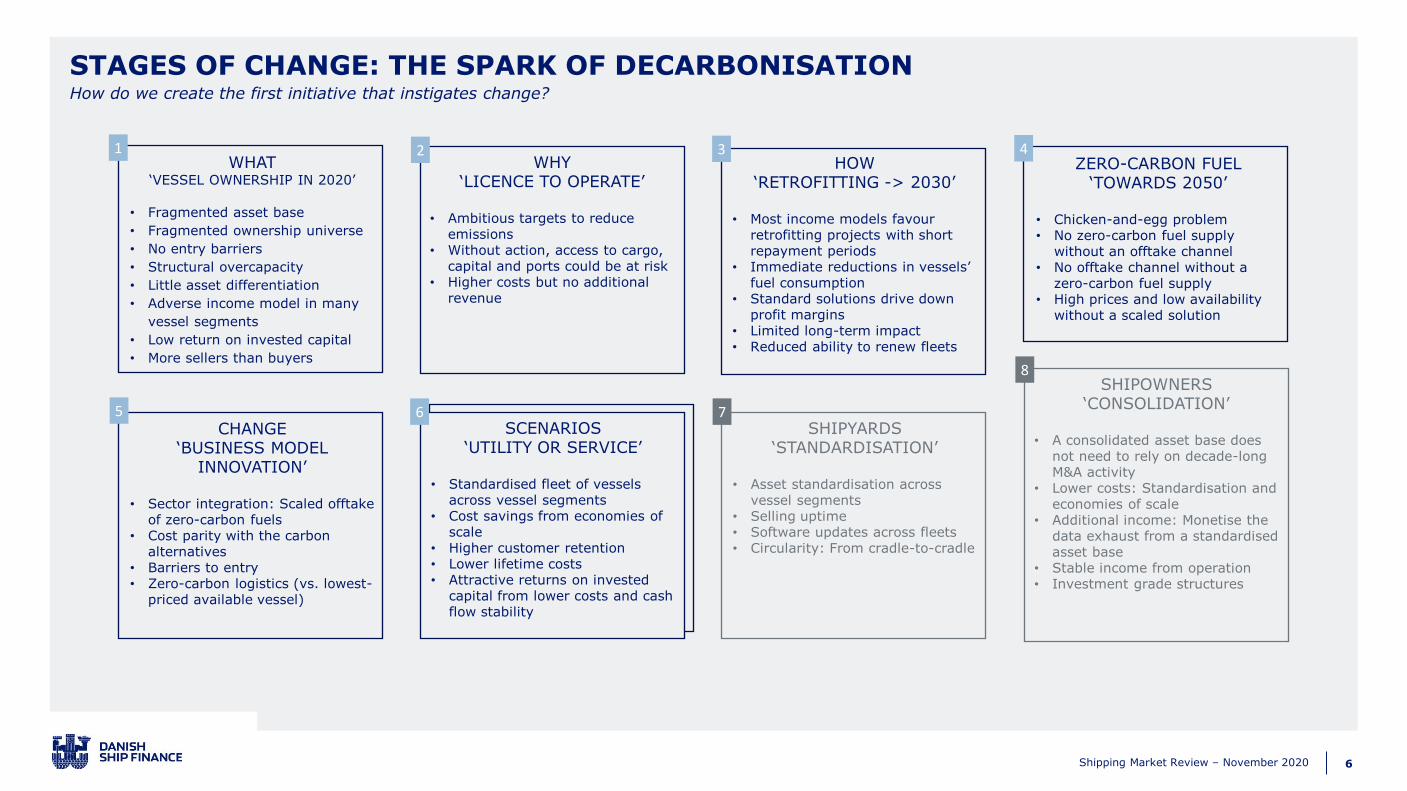
STAGES OF CHANGE: THE SPARK OF DECARBONISATIONHow do we create the first initiative that instigates change?
HOW‘RETROFITTING -> 2030’
• Most income models favour retrofitting projects with short repayment periods
• Immediate reductions in vessels’ fuel consumption
• Standard solutions drive down profit margins
• Limited long-term impact• Reduced ability to renew fleets
CHANGE‘BUSINESS MODEL
INNOVATION’
• Sector integration: Scaled offtake of zero-carbon fuels
• Cost parity with the carbon alternatives
• Barriers to entry• Zero-carbon logistics (vs. lowest-
priced available vessel)
SCENARIOS‘UTILITY OR SERVICE’
• Standardised fleet of vessels across vessel segments
• Cost savings from economies of scale
• Higher customer retention• Lower lifetime costs• Attractive returns on invested
capital from lower costs and cash flow stability
SHIPYARDS‘STANDARDISATION’
• Asset standardisation across vessel segments
• Selling uptime• Software updates across fleets• Circularity: From cradle-to-cradle
SHIPOWNERS‘CONSOLIDATION’
• A consolidated asset base does not need to rely on decade-long M&A activity
• Lower costs: Standardisation and economies of scale
• Additional income: Monetise the data exhaust from a standardised asset base
• Stable income from operation• Investment grade structures
1 2 3 4
5 7
8
WHAT‘VESSEL OWNERSHIP IN 2020’
• Fragmented asset base
• Fragmented ownership universe
• No entry barriers
• Structural overcapacity
• Little asset differentiation
• Adverse income model in many
vessel segments
• Low return on invested capital
• More sellers than buyers
WHY‘LICENCE TO OPERATE’
• Ambitious targets to reduce emissions
• Without action, access to cargo, capital and ports could be at risk
• Higher costs but no additional revenue
ZERO-CARBON FUEL‘TOWARDS 2050’
• Chicken-and-egg problem• No zero-carbon fuel supply
without an offtake channel• No offtake channel without a
zero-carbon fuel supply• High prices and low availability
without a scaled solution
6
7Shipping Market Review – November 2020
?
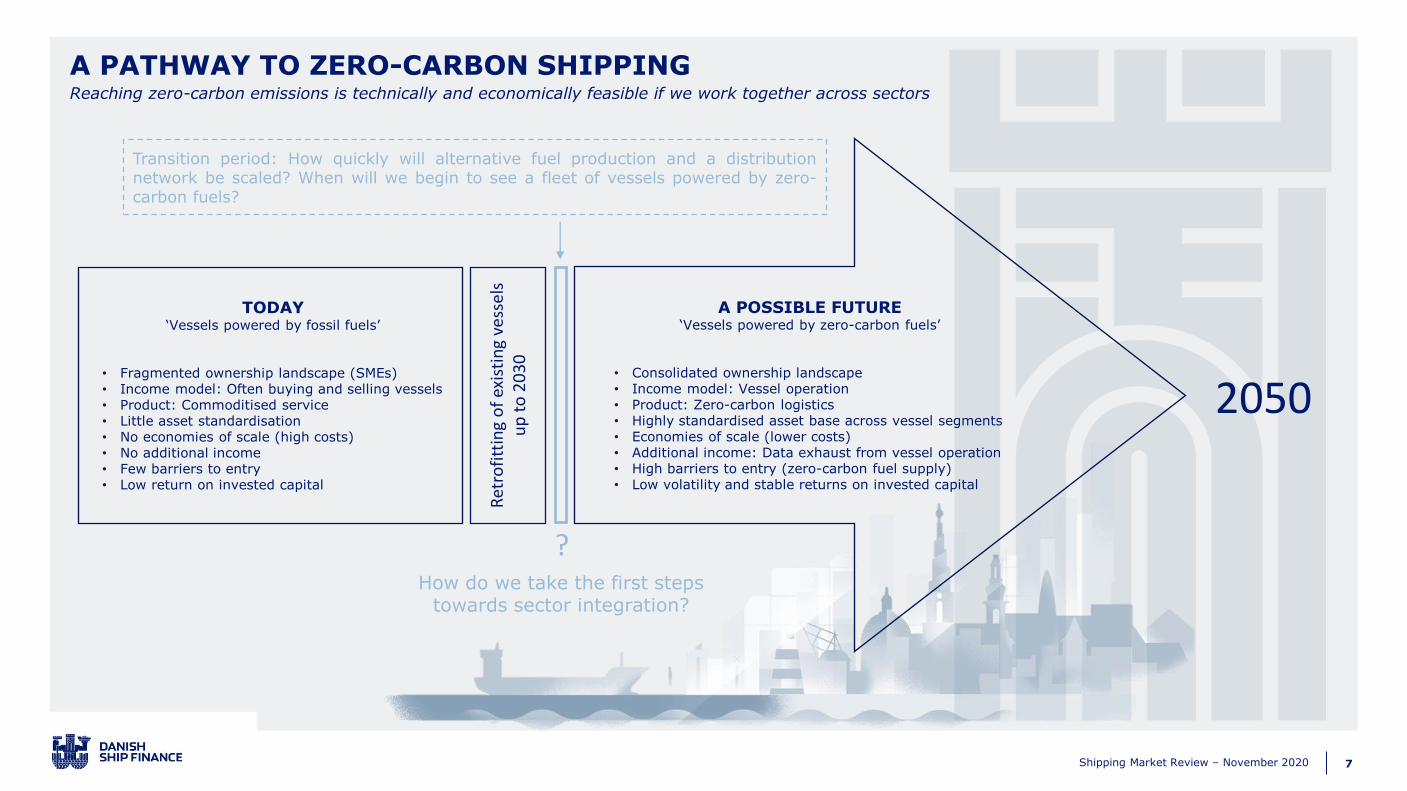
A PATHWAY TO ZERO-CARBON SHIPPINGReaching zero-carbon emissions is technically and economically feasible if we work together across sectors
Ret
rofi
ttin
g o
f ex
isti
ng
vess
els
up
to
20
30
2050
A POSSIBLE FUTURE‘Vessels powered by zero-carbon fuels’
• Consolidated ownership landscape• Income model: Vessel operation• Product: Zero-carbon logistics• Highly standardised asset base across vessel segments• Economies of scale (lower costs)• Additional income: Data exhaust from vessel operation• High barriers to entry (zero-carbon fuel supply)• Low volatility and stable returns on invested capital
TODAY‘Vessels powered by fossil fuels’
• Fragmented ownership landscape (SMEs)• Income model: Often buying and selling vessels• Product: Commoditised service• Little asset standardisation• No economies of scale (high costs)• No additional income• Few barriers to entry• Low return on invested capital
Transition period: How quickly will alternative fuel production and a distributionnetwork be scaled? When will we begin to see a fleet of vessels powered by zero-carbon fuels?
How do we take the first steps towards sector integration?
8Shipping Market Review – November 2020
The world fleet numbers more than 60,000 vessels, sharing few standards. Most fleets
are owned by small or medium-sized players. Business models are relatively simple: you
either charter out your vessel or you operate it. Most vessel segments have been
burdened by surplus vessel capacity for large parts of the past decade. This has driven
down freight rates and charter rates. The return on invested capital has been low across
vessel segments.
LOW BARRIERS TO ENTRY
Few vessel segments can present meaningful barriers to entry except for some of the
more industrialised Liner operations, many of which operate in short-sea trades within
specific regions. The more tramp-based operations are working almost without any
barriers to entry. Income stability is generally greater for players operating behind some
barriers to entry, while much of the value generation in tramp operations is achieved
from buying and selling vessels rather than operating them.
THE LACK OF STANDARDISATION RAISES COSTS AND LOWERS PROFITABILITY
The commoditised nature of cargo handling leaves little room for differentiation. The
fragmented asset base means few tangible financial benefits for individual owners. The
lack of standardisation raises costs and lowers the potential for additional cost savings
through consolidation and economies of scale.
ADDITIONAL COST SAVINGS ARE NEEDED
Additional cost savings are available for shipowners that invest to reduce individual
vessels’ fuel consumption. This is largely a question of investing in and implementing new
technology, onshore and onboard the vessels. The industry has progressed in this field
over the past few years, demonstrating that the potential is real. Still, a significant part of
the fleet is owned by players that earn their money not by operating the vessels but by
buying and selling them. This limits the demand for investing in solutions with long
repayment periods. Many retrofitting projects are focused on solutions that deliver
immediate reductions in individual vessels’ fuel consumption.
SHIPOWNERS’ LICENCE TO OPERATE IS AT RISK
By implementing new technologies, the industry continues to improve fuel efficiency and
reduce operational inefficiencies. These are critical elements for individual shipowners to
stay competitive. However, if the solutions that deliver the efficiency improvements are
available to all players willing to pay, it will simply drive down margins. Shipowners’
medium-term licence to operate is somehow being renegotiated, since lower returns on
invested capital limit their appetite to renew their fleets. Those operating their own
vessels are in a better position, but not all may have access to the competencies,
technologies or capital needed to progress.
LOW RETURNS ON INVESTED CAPITAL LIMIT THE APPETITE FOR INNOVATION
The industry’s low returns on invested capital combined with the increased need to invest
in new technologies have dried up the supply of equity investors and created an
environment where there are more sellers than buyers of vessels. Few new vessels are
being ordered, and transaction volumes among existing vessels are currently low.
VESSELS AS AN ASSET CLASSThe industry’s low return on invested capital is reducing the supply of equity investors
The shipping industry is an integrated part of the global economy. There is little to indicate that the service delivered is about to
become obsolete. However, critical elements of the industry’s architecture need to change before ownership of the vessels that serve
the global economy once again becomes an attractive investment opportunity. The global call to decarbonise the shipping industry
increases costs while doing little to support revenues.
9Shipping Market Review – November 2020
The climate agenda is working to reduce total energy consumption and increase energy
efficiency across all parts of the economy. The push is global and is transiting through
numerous channels. The ripple effects are intensifying and will soon begin to reach the
tectonic plates underlying industries and sectors.
THE CLIMATE AGENDA IS REDEFINING THE LICENCE TO OPERATE
The shipping industry has taken steps to address emissions and set ambitious targets
towards carbon neutrality by 2050. The case for action is clear. Making progress towards
zero-emission vessels will require concerted efforts not only by shipowners but by many
actors across the value chain. Shipowners’ access to cargo, capital and ports could be at
risk if they are considered not to be doing enough about their CO2 footprint. The time for
action is now.
THE CALL TO ACTION IS ON
Mounting scrutiny from the public, the media, investors, lenders and regulators is
increasing the pressure. Investors, for their part, are concerned about the effects of
climate risk on valuations and access to capital. Climate-related financial disclosures are
becoming more common. Institutions and governments are announcing policies on CO2
and zero-carbon fuels, and some are considering implementing national or regional
carbon taxes. There are hopes that a global carbon tax could facilitate the transition.
A FRAGMENTED ASSET SIDE IS STRUGGLING TO CHAIR THE TRANSITION
It seems that the industry’s transition is not being orchestrated by the shipowners,
although some are investing to be forerunners. It is charterers, ship managers,
equipment manufacturers and service providers, among others, which are working to
develop and scale new efficiency-improving solutions for the industry that will allow
massive cost savings (including fuel) without risking equity in non-scalable vessels that
share few standards. This field is often dominated by players that are significantly more
consolidated than those in the vessel-owning space.
THE RISK OF STRANDED ASSETS IS ON THE RISE
The forces at play could, at some point, begin to reshape the competitive landscape by
changing value drivers and business models. Owners of existing assets in particular are
exposed, and the risk of stranded assets is on the rise, with older assets seemingly less
exposed than younger ones. Freight rates are low across oversupplied markets and many
vessels are at risk of unexpected short-term value depreciation.
NOT ALL VESSEL OWNERS WILL RENEW THEIR FLEETS
The implementation of new technologies, not just related to the operation of the vessel
but also the booking and tracking of cargo, is expected to increase competition and
reduce margins. We expect that the average small and medium-sized owner, operating a
fragmented fleet, will find it increasingly difficult to deliver a return on invested capital
justifying fleet renewal.
THE LICENCE TO OPERATE IS UP FOR RENEWALThe global economy's call to decarbonise is exacerbating existing vulnerabilities across sectors and industries
The demands to advance the climate agenda are starting to affect how businesses operate as they attempt to cut their carbon
emissions, ramp up energy efficiency, and adjust to new risks incurred by the introduction of new technologies. The shipping
industry is no exception. The global call to decarbonise is increasing the pressure on margins at a time when the shipping industry
can scarcely handle any additional financial burden.
10Shipping Market Review – November 2020
The industry’s path towards lower carbon emissions is clearly related to fleet renewal,
since new vessels have more efficient engines than older vessels. The current appetite for
fleet renewals is low, however, in the absence of a clear pathway towards zero-carbon
shipping.
RETROFITTING IS ONLY A SHORT-TERM SOLUTION
The industry is working to cut emissions on existing vessels. Fuel represents by far the
largest share of operational costs, which is why operators have an intrinsic motivation for
increasing their fuel efficiency. Many players across the maritime space are working to
optimise operational efficiency and traffic planning. The industry has invested large sums
in modernising vessels through retrofits and introduction of new technologies both
onshore and onboard vessels. However, these actions can only get the industry so far,
cutting emissions by maybe 20-30-40% compared with the do-nothing alternative.
RETROFITTING EXISTING VESSELS OFTEN REPRESENTS AN ATTRACTIVE BUSINESS CASE
Additional leaps in energy efficiency are largely possible through the application of new
technology. Still, some retrofitting cases fail because repayment periods are too long, and
others because the technology required is not yet mature. Nonetheless, retrofitting
existing vessels to lower their fuel consumption continues to represent an attractive
business case in the years to come.
THIRD-PARTY SOLUTIONS ARE DRIVING DOWN MARGINS
However, implementing the latest industry upgrade, developed by a third-party provider
and available to anyone willing to pay, may represent a difficult choice. It is like an arms
race. It may deliver short-term value but will also drive up costs. Eventually, it will drive
down profit margins. But doing nothing is not an option either.
CONSOLIDATION IS NOT A SHORT-TERM SOLUTION
In past editions of our Shipping Market Review, we have argued that the industry needs
to consolidate the asset-owning space. This appears to be a prerequisite for the next
generation of digital and zero-carbon vessels, since it is expected to pave the way for cost
savings and monetisation of the vessels’ data exhaust. But for the current fleet, this is
not an attractive option. The fragmented asset base means that achieving economies of
scale or higher barriers to entry simply by being owned by fewer players is not possible.
Consolidation of the current fleet is unlikely to improve returns on invested capital
beyond potential reductions in the cost of capital.
THE BARRIERS TO ENTRY NEED TO INCREASE
Take the current business environment for the major Container Liner companies as an
example. The largest companies own and control a significant share of the industry
individually but are still price takers in an oversupplied and volatile market. Additional
cost savings would not, per se, increase the returns on invested capital to a degree that
would change investors’ appetite. The barriers to entry need to increase one way or
another.
RETROFITTING EXISTING VESSELS TO EXTEND THEIR LIFETIMESNavigating the transition while protecting asset values
The short-term challenge is all about the vessels and individual shipowners. The fragmented asset base limits the ability to introduce
large-scale refurbishment programmes to extend the lives of existing vessels. Retrofitting existing vessels often represents an
attractive business case and is often handled by individual shipowners on a ship-by-ship basis. Still, this can only extend the lives of
existing assets and postpone the need to renew fleets; it is not a long-term industry solution.
11Shipping Market Review – November 2020
The shipping industry is struggling to identify a clear pathway towards decarbonisation.
Some discussions on the industry transition are centred around questions about fuels,
safety, regulation and technologies. These are all valid topics, on which there are many
unanswered questions, but addressing them in isolation will not establish a clear pathway
to the future. The reality is that more fundamental forces are at play. It is true that none
of today’s business models are able to handle higher costs without compensation in some
form or another, but changing the fuel mix will not, per se, increase returns on invested
capital.
THE INDUSTRY STRUCTURE AND COMPETITIVE LANDSCAPE ARE UP FOR REVIEW
The call to decarbonise is a long-term ambition that relates largely to the next-generation
vessels that have not yet been built. The pathway to a zero-carbon future is a long-term
value play that over time may introduce critical changes not only to the shipping industry
but to all industries involved.
REPLACING THE OIL AND GAS INDUSTRY…
Change on this scale calls for a global perspective on sector integration. Decarbonisation
is a global challenge facing all industries and sectors of the economy, not just maritime
players. The zero-carbon fuels of the future will supply multiple sectors and industries at
scale to drive down costs and enable a global distribution network to be developed.
…WITH A COST-COMPETITIVE ZERO-CARBON ALTERNATIVE
Zero-carbon fuels present a classic chicken-and-egg problem. Shipowners do not yet
have a viable business case for buying zero-carbon fuels, since no such fuel is currently
available at cost parity and in a global distribution network at scale. Surmounting the
which-comes-first hurdle will involve a large number of groups globally, each playing their
part in achieving this.
A GREAT BUSINESS OPPORTUNITY IS ABOUT TO EMERGE
There is no doubt that the introduction of zero-carbon fuels throws up several issues to
consider including the use of fuels with low(er) energy content, higher prices, more
frequent bunkering and supply concerns. Still, solving these issues represents an
extraordinary business opportunity to be tackled within the next decade.
SUPER-SCALING TO INTRODUCE COST PARITY WITH FOSSIL FUELS
The transition enabler seems to be the identification of a zero-carbon fuel that can be
produced and scaled to the benefit of multiple sectors and industries at cost parity with
fossil fuels. The cost of renewable energy is now below the cost of its fossil counterparts
in most power markets. This justifies plans to expand the direct and indirect
electrification of other sectors. The shipping industry is considered an obvious sector to
electrify indirectly via electrolysis and electrofuels. The most energy-efficient electrofuels
are widely considered to be hydrogen, ammonia and methanol, taking into account
production, storage and transportation. Other alternatives are also being reviewed.
ZERO-CARBON FUELS INTRODUCE BARRIERS TO ENTRY
The ability to offer a zero-carbon logistics solution to the market represents an attractive
business opportunity that also raises the barriers to entry until other players are able to
do the same. The future competitive landscape will be defined by the players that can
offer and scale the operation of zero-carbon vessels, potentially across vessel segments,
at price parity with their carbon-emitting counterparts (i.e. a carbon tax will only help to
bridge the gap).
ZERO-CARBON FUELSTransitioning to a zero-carbon industry is strategically not about the fuel but about the business model
The transition towards zero-carbon shipping is strategically not a fuel-type problem. Shifting to zero-carbon fuel will not, in isolation,
form a clear pathway to the future; the ability to yield a return on invested capital will not improve just because the fuel mix
changes. The forces at play are more fundamental and will – at some point – begin to redesign the competitive landscape by
changing value drivers and business models.
12Shipping Market Review – November 2020
The shipping industry has made great strides towards meeting global emission-reduction
targets by 2030, but it will need to move to the next level of decarbonisation to reach the
2050 goals. Zero-carbon fuel is an option that could enable the industry to do so. It is a
delicate balancing act. The large-scale introduction of zero-carbon fuels could also lead to
rapid fleet renewal without much emphasis on existing assets’ remaining lifetimes. It
would take bold moves and much deeper sector integration to build financial structures
and programmes that could help funnel capital into such a shift. The rewards could be
extraordinary – but the opportunity may not be available to all shipowners.
PUBLIC OR PRIVATE FINANCING?
The ambition of a zero-carbon future is very inspiring, but how do we light the first spark?
And how do we finance it? The rollout of solar and wind energy came after decade-long
public subsidies before reaching cost parity with the carbon alternatives. Many people
argue that the actual rollout of zero-carbon fuels across the global economy could end up
being a slow process without subsidies, new legislation or a (global) carbon tax. They
may very well be right. However, let us explore an alternative route that has its origins in
sector integration.
CREATING AN OFFTAKE CHANNEL AT SCALE TO KICKSTART PRODUCTION AT COST PARITY
Imagine a situation where leading players across industries (including the shipping space)
agree to guarantee an extraordinarily large offtake of a zero-carbon fuel. Such a
commitment would allow zero-carbon fuel producers to super-scale production end-to-
end. The case for this only strengthens when we include more sectors and industries.
Some recent studies suggest that in the not-too-distant future it could be possible to
offer zero-carbon fuels to the market almost at cost parity with carbon fuels if production
were sufficiently scaled.
SOLVING THE CHICKEN-AND-EGG PROBLEM
When we solve the classic chicken-and-egg problem, we will pave the way for the
shipping industry to be decarbonised while creating an extraordinary business
opportunity. The oil and gas industry is painfully aware that the global appetite for its
core services is waning. Players in this industry are also working to take the next steps
towards a zero-carbon future that would allow them to redirect their core services to new
areas. The identification of a scalable business case across not just the shipping industry
but adjacent domains will allow fuel producers to scale production to an extent that zero-
carbon fuels may one day replace fossil fuels.
SECTOR INTEGRATION COULD AMPLIFY THE NEED TO CONSOLIDATE
Vessel ownership in a future of zero-carbon fuels is up for review. For small and medium-
sized shipowners, large-scale sector integration could prove difficult, because they bring
too little volume to the table. Only the largest shipowners with strong balance sheets
seem to be battle ready. Large-scale sector integration could also attract players from
other industries and sectors as well as institutional investors. However, that will not be
enough. The lifetime costs of owning and operating the vessels will need to decline to
balance their income potential. This calls for standardisation and economies of scale.
BUSINESS MODEL INNOVATIONThe introduction of alternative fuels at scale is some years ahead of us, but it is already beginning to shape the strategic outlook
The long-term value play is about reducing the global economy’s CO2 footprint by decarbonising the underlying industries and
sectors. To some extent, this means replacing the oil and gas industry, which requires a standardised, scalable and cost-competitive
zero-carbon fuel solution that can work across sectors to be identified. The transformation is likely to reshape industries and
redistribute value creation.
13Shipping Market Review – November 2020
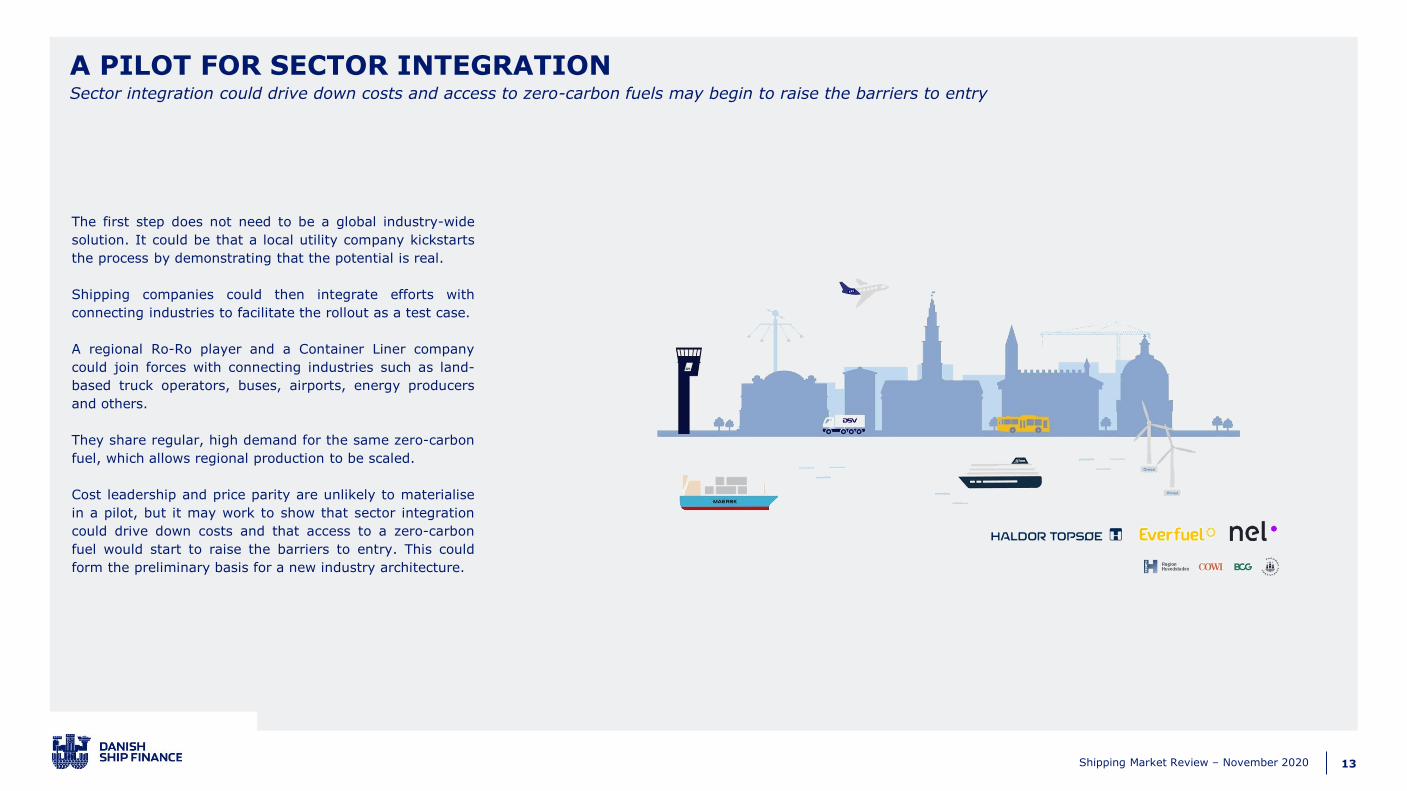
The first step does not need to be a global industry-wide
solution. It could be that a local utility company kickstarts
the process by demonstrating that the potential is real.
Shipping companies could then integrate efforts with
connecting industries to facilitate the rollout as a test case.
A regional Ro-Ro player and a Container Liner company
could join forces with connecting industries such as land-
based truck operators, buses, airports, energy producers
and others.
They share regular, high demand for the same zero-carbon
fuel, which allows regional production to be scaled.
Cost leadership and price parity are unlikely to materialise
in a pilot, but it may work to show that sector integration
could drive down costs and that access to a zero-carbon
fuel would start to raise the barriers to entry. This could
form the preliminary basis for a new industry architecture.
A PILOT FOR SECTOR INTEGRATIONSector integration could drive down costs and access to zero-carbon fuels may begin to raise the barriers to entry
14Shipping Market Review – November 2020
There is no doubt that the call to action is on. But few owners of existing fleets are
currently considering ordering new vessels. Orderbooks are running thin across most
vessel segments, sparking expectations of higher earnings in the years to come if few
new vessels are ordered and demand recovers. Shipyards and OEMs are struggling to fill
their orderbooks. Lower-tier players may close. The consolidation push among shipyards
and OEMs is concentrating the competitive landscape and could accelerate the
standardisation of vessels further.
STRONG FORCES AT PLAY LEAVE LITTLE ROOM FOR NAVIGATION
Similar trends are emerging across multiple frontiers. Large parts of shipowners’
ecosystems are characterised by small numbers of large players dominating their
respective territories: from producers of main engines to OEMs to pool operators,
managers, cargo owners and freight forwarders. The fragmented ownership structure of
vessels allows few shipowners to gain an upper hand.
NEW MARKET DYNAMICS COULD EMERGE FROM SECTOR INTEGRATION
The introduction of more expensive fuels that are not as widely available seems unlikely
to support additional value creation. Nevertheless, the advent of zero-carbon fuels may
open a window of opportunity to establish partnerships that were not previously possible.
These partnerships, across sectors, may not, per se, change much, but they may allow
some market dynamics to change.
THE FRAGMENTED OWNERSHIP LANDSCAPE MAY CONTINUE
The dynamics of sector integration are likely to favour the largest and strongest
shipowners, but the outlook for asset ownership does not necessarily point in the
direction of consolidation. Many shipowners may choose simply to wait, retrofit existing
vessels and only adopt zero-carbon fuels when a clear pathway has emerged. Adopting
such a position could work and could even be very profitable in the years to come. But
there is a risk that it may allow other partnerships to grow and that these partnerships
could introduce radical changes to the market dynamics. Existing vessels could become
obsolete, almost irrespective of their age, if an alternative is introduced that offers more
value for the same freight rate. The message is clear: transformation is not an option; it
is a business imperative.
THE COMPETITIVE LANDSCAPE IS LIKELY TO CHANGE
Regulatory regimes could tighten without warning. The introduction of a global carbon
tax, in one form or another, could supercharge change, blur industry boundaries and
redefine the access to value creation. Players that respond to the call to decarbonise with
an effective transformation process may reap long-term rewards. Still, new fuels will not
fundamentally change the game for shipowners over the next decade, but staying abreast
of market changes and understanding how value creation is affected could be the
difference between becoming a leader or falling behind. Companies that capitalise on
these opportunities faster than the competition could change the playing field in ways
that bring rewards beyond the disruption.
ZERO-CARBON FUELS: WHAT THE FUTURE HOLDS FOR SHIPOWNERSNew fuels may not fundamentally change the game for shipowners over the next decade, but new value drivers may emerge
Many shipowners will be affected by the fuel transition. Historical performance is no longer a guarantee of success. Shipowners need
a solid strategy to avoid being outflanked by peers that create competitive opportunities from new market dynamics. Forward-
thinking companies are launching transformation processes even when they dominate a market, retooling themselves to ensure that
they stay ahead of the pack. Short-term value creation may not prepare players for long-term challenges.
15Shipping Market Review – November 2020
The ability to offer customers a price-competitive zero-carbon transport solution is not
available to many. Early adopters would need to guarantee a fuel offtake that justifies
large-scale production of a zero-carbon fuel. In the shipping industry, it could require a
sweeping consolidation of the ownership landscape – potentially across multiple vessel
segments – or the emergence of a new type of entity that combines large-scale sector
integration with long-term cargo contracts, strong balance sheets and standardised fleets,
potentially across intermodal sectors. Vessel ownership does not need to be the core
focus of such an entity.
A CONSOLIDATED FLEET OF STANDARDISED VESSELS
The asset consolidation does not need to come after decade-long M&A activity between
existing shipowners. Asset consolidation could, for example, materialise in a model where
most of the contracting of the zero-carbon fleet is done by large players consolidating the
ownership of standardised vessels. Many of these players are likely to have engaged in
sector integration to secure a supply of zero-carbon fuels that allows them to offer their
customers a premium zero-carbon transport solution before it becomes widely available.
These vessels are likely to be operated more cost efficiently than their non-standardised
counterparts, since they would reap not only the benefits of standardisation and
economies of scale but also the value potential of the data exhaust from a standardised
asset base.
FIRST MOVERS COULD REACH EXCLUSIVE AGREEMENTS AND SET INDUSTRY STANDARDS
The first movers that actively engage with other major players across sectors could reach
exclusive agreements with suppliers, set industry standards and develop strong
relationships not only with customers but also with investors and lenders. By being
among the first to develop and market zero-carbon transport solutions, first movers could
obtain prime advantages that strengthen their access to cargo, capital and ports. Still, if
the market responds unfavourably, then later entrants could capitalise on the first
movers' failure to produce a product that aligns with consumers’ interests – and the cost
of imitating versus the cost of creating is significantly less.
HIGHER BARRIERS TO ENTRY FOR ZERO-CARBON SHIPS
In this scenario, the shipping industry could slowly be divided into two. The standardised
fleet of zero-carbon vessels would work to carve out the lucrative (and stable) parts of
the market. Long-term zero-carbon cargo volume contracts could be built into the system
to introduce some degree of cash flow stability. A zero-carbon fuel supply at cost parity
would create a barrier to entry until a similar supply became widely available through a
global distribution network at a similar cost. The size of the market available to carbon-
fuelled vessels would continuously decline as the zero-carbon fleet was scaled up.
LOWER OPERATIONAL COSTS AND LOWER COST OF CAPITAL
Large owners of standardised vessels powered by zero-carbon fuels offered to the market
before the fuels become widely available will be supplying a rather unique product to their
customers: a price-competitive zero-carbon transport solution. The standardised fleets
would presumably operate at lower costs and be somewhat protected by barriers to
entry. Such a platform would be likely to attract the attention of large-scale institutional
investors that are working to roll out zero-carbon infrastructures across adjacent
domains. Secured green bonds with long maturities could become an attractive source of
debt for strong owners of zero-carbon assets.
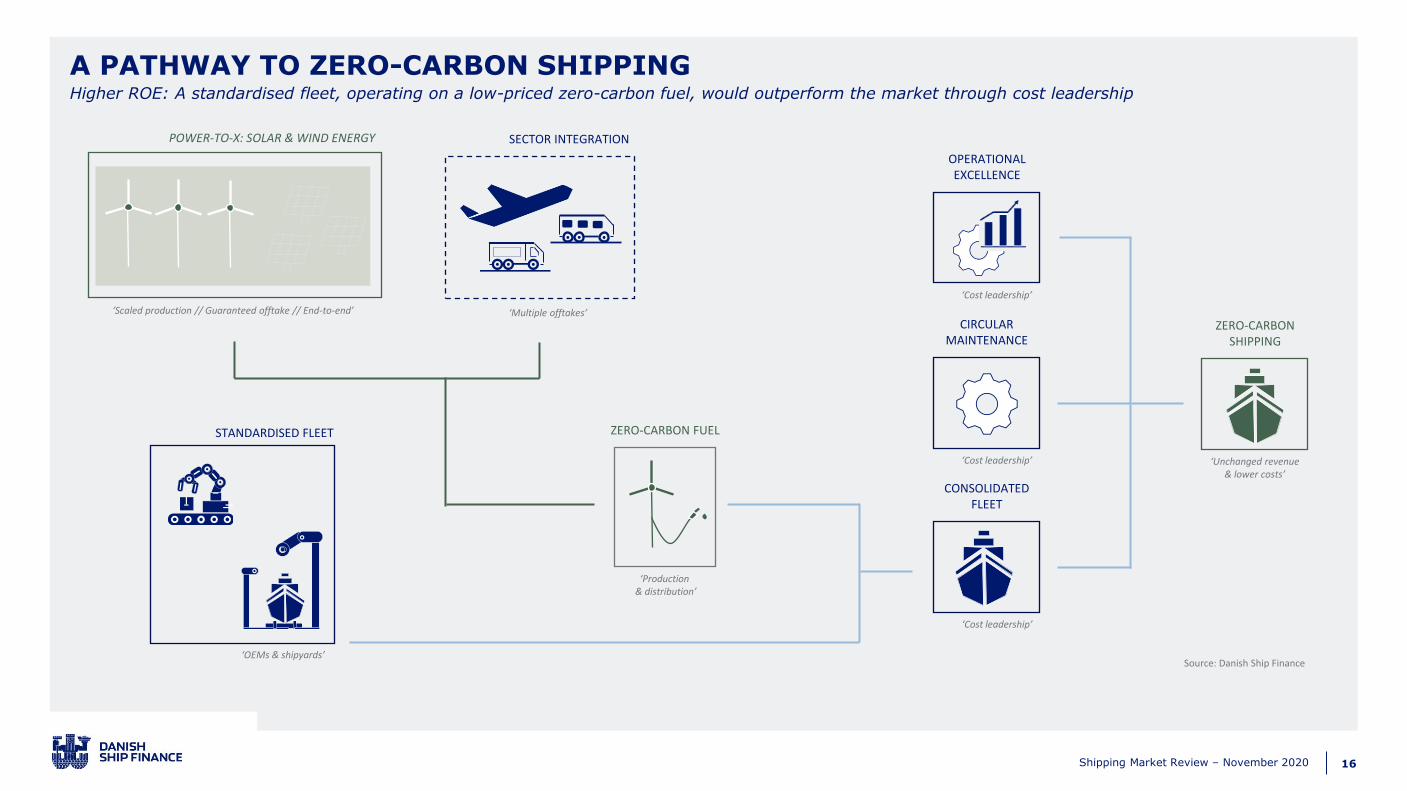
ASSET CONSOLIDATION OF STANDARDISED FLEETS OF VESSELSScenario 1: Large-scale asset consolidation partly financed by secured green bonds with long maturities
The pathway towards a zero-carbon shipping industry may change the competitive landscape within a decade or two. Imagine a
2040 scenario where consolidated groups of shipowners control a large fleet of standardised vessels. These vessels could reap the
benefits of economies of scale, lower cost of capital, cash flow stability and raise the barriers to entry, while broadly operating at cost
parity with traditional carbon-fuelled vessels.
16Shipping Market Review – November 2020
CONSOLIDATEDFLEET
‘Cost leadership’
STANDARDISED FLEET
‘OEMs & shipyards’
CIRCULARMAINTENANCE
‘Cost leadership’
OPERATIONALEXCELLENCE
‘Cost leadership’
ZERO-CARBONSHIPPING
‘Unchanged revenue& lower costs’
SECTOR INTEGRATION
‘Multiple offtakes’
ZERO-CARBON FUEL
‘Production & distribution’
‘Scaled production // Guaranteed offtake // End-to-end’
POWER-TO-X: SOLAR & WIND ENERGY
A PATHWAY TO ZERO-CARBON SHIPPINGHigher ROE: A standardised fleet, operating on a low-priced zero-carbon fuel, would outperform the market through cost leadership
Source: Danish Ship Finance
17Shipping Market Review – November 2020
The fuel transition may potentially revolutionise how value is created across sectors and
industries. The competitive landscape is likely to change and traditional players may find
it increasingly difficult to protect the value of their existing assets. The borders of
industries are up for review.
CIRCULAR SPARE PART FLOWS WOULD REDUCE COSTS
The creation of an extraordinarily large fleet of standardised vessels operating on zero-
carbon fuel would bring additional business opportunities. Take the introduction of circular
spare part flows as an example. Circular spare part flows would not only reduce
maintenance costs (and the industry’s CO2 footprint) but would also work to sustain and
develop the barriers to entry. Only a large and standardised fleet could scale the benefits
of introducing crypto-anchors (i.e. digital fingerprints) that allow spare parts to be
identified, tracked and authenticated (including their service certificates and history).
SELLING UPTIME RATHER THAN PARTS
The concept of circular material flows is closely related to that of selling uptime rather
than parts (or fuel!). But we could take it even further. We know that the lifetime cost of
fuelling a vessel is a much larger expense than buying the vessel (not to mention the
onshore infrastructure investments to scale zero-carbon fuel production). We have
discussed the potential scenario of a scaled ownership model for vessels in order to
create a sufficiently large offtake channel for zero-carbon fuels, but we could turn the
question on its head by asking if we could structure a fuel supply that includes the offtake
channel (i.e. the vessels)?
BARRIERS TO ENTRY AND CUSTOMER LOYALTY
This line of thinking can be likened to coffee makers selling ‘coffee solutions’ (i.e.
throwing in a ‘free’ coffee machine with the beans) rather than engaging in fierce price
competition with fellow sellers of beans. By supplying the product including the machinery
needed to consume it, customer loyalty can be expected to increase, while the seller also
raises the barriers to entry for alternative suppliers. In this example, the coffee machine
is secondary to the coffee beans. However, customers are not really demanding beans or
the coffee machine – they are more likely to want a ‘one-click’ skilled barista offering latte
art to go. Selling that at scale is significantly more valuable than selling beans or coffee
machines.
LOW-COST INFRASTRUCTURE PLAY SUPPLYING ZERO-CARBON FUELS ON LONG-TERM CONTRACTS
Cargo owners will demand neither vessels nor fuel. They are more likely to prefer a zero-
carbon global supply chain from origin to destination at cost parity with the carbon
alternative. For many, this may sound implausible, but imagine if a combination of
massive sector integration and super-standardisation were to introduce cost savings to a
degree that made it possible. The impact on the competitive landscape of the shipping
industry could be extraordinary. Ships could become an attractive infrastructure
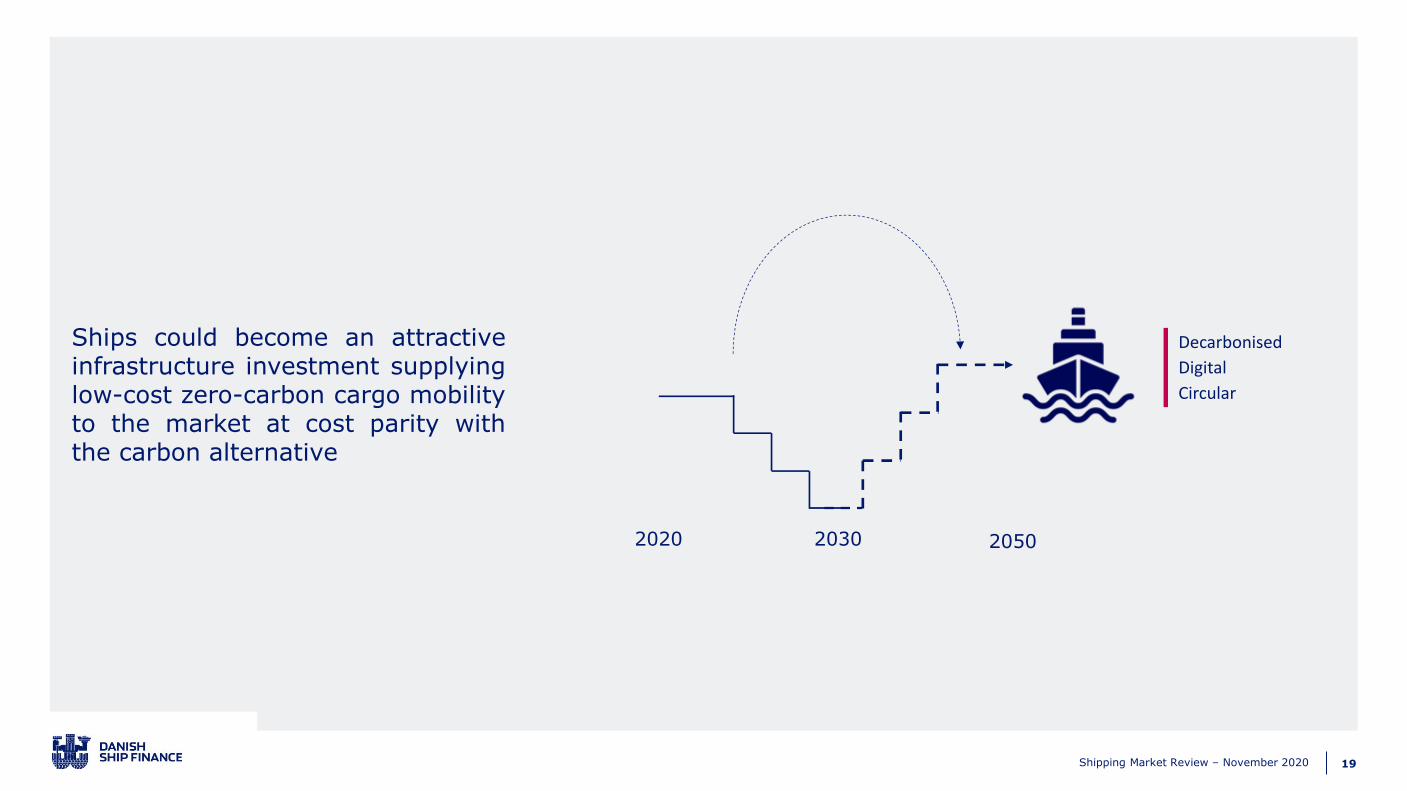
investment supplying low-cost zero-carbon cargo mobility to the market at cost parity
with the carbon alternative.
DO WE MARKET VESSEL CAPACITY OR ZERO-CARBON LOGISTICS? Scenario 2: The offtake channel is integrated into the fuel supply – sold as a price per kwh – offering green-shipping-as-a-service
The commoditised nature of cargo handling leaves little room for differentiation. The fragmented asset landscape means that there
are no tangible financial benefits for individual owners. Standardisation would lower costs, while a zero-carbon fuel supply at cost
parity with carbon alternatives may temporarily raise the barriers to entry. Integration into adjacent domains seems necessary for
additional value to be created.
18Shipping Market Review – November 2020
Presenting a path to zero-carbon shipping is the study of history before it happens. Just
as there are many perspectives on the past, there are many potential future scenarios
too, some of which are more likely than others. Some are utopian best-of-all-possible-
worlds scenarios, while others are so grim and dark that many would prefer not to think
about them at all. Exploring these possible future scenarios is the key to opening our
minds to alternative trajectories and helping us escape the rut of linear thinking.
NAVIGATING UNCHARTED TERRITORY
The more we raise the level of abstraction, the more potential future scenarios emerge.
In this report, we have presented a range of perspectives that aim to identify how ships
as an asset class can re-emerge as an attractive investment opportunity in a zero-carbon
future. Many traditional players will clearly continue to own vessels, but we expect their
access to attractive deals that can deliver a return on invested capital justifying fleet
renewal to be diminished over time.
OPERATIONAL CHALLENGES PREVAIL
In this study, we have not explicitly distinguished between short-sea and deep-sea
shipping, albeit our efforts are focused on the latter. Zero-carbon fuels have strong
potential to reduce carbon emissions, but one of their challenges is their lower energy
content and the comparatively lower amount of energy they can store in a ship’s tanks.
The lower energy, combined with a less developed distribution network, makes them
more suited to short-sea shipping and Liner operations in the short to medium term.
NEW REGULATION CAN DRIVE CHANGE
Climate change is an existential threat to the world. To overcome these challenges, the
shipping industry needs a new growth strategy that will transform business models by
turning climate and environmental challenges into business opportunities. New
international laws can level the playing field and supercharge the transition by turning a
political commitment into a legal obligation and thereby facilitate change.
REINVENTING VALUE CREATION IN THE SHIPPING INDUSTRY
We have chosen not to join the debate on new legislation, carbon taxes, government
subsidies and numbers but instead have focused our attention on the perspectives of
value drivers and business models. This is, to some extent, an invitation to discuss end-
game scenarios. It lets us imagine alternative trajectories that may enable us to identify
new opportunities – and new challenges. Whether or not the scenarios we have presented
actually materialise is less important. The key thing is that exploring them may allow us
to open our minds to alternative trajectories and help us escape the rut of linear thinking.
PERSPECTIVES AND KEY TAKEAWAYSGrowth requires new technology, new methodologies and new paths towards value creation
Traditionally, shipowners have been the cornerstone of the shipping industry. They have built the right vessels, at the right time, and
at the right price. They have enabled the global trade expansion throughout past decades. It was a model that worked well when
carriers’ emphasis was on expansion, but times and market dynamics are changing. The global call to reduce CO2 emissions is
raising costs while leaving revenues vulnerable to overcapacity. Today’s market trends highlight the urgent need for change.
19Shipping Market Review – November 2020
Ships could become an attractiveinfrastructure investment supplyinglow-cost zero-carbon cargo mobilityto the market at cost parity withthe carbon alternative
2020 2030 2050
Decarbonised
Digital
Circular
20Shipping Market Review – November 2020
SHIPPING MARKETS AT A GLANCE
21Shipping Market Review – November 2020
OU
TLO
OK
SU
MM
AR
Y
POSITIVE
NEUTRAL
NEGATIVE
SHIPPING MARKETS AT A GLANCEPerspectives and key takeaways
The short- to medium-term outlook for the shipping market appears brighter than six
months ago. The orderbook is at a historically low level and is shrinking rapidly. Today,
the orderbook is equivalent to 7% of the fleet. The vast majority of the orderbook
(74%) is scheduled to be delivered by year-end 2021.
The first wave of the pandemic primarily affected consumer demand, personal
transportation and service sector jobs. While large parts of the global economy have
staged a better recovery than initially anticipated, global seaborne demand has been
severely impacted by the economic repercussions of the Covid-19 pandemic. Seaborne
transport volumes are expected to decline by 4-5% in 2020 compared to 2019 volumes,
while most forecasts predict that the lost volumes will be restored sometime during the
next 12-18 months.
The effects of the second wave of the pandemic are difficult to predict. They involve the
next round of coronavirus outbreaks, labour market dynamics, changes in global
spending and investment behaviour, and government stimuli in one form or another.
Still, it goes without saying that for the shipping industry it is vital for seaborne trade
volumes to increase in times of expanding fleets.
The global economy's call to decarbonise is exacerbating existing vulnerabilities across
sectors and industries. The shipping industry is no exception. However, the lower oil price
is raising the barriers to entry for zero-carbon fuels, and this will continue until the point
where new international laws, or a global carbon tax, can level the playing field and
supercharge the transition by turning political commitments into legal obligations and
thereby facilitate change.
In the meantime, few new vessels are likely to be ordered. Existing vessels, if they can
survive a period of surplus capacity, could be positioned for medium-term value
appreciation, driven by longer economic lifetimes. If demand manages to continue
growing, many vessel segments may enter a period of higher freight rates and further
appreciation in existing vessels’ secondhand prices. In segments where demand fails to
recoup the lost territory, we see increased risk of unexpected value depreciation.
The transition towards zero-carbon shipping is eventually expected to lead to a massive
shift in the asset base. The length of the transition period is uncertain. Existing owners
are hoping that zero-carbon vessels can be introduced as part of natural fleet renewal,
but the remaining lifetimes of the vessels in the current fleet do not need to be
determined by their age. If a zero-carbon fleet that offers more value for the same freight
rate can be brought to the market, there could be little to stop it from cannibalising the
current fleet. The current fleet could become obsolete – even after a period of increased
secondhand prices.
The risk of stranded assets is on the rise, particularly in segments where peak demand
could be approaching sooner than previously anticipated. The outlook is highly uncertain
for vessels transporting fossil fuels and for Offshore Supply Vessels. Still, peak fossil fuel
demand could be years ahead of us.
The market outlook across vessel segments has improved
during the past six months, as the effects of the first wave
of the Covid-19 pandemic seem to have lowered seaborne
trade volumes less than initially feared.
Most vessel segments are benefiting from a low oil price and
more manageable fleet expansion, which is easing some of
the pressure on freight rates. Still, demand volumes need to
recover or more vessels need to be scrapped before freight
rates can begin to increase.
22Shipping Market Review – November 2020
SHIPPING MARKETS AT A GLANCE
THE CLARKSEA INDEX IS EXHIBITING EXTRAORDINARY VOLATILITY
Sources: Clarksons
Freight rates are higher despite weakened fundamentals. Earnings expectations are waning and prices remain low.
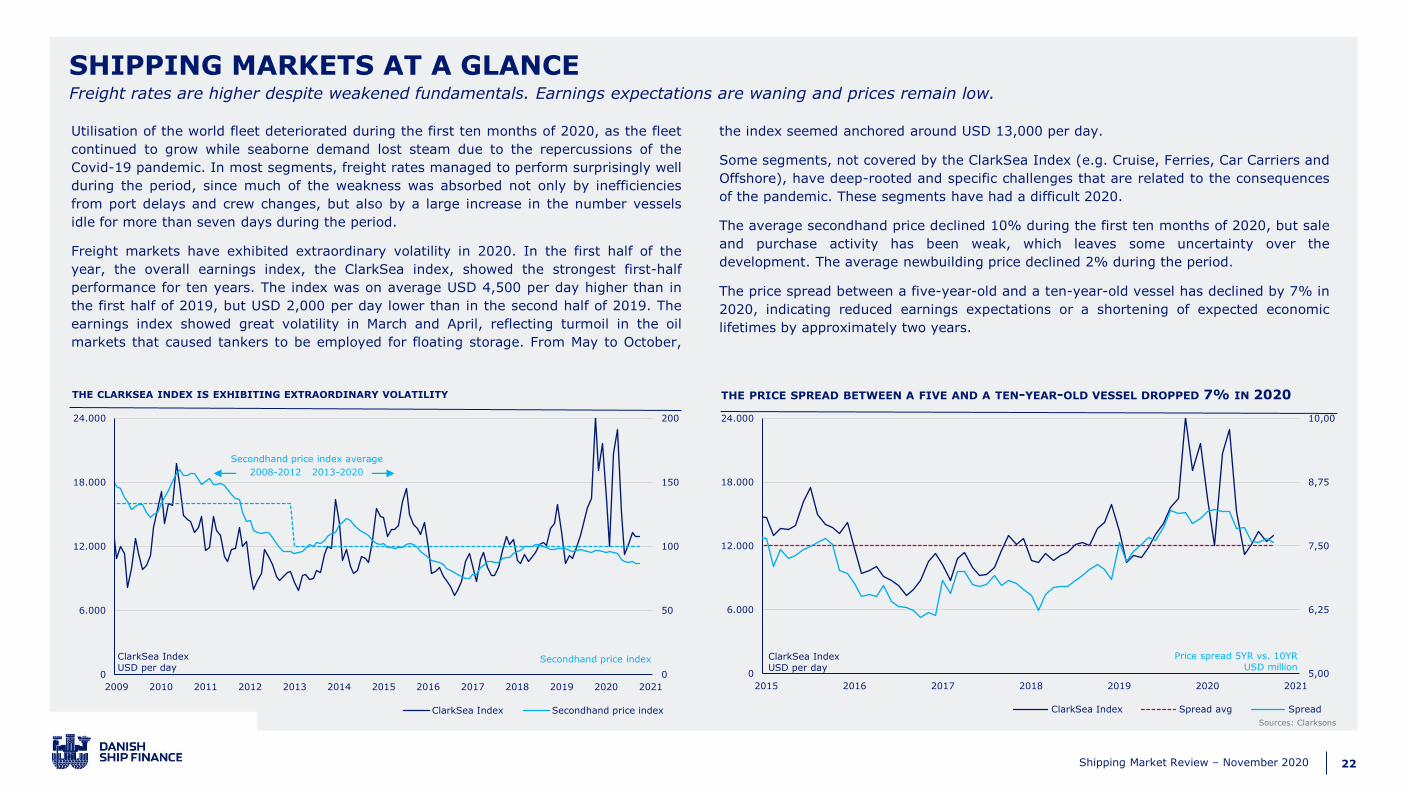
Utilisation of the world fleet deteriorated during the first ten months of 2020, as the fleet
continued to grow while seaborne demand lost steam due to the repercussions of the
Covid-19 pandemic. In most segments, freight rates managed to perform surprisingly well
during the period, since much of the weakness was absorbed not only by inefficiencies
from port delays and crew changes, but also by a large increase in the number vessels
idle for more than seven days during the period.
Freight markets have exhibited extraordinary volatility in 2020. In the first half of the
year, the overall earnings index, the ClarkSea index, showed the strongest first-half
performance for ten years. The index was on average USD 4,500 per day higher than in
the first half of 2019, but USD 2,000 per day lower than in the second half of 2019. The
earnings index showed great volatility in March and April, reflecting turmoil in the oil
markets that caused tankers to be employed for floating storage. From May to October,
the index seemed anchored around USD 13,000 per day.
Some segments, not covered by the ClarkSea Index (e.g. Cruise, Ferries, Car Carriers and
Offshore), have deep-rooted and specific challenges that are related to the consequences
of the pandemic. These segments have had a difficult 2020.
The average secondhand price declined 10% during the first ten months of 2020, but sale
and purchase activity has been weak, which leaves some uncertainty over the
development. The average newbuilding price declined 2% during the period.
The price spread between a five-year-old and a ten-year-old vessel has declined by 7% in
2020, indicating reduced earnings expectations or a shortening of expected economic
lifetimes by approximately two years.
THE PRICE SPREAD BETWEEN A FIVE AND A TEN-YEAR-OLD VESSEL DROPPED 7% IN 2020
5,00
6,25
7,50
8,75
10,00
0
6.000
12.000
18.000
24.000
2015 2016 2017 2018 2019 2020 2021
ClarkSea Index Spread avg Spread
Price spread 5YR vs. 10YRUSD million
ClarkSea Index USD per day
0
50
100
150
200
0
6.000
12.000
18.000
24.000
2009 2010 2011 2012 2013 2014 2015 2016 2017 2018 2019 2020 2021
ClarkSea Index Secondhand price index
ClarkSea Index USD per day
Secondhand price index
Secondhand price index average
2008-2012 2013-2020
23Shipping Market Review – November 2020
Bulk CarrierCrude Tanker
Container
Liner
Product
Tanker
LNG
LPG
Container Feeder0
2
3
5
6
0% 5% 10% 15% 20% 25% 30%
Fleet renewalOrderbook / Fleet (20 yr+) dwt
Orderbook / Fleet
WORLD FLEET DEVELOPMENT
Sources: Clarksons, Danish Ship Finance
AGE DISTRIBUTION OF FLEET (MILLION DWT) DELIVERIES AND DEMOLITIONS (MILLION DWT) FLEET RENEWAL POTENTIAL (DWT)
Supply-side development
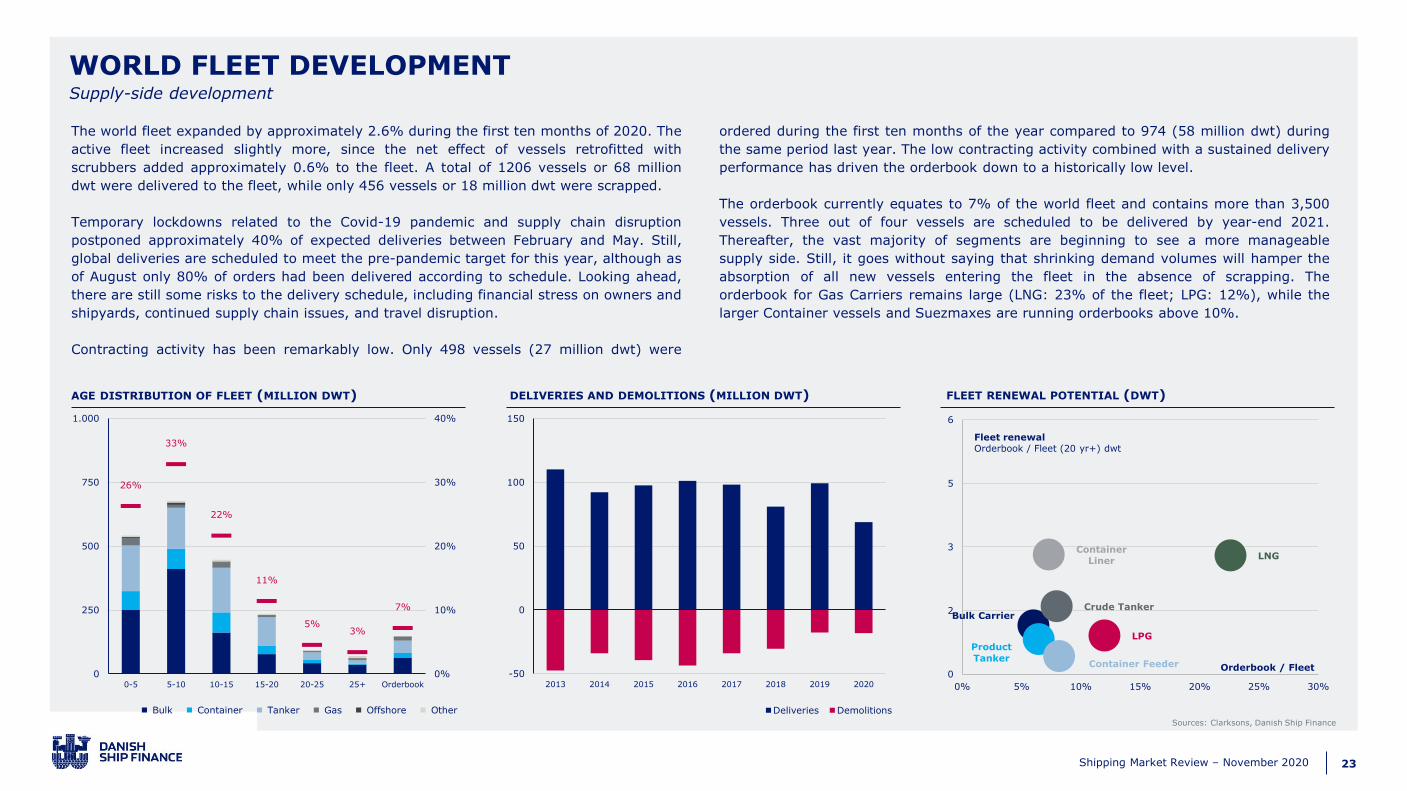
The world fleet expanded by approximately 2.6% during the first ten months of 2020. The
active fleet increased slightly more, since the net effect of vessels retrofitted with
scrubbers added approximately 0.6% to the fleet. A total of 1206 vessels or 68 million
dwt were delivered to the fleet, while only 456 vessels or 18 million dwt were scrapped.
Temporary lockdowns related to the Covid-19 pandemic and supply chain disruption
postponed approximately 40% of expected deliveries between February and May. Still,
global deliveries are scheduled to meet the pre-pandemic target for this year, although as
of August only 80% of orders had been delivered according to schedule. Looking ahead,
there are still some risks to the delivery schedule, including financial stress on owners and
shipyards, continued supply chain issues, and travel disruption.
Contracting activity has been remarkably low. Only 498 vessels (27 million dwt) were
ordered during the first ten months of the year compared to 974 (58 million dwt) during
the same period last year. The low contracting activity combined with a sustained delivery
performance has driven the orderbook down to a historically low level.
The orderbook currently equates to 7% of the world fleet and contains more than 3,500
vessels. Three out of four vessels are scheduled to be delivered by year-end 2021.
Thereafter, the vast majority of segments are beginning to see a more manageable
supply side. Still, it goes without saying that shrinking demand volumes will hamper the
absorption of all new vessels entering the fleet in the absence of scrapping. The
orderbook for Gas Carriers remains large (LNG: 23% of the fleet; LPG: 12%), while the
larger Container vessels and Suezmaxes are running orderbooks above 10%.
26%
33%
22%
11%
5%3%
7%
0%
10%
20%
30%
40%
0
250
500
750
1.000
0-5 5-10 10-15 15-20 20-25 25+ Orderbook
Bulk Container Tanker Gas Offshore Other
-50
0
50
100
150
2013 2014 2015 2016 2017 2018 2019 2020
Deliveries Demolitions
24Shipping Market Review – November 2020
The low overall orderbook clearly brightens the outlook across segments and paves the
way for freight rate improvements when demand recovers from the current slump and
additional demand improves fleet utilisation across segments. This is the first time for
decades that the supply side has become so muted: sale and purchase activity is low, few
vessels are being ordered and few vessels are being scrapped.
THE OUTLOOK IS SHROUDED IN UNCERTAINTY
Still, the pathway to zero-carbon shipping remains unclear. Many shipowners are hesitant
to order new vessels until the situation becomes clearer and the risk of stranded assets
becomes more tangible. Adding to this is the energy transition, which impacts the long-
term demand outlook for not only Crude, Product Tankers and Offshore Supply Vessels,
but also Gas Carriers (LPG and LNG) and vessels transporting coal. We estimate that
approximately 40% of the world fleet currently serves energy production or
transportation to some extent.
THE TIMING OF PEAK SEABORNE TRADE VOLUMES IS UP FOR REVIEW IN MANY SEGMENTS
The economic recession unfolding in the wake of the global Covid-19 pandemic has
lowered seaborne trade volumes significantly in 2020. Public stimulus programmes are
being launched to rebalance national economies, but it seems clear that the energy
transition is being prioritised to speed up the decarbonisation of the global economy.
Such a shift is structurally negative for seaborne trade. The timing of peak seaborne trade
volumes is up for review in many segments. This is especially the case for vessels that
transport fossil fuels (i.e. Crude and Product Tankers, LNG and Capesize vessels (coal)),
but other segments (for other reasons) – Offshore Supply Vessels, large Container
vessels and Car Carriers – are also considering whether peak seaborne demand is
approaching. Peak demand is probably years away in most segments, but the potential
life expectancy of existing vessels is becoming increasingly important amid the build-up
of this risk.
HIGHER LONG-TERM EARNINGS EXPECTATIONS
For vessels that are not set to be scrapped in the short to medium term, the price outlook
appears bright. We expect their life expectancy to lengthen, as long as few new vessels
are delivered and demand grows. If this situation persists into 2021 and beyond, many
vessel segments may enter a period of higher freight rates and appreciating secondhand
prices. If the situation proves long-lasting, existing vessels may begin to see their
economic lifetimes approach their technical lifetimes and, in some segments, even exceed
them.
LOW DEMAND FOR NEW VESSELS IN THE SHORT TO MEDIUM TERM
Many shipyards are struggling, as surplus yard capacity and low ordering of new vessels
are quickly depleting orderbooks. Still, ordering of new vessels is likely to stay low until a
clear pathway towards zero-carbon shipping emerges at scale. There will, of course, be
new vessels ordered. However, we see significant risk attached to investments in vessels
that have not been built for zero-carbon trading. True, dual-fuelled engines could mitigate
the risk, but these vessels may turn out to be more expensive to operate and maintain
than later-generation vessels.
TO RETROFIT EXISTING VESSELS OR TO ORDER NEW?
The decision to order a new vessel in this environment is largely a question of balancing
the downside risk associated with new vessels compared with the upside potential from
retrofitting and extending the lives of existing vessels. The decision is especially difficult
in segments facing the risk of peak seaborne trade volumes, which may soon begin to
impact the valuations not only of new vessels but also younger vessels on the water
today.
UPSIDE POTENTIAL FOR EXISTING VESSELSLife expectancy, fleet renewal and the outlook for secondhand vessels
25Shipping Market Review – November 2020
It is in periods of extraordinarily low demand and surplus capacity that tail risk emerges.
It is under these circumstances that vessel prices occasionally but unexpectedly collapse,
resulting in very little price difference between young and old vessels. This trend is
currently visible in the Offshore market but has in previous decades materialised in other
segments. Many segments need to see demand recovers or prices to decline before
buyers’ confidence will re-establish a market where prices are settled between willing
buyers and willing sellers.
TAIL RISK COULD EMERGE IF FEW OWNERS PRESENT THEMSELVES IN OVERSUPPLIED MARKETS
Transaction volumes have been declining across the board for the past few years and are
currently low. Normal price dynamics could suddenly be replaced by tail risk if an
unusually small number of buyers present themselves in oversupplied markets. This is
particularly relevant in segments where fewer owners dominate the asset-owning space.
The ten largest players own approximately 50% of the fleets in the Container Liner, LNG
and Car Carrier segments. The ten largest players own approximately 25% of the fleets in
the Crude Tanker, Product Tanker and Chemical Tanker segments.
RISK IS BUILDING UP IN THE SHADOWS OF ILLIQUIDITY IN SOME SEGMENTS
Secondhand prices depreciated by 10% on average during the first ten months of 2020.
Average fleet utilisation dropped by 7-8%. Demand is down by approximately 4-5% and
more vessels are about to be delivered. While this may not appear to signal extraordinary
risk building up in the short term, the price development in some segments should be
seen in the context of a very illiquid market and not misinterpreted as showing stability.
There is significant risk associated with the demand outlook in many segments, and the
long-term earnings potential is being reviewed across many segments. Unexpected and
extraordinary price depreciations could materialise in some segments in the medium
term.
POCKETS OF EXTRAORDINARY RISKSNot all vessel segments are positioned for asset price appreciation
26Shipping Market Review – November 2020
LARGEST COMPANIES BY MARKET VALUE (USD BILLION)
CONTRACTING, 2003-2009 (USD BILLION)
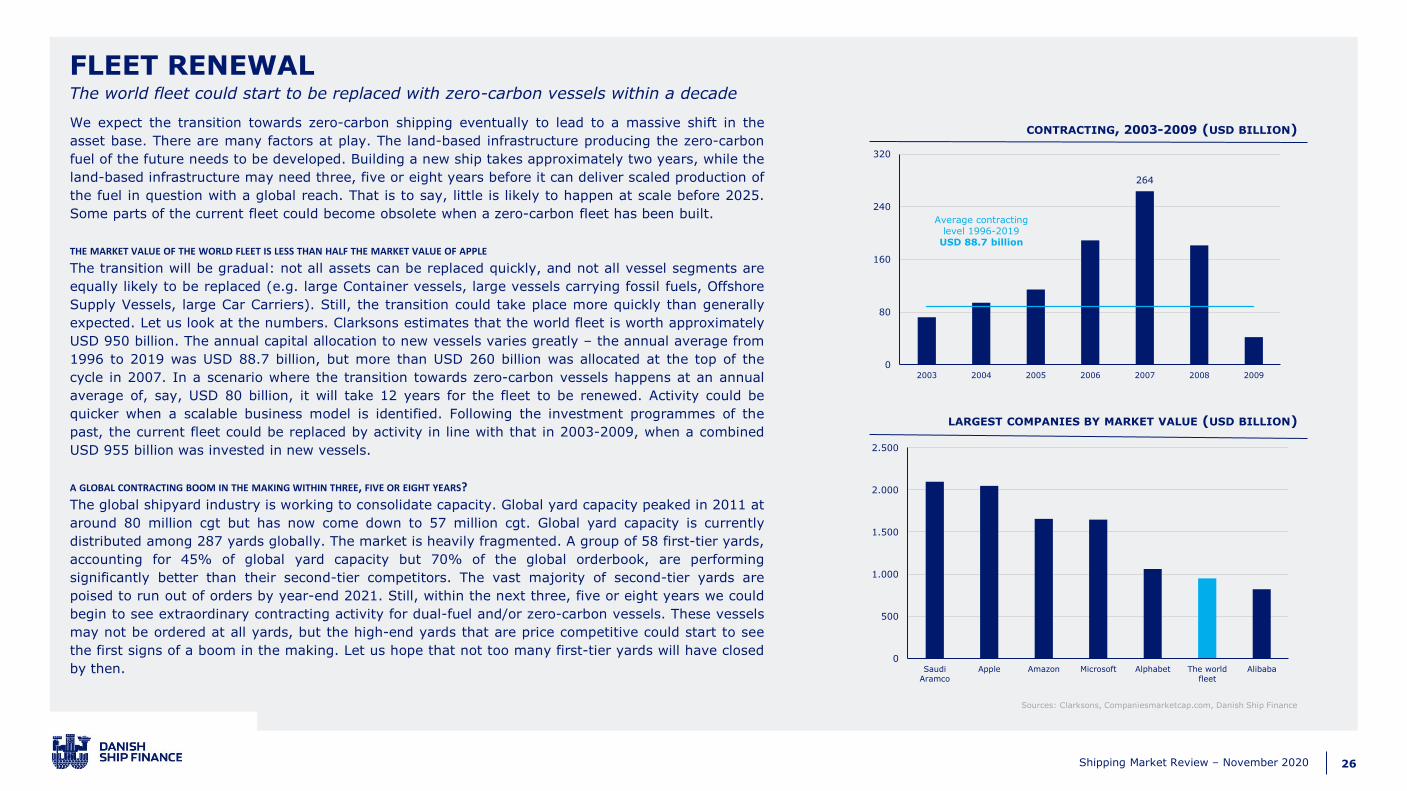
FLEET RENEWALThe world fleet could start to be replaced with zero-carbon vessels within a decade
We expect the transition towards zero-carbon shipping eventually to lead to a massive shift in the
asset base. There are many factors at play. The land-based infrastructure producing the zero-carbon
fuel of the future needs to be developed. Building a new ship takes approximately two years, while the
land-based infrastructure may need three, five or eight years before it can deliver scaled production of
the fuel in question with a global reach. That is to say, little is likely to happen at scale before 2025.
Some parts of the current fleet could become obsolete when a zero-carbon fleet has been built.
THE MARKET VALUE OF THE WORLD FLEET IS LESS THAN HALF THE MARKET VALUE OF APPLE
The transition will be gradual: not all assets can be replaced quickly, and not all vessel segments are
equally likely to be replaced (e.g. large Container vessels, large vessels carrying fossil fuels, Offshore
Supply Vessels, large Car Carriers). Still, the transition could take place more quickly than generally
expected. Let us look at the numbers. Clarksons estimates that the world fleet is worth approximately
USD 950 billion. The annual capital allocation to new vessels varies greatly – the annual average from
1996 to 2019 was USD 88.7 billion, but more than USD 260 billion was allocated at the top of the
cycle in 2007. In a scenario where the transition towards zero-carbon vessels happens at an annual
average of, say, USD 80 billion, it will take 12 years for the fleet to be renewed. Activity could be
quicker when a scalable business model is identified. Following the investment programmes of the
past, the current fleet could be replaced by activity in line with that in 2003-2009, when a combined
USD 955 billion was invested in new vessels.
A GLOBAL CONTRACTING BOOM IN THE MAKING WITHIN THREE, FIVE OR EIGHT YEARS?
The global shipyard industry is working to consolidate capacity. Global yard capacity peaked in 2011 at
around 80 million cgt but has now come down to 57 million cgt. Global yard capacity is currently
distributed among 287 yards globally. The market is heavily fragmented. A group of 58 first-tier yards,
accounting for 45% of global yard capacity but 70% of the global orderbook, are performing
significantly better than their second-tier competitors. The vast majority of second-tier yards are
poised to run out of orders by year-end 2021. Still, within the next three, five or eight years we could
begin to see extraordinary contracting activity for dual-fuel and/or zero-carbon vessels. These vessels
may not be ordered at all yards, but the high-end yards that are price competitive could start to see
the first signs of a boom in the making. Let us hope that not too many first-tier yards will have closed
by then.
264
0
80
160
240
320
2003 2004 2005 2006 2007 2008 2009
Average contractinglevel 1996-2019
USD 88.7 billion
0
500
1.000
1.500
2.000
2.500
Saudi
Aramco
Apple Amazon Microsoft Alphabet The world
fleet
Alibaba
Sources: Clarksons, Companiesmarketcap.com, Danish Ship Finance

27Shipping Market Review – November 2020
SHIPBUILDING
28Shipping Market Review – November 2020
OU
TLO
OK
SU
MM
AR
Y
POSITIVE
NEUTRAL
NEGATIVE
The consolidation process has been ongoing for a decade, but the shipbuilding market
continues to be burdened by excess capacity. Prior to the Covid-19 pandemic, capacity
utilisation was slowly improving due to consolidation among yard groups. This attracted
the attention of competition authorities around the world, as they saw potential capacity
constraints in certain vessel segments. In the meantime, the pandemic has resulted in
overall excess capacity expanding again, as a global recession has been added to the
existing risks associated with ordering a newbuild: geopolitical tensions, environmental
regulations, fuel type considerations and new standards for digital ships.
We expect Covid-19 to accelerate consolidation among small yards and thereby increase
the market shares of not only state-owned entities but also shipyards with strong
balance sheets or strong group owners.
We have identified a group of 58 yards, covering 45% of global yard capacity and 70%
of the orderbook, that attract more orders and retain superior capacity utilisation
compared to their peers. Of these, 33 are Chinese, five South Korean, five Japanese, 11
European and four from the rest of the world. We label them first-tier yards and the
remaining 229 yards second-tier.
THE SHIPBUILDING MARKETPerspectives and key takeaways
The ten-year-long consolidation process has been
accelerated by Covid-19, as the scarcity of orders amid the
pandemic has put yards under additional pressure. There
are 58 first-tier yards that have established themselves as
industry leaders, but government support and balance sheet
size will determine whether or not they survive. We expect
contracting activity to remain low until consensus regarding
fuel mix emerges. Yards will need to upgrade their
production and the global supply chain in order to build
smarter and greener vessels.
Most second-tier yards seem unlikely to attract enough new orders to survive. Even
some of the best-performing first-tier yards will likely continue to struggle to utilise
capacity in the coming years, as we expect few new orders to be placed. The best-
performing yards could begin to incorporate further automation into their production lines
to lower unit costs when fewer competitors remain in operation.
The governments in China and South Korea continue to impact the market. They have
declared shipbuilding a strategically important industry and selected yards are likely to
receive government support in one form or another.
The Japanese yards are generally operating without government support. The Japanese
yard industry has largely not consolidated during the past decade. Most players remain
independent, but recently we have seen increased yard collaboration through bilateral
joint ventures. Individual first-tier yards are generally smaller than their Chinese or South
Korean competitors. Their access to foreign orders appears to be becoming increasingly
difficult. The Japanese government has initiated funding programmes to attract foreign
orders, but further government intervention and increased yard collaboration seem
necessary to maintain domestic yard capacity. At present, it seems almost inevitable that
the Japanese second-tier yards will diminish in the years to come, whereas many first-tier
yards are expected to continue operating.
29Shipping Market Review – November 2020
0
75
150
225
300
2000 2001 2002 2003 2004 2005 2006 2007 2008 2009 2010 2011 2012 2013 2014 2015 2016 2017 2018 2019 2020 2021
Newbuilding price index Dry Bulk Container Gas Carrier Oil Tanker
THE SHIPBUILDING MARKET
Source: Clarksons, Danish Ship Finance
The shipbuilding market
The global shipyard industry has been consolidating for the past ten years. Today, 287
yards remain active with an estimated capacity of 56.7 million cgt, but the capacity is
unevenly distributed. The first-tier yards dominate the overall yard industry, while some
second-tier yards are clinging on thanks to government and group owner support. The
remaining are struggling.
The weaker yards among the first-tier group are challenged. In our May report, we
identified 64 first-tier yards – this has now come down to 58. In Japan, ten yards were
considered first-tier six months ago. While they are delivering vessels on order, only five
of them have managed to attract new orders. Government initiatives have been launched
to attract foreign orders, but few deals have been closed. A similar situation is playing out
among some of the smaller Chinese first-tier yards. The first-tier yards in Europe and
South Korea have proved more resilient so far, but their orderbooks are not immune.
The global yard industry seems to be concentrated around ten yard groups which in
combination control 70% of the global orderbook. Regulators are increasingly concerned
about the level of market competition – and for good reason. The second-tier yards
appear to be in a very difficult situation of excess yard capacity. Among this group, 37
yards have already delivered their last order this year, while only six have unexpectedly
reappeared in the orderbook. The average second-tier yard is due to deliver its last order
within the next ten months. We expect more yards to close, and market consolidation to
continue to be focused on the ten yard groups in general and the first-tier yards in
particular.
Low contracting and persistent excess capacity caused newbuilding prices to fall by 2.90%
across all segments in the first seven months of 2020, mainly driven by Oil Tankers and
Containerships. Although nowhere near as severe as the decline following the financial
crisis, the development represents another challenge for the shipyards’ earnings.
DEVELOPMENT IN NEWBUILDING PRICE INDEX
33
5
5 11 4
81 5
48
33 62
0
6
12
18
24
China South Korea Japan Europe Rest of the world
Second-tier First-tier
Active yards
ACTIVE YARD CAPACITY (MILLION CGT)
30Shipping Market Review – November 2020
0
7
14
21
28
Expected deliveries Postponed Delivered
China South Korea Japan Europe Rest of the world
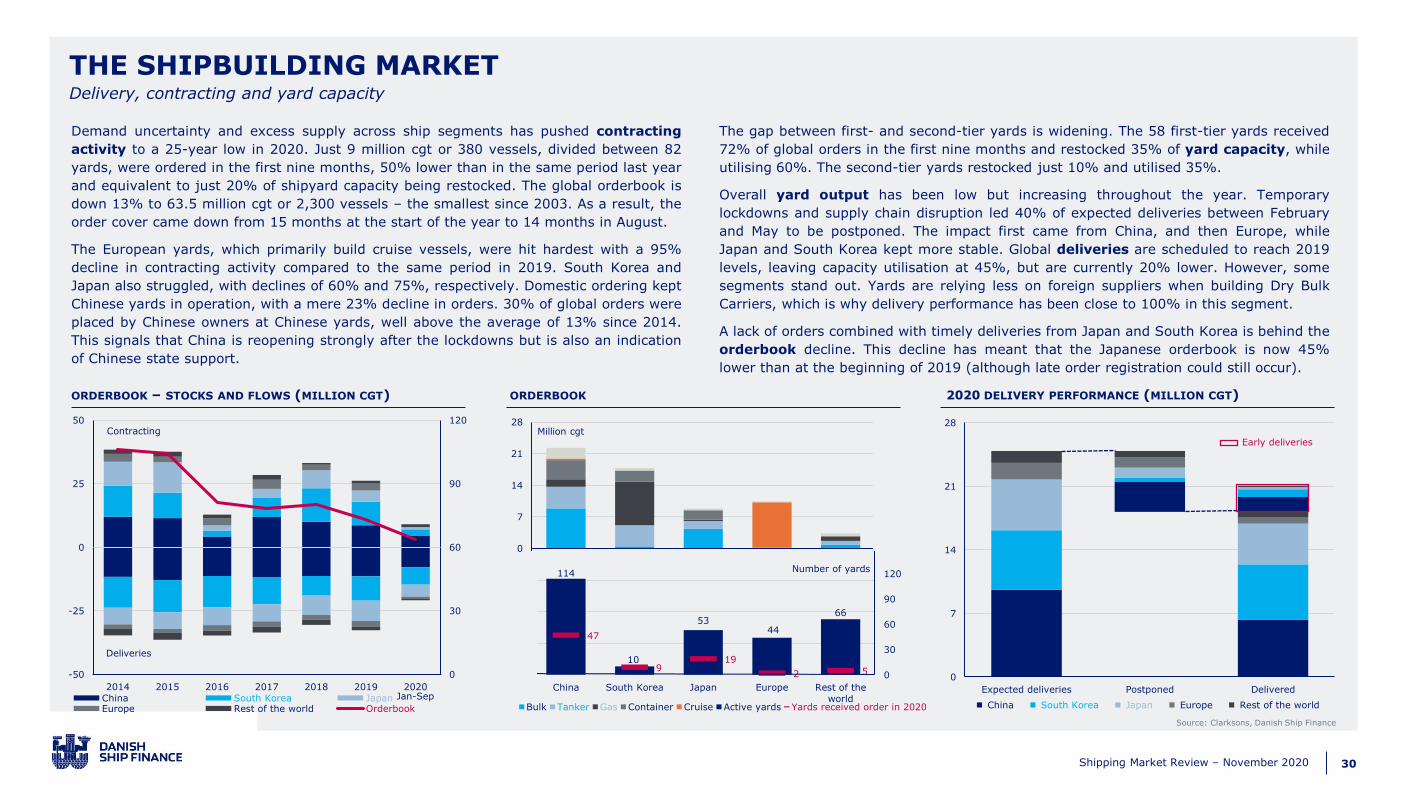
Demand uncertainty and excess supply across ship segments has pushed contracting
activity to a 25-year low in 2020. Just 9 million cgt or 380 vessels, divided between 82
yards, were ordered in the first nine months, 50% lower than in the same period last year
and equivalent to just 20% of shipyard capacity being restocked. The global orderbook is
down 13% to 63.5 million cgt or 2,300 vessels – the smallest since 2003. As a result, the
order cover came down from 15 months at the start of the year to 14 months in August.
The European yards, which primarily build cruise vessels, were hit hardest with a 95%
decline in contracting activity compared to the same period in 2019. South Korea and
Japan also struggled, with declines of 60% and 75%, respectively. Domestic ordering kept
Chinese yards in operation, with a mere 23% decline in orders. 30% of global orders were
placed by Chinese owners at Chinese yards, well above the average of 13% since 2014.
This signals that China is reopening strongly after the lockdowns but is also an indication
of Chinese state support.
The gap between first- and second-tier yards is widening. The 58 first-tier yards received
72% of global orders in the first nine months and restocked 35% of yard capacity, while
utilising 60%. The second-tier yards restocked just 10% and utilised 35%.
Overall yard output has been low but increasing throughout the year. Temporary
lockdowns and supply chain disruption led 40% of expected deliveries between February
and May to be postponed. The impact first came from China, and then Europe, while
Japan and South Korea kept more stable. Global deliveries are scheduled to reach 2019
levels, leaving capacity utilisation at 45%, but are currently 20% lower. However, some
segments stand out. Yards are relying less on foreign suppliers when building Dry Bulk
Carriers, which is why delivery performance has been close to 100% in this segment.
A lack of orders combined with timely deliveries from Japan and South Korea is behind the
orderbook decline. This decline has meant that the Japanese orderbook is now 45%
lower than at the beginning of 2019 (although late order registration could still occur).
THE SHIPBUILDING MARKET
ORDERBOOK – STOCKS AND FLOWS (MILLION CGT) ORDERBOOK 2020 DELIVERY PERFORMANCE (MILLION CGT)
Delivery, contracting and yard capacity
0
30
60
90
120
-50
-25
0
25
50
2014 2015 2016 2017 2018 2019 2020China South Korea JapanEurope Rest of the world Orderbook
Contracting
Deliveries
Jan-Sep
114
10
5344
66
47
919
2 5 0
30
60
90
120
150
180
210
240
270
300
-28
-21
-14
-7
0
7
14
21
28
China South Korea Japan Europe Rest of the
worldBulk Tanker Gas Container Cruise Active yards Yards received order in 2020
Million cgt
Number of yards
Early deliveries
Source: Clarksons, Danish Ship Finance
31Shipping Market Review – November 2020
90 42 10 8 51 19 43 17 34 6
0
6
12
18
24
2020 2021 2020 2021 2020 2021 2020 2021 2020 2021
First-tier yard capacity Second-tier yard capacity Vacant capacity (End of year)
China South Korea Japan Europe Rest of the world
Yards with active orderbook (End of year)
537 528510
465
420
364
318
287
0
150
300
450
600
0
20
40
60
80
2013 2014 2015 2016 2017 2018 2019 2020 2021 2022
First-tier yard capacity Second-tier yard capacity Deliveries Orderbook Active yards
THE SHIPBUILDING MARKET
Source: Clarksons , Danish Ship Finance
Market outlook
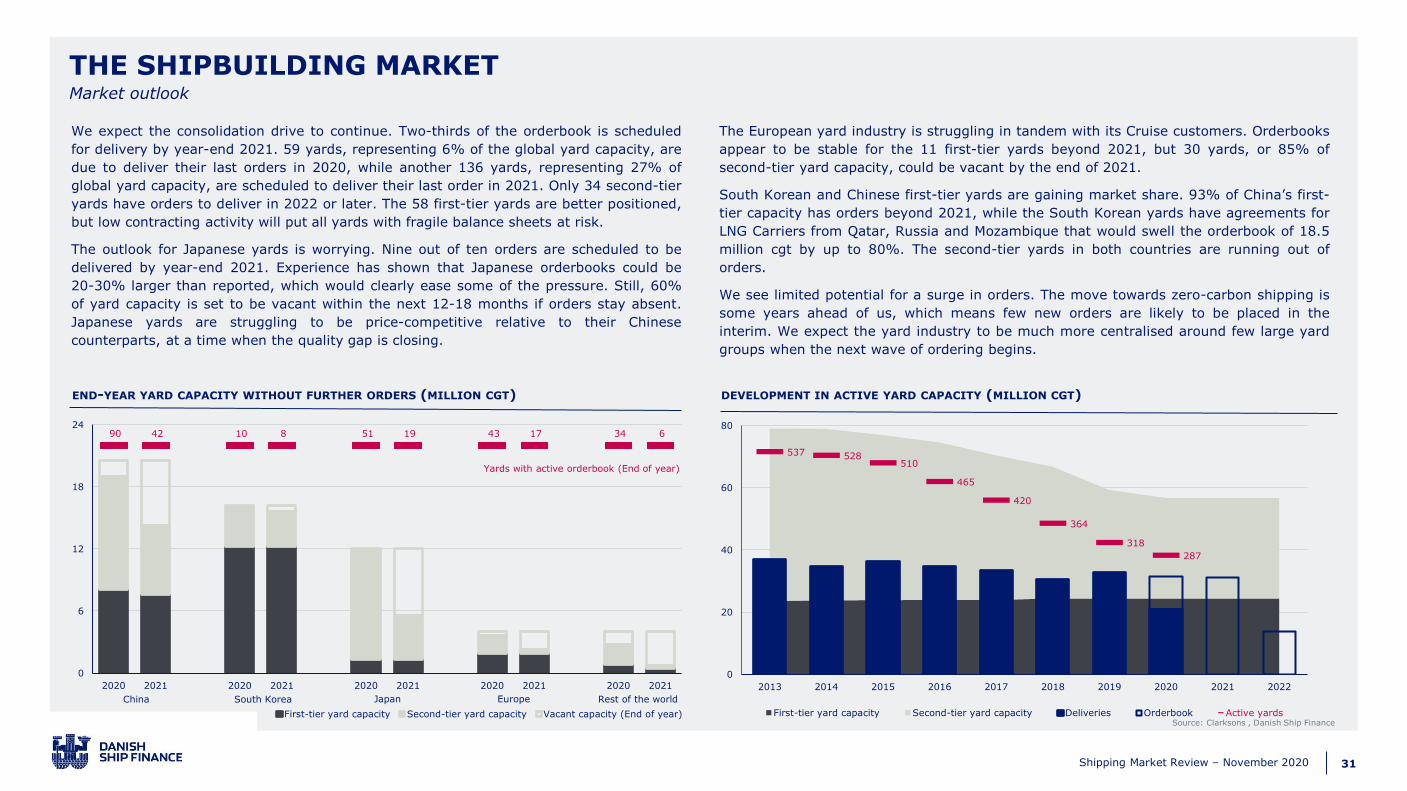
We expect the consolidation drive to continue. Two-thirds of the orderbook is scheduled
for delivery by year-end 2021. 59 yards, representing 6% of the global yard capacity, are
due to deliver their last orders in 2020, while another 136 yards, representing 27% of
global yard capacity, are scheduled to deliver their last order in 2021. Only 34 second-tier
yards have orders to deliver in 2022 or later. The 58 first-tier yards are better positioned,
but low contracting activity will put all yards with fragile balance sheets at risk.
The outlook for Japanese yards is worrying. Nine out of ten orders are scheduled to be
delivered by year-end 2021. Experience has shown that Japanese orderbooks could be
20-30% larger than reported, which would clearly ease some of the pressure. Still, 60%
of yard capacity is set to be vacant within the next 12-18 months if orders stay absent.
Japanese yards are struggling to be price-competitive relative to their Chinese
counterparts, at a time when the quality gap is closing.
The European yard industry is struggling in tandem with its Cruise customers. Orderbooks
appear to be stable for the 11 first-tier yards beyond 2021, but 30 yards, or 85% of
second-tier yard capacity, could be vacant by the end of 2021.
South Korean and Chinese first-tier yards are gaining market share. 93% of China’s first-
tier capacity has orders beyond 2021, while the South Korean yards have agreements for
LNG Carriers from Qatar, Russia and Mozambique that would swell the orderbook of 18.5
million cgt by up to 80%. The second-tier yards in both countries are running out of
orders.
We see limited potential for a surge in orders. The move towards zero-carbon shipping is
some years ahead of us, which means few new orders are likely to be placed in the
interim. We expect the yard industry to be much more centralised around few large yard
groups when the next wave of ordering begins.
DEVELOPMENT IN ACTIVE YARD CAPACITY (MILLION CGT)END-YEAR YARD CAPACITY WITHOUT FURTHER ORDERS (MILLION CGT)
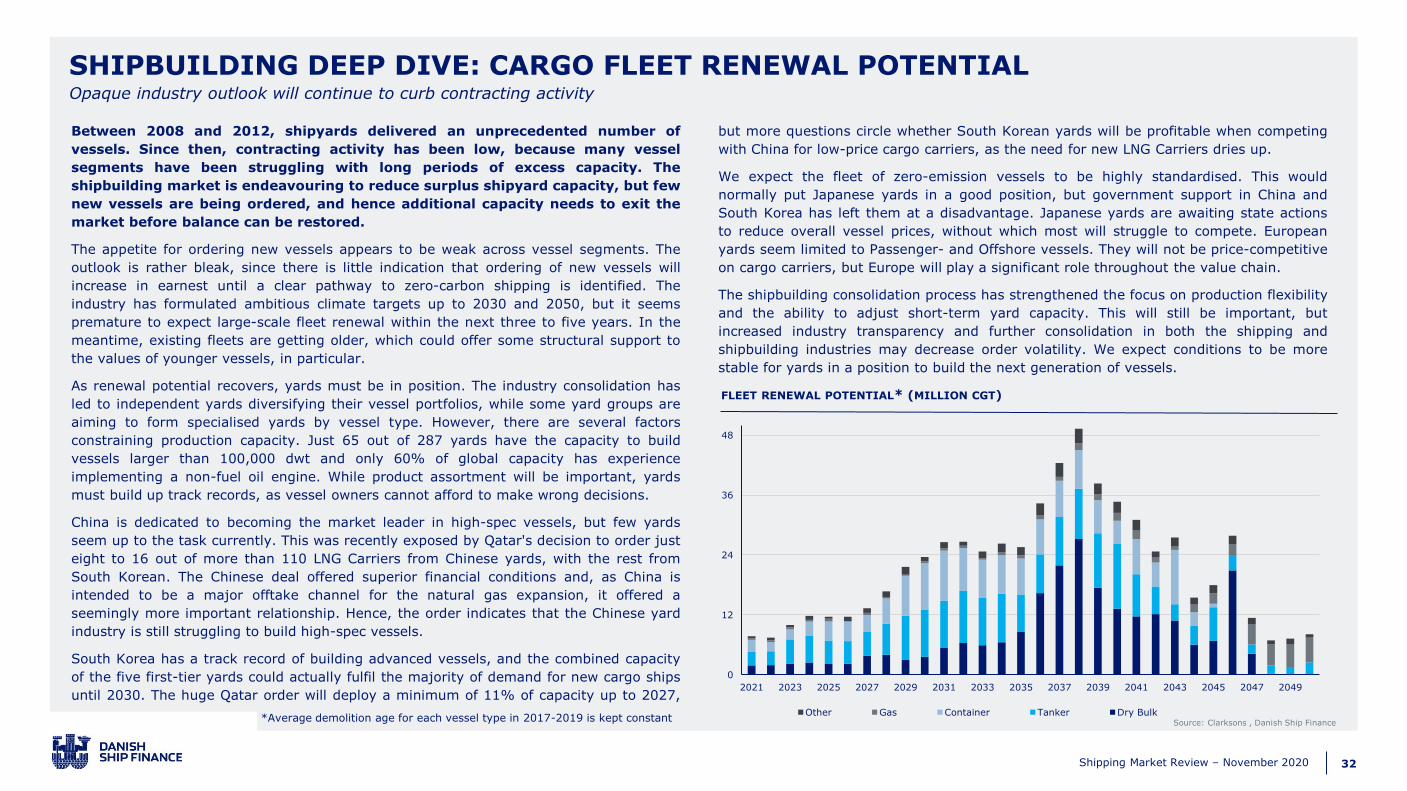
32Shipping Market Review – November 2020
0
12
24
36
48
2021 2023 2025 2027 2029 2031 2033 2035 2037 2039 2041 2043 2045 2047 2049
Other Gas Container Tanker Dry Bulk
Between 2008 and 2012, shipyards delivered an unprecedented number of
vessels. Since then, contracting activity has been low, because many vessel
segments have been struggling with long periods of excess capacity. The
shipbuilding market is endeavouring to reduce surplus shipyard capacity, but few
new vessels are being ordered, and hence additional capacity needs to exit the
market before balance can be restored.
The appetite for ordering new vessels appears to be weak across vessel segments. The
outlook is rather bleak, since there is little indication that ordering of new vessels will
increase in earnest until a clear pathway to zero-carbon shipping is identified. The
industry has formulated ambitious climate targets up to 2030 and 2050, but it seems
premature to expect large-scale fleet renewal within the next three to five years. In the
meantime, existing fleets are getting older, which could offer some structural support to
the values of younger vessels, in particular.
As renewal potential recovers, yards must be in position. The industry consolidation has
led to independent yards diversifying their vessel portfolios, while some yard groups are
aiming to form specialised yards by vessel type. However, there are several factors
constraining production capacity. Just 65 out of 287 yards have the capacity to build
vessels larger than 100,000 dwt and only 60% of global capacity has experience
implementing a non-fuel oil engine. While product assortment will be important, yards
must build up track records, as vessel owners cannot afford to make wrong decisions.
China is dedicated to becoming the market leader in high-spec vessels, but few yards
seem up to the task currently. This was recently exposed by Qatar's decision to order just
eight to 16 out of more than 110 LNG Carriers from Chinese yards, with the rest from
South Korean. The Chinese deal offered superior financial conditions and, as China is
intended to be a major offtake channel for the natural gas expansion, it offered a
seemingly more important relationship. Hence, the order indicates that the Chinese yard
industry is still struggling to build high-spec vessels.
South Korea has a track record of building advanced vessels, and the combined capacity
of the five first-tier yards could actually fulfil the majority of demand for new cargo ships
until 2030. The huge Qatar order will deploy a minimum of 11% of capacity up to 2027,
but more questions circle whether South Korean yards will be profitable when competing
with China for low-price cargo carriers, as the need for new LNG Carriers dries up.
We expect the fleet of zero-emission vessels to be highly standardised. This would
normally put Japanese yards in a good position, but government support in China and
South Korea has left them at a disadvantage. Japanese yards are awaiting state actions
to reduce overall vessel prices, without which most will struggle to compete. European
yards seem limited to Passenger- and Offshore vessels. They will not be price-competitive
on cargo carriers, but Europe will play a significant role throughout the value chain.
The shipbuilding consolidation process has strengthened the focus on production flexibility
and the ability to adjust short-term yard capacity. This will still be important, but
increased industry transparency and further consolidation in both the shipping and
shipbuilding industries may decrease order volatility. We expect conditions to be more
stable for yards in a position to build the next generation of vessels.
SHIPBUILDING DEEP DIVE: CARGO FLEET RENEWAL POTENTIAL
Source: Clarksons , Danish Ship Finance
Opaque industry outlook will continue to curb contracting activity
FLEET RENEWAL POTENTIAL* (MILLION CGT)
*Average demolition age for each vessel type in 2017-2019 is kept constant
33Shipping Market Review – November 2020
CONTAINER
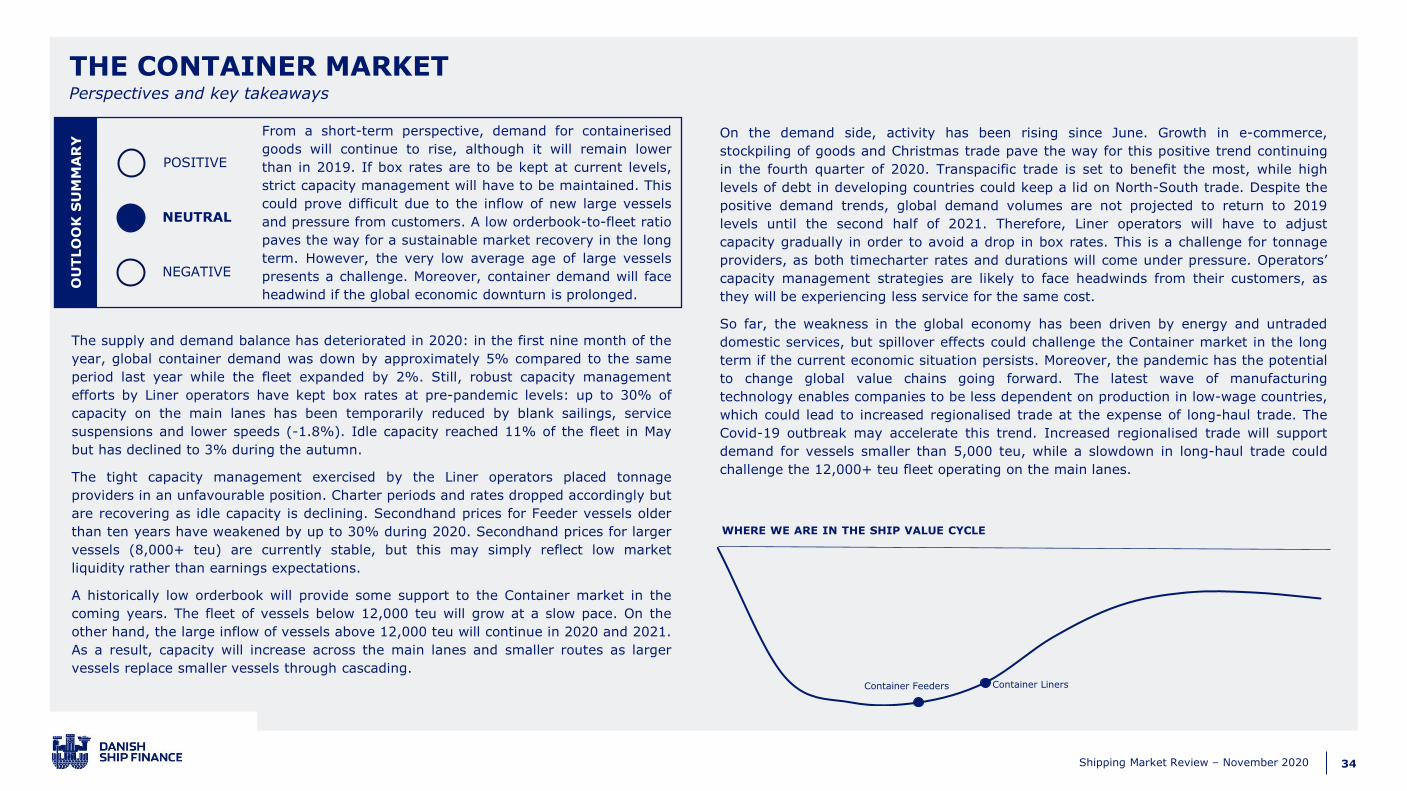
34Shipping Market Review – November 2020
OU
TLO
OK
SU
MM
AR
Y
POSITIVE
NEUTRAL
NEGATIVE
THE CONTAINER MARKET
WHERE WE ARE IN THE SHIP VALUE CYCLE
Perspectives and key takeaways
From a short-term perspective, demand for containerised
goods will continue to rise, although it will remain lower
than in 2019. If box rates are to be kept at current levels,
strict capacity management will have to be maintained. This
could prove difficult due to the inflow of new large vessels
and pressure from customers. A low orderbook-to-fleet ratio
paves the way for a sustainable market recovery in the long
term. However, the very low average age of large vessels
presents a challenge. Moreover, container demand will face
headwind if the global economic downturn is prolonged.
The supply and demand balance has deteriorated in 2020: in the first nine month of the
year, global container demand was down by approximately 5% compared to the same
period last year while the fleet expanded by 2%. Still, robust capacity management
efforts by Liner operators have kept box rates at pre-pandemic levels: up to 30% of
capacity on the main lanes has been temporarily reduced by blank sailings, service
suspensions and lower speeds (-1.8%). Idle capacity reached 11% of the fleet in May
but has declined to 3% during the autumn.
The tight capacity management exercised by the Liner operators placed tonnage
providers in an unfavourable position. Charter periods and rates dropped accordingly but
are recovering as idle capacity is declining. Secondhand prices for Feeder vessels older
than ten years have weakened by up to 30% during 2020. Secondhand prices for larger
vessels (8,000+ teu) are currently stable, but this may simply reflect low market
liquidity rather than earnings expectations.
A historically low orderbook will provide some support to the Container market in the
coming years. The fleet of vessels below 12,000 teu will grow at a slow pace. On the
other hand, the large inflow of vessels above 12,000 teu will continue in 2020 and 2021.
As a result, capacity will increase across the main lanes and smaller routes as larger
vessels replace smaller vessels through cascading.
On the demand side, activity has been rising since June. Growth in e-commerce,
stockpiling of goods and Christmas trade pave the way for this positive trend continuing
in the fourth quarter of 2020. Transpacific trade is set to benefit the most, while high
levels of debt in developing countries could keep a lid on North-South trade. Despite the
positive demand trends, global demand volumes are not projected to return to 2019
levels until the second half of 2021. Therefore, Liner operators will have to adjust
capacity gradually in order to avoid a drop in box rates. This is a challenge for tonnage
providers, as both timecharter rates and durations will come under pressure. Operators’
capacity management strategies are likely to face headwinds from their customers, as
they will be experiencing less service for the same cost.
So far, the weakness in the global economy has been driven by energy and untraded
domestic services, but spillover effects could challenge the Container market in the long
term if the current economic situation persists. Moreover, the pandemic has the potential
to change global value chains going forward. The latest wave of manufacturing
technology enables companies to be less dependent on production in low-wage countries,
which could lead to increased regionalised trade at the expense of long-haul trade. The
Covid-19 outbreak may accelerate this trend. Increased regionalised trade will support
demand for vessels smaller than 5,000 teu, while a slowdown in long-haul trade could
challenge the 12,000+ teu fleet operating on the main lanes.
Container Feeders Container Liners
35Shipping Market Review – November 2020
THE CONTAINER MARKET
AVERAGE BOX RATE OUT OF CHINA (INDEX)
Source: Clarksons, Danish Ship Finance
Freight rates and ship prices
Owing to strict capacity management, the box rate has been kept at a steady level
compared with the end of 2019, while it has increased by 6% since our last report in May.
Global Container demand contracted by an estimated 8% in the first half of 2020 due to
the global economic recession caused by the Covid-19 pandemic. The east-west and
transpacific lanes were hit hardest, with demand declining by 11% and 9%, respectively.
Still, increased idle capacity, void sailings and slow steaming limited the drop in box rates
to 4% in the same period. In the third quarter, Container demand started to slowly
improve as global economic activity rose. Liner operators have been reluctant to increase
available capacity, which has supported an increase in the box rate of 24% since June. By
the end of October, the CCFI stood at index 1,054 – 11% higher than in January.
Liner operators’ focus on capacity management has put pressure on tonnage providers.
As a result, average timecharter rates dropped by 33% in the first half of 2020. In the
autumn, the market has improved as demand has increased, and rates were up by 18%
in October compared with the end of 2019. In order to cope with the uncertainty over
future demand, Liner operators have managed to shorten charter periods. Charter periods
of less than six months represent 33% of all charter agreements in 2020, up from 18% in
2019. For Feeders, this figure has risen from 64% in 2019 to 75%.
The unpredictability of demand trends, uncertainty of future ship design and limited
openings for vessel inspections lower the appetite for S&P. In the second quarter of the
year, only nine sales were registered – the lowest quarterly level since 2008. Still, S&P
activity has shown signs of improvement during the autumn, driven by the Old Panamax
and Feeder segments. The almost non-existent S&P activity for large Container vessels
has kept the secondhand price for five-year-old vessels larger than 8,000 teu fairly
steady. For five-year-old Old Panamaxes and 2,500 teu Feeder vessels, prices have
declined by 2% and 10% during 2020, respectively. The value depreciation has been most
marked for small vessels older than ten years. For example, the price for a 15-year-old
1,000 teu Feeder vessel stood at USD 2.25 million in October – close to scrap value.
SECONDHAND PRICES FOR A FIVE-YEAR-OLD VESSEL (USD MILLION)
0
400
800
1200
1600
2014 2015 2016 2017 2018 2019 2020 2021
CCFI
+11%
0
30
60
90
120
2014 2015 2016 2017 2018 2019 2020 2021
13,000 teu 8,500-9,1000 teu 6,600-6,8000 teu 4,500 teu 2,500 teu
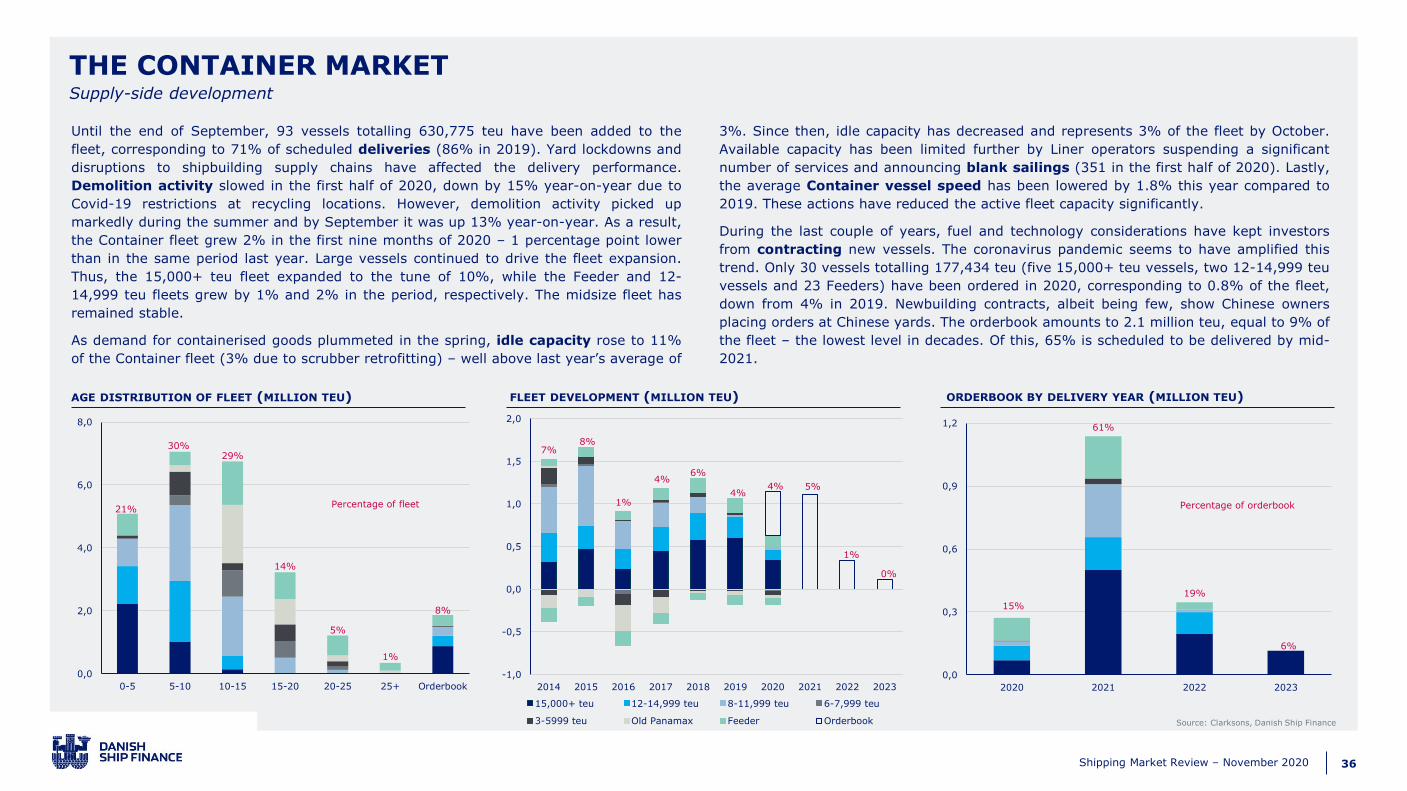
36Shipping Market Review – November 2020
THE CONTAINER MARKET
Source: Clarksons, Danish Ship Finance
AGE DISTRIBUTION OF FLEET (MILLION TEU) FLEET DEVELOPMENT (MILLION TEU) ORDERBOOK BY DELIVERY YEAR (MILLION TEU)
Until the end of September, 93 vessels totalling 630,775 teu have been added to the
fleet, corresponding to 71% of scheduled deliveries (86% in 2019). Yard lockdowns and
disruptions to shipbuilding supply chains have affected the delivery performance.
Demolition activity slowed in the first half of 2020, down by 15% year-on-year due to
Covid-19 restrictions at recycling locations. However, demolition activity picked up
markedly during the summer and by September it was up 13% year-on-year. As a result,
the Container fleet grew 2% in the first nine months of 2020 – 1 percentage point lower
than in the same period last year. Large vessels continued to drive the fleet expansion.
Thus, the 15,000+ teu fleet expanded to the tune of 10%, while the Feeder and 12-
14,999 teu fleets grew by 1% and 2% in the period, respectively. The midsize fleet has
remained stable.
As demand for containerised goods plummeted in the spring, idle capacity rose to 11%
of the Container fleet (3% due to scrubber retrofitting) – well above last year’s average of
3%. Since then, idle capacity has decreased and represents 3% of the fleet by October.
Available capacity has been limited further by Liner operators suspending a significant
number of services and announcing blank sailings (351 in the first half of 2020). Lastly,
the average Container vessel speed has been lowered by 1.8% this year compared to
2019. These actions have reduced the active fleet capacity significantly.
During the last couple of years, fuel and technology considerations have kept investors
from contracting new vessels. The coronavirus pandemic seems to have amplified this
trend. Only 30 vessels totalling 177,434 teu (five 15,000+ teu vessels, two 12-14,999 teu
vessels and 23 Feeders) have been ordered in 2020, corresponding to 0.8% of the fleet,
down from 4% in 2019. Newbuilding contracts, albeit being few, show Chinese owners
placing orders at Chinese yards. The orderbook amounts to 2.1 million teu, equal to 9% of
the fleet – the lowest level in decades. Of this, 65% is scheduled to be delivered by mid-
2021.
21%
30%29%
14%
5%
1%
8%
0,0
2,0
4,0
6,0
8,0
0-5 5-10 10-15 15-20 20-25 25+ Orderbook
Percentage of fleet
7%8%
1%
4%6%
4%4% 5%
1%
0%
-1,0
-0,5
0,0
0,5
1,0
1,5
2,0
2014 2015 2016 2017 2018 2019 2020 2021 2022 2023
15,000+ teu 12-14,999 teu 8-11,999 teu 6-7,999 teu
3-5999 teu Old Panamax Feeder Orderbook
15%
61%
19%
6%
0,0
0,3
0,6
0,9
1,2
2020 2021 2022 2023
Percentage of orderbook
Supply-side development

37Shipping Market Review – November 2020
Positive impactNegative impact ✓
We expect the recovery of the global economy to be drawn-out and uncertain. This increases the risk of structurally high unemployment. Persistently high unemployment rates will lead to a decline in trade of containerised goods.
FORCES AT WORK IMPACTING THE OUTLOOK
The Covid-19 pandemic has highlighted the vulnerability of the complex networks of supply linkages. Manufacturing companies are likely to reevaluate their supply chains. This could change distances and routes for containerised
goods, increasing the need for flexibility in Liner operations.
The orderbook equals 9% of the fleet, which means that parts of the fleet will be able to adapt to future demand. The Feeder and 3,000-4,999 teu vessels are particularly well-positioned.
Strict capacity management among Liner operators has kept the box rate at 2019 levels despite declining demand. Continuous focus on limiting available capacity will be necessary in the coming years.
Global economy
Changing supply chains
Low orderbook-to-fleet ratio
Cascading of capacity
Market discipline
In the coming six to 12 months, demand will be the determining factor in the Container
market. The unpredictable development of the coronavirus adds uncertainty to future
Container trade. Demand on transpacific and Asia-Europe lanes will depend on whether e-
commerce and stockpiling of medical equipment can continue to compensate for a decline
in trade of industrial components. We expect activity to rise but still at volumes below last
year, while local virus outbreaks could cause significant temporary trade disturbances. We
expect Container demand to decline by 4-6% in 2020, driven by long-haul trade.
On the supply side, the 12,000+ teu fleet is scheduled to grow by 9% in both 2020 and
2021. This calls for further cascading of capacity from the main lanes to smaller routes in
order to align supply with demand, which will increase the competition for smaller
vessels, even though the orderbook for vessels smaller than 8,000 teu can easily be
absorbed by scrapping of vessels older than 20 years. This year and the next, fleet is set
to expand by 4% and 5% without any additional scrapping, respectively.
In the short term, we believe that in order to keep the current box rate levels steady,
Liner operators must gradually adjust available capacity to customer demand while
monitoring the supply and demand balance closely, preventing a return to the pre-
pandemic capacity surplus. For the Feeder and 3,000-4,999 teu fleets, we expect
relatively strong regional demand and a favourable supply composition to support freight
rates.
From a long-term perspective, the record-low orderbook-to-fleet ratio raises hopes for a
future market recovery, but the historically uneven fleet growth between small and large
vessels means that continuous cascading of vessels and fleet assessment are required in
order to balance supply and demand. Demand volumes are likely to stabilise and resume
growth rates of 1-3% once the majority of the global population has been protected
against Covid-19 infection. Downside risks to the outlook are a protracted global
economic downturn, with high unemployment rates hampering purchasing power and
thereby demand for containerised goods, and a resumption of the trade dispute between
the US and China.
THE CONTAINER MARKETMarket outlook
Deliveries of 15,000+ teu vessels will shape the supply side in the coming years. Smaller vessels will be replaced and redirected to less demand-intensive routes. This will create downward pressure across Liner networks and for
tonnage providers with older less efficient vessels.
✓
✓
✓
38Shipping Market Review – November 2020
CONTAINER MARKET DEEP DIVE: GLOBAL SUPPLY CHAINSThe Covid-19 pandemic could accelerate the changes to supply chains and shorten Container trade lanes
In the 2000s, Container freight volumes soared as new communication
technologies and China’s entry to the WTO enabled the globalisation of trade
and supply chains. Global supply chains now account for almost 50% of global
trade and fuel demand for Container vessels. An increasing risk of shocks to
the supply chains for containerised goods is forcing a reevaluation of these and
thereby Container lanes.
Even before Covid-19, trade disputes between the US and China as well as Brexit were
constraining demand for containerised goods on the main lanes, while regional trade
seemed more immune to these external shocks. We believe this trend could accelerate,
as the global lockdowns of economies have exposed the risk of relying on complex
networks of supply linkages. Manufacturing companies in high value-added industries
are likely to increase stockpiles or consider a regional source of supply in the future.
Recent research suggests that up to a quarter of global trade volumes could move
across borders in order to minimise supply chain shocks. Supply chains for
containerised goods such as communication equipment, computers and electronics,
semiconductors and apparel are highly exposed to external shocks, and we believe
increasing numbers of companies in these industries will consider nearshoring some
supply linkages in order to reduce the risk of disruption.
Multiple factors indicate a trend towards regionalisation of supply chains. Policies such
as America First and the increasing European focus on domestic production of critical
technologies endorse domestic manufacturing. Take, for example, a new US law
designed to keep Chinese telecommunications companies out of the American network.
Moreover, highly skilled talent, a supplier ecosystem, infrastructure and IP protection
seem to be vital factors for companies when deciding the location of future plants – and
these can be attained thanks to the constant development of manufacturing
technology. Back in our May 2016 report, we argued that new technology trends would
shape the future of international production. This trend may now accelerate. Robotics-
enabled automation, enhanced supply chain digitalisation and additive manufacturing
will make cheap labour less important in the future and provide the opportunity to
locate manufacturing closer to the consumer.
We believe that the changes in supply chains will take place gradually and over a longer
period. Regionalised trade will grow faster as new export hubs for containerised goods
emerge closer to the customer. Vessels smaller than 5,000 teu are likely to benefit
from this trend. Smaller ships sailing more frequently will enable point-to-point
networks to be established and ensure faster turnaround times in ports. On the long-
haul main lanes, demand growth could stagnate or even decline, which will intensify the
focus on economies of scale in order to minimise costs. Premature scrapping could
become a topic among 12-14,999 teu vessels.
We argue that further vertical integration into supply chains could result in an increased
profit pool for the Container industry despite shorter distances between trading
partners. This will require improved flexibility in Liner operators’ pool of vessels. In
order to keep pace with changing supply linkages, the pool must be adjusted
constantly, and a recalibration of the fleet composition will be necessary. A larger share
of chartered vessels in relation to owned vessels could provide Liner operators with the
flexibility to swiftly reorient their services across different Container providers according
to customer demand and preferences. This puts Liner operators in a privileged position
to help make their customers’ supply chains nimbler – a potential source of future value
creation for the Container industry but implying less operational visibility for tonnage
providers.

39Shipping Market Review – November 2020
DRY BULK
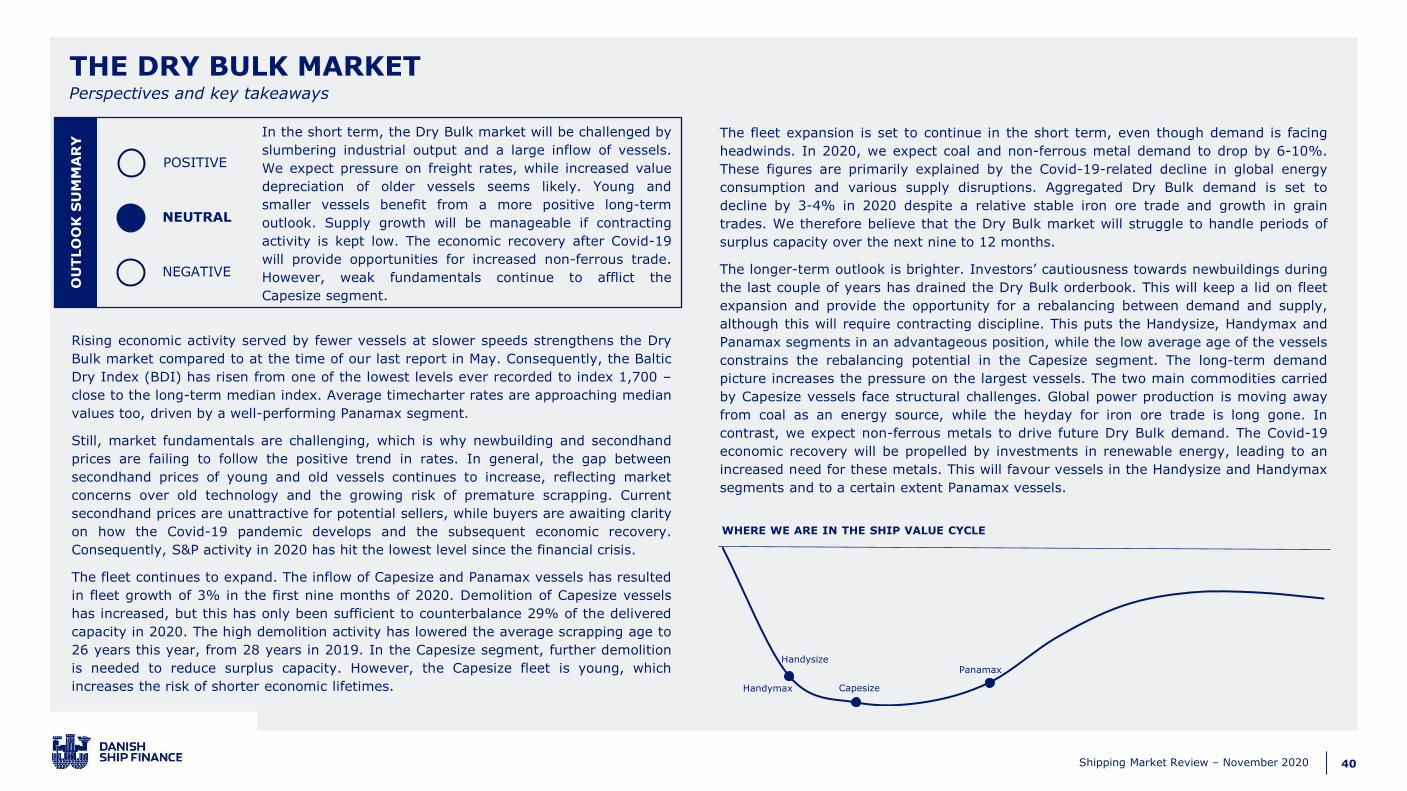
40Shipping Market Review – November 2020
OU
TLO
OK
SU
MM
AR
Y
POSITIVE
NEUTRAL
NEGATIVE
THE DRY BULK MARKET
WHERE WE ARE IN THE SHIP VALUE CYCLE
Perspectives and key takeaways
In the short term, the Dry Bulk market will be challenged by
slumbering industrial output and a large inflow of vessels.
We expect pressure on freight rates, while increased value
depreciation of older vessels seems likely. Young and
smaller vessels benefit from a more positive long-term
outlook. Supply growth will be manageable if contracting
activity is kept low. The economic recovery after Covid-19
will provide opportunities for increased non-ferrous trade.
However, weak fundamentals continue to afflict the
Capesize segment.
Rising economic activity served by fewer vessels at slower speeds strengthens the Dry
Bulk market compared to at the time of our last report in May. Consequently, the Baltic
Dry Index (BDI) has risen from one of the lowest levels ever recorded to index 1,700 –
close to the long-term median index. Average timecharter rates are approaching median
values too, driven by a well-performing Panamax segment.
Still, market fundamentals are challenging, which is why newbuilding and secondhand
prices are failing to follow the positive trend in rates. In general, the gap between
secondhand prices of young and old vessels continues to increase, reflecting market
concerns over old technology and the growing risk of premature scrapping. Current
secondhand prices are unattractive for potential sellers, while buyers are awaiting clarity
on how the Covid-19 pandemic develops and the subsequent economic recovery.
Consequently, S&P activity in 2020 has hit the lowest level since the financial crisis.
The fleet continues to expand. The inflow of Capesize and Panamax vessels has resulted
in fleet growth of 3% in the first nine months of 2020. Demolition of Capesize vessels
has increased, but this has only been sufficient to counterbalance 29% of the delivered
capacity in 2020. The high demolition activity has lowered the average scrapping age to
26 years this year, from 28 years in 2019. In the Capesize segment, further demolition
is needed to reduce surplus capacity. However, the Capesize fleet is young, which
increases the risk of shorter economic lifetimes.
The fleet expansion is set to continue in the short term, even though demand is facing
headwinds. In 2020, we expect coal and non-ferrous metal demand to drop by 6-10%.
These figures are primarily explained by the Covid-19-related decline in global energy
consumption and various supply disruptions. Aggregated Dry Bulk demand is set to
decline by 3-4% in 2020 despite a relative stable iron ore trade and growth in grain
trades. We therefore believe that the Dry Bulk market will struggle to handle periods of
surplus capacity over the next nine to 12 months.
The longer-term outlook is brighter. Investors’ cautiousness towards newbuildings during
the last couple of years has drained the Dry Bulk orderbook. This will keep a lid on fleet
expansion and provide the opportunity for a rebalancing between demand and supply,
although this will require contracting discipline. This puts the Handysize, Handymax and
Panamax segments in an advantageous position, while the low average age of the vessels
constrains the rebalancing potential in the Capesize segment. The long-term demand
picture increases the pressure on the largest vessels. The two main commodities carried
by Capesize vessels face structural challenges. Global power production is moving away
from coal as an energy source, while the heyday for iron ore trade is long gone. In
contrast, we expect non-ferrous metals to drive future Dry Bulk demand. The Covid-19
economic recovery will be propelled by investments in renewable energy, leading to an
increased need for these metals. This will favour vessels in the Handysize and Handymax
segments and to a certain extent Panamax vessels.
Capesize
Panamax
Handymax
Handysize
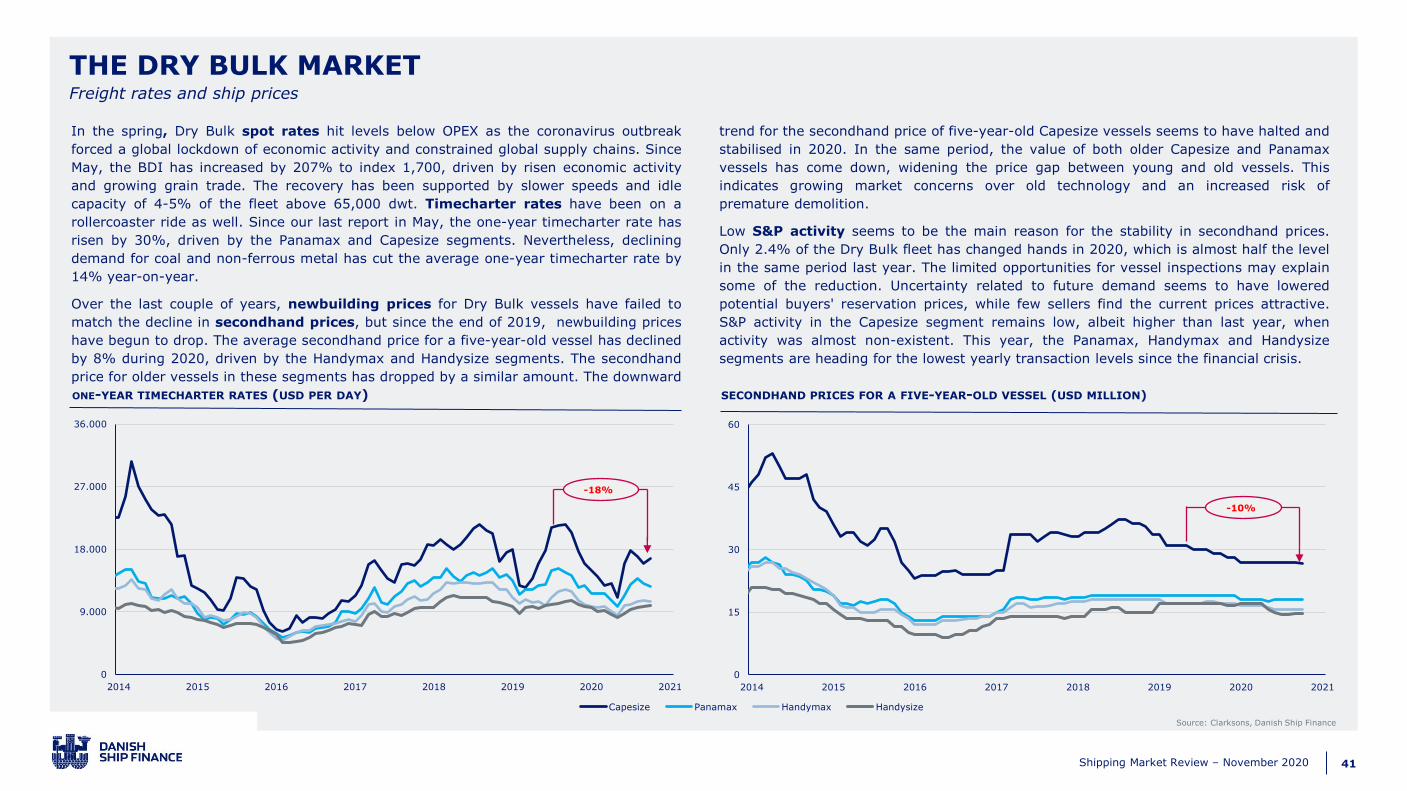
41Shipping Market Review – November 2020
THE DRY BULK MARKET
ONE-YEAR TIMECHARTER RATES (USD PER DAY)
Source: Clarksons, Danish Ship Finance
Freight rates and ship prices
In the spring, Dry Bulk spot rates hit levels below OPEX as the coronavirus outbreak
forced a global lockdown of economic activity and constrained global supply chains. Since
May, the BDI has increased by 207% to index 1,700, driven by risen economic activity
and growing grain trade. The recovery has been supported by slower speeds and idle
capacity of 4-5% of the fleet above 65,000 dwt. Timecharter rates have been on a
rollercoaster ride as well. Since our last report in May, the one-year timecharter rate has
risen by 30%, driven by the Panamax and Capesize segments. Nevertheless, declining
demand for coal and non-ferrous metal has cut the average one-year timecharter rate by
14% year-on-year.
Over the last couple of years, newbuilding prices for Dry Bulk vessels have failed to
match the decline in secondhand prices, but since the end of 2019, newbuilding prices
have begun to drop. The average secondhand price for a five-year-old vessel has declined
by 8% during 2020, driven by the Handymax and Handysize segments. The secondhand
price for older vessels in these segments has dropped by a similar amount. The downward
trend for the secondhand price of five-year-old Capesize vessels seems to have halted and
stabilised in 2020. In the same period, the value of both older Capesize and Panamax
vessels has come down, widening the price gap between young and old vessels. This
indicates growing market concerns over old technology and an increased risk of
premature demolition.
Low S&P activity seems to be the main reason for the stability in secondhand prices.
Only 2.4% of the Dry Bulk fleet has changed hands in 2020, which is almost half the level
in the same period last year. The limited opportunities for vessel inspections may explain
some of the reduction. Uncertainty related to future demand seems to have lowered
potential buyers' reservation prices, while few sellers find the current prices attractive.
S&P activity in the Capesize segment remains low, albeit higher than last year, when
activity was almost non-existent. This year, the Panamax, Handymax and Handysize
segments are heading for the lowest yearly transaction levels since the financial crisis.
SECONDHAND PRICES FOR A FIVE-YEAR-OLD VESSEL (USD MILLION)
0
9.000
18.000
27.000
36.000
2014 2015 2016 2017 2018 2019 2020 2021
Capesize Panamax Handymax Handysize
-18%
0
15
30
45
60
2014 2015 2016 2017 2018 2019 2020 2021
-10%
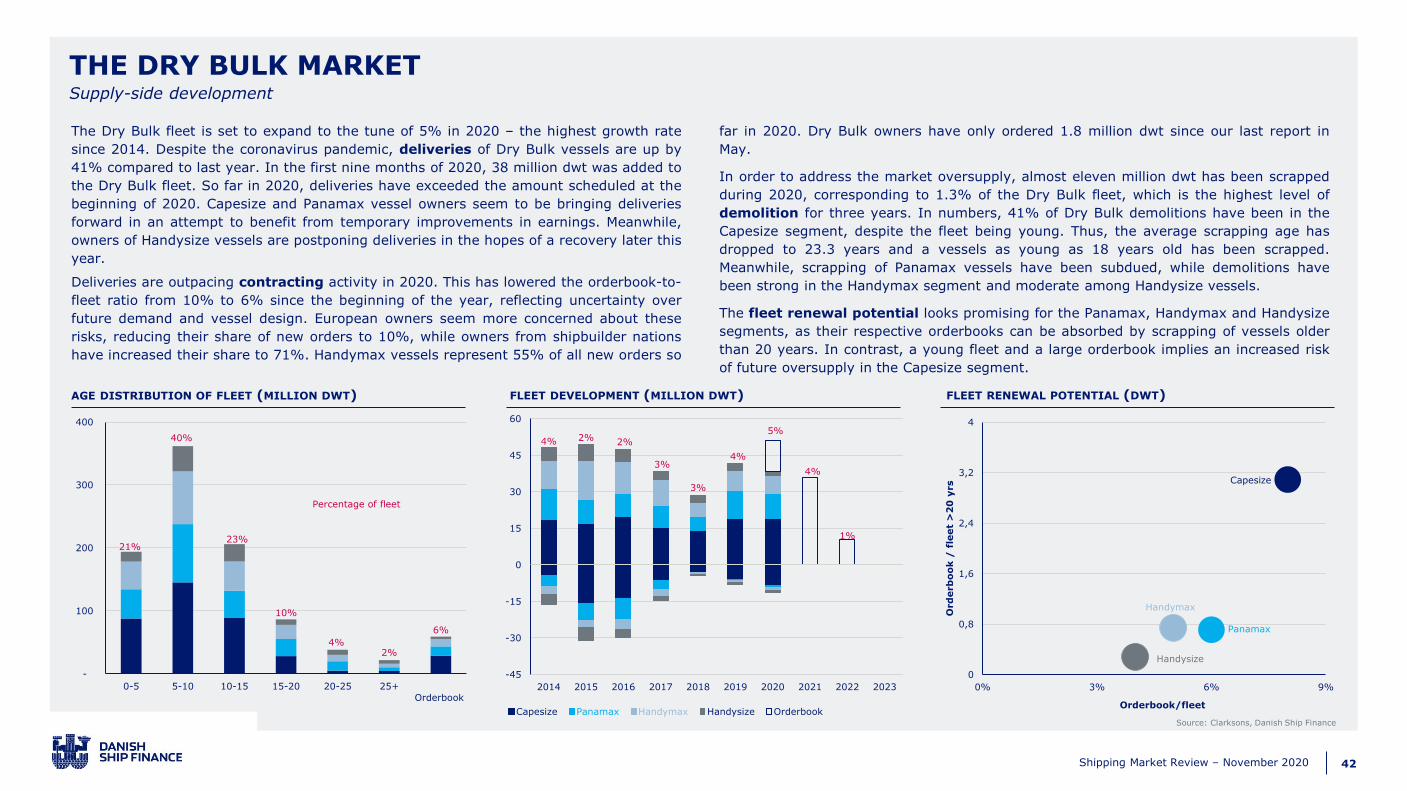
42Shipping Market Review – November 2020
THE DRY BULK MARKET
Source: Clarksons, Danish Ship Finance
AGE DISTRIBUTION OF FLEET (MILLION DWT) FLEET DEVELOPMENT (MILLION DWT) FLEET RENEWAL POTENTIAL (DWT)
Supply-side development
The Dry Bulk fleet is set to expand to the tune of 5% in 2020 – the highest growth rate
since 2014. Despite the coronavirus pandemic, deliveries of Dry Bulk vessels are up by
41% compared to last year. In the first nine months of 2020, 38 million dwt was added to
the Dry Bulk fleet. So far in 2020, deliveries have exceeded the amount scheduled at the
beginning of 2020. Capesize and Panamax vessel owners seem to be bringing deliveries
forward in an attempt to benefit from temporary improvements in earnings. Meanwhile,
owners of Handysize vessels are postponing deliveries in the hopes of a recovery later this
year.
Deliveries are outpacing contracting activity in 2020. This has lowered the orderbook-to-
fleet ratio from 10% to 6% since the beginning of the year, reflecting uncertainty over
future demand and vessel design. European owners seem more concerned about these
risks, reducing their share of new orders to 10%, while owners from shipbuilder nations
have increased their share to 71%. Handymax vessels represent 55% of all new orders so
far in 2020. Dry Bulk owners have only ordered 1.8 million dwt since our last report in
May.
In order to address the market oversupply, almost eleven million dwt has been scrapped
during 2020, corresponding to 1.3% of the Dry Bulk fleet, which is the highest level of
demolition for three years. In numbers, 41% of Dry Bulk demolitions have been in the
Capesize segment, despite the fleet being young. Thus, the average scrapping age has
dropped to 23.3 years and a vessels as young as 18 years old has been scrapped.
Meanwhile, scrapping of Panamax vessels have been subdued, while demolitions have
been strong in the Handymax segment and moderate among Handysize vessels.
The fleet renewal potential looks promising for the Panamax, Handymax and Handysize
segments, as their respective orderbooks can be absorbed by scrapping of vessels older
than 20 years. In contrast, a young fleet and a large orderbook implies an increased risk
of future oversupply in the Capesize segment.
21%
40%
23%
10%
4%2%
6%
-
100
200
300
400
0-5 5-10 10-15 15-20 20-25 25+
Orderbook
Percentage of fleet
4% 2% 2%
3%
3%
4%
5%
4%
1%
-45
-30
-15
0
15
30
45
60
2014 2015 2016 2017 2018 2019 2020 2021 2022 2023
Capesize Panamax Handymax Handysize Orderbook
Capesize
Panamax
Handymax
Handysize
0
0,8
1,6
2,4
3,2
4
0% 3% 6% 9%
Ord
erb
oo
k /
fle
et
>2
0 y
rs
Orderbook/fleet
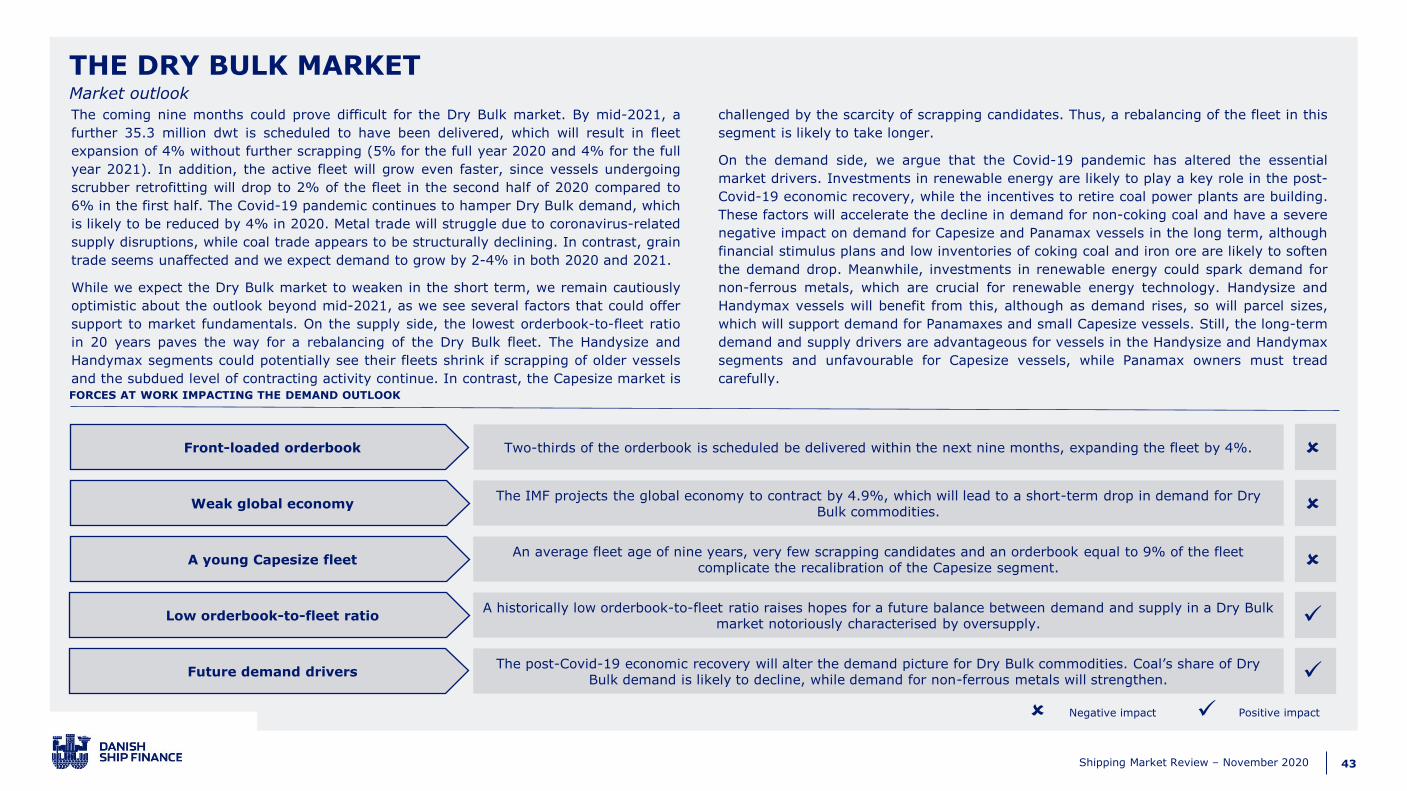
43Shipping Market Review – November 2020
Positive impactNegative impact ✓
FORCES AT WORK IMPACTING THE DEMAND OUTLOOK
Two-thirds of the orderbook is scheduled be delivered within the next nine months, expanding the fleet by 4%.
The IMF projects the global economy to contract by 4.9%, which will lead to a short-term drop in demand for Dry Bulk commodities.
An average fleet age of nine years, very few scrapping candidates and an orderbook equal to 9% of the fleet complicate the recalibration of the Capesize segment.
The post-Covid-19 economic recovery will alter the demand picture for Dry Bulk commodities. Coal’s share of Dry Bulk demand is likely to decline, while demand for non-ferrous metals will strengthen.
Front-loaded orderbook
Weak global economy
A young Capesize fleet
Low orderbook-to-fleet ratio
Future demand drivers
The coming nine months could prove difficult for the Dry Bulk market. By mid-2021, a
further 35.3 million dwt is scheduled to have been delivered, which will result in fleet
expansion of 4% without further scrapping (5% for the full year 2020 and 4% for the full
year 2021). In addition, the active fleet will grow even faster, since vessels undergoing
scrubber retrofitting will drop to 2% of the fleet in the second half of 2020 compared to
6% in the first half. The Covid-19 pandemic continues to hamper Dry Bulk demand, which
is likely to be reduced by 4% in 2020. Metal trade will struggle due to coronavirus-related
supply disruptions, while coal trade appears to be structurally declining. In contrast, grain
trade seems unaffected and we expect demand to grow by 2-4% in both 2020 and 2021.
While we expect the Dry Bulk market to weaken in the short term, we remain cautiously
optimistic about the outlook beyond mid-2021, as we see several factors that could offer
support to market fundamentals. On the supply side, the lowest orderbook-to-fleet ratio
in 20 years paves the way for a rebalancing of the Dry Bulk fleet. The Handysize and
Handymax segments could potentially see their fleets shrink if scrapping of older vessels
and the subdued level of contracting activity continue. In contrast, the Capesize market is
challenged by the scarcity of scrapping candidates. Thus, a rebalancing of the fleet in this
segment is likely to take longer.
On the demand side, we argue that the Covid-19 pandemic has altered the essential
market drivers. Investments in renewable energy are likely to play a key role in the post-
Covid-19 economic recovery, while the incentives to retire coal power plants are building.
These factors will accelerate the decline in demand for non-coking coal and have a severe
negative impact on demand for Capesize and Panamax vessels in the long term, although
financial stimulus plans and low inventories of coking coal and iron ore are likely to soften
the demand drop. Meanwhile, investments in renewable energy could spark demand for
non-ferrous metals, which are crucial for renewable energy technology. Handysize and
Handymax vessels will benefit from this, although as demand rises, so will parcel sizes,
which will support demand for Panamaxes and small Capesize vessels. Still, the long-term
demand and supply drivers are advantageous for vessels in the Handysize and Handymax
segments and unfavourable for Capesize vessels, while Panamax owners must tread
carefully.
THE DRY BULK MARKETMarket outlook
A historically low orderbook-to-fleet ratio raises hopes for a future balance between demand and supply in a Dry Bulk market notoriously characterised by oversupply.
✓
✓
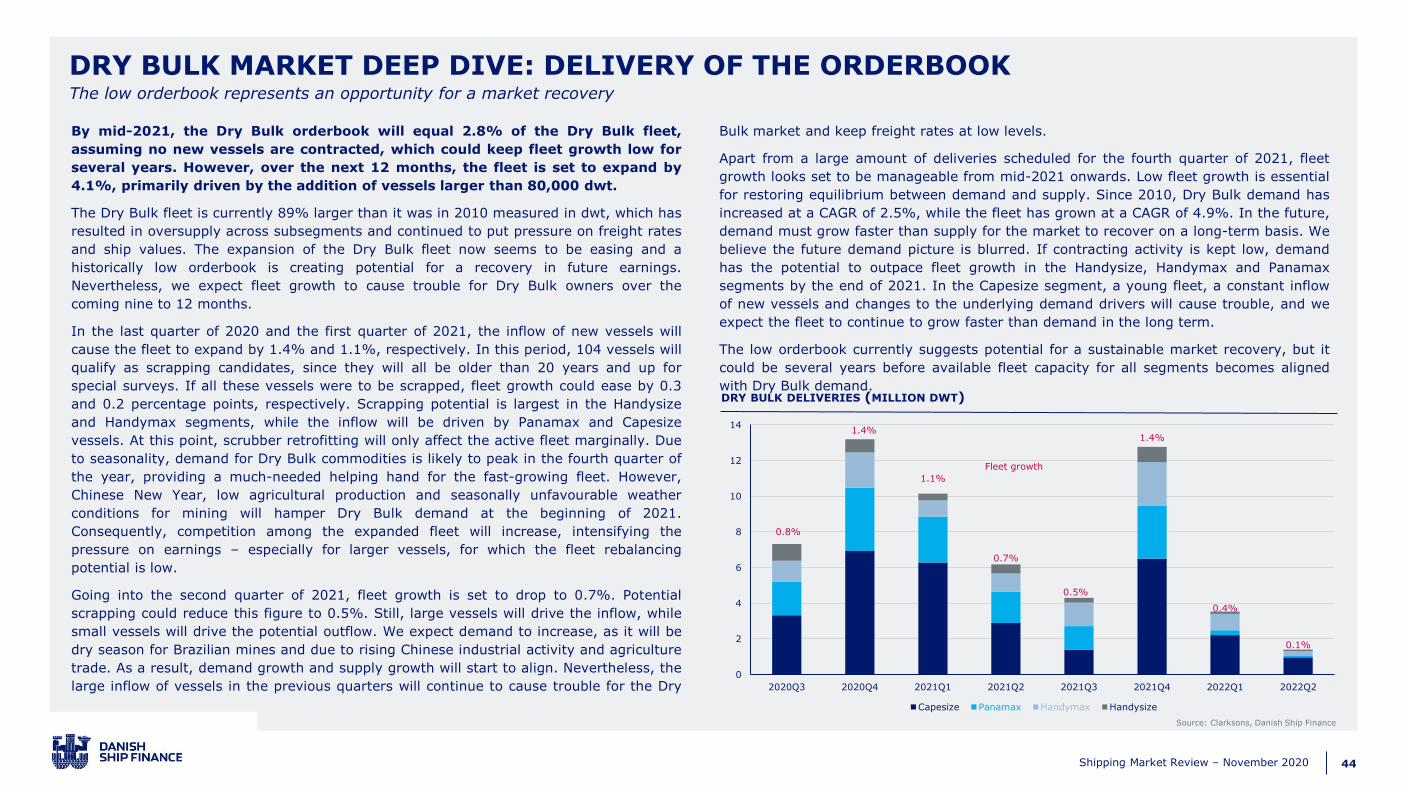
44Shipping Market Review – November 2020
By mid-2021, the Dry Bulk orderbook will equal 2.8% of the Dry Bulk fleet,
assuming no new vessels are contracted, which could keep fleet growth low for
several years. However, over the next 12 months, the fleet is set to expand by
4.1%, primarily driven by the addition of vessels larger than 80,000 dwt.
The Dry Bulk fleet is currently 89% larger than it was in 2010 measured in dwt, which has
resulted in oversupply across subsegments and continued to put pressure on freight rates
and ship values. The expansion of the Dry Bulk fleet now seems to be easing and a
historically low orderbook is creating potential for a recovery in future earnings.
Nevertheless, we expect fleet growth to cause trouble for Dry Bulk owners over the
coming nine to 12 months.
In the last quarter of 2020 and the first quarter of 2021, the inflow of new vessels will
cause the fleet to expand by 1.4% and 1.1%, respectively. In this period, 104 vessels will
qualify as scrapping candidates, since they will all be older than 20 years and up for
special surveys. If all these vessels were to be scrapped, fleet growth could ease by 0.3
and 0.2 percentage points, respectively. Scrapping potential is largest in the Handysize
and Handymax segments, while the inflow will be driven by Panamax and Capesize
vessels. At this point, scrubber retrofitting will only affect the active fleet marginally. Due
to seasonality, demand for Dry Bulk commodities is likely to peak in the fourth quarter of
the year, providing a much-needed helping hand for the fast-growing fleet. However,
Chinese New Year, low agricultural production and seasonally unfavourable weather
conditions for mining will hamper Dry Bulk demand at the beginning of 2021.
Consequently, competition among the expanded fleet will increase, intensifying the
pressure on earnings – especially for larger vessels, for which the fleet rebalancing
potential is low.
Going into the second quarter of 2021, fleet growth is set to drop to 0.7%. Potential
scrapping could reduce this figure to 0.5%. Still, large vessels will drive the inflow, while
small vessels will drive the potential outflow. We expect demand to increase, as it will be
dry season for Brazilian mines and due to rising Chinese industrial activity and agriculture
trade. As a result, demand growth and supply growth will start to align. Nevertheless, the
large inflow of vessels in the previous quarters will continue to cause trouble for the Dry
Bulk market and keep freight rates at low levels.
Apart from a large amount of deliveries scheduled for the fourth quarter of 2021, fleet
growth looks set to be manageable from mid-2021 onwards. Low fleet growth is essential
for restoring equilibrium between demand and supply. Since 2010, Dry Bulk demand has
increased at a CAGR of 2.5%, while the fleet has grown at a CAGR of 4.9%. In the future,
demand must grow faster than supply for the market to recover on a long-term basis. We
believe the future demand picture is blurred. If contracting activity is kept low, demand
has the potential to outpace fleet growth in the Handysize, Handymax and Panamax
segments by the end of 2021. In the Capesize segment, a young fleet, a constant inflow
of new vessels and changes to the underlying demand drivers will cause trouble, and we
expect the fleet to continue to grow faster than demand in the long term.
The low orderbook currently suggests potential for a sustainable market recovery, but it
could be several years before available fleet capacity for all segments becomes aligned
with Dry Bulk demand.
DRY BULK MARKET DEEP DIVE: DELIVERY OF THE ORDERBOOK
Source: Clarksons, Danish Ship Finance
The low orderbook represents an opportunity for a market recovery
DRY BULK DELIVERIES (MILLION DWT)
0.8%
1.4%
1.1%
0.7%
0.5%
1.4%
0.4%
0.1%
0
2
4
6
8
10
12
14
2020Q3 2020Q4 2021Q1 2021Q2 2021Q3 2021Q4 2022Q1 2022Q2
Capesize Panamax Handymax Handysize
Fleet growth
45Shipping Market Review – November 2020
CRUDE TANKERS
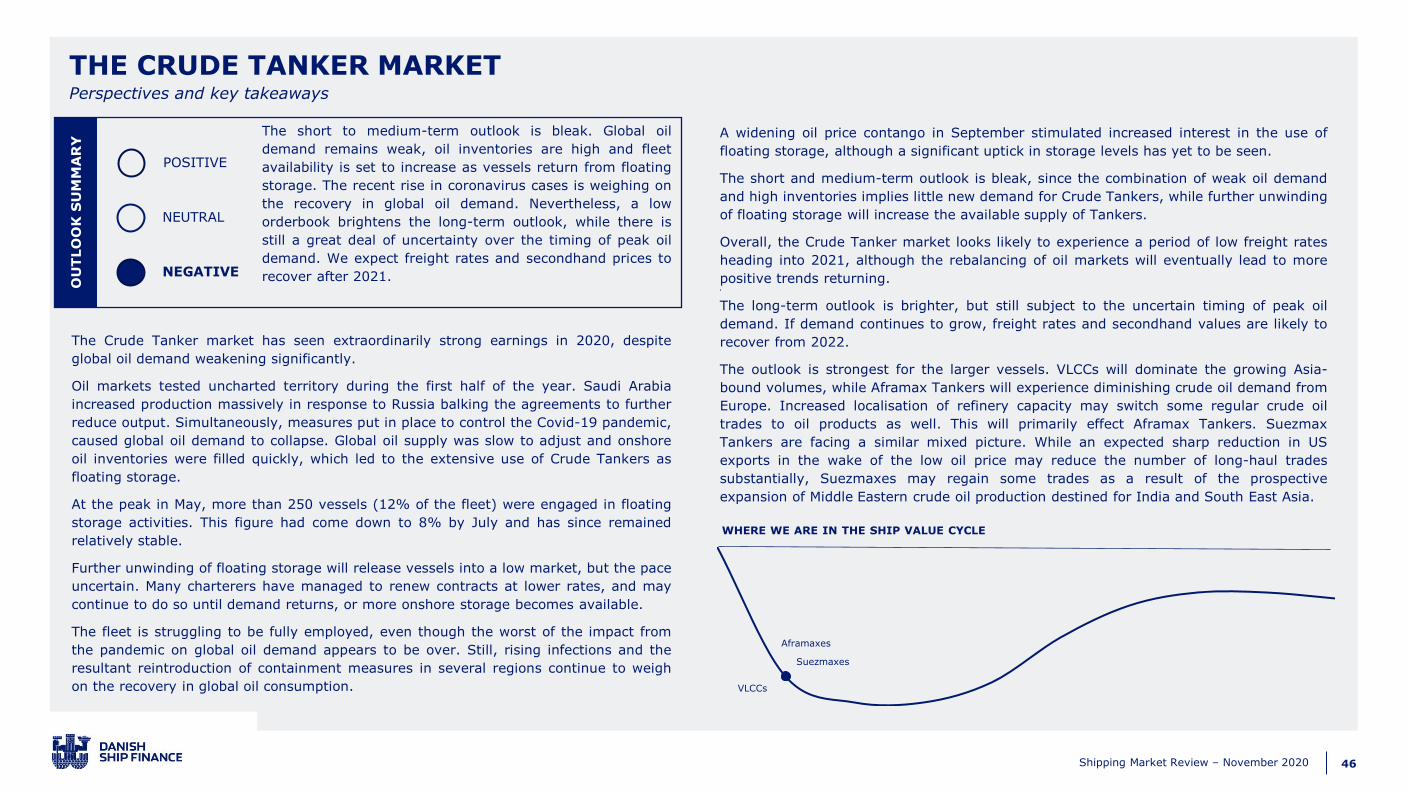
46Shipping Market Review – November 2020
OU
TLO
OK
SU
MM
AR
Y
POSITIVE
NEUTRAL
NEGATIVE
THE CRUDE TANKER MARKET
WHERE WE ARE IN THE SHIP VALUE CYCLE
Perspectives and key takeaways
The short to medium-term outlook is bleak. Global oil
demand remains weak, oil inventories are high and fleet
availability is set to increase as vessels return from floating
storage. The recent rise in coronavirus cases is weighing on
the recovery in global oil demand. Nevertheless, a low
orderbook brightens the long-term outlook, while there is
still a great deal of uncertainty over the timing of peak oil
demand. We expect freight rates and secondhand prices to
recover after 2021.
The Crude Tanker market has seen extraordinarily strong earnings in 2020, despite
global oil demand weakening significantly.
Oil markets tested uncharted territory during the first half of the year. Saudi Arabia
increased production massively in response to Russia balking the agreements to further
reduce output. Simultaneously, measures put in place to control the Covid-19 pandemic,
caused global oil demand to collapse. Global oil supply was slow to adjust and onshore
oil inventories were filled quickly, which led to the extensive use of Crude Tankers as
floating storage.
At the peak in May, more than 250 vessels (12% of the fleet) were engaged in floating
storage activities. This figure had come down to 8% by July and has since remained
relatively stable.
Further unwinding of floating storage will release vessels into a low market, but the pace
uncertain. Many charterers have managed to renew contracts at lower rates, and may
continue to do so until demand returns, or more onshore storage becomes available.
The fleet is struggling to be fully employed, even though the worst of the impact from
the pandemic on global oil demand appears to be over. Still, rising infections and the
resultant reintroduction of containment measures in several regions continue to weigh
on the recovery in global oil consumption.
A widening oil price contango in September stimulated increased interest in the use of
floating storage, although a significant uptick in storage levels has yet to be seen.
The short and medium-term outlook is bleak, since the combination of weak oil demand
and high inventories implies little new demand for Crude Tankers, while further unwinding
of floating storage will increase the available supply of Tankers.
Overall, the Crude Tanker market looks likely to experience a period of low freight rates
heading into 2021, although the rebalancing of oil markets will eventually lead to more
positive trends returning.‘
The long-term outlook is brighter, but still subject to the uncertain timing of peak oil
demand. If demand continues to grow, freight rates and secondhand values are likely to
recover from 2022.
The outlook is strongest for the larger vessels. VLCCs will dominate the growing Asia-
bound volumes, while Aframax Tankers will experience diminishing crude oil demand from
Europe. Increased localisation of refinery capacity may switch some regular crude oil
trades to oil products as well. This will primarily effect Aframax Tankers. Suezmax
Tankers are facing a similar mixed picture. While an expected sharp reduction in US
exports in the wake of the low oil price may reduce the number of long-haul trades
substantially, Suezmaxes may regain some trades as a result of the prospective
expansion of Middle Eastern crude oil production destined for India and South East Asia.
Suezmaxes
Aframaxes
VLCCs
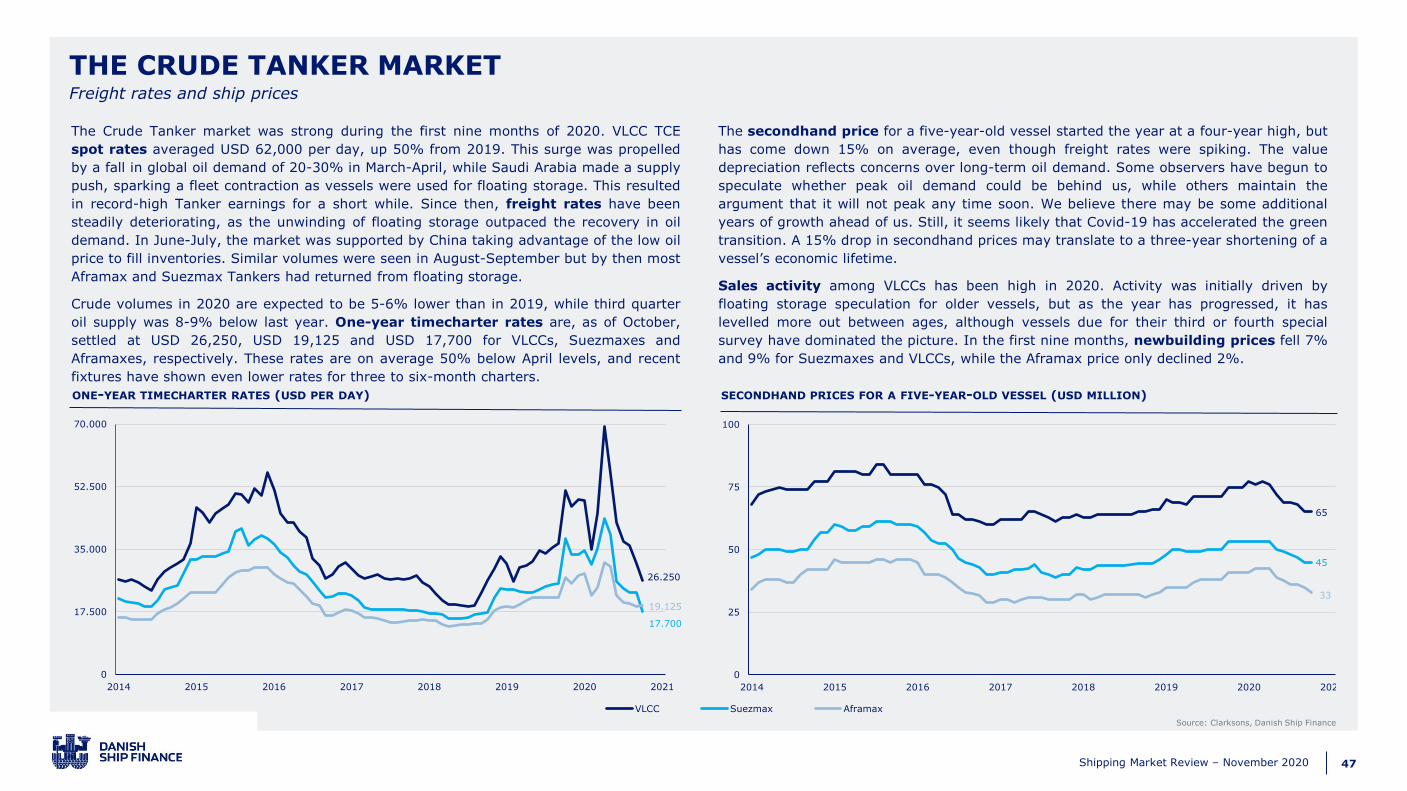
47Shipping Market Review – November 2020
THE CRUDE TANKER MARKET
ONE-YEAR TIMECHARTER RATES (USD PER DAY)
Source: Clarksons, Danish Ship Finance
Freight rates and ship prices
The Crude Tanker market was strong during the first nine months of 2020. VLCC TCE
spot rates averaged USD 62,000 per day, up 50% from 2019. This surge was propelled
by a fall in global oil demand of 20-30% in March-April, while Saudi Arabia made a supply
push, sparking a fleet contraction as vessels were used for floating storage. This resulted
in record-high Tanker earnings for a short while. Since then, freight rates have been
steadily deteriorating, as the unwinding of floating storage outpaced the recovery in oil
demand. In June-July, the market was supported by China taking advantage of the low oil
price to fill inventories. Similar volumes were seen in August-September but by then most
Aframax and Suezmax Tankers had returned from floating storage.
Crude volumes in 2020 are expected to be 5-6% lower than in 2019, while third quarter
oil supply was 8-9% below last year. One-year timecharter rates are, as of October,
settled at USD 26,250, USD 19,125 and USD 17,700 for VLCCs, Suezmaxes and
Aframaxes, respectively. These rates are on average 50% below April levels, and recent
fixtures have shown even lower rates for three to six-month charters.
The secondhand price for a five-year-old vessel started the year at a four-year high, but
has come down 15% on average, even though freight rates were spiking. The value
depreciation reflects concerns over long-term oil demand. Some observers have begun to
speculate whether peak oil demand could be behind us, while others maintain the
argument that it will not peak any time soon. We believe there may be some additional
years of growth ahead of us. Still, it seems likely that Covid-19 has accelerated the green
transition. A 15% drop in secondhand prices may translate to a three-year shortening of a
vessel’s economic lifetime.
Sales activity among VLCCs has been high in 2020. Activity was initially driven by
floating storage speculation for older vessels, but as the year has progressed, it has
levelled more out between ages, although vessels due for their third or fourth special
survey have dominated the picture. In the first nine months, newbuilding prices fell 7%
and 9% for Suezmaxes and VLCCs, while the Aframax price only declined 2%.
SECONDHAND PRICES FOR A FIVE-YEAR-OLD VESSEL (USD MILLION)
26.250
17.700
19.125
0
17.500
35.000
52.500
70.000
2014 2015 2016 2017 2018 2019 2020 2021
VLCC Suezmax Aframax
65
45
33
0
25
50
75
100
2014 2015 2016 2017 2018 2019 2020 2021
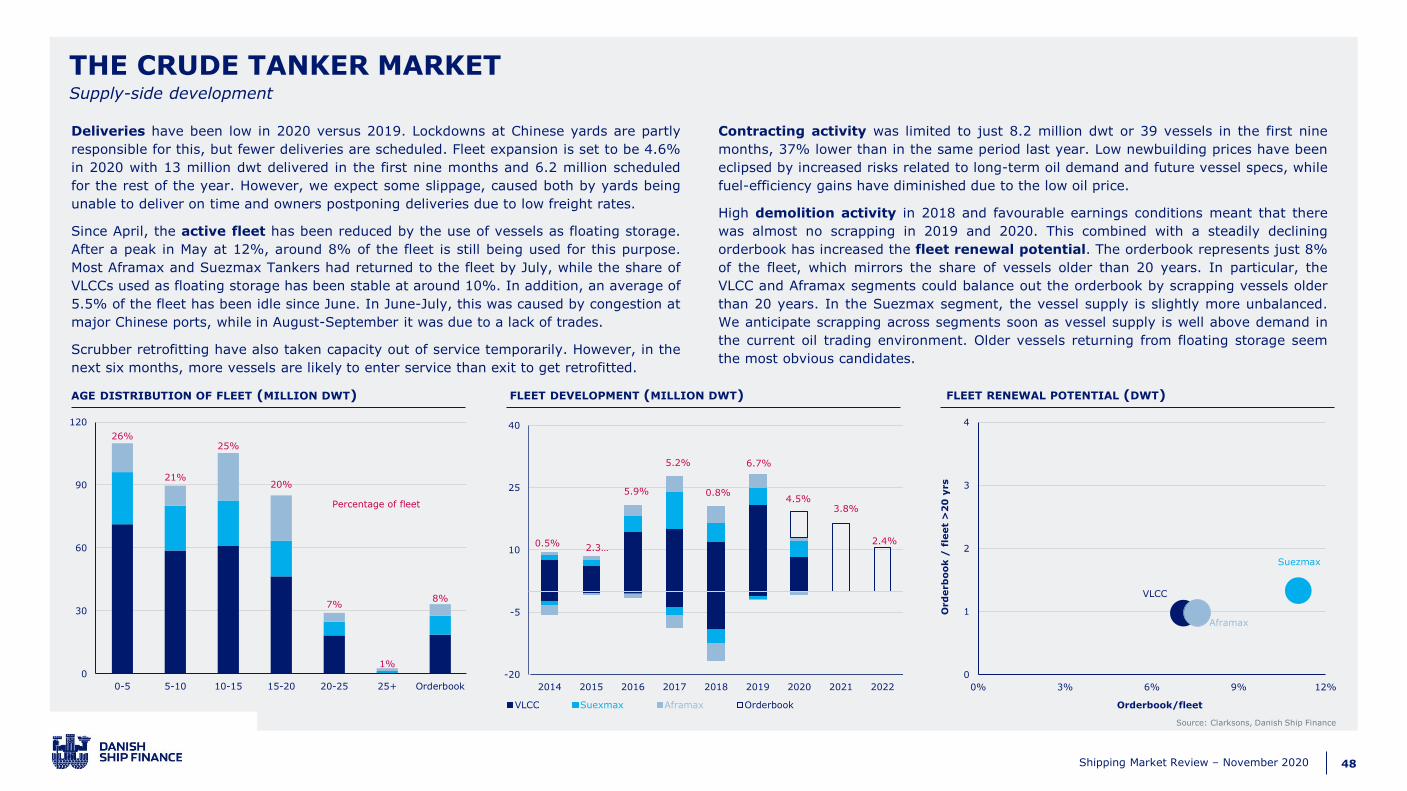
48Shipping Market Review – November 2020
THE CRUDE TANKER MARKET
Source: Clarksons, Danish Ship Finance
AGE DISTRIBUTION OF FLEET (MILLION DWT) FLEET DEVELOPMENT (MILLION DWT) FLEET RENEWAL POTENTIAL (DWT)
Supply-side development
Deliveries have been low in 2020 versus 2019. Lockdowns at Chinese yards are partly
responsible for this, but fewer deliveries are scheduled. Fleet expansion is set to be 4.6%
in 2020 with 13 million dwt delivered in the first nine months and 6.2 million scheduled
for the rest of the year. However, we expect some slippage, caused both by yards being
unable to deliver on time and owners postponing deliveries due to low freight rates.
Since April, the active fleet has been reduced by the use of vessels as floating storage.
After a peak in May at 12%, around 8% of the fleet is still being used for this purpose.
Most Aframax and Suezmax Tankers had returned to the fleet by July, while the share of
VLCCs used as floating storage has been stable at around 10%. In addition, an average of
5.5% of the fleet has been idle since June. In June-July, this was caused by congestion at
major Chinese ports, while in August-September it was due to a lack of trades.
Scrubber retrofitting have also taken capacity out of service temporarily. However, in the
next six months, more vessels are likely to enter service than exit to get retrofitted.
Contracting activity was limited to just 8.2 million dwt or 39 vessels in the first nine
months, 37% lower than in the same period last year. Low newbuilding prices have been
eclipsed by increased risks related to long-term oil demand and future vessel specs, while
fuel-efficiency gains have diminished due to the low oil price.
High demolition activity in 2018 and favourable earnings conditions meant that there
was almost no scrapping in 2019 and 2020. This combined with a steadily declining
orderbook has increased the fleet renewal potential. The orderbook represents just 8%
of the fleet, which mirrors the share of vessels older than 20 years. In particular, the
VLCC and Aframax segments could balance out the orderbook by scrapping vessels older
than 20 years. In the Suezmax segment, the vessel supply is slightly more unbalanced.
We anticipate scrapping across segments soon as vessel supply is well above demand in
the current oil trading environment. Older vessels returning from floating storage seem
the most obvious candidates.
26%
21%
25%
20%
7%
1%
8%
0
30
60
90
120
0-5 5-10 10-15 15-20 20-25 25+ Orderbook
Percentage of fleet
0.5%2.3…
5.9%
5.2%
0.8%
6.7%
4.5%3.8%
2.4%
-20
-5
10
25
40
2014 2015 2016 2017 2018 2019 2020 2021 2022
VLCC Suexmax Aframax Orderbook
VLCC
Suezmax
Aframax
0
1
2
3
4
0% 3% 6% 9% 12%
Ord
erb
oo
k /
fle
et
>2
0 y
rs
Orderbook/fleet
49Shipping Market Review – November 2020
Positive impactNegative impact ✓
Another round of restrictions to control the pandemic will keep oil demand low.
Most refinery expansions are closer to oil production, which will reduce travel distances.
Increased risks attached to newbuildings are keeping contracting low, while demolition potential is high.
The drive to cut carbon emissions will impact the Crude Tanker market negatively in the long term.
Covid-19 and second wave
Refinery expansion
Supply-side
Low oil price
Global decarbonisation
THE CRUDE TANKER MARKET Market outlook
A low oil price is reducing the competitiveness of US shale production. This could lower US exports and reduce travel distances.
✓
The short-term outlook is bleak. Onshore and offshore oil storage is still elevated. This
will cap vessel demand to some extent, while the return of most of the 140 vessels in
floating storage will increase the active fleet. This will put freight rates under further
pressure, as seaborne crude volumes are unlikely to return to 2019 levels until late 2021.
Gross fleet growth is set to 1.5% in the rest of 2020 and 3.8% in 2021. However,
scrapping is likely to pick up, as oversupply is building up. Before end-year 2021, 83
vessels are due for their fourth special survey. In addition, 22 vessels have passed fourth
special survey but are in floating storage or idle, and may struggle to find employment.
Scrapping these will balance out 90% of the capacity scheduled for delivery in the period.
Asia will continue to drive crude oil demand. Chinese imports are already above 2019
levels, and we expect the rest of Asia to follow suit in late 2021. European demand may
not recover at all as nations try to build back greener. The working from home trend is
also likely to continue to curb gasoline and jet fuel demand in developed countries.
Most US shale oil producers are unable to profit from an oil price below USD 45-50 per
barrel, a level that oil futures indicate will continue. The amount of active drilling rigs has
fallen 65% since March. Output from most shale wells drops by 70-90% after two years.
If the oil price stays low, US exports are may fall massively by late 2021. This will mainly
affect long-haul trade to Asia, in favour of the Middle East – reducing tonne-mile demand.
From a longer-term perspective, we may see more changes to trade flows. Many
European refineries have long been burdened by surplus capacity and risk closing. Such
closures would lead to imports being switched from crude oil to oil products. In addition,
the Middle East is securing some of the demand growth in India and South East Asia by
gearing local refinery expansions to Middle Eastern sour crude.
A manageable vessel supply-side represents an upside. Global decarbonisation will impact
the Crude Tanker market negatively in the long term, but opportunities may arise in the
medium term if vessel supply falls below demand. The large number of ships built in
2008-12 may become coveted, as most owners are reluctant to order new vessels.
FORCES AT WORK IMPACTING THE DEMAND OUTLOOK
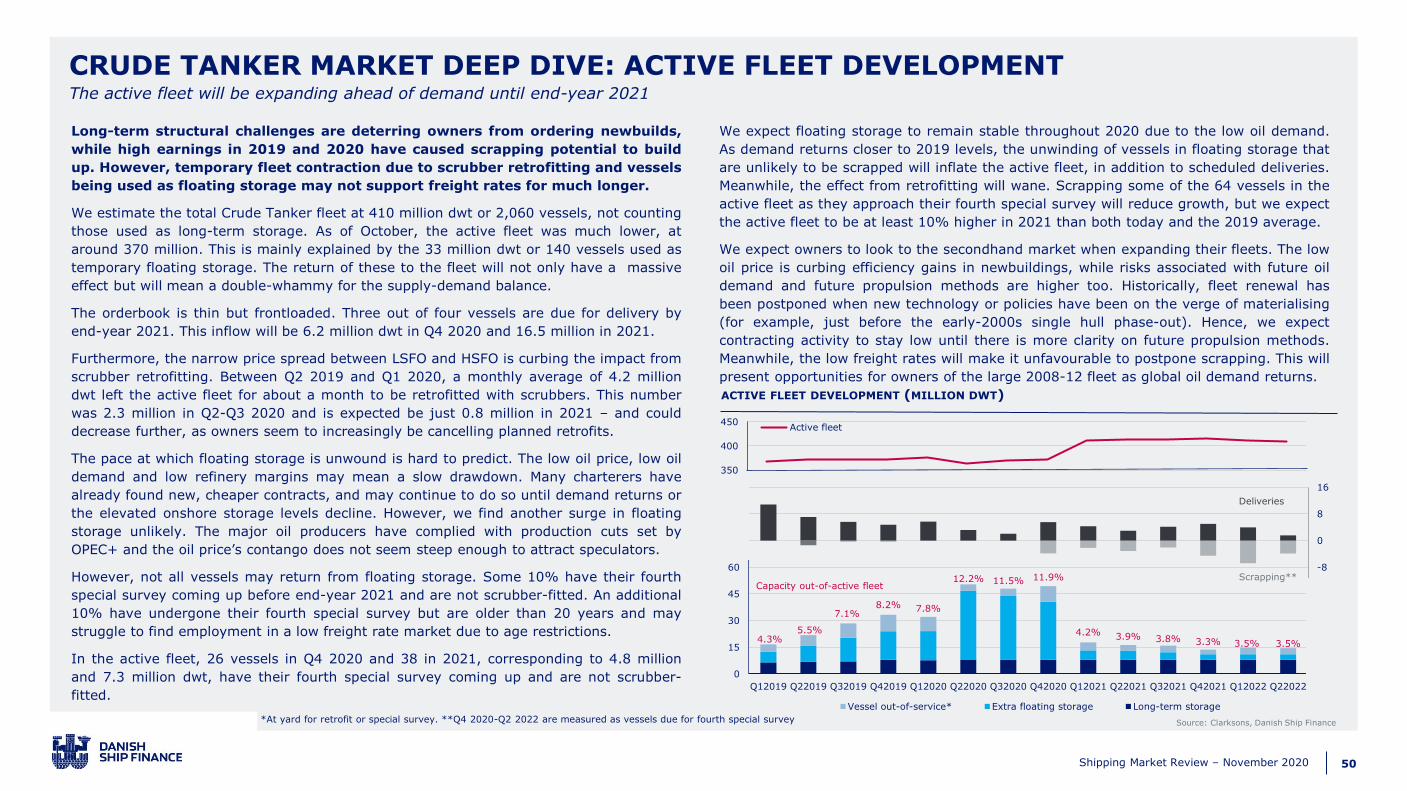
50Shipping Market Review – November 2020
Long-term structural challenges are deterring owners from ordering newbuilds,
while high earnings in 2019 and 2020 have caused scrapping potential to build
up. However, temporary fleet contraction due to scrubber retrofitting and vessels
being used as floating storage may not support freight rates for much longer.
We estimate the total Crude Tanker fleet at 410 million dwt or 2,060 vessels, not counting
those used as long-term storage. As of October, the active fleet was much lower, at
around 370 million. This is mainly explained by the 33 million dwt or 140 vessels used as
temporary floating storage. The return of these to the fleet will not only have a massive
effect but will mean a double-whammy for the supply-demand balance.
The orderbook is thin but frontloaded. Three out of four vessels are due for delivery by
end-year 2021. This inflow will be 6.2 million dwt in Q4 2020 and 16.5 million in 2021.
Furthermore, the narrow price spread between LSFO and HSFO is curbing the impact from
scrubber retrofitting. Between Q2 2019 and Q1 2020, a monthly average of 4.2 million
dwt left the active fleet for about a month to be retrofitted with scrubbers. This number
was 2.3 million in Q2-Q3 2020 and is expected be just 0.8 million in 2021 – and could
decrease further, as owners seem to increasingly be cancelling planned retrofits.
The pace at which floating storage is unwound is hard to predict. The low oil price, low oil
demand and low refinery margins may mean a slow drawdown. Many charterers have
already found new, cheaper contracts, and may continue to do so until demand returns or
the elevated onshore storage levels decline. However, we find another surge in floating
storage unlikely. The major oil producers have complied with production cuts set by
OPEC+ and the oil price’s contango does not seem steep enough to attract speculators.
However, not all vessels may return from floating storage. Some 10% have their fourth
special survey coming up before end-year 2021 and are not scrubber-fitted. An additional
10% have undergone their fourth special survey but are older than 20 years and may
struggle to find employment in a low freight rate market due to age restrictions.
In the active fleet, 26 vessels in Q4 2020 and 38 in 2021, corresponding to 4.8 million
and 7.3 million dwt, have their fourth special survey coming up and are not scrubber-
fitted.
We expect floating storage to remain stable throughout 2020 due to the low oil demand.
As demand returns closer to 2019 levels, the unwinding of vessels in floating storage that
are unlikely to be scrapped will inflate the active fleet, in addition to scheduled deliveries.
Meanwhile, the effect from retrofitting will wane. Scrapping some of the 64 vessels in the
active fleet as they approach their fourth special survey will reduce growth, but we expect
the active fleet to be at least 10% higher in 2021 than both today and the 2019 average.
We expect owners to look to the secondhand market when expanding their fleets. The low
oil price is curbing efficiency gains in newbuildings, while risks associated with future oil
demand and future propulsion methods are higher too. Historically, fleet renewal has
been postponed when new technology or policies have been on the verge of materialising
(for example, just before the early-2000s single hull phase-out). Hence, we expect
contracting activity to stay low until there is more clarity on future propulsion methods.
Meanwhile, the low freight rates will make it unfavourable to postpone scrapping. This will
present opportunities for owners of the large 2008-12 fleet as global oil demand returns.
4.3%5.5%
7.1%8.2% 7.8%
12.2% 11.5% 11.9%
4.2% 3.9% 3.8% 3.3% 3.5% 3.5%
-40
-32
-24
-16
-8
0
8
16
0
15
30
45
60
75
90
105
Q12019 Q22019 Q32019 Q42019 Q12020 Q22020 Q32020 Q42020 Q12021 Q22021 Q32021 Q42021 Q12022 Q22022
Vessel out-of-service* Extra floating storage Long-term storage
Deliveries
Scrapping**Capacity out-of-active fleet
CRUDE TANKER MARKET DEEP DIVE: ACTIVE FLEET DEVELOPMENT
Source: Clarksons, Danish Ship Finance
The active fleet will be expanding ahead of demand until end-year 2021
ACTIVE FLEET DEVELOPMENT (MILLION DWT)
350
400
450Active fleet
*At yard for retrofit or special survey. **Q4 2020-Q2 2022 are measured as vessels due for fourth special survey
51Shipping Market Review – November 2020
PRODUCT TANKERS
52Shipping Market Review – November 2020
OU
TLO
OK
SU
MM
AR
Y
POSITIVE
NEUTRAL
NEGATIVE
THE PRODUCT TANKER MARKET
WHERE WE ARE IN THE SHIP VALUE CYCLE
Perspectives and key takeaways
The short-term outlook for the Product Tanker market is
weak. Ships returning from floating storage are causing the
balance between supply and demand to deteriorate. Supply
is set to run ahead of demand until the end of 2021. After
2022, the market is positioned for a recovery if few new
orders are placed and demand continues to grow.
The Product Tanker market is in the early phase of a cyclical weakening. Weak demand
coupled with a supply side that is positioned for growth has upset the balance between
supply and demand. However, the outlook beyond 2022 is brighter, since the majority of
the current orderbook will have been delivered and demand should have regained the
lost territory.
It had been predicted that 2020 would be a year of high freight rates for Product
Tankers, since the implementation of the IMO 2020 sulphur cap was expected to
increase cargo movements while the active fleet was temporarily reduced by scrubber
retrofitting. It has been a year of super-spiked earnings, but the new regulation has
ended up playing a smaller role. Oil markets took centre stage when the combination of
a supply surge and a temporary demand drought led to all onshore oil inventories being
filled and created the perfect conditions for mass employment of Tanker vessels for
floating storage. The boom was expected to be short-lived, but many vessels are still
being employed as storage facilities.
The weak demand has lowered long-term earnings expectations for vessels. The impact
is most pronounced for the younger vessels, but all vessels are affected, since inventory
drawdowns are resulting in subdued demand while freeing up capacity.
We expect timecharter rates and spot rates to decline in the short-term and stay low
until demand recovers enough to restore market balance. Some seasonal relief may be
sdfsd
visible during the winter, but this is likely to be only temporary. Using current prices and
charter rates we find that the market expect charter rates to be in the lowest 10%
observed since 2000, once floating storage has fully unwonted. This create the potential
for some additional downside risk to secondhand prices.
The orderbook is emptying quickly. This will create some imbalances this year and next,
but from 2022 onwards the outlook is brighter. Demand is expected to trail supply until
late 2021 or early 2022. For freight rates to improve, surplus vessel capacity needs to be
scrapped or employed. Balance may not be restored until after 2022.
The long-term outlook is not without risk. Some observers are discussing whether peak
oil demand could already be behind us. We believe it is pre-mature call and think a peak
oil somewhere in the 2020’s is more likely, but it cannot be ruled out. However, it raises
some important questions for the Product Tanker market; what will happen to global
refinery capacity? Will it continue to grow or will some older, less efficient facilities close?
Can we expect seaborne volumes to stagnate or even decline when travel distances
shorten?
The uncertain demand outlook combined with the many unknowns regarding the next-
generation zero-carbon vessels are likely to keep ordering of new vessels low in the short
to medium-term. There are no guarantees – contracting activity has surprised in the past
– but this remains our base case and seems to be a prerequisite for a medium-term
recovery in freight rates.
LR2
LR1M
53Shipping Market Review – November 2020
THE PRODUCT TANKER MARKET
ONE-YEAR TIMECHARTER RATES (USD PER DAY)
Source: Clarksons, Danish Ship Finance
Freight rates and ship prices
Freight rates have increased strongly in 2020, even though supply has expanded ahead of
demand. The Product Tanker fleet grew by 2.3% during the first ten months of 2020,
while the global lockdowns and economic repercussions of the Covid-19 pandemic
reduced seaborne volumes significantly. In the first seven months of the year, export
volumes dropped by about 11% and we expect a decline of 6-7% for the full year.
The balance between supply and demand was temporarily improved when capacity
equivalent to 0.6% of the fleet was taken out of service to be retrofitted with scrubbers.
However, the source of freight rate improvements was vessels being employed as floating
storage, either directly or indirectly through infrastructural bottlenecks at ports. Storage
ballooned in April and May, causing a spike in earnings. From mid-May ships started to
return to the fleet from floating storage while fewer ships are tied up in port congestion or
undergoing scrubber retrofitting. At the same time seaborn volumes remain weak. This
lowered fleet utilisation and drove down charter and spot rates.
MR tankers have seen the most pronounced decline in the balance between supply and
demand, since the fleet has expanded by 2.8% while demand has contracted by 7.2%.
Still, the extensive use of MRs as floating storage is supporting the market.
Timecharter rates have declined by 30% on average since the peak in May and are now
20% lower than in January 2020. Secondhand prices have followed a similar, albeit less
volatile, trajectory. For five-year-old MRs and LR2s, prices have come down by about 15%
since their peak in March, while prices for LR1s have declined by about 10%. For MRs, the
magnitude of the decline decreases with age, whereas the opposite is the case for LR1s. A
15-year-old MR has seen its price fall 8% since the peak, while the price of an LR1 of
similar age has declined 13%.
SECONDHAND PRICES FOR A FIVE-YEAR-OLD VESSEL (USD MILLION)
0
9.000
18.000
27.000
36.000
2014 2015 2016 2017 2018 2019 2020
LR2 LR1 MR
0
15
30
45
60
2014 2015 2016 2017 2018 2019 2020
54Shipping Market Review – November 2020
THE PRODUCT TANKER MARKET
Source: Clarksons, Danish Ship Finance
AGE DISTRIBUTION OF FLEET (MILLION DWT) FLEET DEVELOPMENT (MILLION DWT) FLEET RENEWAL POTENTIAL (DWT)
Supply-side development
In the first ten months of 2020, the Product Tanker fleet grew by 2.3%, as a result of
deliveries and little scrapping due to low rates. Only 15 Product Tankers were scrapped,
six of which were built in the 1970s and 1980s. At the same time, postponements
increased to 18% from last year’s low of 4%, on a par with the levels in the period 2016-
18. This held back fleet growth by about 0.5%. The orderbook is now down to just 6% of
the fleet, the lowest level on record. The lion’s share of new vessels are due to be
delivered in the next 12 months; just one vessel has a delivery date after 2022.
The Product Tanker market is in the process of absorbing vessels used as floating storage
due to the large oversupply of oil in the first half of 2020. The high point of this was
reached in May, when 239 Product Tankers were used as floating storage. This number
was down to 86 vessels as of mid-October. Normally, fewer than ten ships are used for
storage at any one time, meaning vessel supply could suddenly increase by as much as
2%.
If demand fails to employ the incoming vessels, the orderbook can be absorbed by
removing the oldest ship in the fleet each time a new vessel is delivered, maintaining an
average scrapping age of about 25 years. This stylised methodology will mean average
scrapping ages of 22, 24 and 28 for LR2s, LR1s and MRs, respectively, up to 2023.
Even if an average scrapping age of about 25 years can be maintained, vessels younger
than this will still have to be demolished. Using the above methodology, LR2s as young as
19 years of age may have to be scrapped (22 years for LR1s and 23 years for MRs).
Travel restrictions, strong earnings and a weak outlook have held back transaction
volumes for both secondhand vessels and newbuildings. Only 63 vessels have changed
hands this year, down from 164 in 2019. Moreover, 59 newbuilding contracts have been
signed, down from about 100 annually in both 2018 and 2019. Of these newbuilding
contracts, 12 were an en bloc deal for dual-fuelled LR2s with long charter contracts with
Shell, which means that ordinary contracting has been even lower.
21% 20%
36%
17%
5%
1%
6%
0
18
35
53
70
0-5 5-10 10-15 15-20 20-25 25+ Orderbook
Percentage of fleet
4%
6%
6%
4%
2%
5%
4% 4%
1%
-5
0
5
10
2014 2015 2016 2017 2018 2019 2020 2021 2022
LR2 LR1 MR Orderbook
Percentage of fleet
LR2
LR1
MR
0
0,6
1,2
1,8
2,4
0 0,03 0,06 0,09 0,12
Ord
erb
oo
k /
fle
et
>2
0 y
rs
Orderbook/fleet
55Shipping Market Review – November 2020
Positive impactNegative impact ✓
FORCES AT WORK IMPACTING THE DEMAND OUTLOOK
Covid-19 has lowered demand for oil products. A second wave of the pandemic will prolong the recovery.
The fleet has temporarily shrunk due to scrubber retrofitting and vessels being used as floating storage. Once these one-off effects disappear, the fleet will be larger while demand remains the same.
The number of deliveries and scrapping candidates are set to be balanced until 2022, and thereafter the fleet size may decline. This creates potential for a Product Tanker boom.
Asia continues to add petrochemical capacity. This indicates increasing volumes and longer travel distances for naphtha.
Covid-19 and second wave
Ships returning to active fleet
Low orderbook
Changing trade patterns
Increasing naphtha imports in Asia
The Product Tanker market is in the early phase of a cyclical weakening, but the medium-
term outlook is brighter due to the low orderbook.
The short-term demand outlook for Product Tankers is weak amid low oil demand and
large inventories. At the same time, the number of ships in the fleet is increasing as a
result of deliveries and ships returning from floating storage. We expect demand to fall 6-
7% in 2020 followed by a rebound of about 6% in 2021. This implies that seaborne
volumes will still be about 6% below the peak in 2018. Since January 2018, supply has
expanded by 8%, and a further 6% of the fleet is scheduled to be delivered by 2022.
The decline in demand and expansion of the fleet has led to the weakest supply-demand
balance on record and it is unlikely to improve in the short-term. The average ship in the
Product Tanker fleet is expected to carry approximately 310,000 tonnes this year, down
from about 340,000 tonnes in 2019. Even if demand recovers fully to 2018 levels, the
supply-demand balance will still be the third weakest since 2000. Both years when the
balance were weaker were supported by temporary supply contractions. This is unlikely to
be repeated, meaning the lows of 2017 and 2018 could be tested during the coming year,
even if demand recovers.
In the medium to long-term, the market outlook is much better. Demand is gradually
returning, and fleet growth is slowing, possibly contracting from 2023. However, the
medium to long-term outlook is not without downside risk. Newbuilding ordering could
return, spurred by the expected medium-term improvement in the market, and global oil
demand could decline. Our base case remains that oil demand return to about 100 mb/d
in two to three years, and peak oil demand is sometime in the mid-2020’s. However, the
market visibility is very low. Postponements in car adaption in developing markets due to
lower economic growth, engine efficiency improvements and electric car market
penetration may cause a lower rebound in oil demand possibly somewhere in the 90’s
mb/d. Moreover, we see possible scenarios where oil product trade flows could become
more regionalised, lowering seaborne volumes and travel distances.
THE PRODUCT TANKER MARKETMarket outlook
New refinery capacity closer to end users and petrochemical plants may mean lower seaborne volumes.
✓
✓
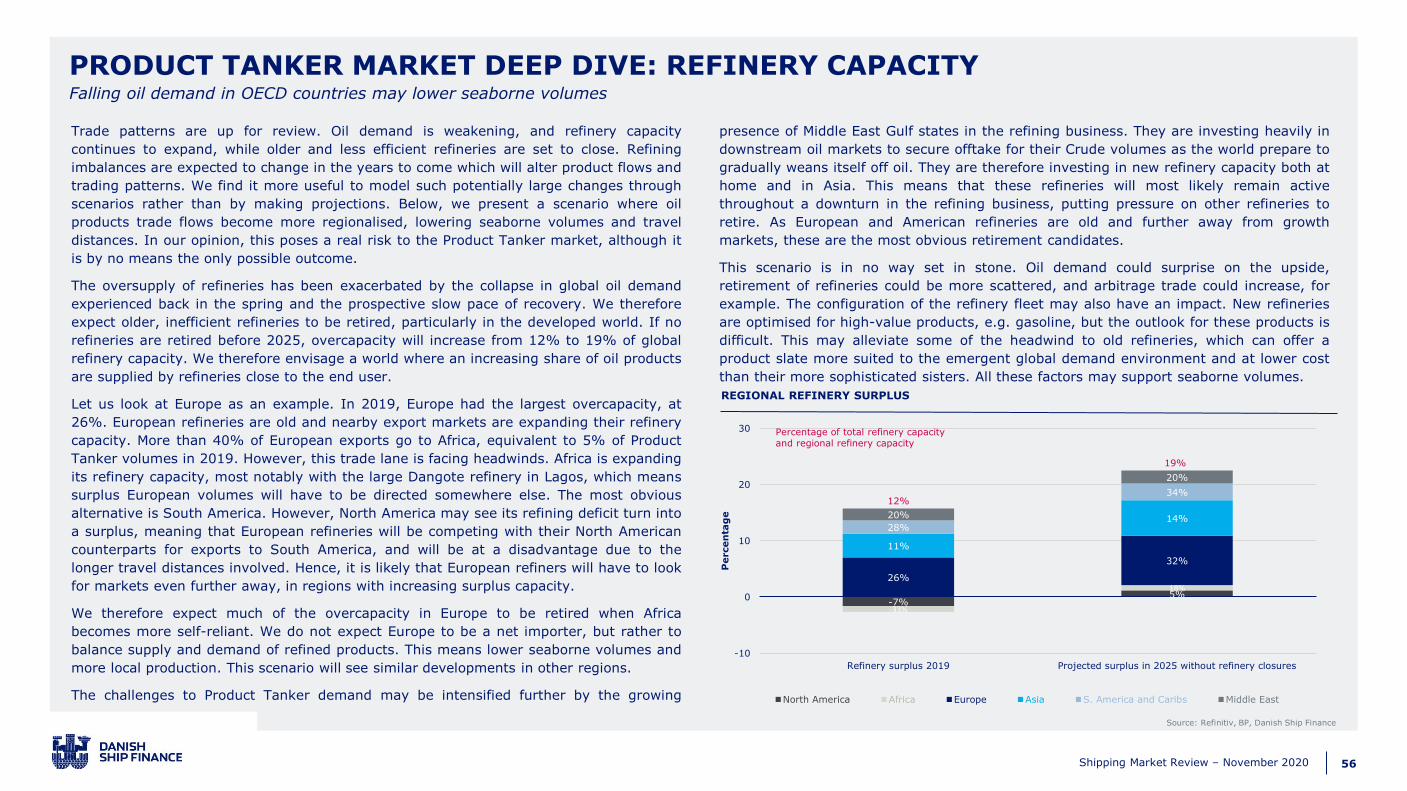
56Shipping Market Review – November 2020
Trade patterns are up for review. Oil demand is weakening, and refinery capacity
continues to expand, while older and less efficient refineries are set to close. Refining
imbalances are expected to change in the years to come which will alter product flows and
trading patterns. We find it more useful to model such potentially large changes through
scenarios rather than by making projections. Below, we present a scenario where oil
products trade flows become more regionalised, lowering seaborne volumes and travel
distances. In our opinion, this poses a real risk to the Product Tanker market, although it
is by no means the only possible outcome.
The oversupply of refineries has been exacerbated by the collapse in global oil demand
experienced back in the spring and the prospective slow pace of recovery. We therefore
expect older, inefficient refineries to be retired, particularly in the developed world. If no
refineries are retired before 2025, overcapacity will increase from 12% to 19% of global
refinery capacity. We therefore envisage a world where an increasing share of oil products
are supplied by refineries close to the end user.
Let us look at Europe as an example. In 2019, Europe had the largest overcapacity, at
26%. European refineries are old and nearby export markets are expanding their refinery
capacity. More than 40% of European exports go to Africa, equivalent to 5% of Product
Tanker volumes in 2019. However, this trade lane is facing headwinds. Africa is expanding
its refinery capacity, most notably with the large Dangote refinery in Lagos, which means
surplus European volumes will have to be directed somewhere else. The most obvious
alternative is South America. However, North America may see its refining deficit turn into
a surplus, meaning that European refineries will be competing with their North American
counterparts for exports to South America, and will be at a disadvantage due to the
longer travel distances involved. Hence, it is likely that European refiners will have to look
for markets even further away, in regions with increasing surplus capacity.
We therefore expect much of the overcapacity in Europe to be retired when Africa
becomes more self-reliant. We do not expect Europe to be a net importer, but rather to
balance supply and demand of refined products. This means lower seaborne volumes and
more local production. This scenario will see similar developments in other regions.
The challenges to Product Tanker demand may be intensified further by the growing
presence of Middle East Gulf states in the refining business. They are investing heavily in
downstream oil markets to secure offtake for their Crude volumes as the world prepare to
gradually weans itself off oil. They are therefore investing in new refinery capacity both at
home and in Asia. This means that these refineries will most likely remain active
throughout a downturn in the refining business, putting pressure on other refineries to
retire. As European and American refineries are old and further away from growth
markets, these are the most obvious retirement candidates.
This scenario is in no way set in stone. Oil demand could surprise on the upside,
retirement of refineries could be more scattered, and arbitrage trade could increase, for
example. The configuration of the refinery fleet may also have an impact. New refineries
are optimised for high-value products, e.g. gasoline, but the outlook for these products is
difficult. This may alleviate some of the headwind to old refineries, which can offer a
product slate more suited to the emergent global demand environment and at lower cost
than their more sophisticated sisters. All these factors may support seaborne volumes.
PRODUCT TANKER MARKET DEEP DIVE: REFINERY CAPACITY
Source: Refinitiv, BP, Danish Ship Finance
Falling oil demand in OECD countries may lower seaborne volumes
REGIONAL REFINERY SURPLUS
-7%5%
-33%
18%26%
32%
11%
14%28%
34%
20%
20%
12%
19%
-10
0
10
20
30
Refinery surplus 2019 Projected surplus in 2025 without refinery closures
Percen
tag
e
North America Africa Europe Asia S. America and Caribs Middle East
Percentage of total refinery capacityand regional refinery capacity

57Shipping Market Review – November 2020
LPG CARRIERS
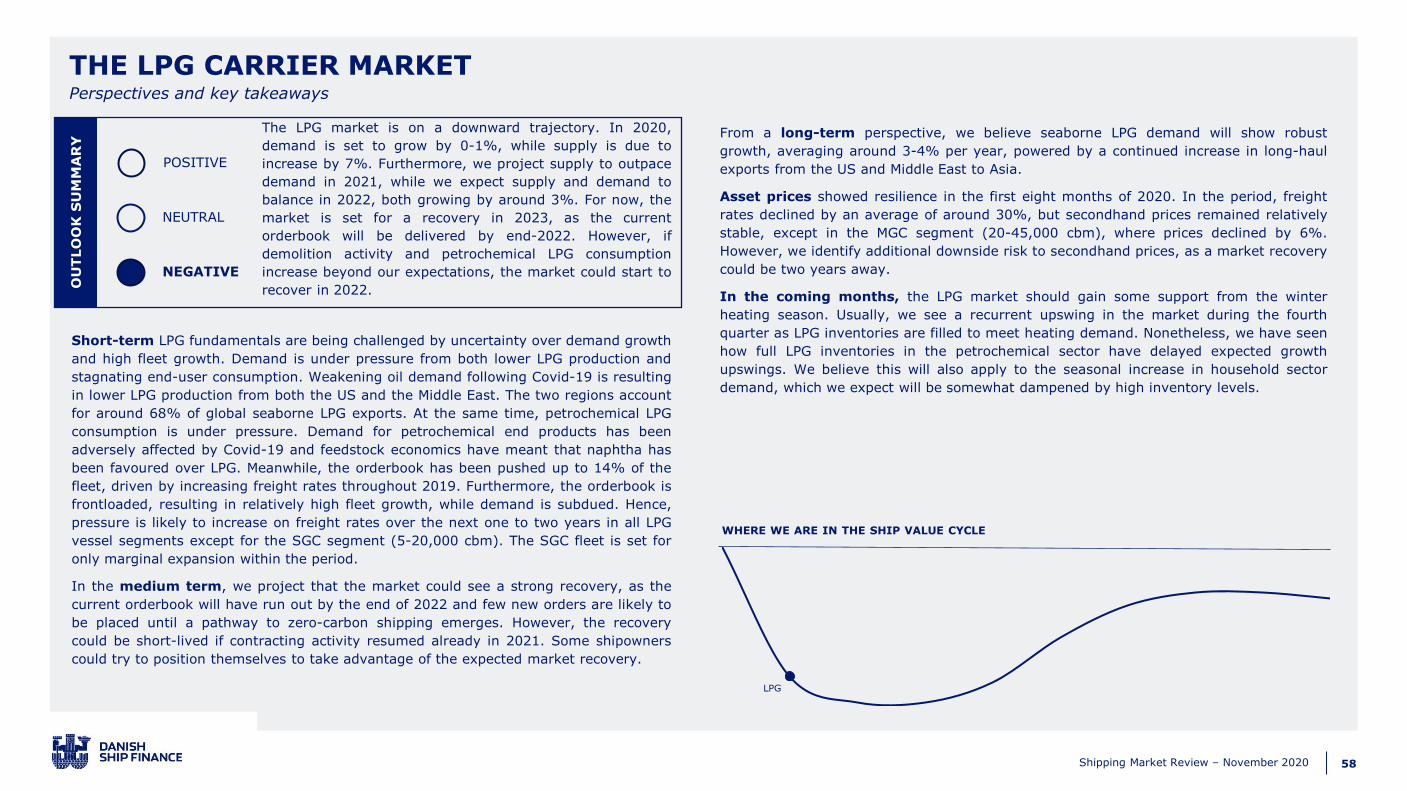
58Shipping Market Review – November 2020
OU
TLO
OK
SU
MM
AR
Y
POSITIVE
NEUTRAL
NEGATIVE
THE LPG CARRIER MARKET
WHERE WE ARE IN THE SHIP VALUE CYCLE
Perspectives and key takeaways
The LPG market is on a downward trajectory. In 2020,
demand is set to grow by 0-1%, while supply is due to
increase by 7%. Furthermore, we project supply to outpace
demand in 2021, while we expect supply and demand to
balance in 2022, both growing by around 3%. For now, the
market is set for a recovery in 2023, as the current
orderbook will be delivered by end-2022. However, if
demolition activity and petrochemical LPG consumption
increase beyond our expectations, the market could start to
recover in 2022.
Short-term LPG fundamentals are being challenged by uncertainty over demand growth
and high fleet growth. Demand is under pressure from both lower LPG production and
stagnating end-user consumption. Weakening oil demand following Covid-19 is resulting
in lower LPG production from both the US and the Middle East. The two regions account
for around 68% of global seaborne LPG exports. At the same time, petrochemical LPG
consumption is under pressure. Demand for petrochemical end products has been
adversely affected by Covid-19 and feedstock economics have meant that naphtha has
been favoured over LPG. Meanwhile, the orderbook has been pushed up to 14% of the
fleet, driven by increasing freight rates throughout 2019. Furthermore, the orderbook is
frontloaded, resulting in relatively high fleet growth, while demand is subdued. Hence,
pressure is likely to increase on freight rates over the next one to two years in all LPG
vessel segments except for the SGC segment (5-20,000 cbm). The SGC fleet is set for
only marginal expansion within the period.
In the medium term, we project that the market could see a strong recovery, as the
current orderbook will have run out by the end of 2022 and few new orders are likely to
be placed until a pathway to zero-carbon shipping emerges. However, the recovery
could be short-lived if contracting activity resumed already in 2021. Some shipowners
could try to position themselves to take advantage of the expected market recovery.
From a long-term perspective, we believe seaborne LPG demand will show robust
growth, averaging around 3-4% per year, powered by a continued increase in long-haul
exports from the US and Middle East to Asia.
Asset prices showed resilience in the first eight months of 2020. In the period, freight
rates declined by an average of around 30%, but secondhand prices remained relatively
stable, except in the MGC segment (20-45,000 cbm), where prices declined by 6%.
However, we identify additional downside risk to secondhand prices, as a market recovery
could be two years away.
In the coming months, the LPG market should gain some support from the winter
heating season. Usually, we see a recurrent upswing in the market during the fourth
quarter as LPG inventories are filled to meet heating demand. Nonetheless, we have seen
how full LPG inventories in the petrochemical sector have delayed expected growth
upswings. We believe this will also apply to the seasonal increase in household sector
demand, which we expect will be somewhat dampened by high inventory levels.
LPG
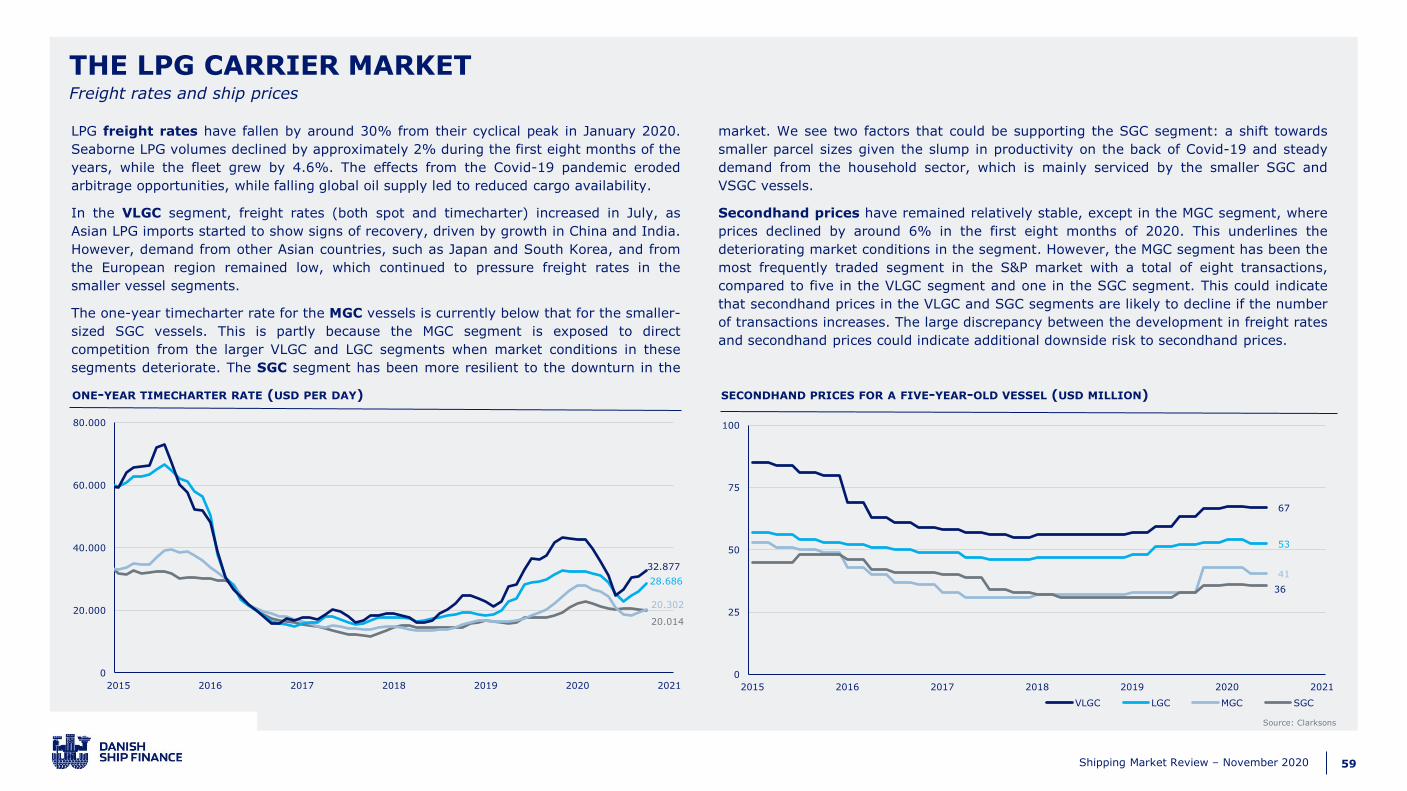
59Shipping Market Review – November 2020
THE LPG CARRIER MARKET
ONE-YEAR TIMECHARTER RATE (USD PER DAY)
Source: Clarksons
Freight rates and ship prices
SECONDHAND PRICES FOR A FIVE-YEAR-OLD VESSEL (USD MILLION)
20.014
20.302
28.686
32.877
0
20.000
40.000
60.000
80.000
2015 2016 2017 2018 2019 2020 2021
67
53
41
36
0
25
50
75
100
2015 2016 2017 2018 2019 2020 2021
VLGC LGC MGC SGC
LPG freight rates have fallen by around 30% from their cyclical peak in January 2020.
Seaborne LPG volumes declined by approximately 2% during the first eight months of the
years, while the fleet grew by 4.6%. The effects from the Covid-19 pandemic eroded
arbitrage opportunities, while falling global oil supply led to reduced cargo availability.
In the VLGC segment, freight rates (both spot and timecharter) increased in July, as
Asian LPG imports started to show signs of recovery, driven by growth in China and India.
However, demand from other Asian countries, such as Japan and South Korea, and from
the European region remained low, which continued to pressure freight rates in the
smaller vessel segments.
The one-year timecharter rate for the MGC vessels is currently below that for the smaller-
sized SGC vessels. This is partly because the MGC segment is exposed to direct
competition from the larger VLGC and LGC segments when market conditions in these
segments deteriorate. The SGC segment has been more resilient to the downturn in the
market. We see two factors that could be supporting the SGC segment: a shift towards
smaller parcel sizes given the slump in productivity on the back of Covid-19 and steady
demand from the household sector, which is mainly serviced by the smaller SGC and
VSGC vessels.
Secondhand prices have remained relatively stable, except in the MGC segment, where
prices declined by around 6% in the first eight months of 2020. This underlines the
deteriorating market conditions in the segment. However, the MGC segment has been the
most frequently traded segment in the S&P market with a total of eight transactions,
compared to five in the VLGC segment and one in the SGC segment. This could indicate
that secondhand prices in the VLGC and SGC segments are likely to decline if the number
of transactions increases. The large discrepancy between the development in freight rates
and secondhand prices could indicate additional downside risk to secondhand prices.
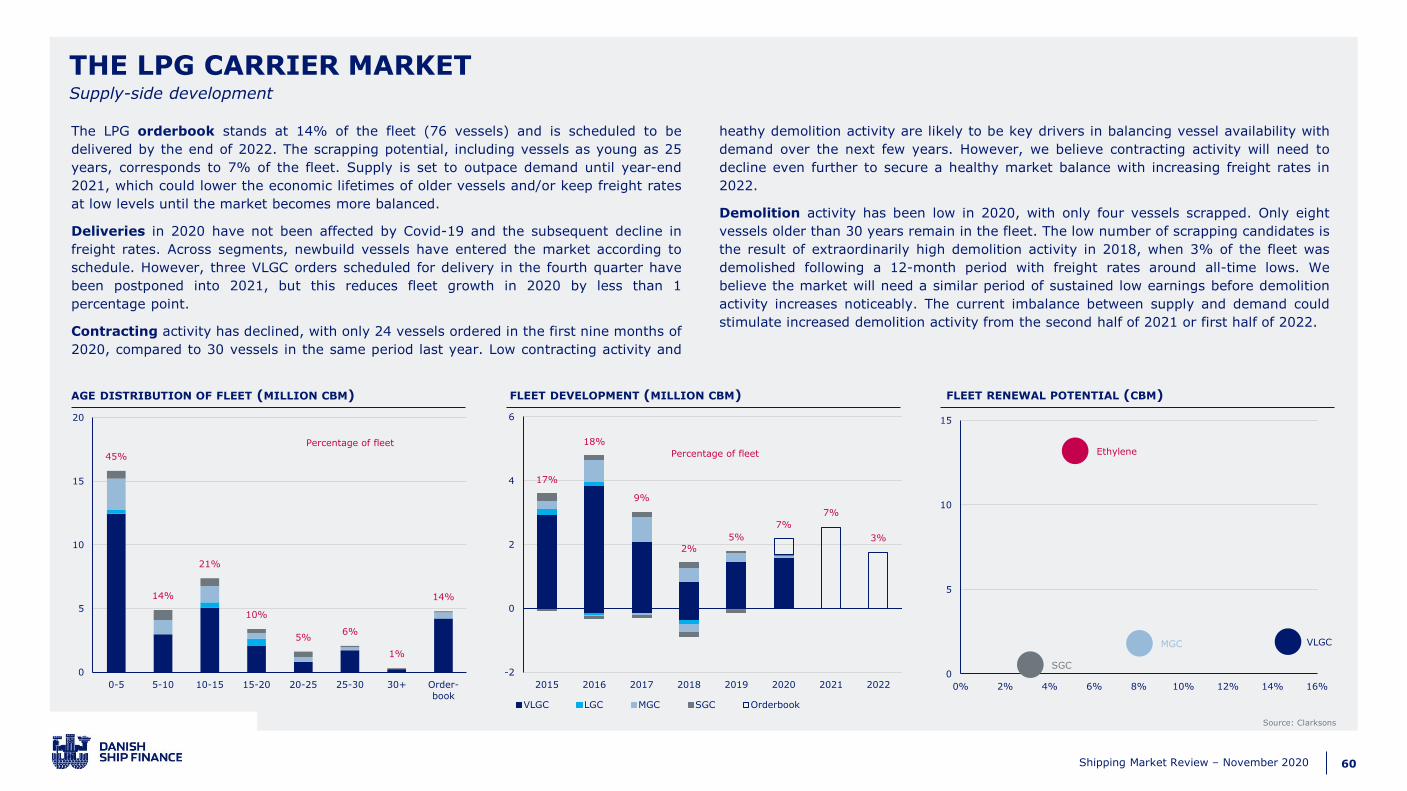
60Shipping Market Review – November 2020
THE LPG CARRIER MARKET
Source: Clarksons
AGE DISTRIBUTION OF FLEET (MILLION CBM) FLEET DEVELOPMENT (MILLION CBM) FLEET RENEWAL POTENTIAL (CBM)
Supply-side development
The LPG orderbook stands at 14% of the fleet (76 vessels) and is scheduled to be
delivered by the end of 2022. The scrapping potential, including vessels as young as 25
years, corresponds to 7% of the fleet. Supply is set to outpace demand until year-end
2021, which could lower the economic lifetimes of older vessels and/or keep freight rates
at low levels until the market becomes more balanced.
Deliveries in 2020 have not been affected by Covid-19 and the subsequent decline in
freight rates. Across segments, newbuild vessels have entered the market according to
schedule. However, three VLGC orders scheduled for delivery in the fourth quarter have
been postponed into 2021, but this reduces fleet growth in 2020 by less than 1
percentage point.
Contracting activity has declined, with only 24 vessels ordered in the first nine months of
2020, compared to 30 vessels in the same period last year. Low contracting activity and
heathy demolition activity are likely to be key drivers in balancing vessel availability with
demand over the next few years. However, we believe contracting activity will need to
decline even further to secure a healthy market balance with increasing freight rates in
2022.
Demolition activity has been low in 2020, with only four vessels scrapped. Only eight
vessels older than 30 years remain in the fleet. The low number of scrapping candidates is
the result of extraordinarily high demolition activity in 2018, when 3% of the fleet was
demolished following a 12-month period with freight rates around all-time lows. We
believe the market will need a similar period of sustained low earnings before demolition
activity increases noticeably. The current imbalance between supply and demand could
stimulate increased demolition activity from the second half of 2021 or first half of 2022.
45%
14%
21%
10%
5%6%
1%
14%
0
5
10
15
20
0-5 5-10 10-15 15-20 20-25 25-30 30+ Order-
book
Percentage of fleet
VLGCMGC
SGC
Ethylene
0
5
10
15
0% 2% 4% 6% 8% 10% 12% 14% 16%
17%
18%
9%
2%
5%
7%
7%
3%
-2
0
2
4
6
2015 2016 2017 2018 2019 2020 2021 2022
VLGC LGC MGC SGC Orderbook
Percentage of fleet
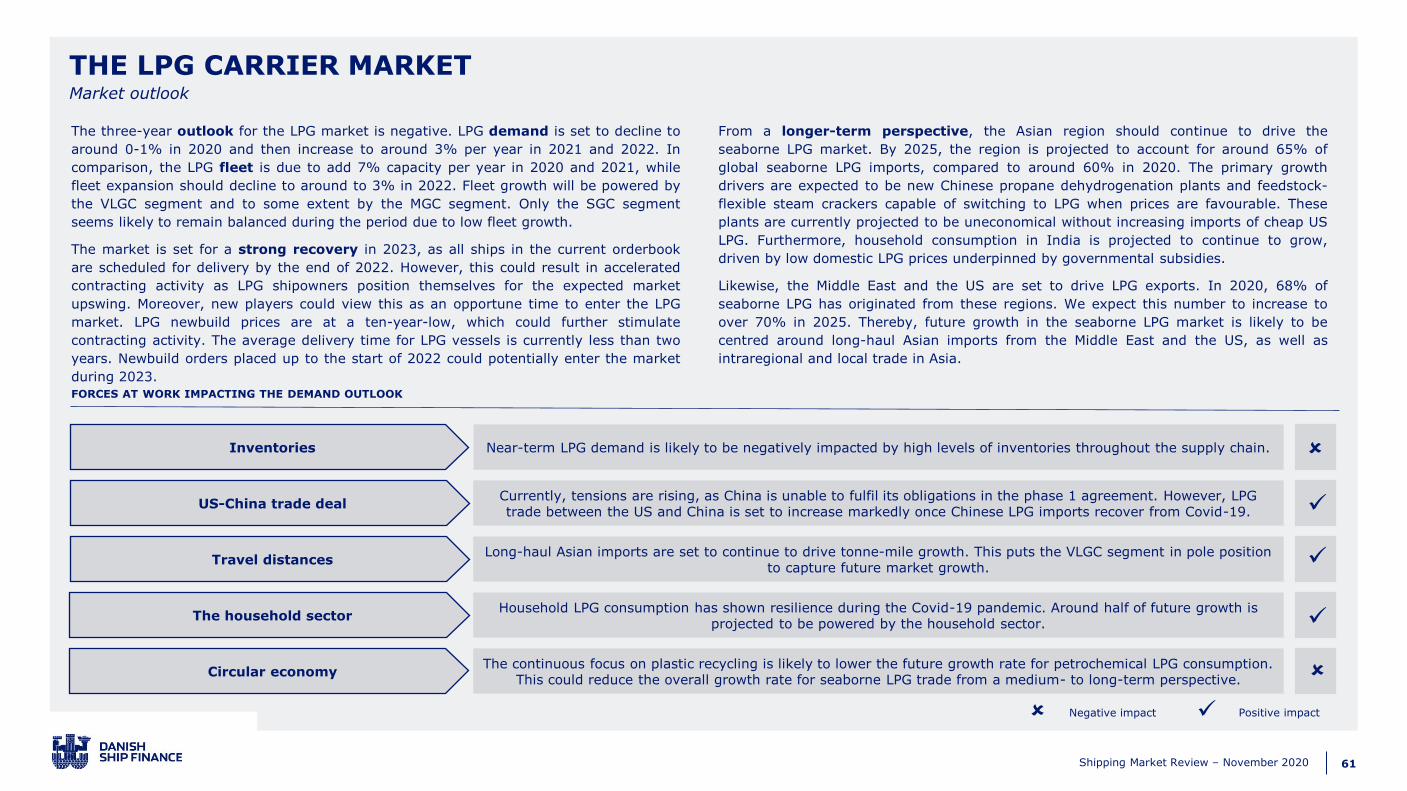
61Shipping Market Review – November 2020
Positive impactNegative impact ✓
FORCES AT WORK IMPACTING THE DEMAND OUTLOOK
Near-term LPG demand is likely to be negatively impacted by high levels of inventories throughout the supply chain.
Currently, tensions are rising, as China is unable to fulfil its obligations in the phase 1 agreement. However, LPG trade between the US and China is set to increase markedly once Chinese LPG imports recover from Covid-19.
Long-haul Asian imports are set to continue to drive tonne-mile growth. This puts the VLGC segment in pole position to capture future market growth.
The continuous focus on plastic recycling is likely to lower the future growth rate for petrochemical LPG consumption. This could reduce the overall growth rate for seaborne LPG trade from a medium- to long-term perspective.
Inventories
US-China trade deal
Travel distances
The household sector
Circular economy
The three-year outlook for the LPG market is negative. LPG demand is set to decline to
around 0-1% in 2020 and then increase to around 3% per year in 2021 and 2022. In
comparison, the LPG fleet is due to add 7% capacity per year in 2020 and 2021, while
fleet expansion should decline to around to 3% in 2022. Fleet growth will be powered by
the VLGC segment and to some extent by the MGC segment. Only the SGC segment
seems likely to remain balanced during the period due to low fleet growth.
The market is set for a strong recovery in 2023, as all ships in the current orderbook
are scheduled for delivery by the end of 2022. However, this could result in accelerated
contracting activity as LPG shipowners position themselves for the expected market
upswing. Moreover, new players could view this as an opportune time to enter the LPG
market. LPG newbuild prices are at a ten-year-low, which could further stimulate
contracting activity. The average delivery time for LPG vessels is currently less than two
years. Newbuild orders placed up to the start of 2022 could potentially enter the market
during 2023.
From a longer-term perspective, the Asian region should continue to drive the
seaborne LPG market. By 2025, the region is projected to account for around 65% of
global seaborne LPG imports, compared to around 60% in 2020. The primary growth
drivers are expected to be new Chinese propane dehydrogenation plants and feedstock-
flexible steam crackers capable of switching to LPG when prices are favourable. These
plants are currently projected to be uneconomical without increasing imports of cheap US
LPG. Furthermore, household consumption in India is projected to continue to grow,
driven by low domestic LPG prices underpinned by governmental subsidies.
Likewise, the Middle East and the US are set to drive LPG exports. In 2020, 68% of
seaborne LPG has originated from these regions. We expect this number to increase to
over 70% in 2025. Thereby, future growth in the seaborne LPG market is likely to be
centred around long-haul Asian imports from the Middle East and the US, as well as
intraregional and local trade in Asia.
THE LPG CARRIER MARKETMarket outlook
Household LPG consumption has shown resilience during the Covid-19 pandemic. Around half of future growth is projected to be powered by the household sector.
✓
✓
✓
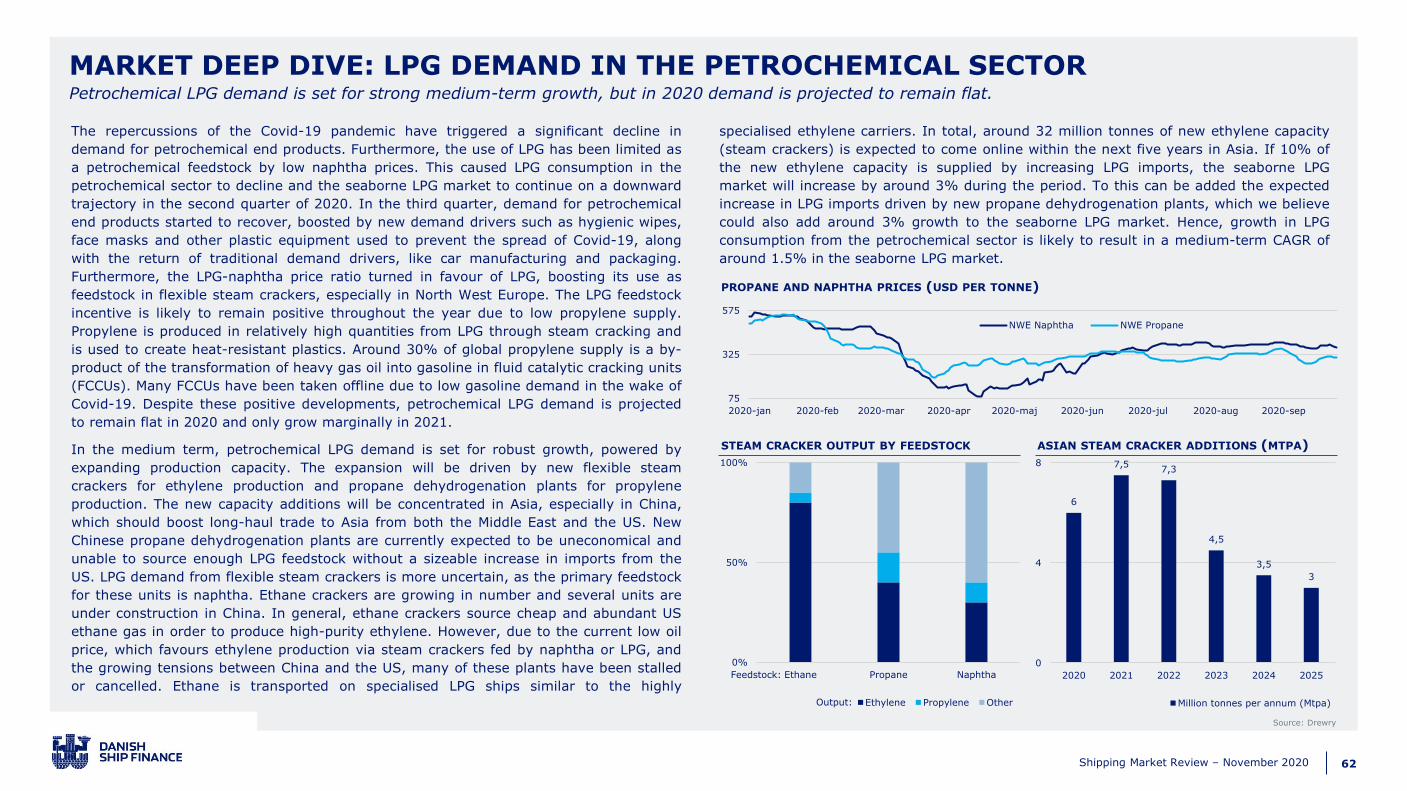
62Shipping Market Review – November 2020
The repercussions of the Covid-19 pandemic have triggered a significant decline in
demand for petrochemical end products. Furthermore, the use of LPG has been limited as
a petrochemical feedstock by low naphtha prices. This caused LPG consumption in the
petrochemical sector to decline and the seaborne LPG market to continue on a downward
trajectory in the second quarter of 2020. In the third quarter, demand for petrochemical
end products started to recover, boosted by new demand drivers such as hygienic wipes,
face masks and other plastic equipment used to prevent the spread of Covid-19, along
with the return of traditional demand drivers, like car manufacturing and packaging.
Furthermore, the LPG-naphtha price ratio turned in favour of LPG, boosting its use as
feedstock in flexible steam crackers, especially in North West Europe. The LPG feedstock
incentive is likely to remain positive throughout the year due to low propylene supply.
Propylene is produced in relatively high quantities from LPG through steam cracking and
is used to create heat-resistant plastics. Around 30% of global propylene supply is a by-
product of the transformation of heavy gas oil into gasoline in fluid catalytic cracking units
(FCCUs). Many FCCUs have been taken offline due to low gasoline demand in the wake of
Covid-19. Despite these positive developments, petrochemical LPG demand is projected
to remain flat in 2020 and only grow marginally in 2021.
In the medium term, petrochemical LPG demand is set for robust growth, powered by
expanding production capacity. The expansion will be driven by new flexible steam
crackers for ethylene production and propane dehydrogenation plants for propylene
production. The new capacity additions will be concentrated in Asia, especially in China,
which should boost long-haul trade to Asia from both the Middle East and the US. New
Chinese propane dehydrogenation plants are currently expected to be uneconomical and
unable to source enough LPG feedstock without a sizeable increase in imports from the
US. LPG demand from flexible steam crackers is more uncertain, as the primary feedstock
for these units is naphtha. Ethane crackers are growing in number and several units are
under construction in China. In general, ethane crackers source cheap and abundant US
ethane gas in order to produce high-purity ethylene. However, due to the current low oil
price, which favours ethylene production via steam crackers fed by naphtha or LPG, and
the growing tensions between China and the US, many of these plants have been stalled
or cancelled. Ethane is transported on specialised LPG ships similar to the highly
specialised ethylene carriers. In total, around 32 million tonnes of new ethylene capacity
(steam crackers) is expected to come online within the next five years in Asia. If 10% of
the new ethylene capacity is supplied by increasing LPG imports, the seaborne LPG
market will increase by around 3% during the period. To this can be added the expected
increase in LPG imports driven by new propane dehydrogenation plants, which we believe
could also add around 3% growth to the seaborne LPG market. Hence, growth in LPG
consumption from the petrochemical sector is likely to result in a medium-term CAGR of
around 1.5% in the seaborne LPG market.
75
325
575
2020-jan 2020-feb 2020-mar 2020-apr 2020-maj 2020-jun 2020-jul 2020-aug 2020-sep
NWE Naphtha NWE Propane
MARKET DEEP DIVE: LPG DEMAND IN THE PETROCHEMICAL SECTOR
Source: Drewry
Petrochemical LPG demand is set for strong medium-term growth, but in 2020 demand is projected to remain flat.
PROPANE AND NAPHTHA PRICES (USD PER TONNE)
6
7,57,3
4,5
3,5
3
0
4
8
2020 2021 2022 2023 2024 2025
Million tonnes per annum (Mtpa)
0%
50%
100%
Ethane Propane Naphtha
Ethylene Propylene Other
STEAM CRACKER OUTPUT BY FEEDSTOCK ASIAN STEAM CRACKER ADDITIONS (MTPA)
Output:
Feedstock:
63Shipping Market Review – November 2020
OFFSHORE SUPPLY VESSELS
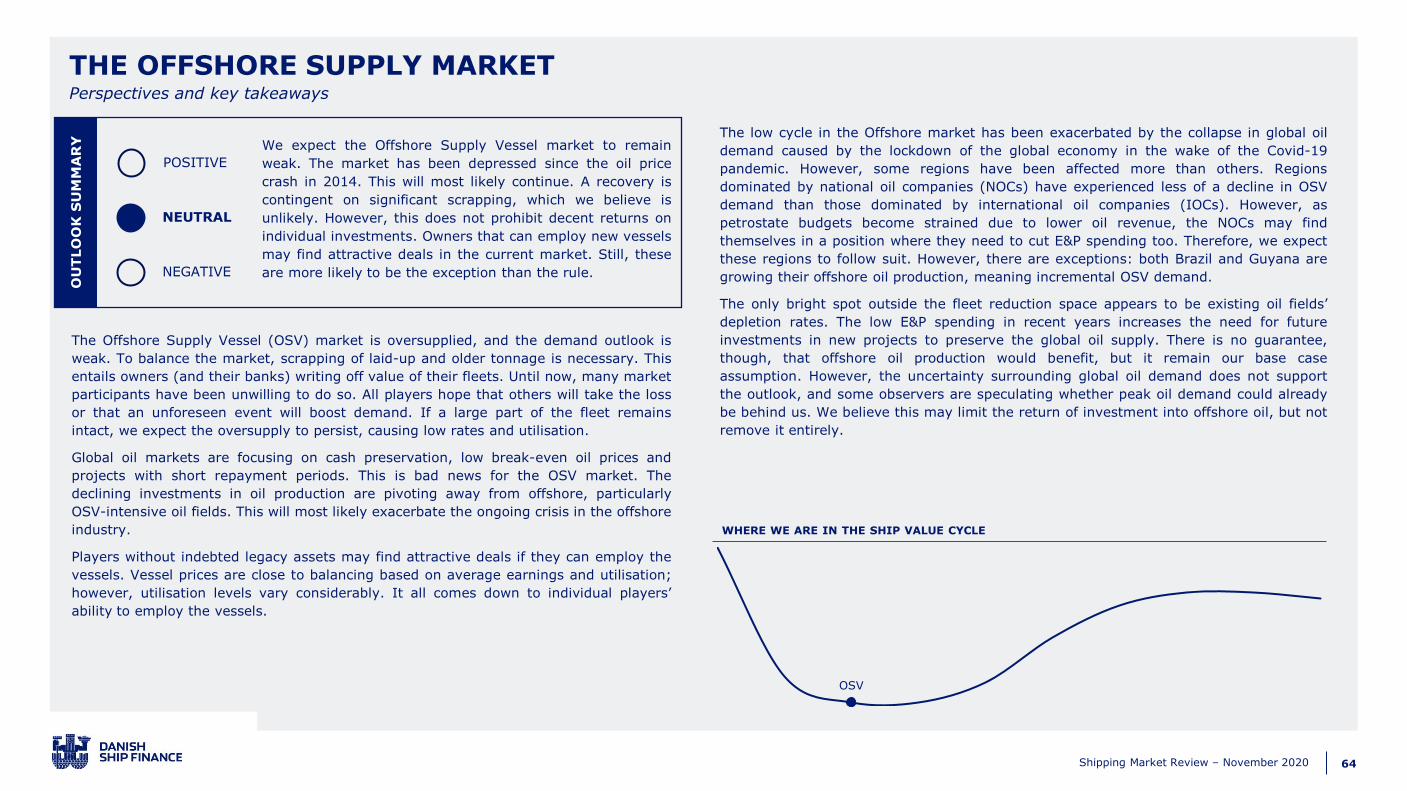
64Shipping Market Review – November 2020
OU
TLO
OK
SU
MM
AR
Y
POSITIVE
NEUTRAL
NEGATIVE
THE OFFSHORE SUPPLY MARKETPerspectives and key takeaways
We expect the Offshore Supply Vessel market to remain
weak. The market has been depressed since the oil price
crash in 2014. This will most likely continue. A recovery is
contingent on significant scrapping, which we believe is
unlikely. However, this does not prohibit decent returns on
individual investments. Owners that can employ new vessels
may find attractive deals in the current market. Still, these
are more likely to be the exception than the rule.
The Offshore Supply Vessel (OSV) market is oversupplied, and the demand outlook is
weak. To balance the market, scrapping of laid-up and older tonnage is necessary. This
entails owners (and their banks) writing off value of their fleets. Until now, many market
participants have been unwilling to do so. All players hope that others will take the loss
or that an unforeseen event will boost demand. If a large part of the fleet remains
intact, we expect the oversupply to persist, causing low rates and utilisation.
Global oil markets are focusing on cash preservation, low break-even oil prices and
projects with short repayment periods. This is bad news for the OSV market. The
declining investments in oil production are pivoting away from offshore, particularly
OSV-intensive oil fields. This will most likely exacerbate the ongoing crisis in the offshore
industry.
Players without indebted legacy assets may find attractive deals if they can employ the
vessels. Vessel prices are close to balancing based on average earnings and utilisation;
however, utilisation levels vary considerably. It all comes down to individual players’
ability to employ the vessels.
The low cycle in the Offshore market has been exacerbated by the collapse in global oil
demand caused by the lockdown of the global economy in the wake of the Covid-19
pandemic. However, some regions have been affected more than others. Regions
dominated by national oil companies (NOCs) have experienced less of a decline in OSV
demand than those dominated by international oil companies (IOCs). However, as
petrostate budgets become strained due to lower oil revenue, the NOCs may find
themselves in a position where they need to cut E&P spending too. Therefore, we expect
these regions to follow suit. However, there are exceptions: both Brazil and Guyana are
growing their offshore oil production, meaning incremental OSV demand.
The only bright spot outside the fleet reduction space appears to be existing oil fields’
depletion rates. The low E&P spending in recent years increases the need for future
investments in new projects to preserve the global oil supply. There is no guarantee,
though, that offshore oil production would benefit, but it remain our base case
assumption. However, the uncertainty surrounding global oil demand does not support
the outlook, and some observers are speculating whether peak oil demand could already
be behind us. We believe this may limit the return of investment into offshore oil, but not
remove it entirely.
WHERE WE ARE IN THE SHIP VALUE CYCLE
OSV
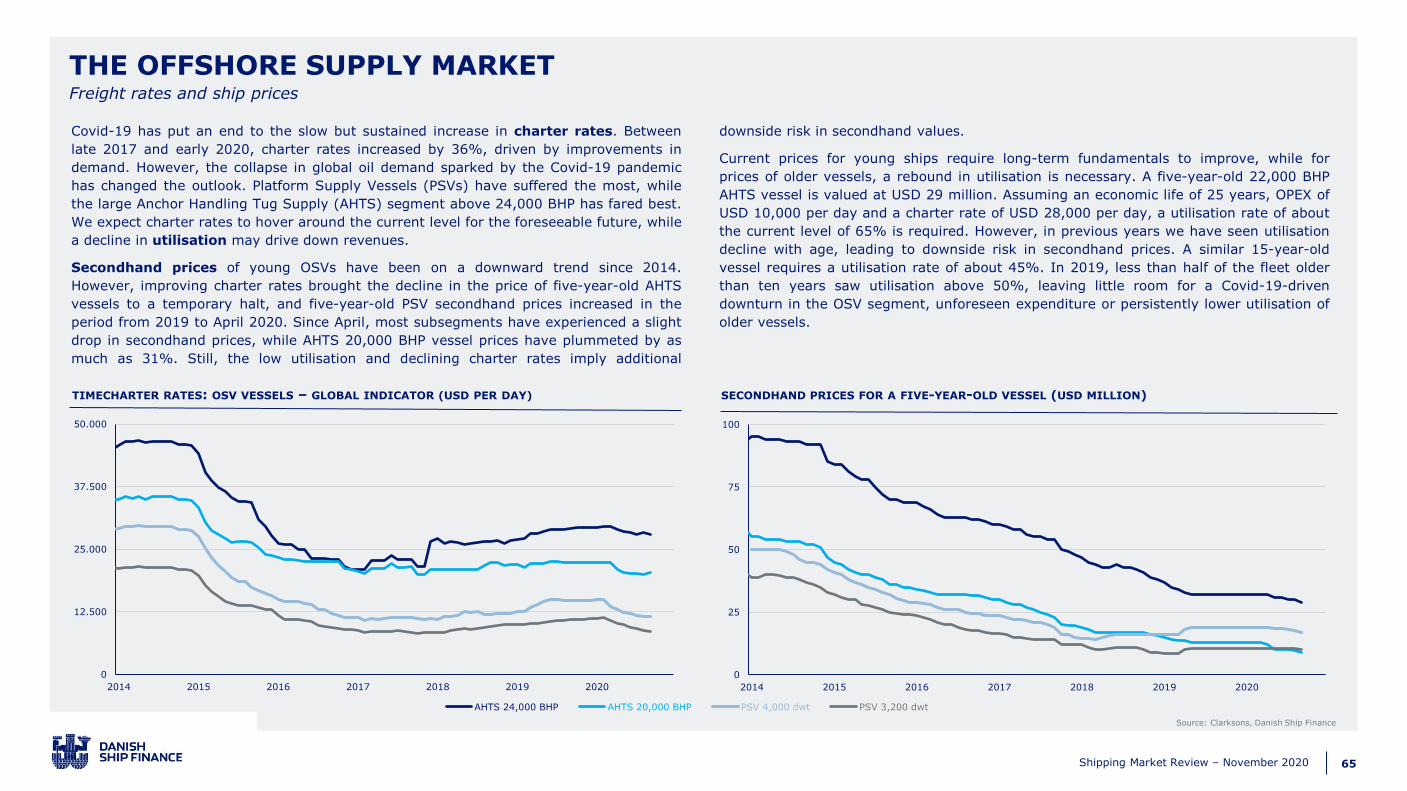
65Shipping Market Review – November 2020
THE OFFSHORE SUPPLY MARKET
TIMECHARTER RATES: OSV VESSELS – GLOBAL INDICATOR (USD PER DAY)
Source: Clarksons, Danish Ship Finance
Freight rates and ship prices
Covid-19 has put an end to the slow but sustained increase in charter rates. Between
late 2017 and early 2020, charter rates increased by 36%, driven by improvements in
demand. However, the collapse in global oil demand sparked by the Covid-19 pandemic
has changed the outlook. Platform Supply Vessels (PSVs) have suffered the most, while
the large Anchor Handling Tug Supply (AHTS) segment above 24,000 BHP has fared best.
We expect charter rates to hover around the current level for the foreseeable future, while
a decline in utilisation may drive down revenues.
Secondhand prices of young OSVs have been on a downward trend since 2014.
However, improving charter rates brought the decline in the price of five-year-old AHTS
vessels to a temporary halt, and five-year-old PSV secondhand prices increased in the
period from 2019 to April 2020. Since April, most subsegments have experienced a slight
drop in secondhand prices, while AHTS 20,000 BHP vessel prices have plummeted by as
much as 31%. Still, the low utilisation and declining charter rates imply additional
downside risk in secondhand values.
Current prices for young ships require long-term fundamentals to improve, while for
prices of older vessels, a rebound in utilisation is necessary. A five-year-old 22,000 BHP
AHTS vessel is valued at USD 29 million. Assuming an economic life of 25 years, OPEX of
USD 10,000 per day and a charter rate of USD 28,000 per day, a utilisation rate of about
the current level of 65% is required. However, in previous years we have seen utilisation
decline with age, leading to downside risk in secondhand prices. A similar 15-year-old
vessel requires a utilisation rate of about 45%. In 2019, less than half of the fleet older
than ten years saw utilisation above 50%, leaving little room for a Covid-19-driven
downturn in the OSV segment, unforeseen expenditure or persistently lower utilisation of
older vessels.
SECONDHAND PRICES FOR A FIVE-YEAR-OLD VESSEL (USD MILLION)
0
12.500
25.000
37.500
50.000
2014 2015 2016 2017 2018 2019 2020
AHTS 24,000 BHP AHTS 20,000 BHP PSV 4,000 dwt PSV 3,200 dwt
0
25
50
75
100
2014 2015 2016 2017 2018 2019 2020
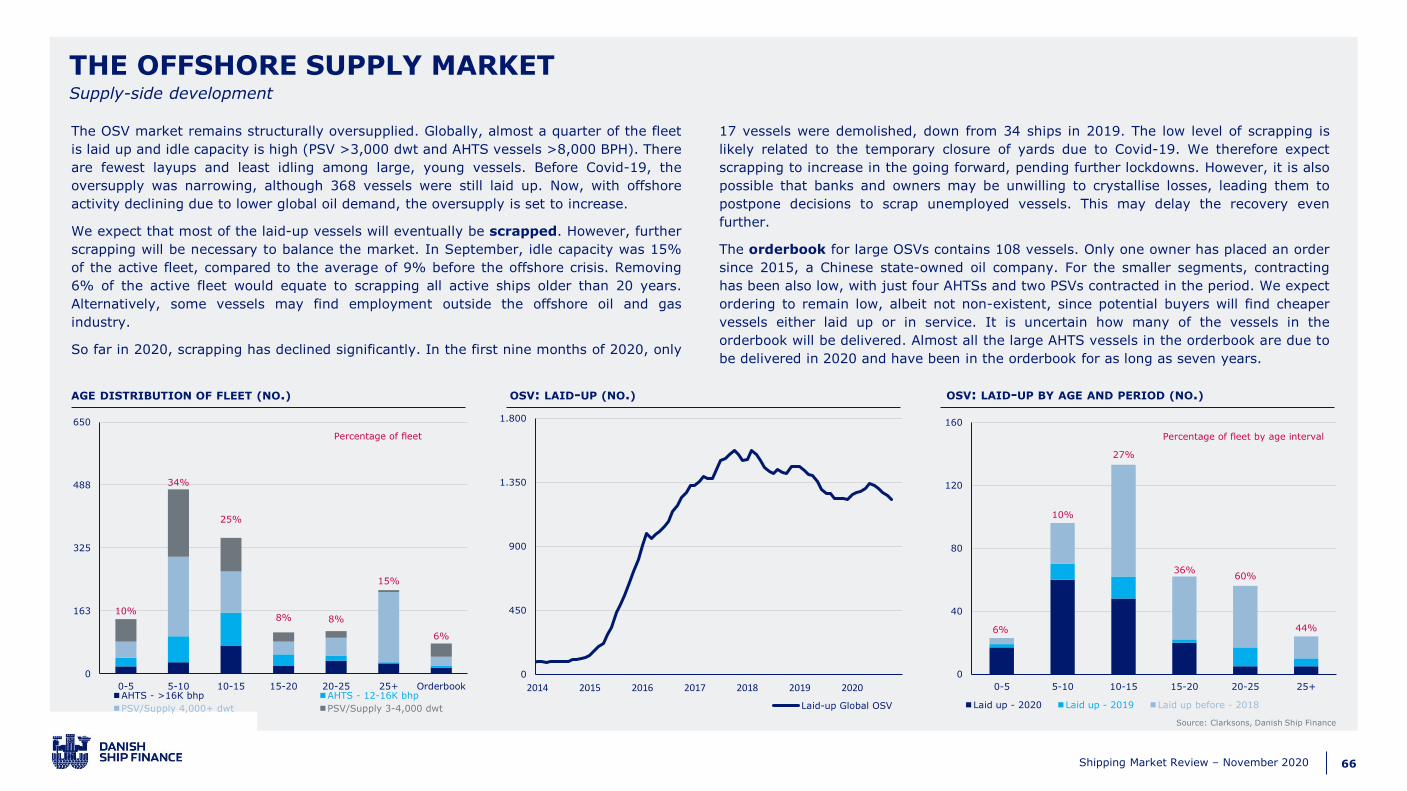
66Shipping Market Review – November 2020
THE OFFSHORE SUPPLY MARKET
Source: Clarksons, Danish Ship Finance
AGE DISTRIBUTION OF FLEET (NO.) OSV: LAID-UP (NO.) OSV: LAID-UP BY AGE AND PERIOD (NO.)
Supply-side development
The OSV market remains structurally oversupplied. Globally, almost a quarter of the fleet
is laid up and idle capacity is high (PSV >3,000 dwt and AHTS vessels >8,000 BPH). There
are fewest layups and least idling among large, young vessels. Before Covid-19, the
oversupply was narrowing, although 368 vessels were still laid up. Now, with offshore
activity declining due to lower global oil demand, the oversupply is set to increase.
We expect that most of the laid-up vessels will eventually be scrapped. However, further
scrapping will be necessary to balance the market. In September, idle capacity was 15%
of the active fleet, compared to the average of 9% before the offshore crisis. Removing
6% of the active fleet would equate to scrapping all active ships older than 20 years.
Alternatively, some vessels may find employment outside the offshore oil and gas
industry.
So far in 2020, scrapping has declined significantly. In the first nine months of 2020, only
17 vessels were demolished, down from 34 ships in 2019. The low level of scrapping is
likely related to the temporary closure of yards due to Covid-19. We therefore expect
scrapping to increase in the going forward, pending further lockdowns. However, it is also
possible that banks and owners may be unwilling to crystallise losses, leading them to
postpone decisions to scrap unemployed vessels. This may delay the recovery even
further.
The orderbook for large OSVs contains 108 vessels. Only one owner has placed an order
since 2015, a Chinese state-owned oil company. For the smaller segments, contracting
has been also low, with just four AHTSs and two PSVs contracted in the period. We expect
ordering to remain low, albeit not non-existent, since potential buyers will find cheaper
vessels either laid up or in service. It is uncertain how many of the vessels in the
orderbook will be delivered. Almost all the large AHTS vessels in the orderbook are due to
be delivered in 2020 and have been in the orderbook for as long as seven years.
10%
34%
25%
8% 8%
15%
6%
0
163
325
488
650
0-5 5-10 10-15 15-20 20-25 25+ OrderbookAHTS - >16K bhp AHTS - 12-16K bhp
PSV/Supply 4,000+ dwt PSV/Supply 3-4,000 dwt
Percentage of fleet
0
450
900
1.350
1.800
2014 2015 2016 2017 2018 2019 2020
Laid-up Global OSV
6%
10%
27%
36%60%
44%
0
40
80
120
160
0-5 5-10 10-15 15-20 20-25 25+
Laid up - 2020 Laid up - 2019 Laid up before - 2018
Percentage of fleet by age interval
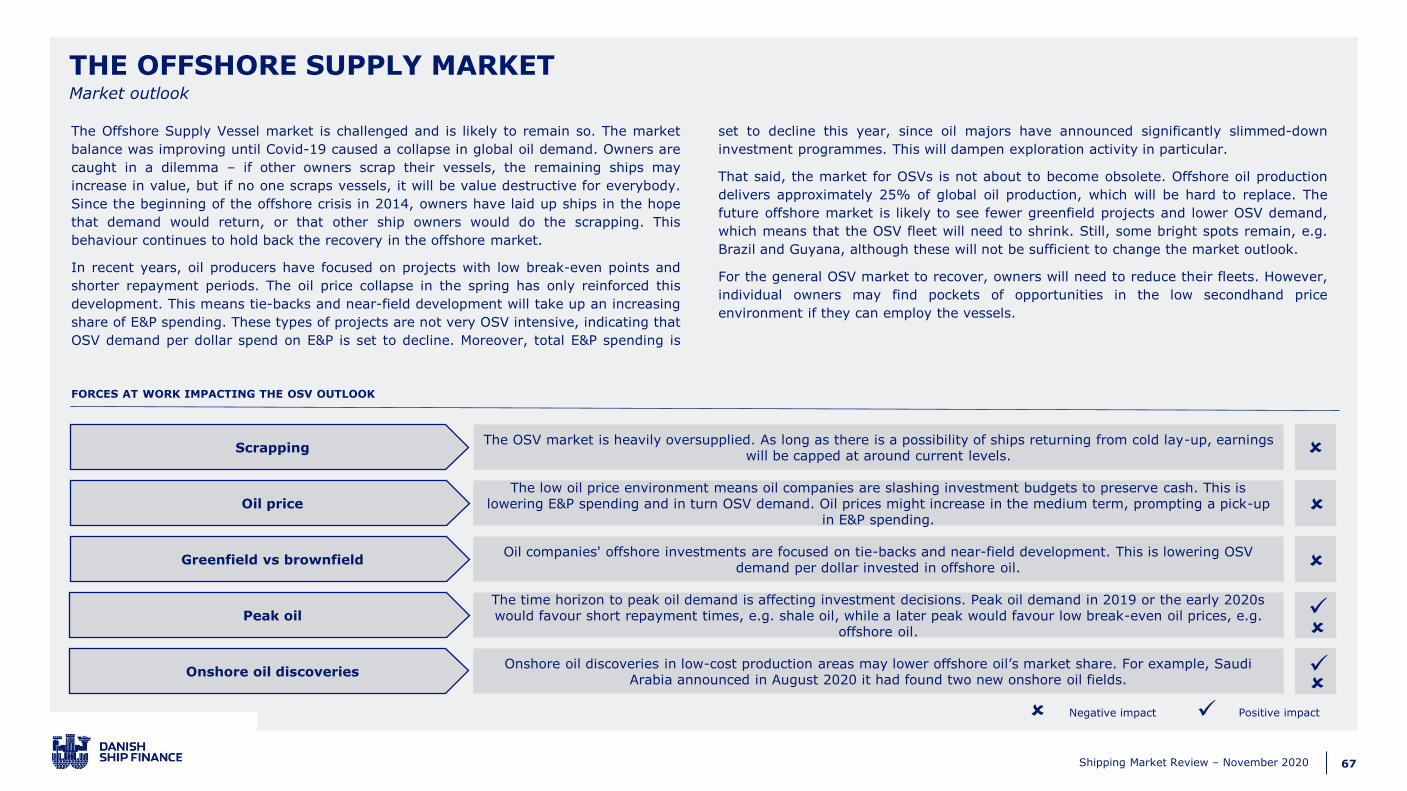
67Shipping Market Review – November 2020
Positive impactNegative impact ✓
FORCES AT WORK IMPACTING THE OSV OUTLOOK
The OSV market is heavily oversupplied. As long as there is a possibility of ships returning from cold lay-up, earnings will be capped at around current levels.
The low oil price environment means oil companies are slashing investment budgets to preserve cash. This is lowering E&P spending and in turn OSV demand. Oil prices might increase in the medium term, prompting a pick-up
in E&P spending.
Oil companies' offshore investments are focused on tie-backs and near-field development. This is lowering OSV demand per dollar invested in offshore oil.
Onshore oil discoveries in low-cost production areas may lower offshore oil’s market share. For example, Saudi Arabia announced in August 2020 it had found two new onshore oil fields.
Scrapping
Oil price
Greenfield vs brownfield
Peak oil
Onshore oil discoveries
The Offshore Supply Vessel market is challenged and is likely to remain so. The market
balance was improving until Covid-19 caused a collapse in global oil demand. Owners are
caught in a dilemma – if other owners scrap their vessels, the remaining ships may
increase in value, but if no one scraps vessels, it will be value destructive for everybody.
Since the beginning of the offshore crisis in 2014, owners have laid up ships in the hope
that demand would return, or that other ship owners would do the scrapping. This
behaviour continues to hold back the recovery in the offshore market.
In recent years, oil producers have focused on projects with low break-even points and
shorter repayment periods. The oil price collapse in the spring has only reinforced this
development. This means tie-backs and near-field development will take up an increasing
share of E&P spending. These types of projects are not very OSV intensive, indicating that
OSV demand per dollar spend on E&P is set to decline. Moreover, total E&P spending is
set to decline this year, since oil majors have announced significantly slimmed-down
investment programmes. This will dampen exploration activity in particular.
That said, the market for OSVs is not about to become obsolete. Offshore oil production
delivers approximately 25% of global oil production, which will be hard to replace. The
future offshore market is likely to see fewer greenfield projects and lower OSV demand,
which means that the OSV fleet will need to shrink. Still, some bright spots remain, e.g.
Brazil and Guyana, although these will not be sufficient to change the market outlook.
For the general OSV market to recover, owners will need to reduce their fleets. However,
individual owners may find pockets of opportunities in the low secondhand price
environment if they can employ the vessels.
THE OFFSHORE SUPPLY MARKETMarket outlook
The time horizon to peak oil demand is affecting investment decisions. Peak oil demand in 2019 or the early 2020s would favour short repayment times, e.g. shale oil, while a later peak would favour low break-even oil prices, e.g.
offshore oil.
✓
✓

68Shipping Market Review – November 2020
THIS PAGE IS INTENTIONALLY LEFT BLANK
69Shipping Market Review – November 2020
www.shipfinance.dk