shipping market review - ship finance
TRANSCRIPT

SHIPPING MARKET REVIEW
MAY 2015
DISCLAIMER The persons named as the authors of this report hereby certify that: (i) all of the views expressed in the research report accurately reflect the personal views of the authors on the subjects; and (ii) no part of their compensation was, is, or will be, directly or indirectly, related to the specific recommendations or views expressed in the research report. This report has been prepared by Danish Ship Finance A/S (Danmarks Skibskredit A/S) (“DSF”).
This report is provided to you for information purposes only. Whilst every effort has been taken to make the information contained herein as reliable as possible, DSF does not represent the information as accurate or complete, and it should not be relied upon as such. Any opinions expressed reflect DSF’s judgment at the time this report was prepared and are subject to change without notice. DSF will not be responsible for the consequences of reliance upon any opinion or statement contained in this report. This report is based on information obtained from sources which DSF believes to be reliable, but DSF does not represent or warrant its accuracy. The information in this report is not intended to predict actual results, and actual results may differ substantially from forecasts and estimates provided in this report. This report may not be reproduced, in whole or in part, without the prior written permission of DSF. To Non-Danish residents: The contents hereof are intended for the use of non-private customers and may not be issued or passed on to any person and/or institution without the prior written consent of DSF. Additional information regarding this publication will be furnished upon request.

HEAD OF RESEARCH
Christopher Rex, [email protected]
ANALYTICAL TEAM
Mette Andersen, [email protected]
Ninna Kristensen, [email protected]

TABLE OF CONTENTS
SHIPPING MARKET REVIEW – MAY 2015
EXECUTIVE SUMMARY, 6
GENERAL REVIEW AND OUTLOOK, 10
SHIPBUILDING, 25
CONTAINER, 34
DRY BULK, 45
CRUDE TANKER, 58
PRODUCT TANKER, 70
LPG TANKER, 82
GLOSSARY, 93
EXECUTIVE SUMMARY
SHIPPING MARKET REVIEW – MAY 2015

EXECUTIVE SUMMARYPlease read the disclaimer at the beginning of this report care-
fully. The report reviews key developments in shipping markets
and the main shipping segments during the period November
2014 to May 2015 and indicates possible future market direc-
tions.
GENERAL REVIEW AND OUTLOOK
The General Review and Outlook is intended to promote discus-
sion of the medium to long-term challenges facing the shipping
industry and to highlight some global perspectives that might
serve as an outlook. We present a discussion of the potential
issues that may or may not come into play within the lifetime of
vessels recently ordered (i.e. 2040). Throughout this chapter we
apply a macroeconomic perspective to the shipping industry.
This methodology enables us to analyse some long-term trends,
although it does create blind spots on the short-term industrial
level. Consequently, our approach may not identify all the short-
term opportunities that enable sudden market improvements to
materialise.
Our latest analysis of the factors shaping the long-term outlook
for seaborne trade volumes highlights in particular concerns
about their dependence on China. Most ship segments are in-
creasingly dependent on Chinese demand, directly or indirectly.
We all hope that Chinese demand will be maintained, but we
should not neglect the potential negative spill-over effects of a
slowdown in China on both global trade volumes and the global
economy.
In 2009, seaborne import volumes declined by 7% due to a
19% drop in the combined seaborne import volumes of North
America, Japan and Europe. If Chinese seaborne import volumes
declined by 20% in 2015, world seaborne import volumes would
decline by 5%. Even though this scenario sounds concerning, we
do not consider it highly unlikely.
The outlook for the world fleet is dominated by this rather chal-
lenging demand outlook in combination with an orderbook-to-
fleet ratio of 18%. In the absence of many obvious scrapping
candidates, owners might choose either to lay up vessels or to
scrap older vessels prematurely. Freight rates and secondhand
values are expected to remain low during the next two to three
years, while newbuilding prices are expected to return to the
lower levels seen in early 2013.
Still, it should be kept in mind that not all ship segments are the
same: some can be regarded as being over the worst (crude
tankers), while others are yet to be impacted (LPG), but most, if
not all, ship segments seem to have been exposed. Dry bulk is
approaching what could be considered the eye of the storm. The
larger container segments continue to build up excessive capaci-
ty. Product tanker earnings have taken us by surprise, but mar-
ket sentiment could easily turn negative again if the many new
vessels currently on order are delivered.
Past experience has taught us to expect the unexpected: win-
dows of opportunity will emerge and freight rates and market
sentiments could spike unexpectedly. This report covers the
long term trends.
SHIPBUILDING
The shipbuilding industry has entered a period of adjustment.
Some yards are managing to bring in orders and re-activate
previously idled capacity, while others are struggling to attract
any orders and must reduce capacity and ultimately close down.
Hence, the current state of the industry could be described as a
struggle for survival whereby the wheat is separated from the
chaff. We have divided the industry into first-tier and second-
tier yards. The first-tier yards have a healthy order cover of 2.4
years, while the second-tier yards only have 0.8 years’ cover. As
a consequence, we think the majority of second-tier yard capac-
ity will close down over the next two years. A smaller share of
first-tier yards are also facing a low order cover of less than one
year and could also be forced to close down if they do not bring
in more contracts. Therefore, they might feel pressured to lower
newbuilding prices. The overcapacity seen in the last couple of
years has sent newbuilding prices on a downward trajectory.
The contracting boom in 2013 and 2014 provided a short-lived
boost to prices, but halfway through 2014 they started to de-
cline once again. We believe that they could go even lower from
Danish Ship Finance (Danmarks Skibskredit A/S)Shipping Market Review - May 2015
6

the current levels this year.
CONTAINER
The container industry has for a long time been in favour of
larger vessels, as they allow liner operators to optimise opera-
tions and benefit from economies of scale. This has led to a
massive and continuous upscaling in vessel sizes and a market
that constantly struggles to adjust to changing fleet dynamics
and thereby low freight rates. The increases in vessel sizes have
been spurred on by strong demand for seaborne containerised
goods. China’s entry to the WTO in late 2001 marked the begin-
ning of the significant upturn in container volumes and demand
grew at a tremendous pace in the following years. However,
since the financial crisis in 2008 demand growth has fallen to
more moderate levels. We question whether it will return to the
levels of the mid-2000s. Still, it seems that the market is con-
tinuing to invest in the future based on assumptions of the past.
Clearly, larger vessels lower the unit cost per moved TEU but
the build-up of overcapacity puts a lid on gross rates. Economics
of scale proves only an asset if the capacity is being utilised suf-
ficiently. We believe that the potential for future container de-
mand is structurally reduced and that long-term container vol-
umes could start to contract if manufacturing is to a larger de-
gree re-shored.
DRY BULK
Many expected 2014 to be the year that the long-awaited re-
covery of the dry bulk market would begin. On the contrary, it
turned out to be the beginning of one of the worst downturns
that the market has ever endured. The Baltic Dry Index fell to a
record low in February 2015 and since then has only increased
marginally. Timecharter rates have followed suit. The oversup-
ply in the market continued to expand and is expected to con-
tinue to do so in 2015, as the orderbook is still massive. Mean-
while, the prospects for dry bulk demand are waning as China’s
rebalancing exercise begins to leave its mark on Chinese dry
bulk demand. 2014 was the first year that we witnessed decli
ning coal imports into China and there are no signs of this being
a temporary slowdown. Moreover, the country’s weakening real
estate sector and slowing domestic steel production is also wor-
rying, as these create the underlying demand for iron ore im-
ports. Hence, there are multiple factors that could indicate lower
Chinese dry bulk demand in the future. As a consequence, we
have low expectations for the dry bulk market in the short term,
and believe that 2015 will be a tough year for many shipowners,
with freight rates and ship values staying relatively low.
CRUDE TANKER
The crude tanker market turned out to be much better than we
expected in 2014, particularly towards the end of the year,
when a drop in crude oil prices propelled demand for crude
tankers. Freight rates surged and the 1-year VLCC timecharter
rate rose to the highest level since the start of the financial cri-
sis. Driving the improvement was a combination of slowing fleet
growth, lower speeds and higher tanker demand alleviating
overcapacity in 2014. There were two main reasons for the in-
creased crude tanker demand: longer travelling distances as
Asia upped its intake of Atlantic Basin crude oil, and temporary
factors such as storage builds and a contango situation triggered
by the drop in crude oil prices. This, in turn, encouraged owners
to renew their 2013 optimism and contract another 17 million
dwt in 2014. In 2014, however, owners also focused on the Su-
ezmax segments as they regained confidence in future Suezmax
earnings. Even though contracting is nowhere near its former
highs, it still poses a threat to the continued recovery of the
crude tanker market. On top of that, demand growth hinges to a
large extent on China, increasing the uncertainty surrounding
future crude tanker demand. Overall, we expect average travel-
ling distances to increase, providing some support to the crude
tanker market. The reason for this is that the Middle East has
begun shifting its focus from crude oil exports to downstream
developments like refineries, making Atlantic Basin crude oil
more sought after by Asia.
PRODUCT TANKER
At the beginning of 2014, the product tanker market looked set
for one of the worst years ever, with supply growth once again
projected to exceed distance-adjusted demand. However, to-
Danish Ship Finance (Danmarks Skibskredit A/S)Shipping Market Review - May 2015
7
wards the end of the year, seasonal demand, temporary factors
and lower oil prices boosted product tanker demand. As a result,
freight rates surged and 1-year timecharter rates reached their
highest annual average since 2010. Still, contracting slowed
down considerably, with only 6 million dwt contracted in 2014.
However, heavy contracting from 2013 is still lurking in the
background and by 2016 fleet growth is expected to have
climbed above 5% before easing slightly in 2017. In compari-
son, distance-adjusted demand from 2015 to 2018 is expected
to grow by an annual average of 1.9%, spurred on by relocation
of refineries rather than above-average oil demand growth. Al-
together, distance-adjusted demand will be insufficient to offset
the relatively high influx of new vessels. Consequently, if the
temporary factors currently supporting the product tanker mar-
ket disappear, the market could be heading for a rough path in
the coming years.
LPG TANKER
2014 turned out to be the best year so far for LPG owners. De-
mand for LPG tankers was boosted by rising Asian imports of
competitively-priced US LPG. Distance-adjusted demand grew by
16% in 2014, 11 percentage points above supply growth.
Consequently, utilisation rates surged, reaching close to 100%.
In tandem with this, freight rates soared to record-high levels
and contracting took another quantum leap. The positive senti-
ment in the LPG market has also resulted in high demand for
secondhand vessels, causing some secondhand prices to surpass
newbuilding prices. Since the beginning of the third quarter,
freight rates, spot rates in particular, have returned to a lower
level and contracting has subsided, sparking hopes that it will
return to a lower and more sustainable level in the coming
years.
In the coming years, the current orderbook, corresponding to
51% of the fleet, is scheduled for delivery. This is expected to
put downward pressure on freight rates, especially in 2016,
when fleet growth is expected to reach a new record high of
19%. However, if demand from the petrochemical sector devel-
ops according to current plans – in particular, if the Chinese pro-
pane dehydrogenation plants materialise – a significant portion
of scheduled orders are expected to find employment. Moreover,
if US export capacity develops in tandem with higher Asian im-
port requirements, average travelling distances could provide
further support for demand for LPG tankers. The transition of
the Chinese economy, in particular, towards being more con-
sumption-driven than industry-driven could also strengthen LPG
demand. Nevertheless, we expect average freight rates to drop
to a significantly lower level in the next two years.
Danish Ship Finance (Danmarks Skibskredit A/S)Shipping Market Review - May 2015
8

GENERAL REVIEW AND OUTLOOK
SHIPPING MARKET REVIEW – MAY 2015

GENERAL REVIEW AND OUTLOOKPARTS OF THE SHIPPING INDUSTRY HAVE RECENTLY SEEN A
TEMPORAL RECOVERY BUT AMPLE SUPPLY CONTINUES TO
SHROUD THE OUTLOOK. ON THE DEMAND SIDE THERE ARE A
NUMBER OF SIGNS INDICATING THAT SEABORNE TRADE VOL-
UMES COULD PLATEAU IN THE SHORT TO MEDIUM TERM. SEV-
ERAL OF THE MAJOR SHIPPING SEGMENTS COULD CONTINUE
TO SUFFER FROM OVERCAPACITY DURING THE NEXT COUPLE
OF YEARS. PREMATURE SCRAPPING IS EXPECTED TO BECOME
THE NEW NORM, AND FREIGHT RATES AND SECONDHAND
PRICES MAY STAY LOW. INVESTORS PLAYING A SHORT-TERM
ASSET GAME MAY FIND IT DIFFICULT TO EXIT WITH THE EX-
PECTED PROFIT IF THEY WAIT TOO LONG.
WORLD DEMAND INDICATORS
THE LEGACIES OF THE FINANCIAL CRISIS PREVAIL. A DEFLA-
TIONARY PRESSURE IS ABOUT TO RESHAPE MUCH OF THE
GLOBAL ECONOMIC LANDSCAPE. BY WEAKENING THE COM-
PARATIVE ADVANTAGE IN LOW LABOUR COST ECONOMIES,
TECHNOLOGICAL ADVANCEMENTS ARE ABOUT TO ENABLE A
PROCESS WHERE ADVANCED ECONOMIES TO A LARGER EX-
TEND ARE RE-SHORING MANUFACTURING FACILITIES THAT
HAVE PREVIOUSLY BEEN OFFSHORED. THIS TREND IS EX-
PECTED TO ALTER GLOBAL TRADE FLOWS THROUGH A VARIETY
OF CANALS AND POTENTIALLY LOWER GLOBAL TRADE VOL-
UMES IN THE COMING DECADES.
In the aftermath of the global financial crisis lower demand from
the advanced economies destabilised the balance between sup-
ply and demand globally. The bitter legacies of the financial cri-
sis have been high levels of debt and high unemployment, prob-
lems that too many countries are still struggling to overcome.
Many companies and households are still cutting back on in-
vestment and consumption because they are concerned about
low future growth. Governments and central banks have tried to
combat this cycle by slashing interest rates and pursuing other
stimulus measures. Many have cut rates to historically low lev-
els, some even negative, in order to generate economic growth.
DEFLATION RISK IS NOW A WORRY EVEN FOR CHINA
The spectre of deflation has settled over vast tracts of the global
economy, forcing countries large and small to assess the risks of
falling prices. Major economies such as Japan, Germany, the
United Kingdom and the United States are all experiencing ultra-
low inflation or outright price decreases. Several emerging
economies are also under pressure. Deflation is widespread
across Europe, and prices have been sliding for years in trouble
spots like Greece. Now the concerns have spread to China. The
prospect of a deflationary cycle developing at a time when cen-
tral banks are running out of ways to respond has created a re-
newed concern for the global economy.
A SYMPTOM OF DEEPER STRUCTURAL WEAKNESS
In 2014, the global economy grew by a modest 3.4% (i.e. on a
par with 2013), reflecting a pickup in growth in advanced econ-
omies from the previous year and a slowdown in emerging
economies. Despite the slowdown, the emerging economies still
accounted for three-quarters of global growth in 2014. The weak
recovery in many advanced economies and slowdowns in sever-
al large emerging economies may be a symptom of deeper
structural weakness.
FALLING PRODUCER PRICES IN CHINA
While activity in the United States and the United Kingdom is
gathering momentum as labour markets heal and monetary pol-
icy remains extremely accommodative, the recovery has been
sputtering in the Eurozone and Japan as legacies of the financial
crisis linger, intertwined with structural bottlenecks. In China,
the economy continues to gradually decelerate, growing 7.4% in
2014. Excess capacity is reflected in falling producer prices and
a slowdown in house price inflation (which was buffered by poli-
cy measures to stimulate infrastructure investment). Disap-
pointing growth in other emerging economies in 2014 was pri-
marily due to weak external demand.
US MONETARY POLICY EXPECTED TO TIGHTEN
The recovery remains fragile because of significant risks. One
such risk stems from the expected tightening, or normalisation,
Danish Ship Finance (Danmarks Skibskredit A/S)Shipping Market Review - May 2015
10

of US monetary policy at a time when many other countries are
easing monetary conditions. This asynchronous monetary policy
may trigger increased volatility in global financial markets. The
divergence of monetary policy paths has already led to a signifi-
cant strengthening of the US dollar. Emerging markets could be
vulnerable, because many of their banks and companies have
sharply increased their borrowing in dollars over the past five
years.
LOWER GLOBAL GROWTH…
The IMF has revised down its global economic growth predic-
tions for 2015 and 2016. The revisions reflect a reassessment of
prospects in China, Russia, the euro area and Japan, as well as
weaker activity in some of the major oil-exporting economies
owing to the sharp drop in oil prices. The United States is the
only major economy for which growth projections have been
raised.
…DESPITE LOWER OIL PRICES
In particular, the sharp decline in oil prices since mid-2014 is
supporting global activity and helping offset some of the head-
wind for growth in oil-importing economies. Lower commodity
prices are leading to sizeable real income shifts from the com-
modity-exporting to commodity-importing economies. If con-
sumer prices starts to declines and stay depressed over a peri-
od, it may postpone households and businesses spending and
investment decisions. The risk is that such development could
trigger a downward spiral in economic activity, prices and world
trade. Deflation also makes it harder for countries to pay off
debts, and can force weak economies to cut wages in order to
compete globally.
GLOBAL GROWTH TO REACH 3.5% IN 2015
Overall, global growth is projected to reach 3.5% and 3.8% in
2015 and 2016, respectively. Growth is expected to be stronger
in 2015 than in 2014 in advanced economies, but weaker in
emerging markets, reflecting more subdued prospects for some
large emerging market economies and oil exporters. Rapid reas-
sessment of risk could also be triggered by a spike in geopoliti-
cal tensions, bouts of volatility in commodity markets or finan-
cial stress in major emerging economies. In China, economic
growth has increasingly decoupled from the rapid debt build-up
that has fuelled investments (and dry bulk demand). An uneven
slowdown in China, potentially spurred by a partial restructuring
of the Chinese banking sector, could reduce GDP and dampen
commodity demand. Economic growth in key trading partners
would suffer accordingly. In general, world trade volumes could
be negatively affected by lower Chinese GDP growth.
GLOBAL TRADE EXPANDED LESS THAN GLOBAL GDP IN 2014
For at least three decades before the 2008 financial crisis, global
trade grew at twice the rate of the global economy. It is now
expanding at – or below – the rate of the global economy. Glob-
al import volumes grew by 2.7% in 2014, well below the pre-
crisis average annual growth of about 5-6% (fig. 1).
GLOBAL TRADE WAS PREDICTED 10-15% ABOVE CURRENT LEVELS
The modest gains in 2014 marked the third consecutive year in
which trade grew less than 3%. Import volume growth averaged
just 2.4% per annum between 2012 and 2014, the slowest rate
Figure GRO.1
80
100
120
140
160
80
100
120
140
160
2005 2006 2007 2008 2009 2010 2011 2012 2013 2014 2015 2016
In
dex (
20
05
= 1
00
)
In
dex (
20
05
= 1
00
)
Sources: Reuters EcoWin, Danish Ship Finance
Seaborne trade volumes increased by 2.7% in 2014
World Trade Volume Annual average
10-15%
Danish Ship Finance (Danmarks Skibskredit A/S)Shipping Market Review - May 2015
11

recorded during the last decade for a three-year period when
trade was expanding. If global trade had continued to expand at
its historical rate, it would have been some 10-15% above its
actual level in 2014.
SERVICES DO NOT GENERATE SEABORNE DEMAND
The slowdown in global trade has been driven by both a cyclical
and a structural component. The cyclical factor is most notably
persistently weak import demand in advanced economies. The
structural component is largely the fact that existing global val-
ue chains are maturing while no significant new value chains are
being formed. Besides, the composition of global demand has
shifted away from trade-intensive goods. Indeed, among the
components of aggregate demand, the recovery in investment,
the most trade-intensive component, has been slowest (in par-
ticular for the advanced economies), further contributing to the
weakening sensitivity of trade to GDP. In short, world trade has
become less responsive to changes in global GDP because global
supply chains are expanding more slowly and demand is shifting
towards less import-intensive items (e.g. services). Consequent-
ly, the pre-crisis correlation between world trade growth and
global GDP growth is not expected to be re-established. Now let
us take a closer look at the building blocks of seaborne trade
volumes.
ASIA ACCOUNTED FOR 78% OF GROWTH IN GLOBAL IMPORT VOLUMES
Seaborne trade volumes have experienced incredible growth
since China joined the WTO in December 2001. Seaborne import
volumes increased by an annual average of 4.5% between 2002
and 2014. Seaborne trade has primarily been driven by the
emerging Asian economies which generated no less than 78% of
the growth in seaborne import volumes during this period (fig.
2).
CHINESE IMPORT VOLUMES HAVE INCREASED BY 15.8% PER ANNUM
Chinese demand alone accounted for more than half of the in-
crease in seaborne trade volumes between 2002 and 2014. This
corresponds to an average annual increase in import volumes of
15.8% per year – every year – between 2002 and 2014. This is
by any measure a quite remarkable development, not least
compared with annual GDP growth of 10-11% during the period.
Figure GRO.2
IMPORT VOLUMES HAVE DECLINED AMONG THE ADVANCED ECONOMIES
By 2014, China was importing approximately the same volumes
of goods as its emerging Asian trading partners and 20% less
than the combined import volumes of North America, Japan and
Europe. Interestingly, Chinese import volumes doubled between
2008 and 2014 from the levels seen in the period 2002-2008,
while import volumes into North America, Europe and Japan de-
clined by 12%. What were the factors driving Chinese growth?
Global demand has weakened since the global financial crisis, so
it seems reasonable to assume that it is primarily domestic de-
mand that has fuelled the increase in import volumes.
DRY BULK IMPORT VOLUMES HAVE DEFINED CHINESE DEMAND
The Chinese import growth story is primarily a dry bulk story.
Chinese dry bulk import volumes increased by 19.3% per year
between 2002 and 2014. As such, dry bulk volumes constituted
76% of the total increase in Chinese import volumes during the
period. Imports carried on tankers – i.e. oil, gas or chemical
tankers – only contributed 16% to the increase.
15.8%
5.1%
0.4%
4.1% 4.5%
51%27%
3%19%
-300%
-250%
-200%
-150%
-100%
-50%
0%
50%
100%
0%
8%
15%
23%
30%
China Other Asia (ex.Japan and
China)
North America+ Europe +
Japan
Rest of theworld
Annual growthin world importvolume (2002-
2014)
Wo
rld
im
po
rt
volu
me g
ro
wth
CAG
R (
2002-2
014)
Sources: IHS Global Insight, Danish Ship Finance
Asian import volume growth contributed 78% to growth in total import volumes between 2002 and 2014
Annual growth in world import volume (2002-2014) Growth contribution (2002-2014)
Danish Ship Finance (Danmarks Skibskredit A/S) Shipping Market Review - May 2015
12

BUT MUCH OF THE GROWTH HAS BEEN DEBT-DRIVEN
From 2000 to 2007, total debt in China grew only slightly faster
than GDP, reaching 158% of GDP, a level in line with that of
other developing economies. Since then, debt has risen rapidly.
In November 2008, the Chinese authorities initiated a USD 600
billion stimuli programme focusing on domestic construction and
infrastructure projects. Over the next six years, China’s nominal
GDP roughly doubled, ballooning from around USD 4.5 trillion in
2008 to just over USD 9 trillion in 2014. But the economic
growth was accompanied by increased levels of debt. By the
middle of 2014, China’s total debt had reached 282% of GDP,
far exceeding the developing economy average and higher than
some advanced economies, including the United States and
Germany. The Chinese economy has added USD 20.8 trillion of
new debt since 2007, which represents more than one-third of
global growth in debt.
HALF THE DEBT IS SOMEHOW RELATED TO THE REAL ESTATE SECTOR
In February 2015, McKinsey estimated that nearly half of the
debt of Chinese households, corporations and governments is
directly or indirectly related to real estate, collectively worth as
much as USD 9 trillion. This includes mortgages to homeowners;
property developers’ debt; lending to related industries, such as
steel and cement; and debt raised by local governments for
property development. This concentration to the property sector
poses a significant risk. Property prices have risen by 60% since
2008 in 40 Chinese cities, and even more in Shanghai and
Shenzhen. Residential real estate prices in prime locations in
Shanghai are now only about 10% below those in Paris and New
York. Over the past year, a correction has begun. Transaction
volumes are down by around 10% across China, and unsold
square metres are building up. A slowdown in the property mar-
ket would be felt mostly by construction and related industries
(leading to lower dry bulk demand), rather than by households,
which are not highly indebted. However, housing construction is
an enormous sector, accounting for 15% of GDP.
Figure GRO.3
GROWTH IN DRY BULK DEMAND COULD LEVEL OFF
Indeed, the beginning of 2015 marked a turning point for Chi-
na’s real estate market; land sales in both volume and revenue
terms plunged by 30% compared with the same period last
year. The reason for this is twofold. The first is a decline in qual-
ity: after a 15-year boom, local governments have sold off most
of the country’s premium plots. The second is a drop in demand.
In 2014, new property sales fell by 7.6% in volume and by
6.3% in terms of proceeds, down from increases of 17.3% and
26.3%, respectively, in 2013. To make matters worse, the real
estate market is now suffering from an excess of supply. At the
end of 2014, China had around 75 billion square feet of new
property space either under construction or ready to be occu-
pied; even if demand remains steady, it will likely take more
than five years to sell all that space. In fact, demand will proba-
bly dip. That could have consequences for world trade and dry
bulk volumes (in particular for iron ore).
-1,000
0
1,000
2,000
3,000
4,000
China Other Asia (non-Japan+China)
North America +Europe + Japan
Rest of the world
Mil
lio
n t
on
nes
Sources: IHS Global Insight, Danish Ship Finance
Import volume growth paused outside Asia after 2008Import volumes declined by 12% in North America, Japan and Europe
2002 import volumes 2002-2008 import growth 2008-2014 import growth
Danish Ship Finance (Danmarks Skibskredit A/S)Shipping Market Review - May 2015
13

DRY BULK DEMAND IS PRONE TO DECLINE
A plausible concern is that the combination of an overextended
property sector and unsustainable finances of local governments
could result in a wave of loan defaults in China, damaging the
regular banking system and potentially creating a wave of losses
for investors and companies that have put money into projects.
While this could create challenges for the economy, McKinsey
also finds that China’s government has the capacity — if it
chooses to use it — to bail out the financial sector, even if de-
fault rates reach crisis levels. This would most likely prevent a
full-blown financial crisis. Because China’s capital account has
not been fully liberalised, spillovers to the global economy would
most likely be indirect, via a further slowdown in China’s GDP
growth.
TRADE GROWTH MAY DECOUPLE FURTHER FROM GDP GROWTH
The impact on world trade volumes in general and dry bulk de-
mand in particular could be large. As shown in figure 3, Chinese
import volumes accounted for more than 50% of total growth in
import volumes between 2002 and 2014. The correlation be-
tween global GDP and world trade will be further reduced in the
future if or when China lowers the contribution from investments
to its GDP creation. A reduced economic activity, starting from
lower construction activity, ripples throughout the entire econo-
my and thereby lowering both fossil fuel demand (i.e. oil, gas
and coal) and steel consumption (i.e. iron ore). The direct con-
sequence is expected to be that future GDP growth will be much
less trade-intensive than in the past.
A NEW NORMAL REQUIRES LESS FOSSIL FUEL AND STEEL
The logic is fairly straightforward. It takes a lot of fossil fuel and
steel to build up an emerging economy – like, for example, the
Chinese. But when the economy matures and enters a new
phase of normality, demand for fossil fuel and steel could settle
at a lower level. That is to say that when we analyse and fore-
cast import figures, in particular for emerging economies, it is
important to remember that a significant part of these figures
reflect one-off effects related to the urbanisation process. Some
of these effects are long-lasting, but nonetheless non-recurring.
WE ARGUE THAT SEABORNE IMPORT VOLUMES COULD PLATEAU…
Still, most forecasts tend to present an outlook that somehow
mirrors the market fundamentals of the past. The latest fore-
casts for world trade volumes are no different. But we see little
to indicate that past drivers will drive future growth. We argue
that the trade dynamics created in the wake of China joining the
WTO in November 2001 were partly a one-off effect boosting
world trade volumes for more than a decade. Any significant ad-
ditional jumps in global trade are not likely in the years to come
as we do not see any potential factors that could drive the same
level of performance as in the past. Seaborne import volumes
could plateau within the lifetime of vessels recently ordered.
…BUT CURRENT FORECASTS INDICATE 3.3% GROWTH
World import volumes are expected to grow by an annual aver-
age growth rate of 3.3% between 2014 and 2030 (4.5% be-
tween 2002 and 2014). The drivers of growth are expected to
be the same, although the relative strength between emerging
Asia and the advanced economies of North America, Japan and
Europe is expected to change. Chinese import volume growth is
predicted to average 4.7% (down from 15.8% between 2002
and 2014), while the advanced economies are expected to in-
crease import volumes by 1.9% per year (up from 0.4% be-
tween 2002 and 2014). If this forecast turns out to be fairly ac-
curate, emerging Asia will generate 69% of the growth in sea-
borne import volumes (78% between 2002 and 2014). The es-
sential issue to consider is why future growth should be driven
by the same growth drivers as in the past.
FUTURE GROWTH MAY REQUIRE LESS SEABORNE TRANSPORTATION
It is true that several emerging economies, including India, have
a vast pool of low-cost workers available. These economies will
continue to play an important role for the global economy and
for world trade. But there is little to suggest that the world
economy of tomorrow will require the same large quantities of
low-skilled and low-cost labour as it has done in the past. Future
economic growth may create fewer jobs and require less sea-
borne transportation as services are not often transported by
the sea.
Danish Ship Finance (Danmarks Skibskredit A/S) Shipping Market Review - May 2015
14
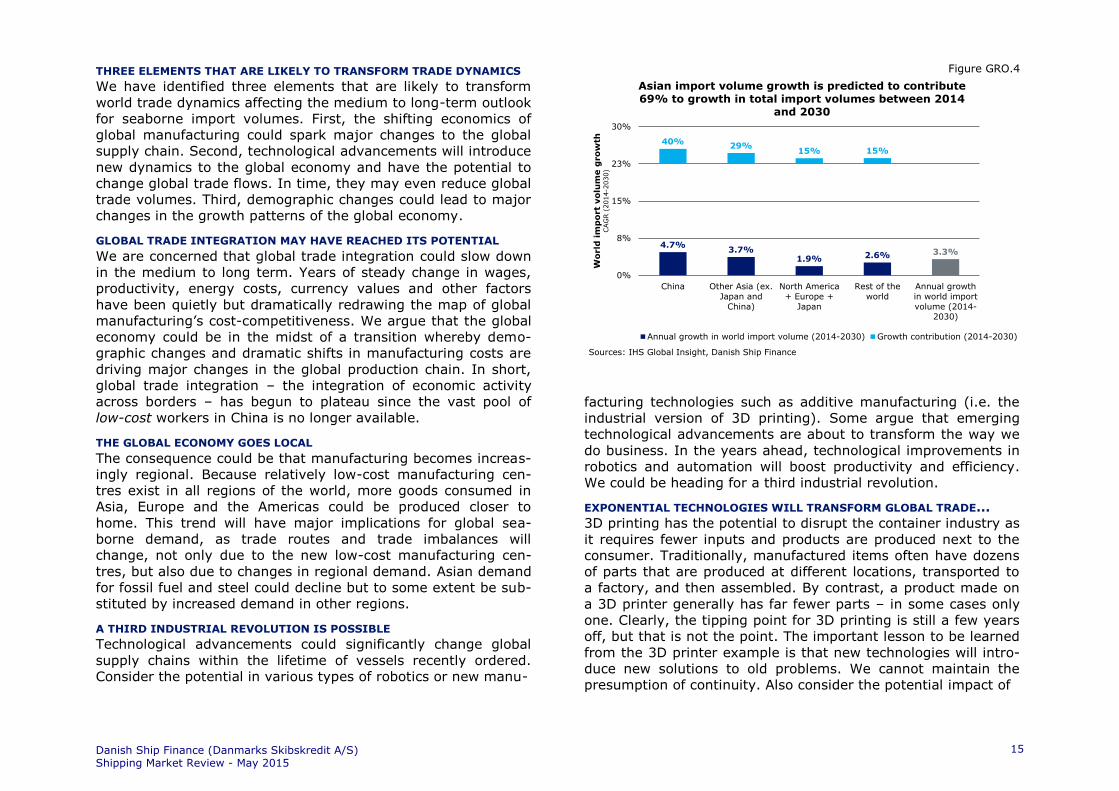
THREE ELEMENTS THAT ARE LIKELY TO TRANSFORM TRADE DYNAMICS
We have identified three elements that are likely to transform
world trade dynamics affecting the medium to long-term outlook
for seaborne import volumes. First, the shifting economics of
global manufacturing could spark major changes to the global
supply chain. Second, technological advancements will introduce
new dynamics to the global economy and have the potential to
change global trade flows. In time, they may even reduce global
trade volumes. Third, demographic changes could lead to major
changes in the growth patterns of the global economy.
GLOBAL TRADE INTEGRATION MAY HAVE REACHED ITS POTENTIAL
We are concerned that global trade integration could slow down
in the medium to long term. Years of steady change in wages,
productivity, energy costs, currency values and other factors
have been quietly but dramatically redrawing the map of global
manufacturing’s cost-competitiveness. We argue that the global
economy could be in the midst of a transition whereby demo-
graphic changes and dramatic shifts in manufacturing costs are
driving major changes in the global production chain. In short,
global trade integration – the integration of economic activity
across borders – has begun to plateau since the vast pool of
low-cost workers in China is no longer available.
THE GLOBAL ECONOMY GOES LOCAL
The consequence could be that manufacturing becomes increas-
ingly regional. Because relatively low-cost manufacturing cen-
tres exist in all regions of the world, more goods consumed in
Asia, Europe and the Americas could be produced closer to
home. This trend will have major implications for global sea-
borne demand, as trade routes and trade imbalances will
change, not only due to the new low-cost manufacturing cen-
tres, but also due to changes in regional demand. Asian demand
for fossil fuel and steel could decline but to some extent be sub-
stituted by increased demand in other regions.
A THIRD INDUSTRIAL REVOLUTION IS POSSIBLE
Technological advancements could significantly change global
supply chains within the lifetime of vessels recently ordered.
Consider the potential in various types of robotics or new manu-
Figure GRO.4
facturing technologies such as additive manufacturing (i.e. the
industrial version of 3D printing). Some argue that emerging
technological advancements are about to transform the way we
do business. In the years ahead, technological improvements in
robotics and automation will boost productivity and efficiency.
We could be heading for a third industrial revolution.
EXPONENTIAL TECHNOLOGIES WILL TRANSFORM GLOBAL TRADE…
3D printing has the potential to disrupt the container industry as
it requires fewer inputs and products are produced next to the
consumer. Traditionally, manufactured items often have dozens
of parts that are produced at different locations, transported to
a factory, and then assembled. By contrast, a product made on
a 3D printer generally has far fewer parts – in some cases only
one. Clearly, the tipping point for 3D printing is still a few years
off, but that is not the point. The important lesson to be learned
from the 3D printer example is that new technologies will intro-
duce new solutions to old problems. We cannot maintain the
presumption of continuity. Also consider the potential impact of
4.7%3.7%
1.9% 2.6% 3.3%
40%29%
15% 15%
-300%
-250%
-200%
-150%
-100%
-50%
0%
50%
100%
0%
8%
15%
23%
30%
China Other Asia (ex.Japan and
China)
North America+ Europe +
Japan
Rest of theworld
Annual growthin world importvolume (2014-
2030)
Wo
rld
im
po
rt
vo
lum
e g
ro
wth
CAG
R (
2014-2
030)
Sources: IHS Global Insight, Danish Ship Finance
Asian import volume growth is predicted to contribute69% to growth in total import volumes between 2014
and 2030
Annual growth in world import volume (2014-2030) Growth contribution (2014-2030)
Danish Ship Finance (Danmarks Skibskredit A/S)Shipping Market Review - May 2015
15

hydrogen fuel cells: via the chemical reaction between hydrogen
and oxygen, fuel cells generate electricity to power an engine.
We need to ask ourselves how many vehicles can be powered by
alternative sources of energy by 2025. In sum, we need to fully
understand the impact of exponential technology on global
trade.
…AND SEND RIPPLES TO ALL PARTS OF THE GLOBAL ECONOMY
The argument is that new technological advancements hold the
potential to change the long-term outlook for regional seaborne
demand – not only for manufactured goods, but also for regional
electricity demand, demand for refined oil products, construction
activity and petrochemical demand. Changes to the industrial
supply chain will send ripples all the way from global consumers
to industrial suppliers and therefore also transform the outlook
for the merchant fleet within the lifetime of vessels recently or-
dered.
DEMOGRAPHIC PRESSURES
Impending demographic changes are also expected to reshape
the global economic landscape in the medium to long term. The
world population is projected to increase to more than 8 billion
by 2030 and to age at an unprecedented rate. For the first time
in history, by 2020, children younger than five years old will be
outnumbered by people aged 65 years and older. In all regions,
except sub-Saharan Africa, the elderly population will increase
faster than the working-age population, which will drive up age-
related costs. At the same time, increased life expectancy
means people can work for longer. China may get old before
getting rich owing to a declining population. But many develop-
ing economies, especially in sub-Saharan Africa and South Asia,
will have to generate job opportunities for new labour market
entrants due to the rapidly increasing populations.
OLDER PEOPLE REQUIRE SERVICES NOT SEABORNE DEMAND
When the above-mentioned forces come into play simultaneous-
ly in Europe, Japan and China, they could have the potential to
redefine the growth engines driving the global economy. The
growth potential in debt-laden economies facing ageing popula-
tions is expected to be structurally reduced. We believe that
older people buy fewer things that require heavy investment –
notably houses – and consume less energy. And older people
commute less, but require more services, whether in healthcare
or tourism.
SEABORNE TRADE VOLUMES COULD BE ON A STRUCTURAL DECLINE
In the short to medium term economic growth can be stimulated
by various means (and may even be supply-pushed), but in
time it will all come down to consumer demand. If economic
growth fails to translate into consumer demand through the
channels of job creation and economic prosperity, the founda-
tion for future growth will be weakened and the capital invested
could be at risk. The medium to long-term prosperity of the
global economy is highly dependent on the outlook for the
emerging economies which, with young and growing popula-
tions, are ready to drive future economic growth. Still, the long-
term potential for international trade flows is expected to be re-
duced. Seaborne trade volumes could plateau or in the worst
case embark on a structural decline within the next decade, as
demand for services does not typically require transportation by
the world fleet.
BUT THE GLOBAL ECONOMY COULD CONTINUE TO EXPAND
To reverse this trend, the trade potential of other regions needs
to be unlocked. South America, South Asia, sub-Saharan Africa,
the Middle East and North Africa: these are the regions that
would greatly benefit economically from being better integrated
into global value chains. More comprehensive global integration
would be good for those emerging economies yet to realise the
potential of global trade.
Danish Ship Finance (Danmarks Skibskredit A/S) Shipping Market Review - May 2015
16

COMMODITY PRICES
The decline in commodity prices that began with metals and ag-
riculture four years ago — and was joined by crude oil in mid-
2014 — continued in the first quarter of 2015. Energy, metals
and agricultural prices were down 28%, 11%, and 5%, respec-
tively, from the previous quarter. Increasing supplies, bumper
harvests, weak demand and a stronger US dollar all contributed
to the declines. All main commodity price indices are expected
to come down in 2015, mainly due to abundant supplies, before
recovering somewhat in 2016.
LOWER CHINESE GROWTH IS BEING REFLECTED IN COMMODITY PRICES
China is a major importer of industrial commodities: it con-
sumes almost one-quarter of global energy output and one-half
of global metal supply. Just as China’s burgeoning investment in
commodity-intensive manufacturing, construction and real es-
tate raised global demand for commodities, its slowing has de-
pressed demand, especially for copper, iron ore, steel and nick-
el. Prices of these metals have declined by more than 30%
(65% for iron ore) since their record highs of 2011. These prices
are expected to stay low over the period 2015-16 as expanding
supply is only gradually absorbed by rising demand.
ENERGY PRICES TO DECLINE BY 42% IN 2015
Energy prices are projected to fall by 42% in 2015, largely re-
flecting a 45% drop in crude oil prices, which are still estimated
to average USD 53 per barrel, according to the World Bank.
Most of this decline has already occurred, implying flat oil prices
for the rest of the year as the industry reduces the current large
supply overhang. The weakness in crude oil prices will extend to
other energy markets, especially natural gas in Europe and Asia.
The European natural gas and the Japanese liquefied natural gas
(LNG) price benchmarks are projected to decline by 15% and
30%, respectively, in 2015. Coal prices have fallen 40% since
2011 and are projected to decline by an additional 12% this
year due to weak Chinese import demand and a global supply
surplus.
NON-ENERGY PRICES ARE PROJECTED TO DECLINE BY 10% IN 2015
Non-energy prices are expected to fall by 10% in 2015, with de-
clines in all main indices. Metals prices are estimated to decline
by 13% due to capacity increases and slowing demand in China.
Iron ore prices are expected to decline by 35% owing to new
low-cost mining capacity (mainly in Australia but also in Brazil)
coming online this year and next. Iron ore prices fell 15% during
the first quarter of 2015. March prices stood at just a third of
their 2011 highs. The new supply led high-cost production in
China and elsewhere to close. However, more new low-cost ca-
pacity is due to come online in the next two years and further
displacement of high-cost supply will likely be required to re-
balance the market. Demand from the steel industry, which con-
sumes nearly all iron ore output, was weak in the first quarter of
2015, continuing a year-long trend. Output growth in China,
which produces half of the world’s steel, is slowing due to weak
domestic demand. However, China’s finished steel exports con-
tinue to rise as steel prices have declined sharply.
Danish Ship Finance (Danmarks Skibskredit A/S) Shipping Market Review - May 2015
17

SHIPPING MARKETS AT A GLANCE
THE SHIPPING INDUSTRY REMAINS BOTH CYCLICAL AND VOLA-
TILE, BUT ITS MEAN-REVERTING NATURE SEEMS TO HAVE
BEEN ABSENT FOR A PROLONGED PERIOD DUE TO THE MAS-
SIVE OVERORDERING IN MANY SEGMENTS. INVESTORS WHO
HAVE BEEN PLANNING TO RIDE THE GLOBAL RECOVERY ARE
REALISING THAT WHAT GOES DOWN SOMETIMES STAYS DOWN
FOR QUITE A FEW YEARS. WE PREDICT THAT SECONDHAND
VALUES COULD DECLINE FURTHER, POTENTIALLY BY AS MUCH
AS 20% FROM CURRENT LEVELS IN SOME SEGMENTS.
Above, we have argued that the global economy is currently in
the midst of a transition whereby old growth engines are gradu-
ally being replaced by new ones. It seems that this paradigm
shift is generally being misperceived, and many continue to ex-
pect that the shipping markets will be mean-reverting in due
course. We do not share their expectations for the short to me-
dium term (i.e. 12 months and one to three years, respectively)
since we predict that global demand for fossil fuels and steel
could settle at a lower level if China stops adding to its stocks of
empty buildings. The risk of a correction in seaborne import vol-
umes appears to be going largely unnoticed. Still, for the pur-
poses of this section we will assume that seaborne demand vol-
umes will increase by an annual average of 3.3% until 2018.
OVERCAPACITY PREVAILS
The problem is that nominal supply is already well ahead of
nominal demand in many ship segments. And many more ships
are on order. While it is true that orderbook-to-fleet ratios have
come down in recent years, few segments have the capacity to
absorb the scheduled deliveries without future earnings being
lowered. Supply increased twice as fast as demand between
2008 and 2014, leaving nominal supply approximately 30%
ahead of demand by year-end 2014. Today, few ship segments
have many scrapping candidates. The size of the orderbook
relative to the age profile of the world fleet leaves little hope for
freight rates to increase should demand fail to grow in line with
investors’ expectations. It therefore seems inevitable that prem-
ature scrapping will intensify if all vessels on order are deliv-
ered.
BUT NOT ALL SHIP SEGMENTS ARE EQUALLY EXPOSED
Part of the supply gap has been bridged by short-term cyclical
factors such as longer travel distances, slower speeds and lower
fleet efficiency (e.g. long ballasting routes) in many segments.
By continuing to buy fuel-efficient vessels for already oversup-
plied markets, ship investors have exacerbated a deflationary
cycle. The individual ship segments have been impacted differ-
ently: some can be regarded as being over the worst (Crude
tankers) while others have yet to be impacted (LPG), but most,
if not all, ship segments seem to be exposed. Dry bulk is ap-
proaching what could be considered the eye of the storm. The
larger container segments continue to build up excessive capaci-
ty. Product tanker earnings have taken us by surprise, but mar-
ket sentiment could easily turn negative again if the many new
vessels currently on order are delivered.
Figure GRO.5
Chemical Tanker
Container
Crude Tanker
Dry Bulk
LNG
LPG
Product Tanker
0
2
4
6
8
0% 10% 20% 30% 40% 50% 60%
Fle
et
ren
ew
al
(Ord
erb
ook /
fle
et
(20yr+
) dw
t)
Sources: Clarksons, Danish Ship Finance
Not all segments are equally exposed to futureovercapacity
Orderbook / fleet
Danish Ship Finance (Danmarks Skibskredit A/S) Shipping Market Review - May 2015
18

LITTLE ROOM FOR MANOEUVRE IF DEMAND DISAPPOINTS
Looking at the orderbooks for the various main ship segments
relative to their fleets’ replacement potential, it is apparent that
none of the major ship segment has a plan B for the short term.
In particular, the strong demand expectations for gas carriers
are clearly visible in the size of this segment’s orderbook com-
pared with its current fleet. Moreover, the outlook for crude
tankers remains fragile due to the age distribution of the fleet.
To illustrate the challenge it is facing, for each crude tanker old-
er than 20 years six vessels are scheduled to enter the fleet
within the next few years (fig. 5). Let us hope that our predic-
tion of stagnating or outright declining seaborne trade volumes
turns out to be incorrect or at least premature.
TEMPORARY FACTORS CAN BE MISLEADING EVEN FOR LONG PERIODS
In general, we must not allow ourselves to be dazzled by power-
ful demand shocks that are caused by temporary factors. A fun-
damental overcapacity issue is not resolved, per se, simply be-
cause freight rates soar for a year. In shipping, short-term fac-
tors such as arbitrage windows (i.e. often related to price vola-
tility), weather disruptions, geopolitical issues or issues related
to congestion can be strong enough to lift freight rates above
their fundamental balance, even for longer periods. But that
does not mean that the market will improve the following year –
and it certainly does not call for additional contracting of new
vessels.
SHIPPING’S MEAN-REVERTING NATURE WILL RETURN IN DUE COURSE
We believe that the industry’s mean-reverting nature has been
somehow sacrificed in the search for yield (i.e. overordering of
new vessels). While it is true that cyclicality tends to return in
the long term, the low point in the cycle is expected to be long-
lasting, especially if demand stagnates or even declines in the
short to medium term. Besides, we believe that volatility is
structurally reduced in times of significant oversupply.
DEMAND IS FAILING TO ABSORB SUPPLY
An important factor seems to have been forgotten in the years
of overinvestment. Supply has been growing much faster than
demand since 2008. By year-end 2014, a 1% increase in de-
mand only absorbed a 0.8% increase in supply. Put simply, the
supply gap will continue to widen in the coming years even if
both supply and demand are expected to grow at, let’s say, 4%
per annum. And if the supply gap widens, freight rates are un-
likely to increase.
LOW FREIGHT RATES REMAIN DUE TO OVERCAPACITY
The ClarkSea Index, a composite freight rate index sourced by
Clarkson, has only surpassed USD 15,000 per day for short pe-
riods in the years from 2009 to 2015. The index has mostly
hovered between USD 7,500 per day and USD 15,000 per day.
The average rate for the period from 2009 to 2015 has been
USD 11,800 per day, while the corresponding figure for the pre-
vious nine years – from 2000 to 2008 – was USD 23,500 per
day. As of 1 May, 2015, the index stood at USD 13,000 per day
(fig. 7).
FREIGHT RATES INCREASE WITH HIGHER UTILISATION…
A composite freight rate index in theory reflects the average uti-
lisation of the world fleet adjusted for speed, inefficiencies and
travel distances and is unaffected by regional imbalances. For
freight rates to rise, demand needs to employ an increasing
share of the world fleet.
…BUT UTILISATION IS EXPECTED TO STAY LOW…
Let us look at what it will take for freight rates to stay at current
levels. On aggregate, seaborne world trade volumes are predict-
ed to increase at an annual growth rate of 3.3% until 2018. (For
a detailed discussion of the outlook for world trade volumes,
please refer to the World Demand Indicators section above.)
This implies that demand growth will absorb 2.6% fleet growth
per year or approximately 50 million dwt.
…DESPITE AN OPTIMISTIC SCRAPPING SCENARIO…
There is, however, no reason to expect that supply will only ex-
pand by 2.6% between 2015 and 2018. The orderbook currently
constitutes 18% of the fleet, with the vast majority scheduled to
be delivered in 2015 and 2016 (more than 100 million dwt per
year). To counterbalance the massive inflow of vessels, we as-
Danish Ship Finance (Danmarks Skibskredit A/S) Shipping Market Review - May 2015
19

sume that approximately 50 million dwt per annum will be
scrapped during the period 2015 to 2018. This is a fairly opti-
mistic scenario that represents a 10% higher level of activity
than during the previous peak from 2011 to 2014.
…AND AN EXPECTED DELIVERY RATIO OF ONLY 70%
Further, we assume that of the orders scheduled for delivery in
a year, 70% will actually be delivered, with the rest postponed
to the following year. To accommodate future contracting activi-
ty, we assume a level of new orders for 2017 and 2018 such
that combined deliveries from 2015 to 2018 will be approxi-
mately 25% below the peak deliveries of 2011 to 2014.
CLARKSEA INDEX COULD STAY LOW FOR THE NEXT TWO YEARS
Based on the above scenario, supply is projected to grow at a
compounded average growth rate of 4.2% between 2015 and
2018. Still, the outlook remains bleak. We do not believe that
the current fleet utilisation can be maintained beyond 2015 (fig.
7). Consequently, we find it less probable that the ClarkSea In-
dex will rise significantly from its current level of approximately
USD 13,000 per day in the next two to three years. So what will
happen to secondhand prices during this period?
A DEMOGRAPHIC DEFICIT IS ABOUT TO EMERGE
The protracted duration of the low market has proved extremely
challenging for the industry at large. The continuing low freight
rate environment continues to weigh on secondhand prices, alt-
hough the cost of debt remains low. For quite some time we
have argued that the age distribution of the world fleet presents
a structural challenge for ship value formation. In our approach
to ship value formation, the value of a ship is determined by
three parameters: short-term earnings (related to the timechar-
ter rate), the long-term earnings potential (often seen as being
related to the newbuilding price) and the expected operating life
of the vessel. If vessels are on average scrapped prematurely
(i.e. before their technical operating life), it represents – per se
– a structural downside risk to current ship prices, in particular
for older, less efficient vessels that are technically outdated. For
some, but not all, ship segments in today’s market, that could
mean vessels older than ten years.
Figure GRO.6
THE AVERAGE SHIP IS PRICED ABOVE ITS EARNINGS POTENTIAL
Ship price formation has decoupled from earnings throughout
most of the period from 2009 to 2015. Between 2000 and 2008,
the average ship was priced at a price-to-earnings ratio (P/E) of
4, but this figure has increased to 7 since 2009 (fig. 8).
Throughout the period since 2009, freight rates have often been
insufficient to cover costs. In these circumstances, where equity
is being spent on a daily basis, the pricing mechanism for
secondhand vessels fails to assess the impact of short-term de-
mand for equity relative to the expected longer-term recovery.
However, the recent freight rate improvements and continued
softening in prices seem to have restored pricing to a more bal-
anced level.
83%
81%
82%
70%
80%
90%
100%
-100
0
100
200
2009 2010 2011 2012 2013 2014 2015 2016 2017 2018
World
Fle
et
Uti
lisati
on
Mil
lio
n d
wt
Sources: Clarksons, Danish Ship Finance
World fleet utilisation expected to bottom out at 81% in 2017
Delivery Demolition New Orders World Fleet Utilisation
Danish Ship Finance (Danmarks Skibskredit A/S) Shipping Market Review - May 2015
20

SECONDHAND PRICES ARE LIKELY TO DECLINE FURTHER
Prices have come down considerably. Yet, the essential issue to
address is whether secondhand prices will decline further. Cur-
rent prices seem to indicate that many investors are still antici-
pating a short- to medium-term recovery in freight rates. This
hypothesis is supportive of the market convention that shipping
is a cyclical and mean-reverting industry. As discussed above,
we do not argue against the cyclical nature of the industry, but
neither do we expect to see significant freight rate increases in
the short to medium term. Freight rates will eventually go up,
but we are less certain that secondhand prices will increase in
the short to medium term. We simply believe that current prices
already reflect overly high expectations for future income in
many segments. For freight rates to justify today’s secondhand
prices, the ClarkSea Index would need to increase to USD
19,000 per day (+46%). We consider it fairly unlikely that the
2015 annual average of the ClarkSea Index will reach USD
19,000 per day. There are simply too many vessels at sea and
there are more to come.
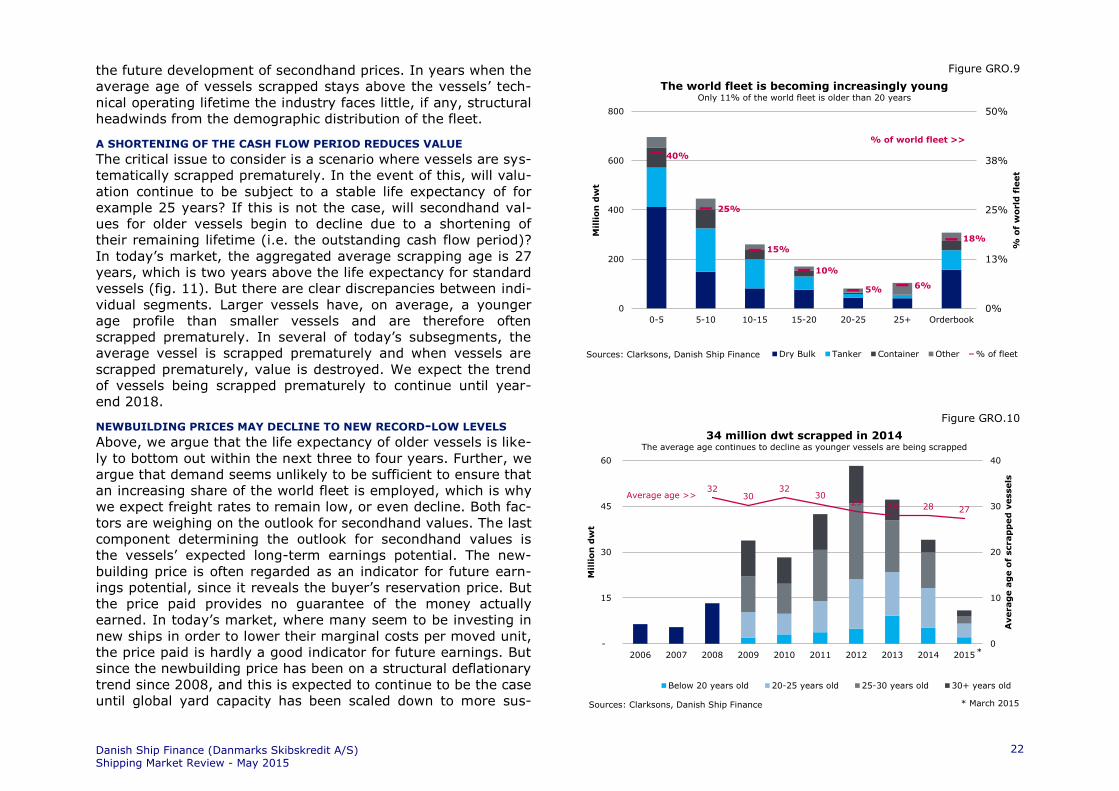
11% OF THE WORLD FLEET IS OLDER THAN 20 YEARS
The age profile of the world fleet clearly illustrates that years of
massive inflow of new and larger vessels in combination with
low freight rates have maintained the pressure on owners to
scrap older, less efficient vessels. Today, only 11% of the world
fleet is 20 years or older, while 65% of the world fleet is ten
years or younger (fig. 9). Above, we argued that for an ac-
ceptable level of world fleet utilisation to be maintained, very
high demolition activity of approximately 50 million dwt per an-
num is necessary between 2015 and 2018. We therefore as-
sume that the record-high demolition activity from 2011 to 2014
will be repeated in the coming years.
ARE WE ENTERING A PHASE OF STRUCTURALLY DECLINING PRICES?
In theory, this could be achieved on an aggregated level by
scrapping almost all vessels currently older than 20 years by
year-end 2018. The reality, however, may turn out to be a much
less smooth process. In a more conventional scenario both
younger and older vessels are scrapped collectively. This appar-
ently irrelevant technical nuance may be of great significance for
Figure GRO.7
Figure GRO.8
450
713
975
1,238
1,500
-
15,000
30,000
45,000
60,000
2000 2002 2004 2006 2008 2010 2012 2014 2016
Averag
e s
econ
dh
an
d p
ric
e
USD
per
dw
t
Cla
rkS
ea I
nd
ex
USD
per
day
Sources: Clarksons, Danish Ship Finance
Secondhand prices are trading closer to vessels' earnings potential
<< ClarkSea Index Avg. secondhand prices >>
12-20016.7
11-20041.8
04-2009
10.8
12-20134.3
5.4
3.97
0.0
3.5
7.0
10.5
14.0
-
3.5
7.0
10.5
14.0
2000 2002 2004 2006 2008 2010 2012 2014 2016 2018
Pric
e /
earn
ing
s r
ati
o
(Avg.
secondhand p
rice index /
Cla
rkSea I
ndex)
Pric
e /
earn
ing
s r
ati
o(A
vg.
secondhand p
rice index /
Cla
rkSea I
ndex)
Sources: Clarksons, Danish Ship Finance
The P/E range seems to have shifted upwardsSecondhand prices seem to be traded 10-20% above the earnings potential
P/E P/E avg. 2000-2008 P/E avg. 2009-2015
Danish Ship Finance (Danmarks Skibskredit A/S) Shipping Market Review - May 2015
21
the future development of secondhand prices. In years when the
average age of vessels scrapped stays above the vessels’ tech-
nical operating lifetime the industry faces little, if any, structural
headwinds from the demographic distribution of the fleet.
A SHORTENING OF THE CASH FLOW PERIOD REDUCES VALUE
The critical issue to consider is a scenario where vessels are sys-
tematically scrapped prematurely. In the event of this, will valu-
ation continue to be subject to a stable life expectancy of for
example 25 years? If this is not the case, will secondhand val-
ues for older vessels begin to decline due to a shortening of
their remaining lifetime (i.e. the outstanding cash flow period)?
In today’s market, the aggregated average scrapping age is 27
years, which is two years above the life expectancy for standard
vessels (fig. 11). But there are clear discrepancies between indi-
vidual segments. Larger vessels have, on average, a younger
age profile than smaller vessels and are therefore often
scrapped prematurely. In several of today’s subsegments, the
average vessel is scrapped prematurely and when vessels are
scrapped prematurely, value is destroyed. We expect the trend
of vessels being scrapped prematurely to continue until year-
end 2018.
NEWBUILDING PRICES MAY DECLINE TO NEW RECORD-LOW LEVELS
Above, we argue that the life expectancy of older vessels is like-
ly to bottom out within the next three to four years. Further, we
argue that demand seems unlikely to be sufficient to ensure that
an increasing share of the world fleet is employed, which is why
we expect freight rates to remain low, or even decline. Both fac-
tors are weighing on the outlook for secondhand values. The last
component determining the outlook for secondhand values is
the vessels’ expected long-term earnings potential. The new-
building price is often regarded as an indicator for future earn-
ings potential, since it reveals the buyer’s reservation price. But
the price paid provides no guarantee of the money actually
earned. In today’s market, where many seem to be investing in
new ships in order to lower their marginal costs per moved unit,
the price paid is hardly a good indicator for future earnings. But
since the newbuilding price has been on a structural deflationary
trend since 2008, and this is expected to continue to be the case
until global yard capacity has been scaled down to more sus-
Figure GRO.9
Figure GRO.10
40%
25%
15%
10%
5% 6%
18%
0%
13%
25%
38%
50%
0
200
400
600
800
0-5 5-10 10-15 15-20 20-25 25+ Orderbook
% o
f w
orld
fle
et
Mil
lio
n d
wt
Sources: Clarksons, Danish Ship Finance
The world fleet is becoming increasingly youngOnly 11% of the world fleet is older than 20 years
Dry Bulk Tanker Container Other % of fleet
% of world fleet >>
3230
3230
2928 28 27
0
10
20
30
40
-
15
30
45
60
2006 2007 2008 2009 2010 2011 2012 2013 2014 2015
Averag
e a
ge o
f scrap
ped
vessels
Mil
lio
n d
wt
Sources: Clarksons, Danish Ship Finance
34 million dwt scrapped in 2014The average age continues to decline as younger vessels are being scrapped
Below 20 years old 20-25 years old 25-30 years old 30+ years old
*
* March 2015
Average age >>
Danish Ship Finance (Danmarks Skibskredit A/S) Shipping Market Review - May 2015
22

tainable levels, this indicator offers little hope. We expect new-
building prices to double-dip, with new record-low levels seen in
the coming years.
SECONDHAND VALUES COULD DECLINE BY AS MUCH AS 20%
In longer periods of low earnings the market tends to underes-
timate the risks, since many argue that we are near the bottom.
And we might well be. But investors who have been planning to
ride the global recovery will realise that what goes down some-
times stays down for quite a few years. Many investors seem to
have planned for a recovery this year or next. The timing has
been good for tanker investments while the opposite has been
true for dry bulk and containers. For these two segments we ex-
pect to see low freight rates and low ship prices for the next two
to three years. So the critical question to ask is how much fur-
ther can prices decline? There is an argument to say that prices
have reached a structural low point and that further reductions
appear unrealistic. From a cost perspective the argument is sol-
id, but from the perspective of supply and demand we see little
to prevent further value depreciations. In fact, we argue that
secondhand values for older vessels, in several subsegments,
could be at risk of value depreciations of as much as 20-25%
within the next year or two.
Figure GRO.11
AVERAGE SCRAPPING AGE 2014 2015* AVERAGE SCRAPPING AGE 2014 2015*
Crude Tanker Container
VLCC 21 24 3-7,999 Post-Panamax 18
Suezmax 20 Panamax 20 24
Aframax 22 23 Sub-Panamax 22 21
Panamax 20 19 Handy 22 21
Handysize 24 Feedermax 22 21
Small Tankers 30 37 Feeder 33 35
8-11,999 Post Panamax
Bulk Carrier Product Tanker
Capesize 23 20 LR2 27
Panamax 24 23 LR1 21 31
Handymax 26 26 MR 25 27
Handysize 29 28 Small Tankers 33 34
Small 33 27
* as per March 2015
Danish Ship Finance (Danmarks Skibskredit A/S) Shipping Market Review - May 2015
23
SHIPBUILDING
SHIPPING MARKET REVIEW – MAY 2015
SHIPBUILDING
THE SHIPBUILDING INDUSTRY HAS ENTERED A PERIOD OF AD-
JUSTMENT. SOME YARDS ARE MANAGING TO BRING IN OR-
DERS AND SCALE UP CAPACITY, WHILE OTHERS ARE STRUG-
GLING TO ATTRACT ORDERS. AS A CONSEQUENCE, THEY ARE
BEING FORCED TO REDUCE CAPACITY AND ULTIMATELY CLOSE.
NEWBUILDING PRICES
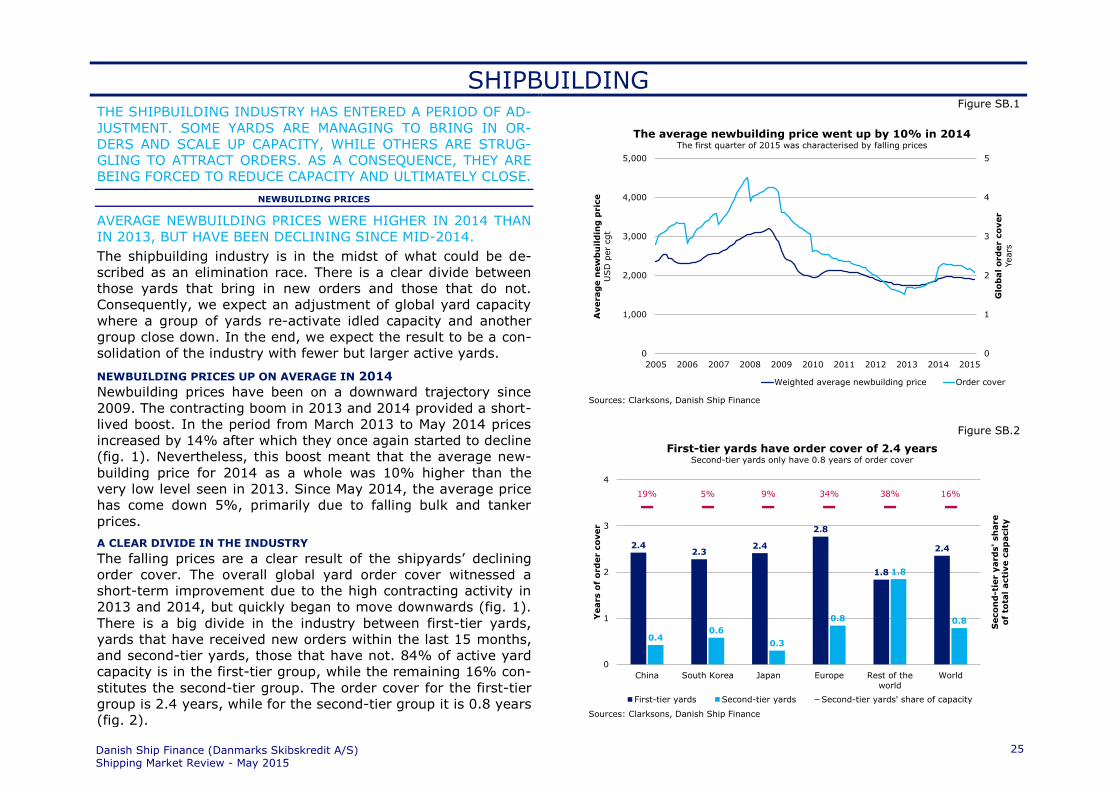
AVERAGE NEWBUILDING PRICES WERE HIGHER IN 2014 THAN
IN 2013, BUT HAVE BEEN DECLINING SINCE MID-2014.
The shipbuilding industry is in the midst of what could be de-
scribed as an elimination race. There is a clear divide between
those yards that bring in new orders and those that do not.
Consequently, we expect an adjustment of global yard capacity
where a group of yards re-activate idled capacity and another
group close down. In the end, we expect the result to be a con-
solidation of the industry with fewer but larger active yards.
NEWBUILDING PRICES UP ON AVERAGE IN 2014
Newbuilding prices have been on a downward trajectory since
2009. The contracting boom in 2013 and 2014 provided a short-
lived boost. In the period from March 2013 to May 2014 prices
increased by 14% after which they once again started to decline
(fig. 1). Nevertheless, this boost meant that the average new-
building price for 2014 as a whole was 10% higher than the
very low level seen in 2013. Since May 2014, the average price
has come down 5%, primarily due to falling bulk and tanker
prices.
A CLEAR DIVIDE IN THE INDUSTRY
The falling prices are a clear result of the shipyards’ declining
order cover. The overall global yard order cover witnessed a
short-term improvement due to the high contracting activity in
2013 and 2014, but quickly began to move downwards (fig. 1).
There is a big divide in the industry between first-tier yards,
yards that have received new orders within the last 15 months,
and second-tier yards, those that have not. 84% of active yard
capacity is in the first-tier group, while the remaining 16% con-
stitutes the second-tier group. The order cover for the first-tier
group is 2.4 years, while for the second-tier group it is 0.8 years
(fig. 2).
Figure SB.1
Figure SB.2
0
1
2
3
4
5
0
1,000
2,000
3,000
4,000
5,000
2005 2006 2007 2008 2009 2010 2011 2012 2013 2014 2015
Glo
bal ord
er c
over
Years
Averag
e n
ew
bu
ild
ing
pric
eU
SD
per
cgt
Sources: Clarksons, Danish Ship Finance
The average newbuilding price went up by 10% in 2014 The first quarter of 2015 was characterised by falling prices
Weighted average newbuilding price Order cover
2.42.3
2.4
2.8
1.8
2.4
0.40.6
0.3
0.8
1.8
0.8
19% 5% 9% 34% 38% 16%
-40000%-39906%-39812%-39718%-39624%-39530%-39436%-39342%-39248%-39154%-39060%-38966%-38872%-38778%-38684%-38590%-38496%-38402%-38308%-38214%-38120%-38026%-37932%-37838%-37744%-37650%-37556%-37462%-37368%-37274%-37180%-37086%-36992%-36898%-36804%-36710%-36616%-36522%-36428%-36334%-36240%-36146%-36052%-35958%-35864%-35770%-35676%-35582%-35488%-35394%-35300%-35206%-35112%-35018%-34924%-34830%-34736%-34642%-34548%-34454%-34360%-34266%-34172%-34078%-33984%-33890%-33796%-33702%-33608%-33514%-33420%-33326%-33232%-33138%-33044%-32950%-32856%-32762%-32668%-32574%-32480%-32386%-32292%-32198%-32104%-32010%-31916%-31822%-31728%-31634%-31540%-31446%-31352%-31258%-31164%-31070%-30976%-30882%-30788%-30694%-30600%-30506%-30412%-30318%-30224%-30130%-30036%-29942%-29848%-29754%-29660%-29566%-29472%-29378%-29284%-29190%-29096%-29002%-28908%-28814%-28720%-28626%-28532%-28438%-28344%-28250%-28156%-28062%-27968%-27874%-27780%-27686%-27592%-27498%-27404%-27310%-27216%-27122%-27028%-26934%-26840%-26746%-26652%-26558%-26464%-26370%-26276%-26182%-26088%-25994%-25900%-25806%-25712%-25618%-25524%-25430%-25336%-25242%-25148%-25054%-24960%-24866%-24772%-24678%-24584%-24490%-24396%-24302%-24208%-24114%-24020%-23926%-23832%-23738%-23644%-23550%-23456%-23362%-23268%-23174%-23080%-22986%-22892%-22798%-22704%-22610%-22516%-22422%-22328%-22234%-22140%-22046%-21952%-21858%-21764%-21670%-21576%-21482%-21388%-21294%-21200%-21106%-21012%-20918%-20824%-20730%-20636%-20542%-20448%-20354%-20260%-20166%-20072%-19978%-19884%-19790%-19696%-19602%-19508%-19414%-19320%-19226%-19132%-19038%-18944%-18850%-18756%-18662%-18568%-18474%-18380%-18286%-18192%-18098%-18004%-17910%-17816%-17722%-17628%-17534%-17440%-17346%-17252%-17158%-17064%-16970%-16876%-16782%-16688%-16594%-16500%-16406%-16312%-16218%-16124%-16030%-15936%-15842%-15748%-15654%-15560%-15466%-15372%-15278%-15184%-15090%-14996%-14902%-14808%-14714%-14620%-14526%-14432%-14338%-14244%-14150%-14056%-13962%-13868%-13774%-13680%-13586%-13492%-13398%-13304%-13210%-13116%-13022%-12928%-12834%-12740%-12646%-12552%-12458%-12364%-12270%-12176%-12082%-11988%-11894%-11800%-11706%-11612%-11518%-11424%-11330%-11236%-11142%-11048%-10954%-10860%-10766%-10672%-10578%-10484%-10390%-10296%-10202%-10108%-10014%-9920%-9826%-9732%-9638%-9544%-9450%-9356%-9262%-9168%-9074%-8980%-8886%-8792%-8698%-8604%-8510%-8416%-8322%-8228%-8134%-8040%-7946%-7852%-7758%-7664%-7570%-7476%-7382%-7288%-7194%-7100%-7006%-6912%-6818%-6724%-6630%-6536%-6442%-6348%-6254%-6160%-6066%-5972%-5878%-5784%-5690%-5596%-5502%-5408%-5314%-5220%-5126%-5032%-4938%-4844%-4750%-4656%-4562%-4468%-4374%-4280%-4186%-4092%-3998%-3904%-3810%-3716%-3622%-3528%-3434%-3340%-3246%-3152%-3058%-2964%-2870%-2776%-2682%-2588%-2494%-2400%-2306%-2212%-2118%-2024%-1930%-1836%-1742%-1648%-1554%-1460%-1366%-1272%-1178%-1084%-990%-896%-802%-708%-614%-520%-426%-332%-238%-144%-50%44%138%232%326%420%514%608%702%796%890%984%1078%1172%1266%1360%1454%1548%1642%1736%1830%1924%2018%2112%2206%2300%2394%2488%2582%2676%2770%2864%2958%3052%3146%3240%3334%3428%3522%3616%3710%3804%3898%3992%4086%4180%4274%4368%4462%4556%4650%4744%4838%4932%5026%5120%5214%5308%5402%5496%5590%5684%5778%5872%5966%6060%6154%6248%6342%6436%6530%6624%6718%6812%6906%7000%
0
1
2
3
4
China South Korea Japan Europe Rest of theworld
World
Seco
nd
-tie
r y
ard
s' sh
are
of
tota
l acti
ve c
ap
acit
y
Years o
f o
rd
er c
over
Sources: Clarksons, Danish Ship Finance
First-tier yards Second-tier yards Second-tier yards' share of capacity
First-tier yards have order cover of 2.4 yearsSecond-tier yards only have 0.8 years of order cover
Danish Ship Finance (Danmarks Skibskredit A/S) Shipping Market Review - May 2015
25

GLOBAL CONTRACTING
FIRST-TIER YARDS RESTOCKED 93% OF THEIR COMBINED CA-
PACITY IN 2014. CHINA RESTOCKED 93% OF ACTIVE FIRST-
TIER CAPACITY, SOUTH KOREA 86% AND JAPAN 94%.
41 MILLION CGT WAS CONTRACTED IN 2014
In 2014, 41 million cgt was contracted at the industry’s 300
first-tier yards, equivalent to 5% of the total world fleet. Alt-
hough this was moderate compared with 2013, it was a sub-
stantial volume in the light of the overcapacity in many ship
segments. 48% of the contracts placed in 2014 are scheduled to
be delivered in 2016. We estimate that there were around 700
active newbuilding yards in 2014, hence, there were approxi-
mately 400 second-tier yards that did not receive any orders. In
the first quarter of 2015, 5.6 million cgt were contracted at 67
yards, 35% less than in the same period in 2014.
CHINA RESTOCKED 93% OF FIRST-TIER CAPACITY IN 2014
The majority of orders placed in 2014 went to Chinese yards (16
million cgt or 38% of total contracting), primarily in the form of
bulk orders. Of China’s 200 active newbuilding yards, 100 yards,
representing 81% of capacity, received new orders, restocking
93% of their active capacity. In the first quarter of 2015, Chi-
nese yards only received orders amounting to 1.3 million cgt, or
24% of total world contracting. This was 80% lower than in the
same period in 2014, probably as a consequence of the sluggish
market for bulk vessels, still dominating the Chinese orderbooks.
SOUTH KOREA RESTOCKED 86% OF FIRST-TIER CAPACITY IN 2014
South Korean yards attracted orders amounting to 12 million
cgt in 2014. Of these, 49% were for gas vessels and another
25% were for tankers. Of South Korea’s 26 active yards, 12 re-
ceived new orders and restocked 86% of their capacity. So far
in 2015, 2.3 million cgt has been contracted at South Korean
yards, 50% less than in the same period last year.
JAPAN RESTOCKED 94% OF FIRST-TIER CAPACITY IN 2014
8.3 million cgt was contracted at Japanese yards in 2014, more
than half bulk orders. Contracts were divided between Japan’s
56 first-tier yards, representing 97% of domestic capacity.
These yards restocked 94% of their capacity. In the first quarter
of 2015, Japan received 1.6 million cgt, 48% less than in the
first quarter of 2014.
Figure SB.3
Figure SB.4
-
2
4
6
-
30
60
90
2005 2006 2007 2008 2009 2010 2011 2012 2013 2014 2015
Years o
f ord
er c
over
Mil
lio
n c
gt
Sources: Clarksons, Danish Ship Finance
41 million cgt was contracted in 20145.6 million cgt was contracted in the first quarter of 2015
China South Korea Japan Europe Rest of the World Order cover
81%95% 91%
66% 62%
84%
19%5% 9%
34% 38%
16%
0.4 0.6 0.3 0.8 1.8 0.8
-900.0
-700.0
-500.0
-300.0
-100.0
100.0
0%
50%
100%
150%
China South Korea Japan Europe Rest of theworld
Globalcapacity
Years o
f o
rd
er c
over
(Second-t
ier
yard
s)
Acti
ve y
ard
cap
acit
y
Sources: Clarksons, Danish Ship Finance
Yards representing 16% of global capacity have not received any new orders during the last 15 months
These yards are expected to run out of orders in less than a year
New orders in 2014 or 2015 No new orders in 2014 or 2015 Order cover for second-tier yards
Danish Ship Finance (Danmarks Skibskredit A/S) Shipping Market Review - May 2015
26

GLOBAL DELIVERIES
75% OF SCHEDULED ORDERS WERE DELIVERED IN 2014.
FIRST-TIER YARDS MANAGED TO DELIVER 81% OF SCHEDULED
ORDERS, WHILE SECOND-TIER YARDS ONLY DELIVERED 44%.
At the beginning of 2014, 49 million cgt was scheduled to enter
the world fleet. 75% of scheduled orders were delivered over
the year, equal to 36 million cgt, which was 6% less than in
2013. During the year, orders amounting to 6 million cgt were
cancelled and another 6 million cgt postponed for later delivery
(fig. 5). The first-tier yards accounted for 90% of deliveries and
performed significantly better than the second-tier yards, deliv-
ering 81% of scheduled orders, whereas second-tier yards only
delivered 44%. In the first quarter of 2015, 18 million cgt was
scheduled to be delivered, but only 9.6 million cgt entered the
fleet during the period.
CHINA DELIVERED 64% OF SCHEDULED ORDERS IN 2014
Chinese yards had 19 million cgt of orders scheduled for 2014.
Only 12 million cgt was actually delivered, representing a deliv-
ery ratio of 64% (fig 6). The first–tier yards delivered 74% of
scheduled orders (10.7 million cgt), while the second-tier yards
delivered 30%, equal to 1.3 million cgt. In the first quarter of
2015, 3.4 million cgt of the 7.7 million cgt scheduled orders was
delivered. First-tier yards delivered 48% and second-tier yards
28% of scheduled orders in the first quarter.
SOUTH KOREA DELIVERED 87% OF SCHEDULED ORDERS IN 2014
14 million cgt was scheduled to be delivered from South Korean
yards in 2014, and by year-end, 12 million cgt had actually
been delivered. First-tier yards delivered 87% of scheduled or-
ders and second-tier yards 83%. In the first quarter of 2015,
South Korea was scheduled to deliver 4.6 million cgt, but 3 mil-
lion cgt was actually delivered. First-tier yards delivered 84% of
scheduled orders in this quarter and second-tier yards 75%.
JAPAN DELIVERED 80% OF SCHEDULED ORDERS IN 2014
Japanese yards intended to deliver 9 million cgt in 2014, and
managed to deliver 7 million cgt. First-tier yards delivered 82%
of scheduled orders, while second-tier yards only delivered
59%. In the first quarter of 2015, Japan delivered 79% of
scheduled orders. The first-tier yards’ delivery performance was
78% and the second-tier yards’ was 98%.
Figure SB.5
Figure SB.6
19
4
3
12
14
12
8
7
3
2
5
3
-
20
40
60
-
20
40
60
Scheduled deliveries Cancellations Postponements Actual deliveries
Mil
lion
cg
t
Mil
lio
n c
gt
Sources: Clarksons, Danish Ship Finance
49 million cgt was scheduled for delivery in 201436 million cgt was actually delivered
China South Korea Japan Europe Rest of the world
12 12
7
2 3
7
2
2
0
2
64%
87%
80%83%
67%
0%
25%
50%
75%
100%
-
5
10
15
20
China South Korea Japan Europe Rest of theworld
Deli
very p
erfo
rm
an
ce
Mil
lio
n c
gt
Sources: Clarksons, Danish Ship Finance
75% of scheduled orders were delivered in 2014China only delivered 64% of scheduled orders
Actual deliveries Non-deliveries Delivery performance >>
Danish Ship Finance (Danmarks Skibskredit A/S) Shipping Market Review - May 2015
27

YARD CAPACITY AND UTILISATION
YARD CAPACITY CONTINUES TO DECLINE, BUT NOT ENOUGH
TO INCREASE UTILISATION RATES SIGNIFICANTLY. YARDS
UTILISED 68% OF THEIR ACTIVE CAPACITY IN 2014 UP FROM
66% IN 2013.
To get a better handle on the rather abstract concept of yard
capacity, we have chosen to distinguish between a yard’s histor-
ical maximum capacity, capacity that has been idled and that
can be re-activated if necessary, and active capacity, capacity
that is currently being utilised. For a detailed discussion of yard
capacity, please refer to the textbox at the end of this chapter.
YARD CAPACITY DECLINED BY 10% IN 2014
We estimate that active yard capacity was reduced by 6 million
cgt in 2014 (fig. 7). Of this, 3.4 million cgt was at yards that
closed down (around 200 yards) and 2.4 million cgt was at
yards that reduced active capacity (200 yards). As a result, ac-
tive global yard capacity was reduced to 53 million cgt.
CHINA AND SOUTH KOREA SCALED BACK ACTIVE CAPACITY
China reduced its active capacity by 12%. 69 yards with a com-
bined capacity of 1.8 million cgt closed down in 2014, while an-
other 24 yards reduced capacity by 1 million cgt. South Korea
reduced its active yard capacity by 10%. Of this, only five yards
closed down (0.3 million cgt), while 10-15 reduced their active
capacity by 1.5 million cgt.
GLOBAL YARD UTILISATION WAS 68% IN 2014
At the beginning of 2014, yard utilisation was estimated at 91%
for first-tier yards and 96% for second-tier yards. However, with
a delivery ratio of only 75% for the industry as a whole, the
group of first-tier yards only utilised 73% of their active capaci-
ty in 2014, while the second-tier group only utilised 43%. On
aggregate, 68% of global yard capacity was utilised in 2014, 2
percentage points higher than in 2013.
SECOND-TIER YARD UTILISATION LOW IN CHINA AND SOUTH KOREA
Chinese second-tier yards performed the worst of all, only utilis-
ing 32% of their active capacity (fig. 8). Second-tier yards in
South Korea and Japan did not perform much better; however,
note that the second-tier yards in South Korea and Japan only
constitute 5% and 9% of domestic yard capacity, respectively,
while in China they account for 19%.
Figure SB.7
Figure SB.8
-12%
-10%
-4%
-13%
-9%
-15%
-10%
-5%
0%
-3.0
-2.0
-1.0
0.0
China South Korea Japan Europe Rest of theworld
% o
f d
om
esti
c y
ard
cap
acit
y
Cap
acit
y a
dju
stm
en
ts
Million c
gt
Sources: Clarksons, Danish Ship Finance
Global yard capacity down 10% in 2014
2014 capacity adjustment Percentage change
63%
84%
78%
71%74% 73%
32%
37%
46%
57% 58%
43%
0%
25%
50%
75%
100%
0%
25%
50%
75%
100%
China South Korea Japan Europe Rest of theworld
Total
Uti
lisati
on
Uti
lisati
on
Sources: Clarksons, Danish Ship Finance
The first-tier group utilised 73% of capacity in 2014The second-tier group utilised 43% of capacity
First-tier yards Second-tier yards
Danish Ship Finance (Danmarks Skibskredit A/S) Shipping Market Review - May 2015
28
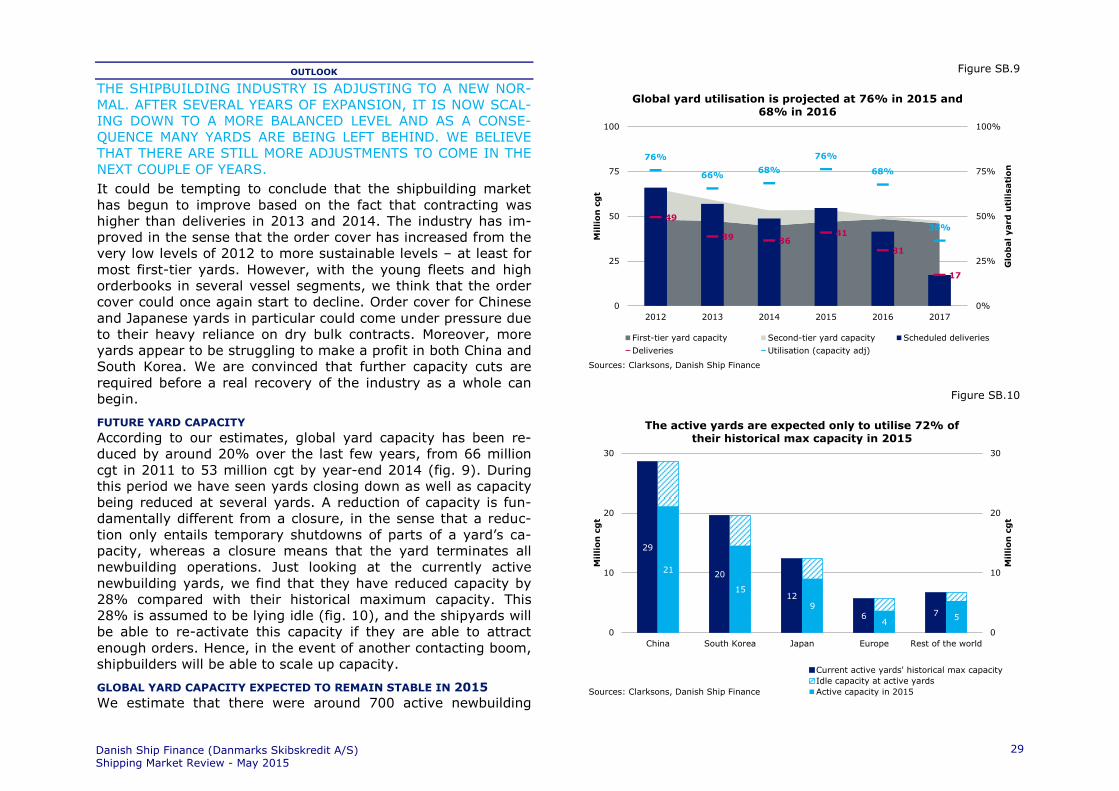
OUTLOOK
THE SHIPBUILDING INDUSTRY IS ADJUSTING TO A NEW NOR-
MAL. AFTER SEVERAL YEARS OF EXPANSION, IT IS NOW SCAL-
ING DOWN TO A MORE BALANCED LEVEL AND AS A CONSE-
QUENCE MANY YARDS ARE BEING LEFT BEHIND. WE BELIEVE
THAT THERE ARE STILL MORE ADJUSTMENTS TO COME IN THE
NEXT COUPLE OF YEARS.
It could be tempting to conclude that the shipbuilding market
has begun to improve based on the fact that contracting was
higher than deliveries in 2013 and 2014. The industry has im-
proved in the sense that the order cover has increased from the
very low levels of 2012 to more sustainable levels – at least for
most first-tier yards. However, with the young fleets and high
orderbooks in several vessel segments, we think that the order
cover could once again start to decline. Order cover for Chinese
and Japanese yards in particular could come under pressure due
to their heavy reliance on dry bulk contracts. Moreover, more
yards appear to be struggling to make a profit in both China and
South Korea. We are convinced that further capacity cuts are
required before a real recovery of the industry as a whole can
begin.
FUTURE YARD CAPACITY
According to our estimates, global yard capacity has been re-
duced by around 20% over the last few years, from 66 million
cgt in 2011 to 53 million cgt by year-end 2014 (fig. 9). During
this period we have seen yards closing down as well as capacity
being reduced at several yards. A reduction of capacity is fun-
damentally different from a closure, in the sense that a reduc-
tion only entails temporary shutdowns of parts of a yard’s ca-
pacity, whereas a closure means that the yard terminates all
newbuilding operations. Just looking at the currently active
newbuilding yards, we find that they have reduced capacity by
28% compared with their historical maximum capacity. This
28% is assumed to be lying idle (fig. 10), and the shipyards will
be able to re-activate this capacity if they are able to attract
enough orders. Hence, in the event of another contacting boom,
shipbuilders will be able to scale up capacity.
GLOBAL YARD CAPACITY EXPECTED TO REMAIN STABLE IN 2015
We estimate that there were around 700 active newbuilding
Figure SB.9
Figure SB.10
49
39 3641
31
17
76%
66%68%
76%
68%
36%
0%
25%
50%
75%
100%
0
25
50
75
100
2012 2013 2014 2015 2016 2017
Glo
bal yard
uti
lisati
on
Mil
lio
n c
gt
Sources: Clarksons, Danish Ship Finance
Global yard utilisation is projected at 76% in 2015 and 68% in 2016
First-tier yard capacity Second-tier yard capacity Scheduled deliveries
Deliveries Utilisation (capacity adj)
29
20
12
6 7
21
15
9
45
0
10
20
30
0
10
20
30
China South Korea Japan Europe Rest of the world
Mil
lion
cg
t
Mil
lio
n c
gt
Sources: Clarksons, Danish Ship Finance
The active yards are expected only to utilise 72% of their historical max capacity in 2015
Current active yards' historical max capacity
Idle capacity at active yards
Active capacity in 2015
Danish Ship Finance (Danmarks Skibskredit A/S) Shipping Market Review - May 2015
29
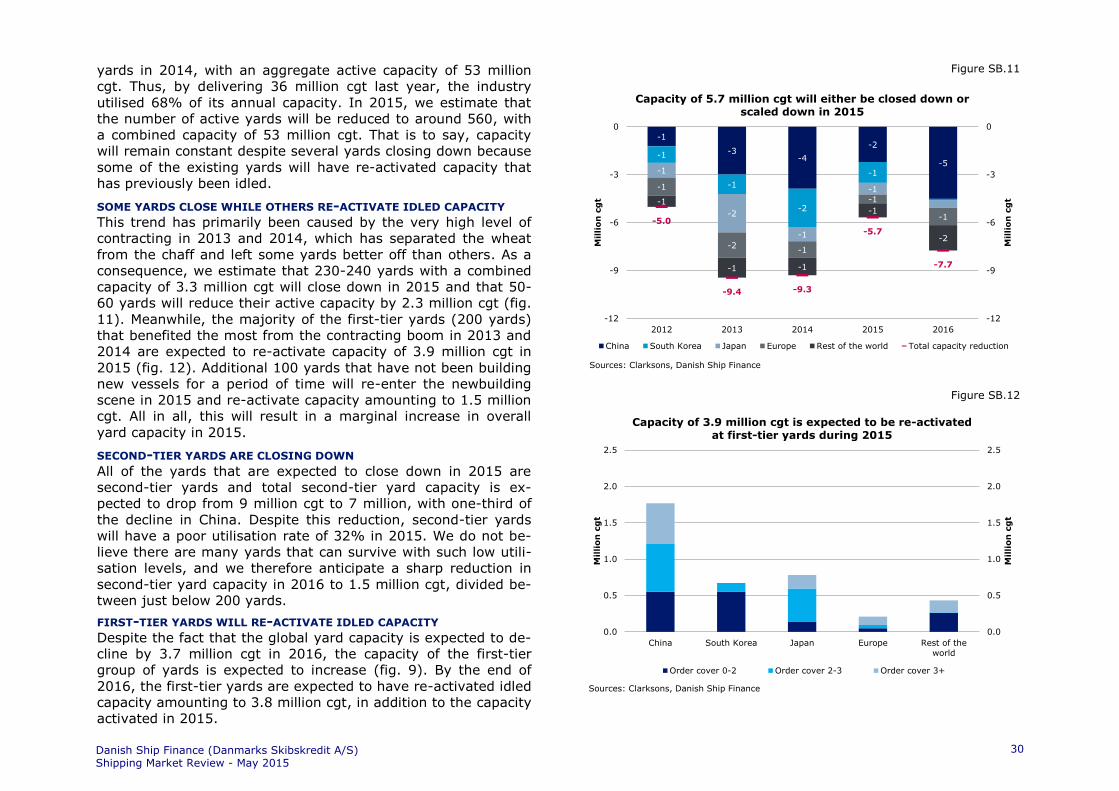
yards in 2014, with an aggregate active capacity of 53 million
cgt. Thus, by delivering 36 million cgt last year, the industry
utilised 68% of its annual capacity. In 2015, we estimate that
the number of active yards will be reduced to around 560, with
a combined capacity of 53 million cgt. That is to say, capacity
will remain constant despite several yards closing down because
some of the existing yards will have re-activated capacity that
has previously been idled.
SOME YARDS CLOSE WHILE OTHERS RE-ACTIVATE IDLED CAPACITY
This trend has primarily been caused by the very high level of
contracting in 2013 and 2014, which has separated the wheat
from the chaff and left some yards better off than others. As a
consequence, we estimate that 230-240 yards with a combined
capacity of 3.3 million cgt will close down in 2015 and that 50-
60 yards will reduce their active capacity by 2.3 million cgt (fig.
11). Meanwhile, the majority of the first-tier yards (200 yards)
that benefited the most from the contracting boom in 2013 and
2014 are expected to re-activate capacity of 3.9 million cgt in
2015 (fig. 12). Additional 100 yards that have not been building
new vessels for a period of time will re-enter the newbuilding
scene in 2015 and re-activate capacity amounting to 1.5 million
cgt. All in all, this will result in a marginal increase in overall
yard capacity in 2015.
SECOND-TIER YARDS ARE CLOSING DOWN
All of the yards that are expected to close down in 2015 are
second-tier yards and total second-tier yard capacity is ex-
pected to drop from 9 million cgt to 7 million, with one-third of
the decline in China. Despite this reduction, second-tier yards
will have a poor utilisation rate of 32% in 2015. We do not be-
lieve there are many yards that can survive with such low utili-
sation levels, and we therefore anticipate a sharp reduction in
second-tier yard capacity in 2016 to 1.5 million cgt, divided be-
tween just below 200 yards.
FIRST-TIER YARDS WILL RE-ACTIVATE IDLED CAPACITY
Despite the fact that the global yard capacity is expected to de-
cline by 3.7 million cgt in 2016, the capacity of the first-tier
group of yards is expected to increase (fig. 9). By the end of
2016, the first-tier yards are expected to have re-activated idled
capacity amounting to 3.8 million cgt, in addition to the capacity
activated in 2015.
Figure SB.11
Figure SB.12
-1
-3-4
-2
-5-1
-1
-2
-1-1
-2
-1
-1-1
-2-1
-1
-1
-1
-1 -1
-1
-2
-5.0
-9.4 -9.3
-5.7
-7.7
-12
-9
-6
-3
0
-12
-9
-6
-3
0
2012 2013 2014 2015 2016
Mil
lio
n c
gt
Mil
lio
n c
gt
Sources: Clarksons, Danish Ship Finance
Capacity of 5.7 million cgt will either be closed down or scaled down in 2015
China South Korea Japan Europe Rest of the world Total capacity reduction
0.0
0.5
1.0
1.5
2.0
2.5
0.0
0.5
1.0
1.5
2.0
2.5
China South Korea Japan Europe Rest of theworld
Mil
lion
cg
t
Mil
lio
n c
gt
Sources: Clarksons, Danish Ship Finance
Capacity of 3.9 million cgt is expected to be re-activated at first-tier yards during 2015
Order cover 0-2 Order cover 2-3 Order cover 3+
Danish Ship Finance (Danmarks Skibskredit A/S) Shipping Market Review - May 2015
30
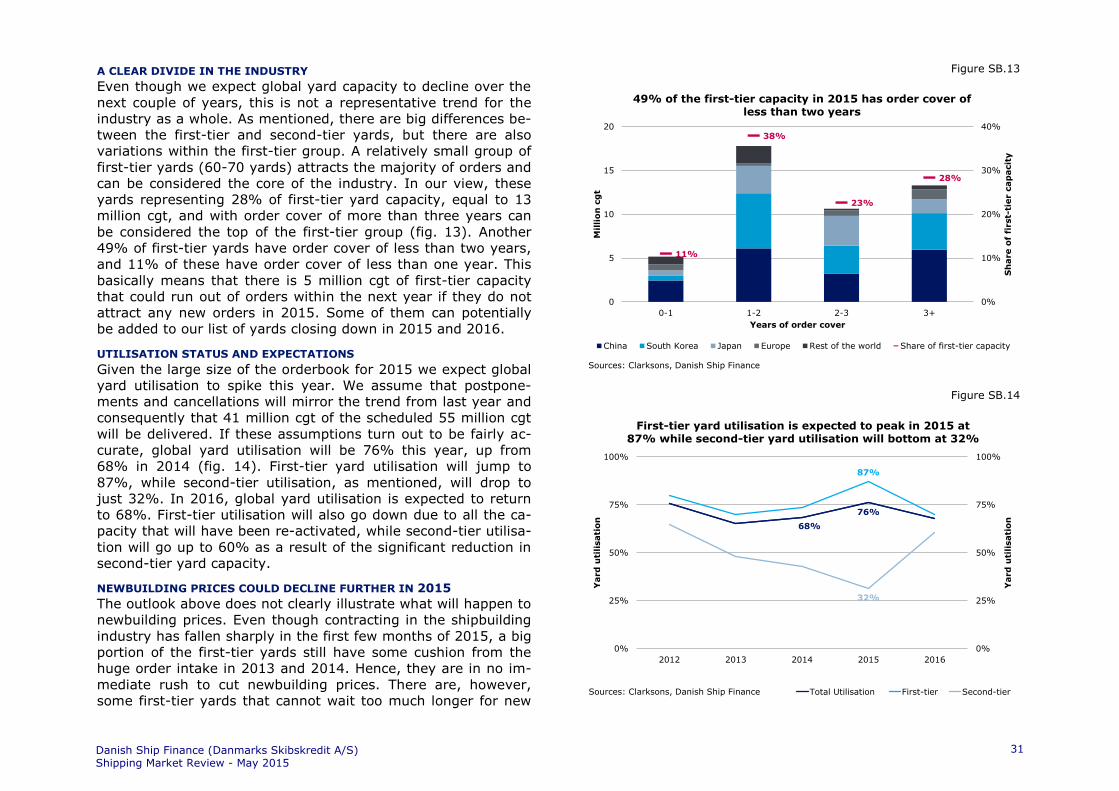
A CLEAR DIVIDE IN THE INDUSTRY
Even though we expect global yard capacity to decline over the
next couple of years, this is not a representative trend for the
industry as a whole. As mentioned, there are big differences be-
tween the first-tier and second-tier yards, but there are also
variations within the first-tier group. A relatively small group of
first-tier yards (60-70 yards) attracts the majority of orders and
can be considered the core of the industry. In our view, these
yards representing 28% of first-tier yard capacity, equal to 13
million cgt, and with order cover of more than three years can
be considered the top of the first-tier group (fig. 13). Another
49% of first-tier yards have order cover of less than two years,
and 11% of these have order cover of less than one year. This
basically means that there is 5 million cgt of first-tier capacity
that could run out of orders within the next year if they do not
attract any new orders in 2015. Some of them can potentially
be added to our list of yards closing down in 2015 and 2016.
UTILISATION STATUS AND EXPECTATIONS
Given the large size of the orderbook for 2015 we expect global
yard utilisation to spike this year. We assume that postpone-
ments and cancellations will mirror the trend from last year and
consequently that 41 million cgt of the scheduled 55 million cgt
will be delivered. If these assumptions turn out to be fairly ac-
curate, global yard utilisation will be 76% this year, up from
68% in 2014 (fig. 14). First-tier yard utilisation will jump to
87%, while second-tier utilisation, as mentioned, will drop to
just 32%. In 2016, global yard utilisation is expected to return
to 68%. First-tier utilisation will also go down due to all the ca-
pacity that will have been re-activated, while second-tier utilisa-
tion will go up to 60% as a result of the significant reduction in
second-tier yard capacity.
NEWBUILDING PRICES COULD DECLINE FURTHER IN 2015
The outlook above does not clearly illustrate what will happen to
newbuilding prices. Even though contracting in the shipbuilding
industry has fallen sharply in the first few months of 2015, a big
portion of the first-tier yards still have some cushion from the
huge order intake in 2013 and 2014. Hence, they are in no im-
mediate rush to cut newbuilding prices. There are, however,
some first-tier yards that cannot wait too much longer for new
Figure SB.13
Figure SB.14
11%
38%
23%
28%
0%
10%
20%
30%
40%
0
5
10
15
20
0-1 1-2 2-3 3+
Sh
are o
f fi
rst-
tier c
ap
acit
y
Mil
lio
n c
gt
Years of order cover
49% of the first-tier capacity in 2015 has order cover of less than two years
China South Korea Japan Europe Rest of the world Share of first-tier capacity
Sources: Clarksons, Danish Ship Finance
76%
87%
32%
68%
0%
25%
50%
75%
100%
0%
25%
50%
75%
100%
2012 2013 2014 2015 2016
Yard
uti
lisati
on
Yard
uti
lisati
on
Sources: Clarksons, Danish Ship Finance Total Utilisation First-tier Second-tier
First-tier yard utilisation is expected to peak in 2015 at 87% while second-tier yard utilisation will bottom at 32%
Danish Ship Finance (Danmarks Skibskredit A/S) Shipping Market Review - May 2015
31
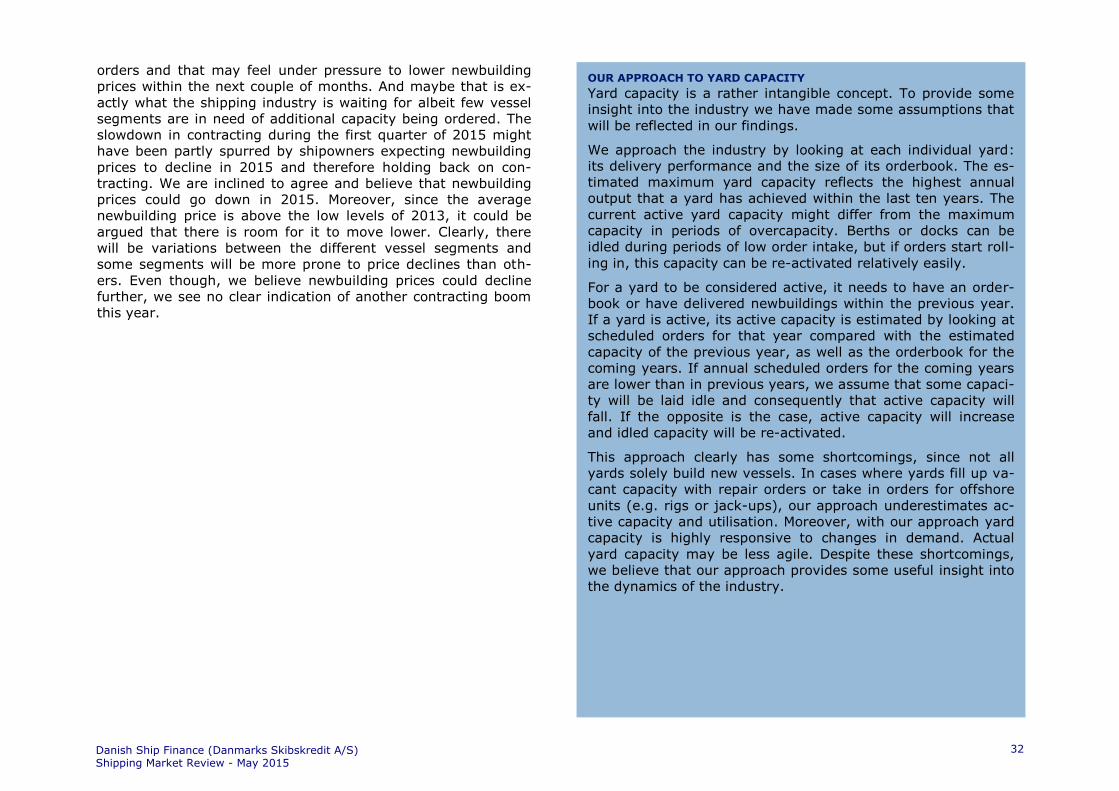
orders and that may feel under pressure to lower newbuilding
prices within the next couple of months. And maybe that is ex-
actly what the shipping industry is waiting for albeit few vessel
segments are in need of additional capacity being ordered. The
slowdown in contracting during the first quarter of 2015 might
have been partly spurred by shipowners expecting newbuilding
prices to decline in 2015 and therefore holding back on con-
tracting. We are inclined to agree and believe that newbuilding
prices could go down in 2015. Moreover, since the average
newbuilding price is above the low levels of 2013, it could be
argued that there is room for it to move lower. Clearly, there
will be variations between the different vessel segments and
some segments will be more prone to price declines than oth-
ers. Even though, we believe newbuilding prices could decline
further, we see no clear indication of another contracting boom
this year.
OUR APPROACH TO YARD CAPACITY
Yard capacity is a rather intangible concept. To provide some
insight into the industry we have made some assumptions that
will be reflected in our findings.
We approach the industry by looking at each individual yard:
its delivery performance and the size of its orderbook. The es-
timated maximum yard capacity reflects the highest annual
output that a yard has achieved within the last ten years. The
current active yard capacity might differ from the maximum
capacity in periods of overcapacity. Berths or docks can be
idled during periods of low order intake, but if orders start roll-
ing in, this capacity can be re-activated relatively easily.
For a yard to be considered active, it needs to have an order-
book or have delivered newbuildings within the previous year.
If a yard is active, its active capacity is estimated by looking at
scheduled orders for that year compared with the estimated
capacity of the previous year, as well as the orderbook for the
coming years. If annual scheduled orders for the coming years
are lower than in previous years, we assume that some capaci-
ty will be laid idle and consequently that active capacity will
fall. If the opposite is the case, active capacity will increase
and idled capacity will be re-activated.
This approach clearly has some shortcomings, since not all
yards solely build new vessels. In cases where yards fill up va-
cant capacity with repair orders or take in orders for offshore
units (e.g. rigs or jack-ups), our approach underestimates ac-
tive capacity and utilisation. Moreover, with our approach yard
capacity is highly responsive to changes in demand. Actual
yard capacity may be less agile. Despite these shortcomings,
we believe that our approach provides some useful insight into
the dynamics of the industry.
Danish Ship Finance (Danmarks Skibskredit A/S) Shipping Market Review - May 2015
32

CONTAINER
SHIPPING MARKET REVIEW – MAY 2015

CONTAINER
THE MARKET PLAYERS CONTINUE TO INVEST IN THE FUTURE
BASED ON ASSUMPTIONS OF THE PAST. WE ARGUE THAT THE
POTENTIAL FOR FUTURE CONTAINER DEMAND IS STRUCTURAL-
LY REDUCED, AND THAT LONG-TERM CONTAINER VOLUMES
COULD CONTRACT IF MANUFACTURING IS RE-SHORED.
FREIGHT RATES
2014 STARTED OFF WITH MORE STABLE BOX RATES, BUT IN
THE SECOND HALF, BOX RATES BEGAN TO DECLINE. IN 2015,
THEY HAVE FALLEN TO THEIR LOWEST LEVEL IN THREE YEARS.
THE 2014 AVERAGE BOX RATE REMAINED AT THE 2013 LEVEL
The average box rate out of China weakened in the fourth quar-
ter of 2014 due to lower freight rates on the trade to Europe.
This led to the annual average rate in 2014 being only marginal-
ly higher than in 2013. Yet, the route from China to the Mediter-
ranean experienced the largest percentage rate increase year-
on-year compared with 2013 (+14%), whereas the service to
Australia/New Zealand experienced the biggest decline (-11%).
BOX RATES DECLINED IN THE FIRST QUARTER OF 2015
Since the beginning of 2015, the average rate out of China has
fallen by 9%, to the lowest level in three years. Once again, it is
the trade from China to Europe that is struggling to maintain
stable rates despite several General Rate Increase attempts. As
of April 2015, the box rate on this trade has fallen 17%. The
reason for this is the massive inflow of large vessels, which has
upset the trade balance and pushed down utilisation. To address
this, the Transpacific Stabilization Agreement is recommending
introducing general rate minimums instead of rate increases.
TIMECHARTER RATES ON AN UPWARD TRAJECTORY
For quite some time, timecharter rates have remained at very
low levels that have barely covered OPEX (fig. 2). By the fourth
quarter of 2014, timecharter rates began to rise, especially in
the Panamax segment, where the ongoing fleet contraction co-
incided with the congestion problems on the US west coast. The
rate increases have continued in 2015, spilling over into the
Sub-Panamax and Handy segments in particular. Overall, the
average timecharter rate went up by 2% in 2014 year-on-year,
and by a further 6% in the first quarter of 2015.
Figure C.1
Figure C.2
08-2010
1,215
12-2011881
05-20121,336
969
570
820
1,070
1,320
1,570
570
820
1,070
1,320
1,570
2005 2006 2007 2008 2009 2010 2011 2012 2013 2014 2015 2016
In
dex
In
dex
The average container box rate out of China The 2014 annual average was only marginally up on 2013
CCFI Composite IndexSources: Clarksons, Danish Ship Finance
Annual average
01-2010-90
03-2011504
119
-500
0
500
1,000
1,500
2,000
-500
0
500
1,000
1,500
2,000
2005 2006 2007 2008 2009 2010 2011 2012 2013 2014 2015
Pro
fita
bil
ity I
nd
ex
(2004 =
Index 1
,000)
Pro
fita
bil
ity I
nd
ex
(2004 =
Index 1
,000)
Profitability Index for the Panama-transitable segments(Timecharter rate per teu less OPEX per teu)
Sources: Clarksons, Drewry, Danish Ship Finance
Profitability Index
Danish Ship Finance (Danmarks Skibskredit A/S) Shipping Market Review - May 2015
34

Asia→Europe 24%
Asia→North
America 23%
Intra-Asia 10%
Asia→Africa 6%
Asia→South
America 5% Asia→Middle East
4%
Asia→FSU 4%
Europe→North
America 3%
Europe→Africa 2%
Other 17%
Top-ten head-haul container trades 2014Measured in teu miles
Asia→Central America
and the Caribbean 2%
Sources: IHS Global Insight, Danish Ship Finance
Figure C.3
Danish Ship Finance (Danmarks Skibskredit A/S) Shipping Market Review - May 2015
35
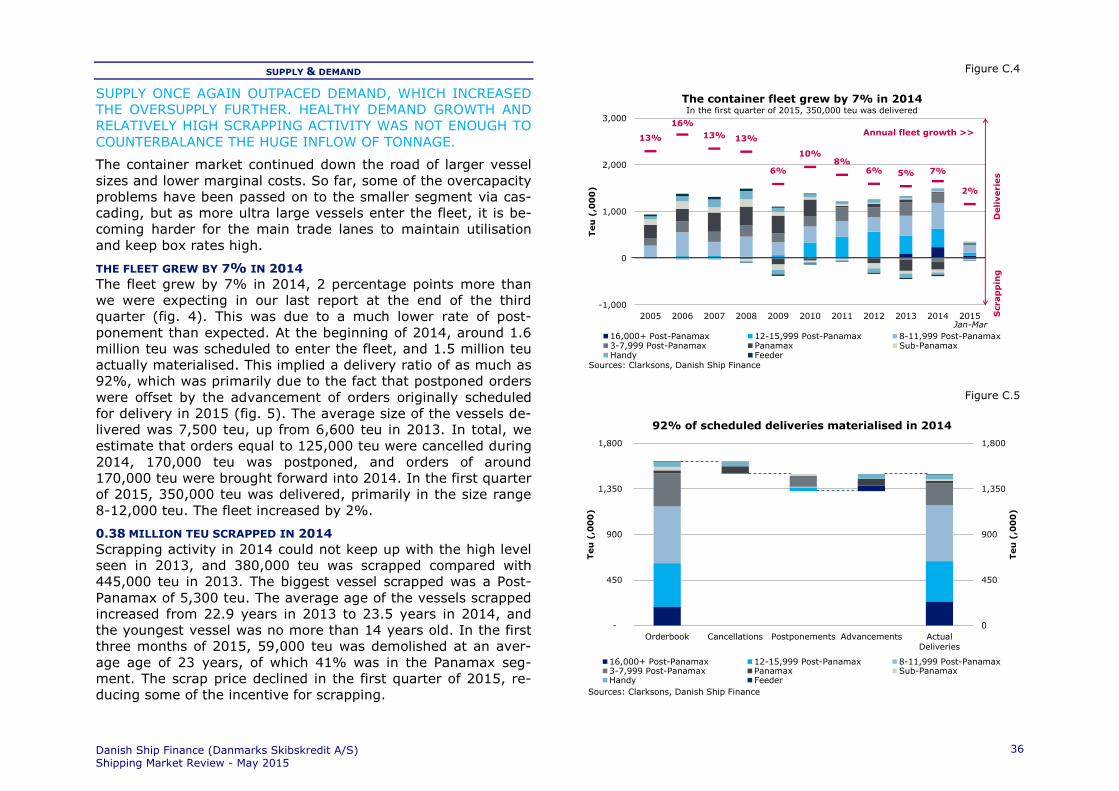
SUPPLY & DEMAND
SUPPLY ONCE AGAIN OUTPACED DEMAND, WHICH INCREASED
THE OVERSUPPLY FURTHER. HEALTHY DEMAND GROWTH AND
RELATIVELY HIGH SCRAPPING ACTIVITY WAS NOT ENOUGH TO
COUNTERBALANCE THE HUGE INFLOW OF TONNAGE.
The container market continued down the road of larger vessel
sizes and lower marginal costs. So far, some of the overcapacity
problems have been passed on to the smaller segment via cas-
cading, but as more ultra large vessels enter the fleet, it is be-
coming harder for the main trade lanes to maintain utilisation
and keep box rates high.
THE FLEET GREW BY 7% IN 2014
The fleet grew by 7% in 2014, 2 percentage points more than
we were expecting in our last report at the end of the third
quarter (fig. 4). This was due to a much lower rate of post-
ponement than expected. At the beginning of 2014, around 1.6
million teu was scheduled to enter the fleet, and 1.5 million teu
actually materialised. This implied a delivery ratio of as much as
92%, which was primarily due to the fact that postponed orders
were offset by the advancement of orders originally scheduled
for delivery in 2015 (fig. 5). The average size of the vessels de-
livered was 7,500 teu, up from 6,600 teu in 2013. In total, we
estimate that orders equal to 125,000 teu were cancelled during
2014, 170,000 teu was postponed, and orders of around
170,000 teu were brought forward into 2014. In the first quarter
of 2015, 350,000 teu was delivered, primarily in the size range
8-12,000 teu. The fleet increased by 2%.
0.38 MILLION TEU SCRAPPED IN 2014
Scrapping activity in 2014 could not keep up with the high level
seen in 2013, and 380,000 teu was scrapped compared with
445,000 teu in 2013. The biggest vessel scrapped was a Post-
Panamax of 5,300 teu. The average age of the vessels scrapped
increased from 22.9 years in 2013 to 23.5 years in 2014, and
the youngest vessel was no more than 14 years old. In the first
three months of 2015, 59,000 teu was demolished at an aver-
age age of 23 years, of which 41% was in the Panamax seg-
ment. The scrap price declined in the first quarter of 2015, re-
ducing some of the incentive for scrapping.
Figure C.4
Figure C.5
13%
16%
13% 13%
6%
10%8%
6% 5% 7%
2%
-20%
-10%
0%
10%
20%
-1,000
0
1,000
2,000
3,000
2005 2006 2007 2008 2009 2010 2011 2012 2013 2014 2015
Teu
(,0
00
)
Sources: Clarksons, Danish Ship Finance
The container fleet grew by 7% in 2014In the first quarter of 2015, 350,000 teu was delivered
16,000+ Post-Panamax 12-15,999 Post-Panamax 8-11,999 Post-Panamax3-7,999 Post-Panamax Panamax Sub-PanamaxHandy Feeder
Annual fleet growth >>
Deli
verie
sS
crap
pin
g
Jan-Mar
0
450
900
1,350
1,800
-
450
900
1,350
1,800
Orderbook Cancellations Postponements Advancements ActualDeliveries
Teu
(,0
00
)
Teu
(,0
00
)
Sources: Clarksons, Danish Ship Finance
92% of scheduled deliveries materialised in 2014
16,000+ Post-Panamax 12-15,999 Post-Panamax 8-11,999 Post-Panamax3-7,999 Post-Panamax Panamax Sub-PanamaxHandy Feeder
Danish Ship Finance (Danmarks Skibskredit A/S) Shipping Market Review - May 2015
36
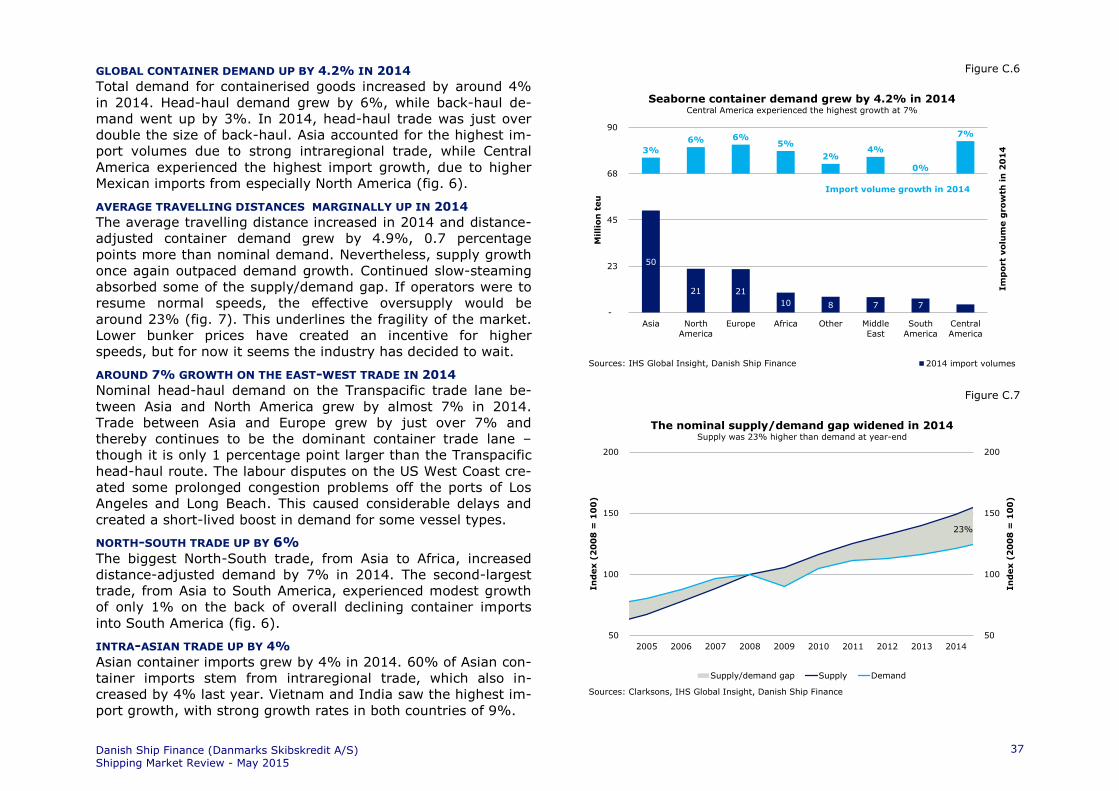
GLOBAL CONTAINER DEMAND UP BY 4.2% IN 2014
Total demand for containerised goods increased by around 4%
in 2014. Head-haul demand grew by 6%, while back-haul de-
mand went up by 3%. In 2014, head-haul trade was just over
double the size of back-haul. Asia accounted for the highest im-
port volumes due to strong intraregional trade, while Central
America experienced the highest import growth, due to higher
Mexican imports from especially North America (fig. 6).
AVERAGE TRAVELLING DISTANCES MARGINALLY UP IN 2014
The average travelling distance increased in 2014 and distance-
adjusted container demand grew by 4.9%, 0.7 percentage
points more than nominal demand. Nevertheless, supply growth
once again outpaced demand growth. Continued slow-steaming
absorbed some of the supply/demand gap. If operators were to
resume normal speeds, the effective oversupply would be
around 23% (fig. 7). This underlines the fragility of the market.
Lower bunker prices have created an incentive for higher
speeds, but for now it seems the industry has decided to wait.
AROUND 7% GROWTH ON THE EAST-WEST TRADE IN 2014
Nominal head-haul demand on the Transpacific trade lane be-
tween Asia and North America grew by almost 7% in 2014.
Trade between Asia and Europe grew by just over 7% and
thereby continues to be the dominant container trade lane –
though it is only 1 percentage point larger than the Transpacific
head-haul route. The labour disputes on the US West Coast cre-
ated some prolonged congestion problems off the ports of Los
Angeles and Long Beach. This caused considerable delays and
created a short-lived boost in demand for some vessel types.
NORTH-SOUTH TRADE UP BY 6%
The biggest North-South trade, from Asia to Africa, increased
distance-adjusted demand by 7% in 2014. The second-largest
trade, from Asia to South America, experienced modest growth
of only 1% on the back of overall declining container imports
into South America (fig. 6).
INTRA-ASIAN TRADE UP BY 4%
Asian container imports grew by 4% in 2014. 60% of Asian con-
tainer imports stem from intraregional trade, which also in-
creased by 4% last year. Vietnam and India saw the highest im-
port growth, with strong growth rates in both countries of 9%.
Figure C.6
Figure C.7
50
21 21
10 8 7 7
3%
6% 6%5%
2%4%
0%
7%
-30%
-20%
-10%
0%
10%
-
23
45
68
90
Asia North
America
Europe Africa Other Middle
East
South
America
Central
America
Im
po
rt
volu
me g
ro
wth
in
20
14
Mil
lio
n t
eu
Sources: IHS Global Insight, Danish Ship Finance
Seaborne container demand grew by 4.2% in 2014Central America experienced the highest growth at 7%
2014 import volumes
Import volume growth in 2014
23%
50
100
150
200
50
100
150
200
2005 2006 2007 2008 2009 2010 2011 2012 2013 2014
In
dex (
20
08
= 1
00
)
In
dex (
20
08
= 1
00
)
Sources: Clarksons, IHS Global Insight, Danish Ship Finance
The nominal supply/demand gap widened in 2014Supply was 23% higher than demand at year-end
Supply/demand gap Supply Demand
Danish Ship Finance (Danmarks Skibskredit A/S) Shipping Market Review - May 2015
37

CONTRACTING AND SHIP VALUES
CONTRACTING SLOWED IN 2014 AND CONTINUED TO BE DOM-
INATED BY ORDERS FOR LARGE POST-PANAMAX VESSELS. AV-
ERAGE NEWBUILDING PRICES WENT UP, WHILE SECONDHAND
VALUES DROPPED TOWARDS THE END OF THE YEAR.
956,000 TEU CONTRACTED IN 2014
The contracting preferences of the last couple of years were re-
peated in 2014, as 87% of all contracts, equal to 820,000 teu or
64 vessels, were for Post-Panamax vessels. Of these contracts,
72% were for vessels of 12,000 teu or above. There was also
some activity in the Sub-Panamax and Handy segments, where
29 and 39 vessels, respectively, were ordered. In the first quar-
ter of 2015, 359,000 teu was contracted, 89% for vessels larger
than 16,000 teu (fig. 8). In March, we saw the first orders for
21,100 teu vessels and rumour has it that it might not be long
before orders are placed for even larger vessels.
RISING NEWBUILDING PRICES, FALLING SECONDHAND VALUES
Average newbuilding prices went up by 8% across all segments
in 2014. Reportedly, the biggest increases were for the belea-
guered Panamax vessels which finally caught some tailwind.
However, no orders have been placed for Panamax vessels in
the past two years, which makes the price development some-
what theoretical. Even though contracting slowed significantly in
2014 from 2013, the increasing trend in newbuilding prices
could be a consequence of the rather small number of yards
building the very large Post-Panamax vessels. Only 14 different
yards have historically built vessels above 12,000 teu, and
hence there is less price competition between these yards.
Secondhand values declined by 6% year-on-year in 2014. Prices
started to dip in the fourth quarter, and by the end of March
2015, average secondhand prices were down almost 20% on the
2014 average. Values for the larger Panama-transitable seg-
ments, however, increased slightly in the first quarter.
PRICE/EARNINGS RATIOS IMPROVED IN 2014
The relationship between earnings and vessel prices remained
relatively stable in 2014. Price/earnings ratios hovered around
24 over the year (i.e. USD 24 was paid for a USD 1 cash flow),
down from an average of 30 in 2013. In 2015, ratios have fallen
to a level in line with the average from 2000 to 2015 (fig. 9).
Figure C.8
Figure C.9
0
1
2
3
4
0
750
1,500
2,250
3,000
2005 2006 2007 2008 2009 2010 2011 2012 2013 2014 2015
Averag
e d
eli
very t
ime
Years
Teu
(,0
00
)
Sources: Clarksons, Danish Ship Finance
Contracting activity slowed in 2014 87% of contracting was in the Post-Panamax segment
16,000+ Post-Panamax 12-15,999 Post-Panamax 8-11,999 Post-Panamax
3-7,999 Post-Panamax Panamax Sub-Panamax
Handy Feeder Delivery time
22 months
Avg. container delivery time >>
6.7
22.1
0
25
50
75
100
0
25
50
75
100
2005 2006 2007 2008 2009 2010 2011 2012 2013 2014 2015
Pric
e/
earn
ing
s r
ati
o
Pric
e/
earn
ing
s r
ati
o
Sources: Clarksons, Danish Ship Finance
Handy - 5-year-old Avg. 2000-2008 P/E ratio Avg. 2009-2015 P/E ratio
Period in which OPEX surpassed the timecharter rate
Price/Earnings ratios were stable in 2014In the first quarter of 2015, P/E ratios have come down to the long-term average of 15
Danish Ship Finance (Danmarks Skibskredit A/S) Shipping Market Review - May 2015
38

OUTLOOK
THE CONTAINER INDUSTRY WILL CONTINUE TO BE UNDER
PRESSURE IN THE COMING YEARS FROM THE MASSIVE OVER-
SUPPLY. FROM 2017, THE MARKET MIGHT IMPROVE IF CON-
TRACTING IS KEPT LOW AND DEMAND CONTINUES TO GROW
AT HEALTHY RATES.
Despite years of weak trade growth, the container industry con-
tinues to plan for the future as if past patterns will still apply.
But will they? Past trade expansions were shaped by some ra-
ther strong effects that seem unlikely to be repeated in the fu-
ture (e.g. China’s WTO membership in December 2001). The
global shift in manufacturing from advanced economies to low-
er-cost countries was a one-time effect that is now losing
steam. Once production has been offshored, it does not add to
incremental trade growth. Besides, the level of containerisation
seems to have plateaued and significant additional jumps are
unlikely in the years to come. The container industry is scaling
up to bigger vessel sizes. It could be argued that a new contain-
er market is about to emerge, but the path to higher freight
rates is expected to be long and bumpy. As virtually none of the
larger vessels are candidates for scrapping due to old age, any
future capacity adjustments among the larger sizes will have to
be premature and thereby value-destructive for the owners (fig.
10).
TONNAGE PROVIDERS SCALE UP MARKET EXPOSURE
Liner companies have seized the opportunity in the weak market
to cut costs, scale back newbuilding plans on their own books
and form strategic alliances with competitors. Some tonnage
providers are, to a certain extent, being left behind. Others are
bravely scaling up their dependence on the liners by making
heavy investments in new, larger vessels (fig. 11). Let us hope
that the short-term returns on their investments are large
enough to be worth the considerable residual risk after the end
of the charter period.
THE COST-CUTTING STRATEGY IS DRIVING FREIGHT RATES DOWN
According to economic theory, freight rates will approach mar-
ginal costs in perfectly competitive markets. True, the container
industry is far from perfectly competitive, but the continued
overordering of larger vessels, adding to the supply surplus, has
Figure C.10
Figure C.11
43%
32%
14%
9%
2% 1%
18%
0%
10%
20%
30%
40%
50%
0
2
4
6
8
10
0-5 5-10 10-15 15-20 20-25 25+ Orderbook
% o
f con
tain
er f
leet
Co
nta
iner f
leet
Million t
eu
Sources: Clarksons, Danish Ship Finance
75% of the container fleet is between 0 and 10 years oldThe orderbook-to-fleet ratio is 18%
16,000+ Post Panamax 12-15,999 Post Panamax 8-11,999 Post Panamax3-7,999 Post Panamax Panamax Sub-PanamaxHandy Feeder % of world fleet
0%
20%
40%
60%
80%
100%
0
2,000
4,000
6,000
8,000
10,000
2005 2006 2007 2008 2009 2010 2011 2012 2013 2014 2015
Sh
are o
f o
rd
erb
oo
k
Averag
e v
essel siz
e
Sources: Clarksons, Danish Ship Finance
Tonnage providers' share of orderbook
Avg. vessel size (Tonnage provider orderbook)
Avg. vessel size (Liner operator orderbook)
Tonnage providers' share of the orderbook amounts to 68%Tonnage providers have been scaling up in vessel sizes while liner operators have
begun to scale down
Danish Ship Finance (Danmarks Skibskredit A/S) Shipping Market Review - May 2015
39

been driving a deflationary freight rate trend. Consequently, few
owners are making the expected short-term profits on their cur-
rent investments.
THE ORDERBOOK AMOUNTS TO 3.3 MILLION TEU
The orderbook is gradually declining, but remains massive. As of
April 2015, it has come down to 3.3 million teu, equal to 18% of
the current fleet. 50% of the orderbook is scheduled to be deliv-
ered as early as this year (fig. 10). Tonnage providers have in-
creased their share of the orderbook from around 38% in 2012
to 68% today. The average vessel on order by tonnage provid-
ers is 25% larger than that of the liner operators (fig. 11). Half
of the tonnage providers’ current orderbook is for vessels of
more than 14,000 teu. Is the change in the composition of the
orderbook an indication that many of the liners do not have the
financial strength to order the vessels themselves? Or does it
reflect the fact that liners continue to prefer a balanced mix of
owned and chartered vessels in order to maintain operational
flexibility? We do not know the answer. But the residual risk for
tonnage providers after the end of a charter period seems set to
increase if the strategic alliances are sustained.
1.9 MILLION TEU SCHEDULED FOR DELIVERY IN 2015
At the beginning of this year, 1.9 million teu was scheduled to
be delivered in 2015. As of April, remaining deliveries for the
rest of the year amount to around 1.5 million teu. Hence, before
accounting for any additional scrapping or postponements, the
fleet is scheduled to grow by 10% in 2015.
350,000 TEU EXPECTED TO BE SCRAPPED IN 2015
We have identified 1.4 million teu of potential scrapping candi-
dates in 2015, our criteria being that a vessel becomes eligible
for scrapping the year before its next special survey, starting at
the fourth. In addition to the 59,000 teu already scrapped in
2015, we estimate that just over 300,000 teu of the 1.4 million
scrapping candidates will be demolished. All in all, this would
result in total demolition of around 350,000 teu, which is 8%
lower than in 2014.
7% FLEET GROWTH IN 2015
In addition to scrapping, we also assume that a share of sched-
uled orders will be postponed to 2016. The container segment
has historically seen fairly high delivery ratios. We presume that
Figure C.12
Figure C.13
10%
8%
6%
5%
7%
7%
3%
0%
-2%
3%
8%
-0.6
0.0
0.6
1.2
1.8
2010 2011 2012 2013 2014 2015 2016 2017
Mil
lio
n t
eu
Sources: Clarksons, Danish Ship Finance
The container fleet is expected to grow by 7% in 2015After adjusting for postponements and scrapping
16,000+ Post Panamax 12-15,999 Post Panamax 8-11,999 Post Panamax3-7,999 Post Panamax Panamax Sub-PanamaxHandy Feeder
Net fleet growth, year-on-year
Deli
verie
sS
crap
pin
g
2538
496210
18
19
22
14
20
23
29
13
26
33
39
0
45
90
135
180
0
45
90
135
180
2002 2008 2014 2018
Million
teu
Million
teu
Container import volumes are on average expected to increase 5.2% annually in the coming years
Asia Europe North America Other
CAGR 8.9%
CAGR 5.2%
Sources: IHS Global Insight, Danish Ship Finance
CAGR 3.2%
Annual container demand growth
Danish Ship Finance (Danmarks Skibskredit A/S) Shipping Market Review - May 2015
40

this will be repeated in 2015 and expect a delivery ratio of
around 90%. If our estimates for scrapping and postponements
hold, the fleet will grow by close to 7% in 2015, increasing the
overall fleet by 1.4 million teu, the highest teu intake since 2008
(fig. 12).
HIGH EXPECTATIONS FOR SEABORNE CONTAINER DEMAND IN 2015
Demand for seaborne container goods in 2015 is expected to
remain relatively strong and grow by 5%. Asia is expected to
show the highest demand growth at 6%, primarily driven by 7%
growth in intraregional trade. Over the next four years, sea-
borne container demand is projected to grow at an annual aver-
age rate of 5.2% (fig. 13).
CONTAINER DISTANCES EXPECTED TO BECOME SLIGHTLY SHORTER
Distance-adjusted demand is expected to grow in line with nom-
inal demand in 2015. According to our forecasts, distances are
set to become slightly shorter over the next three years (fig.
14). The graph shows that distances have only made a marginal
contribution to container demand since 2008. In the years from
2002 to 2008, distances added almost 2 percentage points to
demand, but in the years ahead we anticipate a slightly negative
growth contribution from distances.
THE OVERCAPACITY WILL NOT DECLINE UNTIL 2017
Given our current expectations for both supply and demand
growth in 2015, we anticipate a further deterioration in the
overcapacity situation this year. According to our calculations,
the nominal oversupply will increase to 26% of the fleet in 2015
before peaking at 27% in 2016. Thereafter, if contracting can be
kept at reasonable levels – lower than in the previous two years
– we believe that the overcapacity will slowly begin to decline by
2017 (fig. 15).
THE REVIVAL OF THE PANAMA-TRANSITABLE SEGMENTS
The upturn in the Panama-transitable segments in the first
quarter of 2015 came as something of a surprise, as fundamen-
tals have not improved significantly since last year. The conges-
tion problems did undeniably help boost demand for these seg-
ments, but the problems have now been more or less resolved
and can no longer be credited for the upturn. It could be that
Figure C.14
Figure C.15
-3%
0%
3%
6%
9%
12%
-3%
0%
3%
6%
9%
12%
2002-2008 2008-2014 2014-2018
Percen
tag
e g
ro
wth
in
dem
an
d
Percen
tag
e g
ro
wth
in
dem
an
d
Sources: IHS Global Insight, Danish Ship Finance
Container distances are expected to contribute negatively to demand between 2014 and 2018
Growth in demand Growth in distances
23%
27%
19%
50
100
150
200
50
100
150
200
In
dex (
20
08
= 1
00
)
In
dex (
20
08
= 1
00
)
Sources: Clarksons, IHS Global Insight, Danish Ship Finance
The nominal supply/demand gap will increaseThe gap will increase in the next two years before slowly starting to decline
Supply/demand gap Supply Demand
Danish Ship Finance (Danmarks Skibskredit A/S) Shipping Market Review - May 2015
41
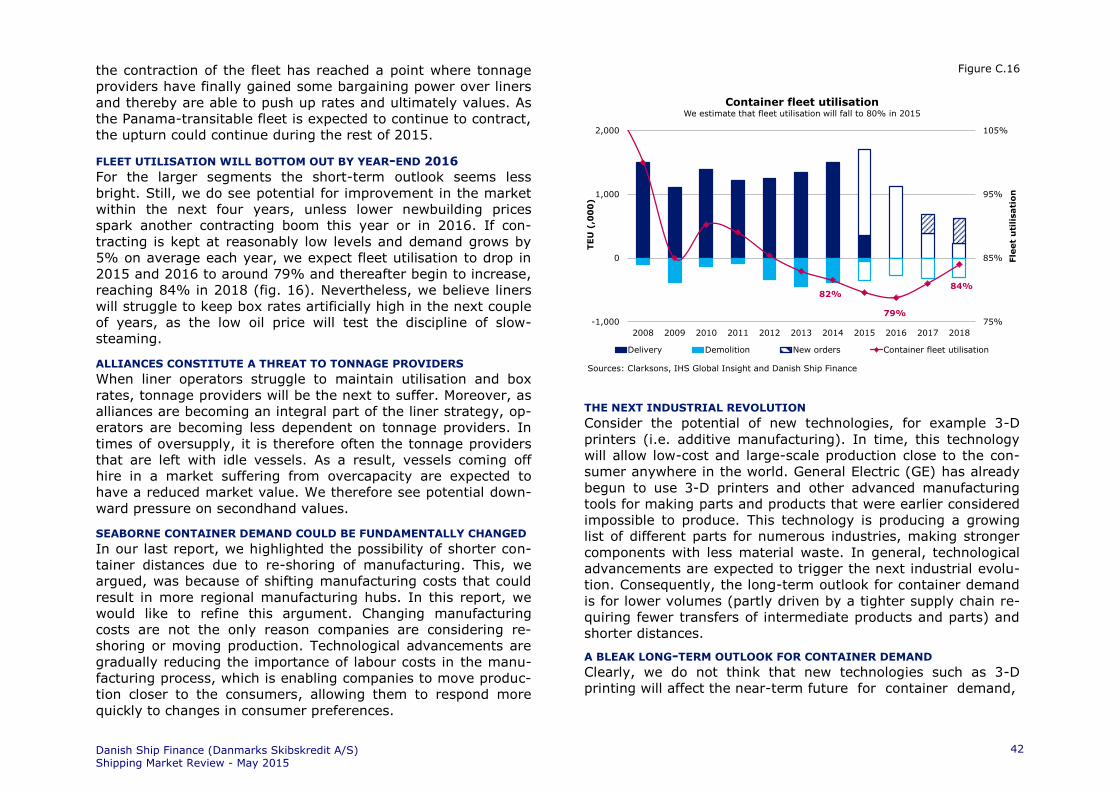
the contraction of the fleet has reached a point where tonnage
providers have finally gained some bargaining power over liners
and thereby are able to push up rates and ultimately values. As
the Panama-transitable fleet is expected to continue to contract,
the upturn could continue during the rest of 2015.
FLEET UTILISATION WILL BOTTOM OUT BY YEAR-END 2016
For the larger segments the short-term outlook seems less
bright. Still, we do see potential for improvement in the market
within the next four years, unless lower newbuilding prices
spark another contracting boom this year or in 2016. If con-
tracting is kept at reasonably low levels and demand grows by
5% on average each year, we expect fleet utilisation to drop in
2015 and 2016 to around 79% and thereafter begin to increase,
reaching 84% in 2018 (fig. 16). Nevertheless, we believe liners
will struggle to keep box rates artificially high in the next couple
of years, as the low oil price will test the discipline of slow-
steaming.
ALLIANCES CONSTITUTE A THREAT TO TONNAGE PROVIDERS
When liner operators struggle to maintain utilisation and box
rates, tonnage providers will be the next to suffer. Moreover, as
alliances are becoming an integral part of the liner strategy, op-
erators are becoming less dependent on tonnage providers. In
times of oversupply, it is therefore often the tonnage providers
that are left with idle vessels. As a result, vessels coming off
hire in a market suffering from overcapacity are expected to
have a reduced market value. We therefore see potential down-
ward pressure on secondhand values.
SEABORNE CONTAINER DEMAND COULD BE FUNDAMENTALLY CHANGED
In our last report, we highlighted the possibility of shorter con-
tainer distances due to re-shoring of manufacturing. This, we
argued, was because of shifting manufacturing costs that could
result in more regional manufacturing hubs. In this report, we
would like to refine this argument. Changing manufacturing
costs are not the only reason companies are considering re-
shoring or moving production. Technological advancements are
gradually reducing the importance of labour costs in the manu-
facturing process, which is enabling companies to move produc-
tion closer to the consumers, allowing them to respond more
quickly to changes in consumer preferences.
Figure C.16
THE NEXT INDUSTRIAL REVOLUTION
Consider the potential of new technologies, for example 3-D
printers (i.e. additive manufacturing). In time, this technology
will allow low-cost and large-scale production close to the con-
sumer anywhere in the world. General Electric (GE) has already
begun to use 3-D printers and other advanced manufacturing
tools for making parts and products that were earlier considered
impossible to produce. This technology is producing a growing
list of different parts for numerous industries, making stronger
components with less material waste. In general, technological
advancements are expected to trigger the next industrial evolu-
tion. Consequently, the long-term outlook for container demand
is for lower volumes (partly driven by a tighter supply chain re-
quiring fewer transfers of intermediate products and parts) and
shorter distances.
A BLEAK LONG-TERM OUTLOOK FOR CONTAINER DEMAND
Clearly, we do not think that new technologies such as 3-D
printing will affect the near-term future for container demand,
82%
79%
84%
75%
85%
95%
105%
-1,000
0
1,000
2,000
2008 2009 2010 2011 2012 2013 2014 2015 2016 2017 2018
Fle
et
uti
lisati
on
TEU
(,0
00
)
Sources: Clarksons, IHS Global Insight and Danish Ship Finance
Container fleet utilisation We estimate that fleet utilisation will fall to 80% in 2015
Delivery Demolition New orders Container fleet utilisation
Danish Ship Finance (Danmarks Skibskredit A/S) Shipping Market Review - May 2015
42

but we do believe that lower volumes and shorter distances
could shape the long-term outlook for container demand within
the lifetime of vessels recently ordered (i.e. before 2040). The
consequences could be significant, not just for the long head-
haul routes from Asia to Europe and North America, but also for
the intra-Asian component trades and the back-haul volumes
from North America and Europe to Asia.
VOLUMES AND DISTANCES MAY DECLINE IN THE FUTURE
So while the Chinese membership of the WTO in December 2001
marked the beginning of the rising tide that lifted all vessels be-
tween 2002 and 2008, the next industrial revolution, potentially
initiated by the 3-D printer or the like, could put a drain on vol-
umes and travelling distances. If these rather challenging forces
come into play simultaneously, it will mean a fairly bleak outlook
for the largest container vessels, while some of the smaller
segments may experience a renaissance some day in the future.
Danish Ship Finance (Danmarks Skibskredit A/S) Shipping Market Review - May 2015
43

DRY BULK
SHIPPING MARKET REVIEW – MAY 2015
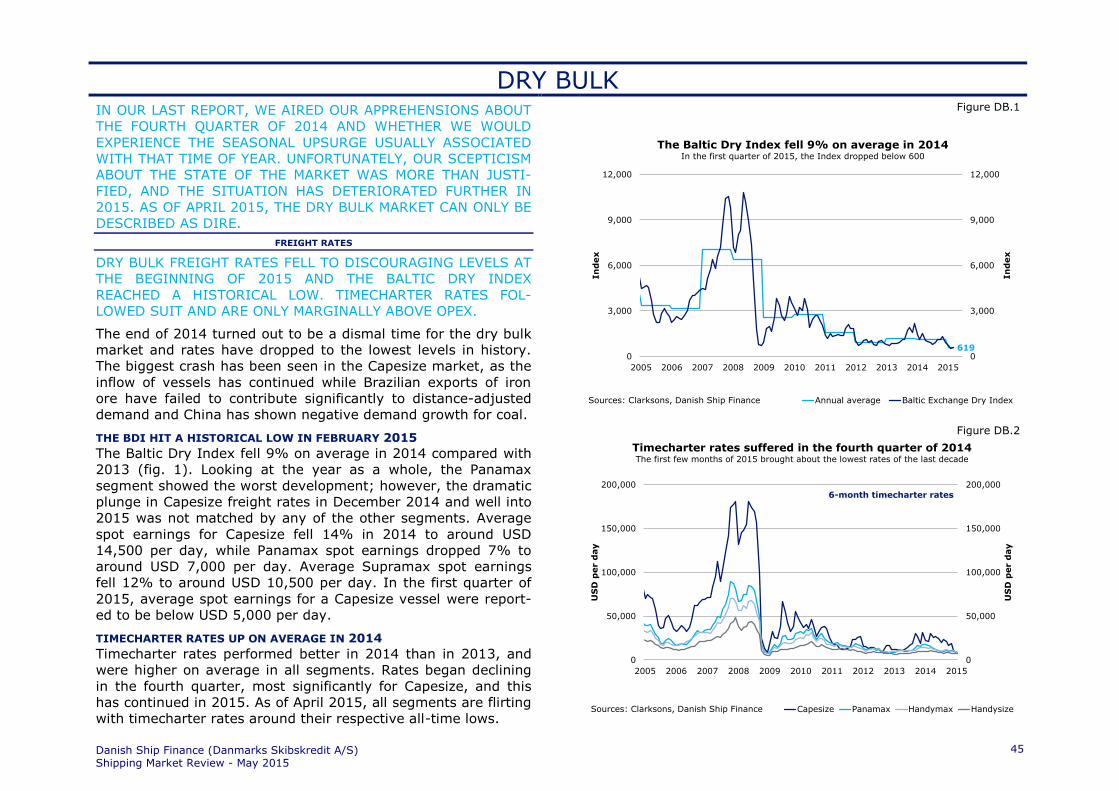
DRY BULK
IN OUR LAST REPORT, WE AIRED OUR APPREHENSIONS ABOUT
THE FOURTH QUARTER OF 2014 AND WHETHER WE WOULD
EXPERIENCE THE SEASONAL UPSURGE USUALLY ASSOCIATED
WITH THAT TIME OF YEAR. UNFORTUNATELY, OUR SCEPTICISM
ABOUT THE STATE OF THE MARKET WAS MORE THAN JUSTI-
FIED, AND THE SITUATION HAS DETERIORATED FURTHER IN
2015. AS OF APRIL 2015, THE DRY BULK MARKET CAN ONLY BE
DESCRIBED AS DIRE.
FREIGHT RATES
DRY BULK FREIGHT RATES FELL TO DISCOURAGING LEVELS AT
THE BEGINNING OF 2015 AND THE BALTIC DRY INDEX
REACHED A HISTORICAL LOW. TIMECHARTER RATES FOL-
LOWED SUIT AND ARE ONLY MARGINALLY ABOVE OPEX.
The end of 2014 turned out to be a dismal time for the dry bulk
market and rates have dropped to the lowest levels in history.
The biggest crash has been seen in the Capesize market, as the
inflow of vessels has continued while Brazilian exports of iron
ore have failed to contribute significantly to distance-adjusted
demand and China has shown negative demand growth for coal.
THE BDI HIT A HISTORICAL LOW IN FEBRUARY 2015
The Baltic Dry Index fell 9% on average in 2014 compared with
2013 (fig. 1). Looking at the year as a whole, the Panamax
segment showed the worst development; however, the dramatic
plunge in Capesize freight rates in December 2014 and well into
2015 was not matched by any of the other segments. Average
spot earnings for Capesize fell 14% in 2014 to around USD
14,500 per day, while Panamax spot earnings dropped 7% to
around USD 7,000 per day. Average Supramax spot earnings
fell 12% to around USD 10,500 per day. In the first quarter of
2015, average spot earnings for a Capesize vessel were report-
ed to be below USD 5,000 per day.
TIMECHARTER RATES UP ON AVERAGE IN 2014
Timecharter rates performed better in 2014 than in 2013, and
were higher on average in all segments. Rates began declining
in the fourth quarter, most significantly for Capesize, and this
has continued in 2015. As of April 2015, all segments are flirting
with timecharter rates around their respective all-time lows.
Figure DB.1
Figure DB.2
6190
3,000
6,000
9,000
12,000
0
3,000
6,000
9,000
12,000
2005 2006 2007 2008 2009 2010 2011 2012 2013 2014 2015
In
dex
In
dex
Annual average Baltic Exchange Dry IndexSources: Clarksons, Danish Ship Finance
The Baltic Dry Index fell 9% on average in 2014In the first quarter of 2015, the Index dropped below 600
0
50,000
100,000
150,000
200,000
0
50,000
100,000
150,000
200,000
2005 2006 2007 2008 2009 2010 2011 2012 2013 2014 2015
US
D p
er d
ay
US
D p
er d
ay
Timecharter rates suffered in the fourth quarter of 2014The first few months of 2015 brought about the lowest rates of the last decade
Capesize Panamax Handymax HandysizeSources: Clarksons, Danish Ship Finance
6-month timecharter rates
Danish Ship Finance (Danmarks Skibskredit A/S) Shipping Market Review - May 2015
45
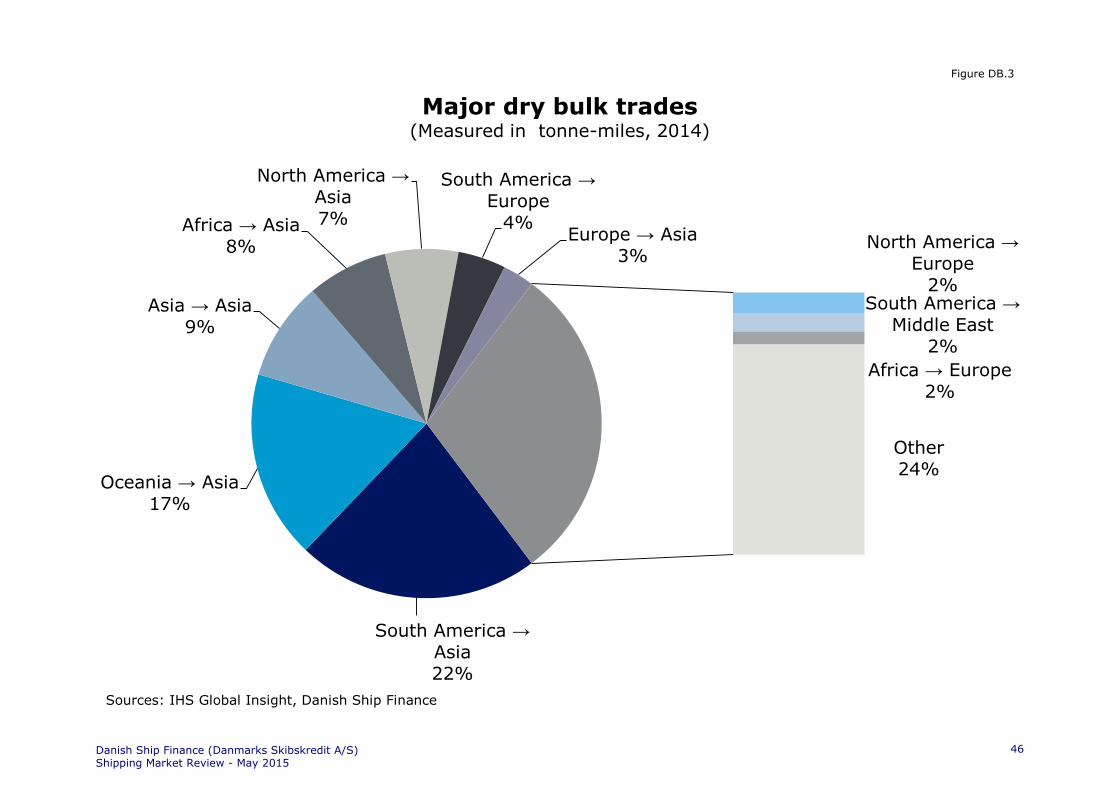
South America →Asia22%
Oceania → Asia17%
Asia → Asia9%
Africa → Asia
8%
North America →
Asia7%
South America →Europe
4%Europe → Asia
3%North America →
Europe2%
South America →
Middle East2%
Africa → Europe2%
Other24%
Major dry bulk trades(Measured in tonne-miles, 2014)
Sources: IHS Global Insight, Danish Ship Finance
Figure DB.3
Danish Ship Finance (Danmarks Skibskredit A/S) Shipping Market Review - May 2015
46

SUPPLY & DEMAND
THERE IS ALMOST NOTHING POSITIVE TO SAY ABOUT THE DRY
BULK SUPPLY SITUATION AT THE MOMENT. WHAT IT BOILS
DOWN TO IS THAT THERE ARE TOO MANY VESSELS AT SEA,
AND IN THE ORDERBOOK, AND THAT DEMAND DOES NOT HAVE
THE SUFFICIENT STRENGTH TO MAKE A DIFFERENCE.
48 MILLION DWT WAS DELIVERED IN 2014
At the beginning of 2014, 75 million dwt was scheduled to enter
the fleet, and by year-end, 48 million had actually been deliv-
ered, 23% less than in 2013 (fig. 4). Orders amounting to 16
million dwt were cancelled over the year, while another 11 mil-
lion were deferred for delivery in 2015. Hence, 64% of all sched-
uled orders were delivered in 2014. 38% of the delivered orders,
in dwt terms, were Capesize vessels. Measured by the number of
vessels, Handymax was the most frequently delivered vessel
type and also saw the most cancellations (fig. 5). In the first
quarter of 2015, 15 million dwt was delivered.
SCRAPPING ACTIVITY DROPPED 31% IN 2014 COMPARED WITH 2013
Scrapping activity slowed in 2014 and only 16 million dwt was
scrapped. The average scrapping age fell from 28 years in 2013
to 27 years in 2014. All segments saw declines in the average
scrapping age with the exception of the Capesize segment,
where the average age increased slightly from 23.2 years to
23.6. However, the average scrapping age for Capesize vessels
so far in 2015 has dropped below 21 years.
THE DRY BULK FLEET GREW BY 4.4% IN 2014
The dry bulk fleet grew by 4.4% in 2014, which was only mar-
ginally lower than the level we were expecting by the end of the
third quarter. The depressed market conditions in the fourth
quarter, however, resulted in slightly higher scrapping activity
than we had expected, which lowered the fleet growth.
DRY BULK DEMAND GREW BY 4.1% IN 2014
In line with the lacklustre performance of the industry in 2014,
demand grew by 4.1% - 0.3 percentage points less than supply
(fig. 6). Hence, the oversupply widened further. Supply has
grown significantly faster than demand over a long period of time
and as a consequence, a 1% increase in demand is no longer
able to absorb a 1% increase in supply (fig. 7). Distance-
adjusted demand increased by 4.6%, indicating that distances
Figure DB.4
Figure DB.5
7% 7% 7% 7%
10%
17%
15%
11%
6%4%
1%
-8%
0%
8%
16%
24%
-40
0
40
80
120
2005 2006 2007 2008 2009 2010 2011 2012 2013 2014 2015
Mil
lion
dw
t
Sources: Clarksons, Danish Ship Finance
The dry bulk fleet grew by 4.4% in 201448 million dwt was delivered while 16 million dwt was scrapped
Capesize Panamax Handymax Handysize
Annual fleet growth
Deli
verie
sS
crap
pin
g
Jan-Mar
25
4
19
24
5
6
13
18
6
11
8
5
0
20
40
60
80
0
20
40
60
80
Orderbook Cancellations Postponements Actual Deliveries
Mil
lio
n d
wt
Mil
lio
n d
wt
Sources: Clarksons, Danish Ship Finance
64% of scheduled orders were delivered in 201422% of orders were cancelled
Capesize Panamax Handymax Handysize
Danish Ship Finance (Danmarks Skibskredit A/S) Shipping Market Review - May 2015
47

contributed to lowering the cargo-carrying capacity of the fleet.
IRON ORE DEMAND WENT UP BY 13%
Annual global steel production only grew by 1% in 2014, down
from 4% in 2013. Counterintuitively, this slow-down did not af-
fect the iron ore trade. Demand increased by 13% on the back of
the declining iron ore price, which fell by around 50% in 2014
and by another 25% in the first quarter of 2015. On 1 April, the
price reached a historical low of USD 48 per tonne.
CHINA CONTINUED IMPORTING DESPITE SLOWING STEEL PRODUCTION
China’s steel production, constituting 50% of the world total, saw
zero growth, whereas its nominal iron ore imports grew by 19%.
81% of the volume growth stemmed from higher imports from
Australia, where there were significant mine expansions. Only
8% came from Brazil. This led to historically high Chinese inven-
tory levels of more than 1 million tonnes on average in 2014.
THE DOWNFALL OF THE CAPESIZE SEGMENT
As mentioned, the majority of the growth in the iron ore trade
was from Australia to China. Consequently, distances did not
contribute significantly to distance-adjusted demand, which grew
by 10% in 2014, compared to the nominal growth of 13%. The
smaller contribution from travel distances was one of the reasons
why the Capesize segment fared so badly in the fourth quarter of
2014 and at the beginning of 2015. Given the relatively short
distance from Australia to China, these imports resulted in an
increase in the cargo-carrying capacity of the Capesize fleet
compared with if they had come from Brazil. For a long time Aus-
tralia has been the biggest exporter of nominal iron ore volumes
into China, whereas Brazil has been the biggest exporter in
terms of distance-adjusted demand. This has, however, been
changing over the last couple of years. In 2014, Australia caught
up with Brazil and is now contributing just as much to distance-
adjusted demand, lowering the utilisation of the Capesize fleet.
The unemployed Capesize vessels sought comfort in the already
strained Panamax market by cannibalising on some of the tradi-
tional Panamax trades.
COAL DEMAND UP BY 1%
The main headlines from the coal trade in 2014 were the decline
in Chinese imports, China’s slowing domestic production and the
general oversupply on the world market. In the past few years,
Figure DB.6
Figure DB.7
4.7%
-1.9%
1.7%
19.5%
3.1%
-1.5%
4.2%
-200.0%
-150.0%
-100.0%
-50.0%
0.0%
50.0%
-
1,000
2,000
3,000
4,000
5,000
Asia Europe Africa NorthAmerica
MiddleEast
SouthAmerica
Other
Im
po
rt
volu
me g
ro
wth
20
14
Im
port
volu
mes 2
01
4(M
illion t
onnes)
Sources: IHS Global Insight, Danish Ship Finance
Dry bulk demand grew by 4.1% in 2014North America experienced the highest growth in all commodities except grain
Iron Ore Coal Grain Minor Bulk
Import volume growth in 2014
24%
29%
50
100
150
200
50
100
150
200
2005 2006 2007 2008 2009 2010 2011 2012 2013 2014
In
dex (
20
08
= 1
00
)
In
dex (
20
08
= 1
00
)
Sources: Clarksons, IHS Global Insight, Danish Ship Finance
The nominal supply/demand gap widened in 2014Supply is currently 29% higher than demand
Supply/demand gap Supply Demand
Danish Ship Finance (Danmarks Skibskredit A/S) Shipping Market Review - May 2015
48
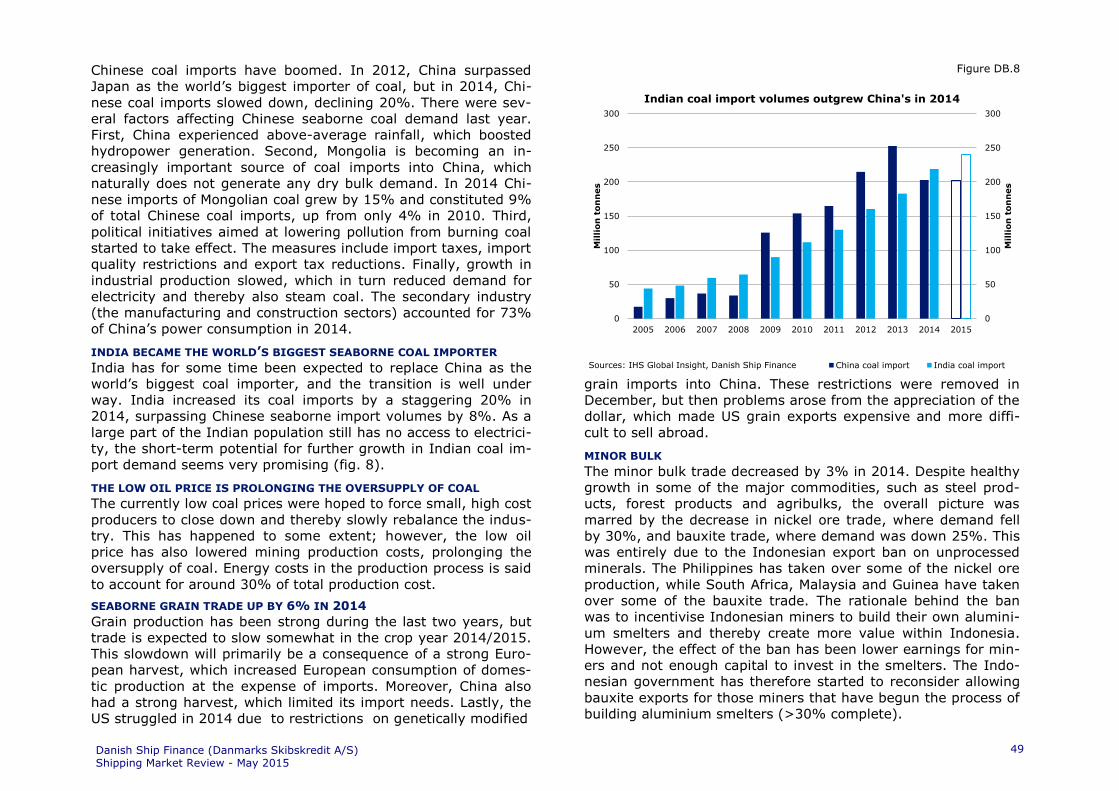
Chinese coal imports have boomed. In 2012, China surpassed
Japan as the world’s biggest importer of coal, but in 2014, Chi-
nese coal imports slowed down, declining 20%. There were sev-
eral factors affecting Chinese seaborne coal demand last year.
First, China experienced above-average rainfall, which boosted
hydropower generation. Second, Mongolia is becoming an in-
creasingly important source of coal imports into China, which
naturally does not generate any dry bulk demand. In 2014 Chi-
nese imports of Mongolian coal grew by 15% and constituted 9%
of total Chinese coal imports, up from only 4% in 2010. Third,
political initiatives aimed at lowering pollution from burning coal
started to take effect. The measures include import taxes, import
quality restrictions and export tax reductions. Finally, growth in
industrial production slowed, which in turn reduced demand for
electricity and thereby also steam coal. The secondary industry
(the manufacturing and construction sectors) accounted for 73%
of China’s power consumption in 2014.
INDIA BECAME THE WORLD’S BIGGEST SEABORNE COAL IMPORTER
India has for some time been expected to replace China as the
world’s biggest coal importer, and the transition is well under
way. India increased its coal imports by a staggering 20% in
2014, surpassing Chinese seaborne import volumes by 8%. As a
large part of the Indian population still has no access to electrici-
ty, the short-term potential for further growth in Indian coal im-
port demand seems very promising (fig. 8).
THE LOW OIL PRICE IS PROLONGING THE OVERSUPPLY OF COAL
The currently low coal prices were hoped to force small, high cost
producers to close down and thereby slowly rebalance the indus-
try. This has happened to some extent; however, the low oil
price has also lowered mining production costs, prolonging the
oversupply of coal. Energy costs in the production process is said
to account for around 30% of total production cost.
SEABORNE GRAIN TRADE UP BY 6% IN 2014
Grain production has been strong during the last two years, but
trade is expected to slow somewhat in the crop year 2014/2015.
This slowdown will primarily be a consequence of a strong Euro-
pean harvest, which increased European consumption of domes-
tic production at the expense of imports. Moreover, China also
had a strong harvest, which limited its import needs. Lastly, the
US struggled in 2014 due to restrictions on genetically modified
Figure DB.8
grain imports into China. These restrictions were removed in
December, but then problems arose from the appreciation of the
dollar, which made US grain exports expensive and more diffi-
cult to sell abroad.
MINOR BULK
The minor bulk trade decreased by 3% in 2014. Despite healthy
growth in some of the major commodities, such as steel prod-
ucts, forest products and agribulks, the overall picture was
marred by the decrease in nickel ore trade, where demand fell
by 30%, and bauxite trade, where demand was down 25%. This
was entirely due to the Indonesian export ban on unprocessed
minerals. The Philippines has taken over some of the nickel ore
production, while South Africa, Malaysia and Guinea have taken
over some of the bauxite trade. The rationale behind the ban
was to incentivise Indonesian miners to build their own alumini-
um smelters and thereby create more value within Indonesia.
However, the effect of the ban has been lower earnings for min-
ers and not enough capital to invest in the smelters. The Indo-
nesian government has therefore started to reconsider allowing
bauxite exports for those miners that have begun the process of
building aluminium smelters (>30% complete).
0
50
100
150
200
250
300
0
50
100
150
200
250
300
2005 2006 2007 2008 2009 2010 2011 2012 2013 2014 2015
Mil
lion
ton
nes
Mil
lio
n t
on
nes
Sources: IHS Global Insight, Danish Ship Finance
Indian coal import volumes outgrew China's in 2014
China coal import India coal import
Danish Ship Finance (Danmarks Skibskredit A/S) Shipping Market Review - May 2015
49

CONTRACTING AND SHIP VALUES
THE DEPRESSED MARKET CONDITIONS HAVE FINALLY BROUGHT
CONTRACTING ACTIVITY IN THE DRY BULK SEGMENT TO AN
ABRUPT HALT, WHICH IN TURN HAS PUT DOWNWARD PRESSURE
ON NEWBUILDING PRICES. SECONDHAND VALUES HAVE, HOW-
EVER, SUFFERED THE MOST AND HAVE BEEN ON A STEEP DE-
CLINE DURING THE LAST SIX MONTHS.
CONTRACTING ACTIVITY SLOWED IN 2014…
In 2014, 58 million dwt was contracted, which was a significant
decline from 2013. Close to half of all contracting was in the
Capesize segment, while a quarter was in the Handymax seg-
ment. The majority of the contracted Handymax vessels (88%)
were Ultramax vessels (60,000-64,999 dwt). The third most or-
dered vessel type was Kamsarmax, which constituted 17% of
total contracting in 2014 (fig. 9).
…AND GROUND TO A HALT IN THE FIRST QUARTER OF 2015
The weak market sentiment in the last few months of 2014 and
at the start of 2015 has made shipowners cautious and very little
was contracted in the first quarter of 2015 (≈1.2 million dwt) (fig.
9). Nothing was contracted in the Capesize segment. Moreover,
shipowners have even begun converting dry bulk orders that
have already been placed into tanker vessels to reduce their ex-
posure.
NEWBUILDING PRICES UP ON AVERAGE IN 2014
In 2014, average newbuilding prices of dry bulk vessels in-
creased across the board from 2013. The average cost of a
Capesize vessel in 2013 was around USD 49 million and in 2014
it was around USD 56 million. For a bigger Panamax vessel the
average cost increased from USD 31 million to USD 37 million.
The smallest increases were for Handysize vessels. Prices started
to decline in the fourth quarter, and by the end of the first quar-
ter of 2015, newbuilding prices were down 2-6% in all segments.
Whether the low contracting activity reflects expectations of de-
flationary newbuilding prices or simply that the market has
stopped expecting stronger future demand is unknown to us.
SECONDHAND PRICES TUMBLED TOWARDS THE END OF 2014
The positive sentiment in the first part of 2014 also spurred sig-
nificant increases in average secondhand prices. By the end of
the third quarter, secondhand prices were up in all segments.
Figure DB.9
Figure DB.10
0
1
2
3
4
0
40
80
120
160
2005 2006 2007 2008 2009 2010 2011 2012 2013 2014 2015
Years
Mil
lio
n d
wt
Sources: Clarksons, Danish Ship Finance
58 million dwt was contracted in 2014The average delivery time for a dry bulk vessel is 25 months
Capesize Panamax Handymax Handysize
25 months
Average delivery time >>
Jan-Mar
5
12
0
15
30
45
0
15
30
45
2005 2006 2007 2008 2009 2010 2011 2012 2013 2014 2015
Pric
e/
earn
ing
s r
ati
o
Pric
e/
earn
ing
s r
ati
o
Sources: Clarksons, Danish Ship Finance
The low dry bulk market has pushed the P/E ratio of a 5-year-old Capesize up to the level of late 2012
Capesize - 5-year-old P/E avg. 2001-2008 P/E avg. 2009-2015
Danish Ship Finance (Danmarks Skibskredit A/S) Shipping Market Review - May 2015
50

Capesize values saw a particularly strong increase during this
period, which was why they suffered the steepest descent when
the market turned in the fourth quarter. Since the third quarter
of 2014, secondhand values across all subsegments have de-
clined by around 30% and we fear they could go even lower.
EARNINGS STILL DECOUPLED FROM PRICES
Despite having fallen significantly in 2014, we have believed for
some time that secondhand values are too high considering the
current earnings environment. The decline has not been suffi-
cient to counterbalance the drop in timecharter earnings, and the
price/earnings ratio of a five-year-old Capesize vessel soared in
the first part of 2015 (fig. 10). Hence, it seems that owners are
placing more and more value in the option of higher future earn-
ings.
MISMATCH BETWEEN SELLERS’ AND BUYERS’ ATTITUDES
There could be many reasons why there continues to be a mis-
match between earnings and values (fig. 11). We believe one of
the main reasons is that sellers are not willing to take the losses
that would be incurred in the current market and are therefore
holding on to their vessels rather than selling them at discounted
levels. This tendency resulted in a relatively slow sale and pur-
chase market, especially for Capesize vessels, in the first quarter
of 2015. Sales candidates have to a large extent been taken off
the market due to significant discrepancies in sellers’ and buyers’
attitudes towards a vessel’s worth. Hence, we believe that it is
only a matter of time before values will have to give way to ac-
commodate buyers’ preferences.
Figure DB.11
0
45,000
90,000
135,000
180,000
0
35
70
105
140
2002 2004 2006 2008 2010 2012 2014 2016
US
D p
er d
ay
Mil
lio
n U
SD
Sources: Clarksons, Danish Ship Finance
Timecharter rates are at a record low but ship prices remain 22% above the 2002 low
Capesize 10YR 1YR T/C
Danish Ship Finance (Danmarks Skibskredit A/S) Shipping Market Review - May 2015
51

OUTLOOK
IN THE PAST COUPLE OF YEARS THERE HAS BEEN MUCH TALK
OF AN UPTURN IN THE DRY BULK MARKET BEING JUST AROUND
THE CORNER. UP UNTIL NOW, THIS HAS BEEN PREMATURE AND
THE MARKET HAS CONTINUED TO SINK DEEPER INTO A SE-
VERELY DEPRESSED STATE. MAYBE NOW, WHEN EVERYTHING
SEEMS HOPELESS, IS THE TIME TO PROCLAIM A MARKET UP-
TURN? ON THE CONTRARY, WE FEAR THE SITUATION COULD
GET EVEN WORSE BEFORE IT GETS BETTER.
The dry bulk market has entered a transitional phase. The tradi-
tional demand drivers are changing at the same time as the fleet
is expanding rapidly, straining the already strained sup-
ply/demand balance. The fact that China has begun to cut coal
imports and that there is a real possibility that it will do the same
with iron ore creates an uncertain demand scenario. An im-
provement in the dry bulk market has therefore shifted even
further out into the future. Many have begun to feel the urgency
of the current market situation and scrapping activity accelerated
in the first quarter of 2015.
THE ORDERBOOK STANDS AT 157 MILLION DWT
The total dry bulk orderbook has been gradually declining since
July 2014, and as of April 2015, it constitutes 20% of the current
fleet (152 million dwt) (fig. 12). It should be borne in mind that
the dry bulk fleet has doubled in size since 2007 and that an or-
derbook of 20% in the light of this is massive. If the extremely
low contracting activity seen in the first quarter continues, it
might be reasonable to hope that the orderbook will have de-
clined even further by the end of 2015.
85 MILLION DWT COULD ENTER THE FLEET IN 2015
In the remainder of 2015, 73 million dwt is scheduled to be de-
livered, and adding this to the tonnage already delivered, 85 mil-
lion dwt could enter the fleet this year. If everything is delivered,
31 million dwt will enter the already afflicted Capesize segment,
67% more than in 2014. The lion’s share of the orderbook is
scheduled to be delivered in 2015 and 2016. We therefore fear
that shipyards could feel pressured to lower newbuilding prices
Figure DB.12
Figure DB.13
58%
16%
10% 10%
4% 3%
20%
0%
15%
30%
45%
60%
0
125
250
375
500
0-5 5-10 10-15 15-20 20-25 25+ Orderbook
% o
f d
ry b
ulk
fle
et
Mil
lio
n d
wt
Sources: Clarksons, Danish Ship Finance
74% of the dry bulk fleet is between 0 and 10 years oldThe orderbook-to-fleet ratio equals 20%
Capesize Panamax Handymax Handysize % of world fleet
% of dry bulk fleet >>
17%
15%
11%
6%4% 4% 5%
0%
-12%
-6%
0%
6%
12%
18%
24%
-40
-
40
80
120
2010 2011 2012 2013 2014 2015 2016 2017
Mil
lio
n d
wt
Sources: Clarksons, Danish Ship Finance
Fleet growth is expected to be 4.4% in 2015After adjusting for a 35% postponement ratio
Capesize Panamax Handymax Handysize
Net fleet growth, year-on-year
Deli
verie
sS
crap
pin
g
Danish Ship Finance (Danmarks Skibskredit A/S) Shipping Market Review - May 2015
52

further and create an incentive for shipowners to order more
ships.
SCRAPPING COULD PICK UP THE PACE
As mentioned, the market players have accelerated their scrap-
ping activity. In addition to the 9 million dwt already scrapped in
2015, we estimate that a further 13 million dwt could be
scrapped this year, 7 million dwt more than in 2014. This num-
ber could be even higher if there is no significant and sustained
improvement in rates during the year, possibly as high as 35
million dwt in total, which would be a welcome scenario for the
market. Moreover, only around 65% of scheduled orders have
actually been delivered in each of the last two years, and consid-
ering the current market, we expect a similar trend to be seen in
2015. Overall, if 22 million dwt is scrapped and 35% of sched-
uled orders cancelled or postponed, the dry bulk fleet will grow
by around 4.4% in 2015 (fig. 13).
SEABORNE DEMAND EXPECTED TO GROW ALMOST 4% IN 2015
Both nominal and distance-adjusted demand is expected to grow
by just under 4% in 2015, around 1 percentage point less than
supply. Looking at demand in the medium term, from 2015 until
2018, we expect seaborne demand to continue to grow at an
annual rate of around 3.7%, which is significantly lower than in
previous years (fig. 14). Deconstructing this aggregate number,
we find that it is the iron ore trade that is expected to slow down
the most. From 2002 to 2014, iron ore demand grew by 8-10%,
but going forward, we expect no more than 4.2% growth. Coal is
also expected to almost halve its growth rate from around 6.5%
to 3.3% annually (fig. 15).
REDEFINING DRY BULK DEMAND DRIVERS
These figures clearly illustrate that the dry bulk industry has en-
tered a transitional phase, where the primary demand drivers
have to be redefined. For more than a decade, the main drivers
of dry bulk demand have been industrial production and the on-
going urbanisation process in China, which have fuelled seeming-
ly insatiable demand for steel and energy. The general market
consensus for a long time was that there was no limit to China’s
demand. China would consume whatever was made available to
it. In 2014, this illusion was shattered and we got a preview of
Figure DB.14
Figure DB.15
539
794
1,132
1,291
238
284
383
431
761
1,034
1,290
1,496
539 794
1,132 1,291
-
1,500
3,000
4,500
6,000
-
1,500
3,000
4,500
6,000
2002 2008 2014 2018
Mil
lio
n t
on
nes
Mil
lio
n t
on
nes
Sources: IHS Global Insight, Danish Ship Finance
Seaborne dry bulk demand expected to grow 3.7% annually from 2015 to 2018
Iron Ore Coal Grain Minor Bulk
CAGR 3.7%
CAGR 6.8%
CAGR 6.1%
1,306
162 100 178
208
215294 140
573
23% 13% 42% -3% 5%
3% 13%
34%
10% 10%
-301%
-251%
-201%
-151%
-101%
-51%
-1%
49%
99%
0
600
1,200
1,800
2,400
China Japan India European Union Other
Im
po
rt
volu
me g
ro
wth
b
etw
een
20
14
an
d
20
18
Im
po
rt
volu
mes 2
01
8(M
illion t
onnes)
Sources: IHS Global Insight, Danish Ship Finance
Iron ore demand in 2018 will be dominated by ChinaIndia will be the biggest importer of coal in 2018, increasing its demand by 34%
Iron ore Coal % growth iron ore % growth coal
Danish Ship Finance (Danmarks Skibskredit A/S) Shipping Market Review - May 2015
53
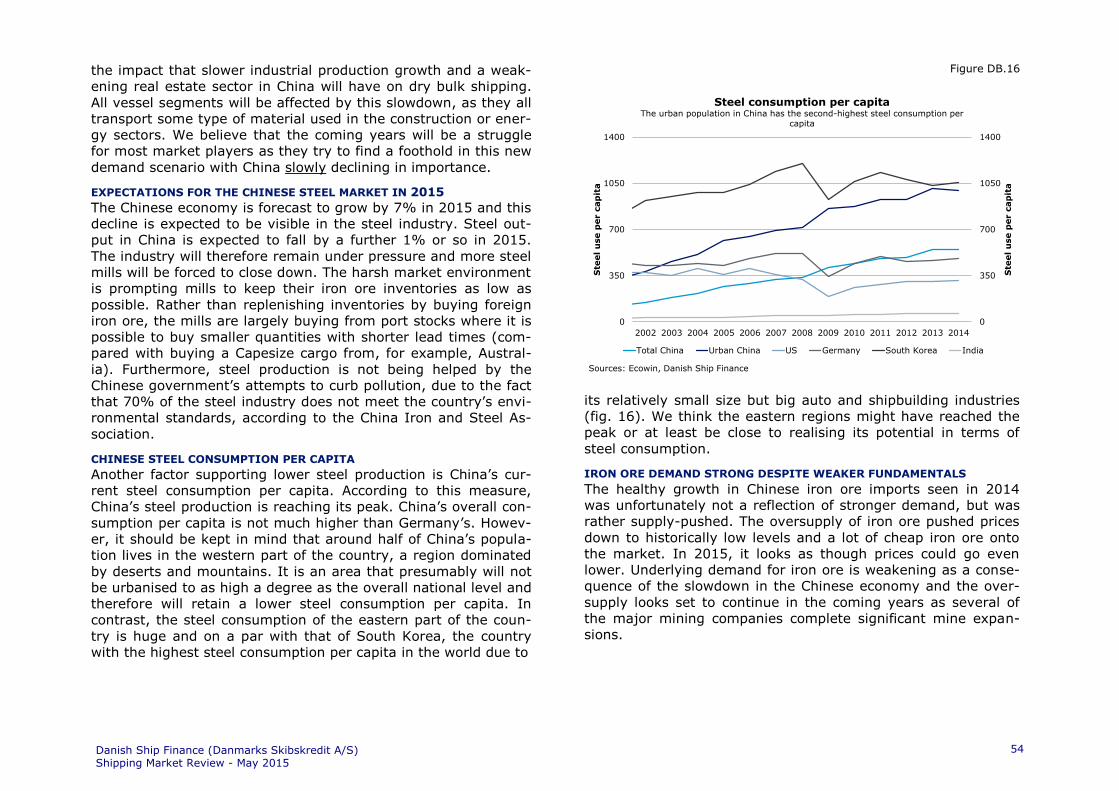
the impact that slower industrial production growth and a weak-
ening real estate sector in China will have on dry bulk shipping.
All vessel segments will be affected by this slowdown, as they all
transport some type of material used in the construction or ener-
gy sectors. We believe that the coming years will be a struggle
for most market players as they try to find a foothold in this new
demand scenario with China slowly declining in importance.
EXPECTATIONS FOR THE CHINESE STEEL MARKET IN 2015
The Chinese economy is forecast to grow by 7% in 2015 and this
decline is expected to be visible in the steel industry. Steel out-
put in China is expected to fall by a further 1% or so in 2015.
The industry will therefore remain under pressure and more steel
mills will be forced to close down. The harsh market environment
is prompting mills to keep their iron ore inventories as low as
possible. Rather than replenishing inventories by buying foreign
iron ore, the mills are largely buying from port stocks where it is
possible to buy smaller quantities with shorter lead times (com-
pared with buying a Capesize cargo from, for example, Austral-
ia). Furthermore, steel production is not being helped by the
Chinese government’s attempts to curb pollution, due to the fact
that 70% of the steel industry does not meet the country’s envi-
ronmental standards, according to the China Iron and Steel As-
sociation.
CHINESE STEEL CONSUMPTION PER CAPITA
Another factor supporting lower steel production is China’s cur-
rent steel consumption per capita. According to this measure,
China’s steel production is reaching its peak. China’s overall con-
sumption per capita is not much higher than Germany’s. Howev-
er, it should be kept in mind that around half of China’s popula-
tion lives in the western part of the country, a region dominated
by deserts and mountains. It is an area that presumably will not
be urbanised to as high a degree as the overall national level and
therefore will retain a lower steel consumption per capita. In
contrast, the steel consumption of the eastern part of the coun-
try is huge and on a par with that of South Korea, the country
with the highest steel consumption per capita in the world due to
Figure DB.16
its relatively small size but big auto and shipbuilding industries
(fig. 16). We think the eastern regions might have reached the
peak or at least be close to realising its potential in terms of
steel consumption.
IRON ORE DEMAND STRONG DESPITE WEAKER FUNDAMENTALS
The healthy growth in Chinese iron ore imports seen in 2014
was unfortunately not a reflection of stronger demand, but was
rather supply-pushed. The oversupply of iron ore pushed prices
down to historically low levels and a lot of cheap iron ore onto
the market. In 2015, it looks as though prices could go even
lower. Underlying demand for iron ore is weakening as a conse-
quence of the slowdown in the Chinese economy and the over-
supply looks set to continue in the coming years as several of
the major mining companies complete significant mine expan-
sions.
0
350
700
1050
1400
0
350
700
1050
1400
2002 2003 2004 2005 2006 2007 2008 2009 2010 2011 2012 2013 2014
Ste
el u
se p
er c
ap
ita
Ste
el u
se p
er c
ap
ita
Sources: Ecowin, Danish Ship Finance
Steel consumption per capitaThe urban population in China has the second-highest steel consumption per
capita
Total China Urban China US Germany South Korea India
Danish Ship Finance (Danmarks Skibskredit A/S) Shipping Market Review - May 2015
54

MORE IRON ORE CAPACITY ON ITS WAY
The decline in iron ore prices was primarily a result of the mas-
sive expansion in Australian iron ore capacity, which triggered
the significant growth in seaborne iron ore volumes into China.
Even more capacity is expected to come online up until 2017,
which could mean that the low price environment continues in
the coming years. The big miners are hoping that the low prices
will lead to closures of smaller, high-cost mines, especially in
China.
CHINA IS PROTECTING ITS DOMESTIC PRODUCTION
The Chinese government seems reluctant to allow its domestic
iron ore miners to go bankrupt. To support the domestic indus-
try, the government has announced that it will lower the re-
source tax on iron ore by 50%. With the introduction of this initi-
ative, there is no reason to believe that the iron ore market will
be rebalanced any time soon or that prices will begin to rise.
WILL LOWER PRICES LEAD TO HIGHER FREIGHT RATES?
If prices remain low, this could benefit the dry bulk market by
providing China with an incentive to continue to import increas-
ing amounts of iron ore, despite its lower steel demand. Whether
this will translate into higher freight rates depends on Brazilian
miners and whether they are able to regain some of the ground
lost to their Australian counterparts in 2014. Nevertheless, even
though lower prices sometimes lead to more trade, they can also
lead to a deflationary market where buyers postpone purchases
in case prices decline further, bringing the market to a temporary
standstill.
WHERE IS CHINESE COAL DEMAND HEADED?
There are two factors determining China’s future coal demand:
electricity demand and anti-pollution measures. Coal constitutes
around 65% of China’s current power mix, and because 73% of
electricity is consumed by the secondary industry, the coal indus-
try would be severely affected by a slowdown in Chinese indus-
trial production. Meanwhile, air pollution in China has reached
unprecedented highs and the government, now more than ever,
is feeling pressure to act. As 60% of China’s air pollution stems
from burning coal and oil, China has begun to invest more in
renewable energy, especially hydro- and solar power. Whether or
not this will cause China’s coal imports to continue to decrease is
Figure DB.17
uncertain. However, considering the government’s heavy focus
on rebalancing the economy and curbing pollution, as well as its
attempts to strengthen domestic production, it is highly likely
that coal imports will drop further this year. It should be kept in
mind, though, that the decline in 2014 was exacerbated by
heavy rainfall, which contributed significantly to hydropower
generation. If this is not repeated in 2015, China might have no
choice but to import more coal.
INDIA’S COAL CONSUMPTION
With China slowing down, all eyes are on India. Will India be
able to provide some of the demand lost from China? In 2014,
India became the world’s fastest-growing economy, allegedly
growing 0.1 percentage points more than China, and it has huge
unmet energy demand to supply. As mentioned earlier, India’s
coal demand is expected to surpass that of China in 2015. India
has plenty of coal in the ground to meet its growing energy
needs; however, it has not been very efficient in extracting that
coal. There is a growing focus on improving the industry, but
there is still a long way to go, and in the short-term, India’s
demand for imported coal is expected to grow.
-2.5%
0.0%
2.5%
5.0%
7.5%
10.0%
-2.5%
0.0%
2.5%
5.0%
7.5%
10.0%
2002-2008 2008-2014 2014-2018
Percen
tag
e g
row
th in
dem
an
d
Percen
tag
e g
ro
wth
in
dem
an
d
Sources: IHS Global Insight, Danish Ship Finance
Dry bulk distances are on average set to decline slightly in the period from 2014 to 2018
Demand growth Distances' contribution to demand
Danish Ship Finance (Danmarks Skibskredit A/S) Shipping Market Review - May 2015
55

WHERE DOES THIS LEAVE THE DRY BULK MARKET?
The slowing demand outlook described above does little to sup-
port higher fleet utilisation. If Chinese imports of iron ore begin
to decline as we have seen for coal, the dry bulk fleet will be
subject to severe overcapacity. Nevertheless, even if Chinese
iron ore imports are maintained at current levels, fleet utilisation
could still decline in 2015. With the current demand forecast in
mind and a supply scenario that takes into account both new
orders and scrapping forecasts, we estimate that fleet utilisation
could fall gradually to the mid-70s by year-end 2018 (fig. 18).
Freight rates are unlikely to increase in a situation with declining
fleet utilisation. According to our calculations, it will take a 5%
increase in demand volumes for the 2015 fleet utilisation to in-
crease by 1 percentage point.
VALUES COULD DECLINE FURTHER
Secondhand prices are usually expected to increase due to high-
er short-term earnings, improved future earnings expectations
and longer cash flow periods. Current fleet utilisation projections
leave little hope for freight rates in the short to medium term.
For both Capesize and Panamax vessels, the average age of ves-
sels scrapped remains below their expected technical operating
life. Consequently, all three parameters mentioned above, in the
short to medium term, point towards lower prices. However, past
experience has taught us that secondhand prices, particularly for
younger vessels, are at times significantly above the vessels’
short-term earnings potential. But for vessels older than eight to
ten years, we believe that current secondhand prices may drop
below their previous all-time lows within the next 12-18 months.
In our worst-case scenario, dry bulk values will fall by an addi-
tional 20% from the March 2015 levels. Let us hope that this
does not happen!
Figure DB.18
77%
72%74%
65%
75%
85%
95%
105%
115%
-80
-40
0
40
80
120
2008 2009 2010 2011 2012 2013 2014 2015 2016 2017 2018
Fle
et
uti
lisati
on
Mil
lio
n d
wt
Sources: Clarksons, IHS Global Insight and Danish Ship Finance
Dry bulk fleet utilisation is expected to remain low We estimate that utilisation could fall to the low 70s in the coming years
Delivery Demolition New orders Dry bulk fleet utilisation
Danish Ship Finance (Danmarks Skibskredit A/S) Shipping Market Review - May 2015
56

CRUDE TANKER
SHIPPING MARKET REVIEW – MAY 2015

CRUDE TANKER2014 MAY HAVE BEEN A TURNING POINT FOR THE CRUDE
TANKER MARKET, BUT UNLESS SUPPLY GROWTH BEYOND 2016
IS KEPT LOW, THE RECOVERY MAY TURN OUT TO BE SHORT-
LIVED.
FREIGHT RATES
THE FREIGHT RATE MARKET IMPROVED SIGNIFICANTLY IN
2014. FIRST, THE BDTI SOARED ABOVE 1,000 IN JANUARY,
AND THEN THE 1-YEAR VLCC TIMECHARTER RATE SURGED TO
THE HIGHEST LEVEL SINCE THE START OF THE FINANCIAL CRI-
SIS.
2014 turned out to be much better than expected, particularly
towards the end of the year, when the drop in crude oil prices
propelled demand for crude tankers and with it freight rates. But
not only did 2014 end on a high note, it started off well too.
BDTI CONTINUES TO SHOW SIGNS OF IMPROVEMENT
The Baltic Dirty Tanker Index (BDTI) reached a four-year high of
1,124 in January 2014, spurred on by high Suezmax and Afra-
max earnings. However, spot rates soon began to slide as spring
maintenance set in. During the summer, spot rates became in-
creasingly volatile as dwindling crude oil prices increased vessel
demand. In November, the market balance became even tighter
and the BDTI reached roughly 900. Overall, spot rates in the
crude tanker market fared much better in 2014. The Suezmax
segment in particular continued to experience the highest annu-
al average spot earnings, at almost USD 27,000 per day in
2014, compared with USD 10,000 and USD 22,000 per day in
the VLCC and Aframax segments, respectively. Spot rates held
up strongly in the first quarter of 2015, earning more than USD
40,000 per day across all segments (fig. 1). This is the highest
quarterly level of spot earnings since 2008.
SURGE IN TIMECHARTER RATES TOWARDS THE END OF 2014
This development also impacted the timecharter market, where
2014 average rates were 40% higher than in 2013. The rise has
continued into 2015 with levels not seen since the beginning of
2009: the 1-year VLCC timecharter rate hit USD 52,500 per day
in January 2015 (fig. 2).
Figure T.1
Figure T.2
0
500
1,000
1,500
2,000
2,500
0
500
1,000
1,500
2,000
2,500
2005 2006 2007 2008 2009 2010 2011 2012 2013 2014 2015
In
dex
In
dex
Sources: Clarksons, Danish Ship Finance
Rising BDTI volatility indicates a tighter market balanceBDTI reached as high as 1,124 and as low as 639 in 2014
Baltic Dirty Tanker Index
Baltic Dirty Tanker Index, annual average
0
20,000
40,000
60,000
80,000
100,000
0
20,000
40,000
60,000
80,000
100,000
2005 2006 2007 2008 2009 2010 2011 2012 2013 2014 2015
US
D p
er d
ay
US
D p
er d
ay
Sources: Clarksons, Danish Ship Finance
1-year timecharter rates improved steadily in 2014The 1-year VLCC timecharter rate is still above USD 40,000 per day
VLCC Suezmax Aframax
Danish Ship Finance (Danmarks Skibskredit A/S) Shipping Market Review - May 2015
58
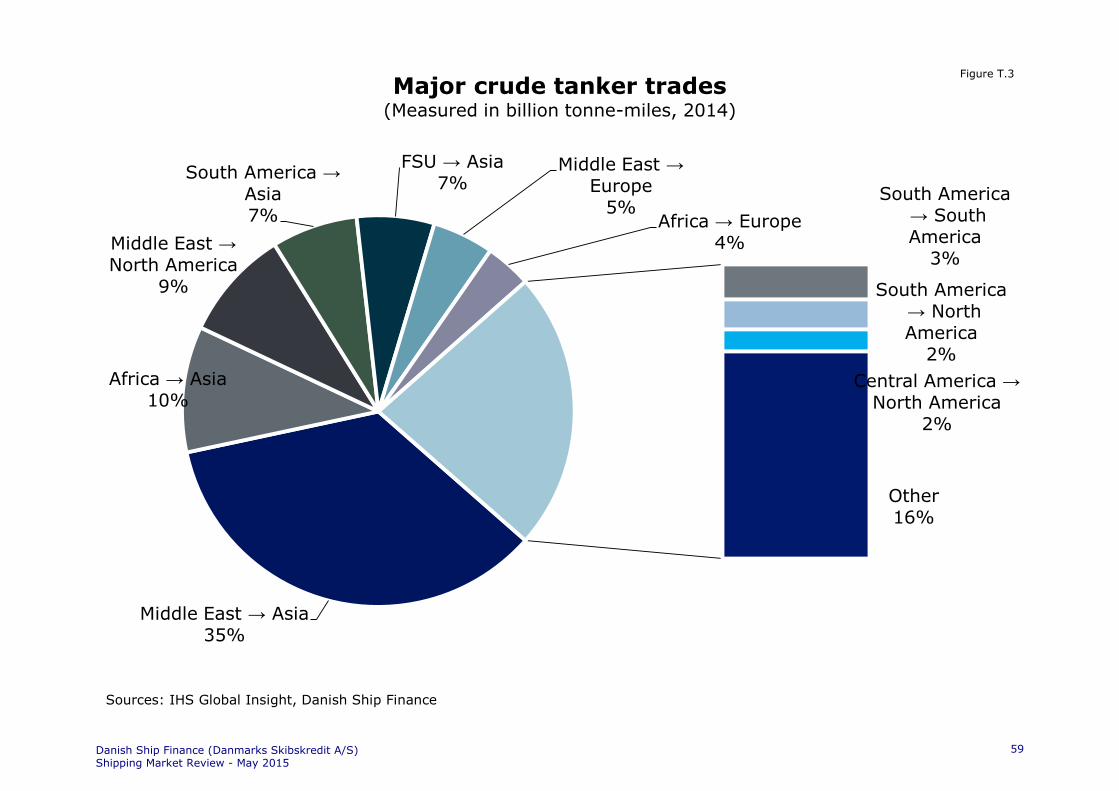
Middle East → Asia35%
Africa → Asia10%
Middle East →North America
9%
South America →
Asia7%
FSU → Asia7%
Middle East →Europe
5%Africa → Europe
4%
South America→ South America
3%
South America→ North America
2%
Central America →
North America2%
Other
16%
Major crude tanker trades (Measured in billion tonne-miles, 2014)
Sources: IHS Global Insight, Danish Ship Finance
Figure T.3
Danish Ship Finance (Danmarks Skibskredit A/S) Shipping Market Review - May 2015
59

SUPPLY & DEMAND
2014 TURNED OUT TO BE MUCH BETTER THAN MANY HAD EX-
PECTED. OVERCAPACITY WAS ALLEVIATED BY A COMBINATION
OF SLOWING FLEET GROWTH AND SLOW STEAMING, WHILE
CRUDE TANKER DEMAND WAS SUPPORTED BY LONGER TRAV-
ELLING DISTANCES AND SOME FLOATING STORAGE. TOGETH-
ER, THESE FACTORS SEEM TO HAVE FINALLY BEEN ABLE TO
ABSORB SOME OF THE OVERSUPPLY.
FLEET GROWTH CAME DOWN BELOW 1% IN 2014
After having peaked at more than 7% in 2011, crude tanker
fleet growth has been declining and in 2014 it slowed to less
than 1%, the lowest level recorded in recent years (fig. 4).
9.5 MILLION DWT WAS DELIVERED TO THE FLEET IN 2014
Deliveries declined further in 2014, with less than 9.5 million
dwt entering the fleet as opposed to the 30 million dwt seen in
2011. VLCC vessels accounted for 80% of the deliveries, while
the remaining 20% was divided between Suez- and Aframaxes.
At the beginning of the year, 16.5 million dwt was scheduled for
delivery. Consequently, 2014 attained a delivery ratio of 57%.
The orderbook was dominated by VLCC orders and 77% of these
were delivered. Both Suez- and Aframaxes, however, only saw
27% of their scheduled orders materialise in 2014. Three-
quarters of all Suezmax cancellations were explained by Jiangsu
Rongsheng, a Chinese yard, going into restructuring, making the
low delivery ratio a one-off-event. The majority of the undeliv-
ered vessels, 26%, were postponed to a later date, while the
rest were cancelled. Suezmax vessels accounted for the bulk of
both postponements and cancellations. In total, 3.5 million dwt
was undelivered in the Suezmax segment, equal to the total for
the other two segments combined (fig. 5).
SCRAPPING EXCEEDED OUR EXPECTATIONS
At the beginning of 2014, we identified roughly 5 million dwt of
potential scrapping candidates, our criteria being that a vessel
becomes eligible for scrapping the year before its next special
survey, starting at the fourth. By the end of 2014, scrapping
amounted to 7.3 million dwt, mainly VLCCs, exceeding our ex-
pectations by almost 50%. This was still lower than in previous
years, however (fig. 4).
Figure T.4
Figure T.5
6%
4%4%
2%
7%
3%
7%
5%
2%
1%
0%
-4%
-2%
0%
2%
4%
6%
8%
-20
-10
-
10
20
30
40
2005 2006 2007 2008 2009 2010 2011 2012 2013 2014 2015
Mil
lio
n d
wt
Sources: Clarksons, Danish Ship Finance
9.5 million dwt entered the fleet in 2014The fleet is expected to remain practically unchanged in 2015
VLCC Suezmax Aframax
Net fleet growth, year-on-year
Deli
verie
sS
crap
pin
g
0
5
10
15
20
0
5
10
15
20
Orderbook Postponements Cancellations Actual deliveries
Mil
lion
dw
t
Mil
lio
n d
wt
Sources: Clarksons, Danish Ship Finance
57% of scheduled orders were delivered in 2014The majority were delivered in the VLCC segment
VLCC Suezmax Aframax
Danish Ship Finance (Danmarks Skibskredit A/S) Shipping Market Review - May 2015
60

SEABORNE CRUDE OIL DEMAND WAS HIGHEST AT THE END OF 2014
On average over the past five years, crude oil consumption has
been 1.2 million barrels per day higher in the second half of the
year. In 2014 the lower crude oil prices are likely to have boost-
ed this number even further. Consequently, despite having de-
creased by 0.5% overall in 2014, seaborne crude oil volumes
might have experienced positive growth in the second half of
the year, paving the way for higher crude tanker demand and
thus improved freight rates.
THE OVERSUPPLY CAME DOWN SLIGHTLY IN 2014
Crude tanker demand was also supported by an increase in av-
erage travelling distances and consequently distance-adjusted
demand ended 2014 roughly unchanged. Nevertheless, supply
growth still outpaced demand growth in 2014, widening the gap
between supply and demand (fig. 6). Increased use of slow
steaming, whereby vessels lowered their average speeds to less
than 9 knots in 2014 from above 11 knots in 2008, absorbed
some of the excess crude tanker capacity, but in 2015 it ap-
pears that high freight rates together with lower bunker costs
have prompted owners to increase speeds again.
SEABORNE CRUDE OIL VOLUMES TO ASIA CONTINUE TO RISE
Asia, particularly China, continues to be the main driver of
growth in seaborne crude oil trade. In 2014, Asia increased its
imports of seaborne crude oil by 1%, equivalent to 15 million
tonnes or roughly 300,000 barrels per day. China accounted for
three quarters of this (fig. 7).
ASIA HAS INCREASED ITS IMPORTS OF ATLANTIC BASIN CRUDE OIL
The Middle East continues to be the main supplier of crude oil to
the Asian market, but Africa is gaining market share, supporting
distance-adjusted demand. In the second half of 2014, Asia also
upped its crude oil intake from several other Atlantic Basin sup-
pliers, particularly South American suppliers, whose crude oil
became increasingly attractive. Most global crude oil prices are
pegged to three international crude oil benchmarks, Brent, WTI
or Dubai, depending on their grade. In the case of the South
Americans it was the WTI-linked crude oil grades that proved
attractive, as WTI prices showed a far steeper decline than other
benchmark crude oil prices in the second half of 2014.
Figure T.6
Figure T.7
25
50
75
100
125
150
50
75
100
125
150
2005 2006 2007 2008 2009 2010 2011 2012 2013 2014 2015
In
dex (
20
08
=1
00
)
In
dex (
20
08
=1
00
)
Sources: Clarksons, IHS Global Insight, Danish Ship Finance
The supply and demand gap widened slightly in 2014Supply grew by less than 1% while distance-adj. demand remained unchanged
Supply/demand gap Supply Distance-adjusted demand
1%
0%
-9%-4%
2%
16%
6%
-1%
-30%
-
400
800
1,200
1,600
2,000
Asia Europe NorthAmerica
SouthAmerica
Africa Oceania CentralAmerica
MiddleEast
FSU
Mil
lio
n t
on
nes
Sources: IHS Global Insight, Danish Ship Finance
Demand for crude oil decreased by 0.5% in 2014Asia remained the most important importer
2014 import volumes
Import volume growth in 2014
Mil
lio
n t
on
nes
Danish Ship Finance (Danmarks Skibskredit A/S) Shipping Market Review - May 2015
61
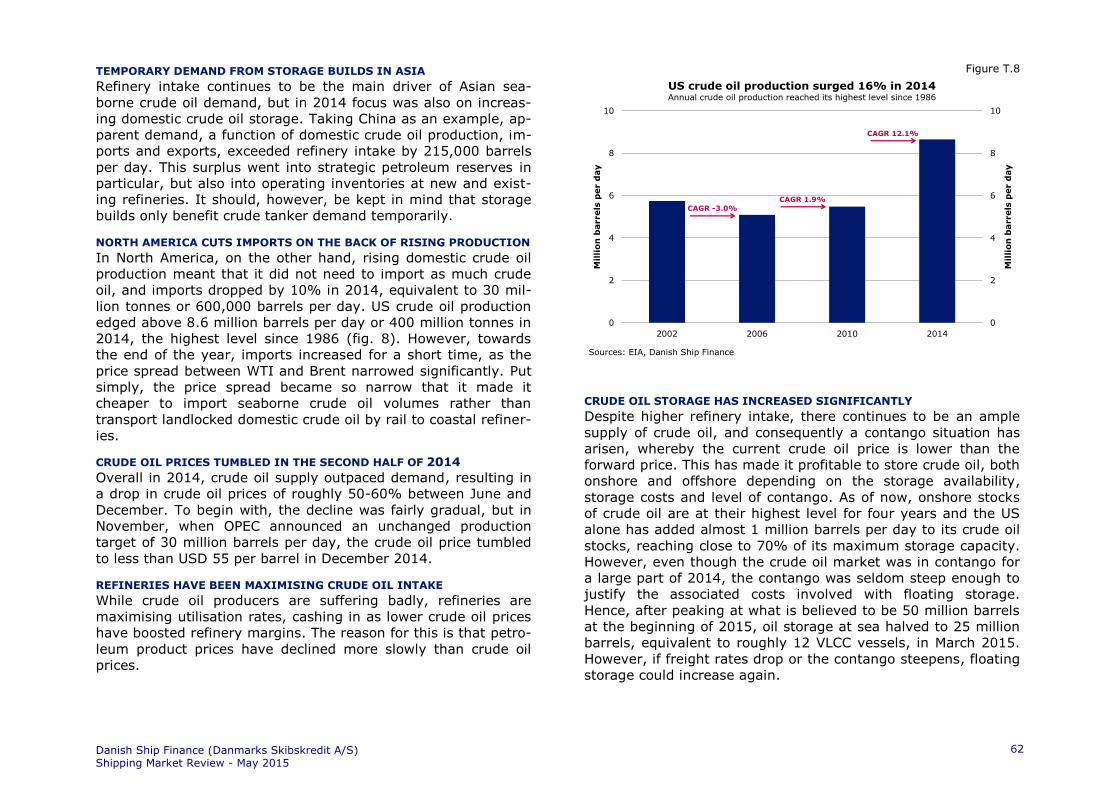
TEMPORARY DEMAND FROM STORAGE BUILDS IN ASIA
Refinery intake continues to be the main driver of Asian sea-
borne crude oil demand, but in 2014 focus was also on increas-
ing domestic crude oil storage. Taking China as an example, ap-
parent demand, a function of domestic crude oil production, im-
ports and exports, exceeded refinery intake by 215,000 barrels
per day. This surplus went into strategic petroleum reserves in
particular, but also into operating inventories at new and exist-
ing refineries. It should, however, be kept in mind that storage
builds only benefit crude tanker demand temporarily.
NORTH AMERICA CUTS IMPORTS ON THE BACK OF RISING PRODUCTION
In North America, on the other hand, rising domestic crude oil
production meant that it did not need to import as much crude
oil, and imports dropped by 10% in 2014, equivalent to 30 mil-
lion tonnes or 600,000 barrels per day. US crude oil production
edged above 8.6 million barrels per day or 400 million tonnes in
2014, the highest level since 1986 (fig. 8). However, towards
the end of the year, imports increased for a short time, as the
price spread between WTI and Brent narrowed significantly. Put
simply, the price spread became so narrow that it made it
cheaper to import seaborne crude oil volumes rather than
transport landlocked domestic crude oil by rail to coastal refiner-
ies.
CRUDE OIL PRICES TUMBLED IN THE SECOND HALF OF 2014
Overall in 2014, crude oil supply outpaced demand, resulting in
a drop in crude oil prices of roughly 50-60% between June and
December. To begin with, the decline was fairly gradual, but in
November, when OPEC announced an unchanged production
target of 30 million barrels per day, the crude oil price tumbled
to less than USD 55 per barrel in December 2014.
REFINERIES HAVE BEEN MAXIMISING CRUDE OIL INTAKE
While crude oil producers are suffering badly, refineries are
maximising utilisation rates, cashing in as lower crude oil prices
have boosted refinery margins. The reason for this is that petro-
leum product prices have declined more slowly than crude oil
prices.
Figure T.8
CRUDE OIL STORAGE HAS INCREASED SIGNIFICANTLY
Despite higher refinery intake, there continues to be an ample
supply of crude oil, and consequently a contango situation has
arisen, whereby the current crude oil price is lower than the
forward price. This has made it profitable to store crude oil, both
onshore and offshore depending on the storage availability,
storage costs and level of contango. As of now, onshore stocks
of crude oil are at their highest level for four years and the US
alone has added almost 1 million barrels per day to its crude oil
stocks, reaching close to 70% of its maximum storage capacity.
However, even though the crude oil market was in contango for
a large part of 2014, the contango was seldom steep enough to
justify the associated costs involved with floating storage.
Hence, after peaking at what is believed to be 50 million barrels
at the beginning of 2015, oil storage at sea halved to 25 million
barrels, equivalent to roughly 12 VLCC vessels, in March 2015.
However, if freight rates drop or the contango steepens, floating
storage could increase again.
0
2
4
6
8
10
0
2
4
6
8
10
2002 2006 2010 2014
Mil
lion
barrels
per d
ay
Mil
lio
n b
arrels
per d
ay
Sources: EIA, Danish Ship Finance
US crude oil production surged 16% in 2014Annual crude oil production reached its highest level since 1986
CAGR -3.0%
CAGR 1.9%
CAGR 12.1%
Danish Ship Finance (Danmarks Skibskredit A/S) Shipping Market Review - May 2015
62
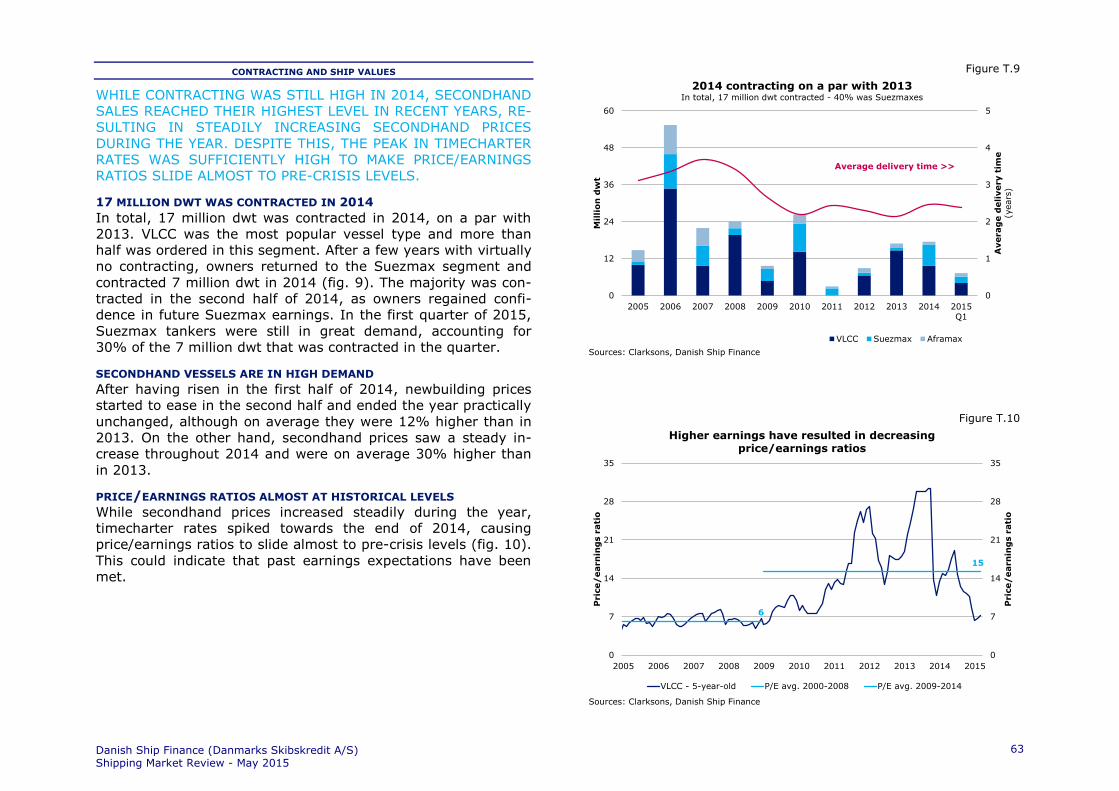
CONTRACTING AND SHIP VALUES
WHILE CONTRACTING WAS STILL HIGH IN 2014, SECONDHAND
SALES REACHED THEIR HIGHEST LEVEL IN RECENT YEARS, RE-
SULTING IN STEADILY INCREASING SECONDHAND PRICES
DURING THE YEAR. DESPITE THIS, THE PEAK IN TIMECHARTER
RATES WAS SUFFICIENTLY HIGH TO MAKE PRICE/EARNINGS
RATIOS SLIDE ALMOST TO PRE-CRISIS LEVELS.
17 MILLION DWT WAS CONTRACTED IN 2014
In total, 17 million dwt was contracted in 2014, on a par with
2013. VLCC was the most popular vessel type and more than
half was ordered in this segment. After a few years with virtually
no contracting, owners returned to the Suezmax segment and
contracted 7 million dwt in 2014 (fig. 9). The majority was con-
tracted in the second half of 2014, as owners regained confi-
dence in future Suezmax earnings. In the first quarter of 2015,
Suezmax tankers were still in great demand, accounting for
30% of the 7 million dwt that was contracted in the quarter.
SECONDHAND VESSELS ARE IN HIGH DEMAND
After having risen in the first half of 2014, newbuilding prices
started to ease in the second half and ended the year practically
unchanged, although on average they were 12% higher than in
2013. On the other hand, secondhand prices saw a steady in-
crease throughout 2014 and were on average 30% higher than
in 2013.
PRICE/EARNINGS RATIOS ALMOST AT HISTORICAL LEVELS
While secondhand prices increased steadily during the year,
timecharter rates spiked towards the end of 2014, causing
price/earnings ratios to slide almost to pre-crisis levels (fig. 10).
This could indicate that past earnings expectations have been
met.
Figure T.9
Figure T.10
0
1
2
3
4
5
0
12
24
36
48
60
2005 2006 2007 2008 2009 2010 2011 2012 2013 2014 2015Q1
Averag
e d
eli
very t
ime
(years
)
Mil
lio
n d
wt
Sources: Clarksons, Danish Ship Finance
2014 contracting on a par with 2013In total, 17 million dwt contracted - 40% was Suezmaxes
VLCC Suezmax Aframax
Average delivery time >>
6
15
0
7
14
21
28
35
0
7
14
21
28
35
2005 2006 2007 2008 2009 2010 2011 2012 2013 2014 2015
Pric
e/
earn
ing
s r
ati
o
Pric
e/
earn
ing
s r
ati
o
Sources: Clarksons, Danish Ship Finance
Higher earnings have resulted in decreasing price/earnings ratios
VLCC - 5-year-old P/E avg. 2000-2008 P/E avg. 2009-2014
Danish Ship Finance (Danmarks Skibskredit A/S) Shipping Market Review - May 2015
63
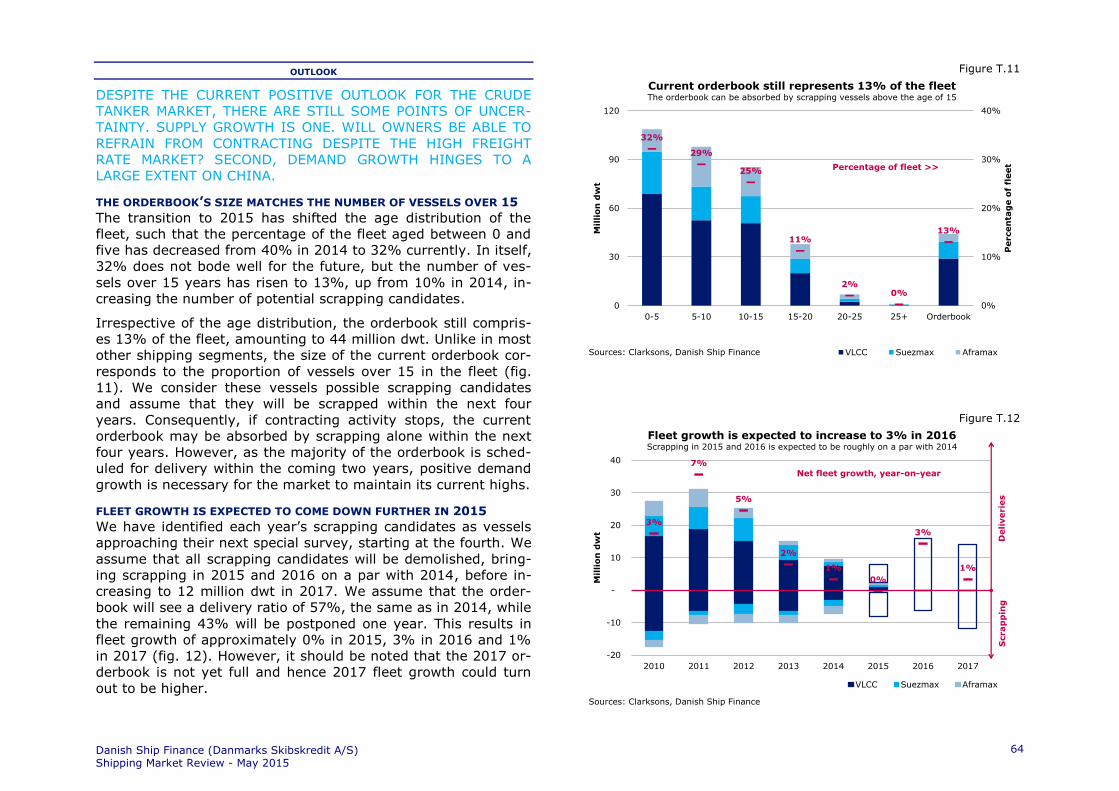
OUTLOOK
DESPITE THE CURRENT POSITIVE OUTLOOK FOR THE CRUDE
TANKER MARKET, THERE ARE STILL SOME POINTS OF UNCER-
TAINTY. SUPPLY GROWTH IS ONE. WILL OWNERS BE ABLE TO
REFRAIN FROM CONTRACTING DESPITE THE HIGH FREIGHT
RATE MARKET? SECOND, DEMAND GROWTH HINGES TO A
LARGE EXTENT ON CHINA.
THE ORDERBOOK’S SIZE MATCHES THE NUMBER OF VESSELS OVER 15
The transition to 2015 has shifted the age distribution of the
fleet, such that the percentage of the fleet aged between 0 and
five has decreased from 40% in 2014 to 32% currently. In itself,
32% does not bode well for the future, but the number of ves-
sels over 15 years has risen to 13%, up from 10% in 2014, in-
creasing the number of potential scrapping candidates.
Irrespective of the age distribution, the orderbook still compris-
es 13% of the fleet, amounting to 44 million dwt. Unlike in most
other shipping segments, the size of the current orderbook cor-
responds to the proportion of vessels over 15 in the fleet (fig.
11). We consider these vessels possible scrapping candidates
and assume that they will be scrapped within the next four
years. Consequently, if contracting activity stops, the current
orderbook may be absorbed by scrapping alone within the next
four years. However, as the majority of the orderbook is sched-
uled for delivery within the coming two years, positive demand
growth is necessary for the market to maintain its current highs.
FLEET GROWTH IS EXPECTED TO COME DOWN FURTHER IN 2015
We have identified each year’s scrapping candidates as vessels
approaching their next special survey, starting at the fourth. We
assume that all scrapping candidates will be demolished, bring-
ing scrapping in 2015 and 2016 on a par with 2014, before in-
creasing to 12 million dwt in 2017. We assume that the order-
book will see a delivery ratio of 57%, the same as in 2014, while
the remaining 43% will be postponed one year. This results in
fleet growth of approximately 0% in 2015, 3% in 2016 and 1%
in 2017 (fig. 12). However, it should be noted that the 2017 or-
derbook is not yet full and hence 2017 fleet growth could turn
out to be higher.
Figure T.11
Figure T.12
32%
29%
25%
11%
2%0%
13%
0%
10%
20%
30%
40%
0
30
60
90
120
0-5 5-10 10-15 15-20 20-25 25+ Orderbook
Percen
tag
e o
f fl
eet
Mil
lio
n d
wt
Sources: Clarksons, Danish Ship Finance
Current orderbook still represents 13% of the fleetThe orderbook can be absorbed by scrapping vessels above the age of 15
VLCC Suezmax Aframax
Percentage of fleet >>
3%
7%
5%
2%
1%
0%
3%
1%
-4%
-2%
0%
2%
4%
6%
8%
-20
-10
-
10
20
30
40
2010 2011 2012 2013 2014 2015 2016 2017
Mil
lio
n d
wt
Sources: Clarksons, Danish Ship Finance
Fleet growth is expected to increase to 3% in 2016Scrapping in 2015 and 2016 is expected to be roughly on a par with 2014
VLCC Suezmax Aframax
Net fleet growth, year-on-year
Deli
verie
sS
crap
pin
g
Danish Ship Finance (Danmarks Skibskredit A/S) Shipping Market Review - May 2015
64
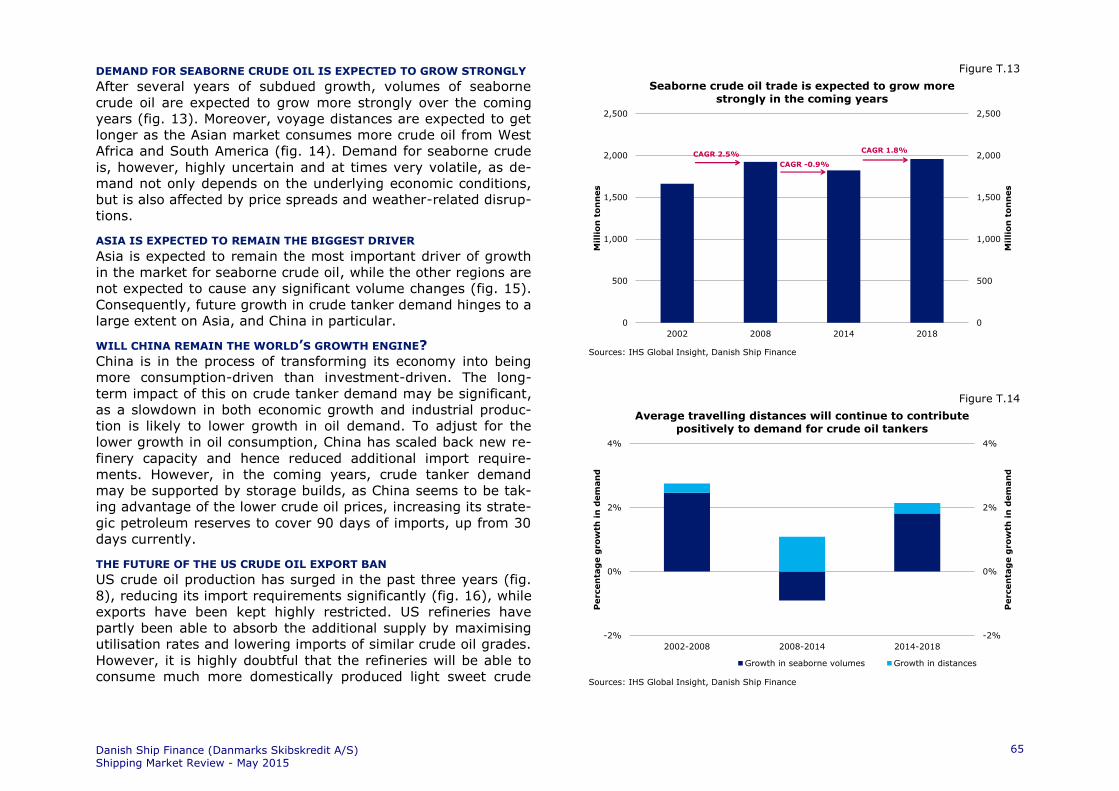
DEMAND FOR SEABORNE CRUDE OIL IS EXPECTED TO GROW STRONGLY
After several years of subdued growth, volumes of seaborne
crude oil are expected to grow more strongly over the coming
years (fig. 13). Moreover, voyage distances are expected to get
longer as the Asian market consumes more crude oil from West
Africa and South America (fig. 14). Demand for seaborne crude
is, however, highly uncertain and at times very volatile, as de-
mand not only depends on the underlying economic conditions,
but is also affected by price spreads and weather-related disrup-
tions.
ASIA IS EXPECTED TO REMAIN THE BIGGEST DRIVER
Asia is expected to remain the most important driver of growth
in the market for seaborne crude oil, while the other regions are
not expected to cause any significant volume changes (fig. 15).
Consequently, future growth in crude tanker demand hinges to a
large extent on Asia, and China in particular.
WILL CHINA REMAIN THE WORLD’S GROWTH ENGINE?
China is in the process of transforming its economy into being
more consumption-driven than investment-driven. The long-
term impact of this on crude tanker demand may be significant,
as a slowdown in both economic growth and industrial produc-
tion is likely to lower growth in oil demand. To adjust for the
lower growth in oil consumption, China has scaled back new re-
finery capacity and hence reduced additional import require-
ments. However, in the coming years, crude tanker demand
may be supported by storage builds, as China seems to be tak-
ing advantage of the lower crude oil prices, increasing its strate-
gic petroleum reserves to cover 90 days of imports, up from 30
days currently.
THE FUTURE OF THE US CRUDE OIL EXPORT BAN
US crude oil production has surged in the past three years (fig.
8), reducing its import requirements significantly (fig. 16), while
exports have been kept highly restricted. US refineries have
partly been able to absorb the additional supply by maximising
utilisation rates and lowering imports of similar crude oil grades.
However, it is highly doubtful that the refineries will be able to
consume much more domestically produced light sweet crude
Figure T.13
Figure T.14
0
500
1,000
1,500
2,000
2,500
0
500
1,000
1,500
2,000
2,500
2002 2008 2014 2018
Mil
lion
ton
nes
Mil
lio
n t
on
nes
Sources: IHS Global Insight, Danish Ship Finance
Seaborne crude oil trade is expected to grow more strongly in the coming years
CAGR 2.5%
CAGR -0.9%
CAGR 1.8%
-2%
0%
2%
4%
-2%
0%
2%
4%
2002-2008 2008-2014 2014-2018
Percen
tag
e g
row
th in
dem
an
d
Percen
tag
e g
ro
wth
in
dem
an
d
Sources: IHS Global Insight, Danish Ship Finance
Average travelling distances will continue to contribute positively to demand for crude oil tankers
Growth in seaborne volumes Growth in distances
Danish Ship Finance (Danmarks Skibskredit A/S) Shipping Market Review - May 2015
65

oil, as their configuration restricts extensive use of this particu-
lar crude oil grade. Consequently, if the US continues to uphold
its restrictions on crude oil exports, US crude oil prices might
become even more discounted and imports could drop further,
reducing demand for crude tankers. However, if the restrictions
are removed, it would most likely benefit the US economy and
the global crude tanker market, as trading activity in and out of
the US would increase given that regional prices and refinery
yields vary throughout the year.
THE EXPORT BAN FAVOURS US REFINERIES BUT HITS OIL PRODUCERS
US refineries are benefiting the most from the current re-
strictions on US crude oil exports, as they are experiencing
above-average refining margins. These high margins have been
attained as refineries have been able to buy crude oil at heavily
discounted prices while selling petroleum products at interna-
tional levels. The main losers are, of course, the oil producers,
especially now that crude oil prices have dropped below margin-
al costs in many areas in the US. On top of that, producers are
selling their crude oil at discounted prices, further dampening
upstream investments, economic activity and job creation. Also,
the global crude tanker market is missing out on US crude oil
demand. Between 2006 and 2014, crude oil imports to the US
dropped by nearly 3 million barrels per day to average only 7
million barrels per day in 2014. Suezmax tankers have suffered
the most from this, as they have lost one of their key trading
areas.
THE CONSEQUENCES OF ALLOWING US CRUDE OIL EXPORTS
The situation would obviously be reversed if the export re-
strictions were removed. However, it seems that allowing the
export of US crude oil would be an economically feasible solu-
tion: removing the export restrictions would ultimately lift US
crude oil prices to international levels, encouraging upstream
investments, economic activity and job creation. The refining
sector, on the other hand, would lose one advantage in the form
of discounted feedstock prices, but they would still have access
to lower-priced electricity, enabling them to sustain part of their
competitive advantage. Furthermore, flooding the international
crude oil market with US crude oil should help keep crude oil
prices low and hence also international prices on petroleum
Figure T.15
Figure T.16
3%1%
-1% -1%
3%0%
2%1%
-3%
-
400
800
1,200
1,600
2,000
Asia Europe NorthAmerica
SouthAmerica
Africa Oceania CentralAmerica
MiddleEast
FSU
Mil
lio
n t
on
nes
Sources: IHS Global Insight, Danish Ship Finance
Asia is expected to remain the most important growth engine for seaborne crude oil trade
2018 import volumes
Compound annual growth rate 2014 - 2018
Mil
lio
n t
on
nes
0
3
6
9
12
-
3
6
9
12
2002 2006 2010 2014
Mil
lion
barrels
per d
ay
Mil
lio
n b
arrels
per d
ay
Sources: EIA, Danish Ship Finance
US crude oil imports dropped by 5% in 2014Annual crude oil imports reached their lowest level for 20 years
CAGR 2.6%
CAGR -2.3%
CAGR -5.5%
Danish Ship Finance (Danmarks Skibskredit A/S) Shipping Market Review - May 2015
66

products. Overall, it seems that removing the export restrictions
could benefit most of the US economy. However, this is easier
said than done. Much of the domestic industry in the US, for ex-
ample the Jones Act fleet, is dependent on these export re-
strictions, making the consequences of removing the restrictions
much harder to grasp.
But for the shipping industry in general, a recent study by the
American Petroleum Institute estimated that exports could aver-
age 2.1 million barrels per day between 2015 and 2035, equiva-
lent to one VLCC per day. Furthermore, trading activity could
increase if both domestic and international refineries decide to
optimise crude oil runs based on all available crude oil grades;
as refineries in different regions prefer different crude oil
grades, this would enable US crude oil to be exported all over
the world. For instance, European refineries might place a high-
er value on condensate as their appetite for light sweet crude oil
is already satisfied by the production in the North Sea or Medi-
terranean regions, while Mars, a medium sour crude oil pro-
duced in the Gulf of Mexico, might be more attractive in Asia, as
Asian refineries are configured to process more heavy and sour
crude oil grades. Overall, international trade flows would likely
change and demand for crude oil tankers would increase.
LIGHTLY PROCESSED CONDENSATE HAS BEEN APPROVED FOR EXPORT
During the last six months, the US Department of Commerce
has eased the export ban by allowing the export of lightly pro-
cessed condensate, a very light and sweet crude oil grade. How-
ever, heavy investment is still needed to process US condensate
production and this begs the question of who will be willing to
invest given the current uncertainty surrounding the export re-
strictions. However, the export of lightly processed US conden-
sate might not benefit crude tankers significantly, as condensate
can be shipped on product tankers (see Shipping Market Review
– November 2014 for further details). However, the preferred
vessel type will depend on parcel sizes and the cargo’s destina-
tion.
LOWER OIL PRICES HAVE BOOSTED DEMAND FOR CRUDE TANKERS
Ample crude oil supply and limited demand have caused crude
oil prices to tumble 50-60% since June 2014. In January 2015,
Brent fell below USD 50 per barrel, its lowest level for six years.
Prices have since rebounded to around USD 65 per barrel after
Saudi Arabia and its allies launched air strikes in Yemen, spark-
ing fears of a wider regional confrontation that could disrupt
world crude oil supplies. In general, the lower crude oil prices
have boosted demand for crude tankers. As of March, 12 VLCCs
are believed to be engaged in floating storage, while another 15
are thought to be storing Iranian crude oil. Furthermore, trade
patterns have changed and crude oil demand has gone up,
causing volumes of crude oil in transit to increase strongly and
thereby boosting demand for crude tankers.
OIL PRICES MAY REMAIN UNDER PRESSURE IN THE SECOND QUARTER
The effect of the air strike in Yemen might only be temporary,
and prices could come under further pressure in the second
quarter of 2015 if the global oversupply of crude oil increases.
This could occur if China puts its build-up of strategic reserves
on hold and refineries slow their crude oil intake ahead of spring
maintenance. A larger crude oil surplus could possibly push the
market into a deeper contango, increasing demand for floating
storage facilities, which in turn could mitigate the effect the low-
er crude oil demand could have on crude tankers. A deeper con-
tango could also alleviate some of the pressure on onshore stor-
age capacity, which is currently beginning to reach its limit.
SANCTIONS AGAINST IRAN COULD BE LIFTED IN JUNE
A nuclear deal with Iran, which could end sanctions and poten-
tially lift Iranian crude oil exports, is also a possibility. As men-
tioned, it is believed that 15 VLCCs, each carrying 2 million bar-
rels of crude oil, are currently deployed for floating storage off-
shore Iran. Needless to say, if a deal is struck, an additional 30
million barrels of crude oil and hence 15 VLCC vessels might be
available to the market overnight. These VLCCs are mainly Ira-
nian vessels, though, and would probably be occupied transport-
ing additional Iranian exports. In the event that Iranian crude oil
replaces other Middle Eastern barrels, freight rates could come
under pressure as more vessels would be available in the crude
tanker market.
Danish Ship Finance (Danmarks Skibskredit A/S) Shipping Market Review - May 2015
67
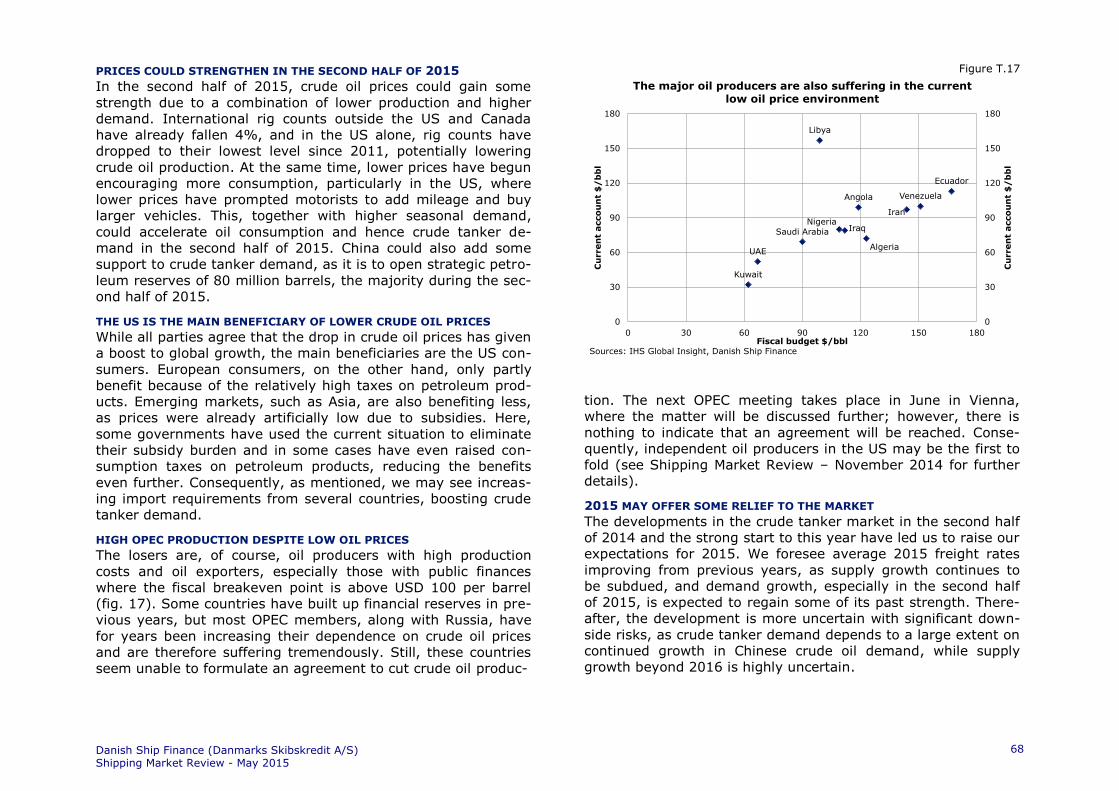
PRICES COULD STRENGTHEN IN THE SECOND HALF OF 2015
In the second half of 2015, crude oil prices could gain some
strength due to a combination of lower production and higher
demand. International rig counts outside the US and Canada
have already fallen 4%, and in the US alone, rig counts have
dropped to their lowest level since 2011, potentially lowering
crude oil production. At the same time, lower prices have begun
encouraging more consumption, particularly in the US, where
lower prices have prompted motorists to add mileage and buy
larger vehicles. This, together with higher seasonal demand,
could accelerate oil consumption and hence crude tanker de-
mand in the second half of 2015. China could also add some
support to crude tanker demand, as it is to open strategic petro-
leum reserves of 80 million barrels, the majority during the sec-
ond half of 2015.
THE US IS THE MAIN BENEFICIARY OF LOWER CRUDE OIL PRICES
While all parties agree that the drop in crude oil prices has given
a boost to global growth, the main beneficiaries are the US con-
sumers. European consumers, on the other hand, only partly
benefit because of the relatively high taxes on petroleum prod-
ucts. Emerging markets, such as Asia, are also benefiting less,
as prices were already artificially low due to subsidies. Here,
some governments have used the current situation to eliminate
their subsidy burden and in some cases have even raised con-
sumption taxes on petroleum products, reducing the benefits
even further. Consequently, as mentioned, we may see increas-
ing import requirements from several countries, boosting crude
tanker demand.
HIGH OPEC PRODUCTION DESPITE LOW OIL PRICES
The losers are, of course, oil producers with high production
costs and oil exporters, especially those with public finances
where the fiscal breakeven point is above USD 100 per barrel
(fig. 17). Some countries have built up financial reserves in pre-
vious years, but most OPEC members, along with Russia, have
for years been increasing their dependence on crude oil prices
and are therefore suffering tremendously. Still, these countries
seem unable to formulate an agreement to cut crude oil produc-
Figure T.17
tion. The next OPEC meeting takes place in June in Vienna,
where the matter will be discussed further; however, there is
nothing to indicate that an agreement will be reached. Conse-
quently, independent oil producers in the US may be the first to
fold (see Shipping Market Review – November 2014 for further
details).
2015 MAY OFFER SOME RELIEF TO THE MARKET
The developments in the crude tanker market in the second half
of 2014 and the strong start to this year have led us to raise our
expectations for 2015. We foresee average 2015 freight rates
improving from previous years, as supply growth continues to
be subdued, and demand growth, especially in the second half
of 2015, is expected to regain some of its past strength. There-
after, the development is more uncertain with significant down-
side risks, as crude tanker demand depends to a large extent on
continued growth in Chinese crude oil demand, while supply
growth beyond 2016 is highly uncertain.
Kuwait
UAE
Saudi ArabiaNigeria
Iraq
Angola
Libya
Iran
Algeria
Venezuela
Ecuador
0
30
60
90
120
150
180
0
30
60
90
120
150
180
0 30 60 90 120 150 180
Cu
rren
t acco
un
t $
/b
bl
Cu
rren
t acco
un
t $
/b
bl
Sources: IHS Global Insight, Danish Ship Finance
The major oil producers are also suffering in the currentlow oil price environment
Fiscal budget $/bbl
Danish Ship Finance (Danmarks Skibskredit A/S) Shipping Market Review - May 2015
68

PRODUCT TANKER
SHIPPING MARKET REVIEW – MAY 2015
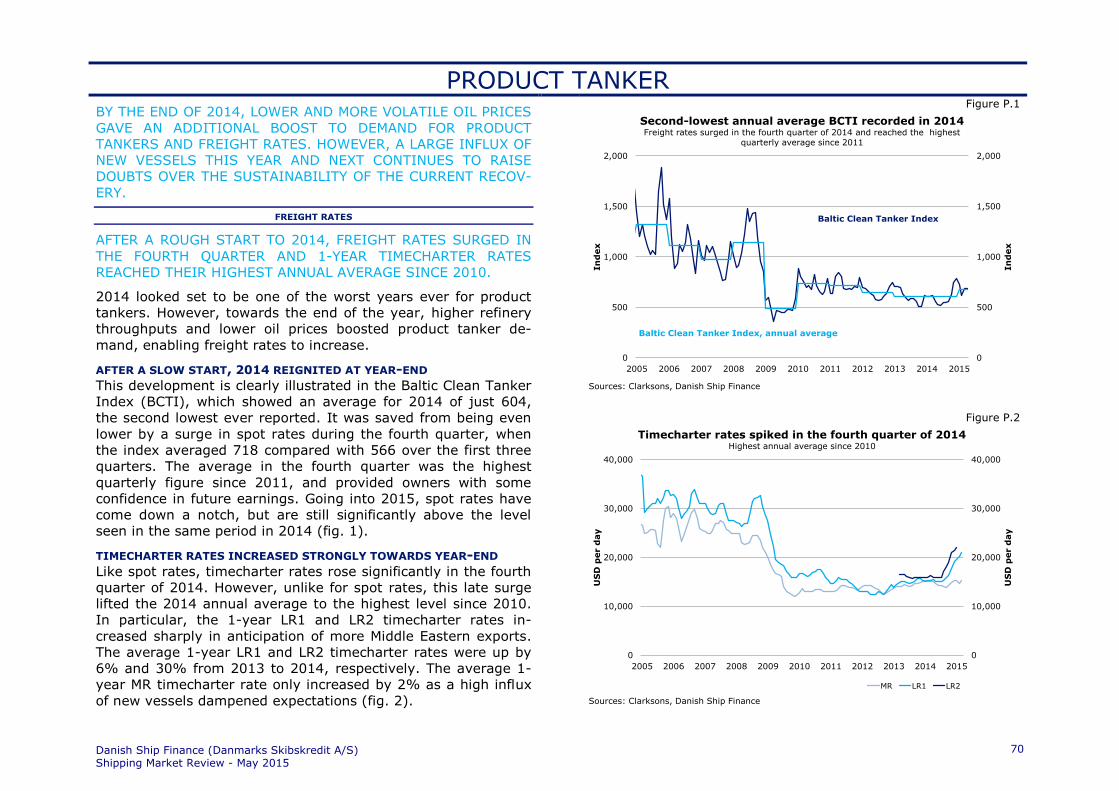
PRODUCT TANKERBY THE END OF 2014, LOWER AND MORE VOLATILE OIL PRICES
GAVE AN ADDITIONAL BOOST TO DEMAND FOR PRODUCT
TANKERS AND FREIGHT RATES. HOWEVER, A LARGE INFLUX OF
NEW VESSELS THIS YEAR AND NEXT CONTINUES TO RAISE
DOUBTS OVER THE SUSTAINABILITY OF THE CURRENT RECOV-
ERY.
FREIGHT RATES
AFTER A ROUGH START TO 2014, FREIGHT RATES SURGED IN
THE FOURTH QUARTER AND 1-YEAR TIMECHARTER RATES
REACHED THEIR HIGHEST ANNUAL AVERAGE SINCE 2010.
2014 looked set to be one of the worst years ever for product
tankers. However, towards the end of the year, higher refinery
throughputs and lower oil prices boosted product tanker de-
mand, enabling freight rates to increase.
AFTER A SLOW START, 2014 REIGNITED AT YEAR-END
This development is clearly illustrated in the Baltic Clean Tanker
Index (BCTI), which showed an average for 2014 of just 604,
the second lowest ever reported. It was saved from being even
lower by a surge in spot rates during the fourth quarter, when
the index averaged 718 compared with 566 over the first three
quarters. The average in the fourth quarter was the highest
quarterly figure since 2011, and provided owners with some
confidence in future earnings. Going into 2015, spot rates have
come down a notch, but are still significantly above the level
seen in the same period in 2014 (fig. 1).
TIMECHARTER RATES INCREASED STRONGLY TOWARDS YEAR-END
Like spot rates, timecharter rates rose significantly in the fourth
quarter of 2014. However, unlike for spot rates, this late surge
lifted the 2014 annual average to the highest level since 2010.
In particular, the 1-year LR1 and LR2 timecharter rates in-
creased sharply in anticipation of more Middle Eastern exports.
The average 1-year LR1 and LR2 timecharter rates were up by
6% and 30% from 2013 to 2014, respectively. The average 1-
year MR timecharter rate only increased by 2% as a high influx
of new vessels dampened expectations (fig. 2).
Figure P.1
Figure P.2
0
500
1,000
1,500
2,000
0
500
1,000
1,500
2,000
2005 2006 2007 2008 2009 2010 2011 2012 2013 2014 2015
In
dex
In
dex
Sources: Clarksons, Danish Ship Finance
Second-lowest annual average BCTI recorded in 2014Freight rates surged in the fourth quarter of 2014 and reached the highest
quarterly average since 2011
Baltic Clean Tanker Index
Baltic Clean Tanker Index, annual average
0
10,000
20,000
30,000
40,000
0
10,000
20,000
30,000
40,000
2005 2006 2007 2008 2009 2010 2011 2012 2013 2014 2015
US
D p
er d
ay
US
D p
er d
ay
Sources: Clarksons, Danish Ship Finance
Timecharter rates spiked in the fourth quarter of 2014Highest annual average since 2010
MR LR1 LR2
Danish Ship Finance (Danmarks Skibskredit A/S)Shipping Market Review - May 2015
70

Middle East → Asia8%
Asia → Asia8%
FSU → Asia
7%
South America →Asia4%
Asia → Europe4%
North America →Europe
4%
FSU → North
America4%
Europe → Asia
3%
North America → South
America3%
Europe →Africa3%
Other52%
Major product tanker trades(Measured in billion tonne-miles, 2014)
Sources: IHS Global Insight, Danish Ship Finance
Figure P.3
Danish Ship Finance (Danmarks Skibskredit A/S) Shipping Market Review - May 2015
71

SUPPLY & DEMAND
SUPPLY GROWTH ONCE AGAIN EXCEEDED DISTANCE-
ADJUSTED DEMAND. BUT TOWARDS THE END OF 2014 SEA-
SONAL DEMAND, TEMPORARY FACTORS AND THE LOWER OIL
PRICES BENEFITED THE PRODUCT TANKER MARKET.
As expected, the rising fleet growth left its mark on the product
tanker market. However, only the first half of 2014 was affect-
ed, as the drop in oil prices propelled product tanker demand in
the fourth quarter and helped alleviate some of the apparent
oversupply.
FLEET GROWTH IS TRENDING UPWARDS AND REACHED 4% IN 2014
After reaching its trough in 2012, fleet growth reversed and has
been trending upwards ever since, reaching 3% in 2013 and 4%
in 2014 (fig. 4).
67% OF SCHEDULED ORDERS WERE DELIVERED IN 2014
At the beginning of 2014, almost 9.7 million dwt was scheduled
to be delivered to the fleet, the majority in the MR segment, as
neither of the LR segments has seen any significant contracting
in recent years, except for 2013. Surprisingly, though, despite
an average delivery time of around two years, nearly 20% of
the vessels contracted in 2013 hit the water during 2014. At
year-end, 6.5 million dwt had entered the product tanker fleet,
representing 67% of scheduled orders. This figure was support-
ed in particular by the MR segment, which showed a delivery
ratio of 70% and accounted for the bulk of the deliveries. Most
of the remaining 33% of the scheduled 2014 orders were post-
poned, while a few MR orders were cancelled, consistent with
the bleaker outlook for this segment (fig. 5).
SCRAPPING DID NOT MEET OUR EXPECTATIONS IN 2014
Contrary to our expectations, the underlying risk of overcapacity
in the product tanker market in combination with the poor mar-
ket environment at the beginning of 2014 did not prompt own-
ers to increase scrapping. In fact, the opposite occurred: scrap-
ping decreased from 2.2 million dwt in 2013 to less than 1.5
million dwt in 2014 (fig. 4). Despite the lower scrapping activity,
the average scrapping age went down by two years, from 27 in
2013 to 25 in 2014.
Figure P.4
Figure P.5
9% 9%
11%
13%
11%
5%
4%
2%3%
4%5%
-4%
0%
4%
8%
12%
16%
-5
-
5
10
15
20
2005 2006 2007 2008 2009 2010 2011 2012 2013 2014 2015
Mil
lio
n d
wt
Sources: Clarksons, Danish Ship Finance
6.5 million dwt entered the fleet in 2014Fleet growth is trending upwards
LR2 LR1 MR
Net fleet growth, year-on-year
Deli
verie
sS
crap
pin
g
0.0
2.5
5.0
7.5
10.0
0.0
2.5
5.0
7.5
10.0
Orderbook Postponements Cancellations Actual deliveries
Mil
lion
dw
t
Mil
lio
n d
wt
Sources: Clarksons, Danish Ship Finance
67% of scheduled orders were delivered in 2014The majority were delivered in the MR segment
LR2 LR1 MR
Danish Ship Finance (Danmarks Skibskredit A/S) Shipping Market Review - May 2015
72
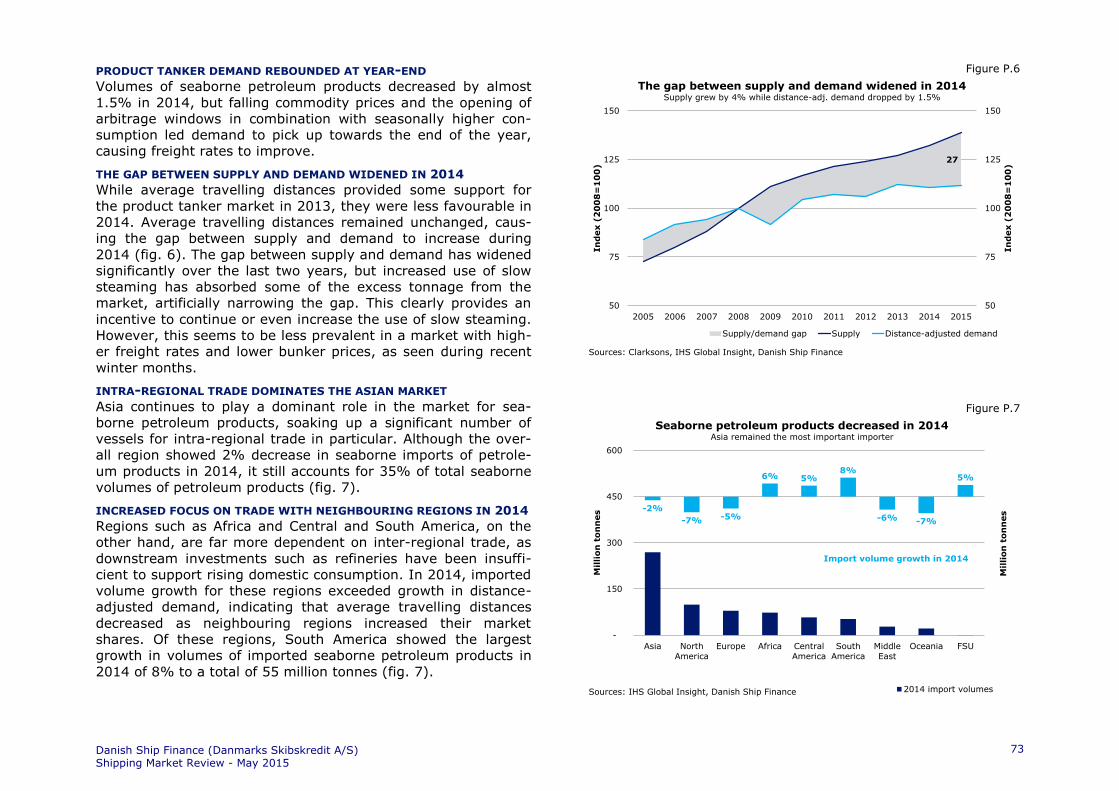
PRODUCT TANKER DEMAND REBOUNDED AT YEAR-END
Volumes of seaborne petroleum products decreased by almost
1.5% in 2014, but falling commodity prices and the opening of
arbitrage windows in combination with seasonally higher con-
sumption led demand to pick up towards the end of the year,
causing freight rates to improve.
THE GAP BETWEEN SUPPLY AND DEMAND WIDENED IN 2014
While average travelling distances provided some support for
the product tanker market in 2013, they were less favourable in
2014. Average travelling distances remained unchanged, caus-
ing the gap between supply and demand to increase during
2014 (fig. 6). The gap between supply and demand has widened
significantly over the last two years, but increased use of slow
steaming has absorbed some of the excess tonnage from the
market, artificially narrowing the gap. This clearly provides an
incentive to continue or even increase the use of slow steaming.
However, this seems to be less prevalent in a market with high-
er freight rates and lower bunker prices, as seen during recent
winter months.
INTRA-REGIONAL TRADE DOMINATES THE ASIAN MARKET
Asia continues to play a dominant role in the market for sea-
borne petroleum products, soaking up a significant number of
vessels for intra-regional trade in particular. Although the over-
all region showed 2% decrease in seaborne imports of petrole-
um products in 2014, it still accounts for 35% of total seaborne
volumes of petroleum products (fig. 7).
INCREASED FOCUS ON TRADE WITH NEIGHBOURING REGIONS IN 2014
Regions such as Africa and Central and South America, on the
other hand, are far more dependent on inter-regional trade, as
downstream investments such as refineries have been insuffi-
cient to support rising domestic consumption. In 2014, imported
volume growth for these regions exceeded growth in distance-
adjusted demand, indicating that average travelling distances
decreased as neighbouring regions increased their market
shares. Of these regions, South America showed the largest
growth in volumes of imported seaborne petroleum products in
2014 of 8% to a total of 55 million tonnes (fig. 7).
Figure P.6
Figure P.7
27
50
75
100
125
150
50
75
100
125
150
2005 2006 2007 2008 2009 2010 2011 2012 2013 2014 2015
In
dex (
20
08
=1
00
)
In
dex (
20
08
=1
00
)
Sources: Clarksons, IHS Global Insight, Danish Ship Finance
The gap between supply and demand widened in 2014Supply grew by 4% while distance-adj. demand dropped by 1.5%
Supply/demand gap Supply Distance-adjusted demand
-2%
-7% -5%
6% 5%8%
-6% -7%
5%
-60%
-40%
-20%
0%
20%
-
150
300
450
600
Asia NorthAmerica
Europe Africa CentralAmerica
SouthAmerica
MiddleEast
Oceania FSU
Mil
lio
n t
on
nes
Sources: IHS Global Insight, Danish Ship Finance
Seaborne petroleum products decreased in 2014Asia remained the most important importer
2014 import volumes
Mil
lio
n t
on
nes
Import volume growth in 2014
Danish Ship Finance (Danmarks Skibskredit A/S) Shipping Market Review - May 2015
73

Brazil, the region’s largest consumer, continues to show resilient
import figures, despite the partial start-up of its Abreu e Lima
refinery in November and its weak economy. Still, subsidised
prices on petroleum products boosted domestic demand, while a
persistent drought in most of the country required the govern-
ment to increase imports of particularly fuel oil in order to offset
a decline in hydropower generation.
US IMPORTS REACHED PRE-RECESSION LEVELS IN 2015
US exports of petroleum products reached a new record high in
2014 after continuous growth throughout the year. Exports
peaked at close to 4.5 million barrels per day in December, av-
eraging 3.8 million barrels per day overall in 2014 (fig. 8). US
imports, on the other hand, decreased by 7% on average in
2014. In the first quarter of 2015, however, US imports recov-
ered as a combination of increasing demand and refinery outag-
es drew in more imports, especially from Europe. Unusually,
even diesel cargoes found their way to the US as the Atlantic
arbitrage flow reversed for a short period. The reason for this
rare occurrence was the double-whammy of refinery unit outag-
es triggered by very cold weather and the largest US refinery
strike since 1980, involving 12 refineries or one-fifth of domestic
capacity.
Besides subduing production, the colder than usual winter drove
up heating oil consumption at the same time as the new ECA
regulations boosted demand for marine gas oil. One reason for
the successful implementation of the new regulations might be
that the drop in crude oil prices has reduced additional bunker
costs associated with the switch from regular bunker fuel to ma-
rine gas oil to a level equal to non-compliance penalties. The
lower oil prices have also encouraged more private consumption
as motorists have added mileage and begun buying larger vehi-
cles. Altogether, these factors have brought about some imbal-
ances between supply and demand, increasing the import re-
quirements to the US, the East Coast in particular.
TANKER DEMAND HELPED BY LOWER AND MORE VOLATILE OIL PRICES
Lower crude oil prices have supported robust refining margins,
encouraging refiners to process as much crude oil as possible.
Figure P.8
Throughputs in Europe, Asia and Oceania were almost 2 million
barrels per day higher at the beginning of 2015 than in the
same period in 2014. Firm refinery throughputs have not yet led
to any large build-up in petroleum product inventories, though,
indicating that oil demand is strong enough to absorb the extra
supplies. Consequently, demand for product tankers has been
boosted by increased transport requirements. In conjunction
with declining oil prices, prices on petroleum products have be-
come more volatile, causing regional arbitrage windows to be
opened and closed more frequently and hence intensifying trad-
ing activity. The result of this has been that voyage durations
have increased, supporting demand for product tankers.
0
1
2
3
4
0
1
2
3
4
2002 2006 2010 2014
Mil
lion
barrels
per d
ay
Mil
lio
n b
arrels
per d
ay
Sources: EIA, Danish Ship Finance
US exports of petroleum products continue to riseExports peaked in December at close to 4.5 million barrels per day
CAGR 7.3%
CAGR 15.6%
CAGR 13.5%
Danish Ship Finance (Danmarks Skibskredit A/S) Shipping Market Review - May 2015
74
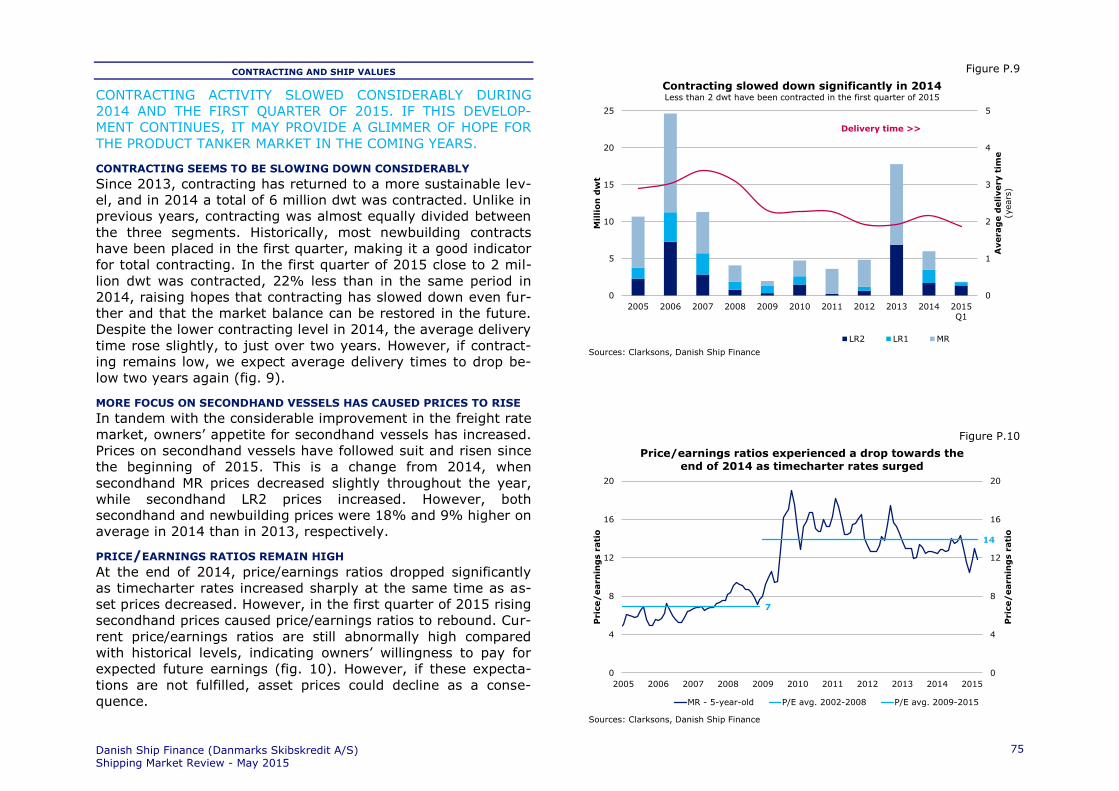
CONTRACTING AND SHIP VALUES
CONTRACTING ACTIVITY SLOWED CONSIDERABLY DURING
2014 AND THE FIRST QUARTER OF 2015. IF THIS DEVELOP-
MENT CONTINUES, IT MAY PROVIDE A GLIMMER OF HOPE FOR
THE PRODUCT TANKER MARKET IN THE COMING YEARS.
CONTRACTING SEEMS TO BE SLOWING DOWN CONSIDERABLY
Since 2013, contracting has returned to a more sustainable lev-
el, and in 2014 a total of 6 million dwt was contracted. Unlike in
previous years, contracting was almost equally divided between
the three segments. Historically, most newbuilding contracts
have been placed in the first quarter, making it a good indicator
for total contracting. In the first quarter of 2015 close to 2 mil-
lion dwt was contracted, 22% less than in the same period in
2014, raising hopes that contracting has slowed down even fur-
ther and that the market balance can be restored in the future.
Despite the lower contracting level in 2014, the average delivery
time rose slightly, to just over two years. However, if contract-
ing remains low, we expect average delivery times to drop be-
low two years again (fig. 9).
MORE FOCUS ON SECONDHAND VESSELS HAS CAUSED PRICES TO RISE
In tandem with the considerable improvement in the freight rate
market, owners’ appetite for secondhand vessels has increased.
Prices on secondhand vessels have followed suit and risen since
the beginning of 2015. This is a change from 2014, when
secondhand MR prices decreased slightly throughout the year,
while secondhand LR2 prices increased. However, both
secondhand and newbuilding prices were 18% and 9% higher on
average in 2014 than in 2013, respectively.
PRICE/EARNINGS RATIOS REMAIN HIGH
At the end of 2014, price/earnings ratios dropped significantly
as timecharter rates increased sharply at the same time as as-
set prices decreased. However, in the first quarter of 2015 rising
secondhand prices caused price/earnings ratios to rebound. Cur-
rent price/earnings ratios are still abnormally high compared
with historical levels, indicating owners’ willingness to pay for
expected future earnings (fig. 10). However, if these expecta-
tions are not fulfilled, asset prices could decline as a conse-
quence.
Figure P.9
Figure P.10
0
1
2
3
4
5
0
5
10
15
20
25
2005 2006 2007 2008 2009 2010 2011 2012 2013 2014 2015Q1
Averag
e d
eli
very t
ime
(years
)
Mil
lio
n d
wt
Sources: Clarksons, Danish Ship Finance
Contracting slowed down significantly in 2014Less than 2 dwt have been contracted in the first quarter of 2015
LR2 LR1 MR
Delivery time >>
7
14
0
4
8
12
16
20
0
4
8
12
16
20
2005 2006 2007 2008 2009 2010 2011 2012 2013 2014 2015
Pric
e/
earn
ing
s r
ati
o
Pric
e/
earn
ing
s r
ati
o
Sources: Clarksons, Danish Ship Finance
Price/earnings ratios experienced a drop towards the end of 2014 as timecharter rates surged
MR - 5-year-old P/E avg. 2002-2008 P/E avg. 2009-2015
Danish Ship Finance (Danmarks Skibskredit A/S) Shipping Market Review - May 2015
75

OUTLOOK
DISTANCE-ADJUSTED DEMAND IS NOT SUFFICIENT TO OFFSET
THE RELATIVELY HIGH INFLUX OF NEW VESSELS. HOWEVER,
TEMPORARY FACTORS ARE CURRENTLY SUPPORTING THE
PRODUCT TANKER MARKET. IF THESE DISAPPEAR, THE PROD-
UCT TANKER MARKET MAY BE HEADING FOR A VERY ROUGH
PATH IN THE COMING YEARS.
THE MAJORITY OF THE FLEET IS BELOW THE AGE OF TEN
After the ordering spree in 2013, contracting dropped to a more
sustainable level in 2014. The orderbook-to-fleet ratio has re-
mained largely unchanged since the beginning of 2014. As of
April 2015, the orderbook totals 24 million dwt, representing
18% of the fleet. Roughly 10 million dwt is scheduled for deliv-
ery this year, while an equal amount is scheduled to be deliv-
ered in 2016. The remainder is scheduled for 2017. It should be
noted that the MR orderbook is balanced by the number of ves-
sels above the age of 15, while the LR1 and LR2 orderbook con-
tains between four to six times as many vessels as there are
vessels above the age of 15 in their respective fleets. Overall,
only 10% of the product tanker fleet is more than 15 years old
(fig. 11), making it impossible for the orderbook to be absorbed
unless premature scrapping increases or demand picks up sig-
nificantly. In general, this does not bode well for the product
tanker market.
FLEET GROWTH IS EXPECTED TO RISE FURTHER IN THE COMING YEARS
As mentioned above, 20 million dwt is scheduled to be delivered
during the remainder of 2015 and 2016 combined. For each
year we assume a delivery ratio of 67%, the same as in 2014.
The remaining 33% is postponed to the following year. Conse-
quently, we expect a total of 18.6 million dwt to be delivered to
the fleet in 2015 and 2016. Scrapping will of course counterbal-
ance some of this. However, by assuming that a vessel becomes
a scrapping candidate the year before its next special survey,
starting at the fourth, we only identify roughly 3.5 million dwt of
potential scrapping candidates in each of the next two years.
Moreover, we only expect two-thirds of these to actually be
scrapped. This will result in net fleet growth of 5%, equivalent
to 7 million dwt in 2015 and 2016 (fig. 12).
Figure P.11
Figure P.12
38% 38%
13%
5%
3% 2%
18%
0%
9%
18%
27%
36%
45%
0
11
22
33
44
55
0-5 5-10 10-15 15-20 20-25 25+ Orderbook
Percen
tag
e o
f fl
eet
Mil
lio
n d
wt
Sources: Clarksons, Danish Ship Finance
The current orderbook represents 18% of the fleetThe majority is made up of MR vessels
LR2 LR1 MR
Percentage of fleet >>
5%
4%
2%
3%
4%
5%5%
2%
-2%
0%
2%
4%
6%
8%
-5
-
5
10
15
20
2010 2011 2012 2013 2014 2015 2016 2017
Mil
lio
n d
wt
Sources: Clarksons, Danish Ship Finance
Fleet growth is expected to exceed 5% in 2015 and 2016Scrapping is expected to increase slightly in the coming years
LR2 LR1 MR
Net fleet growth, year-on-year
Deli
verie
sS
crap
pin
g
Danish Ship Finance (Danmarks Skibskredit A/S) Shipping Market Review - May 2015
76

DEMAND GROWTH FOR SEABORNE PETROLEUM PRODUCTS SET TO RISE
Growth in demand for seaborne petroleum products is expected
to grow by 1.9% in the coming years (fig. 13). Asia is expected
to continue to soak up an increasing number of product tankers,
but import requirements from most other regions are also ex-
pected to rise, albeit on a much smaller scale, volume-wise (fig.
14). Average traveling distances are expected to decrease
slightly as exporters increasingly focus on neighbouring regions
in order to minimise transportation costs (fig. 15). However,
temporary factors could spur demand for product tankers fur-
ther. For instance, more volatile oil prices could boost trading
activity as regional arbitrage windows could be opened and
closed more frequently. Furthermore, a significantly improved
crude tanker market could increase vessel substitution, i.e.
more product tankers could start carrying crude oil.
LOWER OIL PRICES ARE EXPECTED TO BOOST DEMAND
Since June 2014, crude oil prices have fallen sharply, and prices
of petroleum products have followed suit, though with a persis-
tent lag. Lower prices are one of the main factors behind the
expected strengthening in demand for seaborne petroleum
products and recent observations already paint a much healthier
demand picture. Take Europe for example: despite an elevated
level of refinery throughput, petroleum product stocks have re-
mained fairly stable, indicating robust oil demand in the region.
The situation is similar in India and South Korea, where gasoline
demand is experiencing double-digit growth rates, while it is
quite strong in China too. In the US, gasoline consumption is
now close to its former highs (fig. 16).
EXPECTED DEMAND FOR GLOBAL PETROLEUM PRODUCTS IN 2015
From a seasonal perspective, demand in the spring tends to be
softer as winter-related consumption fades. Going into the sec-
ond half of the year, however, demand could grow significantly
as improving economic conditions, lower unemployment and
lower pump prices could boost consumption even further than
normal. In particular, the upcoming summer driving season in
the US could prove very strong as lower oil prices have already
led motorists to add mileage and buy larger, less efficient vehi-
cles.
Figure P.13
Figure P.14
0
250
500
750
1,000
0
250
500
750
1,000
2002 2008 2014 2018
Mil
lion
ton
nes
Mil
lio
n t
on
nes
Sources: IHS Global Insight, Danish Ship Finance
Volumes of seaborne petroleum products is expected to grow by 1.9% per annum in the coming years
CAGR 7.1%
CAGR 1.8%
CAGR 1.9%
2% 1% 3% 3%1% 0%
-2%
3%
8%
-60%
-40%
-20%
0%
20%
-
150
300
450
600
Asia NorthAmerica
Europe Africa CentralAmerica
SouthAmerica
MiddleEast
Oceania FSU
Mil
lio
n t
on
nes
Sources: IHS Global Insight, Danish Ship Finance
Demand for seaborne petroleum products is supported by global import growth
2018 import volumes
Compound annual growth rate 2014-2018
Mil
lio
n t
on
nes
Danish Ship Finance (Danmarks Skibskredit A/S) Shipping Market Review - May 2015
77

WORLD-CLASS REFINING HUBS ARE EXPECTED TO SUPPORT DEMAND
World-class refining hubs in Asia, the Middle East and the US
are expected to become increasingly important in the market for
seaborne petroleum products. These new refining hubs will con-
sist of highly complex refineries enjoying economies of scale
and, for Middle Eastern and US refineries, also easy access to
feedstock. This will make them very competitive and able to
outperform less complex refineries. We have already seen evi-
dence of this development. In the European refining industry
around 1 million barrels per day of capacity have been shut
down within the last five years, while the remaining refineries
are operating at lower utilisation rates. A similar situation has
arisen in Japan and Australia, where several refineries have shut
down in the last couple of years. Consequently, demand for
product tankers is expected to be driven to a large extent by a
relocation of refineries rather than an above average rise in the
production of petroleum products.
SEVERAL CONDENSATE SPLITTERS ARE SET TO START UP IN THE US
US refineries have long enjoyed economies of scale, easy access
to terminals and state-of-the-art technology, but their access to
new, unconventional sources of crude oil has given them an ad-
ditional competitive advantage in the form of cheaper feedstock
and lower energy costs. With a decline in domestic consumption,
the US has become the world’s largest exporter of petroleum
products.
Several new distillation units, more specifically condensate split-
ters, are expected to start up in the US between 2015 and
2016, providing further support for US product tanker trade (fig.
17) (see Shipping Market Review – November 2014 for further
details). A condensate splitter is a cheaper and simpler form of
processing crude oil compared with building a standard crude
distillation unit, and its throughput generally requires further
processing before use. Consequently, lightly processed conden-
sate will form part of the refineries’ feedstock on a par with
more regular crude oil grades. This means that demand for
product tankers may rise further as they could become involved
in the entire process, from supplying the refinery with feedstock
to shipping petroleum products to consumers.
Figure P.15
Figure P.16
-2%
0%
2%
4%
6%
8%
-2%
0%
2%
4%
6%
8%
2002-2008 2008-2014 2014-2018
Percen
tag
e g
row
th in
dem
an
d
Percen
tag
e g
ro
wth
in
dem
an
d
Sources: IHS Global Insight, Danish Ship Finance
Average travelling distances are expected to shorten as neighbouring regions increase their market shares
Growth in seaborne volumes Growth in distances
8.0
8.5
9.0
9.5
10.0
8.0
8.5
9.0
9.5
10.0
Jan Feb Mar Apr May Jun Jul Aug Sep Oct Nov Dec
Mil
lion
barrels
per d
ay
Mil
lio
n b
arrels
per d
ay
Sources: EIA, Danish Ship Finance
US consumption of gasoline is getting closer to its former highs
Output range 2005-2014 2014 2015
Danish Ship Finance (Danmarks Skibskredit A/S) Shipping Market Review - May 2015
78

ASIA’S REFINERY ADDITIONS TO SUPPORT INTRA-REGIONAL TRADE
In Asia, significant growth in demand for petroleum products
was the key driver behind its plans for refinery capacity. Conse-
quently, most new refineries will be focusing on supplying the
domestic market, while a few will also be increasingly export-
driven. Recently, Asia has experienced slowing regional demand
for petroleum products, making several new refinery projects
superfluous. On the back of this development, refinery capacity
expansions in Asia has been scaled back by more than 1 million
barrels per day, but 2.5 million barrels per day of new refining
capacity is still expected to come online in the coming five years
(fig. 17). This will lead to further intra-regional trade, but tem-
porary discrepancies between regional supply and demand fig-
ures may occur for specific petroleum products, fostering inter-
regional trade (see Shipping Market Review – November 2014
for further details).
MIDDLE EASTERN EXPORTS COULD INCREASE SUBSTANTIALLY
Regional growth in demand for petroleum products was also a
key driver behind the Middle East’s plans for refinery additions.
However, the region also has the advantage of easy access to
feedstock, enabling it to profit from domestic refinery capacity.
This ability has made the Middle East more export-driven and
consequently less reliant on domestic consumption. Middle East-
ern refinery capacity is set to increase by 1.7 million barrels per
day in the next five years (fig. 17), significantly more than re-
gional demand growth. This is in line with the predicted decline
in regional imports of petroleum products as the new refinery
capacity is expected to make additional imports of petroleum
products unnecessary given that it will be more than able to sat-
isfy regional consumption growth (fig. 14). However, due to dif-
fering regional quality requirements, the Middle East could de-
cide to maximise profits by exporting high-quality petroleum
products, while importing cheaper low-quality petroleum prod-
ucts. This would likely increase trading activity and hence prod-
uct tanker demand (see Shipping Market review – May 2014 for
further details).
Refinery capacity additions in the Middle East are expected to
support inter-regional trade, and exports of petroleum products
Figure P.17
Figure P.18
-0.4
0.0
0.4
0.8
1.2
1.6
-0.4
0.0
0.4
0.8
1.2
1.6
2015 2016 2017 2018 2019
In
crease i
n r
efi
nery c
ap
acit
y(M
illion b
arr
els
per
day)
In
crease in
refi
nery c
ap
acit
y(M
illion b
arr
els
per
day)
Sources: IEA, Danish Ship Finance
World-class refining hubs in Asia, the Middle East and the US are under development
Asia Middle East North America South America Europe FSU Africa Oceania
8%
10%
5%7% 6%
13% 12%
0%
3%
0
8
16
24
32
40
Asia Africa Europe NorthAmerica
SouthAmerica
CentralAmerica
Oceania MiddleEast
FSU
Mil
lio
n t
on
nes
Sources: IHS Global Insight, Danish Ship Finance
Middle Eastern refinery additions are expected to support inter-regional trade
Growth in export volumes 2014-18
Compound annual growth rate 2014-2018
Mil
lio
n t
on
nes
Danish Ship Finance (Danmarks Skibskredit A/S) Shipping Market Review - May 2015
79

are expected to increase by roughly half of the new refinery ca-
pacity over the coming five years or so (fig. 18). Diesel, in par-
ticular, will be the product of choice for exporters, as the new
refineries will be configured to maximise diesel output, while
domestic consumption seems to favour lighter distillates such as
gasoline. Consequently, it seems that the configuration of these
plants will be somewhat misaligned with predicted regional de-
mand, which could mean that temporary imports of lighter dis-
tillates are required.
MIDDLE EASTERN CONSUMPTION IS ON THE RISE
Middle Eastern consumption of petroleum products has been ris-
ing fast and is, as mentioned, expected to continue growing in
the coming years. This will be driven by a growing population,
an expanding middle class and increasing consumerism, where-
by a lack of public transport makes cars both a functional neces-
sity and a symbol of wealth and status. Currently, car sales are
experiencing double-digit growth rates. Consumption growth is
being boosted further by huge oil subsidies, which besides sup-
porting demand also encourage inefficiencies. If Middle Eastern
countries succeed in implementing policies on energy efficiency
and reduce the level of subsidies, demand growth could moder-
ate, making more petroleum products available for the export
market. These added volumes would be highly competitive on
the world market and would likely replace domestically-
produced petroleum products in, for instance, Europe. Conse-
quently, demand for product tankers would increase.
UNDERLYING FACTORS COULD SUPPORT PRODUCT TANKER DEMAND
Product tankers earnings have declined but after relatively
strong freight rates in the fourth quarter of 2015, they are still
at an acceptable level. This has alleviated some of our concerns
about the product tanker market in 2015, but the gap between
supply and demand is still expected to widen. However, it seems
that a shift in underlying factors such as lower and more volatile
petroleum product prices has been able to provide some support
for the market. If this development does not continue, the prod-
uct tanker market may be heading for a rough path in 2016.
Danish Ship Finance (Danmarks Skibskredit A/S) Shipping Market Review - May 2015
80

LPG TANKER
SHIPPING MARKET REVIEW – MAY 2015

LPG TANKERDURING 2014 DEMAND FOR LPG TANKERS WAS BOOSTED BY
RISING ASIAN IMPORTS OF LONG-HAUL US LPG. ALTHOUGH
DEMAND IS EXPECTED TO CONTINUE ITS POSITIVE DEVELOP-
MENT, A LARGE INFLUX OF NEW VESSELS, PARTICULAR VLGCS,
IS SET TO PUT DOWNWARD PRESSURE ON FUTURE FREIGHT
RATES.
FREIGHT RATES
2014 TURNED OUT TO BE THE BEST YEAR SO FAR FOR LPG
OWNERS. FREIGHT RATES SOARED TO RECORD-HIGH LEVELS
DURING THE SECOND QUARTER AND CONTINUED TO SURGE
THROUGH MOST OF THE SUMMER MONTHS. SPOT RATES HAVE
SINCE RETURNED TO A LOWER, BUT STILL SATISFACTORY,
LEVEL. TIMECHARTER RATES, ON THE OTHER HAND, HAVE
LARGELY STABILISED, WHILE THE VLGC TIMECHARTER RATE,
HAS INCREASED AGAIN IN 2015.
LPG SPOT RATES INCREASED 55% YEAR-ON-YEAR IN 2014
Spot rates rose as high as USD 132 per tonne on average in July
2014 on the benchmark route between the Middle East and Asia.
This surge was not confined to this particular route, but benefit-
ed all other trading routes as well. Overall, the spot market was,
on average, 55% above the level seen in 2013. Since the sum-
mer months, spot rates have dropped to a lower level in accord-
ance with seasonal refinery maintenance. However, while freight
rates often reach their lowest point in the year during the first
quarter, spot rates unexpectedly gained momentum in the first
quarter of 2015, averaging USD 90 per tonne, 56% higher than
in the same period in 2014 (fig. 1).
TIMECHARTER RATES SOFTENED IN THE SECOND HALF OF 2014
After its very strong run throughout the first half of 2014, the 1-
year VLGC timecharter rate eased during the second half of the
year, only to increase again in the first quarter of 2015. It is
now approaching USD 2 million per month, the highest level ev-
er recorded. The 1-year MGC timecharter rate has stabilised at
around USD 1 million per month since the summer months (fig.
2).
Figure LPG.1
Figure LPG.2
-
30
60
90
120
150
0
30
60
90
120
150
2005 2006 2007 2008 2009 2010 2011 2012 2013 2014 2015
US
D p
er t
on
ne
US
D p
er t
on
ne
Sources: Clarksons, Danish Ship Finance
Spot earnings reached a record-high level in 20142015 has started off on a high note - spot rates still above USD 80 per tonne
Baltic Exchange VLGC (Middle East to Japan)
Annual average
0.0
0.4
0.8
1.2
1.6
2.0
0.0
0.4
0.8
1.2
1.6
2.0
2.4
2005 2006 2007 2008 2009 2010 2011 2012 2013 2014 2015
Mil
lion
US
D p
er m
on
th
Mil
lio
n U
SD
per m
on
th
Sources: Clarksons, Danish Ship Finance
1-year timecharter continues to reach new highsThe 1-year VLGC timecharter rate is approaching USD 2 million per month
VLGC MGC
Danish Ship Finance (Danmarks Skibskredit A/S) Shipping Market Review - May 2015
82
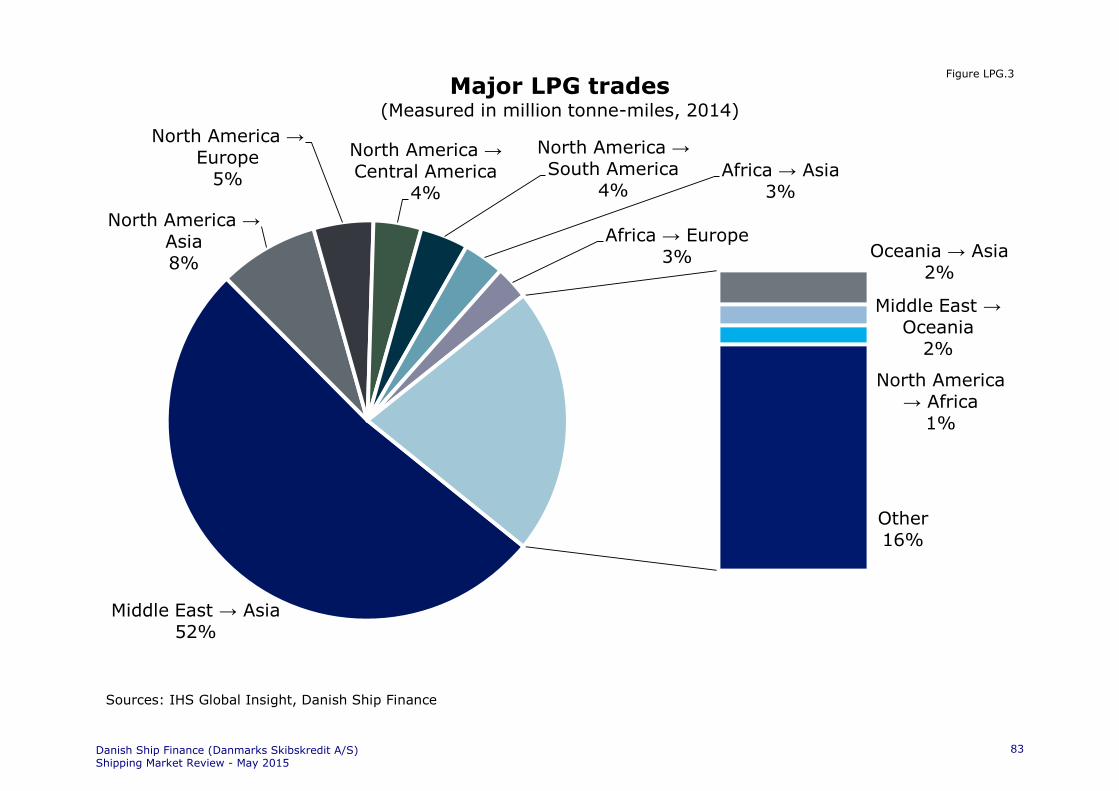
Middle East → Asia52%
North America →Asia8%
North America →Europe
5%
North America →Central America
4%
North America →South America
4%Africa → Asia
3%
Africa → Europe3% Oceania → Asia
2%
Middle East →Oceania
2%
North America → Africa
1%
Other16%
Major LPG trades (Measured in million tonne-miles, 2014)
Sources: IHS Global Insight, Danish Ship Finance
Figure LPG.3
Danish Ship Finance (Danmarks Skibskredit A/S) Shipping Market Review - May 2015
83

SUPPLY & DEMAND
DURING 2014, DISTANCE-ADJUSTED DEMAND FOR SEABORNE
LPG VOLUMES OUTPACED SUPPLY GROWTH BY 11 PERCENTAGE
POINTS. CONSEQUENTLY, UTILISATION RATES ROSE TO AL-
MOST 100%.
THE FLEET GREW BY LESS THAN 5% IN 2014 DUE TO POSTPONEMENTS
The LPG fleet expanded by nearly 5% in 2014, slightly less than
the level we were expecting at the end of the third quarter (fig.
4). This slight decline was attributable to an increase in post-
ponements during the fourth quarter. Postponements usually
increase towards the end of the year, as owners prefer to re-
ceive vessels that, on paper, are one year younger, but this year
the sharp drop in spot rates during the second half of 2014
might have given owners a further incentive to reschedule or-
ders. Altogether, 24% of scheduled orders were postponed in
2014, while 2%, all of them SGC vessels, were cancelled. In to-
tal, almost 1.5 million Cu.M. was scheduled to enter the fleet in
2014, but only 1.1 million Cu.M actually materialised, resulting
in a delivery ratio of 74% (fig. 5). As expected, deliveries have
picked up in 2015, and in the first quarter alone, they have al-
ready exceeded 0.5 million Cu.M., half the level seen for the
whole of 2014.
SCRAPPING CONTINUES TO BE SUBDUED
The record-high freight rate market discouraged owners from
scrapping vessels in 2014. Consequently, scrapping remained
low at less than 0.15 million Cu.M. However, as freight rates
came down from their previous highs in the second half of the
year, scrapping picked up, and overall, was more than 50%
higher in the second half of the year. Scrapping was mainly con-
fined to the SGC segment, which had a higher proportion of old-
er vessels than other segments. At the same time, the drop in
freight rates was more pronounced in the smaller vessel sizes.
Going into 2015, scrapping returned to a minimal level, with on-
ly two SGC vessels sent to the scrapyard in the first quarter (fig.
4). The average scrapping age remained high in 2014 and so far
in 2015 it has been 28 years, i.e. two years below the vessels’
expected operating lifetime. This is an increase of one year
compared with 2013.
Figure LPG.4
Figure LPG.5
2%
5% 5%
14%
4%3%
1% 2%
8%
5%
13%
-4%
0%
4%
8%
12%
16%
-1
-
1
2
3
4
2005 2006 2007 2008 2009 2010 2011 2012 2013 2014 2015
Mil
lio
n C
u.M
.
Sources: Clarksons, Danish Ship Finance
1.1 million Cu.M. entered the fleet in 2014As expected, deliveries began to pick up in the first quarter of 2015
VLGC LGC MGC SGC
Net fleet growth, year-on-year
Deli
verie
sS
crap
pin
g
0.0
0.4
0.8
1.2
1.6
0.0
0.4
0.8
1.2
1.6
Orderbook Postponements Cancellations Actual deliveries
Mil
lion
Cu
.M.
Mil
lio
n C
u.M
.
Sources: Clarksons, Danish Ship Finance
74% of scheduled orders were delivered in 2014The majority were delivered in the VLGC segment
VLGC LGC MGC SGC
Danish Ship Finance (Danmarks Skibskredit A/S) Shipping Market Review - May 2015
84
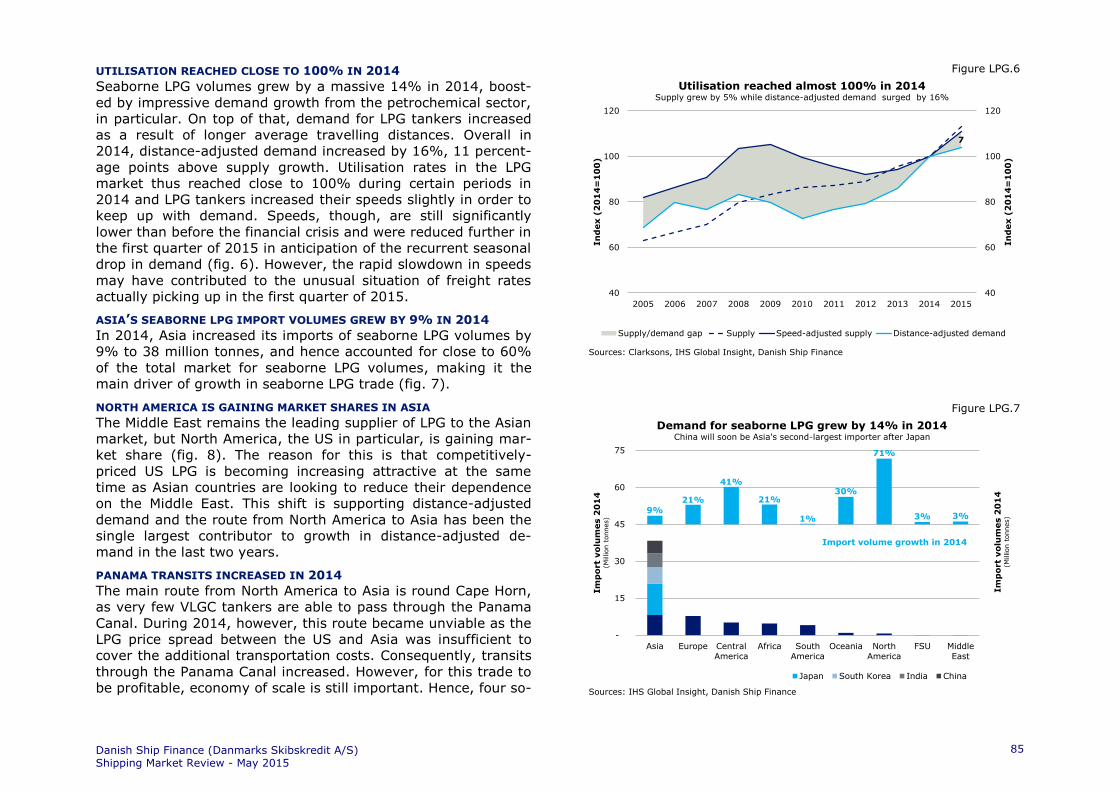
UTILISATION REACHED CLOSE TO 100% IN 2014
Seaborne LPG volumes grew by a massive 14% in 2014, boost-
ed by impressive demand growth from the petrochemical sector,
in particular. On top of that, demand for LPG tankers increased
as a result of longer average travelling distances. Overall in
2014, distance-adjusted demand increased by 16%, 11 percent-
age points above supply growth. Utilisation rates in the LPG
market thus reached close to 100% during certain periods in
2014 and LPG tankers increased their speeds slightly in order to
keep up with demand. Speeds, though, are still significantly
lower than before the financial crisis and were reduced further in
the first quarter of 2015 in anticipation of the recurrent seasonal
drop in demand (fig. 6). However, the rapid slowdown in speeds
may have contributed to the unusual situation of freight rates
actually picking up in the first quarter of 2015.
ASIA’S SEABORNE LPG IMPORT VOLUMES GREW BY 9% IN 2014
In 2014, Asia increased its imports of seaborne LPG volumes by
9% to 38 million tonnes, and hence accounted for close to 60%
of the total market for seaborne LPG volumes, making it the
main driver of growth in seaborne LPG trade (fig. 7).
NORTH AMERICA IS GAINING MARKET SHARES IN ASIA
The Middle East remains the leading supplier of LPG to the Asian
market, but North America, the US in particular, is gaining mar-
ket share (fig. 8). The reason for this is that competitively-
priced US LPG is becoming increasing attractive at the same
time as Asian countries are looking to reduce their dependence
on the Middle East. This shift is supporting distance-adjusted
demand and the route from North America to Asia has been the
single largest contributor to growth in distance-adjusted de-
mand in the last two years.
PANAMA TRANSITS INCREASED IN 2014
The main route from North America to Asia is round Cape Horn,
as very few VLGC tankers are able to pass through the Panama
Canal. During 2014, however, this route became unviable as the
LPG price spread between the US and Asia was insufficient to
cover the additional transportation costs. Consequently, transits
through the Panama Canal increased. However, for this trade to
be profitable, economy of scale is still important. Hence, four so-
Figure LPG.6
Figure LPG.7
7
40
60
80
100
120
40
60
80
100
120
2005 2006 2007 2008 2009 2010 2011 2012 2013 2014 2015
In
dex (
20
14
=1
00
)
In
dex (
20
14
=1
00
)
Sources: Clarksons, IHS Global Insight, Danish Ship Finance
Utilisation reached almost 100% in 2014Supply grew by 5% while distance-adjusted demand surged by 16%
Supply/demand gap Supply Speed-adjusted supply Distance-adjusted demand
9%
21%
41%
21%
1%
30%
71%
3% 3%
-
15
30
45
60
75
Asia Europe CentralAmerica
Africa SouthAmerica
Oceania NorthAmerica
FSU MiddleEast
Im
port
volu
mes 2
01
4(M
illion t
onnes)
Sources: IHS Global Insight, Danish Ship Finance
Demand for seaborne LPG grew by 14% in 2014China will soon be Asia's second-largest importer after Japan
Japan South Korea India China
Im
port
volu
mes 2
01
4(M
illion t
onnes)
Import volume growth in 2014
Danish Ship Finance (Danmarks Skibskredit A/S) Shipping Market Review - May 2015
85

called Panamax VLGCs – possibly the only ones of their kind –
were utilised to navigate the existing Panama Canal. After trans-
iting the Canal, the vessels discharged their cargoes directly on-
to more traditional VLGCs waiting outside Balboa (a district of
Panama City, located at the Pacific entrance to the Panama Ca-
nal). These VLGCs then transported the cargoes to their final
destinations in Asia. While this of course reduced average travel
distances, the distances on this route were still significantly
longer than those from the Middle East to Asia, supporting dis-
tance-adjusted demand. Furthermore, ship-to-ship transfers
outside Balboa provided extra waiting time, prolonging voyages
and reducing the cargo-carrying capacity of the fleet. The in-
creased number of transits through the Panama Canal in 2014
could also mitigate the effect on the market when the expansion
of the Panama Canal finally takes place in 2016, as the market
seems to have already factored in the shorter travelling distanc-
es.
CHINA’S IMPORTS OF LPG SURGED IN 2014
In 2014, three new propane dehydrogenation plants began op-
erating in China, along with a fourth in the first quarter of 2015.
A propane dehydrogenation plant converts propane into propyl-
ene, a key component in the manufacture of plastics and other
petrochemical products. This development caused Chinese LPG
imports to increase by more than 20% in 2014, as additional
domestic LPG production was not nearly sufficient to support the
high feedstock and stockpiling requirements at these propane
dehydrogenation plants.
INDIA’S IMPORTS ARE EARMARKED FOR HOUSEHOLD CONSUMPTION
India’s seaborne LPG imports also surged in 2014, due to two
factors. Firstly, a policy adjustment relaxing India’s subsidy cap
to 12 cylinders containing 14.2 kg of LPG per year, up from nine
cylinders, promoted a 10% rise in household consumption. Sec-
ondly, there was no significant change in refinery capacity and
thereby no significant change in domestic LPG production in
2014. In previous years, domestic consumption growth has
been partly offset by additional domestic LPG production, but
that was not the case in 2014. Thus, the growth in LPG demand
had to be met by additional seaborne LPG imports.
Figure LPG.8
JAPANESE IMPORT REQUIREMENTS INCREASED SLIGHTLY IN 2014
Overall, Japanese LPG consumption is tailing off, but Japan is
still Asia’s largest importer by far (fig. 7). In 2014, imports in-
creased marginally as domestic LPG production declined. This
decline was triggered by a combination of lower refinery utilisa-
tion rates and a drop in domestic refinery capacity. Domestic
refinery capacity dropped 12 million tonnes as refiners opted to
remove capacity rather than carry out expensive refinery up-
grades, which are necessary in order to comply with new gov-
ernment regulations. These regulations require refiners to in-
crease the volume of high-value fuels, like gasoline and diesel,
at the expense of the output of low-value products. Further-
more, falling domestic demand and limited scope for export
growth have squeezed margins, making the refining business
even less attractive. This is also the reason the remaining refin-
eries have lowered their utilisation rates.
2005 2006 2007 2008 2009 2010 2011 2012 2013 2014 2015
Market
sh
are
Market
sh
are
Sources: IHS Global Insight, Danish Ship Finance
North America has been gaining market sharesIn 2014, North America accounted for 7% of Asian LPG imports
Middle East North America Asia Oceania
Africa Central America Europe Other
100%
90%
80%
70%
60%
0%
100%
90%
80%
70%
60%
0%
Danish Ship Finance (Danmarks Skibskredit A/S)Shipping Market Review - May 2015
86
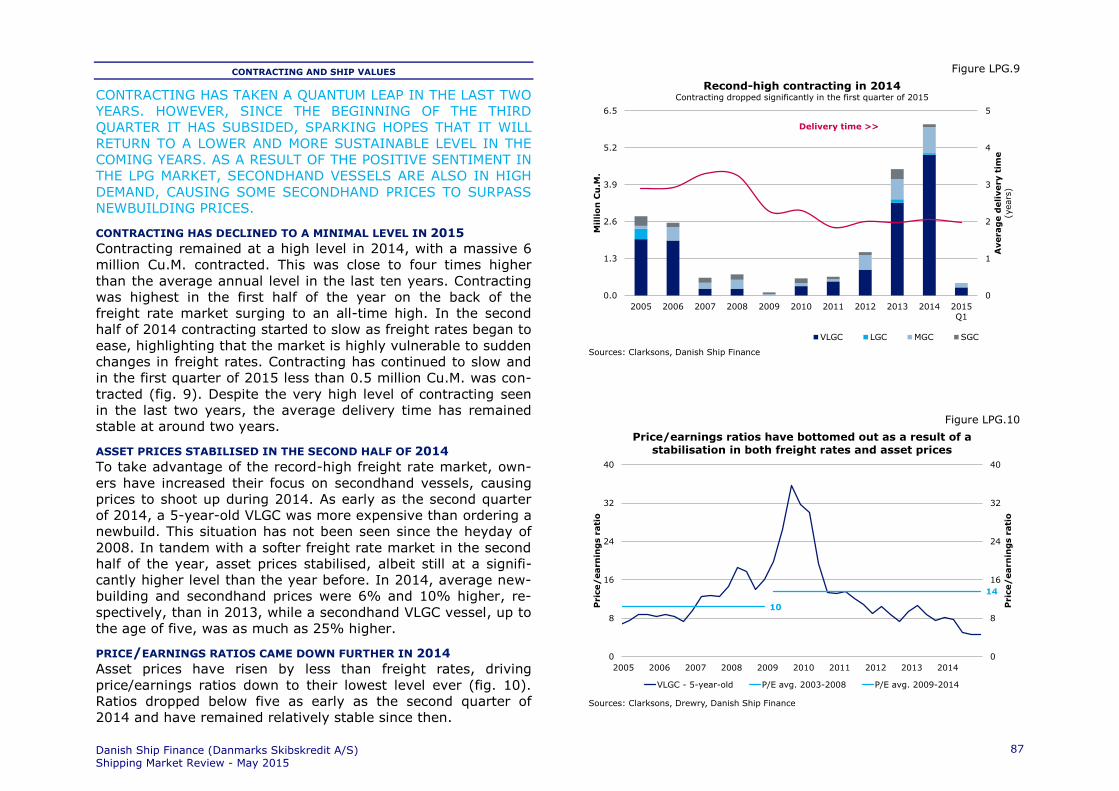
CONTRACTING AND SHIP VALUES
CONTRACTING HAS TAKEN A QUANTUM LEAP IN THE LAST TWO
YEARS. HOWEVER, SINCE THE BEGINNING OF THE THIRD
QUARTER IT HAS SUBSIDED, SPARKING HOPES THAT IT WILL
RETURN TO A LOWER AND MORE SUSTAINABLE LEVEL IN THE
COMING YEARS. AS A RESULT OF THE POSITIVE SENTIMENT IN
THE LPG MARKET, SECONDHAND VESSELS ARE ALSO IN HIGH
DEMAND, CAUSING SOME SECONDHAND PRICES TO SURPASS
NEWBUILDING PRICES.
CONTRACTING HAS DECLINED TO A MINIMAL LEVEL IN 2015
Contracting remained at a high level in 2014, with a massive 6
million Cu.M. contracted. This was close to four times higher
than the average annual level in the last ten years. Contracting
was highest in the first half of the year on the back of the
freight rate market surging to an all-time high. In the second
half of 2014 contracting started to slow as freight rates began to
ease, highlighting that the market is highly vulnerable to sudden
changes in freight rates. Contracting has continued to slow and
in the first quarter of 2015 less than 0.5 million Cu.M. was con-
tracted (fig. 9). Despite the very high level of contracting seen
in the last two years, the average delivery time has remained
stable at around two years.
ASSET PRICES STABILISED IN THE SECOND HALF OF 2014
To take advantage of the record-high freight rate market, own-
ers have increased their focus on secondhand vessels, causing
prices to shoot up during 2014. As early as the second quarter
of 2014, a 5-year-old VLGC was more expensive than ordering a
newbuild. This situation has not been seen since the heyday of
2008. In tandem with a softer freight rate market in the second
half of the year, asset prices stabilised, albeit still at a signifi-
cantly higher level than the year before. In 2014, average new-
building and secondhand prices were 6% and 10% higher, re-
spectively, than in 2013, while a secondhand VLGC vessel, up to
the age of five, was as much as 25% higher.
PRICE/EARNINGS RATIOS CAME DOWN FURTHER IN 2014
Asset prices have risen by less than freight rates, driving
price/earnings ratios down to their lowest level ever (fig. 10).
Ratios dropped below five as early as the second quarter of
2014 and have remained relatively stable since then.
Figure LPG.9
Figure LPG.10
0
1
2
3
4
5
0.0
1.3
2.6
3.9
5.2
6.5
2005 2006 2007 2008 2009 2010 2011 2012 2013 2014 2015Q1
Averag
e d
eli
very t
ime
(years
)
Mil
lio
n C
u.M
.
Sources: Clarksons, Danish Ship Finance
Recond-high contracting in 2014Contracting dropped significantly in the first quarter of 2015
VLGC LGC MGC SGC
Delivery time >>
10
14
0
8
16
24
32
40
0
8
16
24
32
40
2005 2006 2007 2008 2009 2010 2011 2012 2013 2014
Pric
e/
earn
ing
s r
ati
o
Pric
e/
earn
ing
s r
ati
o
Sources: Clarksons, Drewry, Danish Ship Finance
Price/earnings ratios have bottomed out as a result of a stabilisation in both freight rates and asset prices
VLGC - 5-year-old P/E avg. 2003-2008 P/E avg. 2009-2014
Danish Ship Finance (Danmarks Skibskredit A/S) Shipping Market Review - May 2015
87

OUTLOOK
SUPPLY GROWTH IS EXPECTED TO EXCEED DISTANCE-
ADJUSTED DEMAND GROWTH IN THE COMING YEARS, LOWER-
ING UTILISATION RATES FROM THEIR CURRENT HIGHS. THIS
IS BOUND TO HAVE A NEGATIVE IMPACT ON FREIGHT RATES.
The future of the LPG market is shrouded in uncertainty. Today,
the freight market is strong and the outlook for demand seems
promising. However, dark clouds have been building up on the
supply side. The orderbook-to-fleet ratio equals 51%, and al-
most 100 VLGCs are scheduled to enter the fleet within the next
three years (fig. 11). Given that the current VLGC fleet compris-
es 170 vessels, it seems obvious that there is little room for
demand to disappoint. Clearly, it is all about timing. The market
fundamentals could remain in a delicate balance, but if supply
outpaces demand, we may see strong short-term corrections to
freight rates, such as those seen during the second half of 2008.
THE ORDERBOOK NOW EQUALS 51% OF THE CURRENT FLEET
An orderbook-to-fleet ratio of 51%, equivalent to 10 million
Cu.M., is the highest level ever recorded. All else being equal, if
the orderbook is delivered according to schedule, i.e. within the
next three years, more than 50% of the fleet will be below the
age of five by 2017, making the age distribution of the LPG fleet
resemble that of the Dry Bulk fleet. Scrapping may alleviate
some of the pressure that the delivery of the orderbook is bound
to have on the freight rate market. The technical operating life-
time of LPG vessels is expected to be around 30 years, as these
vessels’ purer cargoes enable them to trade at an older age. On-
ly 4% of the current fleet is older than 25, while 18% is older
than 20, limiting the number of possible scrapping candidates
(fig. 11).
FLEET GROWTH WILL REACH A NEW RECORD HIGH IN 2016
We expect scrapping to remain subdued in the coming years,
having only identified an average of 0.7 million Cu.M. of poten-
tial scrapping candidates in each of the coming three years. This
figure includes vessels approaching their next special survey,
starting at the fifth. We assume that only a quarter of these will
actually be sent to the scrapyard, and therefore we see little to
indicate that future deliveries can be counterbalanced.
Figure LPG.11
Figure LPG.12
31%29%
15%
7%
14%
4%
51%
0%
15%
30%
45%
60%
0
3
6
9
12
0-5 5-10 10-15 15-20 20-25 25+ Orderbook
Percen
tag
e o
f fl
eet
Mil
lio
n C
u.M
.
Sources: Clarksons, Danish Ship Finance
18% of the current fleet is above 20 yearsThe current orderbook represents 51% of the fleet
VLGC LGC MGC SGC
Percentage of fleet >>
3%
1% 2%
8%
5%
13%
19%
8%
-5%
0%
5%
10%
15%
20%
-1
-
1
3
4
5
2010 2011 2012 2013 2014 2015 2016 2017
Mil
lio
n C
u.M
.
Sources: Clarksons, Danish Ship Finance
Fleet growth is expected to continue rising until 2017Scrapping is expected to weaken slightly after 2015
VLGC LGC MGC SGC
Net fleet growth, year-on-year
Deli
verie
sS
crap
pin
g
Danish Ship Finance (Danmarks Skibskredit A/S) Shipping Market Review - May 2015
88
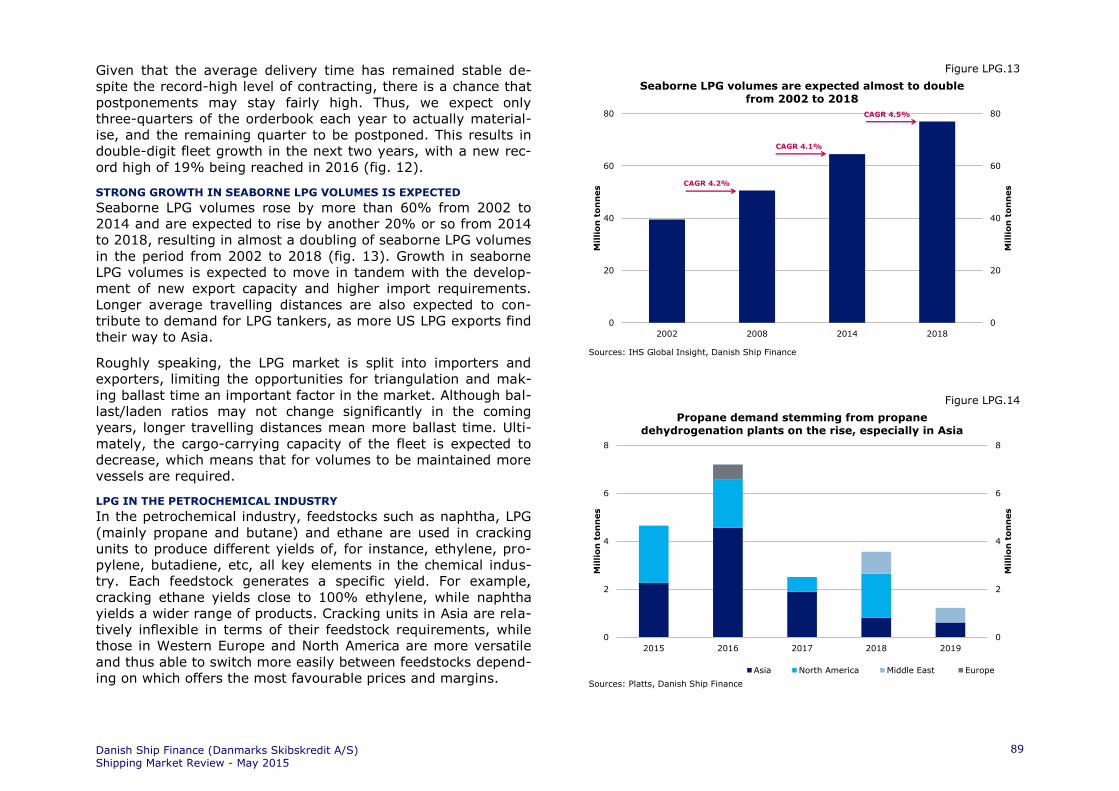
Given that the average delivery time has remained stable de-
spite the record-high level of contracting, there is a chance that
postponements may stay fairly high. Thus, we expect only
three-quarters of the orderbook each year to actually material-
ise, and the remaining quarter to be postponed. This results in
double-digit fleet growth in the next two years, with a new rec-
ord high of 19% being reached in 2016 (fig. 12).
STRONG GROWTH IN SEABORNE LPG VOLUMES IS EXPECTED
Seaborne LPG volumes rose by more than 60% from 2002 to
2014 and are expected to rise by another 20% or so from 2014
to 2018, resulting in almost a doubling of seaborne LPG volumes
in the period from 2002 to 2018 (fig. 13). Growth in seaborne
LPG volumes is expected to move in tandem with the develop-
ment of new export capacity and higher import requirements.
Longer average travelling distances are also expected to con-
tribute to demand for LPG tankers, as more US LPG exports find
their way to Asia.
Roughly speaking, the LPG market is split into importers and
exporters, limiting the opportunities for triangulation and mak-
ing ballast time an important factor in the market. Although bal-
last/laden ratios may not change significantly in the coming
years, longer travelling distances mean more ballast time. Ulti-
mately, the cargo-carrying capacity of the fleet is expected to
decrease, which means that for volumes to be maintained more
vessels are required.
LPG IN THE PETROCHEMICAL INDUSTRY
In the petrochemical industry, feedstocks such as naphtha, LPG
(mainly propane and butane) and ethane are used in cracking
units to produce different yields of, for instance, ethylene, pro-
pylene, butadiene, etc, all key elements in the chemical indus-
try. Each feedstock generates a specific yield. For example,
cracking ethane yields close to 100% ethylene, while naphtha
yields a wider range of products. Cracking units in Asia are rela-
tively inflexible in terms of their feedstock requirements, while
those in Western Europe and North America are more versatile
and thus able to switch more easily between feedstocks depend-
ing on which offers the most favourable prices and margins.
Figure LPG.13
Figure LPG.14
0
20
40
60
80
0
20
40
60
80
2002 2008 2014 2018
Mil
lion
ton
nes
Mil
lio
n t
on
nes
Sources: IHS Global Insight, Danish Ship Finance
Seaborne LPG volumes are expected almost to double from 2002 to 2018
CAGR 4.2%
CAGR 4.1%
CAGR 4.5%
0
2
4
6
8
0
2
4
6
8
2015 2016 2017 2018 2019
Mil
lion
ton
nes
Mil
lio
n t
on
nes
Sources: Platts, Danish Ship Finance
Propane demand stemming from propane dehydrogenation plants on the rise, especially in Asia
Asia North America Middle East Europe
Danish Ship Finance (Danmarks Skibskredit A/S) Shipping Market Review - May 2015
89

LOWER OIL PRICES POSE A THREAT TO PETROCHEMICAL LPG DEMAND
A key driver of LPG demand in the petrochemical industry is its
price compared with alternative feedstocks. The reason for this
is that its yield – ethylene, propylene, etc – is less profitable
than the naphtha yield. Hence, buyers only have an incentive to
substitute naphtha with LPG if the price of LPG is lower. As a
rule of thumb, LPG is a viable alternative to naphtha if its price
is around 90% of that of naphtha or when it is more than USD
50 per tonne cheaper. In addition, the price difference must be
able to cover the extra costs associated with the transport of
LPG. Crude oil prices and hence naphtha prices have fallen
sharply since June 2014, narrowing the price spread between
LPG and naphtha significantly. If the spread remains narrow for
a prolonged period, cracking units may opt to use only naphtha,
and additional projects requiring LPG – both cracking units and
propane dehydrogenation plants – may be at risk. However, in
tandem with lower feedstock prices, plastics prices have de-
creased as well, with a positive impact on demand.
MORE LPG DEMAND WILL COME FROM THE PETROCHEMICAL INDUSTRY
Currently, the petrochemical industry accounts for roughly 25%
of global LPG demand. In the coming years, most, but not all, of
the growth in LPG demand is expected to stem from changes in
petrochemical use, more specifically from the development of
cracking units and propane dehydrogenation plants, using LPG
or ethane as feedstocks. Previously, naphtha was the most
widely used feedstock in the petrochemical industry, but the in-
creased availability of NGL (Natural Gas Liquids) – which, put
simply, consists of all gaseous products except methane (which
is also known as LNG) – has made LPG and ethane viable alter-
natives to naphtha, a petroleum product. This has boosted de-
mand for LPG tankers.
SEVERAL CRACKING UNITS ARE EXPECTED TO COME ON LINE
Several cracking units are scheduled to begin operations in the
coming five years. Most of these are expected to run on naph-
tha, but flexible crackers along with pure LPG and ethane crack-
ers are becoming increasingly common.
NORTH AMERICA FAVOURS ETHANE CRACKING UNITS
Ethane cracking units are primarily being built in North America,
particularly in the US, where the shale revolution has led to a
surge in ethane production. As its use is limited almost entirely
to the production of ethylene, ethane is relatively cheap com-
pared with other feedstocks. Ethylene is the most important raw
material in the downstream plastics industry and accounts for
almost 50% of global chemical volumes. Ethylene prices are
closely linked to the highest-priced feedstock used in its produc-
tion. This is most often naphtha and hence the price spread be-
tween ethane and naphtha roughly determines the ethane
cracking margin. Consequently, as long as US ethane is cheaper
than naphtha, ethane cracking units in the US will be very prof-
itable and the US will continue with its expansions plans. As a
result of these expansion plans, the US might end up with ex-
cess supply of ethylene, which could result in rising ethylene ex-
ports. This could benefit the LPG market, as ethylene is usually
transported on specialised LPG carriers designed to take cargoes
at temperatures as low as -104 degrees Celsius and with a max-
imum tank pressure of 5.4 bar.
ASIA IS MAINLY FOCUSED ON DEVELOPING NAPHTHA CRACKING UNITS
Naphtha is still the preferred feedstock for cracking units in Asia,
as it is domestically produced and yields a wide range of prod-
ucts, including ethylene, propylene and butadiene, used in the
production of different materials ranging from PVC to deter-
gents. However, both flexible and pure LPG cracking units are
expected to begin operations in the coming years, increasing
demand for seaborne LPG.
GROWING NEED FOR PROPANE DEHYDROGENATION PLANTS
Both North America and Asia are expected to invest in purpose-
built propylene production capacity, as their domestic propylene
production, for different reasons, is insufficient to satisfy domes-
tic propylene demand (fig. 14).
Danish Ship Finance (Danmarks Skibskredit A/S) Shipping Market Review - May 2015
90

NORTH AMERICA IS GROWING PROPYLENE PRODUCTION
In North America the change of feedstock from naphtha to
ethane in cracking units has meant that production of propylene
has fallen to an unsustainable level. Propylene is a key chemical
building block second in demand only to ethylene. Consequent-
ly, the petrochemical industry in the US has several propane
dehydrogenation plants planned in order to restore levels of
propylene production. Even though this may increase domestic
consumption of LPG, the shale revolution has resulted in ample
supply of domestically-produced LPG and US LPG exports are
expected to continue to increase in tandem with new export ca-
pacity. Much of the exported LPG is expected to be shipped
long-haul to Asia to support the region’s rising import require-
ments. It remains to be seen whether this will be shipped
through the Panama Canal or around Cape Horn; it depends on
transit costs and the LPG price spread between the US and Asia.
In general, though, demand for LPG tankers on this route is ex-
pected to rise.
ASIA’S DEMAND FOR PROPYLENE IS EXPECTED TO SURGE
While overall demand for propylene in North America is ex-
pected to remain fairly unchanged, Asia is expected to experi-
ence a surge in propylene demand from the plastics industry.
Consequently, Asia is also developing propane dehydrogenation
plants. An estimated propylene capacity of almost 10 million
tonnes is expected to come online in the next few years, which
will require roughly 12 million tonnes of propane (fig. 14). Do-
mestic propane production is considered to be insufficient to
support the surge in demand, thereby making seaborne LPG im-
ports a necessity. Several of these propane dehydrogenation
plants have already signed term contracts for competitively-
priced US LPG, boosting distance-adjusted demand.
EARNINGS MAY COME UNDER PRESSURE AS SUPPLY GROWTH SETS IN
A large influx of new vessels is expected to put downward pres-
sure on freight rates in the coming years. However, very strong
freight rates in the first quarter of 2015 have eased our con-
cerns about overall earnings in 2015, although we are not out of
the woods yet, as many newbuildings are expected to hit the
water during the second half of 2015. Next year could prove
even more difficult, given that fleet growth is expected to reach
a new record high of 19%. However, if demand from the petro-
chemical sector develops in accordance with current plans, this
industry will be able to employ a significant portion of the
scheduled orders. Nevertheless, we expect average freight rates
to drop to a significantly lower level in 2016 and 2017.
CONSUMPTION-DRIVEN GDP CREATION MAY STRENGTHEN LPG DEMAND
A large part of our LPG demand outlook hinges on the develop-
ment in the petrochemical industry and the assumption that ad-
ditional petrochemical products can be absorbed by end-user
demand, securing high petrochemical utilisation rates and hence
LPG demand. However, this is not necessarily the case: in the
dry bulk market, for example, ample supply and inadequate
demand has resulted in severe overcapacity on both the com-
modity and the shipping side, lowering both commodity prices
and freight rates. Fundamentals in the LPG market currently
look quite similar to those in the Dry Bulk market back in 2007,
but the question remains whether demand for LPG continues to
be robust. For freight rates to stay at healthy levels, though,
there is little room for demand to disappoint.
In our ‘General Review and Outlook’ we argued that the global
economy is in a transition phase, whereby new growth engines
are taking over from old ones and Chinese GDP creation, in par-
ticular, will be driven more by consumption and services than
investments. While this transformation is expected to worsen
the outlook for dry bulk demand, the LPG market may, con-
versely, strengthen, as demand, especially Chinese, for products
manufactured with an LPG-related component, such as deter-
gents, pharmaceuticals and electrical appliances, could increase.
Danish Ship Finance (Danmarks Skibskredit A/S) Shipping Market Review - May 2015
91

GLOSSARY
SHIPPING MARKET REVIEW – MAY 2015
GLOSSARY
Aframax: Crude oil tanker or product tanker too
large to pass through the Panama Canal
and with a capacity of 80,000 to 120,000
dwt.
Back-haul: The leg of a trade route that has the low-
est container volumes is often called
’back-haul, whereas the return leg is of-
ten referred to as ‘head-haul’.
Barrel: A volumetric unit measure for crude oil
and petroleum products equivalent to 42
U.S. gallons, or approximately 159 litres.
BHP: Break Horse Power. The amount of engine
horsepower.
Brent: Term used for crude oil from the North
Sea. Brent oil is traded on the Interna-
tional Petroleum Exchange in London, and
the price of Brent is used as a benchmark
for several other types of European oil.
Bulk vessel: Description of vessels transporting large
cargo quantities, including coal, iron ore,
steel, corn, gravel, oil, gas, etc.
Bunker: Fuel for vessels.
Call on OPEC: Defined as total global petroleum demand
less non-OPEC supply less OPEC natural
gas liquid supply.
Capesize: Dry bulk carrier of more than approxi-
mately 100,000 dwt; too large to pass
through the Panama Canal.
Cu.M: Cubic Meter.
Ceu: Car equivalent unit. Unit of measure indi-
cating the car-carrying capacity of a ves-
sel.
Cgt: Compensated Gross Tonnage. Interna-
tional unit of measure that facilitates a
comparison of different shipyards’ produc-
tion regardless of the types of vessel pro-
duced.
Chemical tanker: DSF’s definition: IMO I or IMO II tanker
with stainless steel, zinc, epoxy or
Marineline coated tanks.
Clarksons: British ship brokering and research com-
pany. www.clarksons.net
Clean products: Refers to light, refined oil products such
as jet fuel, gasoline and naphtha.
CoA: Contract of Affreightment. Contract be-
tween a shipping company and a shipper
concerning the freight of a predetermined
volume of goods within a given period of
time and/or at given intervals.
Coating: The internal coatings applied to the tanks
of a product or chemical tanker. Coated
tanks enable the ship to transport corro-
sive refined oil or chemical products and it
facilitates extensive cleaning of the tanks,
which may be required in the transporta-
tion of certain product types.
Deep sea: Refers to trading routes longer than 3,000
nautical miles.
Deep Sea, chemical: A chemical tanker larger than or equal to
20,000 dwt.
Dirty products: Refers to heavy oils such as crude oil or
refined oil products such as fuel oil, diesel
oil or bunker oil.
Drewry: Drewry Shipping Consultants Ltd. British
shipping and transport research company.
www.drewry.co.uk
Dwt: Dead Weight Tons. Indication of a vessel’s
cargo carrying capacity (including bun-
kers, ballast, water and food supplies,
crew and passengers).
Dynamic Positioning: Special instruments on board that in con-
junction with bow thrusters and main
propellers enable a ship to position itself
in a fixed position in relation to the sea-
bed.
Danish Ship Finance (Danmarks Skibskredit A/S) Shipping Market Review - May 2015
93
EIA: Energy Information Administration. A
subsidiary of the US Department of Ener-
gy. www.eia.doe.gov
E&P: Exploration and Production.
Feeders: Small container carrier with a capacity of
less than 1,000 teu.
FPSO: Floating Production Storage Off-loading
unit. Vessel used in the offshore industry
to process and store oil from an underwa-
ter (sub-sea) installation.
Front-haul: The leg of a trade route that has the
highest cargo volumes is often called
‘front-haul’ whereas the return leg is of-
ten referred to as ‘back-haul’.
Geared: Indicates that a vessel is equipped with a
crane or other lifting device.
Gearless: Indicates that a vessel is not equipped
with a crane or other lifting device.
Global order cover: Global order is the global orderbook di-
vided by annual yard capacity.
Gt: Gross Tons. Unit of 100 cubic feet or
2,831 cubic meters, used in arriving at
the calculation of gross tonnage.
Handy, container: Container vessel of between 1,000-1,999
teu.
Handymax, dry cargo: Dry bulk carrier of between approximately
40,000 and 65,000 dwt.
Handysize, dry cargo: Dry bulk carrier of between approximately
10,000 and 40,000 dwt.
Head-haul: The leg of a trade route that has the
highest container volumes is often called
’head-haul, whereas the return leg is of-
ten referred to as ‘back-haul’. On routes
where there is a great trading volume
mismatch between head-haul and back-
haul, the head-haul demand will most of-
ten determine the freight rate level.
Heavy distillates: This oil type includes fuel oils and lubes.
IEA: International Energy Agency. A subsidiary
of the OECD. www.iea.org
IHS Global Insight: American economic consulting company.
www.globalinsight.com
IMO: International Maritime Organization. An
organisation under the UN.
IMO I-III: Quality grades for tankers for the permis-
sion to transport different chemical and
oil products. IMO I are the most hazard-
ous products, IMO III the least hazard-
ous.
Inorganic chemicals: A combination of chemical elements not
containing carbon. The three most com-
mon inorganic chemicals are phosporic
acid, sulphuric acid and caustic soda.
Phosphoric acid and sulphuric acid are
used in the fertilizer industry, whilst caus-
tic soda is used in the aluminium indus-
try. As these chemicals are corrosive to
many metals, they are transported in
stainless steel tanks.
Intermediate: Medium-sized chemical carrier with a ca-
pacity of between 10,000 and 20,000
dwt.
LGC: Large Gas Carrier. LPG ship with a capaci-
ty of between 40,000 and 60,000 Cu.M.
Light distillates: This oil type includes gasoline, naphtha
and solvents.
LPG vessels: Liquefied Petroleum Gas. Vessels used to
transport ammonia and liquid gases
(ethane, ethylene, propane, propylene,
butane, butylenes, isobutene and isobu-
tylene). The gases are transported under
pressure and/or refrigerated.
Danish Ship Finance (Danmarks Skibskredit A/S) Shipping Market Review - May 2015
94

LR1, product tanker: Long Range 1. Product tanker with the
maximum dimensions for passing through
the Panama Canal (width of 32.21 metres
and length of 289.5 metres) of approxi-
mately 60,000-79,999 dwt.
LR2, product tanker: Long Range 2. Product tanker too large to
pass through the Panama Canal and and
with a capacity of 80,000 to 120,000 dwt.
Medium, tanker (MR): Medium Range. Product tanker of be-
tween 10,000 and 60,000 dwt.
MGC: Medium Gas Carrier. LPG ship with a ca-
pacity of between 20,000 and 40,000
Cu.M.
Middle distillates: This oil type includes diesel, kerosene and
gasoil.
Multi-Purpose: Dry bulk carrier with multiple applications,
mainly as a feeder vessel or for special
cargo.
Nautical Mile: Distance unit measure of 1,852 meters,
or 6,076.12 ft.
Offshore vessel: Vessel serving the offshore oil industry.
OPEC: Organisation of Petroleum Exporting
Countries.
Organic chemicals: Contain carbon and are also referred to as
petrochemicals. Are used to produce vir-
tually all products made from plastics or
artificial fibres.
Panamax, container: Container carrier with the maximum di-
mensions for passing through the Panama
Canal (width of 32.21 metres, length of
291 metres) of approximately 3,000—
5,100 teu.
Panamax, tanker: Crude oil tanker or product tanker with
the maximum dimensions for passing
through the Panama Canal (width of
32.21 metres and length of 289.5 metres)
of approximately 60,000—79,999 dwt.
Panamax, dry cargo: Dry bulk vessel with the maximum di-
mensions for passing through the Panama
Canal (width of 32.21 metres and length
of 289.5 metres) of approximately
65,000—100,000 dwt.
Post-Panamax: Container vessel of approximately 3,000+
teu that is too large to pass through the
Panama Canal.
Product tanker: Tanker vessel with coated tanks used to
transport refined oil products.
PSV: Platform Supply Vessel. Offshore vessel
serving the offshore oil installations.
Refinery turnarounds: A planned, periodic shut down (total or
partial) of a refinery process unit or plant
to perform maintenance, overhaul and
repair operations and to inspect, test and
replace process materials and equipment.
Ro-Ro: Roll On – Roll Off. Common description of
vessels on which the cargo is rolled on
board and ashore.
Short sea: Refers to trading routes shorter than
3,000 nautical miles.
Short Sea, chemical: Chemical tanker smaller than 10,000 dwt.
Small gas carrier: LPG ship smaller than 20,000 Cu.M.
SSY: Simpson Spence & Young, British ship
brokering and research company.
www.ssy.co.uk
Sub-Panamax Container vessel of approximately 2,000-
2,999 teu.
Suezmax: Crude oil tanker with the maximum di-
mensions for passing through the Suez
Canal (approximately 120,000—199,999
dwt.).
Super Post-Panamax: Newest type of container vessel of ap-
proximately +12,000 teu.
TCE: Time Charter Equivalent.
Danish Ship Finance (Danmarks Skibskredit A/S) Shipping Market Review - May 2015
95

Teu: Twenty Foot Equivalent Unit. Container
with a length of 20 feet (about 6 metres)
which forms the basis of describing the
capacity of a container vessel.
Teu-knots: Unit of measure that takes account of the
speed of ships when estimating the actual
supply of ships within a segment.
Teu-nautical mile: Unit of measure indicating the volume of
cargo, measured in teu, and how far it
has been transported, measured in nauti-
cal miles.
Tight oil: Tight oil (also known as light tight oil) is a
petroleum play that consists of light crude
oil contained in petroleum-bearing for-
mations of relatively low porosity and
permeability
Ton-nautical mile: Unit of measure indicating the volume of
cargo, measured in ton, and how far it
has been transported, measured in nauti-
cal miles.
Tonnage: Synonymous with “vessel”.
Town gas: A mixture of gases produced by the distil-
lation of bituminous coal and used for
heating and lighting: consists mainly of
hydrogen, methane, and carbon monox-
ide.
ULCC: Ultra Large Crude Carrier. Crude oil tank-
er of more than 320,000 dwt.
Vegetable oils: Oils derived from seeds of plants and
used for both edible and industrial pur-
poses.
VLCC: Very Large Crude Carrier. Crude oil tanker
of between approximately 200,000 and
320,000 dwt.
VLGC: Very Large Gas Carrier. LPG ship with a
capacity of more than 60,000 Cu.M.
Danish Ship Finance (Danmarks Skibskredit A/S) Shipping Market Review - May 2015
96

THIS PAGE IS INTENTIONALLY LEFT BLANK

FOR FURTHER INFORMATION
PLEASE VISIT WWW.SHIPFINANCE.DK