shock tube experiments for earth and mars entry conditions
TRANSCRIPT

RTO-EN-AVT-162 13 - 1
Shock Tube Experiments for Earth and Mars Entry Conditions
David W. Bogdanoff ELORET Corporation
465 S. Mathilda Ave., Suite 103
Sunnyvale, CA 94086
USA
ABSTRACT
This seminar describes how radiative heating for earth and Mars entry conditions has been studied using the
Electric Arc Shock Tube (EAST) at the NASA Ames Research Center in California. The motivation for these
studies includes directly assessing the radiative heating to be expected in specific missions and the
improvement of modeling codes used to predict entry heating. The facility and its instrumentation are
described. The techniques used for the spectrally resolving instruments are described in some detail. Facility
operating procedures and spectrograph and monochromator calibration techniques are described.
Representative data is presented from the data acquistion system and representative spectra are presented for
earth and Mars entry conditions.
1.0 INTRODUCTION
The motivations for the radiation studies at planetary entry conditions in the Electric Arc Shock Tube (EAST)
at the NASA Ames Research Center in California are twofold. First, to directly assess the intensity of the
radiation and second, to provide benchmark data against which modeling and simulation tools can be
calibrated. The actual heating to be expected upon the entry conditions can be assessed, including non-
equilibrium and equilibrium and vacuum ultraviolet (VUV) radiation. Capturing spectroscopic details helps
identify the principal band and line systems to be considered in model building and simulation. Temperatures
(vibrational, rotational, and translational) can, in principle, be obtained from the spectroscopic data, as can
heavy particle and electron number densities (the latter using Stark broadening techniques). These data can
also be used to modify or create new thermochemical rate process models which can then be incorporated into
CFD models to predict entry heating for particular missions. These computational models can then be
calibrated against quantities inferred or measured (temperatures, number densities, line broadening) from the
shock tube experiments.
The purpose of this lecture is to describe specifically how the EAST is being used to study radiative heating
for earth and Mars entry conditions and to present results from these studies.
The presentation starts (Sec. 2) with a brief background on radiation testing in shock tubes. The facility is then
described (Sec. 3). Sections 3.1 to 3.3 describe the driver and driven tubes, the dump tank, the facility power
system and range of operating conditions. Section 4 describes the instrumentation, including pressure
transducers, photomultiplier tubes, spectrographs, monochromators, cameras, windows and optical table
setups. Section 5 presents operating procedures, including calibrations of spectrographs and monochromators

Report Documentation Page Form ApprovedOMB No. 0704-0188
Public reporting burden for the collection of information is estimated to average 1 hour per response, including the time for reviewing instructions, searching existing data sources, gathering andmaintaining the data needed, and completing and reviewing the collection of information. Send comments regarding this burden estimate or any other aspect of this collection of information,including suggestions for reducing this burden, to Washington Headquarters Services, Directorate for Information Operations and Reports, 1215 Jefferson Davis Highway, Suite 1204, ArlingtonVA 22202-4302. Respondents should be aware that notwithstanding any other provision of law, no person shall be subject to a penalty for failing to comply with a collection of information if itdoes not display a currently valid OMB control number.
1. REPORT DATE SEP 2009
2. REPORT TYPE N/A
3. DATES COVERED -
4. TITLE AND SUBTITLE Shock Tube Experiments for Earth and Mars Entry Conditions
5a. CONTRACT NUMBER
5b. GRANT NUMBER
5c. PROGRAM ELEMENT NUMBER
6. AUTHOR(S) 5d. PROJECT NUMBER
5e. TASK NUMBER
5f. WORK UNIT NUMBER
7. PERFORMING ORGANIZATION NAME(S) AND ADDRESS(ES) ELORET Corporation 465 S. Mathilda Ave., Suite 103 Sunnyvale, CA94086 USA
8. PERFORMING ORGANIZATIONREPORT NUMBER
9. SPONSORING/MONITORING AGENCY NAME(S) AND ADDRESS(ES) 10. SPONSOR/MONITOR’S ACRONYM(S)
11. SPONSOR/MONITOR’S REPORT NUMBER(S)
12. DISTRIBUTION/AVAILABILITY STATEMENT Approved for public release, distribution unlimited
13. SUPPLEMENTARY NOTES See also ADA562449. RTO-EN-AVT-162, Non-Equilibrium Gas Dynamics - From Physical Models toHypersonic Flights (Dynamique des gaz non- equilibres - Des modeles physiques jusqu’au volhypersonique)., The original document contains color images.
14. ABSTRACT This seminar describes how radiative heating for earth and Mars entry conditions has been studied usingthe Electric Arc Shock Tube (EAST) at the NASA Ames Research Center in California. The motivation forthese studies includes directly assessing the radiative heating to be expected in specific missions and theimprovement of modeling codes used to predict entry heating. The facility and its instrumentation aredescribed. The techniques used for the spectrally resolving instruments are described in some detail.Facility operating procedures and spectrograph and monochromator calibration techniques are described.Representative data is presented from the data acquistion system and representative spectra are presentedfor earth and Mars entry conditions.
15. SUBJECT TERMS
16. SECURITY CLASSIFICATION OF: 17. LIMITATION OF ABSTRACT
SAR
18. NUMBEROF PAGES
73
19a. NAME OFRESPONSIBLE PERSON
a. REPORT unclassified
b. ABSTRACT unclassified
c. THIS PAGE unclassified
Standard Form 298 (Rev. 8-98) Prescribed by ANSI Std Z39-18

Shock Tube Experiments for Earth and Mars Entry Conditions
13 - 2 RTO-EN-AVT-162
and the data capture process. Section 6 gives the facility operating conditions. Section 7.1 presents results
from the data acquistion system, including monochromator data. Sections 7.2 – 7.5 present low and high
resolution spectra for earth and Mars entry conditions. Section 8 presents concluding remarks.
2.0 BACKGROUND ON RADIATION TESTING IN SHOCK TUBES
2.1 Types of Shock Tube Operation
Figure 1 shows a drawing of a shock tube set up for non-reflected shock wave testing. Above the drawing of
the shock tube proper is its x-t wave diagram. The shock tube consists of a driver, filled with a high pressure
gas and a driven tube, filled with the low pressure test gas. The two regions are initially separated by the main
diaphragm. At the downstream end of the driven tube, one frequently places a secondary diaphragm, which
separates the driven tube from an additional length of tube leading to a large dump tank. The main diaphragm
can be ruptured in many ways. For an electric arc shock tube, the main diaphragm is ruptured by the increase
in driver gas pressure caused by the electric discharge (arc) struck inside the driver. The wave action after
diaphragm is shown in the distance-time (x-t) diagram shown in the upper part of Fig. 1. Upon rupture of the
main diaphragm, a shock wave (S) propagates down the driven tube, while a expansion fan (E) propagates
upstream into the driver gas. Parts of both the driver and driven (regions 2 and 3) gas are set in motion down
the tube. The regions of the driver and driven gases which have not yet been set in motion by the wave action
are denoted 1 and 4, respectively. The driver and driven gases are separated by the interface I. A substantial
amount of mixing occurs at the interface and hence, in reality, the “interface” is not a simple line, as shown in
Fig. 1, but rather a fairly extensive region of mixed driver and driven gases that moves down the tube between
regions of pure driver and driven gas. The test section is denoted by TS and shows up as a vertical dashed
“world line” in the x-t diagram (since it does not move). The radiation testing would be performed along the
TS world line above the shock wave S in the x-t diagram.
Figure 2 shows a drawing and x-t wave diagram of a shock tube set up for reflected shock wave testing. The
driven tube is blanked off at the downstream end. In the x-t diagram, the incident shock wave S can be seen to
be reflected from the end wall to produce the reflected shock wave RS. A doubly compressed region 5 exists
above the reflected shock wave. The advantage of this shock tube configuration is that, with the same driver
and driven tube conditions, much higher pressures and temperatures can be produced in region 5 when
compared to those in region 2. For radiation testing at planetary entry conditions, there are two disadvantages
of reflected shock tunnel operation. First, the two shock waves which produce the doubly shocked condition
do not represent the flow situation in front of the entry vehicle, which has only a single shock wave. Second,
there are very complex boundary layer interactions and thick boundary layers in the reflected shock region of
the shock tube. This makes interpretation of radiation data from these regions difficult, since the radiation
measured will be a sum of the radiation from the core region and from the thick boundary layers. In the non-
reflected shock tube mode of operation, the boundary layers, while always present, are much thinner. Hence,
for radiation testing at planetary entry conditions, operation of the shock tube in the non-reflected mode is
preferred.

Shock Tube Experiments for Earth and Mars Entry Conditions
RTO-EN-AVT-162 13 - 3
Figure 1: Non-reflected shock tube set-up and x-t wave diagram
Figure 2: Reflected shock tube set-up and x-t wave diagram

Shock Tube Experiments for Earth and Mars Entry Conditions
13 - 4 RTO-EN-AVT-162
2.2 Measurements
Many of the points outlined here will be discussed in more detail in Sec. 4. The shock velocity is determined
by locating a number of shock wave detectors along the driven tube and measuring the times of arrival of the
shock wave. The detectors can be piezo-electric pressure transducers, photomultiplier tubes (PMTs), laser
deflection detectors, ionization gauges, etc.
The time history of the radiation behind the shock front can be measured by broad band PMTs, PMTs with
interference filters placed in front of them, or by monochromators. A PMT is typically located at the
monochromator outlet slit. A typical wavelength bandwidth for a monochromator is ~1.0 nm full width at half
maximum amplitude.
Spectrometers can also be used to take snapshot pictures of spectra from the shock heated gas. In one mode of
operation, the spectrometer inlet slit is illuminated by unfocussed light from a window in the facility. A
typical window diameter is ~1.3 cm. Either a one or two dimensional camera array is placed at the
spectrometer outlet to record the spectrum. At a certain time after shock passage, the camera gate (shutter) is
opened for a specified exposure time. A single spectrum is obtained in this way.
Spectrometers can also be operated in the imaging mode. In this mode, a image of a slot window in the shock
tube (typically ~12 cm long) is made on the inlet slit of the spectrometer, using imaging optics. (The imaging
element is usually a mirror, to avoid chromatic aberration problems.) A two-dimensional camera array is
located at the spectrometer exit. Then one obtains a two-dimensional image with the camera which has
wavelength in one direction and distance along the window in the other direction. In this mode of operation,
the time of exposure is usually chosen to place the shock wave about 70% of the way across the image. In this
way, one obtains, in effect, hundreds of spectra at various distances behind (and in front of) the shock wave.
For the monochromators, a typical data sampling rate is 50 MHz, and the PMTs and the amplifiers are capable
of these speeds. However, the time resolution of the data is also limited by typical window sizes (~1.3 cm) or
inlet slit sizes (0.3 mm). These correspond the time resolutions of 1.3 and 0.03 microsec for a shock velocity
of 10 km/sec. The exposures for the spectrometers are always a compromise between smearing or loss of time
resolution of the images and gathering sufficient photons to have an acceptable signal-to-noise ratio. For the
VUV, UV and visible up to about 500 nm, exposures of 0.25 to 0.50 microsec can typically be used. From 500
to 900 nm, exposures as short as 0.015 microsec up to as long as 0.50 microsec can typically be used,
depending on the wavelength range and the brightness of the emitting gas. For IR cameras, typically
exposures of ~1.0 microsec are needed. These translate to image smearing ranging from 0.015 cm to 1.0 cm
for a shock velocity of 10 km/sec.
To obtain absolute intensities, the monochromators and spectrometers must be calibrated. This can be done
using calibrated tungsten ribbon lamps, calibrated integrating spheres and calibrated deuterium lamps (the
latter for the UV wavelength range).

Shock Tube Experiments for Earth and Mars Entry Conditions
RTO-EN-AVT-162 13 - 5
3.0 THE EAST FACILITY
The Electric Arc Shock Tube Facility (EAST) at Ames Research Center is used to investigate the effects of
radiation and ionization associated with shock waves encountered during entry into planetary atmospheres.
To observe and measure these effects, hypersonic shock waves are generated in an atmosphere of interest
inside an aluminum or stainless steel tube embedded with pressure and optical sensor instrumentation. The
data collected by these instruments are then used to develop mathematical models for thermochemical
processes. These models are then incorporated into simulations of planetary entry flights.
A good overall description of the facility as of 1990 is given in Ref. 1. Details of the operation of the driver
and driven tubes, also as of 1990, are given in Refs. 2 and 3.
The EAST facility at Ames consists of three primary components:
• Electric Arc Shock Tube
• Power System
• Instrumentation
3.1 Electric Arc Shock Tube
The Electric Arc Shock Tube assembly consists of three primary components:
• Driver
• Driven Tube
• Dump Tube & Dump Tank
Figure 3 shows the relative locations of these three components.
Figure 3: Electric arc shock tube

Shock Tube Experiments for Earth and Mars Entry Conditions
13 - 6 RTO-EN-AVT-162
3.1.1 Driver
The driver is the section of the Electric Arc Shock Tube where a gas (driver gas) is heated by an electric arc
within a confined space to create sufficient pressure to burst the diaphragm that separates the driver from the
driven tube.
The shock wave that results from this process travels at speeds up to 46 km/s (depending on the driver
operating conditions and the driven gas) down the length of the driven tube where its effects on the gas of
interest (driven gas) are observed and recorded.
Since the beginning of EAST operations in 1965, the driver section has consisted of a variety of components
assembled in a number of different configurations. However, as of the end of Test 46 in 2007, the EAST
driver at Ames was a strong steel vessel containing an insulating Teflon liner enclosing a short, cylinder-cone-
cylinder chamber, approximately 26 cm long, into which driver gas was injected. Figure 4 shows the interior
set-up of this driver.
Figure 4: Driver of EAST facility

Shock Tube Experiments for Earth and Mars Entry Conditions
RTO-EN-AVT-162 13 - 7
An aluminum diaphragm was installed at the large end of the conical chamber, encircled by a ring ground
electrode. A center high voltage electrode, installed at the narrow end of the conical cylinder, was connected
to the test facility power system (See Section 3.2). A tungsten trigger wire, attached to the electrode ring, was
also attached to a Nextel™ cord, composed of alumina-silica fiber with Teflon™ and Rayon sizing. This cord
was drawn through a port in the nose of the center electrode by means of a pneumatic cylinder to bring the
trigger wire close enough to initiate an arc. In addition to housing the pull cord, the port in the center electrode
was used as a gas outlet for evacuating the driver chamber and an inlet for introducing driver gas.
3.1.1.1 Driver Specifications – Test Entries 43 - 46
For Test Entries 43 through 46, conducted from 2003 through 2007, the Ames EAST driver parameters were
as follows:
• Driver chamber: 26.4 cm long
• Diaphragms: Al foil – 0.030 & 0.043 cm thick; Mylar – 0.013, 0.030, 0.036 & 0.054 cm thick
• Trigger wire: Tungsten, 17-4 PH Stainless Steel
• Driver Gases: He/Ar, H2, He
• Driver Gas Pressures: 2.7, 6.8, 8.8, 10.5, 13.3 atm
3.1.2 Driven Tube
The driven tube section of the Electric Arc Shock Tube is where the effects of a shock wave on a gas of
interest can be observed and recorded.
The driven tube currently installed in the AMES EAST facility consists of an aluminum tube, 10.16 cm in
diameter and 9 meters in length. The driver or main diaphragm is located at one end of the tube and the
downstream diaphragm is at the other end.
As shown in Fig. 3, two pumping ports are located at either end of the driven tube. Pumping port # 1, also
known as the upstream port, is located near the main diaphragm. Pumping port #2, also known as the
downstream port, is located after the test section near the downstream diaphragm.
Ports allowing sensor access for test instruments are placed at specific locations along the length of the driven
tube. These locations are designated by a letter, with the location closest to the main diaphragm given the
letter A. If two ports share a location, they are placed 180 degrees apart in the tube wall in east and west-
facing directions and labeled as such (i.e., A East, A West) or given the numbers 1 and 2 (i.e., A1, A2). If four
ports share a location, they are placed 90 degrees apart in the east, west, top and bottom-facing directions and,
again given either the names A East, A West, A Top, A Bottom or A1, A2, A3, A4, respectively.
The portions of the driven tube containing many ports for optical and other diagnostics are called test sections.
The configuration and instrumentation of driven tube test sections vary with the requirements of the test being
undertaken.

Shock Tube Experiments for Earth and Mars Entry Conditions
13 - 8 RTO-EN-AVT-162
In the last run Test Entry 46 conducted in 2007, driven tube port locations A, B, C, D, and E each contained
two instrument ports. As shown in the diagram below, locations G and H in the secondary test section of the
driven tube each contained four instrument ports. In the primary test section, location I contained 3 instrument
ports – on the bottom and on the east and west sides of the test section. Locations J, L, N, and O contained
only one port each – all of which were placed at the bottom of the tube. Location K also contained one port,
positioned at the top of the tube. Finally, location M in this test section contained two ports placed in the east
and west-facing directions.
Figure 5: Sketch of test sections for test entry 46 showing locations of diagnostic ports

Shock Tube Experiments for Earth and Mars Entry Conditions
RTO-EN-AVT-162 13 - 9
For a test run, air is evacuated from the driven tube through either or both of the pumping ports and replaced
with the gas of interest, also known as the driven gas, at a specified pressure. When the shock wave from the
driver enters the driven tube, it travels down the length of the tube and bursts the downstream diaphragm,
allowing the driven gas to move from the driven tube into the dump tube system.
3.1.2.1 Driven Tube Specifications – Test Entries 43 - 46
For Test Entries 43 through 46, the EAST driven tube gasses, gas pressures and shock velocities were as
follows:
• Driven Gases: N2, CH4/N2, CH4/N2/Ar, Air, H2, H2/He, CO2/N2
• Driven Gas Pressures: 0.1, 0.2, 0.283, 0.3, 0.7, 1 Torr
• Shock Velocities: 5.08 to 34.69 km/s
3.1.3 Dump Tube and Dump Tank
The dump tube section of the Electric Arc Shock Tube at Ames consists of an aluminum tube 7 m in length,
10.16 cm in diameter, attached to the driven tube at the downstream diaphragm and running into a steel
holding tank. Gas pressure in the dump tube/tank system is controlled by a 300 CFM Stokes rotating piston
vacuum pump attached to the back of the tank as shown in Fig. 6.
Figure 6: Photograph of dump tank and vacuum pump
Shock Tube Experiments for Earth and Mars Entry Conditions
13 - 10 RTO-EN-AVT-162
When the shock travels down the driven tube and bursts the downstream diaphragm, pressure differentials
between the driven tube and the dump tube/tank system allows the driven gas to move into the dump tube and
be held in the dump tank. Approximately 3 hours after a test run is completed, the dump tank is vented to the
atmosphere.
3.2 Power System
The power system at the Ames EAST facility consists of three main components:
• 40 kV constant current DC power supply
• 1.2 MJ 20/40kV DC fused capacitor storage system
• 40 kV-rated Collector/Driver Electrode assembly
RG-17 coaxial cabling connects the capacitor bank to the collector/driver electrode assembly, and the entire
system is regulated by a control system that includes discharge and shorting equipment, relays, control and
permissive systems.
For a test run, the capacitor bank voltage is set to the level specified for the test and delivered to the collector
ring to be available when an arc is initiated between the trigger wire and the high-voltage electrode.
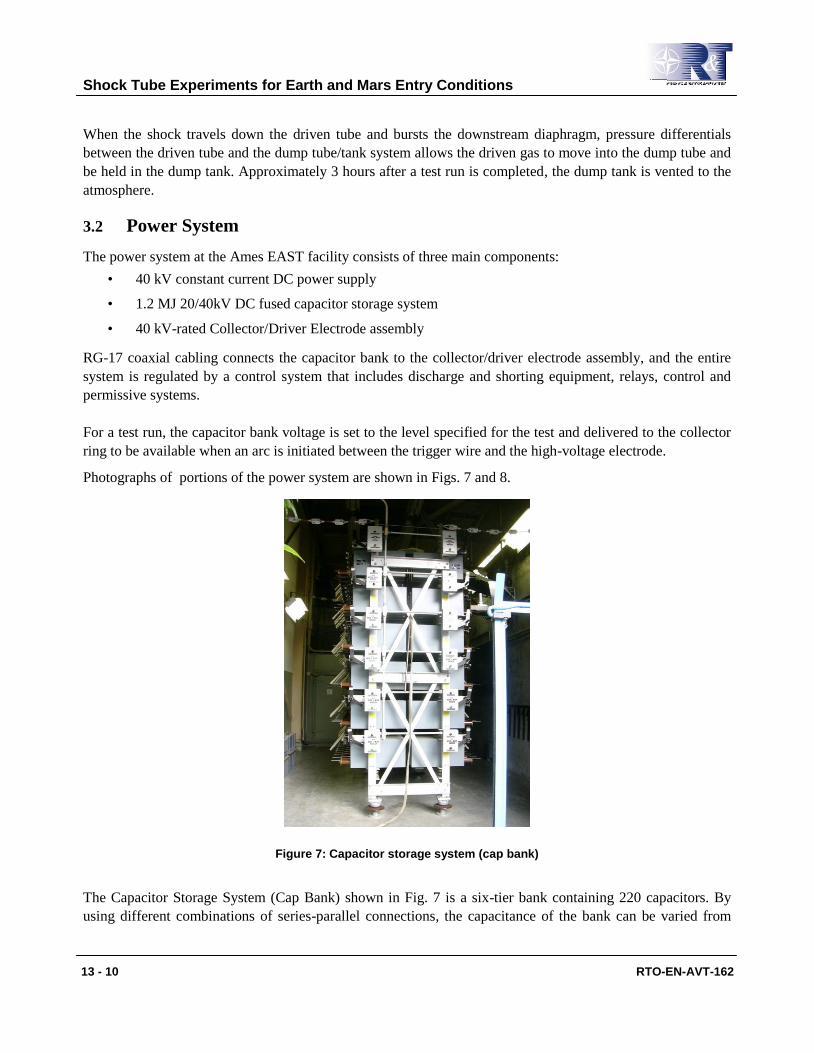
Photographs of portions of the power system are shown in Figs. 7 and 8.
Figure 7: Capacitor storage system (cap bank)
The Capacitor Storage System (Cap Bank) shown in Fig. 7 is a six-tier bank containing 220 capacitors. By
using different combinations of series-parallel connections, the capacitance of the bank can be varied from

Shock Tube Experiments for Earth and Mars Entry Conditions
RTO-EN-AVT-162 13 - 11
149 F to its maximum value of 6126 F (1530 F for 40 kV operation). Nominal total system inductance,
exclusive of the load (arc) is 0.26 H, and the resistance is 1.6 m
Figure 8: Collector ring/driver electrode assembly
The Collector Ring/Driver Electrode Assembly, shown above, consists of two coaxial copper cylinders. The
outer cylinder is flanged to the driver and is electrically grounded. The inner cylinder is connected to the main
electrode by a copper spring contact plate. The high-voltage electrode located inside the driver chamber (See
Section 3.1.1) has a hollow core through which a cord extends back to the piston of a pneumatic solenoid (air
cylinder). The piston draws the cord, which is attached to the trigger wire, through the electrode until an arc is
initiated and the test run is made.
Shock Tube Experiments for Earth and Mars Entry Conditions
13 - 12 RTO-EN-AVT-162
3.2.1 Power System Parameters – Test Entries 43 – 46
For Test Entries 43 through 46, the power system parameters were as follows:
• Cap bank capacitance: 861.3 & 1530 F
• Cap bank voltage: 7.9 to 29 kV
3.3 Range of Operating Gas Mixtures, Shock Velocities and Operating Modes
The EAST facility has been operated with H2, He, Ar and He/Ar mixtures as driver gases. Driven gases have
included Air, N2, O2, Ar, and CO2/N2, CH4/N2, N2O/N2, H2/He, H2/Ne and H2/Ar mixtures. Shock velocities
have ranged from 2 to 46 km/sec. The facility has been operated in the non-reflecting and reflecting shock
tube modes (see Sec. 2.1) and also in the shock tunnel mode. In the shock tunnel mode the shock tube is
operated in the reflected shock tube mode seen in Fig. 2 of Sec. 2.1. A hypersonic nozzle is attached to the
downstream end of the shock tube and the doubly shocked gas in region 5 is used as the reservoir for the
nozzle. The flow at the exit of the nozzle goes into a test box where tests are made at hypersonic Mach
numbers.
4.0 INSTRUMENTATION
The purpose of instrumentation in the Ames EAST facility is to provide experimental data that can be used to
determine radiative heating under planetary entry conditions. The data can be used to directly assess the
heating to be expected and to calibrate and improve mathematical models of the heating .
Toward this end, instruments in EAST provide the data listed below:
• Shock velocity
• Shock pressure and arrival time, including arrival of extra shocks or expansion waves
• Arrival of driver gas contamination
• Snap shots of spatially resolved spectra along the driven tube (hundreds of spectra in one picture)
• Snap shots of non-spatially resolved spectra along the driven tube (single spectrum)
• Time histories of radiation at specific wavelengths
• Cap bank current
• Cap bank charging voltage
• Timing data for spectrograph camera exposures
As of the last run of Test Entry 46 in 2007, these data were gathered by the following instruments in the Ames
EAST facility.

Shock Tube Experiments for Earth and Mars Entry Conditions
RTO-EN-AVT-162 13 - 13
4.1 Pressure Transducers
Two types of pressure transducers (also known as piezoelectric pressure gauges) are used in the Ames EAST
facility to provide data on shock velocity and shock pressure arrival:
• PCB Piezotronics Model #113A21 – resonant frequency > 500 kHz; follows actual pressure
variations
• PCB Piezotronics Model #132A35 – resonant frequency > 1000 kHz; gives substantially more
accurate shock passage time definitions than 113A21, but does not faithfully follow actual pressure
variations
PCB 113A21 transducers were located in the driven tube at A, B, D, and E and PCB 132A35 transducers were
located at stations G, H, I, J, L, N and O.
4.2 Photomultiplier Tubes
The following photomultiplier tubes are employed in the Ames EAST facility to provide data on shock arrival,
arrival of driver gas contamination, spatially resolved spectra along the driven tube, and time histories of
radiation at specific wavelengths:
• 1P21 – spectral response 300 – 650 nm
• 1P28 – spectral response 185 – 650 nm
• Hamamatsu R7154 – spectral response – 160 – 320 nm
• Hamamatsu R456 - spectral response – 160 – 870 nm
• EMI G26E315, CsI photocathode, MgF2 window, spectral response 110 – 220 nm
• EMI G26H314LF, CsTe photocathode, MgF2 window, spectral response 110 – 360 nm
• Electron tubes 9422B, CsTe photocathode, MgF2 window, spectral response 110 – 360 nm
A 1P21 PMT was located at station E, 1P28 PMTs were located at stations B, G, and K, and a R7154 PMT
was located at station A along the driven tube for stand-alone data gathering. The 1P28 and Hamamatsu R456
PMTs were used in combination with the Bausch and Lomb monochromators, while the Electron Tubes
9422B PMT was used with the McPherson model 218 monochromator for VUV investigations. Two slits with
widths 0.05 – 0.40 mm, ~15 cm apart and oriented parallel to the shock front, are located inside a tube in front
of each stand-alone PMT. These slits enable the shock passage time to be reasonably sharply defined. Sample
rates for the PMTs used alone were 5 MHz and for the PMTs used in the monochromators were 50 MHz.

Shock Tube Experiments for Earth and Mars Entry Conditions
13 - 14 RTO-EN-AVT-162
4.3 Spectrographs and Monochromators – Imaging Set-Ups
McPherson Model 218 Scanning Monochromators
Ames EAST currently has five McPherson Model 218 scanning monochromators which can be used either as
monochromators or spectrographs. To use these instruments as spectrographs, the outlet slit is removed and a
digital camera is located at the instrument outlet.
Two of these units can be evacuated for use in VUV as well as UV, visible and near IR spectral ranges.
Available gratings are from 150 to 3600 grooves/mm, and the grating blaze wavelengths range from 150 to
4000 nm.
When used as an imaging spectrograph, the McPherson 218 creates images of the 11.7 cm long facility slot
windows imaged on the inlet slits of the spectrographs with demagnification ratios on the order of 10. With
this set-up, optical trains of two or three mirrors are used to image the slots, and the final concave mirror has a
10.2 cm focal length. The two-dimensional image obtained on the ICCD camera array has wavelength in one
direction and distance along the driven tube slot windows in the other direction. In other words, hundreds of
different spectra are obtained as a function of distance behind (and in front of) the shock wave.
Bausch and Lomb Monochromators
There are at least six B & L monochromators available for use at Ames EAST. These units cannot be
evacuated and are thus not usable for VUV spectral investigation. Gratings with these instruments have 600
grooves/mm, and the grating blaze wavelengths are either 300 or 750 nm.
Two of the B & L units have images of the 1.3 cm diameter facility windows imaged on the inlet slits of the
monochromator. Optical trains of two mirrors are used to image the facility windows. Although there is no
spatial resolution with the imaging on a monochromator inlet slit, the imaging does make the time resolution
of the passing shock wave on the monochromator signal output very sharp.
See Section 4.7 for a diagram of the two optical table set-ups used in Test Entry 46.
4.4 Spectrographs and Monochromators – Non-Imaging Set-Ups
When the two McPherson model 218 instruments that can be used in the VUV are set up for this purpose, no
imaging of the facility aperture on the inlet slit of the instrument takes place. The light simply passes through
a precision aperture and falls on the inlet slit of the instrument. In this case, the two instruments are used
simply as monochromators.

Shock Tube Experiments for Earth and Mars Entry Conditions
RTO-EN-AVT-162 13 - 15
For some runs, however, the exit slit of one of the instruments was removed and an ICCD camera placed at
the exit to obtain a snapshot spectra which was not spatially resolved.
4.5 ICCD Arrays/Cameras
There are four primary cameras and imaging arrays currently available for use at Ames EAST:
Princeton Instruments – PI-MAX Model 512HQ : Imaging array 512 x 512 pixels with a spectral range of 460
to 900 nm
Princeton Instruments – PI-MAX Model 1024UV: Imaging array 1024 x 256 pixels with a spectral range of
120 – 860 nm
Princeton Instruments – PI-MAX Model 1K; Imaging array 1024 x 1024 pixels with a spectral range of 120 –
860 nm
FLIR Systems ThermaCAM – Phoenix-Near Model, VisGas response option; Imaging array 256 x 320 pixels
with a spectral range of 470 – 1700 nm
Section 4.7 shows how the above-listed cameras and imaging arrays were used in Test Entry 46.
The spectrograph cameras are triggered using PMTs located at stations G and K in the driven tube. Station G
is where the VUV spectrograph views the flow and station K is 7.65 cm upstream of the center of the window
where the blue, red and IR spectrographs view the flow. When the rising light intensity at the PMT produces
an output passing the set threshold on the DG-535 timing unit, the unit triggers. A second, delayed output
from the DG-535 unit is used to trigger the camera. Two DG-535 units are used, one for the PMT located at
station G and the second one for the PMT located at station K. For the blue, red and IR spectrographs, the
time delay is chosen to locate the shock wave about 75% downstream of the upstream end of the window at
station K. For the VUV spectrograph, the delay is chosen to take the snapshot 1 to 2 microseconds after shock
passage. The exposure times for the blue spectrograph were 0.25 – 0.50 microsec, for the red spectrograph
0.015 – 0.50 microsec, for the IR spectrograph 1.0 microsec and for the VUV spectrograph 0.5 microsec. For
the imaging set-ups, the image smears range from 0.015 cm for a 0.015 microsec exposure to 1.0 cm for a 1.0
microsec exposure at a shock velocity of 10 km/sec.
4.6 Windows
Materials for the windows at various locations along the driven tube were as follows (the approximate cut-off
wavelengths are given for each material):

Shock Tube Experiments for Earth and Mars Entry Conditions
13 - 16 RTO-EN-AVT-162
• Acrylic, UV grade - 280 nm
• Quartz – 160 nm
• Fused silica, UV grade – 160 nm
• Sapphire – 142 nm
• MgF2 – 115 nm
• LiF– 105 nm
The acrylic is extremely inexpensive and has been used extensively for the red and IR spectrographs. It is
known to outgas water more than the other window materials, but it is not known if this is a major contributor
to water in the test gas, as compared to outgassing from the O-ring seals. It may be actually very satisfactory.
Quartz and UV grade fused silica have been used for the blue spectrograph operating down to the air
absorption limit of ~190 nm. They are much more expensive than the acrylic and are also very robust to the
shock tube environment (heat pulse and debris going down the driven tube). Sapphire has been used for VUV
measurements down to 142 nm in the VUV. Small sapphire windows (2 cm diameter) can be obtained from
Edmund Industrial Optics very inexpensively and are also very robust. To go the extreme wavelengths in the
VUV, one must use the crystal windows – MgF2 and LiF. These windows are fairly expensive and are not
robust in the shock tube environment. Cracks appear in these windows rapidly and they are usually retired
after 2 or 3 test runs. We have found the transmission of LiF to be much better than that of MgF2 at the most
extreme VUV wavelengths. Thus, for these wavelengths, LiF is the material of choice.
4.7 Optical Set-Up Details
There are two optical tables set up to capture data in the Ames EAST Facility – one on the east side of the
driven tube and one on the west side. Figures 9 and 10 show how each table was configured with
instrumentation during Test Entry 46 in 2007.
Shock Tube Experiments for Earth and Mars Entry Conditions
RTO-EN-AVT-162 13 - 17
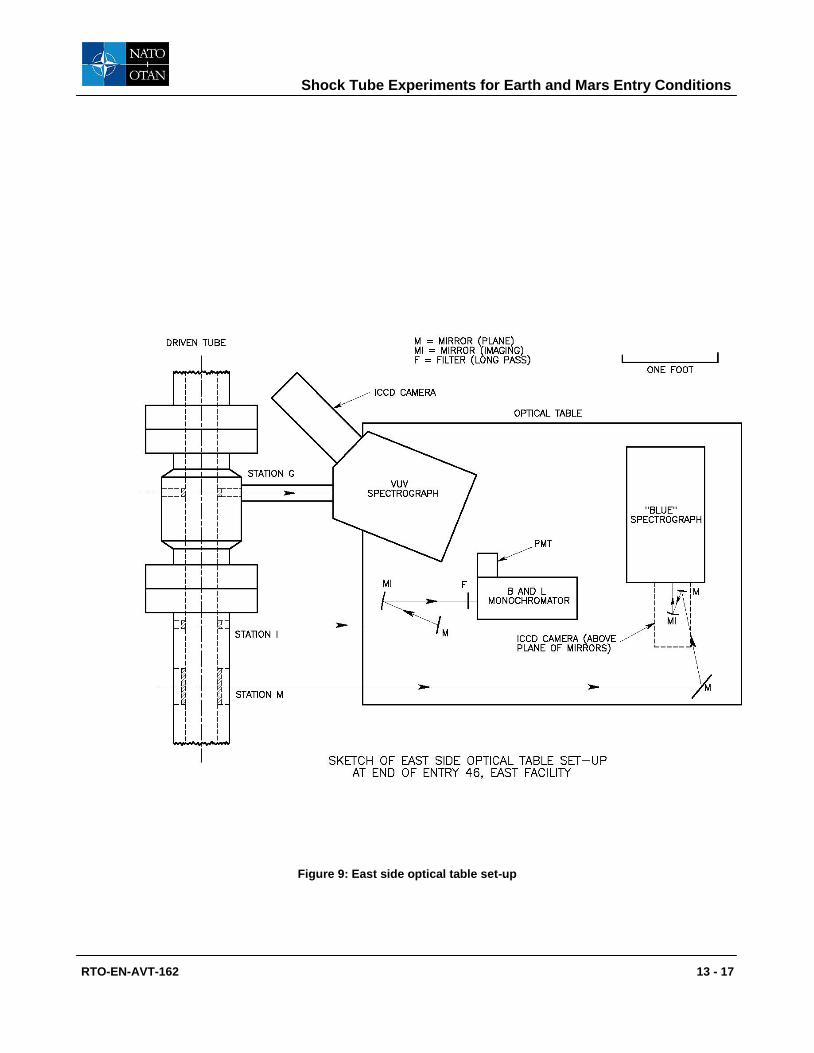
Figure 9: East side optical table set-up

Shock Tube Experiments for Earth and Mars Entry Conditions
13 - 18 RTO-EN-AVT-162
Figure 10: West side optical table set-up

Shock Tube Experiments for Earth and Mars Entry Conditions
RTO-EN-AVT-162 13 - 19
Note that the vacuum ultraviolet (VUV) instruments, both spectrographs and monochromators, are directly
connected to the driven tube with stainless steel tubes and evacuated with vacuum pumps using stainless steel
flexible bellows hoses [not shown in diagram]. The PI-MAX Models 1024UV and 1K cameras was used for
the “blue” and VUV spectrographs, respectively in the east side optical table set-up. Either the PI-MAX
Model 512HQ or the FLIR Systems ThermaCAM were used for the “red” spectrograph in the west side
optical table set-up.
5.0 OPERATING PROCEDURES
The Ames Electric Arc Shock Tube is a complex test facility that requires a significant amount preparation
and maintenance to operate. A complex series of calibrations, checks and data acquistion operations must be
performed during a test entry. In this section, we treat only those items that are most pertinent to the present
report. This will include:
• Calibrations of spectrally resolving intruments
• Data capture process
5.1 Calibration of Spectrally Resolving Instruments
The images obtained directly from the cameras are in the form of “counts” (up to maxima of ~16,000 or
~65,000) for each pixel. To convert the pixel “count” images into the absolute intensity information required
for results analysis, the cameras are calibrated before the start of the Test Entry and at intervals of 20 to 40
runs during the Test Entry. Typically, the maximum differences between two successive calibrations is 3 –
8%. Thus, the sensitivity of the cameras for the runs between the calibrations is known to within that
percentage range.
5.1.1 Calibration of Spectrographs
The following steps were taken to calibrate the spectrographs before and after runs in Test Entry 46.
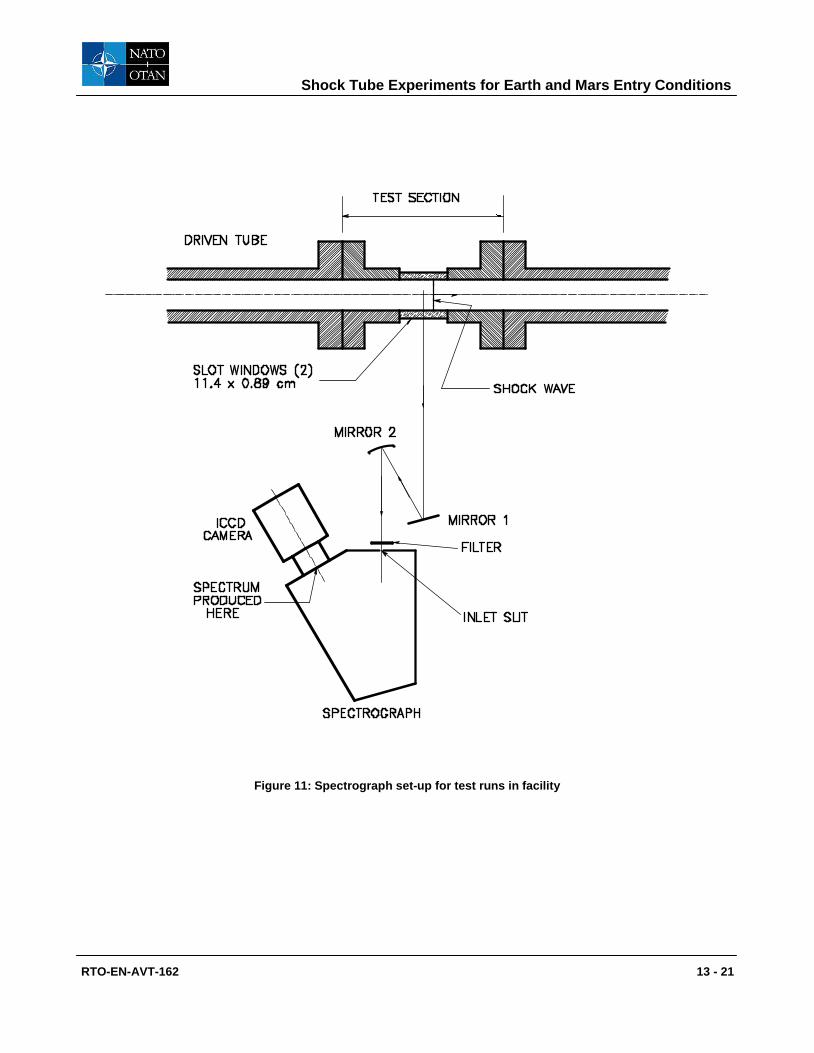
1) The test section in the driven tube, shown in Figure 11, was removed.
2) A calibrated tungsten ribbon lamp or a deuterium lamp was set up on the opposite side of the
driven tube from the spectrograph.
3) Using a concave mirror, a magnified image of the lamp filament or arc was created on the center
line of the test section, as shown in Figure 12. Magnification ratios of 3.5 to 5 were used in this Test Entry.
4) Images taken at five to nine different lamp positions along the shock tube centerline were made for
all spectrograph configurations used in the run.

Shock Tube Experiments for Earth and Mars Entry Conditions
13 - 20 RTO-EN-AVT-162
5) Pixel count information for calibration images were then converted into absolute radiation intensity data
using Drawpix, a NASA Ames computer analysis program. Drawpix accounted for dark noise and used lamp
calibration data to provide finished results in terms of absolute radiation intensity (W/cm3/micron/sr).
The pixel number scales of the camera must also be calibrated. The wavelength scale was calibrated using
lines from spectral lamps. The space direction scale (along the shock tube) was calibrated by imaging a
precision grid placed at the shock tube centerline on the inlet slit of the spectrograph.
Shock Tube Experiments for Earth and Mars Entry Conditions
RTO-EN-AVT-162 13 - 21
Figure 11: Spectrograph set-up for test runs in facility

Shock Tube Experiments for Earth and Mars Entry Conditions
13 - 22 RTO-EN-AVT-162
Figure 12: Spectrograph set-up for lamp calibration
5.1.2 Calibration of VUV Monochromators
The following steps were taken to calibrate the VUV monochromators before and after runs in Test Entry 46.
1) The VUV monochromator with attached PMT was removed from the driven tube and taken to a
calibration set-up area where it was connected to the outlet side of a vacuum box containing a chopper wheel.
The PMT output was connected to a Tektronix oscilloscope.
2) A mercury lamp was placed at the inlet side of the vacuum box. For this step, no vacuum was used.

Shock Tube Experiments for Earth and Mars Entry Conditions
RTO-EN-AVT-162 13 - 23
The mercury lamp was used to wavelength calibrate the monochromator.
3) Next, a special deuterium lamp that was calibrated for absolute radiance and irradiance was
attached to the entrance of the vacuum box. (This lamp has a MgF2 window.) The chopper wheel created an
AC signal from the DC deuterium lamp output. The system was then evacuated.
4) The calibration was then performed using the deuterium lamp as the source.
5) Amplitude readings for various wavelengths with the deuterium lamp source were then taken using
the oscilloscope. Each reading was taken from an average of 256 pulses integrated by the oscilloscope.
5.1.3 Notes on Calibrations for Test Entry 46
In order to calibrate the cameras, the test section needs to be removed and the facility shut down during the
process. To minimize this type of downtime, camera calibration in Test Entry 46 was performed before the
beginning of the Test Entry, between runs 13 and 14, between runs 47 and 48, and at the conclusion of the
Test Entry (after 81 test runs).
In contrast, the VUV instruments are operated without imaging or transfer optics and with a direct path from
the port in the side of the driven tube to the inlet slit of the instrument. Because of this very simple optical set-
up, accurate calibrations can be made after every run, if necessary. Early on in the Test Entry, therefore, VUV
monochromator calibrations were made every 5 to 7 runs.
Also, the VUV PMTs, deuterium lamp and ICCD camera were initially cleaned only every 5 to 7 runs. It was
then found that the sensitivity of the ICCD camera was changing between runs, due to air leakage into the
camera. Because of the possible air leakage problem and concerns over build-up of vacuum pump oil on
various optical surfaces, after about run 52, it was decided to calibrate the VUV instruments after every run.
Also, after this point in time, the optics of the VUV instruments were cleaned after every run.
5.2 Data Capture Process
Data is captured during runs of a Test Entry in the Ames EAST facility in two ways:
• The Data Acquisition System (DAS)
• The camera / computer system
The Data Acquisition System consists of the following components:
• Data Recording Devices, e.g., pressure transducers, spectrographs, etc.
• Data Channels
• Digitizers
• Computer Hardware / Software

Shock Tube Experiments for Earth and Mars Entry Conditions
13 - 24 RTO-EN-AVT-162
During a run of a Test Entry, instrumentation along the driven tube and in the test sections senses and records
time histories of light intensities and pressures. Camera timing data and driver current and charging voltage
data are also recorded. This information is stored in the memory buffers of the digitizers and then transferred
to a computer hard drive using IGOR and IMPAX graphics software to create raw experimental data files.
Images captured by cameras during a run of a Test Entry and stored directly on the hard drive(s) of a
dedicated computer system in the facility. These images are then accessed using Igor and WinSpec software to
create the required image-based data files.
These files are then used to generate the data products specified in the Test Plan.
For the last run of Test Entry 46 completed in December 2007, 26 data channels were employed to capture
information that was sent to the following four types of digitizers:
• LeCroy model 6810 digitizers – 5 MHz maximum digitizing rate
• ZTEC model ZT412VXI-21 digitizers – 200 MHz maximum digitizing rate
• DSP model 2008A digitizers – 20 MHz maximum digitizing rate
• DSP Traq I system, model 2824 digitizers – 1 MHz maximum digitizing rate
In addition, images from red/IR, blue and VUV cameras were captured in the facility’s dedicated computer
system.
6.0 TEST CONDITIONS
Tests for entry into the atmospheres of the Earth, Mars, Titan and Neptune were performed in test entries 43,
to 46 in the EAST facility. A total of 175 test runs were made between November, 2003 and December, 2007.
Shock velocities ranged from 6 km/sec for Titan entry conditions up to 34 km/sec for Neptune entry
conditions. Table 1 below gives the test gases, driven tube pressures and nominal shock velocities for the
various Earth and Mars test conditions discussed in depth herein. Gas compositions are given by mole
fractions.
Table 1: Test conditions
Planet Test gas Test gas pressure Nominal shock velocity
(Torr) (km/sec)
Earth Air 0.1, 0.2, 0.3, 0.7, 1.0 10
Mars 0.96CO2/0.04N2 0.1 8.5
7.0 RESULTS
The following sections present representative data from the data acquistion system (DAS), including data

Shock Tube Experiments for Earth and Mars Entry Conditions
RTO-EN-AVT-162 13 - 25
from the monochromators and from the various spectrometers.
7.1 Data from the Data Acquistion System
Representative plots from the DAS data files are presented below. The plots are from runs 53 and 77 of test
entry 46 in the EAST facility. For run 53, the driven tube gas was 0.7 Torr air, the shock velocity was 10.011
km/sec and the test time was 6.55 s. For run 77, the driven tube gas was 0.2 Torr air, the shock velocity was
9.845 km/sec and the test time was 6.66 s. Plots are presented of data from the following instruments:
• Pressure transducers (2 different models)
• Photomultiplier tubes
• Monochromators
• Trigger signal from the DG-535 timing unit (see Sec. 4.5)
• Camera gate monitor signal
• Driver current
• Capacitor bank charging voltage

Shock Tube Experiments for Earth and Mars Entry Conditions
13 - 26 RTO-EN-AVT-162
Figure 13: Plot of DAS data for PCB pressure transducer at station D, test entry 46, run 53.

Shock Tube Experiments for Earth and Mars Entry Conditions
RTO-EN-AVT-162 13 - 27
Figure 13 shows the plot of the DAS data for the PCB model 113A21 pressure transducer at station D (see
Sec. 3.1) for test entry 46, run 53. The time interval shown is 1.0 millisec and the voltage scale is -100 to +550
mV. The main shock wave arrives at 0.25 msec, followed by a second shock wave at 0.39 msec. Multiple
shock waves are very frequently observed in the upstream 60 – 70% of the driven tube. In 90% or more of the
test runs, by the time the shock wave reaches the test sections, the multiple shock waves either have
amalgamated into one shock wave or are spaced so far apart that there are no negative effects on the test data.
Before the first shock wave arrives, one may see EM pickup from the current oscillations in the driver. The
pressure jump across the main shock wave gives a DAS output of 530 mV, which, using the calibration factor,
converts to 129.5 kPa.
Figure 14: Plot of DAS data for PCB pressure transducer at station O, test entry 46, run 53.
Figure 14 shows the plot of the DAS data for the PCB model 132A35 pressure transducer at station O (see
Sec. 3.1.2) for test entry 46, run 53. The time interval shown is 1.0 msec. The same data is shown on an
expanded time scale (total interval of 50 sec) in Fig. 15. The oscillations seen at ~700 kHz are oscillations of
the quartz crystal of the transducer. Allowing for the overshoot of the ringing transducers, the shock “jump”
in Fig. 15 can be estimated at 2700 mV, corresponding to a pressure jump of 104.2 kPa, less than that at
station D. This is because the shock has slowed down from 11.13 km/sec between stations D and E to 9.97
km/sec between stations N and O. (See Secs. 3.1 and 3.1.2 for the locations of the diagnostic stations.)

Shock Tube Experiments for Earth and Mars Entry Conditions
13 - 28 RTO-EN-AVT-162
Figure 15: Plot of DAS data for PCB pressure transducer at station O, test entry 46, run 53. Time scale is expanded from that of Fig. 12.
Figures 16 and 17 below show the plots of the DAS data for the photomultiplier tubes at stations E and K for
test entry 46, run 53. The time intervals shown are 100 sec. The PMTs give increasing negative outputs as
the light intensity increases. The shock wave passed stations E and K at 350.5 and 484 sec, respectively. The
light seen in the traces before shock wave arrival is due to the shock wave illuminating the far wall of the
driven tube opposite the diagnostic port before it actually reaches the port. The PMT at station E is operated in
the linear region, whereas much more light is allowed to reach the PMT at station K, driving the PMT into
near saturation for the stronger light intensities. This was found to provide much more reliable triggering of
the ICCD cameras. The PMTs at stations G and K were used to trigger the ICCD cameras. In Fig. 17, the
trigger threshold of -1.5 V shown. The voltage from the PMT passed this threshold at 484 msec, triggering the
DG-535 timing unit (see Sec. 4.5) at this instant.

Shock Tube Experiments for Earth and Mars Entry Conditions
RTO-EN-AVT-162 13 - 29
Figure 16: Plot of DAS data for PMT at station E, test entry 46, run 53.
Figure 17: Plot of DAS data for PMT at station K, test entry 46, run 53.

Shock Tube Experiments for Earth and Mars Entry Conditions
13 - 30 RTO-EN-AVT-162
Figures 18 to 20 below show the plots of the DAS data for the monochromators at stations I and G for test
entry 46, run 53. The time intervals shown are 50 sec. Again, since the monochromators have PMTs at their
outlet slits, increasing light produces increasing negative voltages. Although not generally the case, for test
entry 46, run 53, all three monochromators were tuned to oxygen features. The east and west side open
monochromators at station I were tuned to the 777.4 and 394.7 nm O lines, respectively. The vacuum
ultraviolet (VUV) monochromator at station G was tuned to the 130.2 nm O line. From Figs. 18 and 19 (on
opposite sides of the driven tube at station I), the shock wave arrives at station I at ~470.6 sec. From Fig. 20
and from the data from the PMT facing the monochromator at station G (this plot is not shown here), the
shock wave arrives at station G at ~427.0 sec. The plots from all three monochromators, but especially that
at station G, west side, show light intensity increases before shock arrival. (This was discussed above with
regard to Figs. 16 and 17.) The test time, before arrival of driver gas contamination, for test entry 46, run 53,
was ~6.5 sec. The radiation at the 777.4 nm O line (Fig. 16) remains nearly constant during the test time.
The radiation at the 394.7 nm O line (Fig. 17) is nearly constant for the first 2.5 sec of the test time and
increases thereafter. The radiation at the 130.2 nm O line (Fig. 20) first increases to a maximum and then
decreases during the test time.
Figure 18: Plot of DAS data from monochromator at station I, east side, test entry 46, run 53.

Shock Tube Experiments for Earth and Mars Entry Conditions
RTO-EN-AVT-162 13 - 31
Figure 19: Plot of DAS data from monochromator at station I, west side, test entry 46, run 53.
Figure 20: Plot of DAS data from monochromator at station G, west side, test entry 46, run 53.

Shock Tube Experiments for Earth and Mars Entry Conditions
13 - 32 RTO-EN-AVT-162
Figure 21 below shows the plot of the DAS data from the output of the DG-535 timing for test entry 46, run
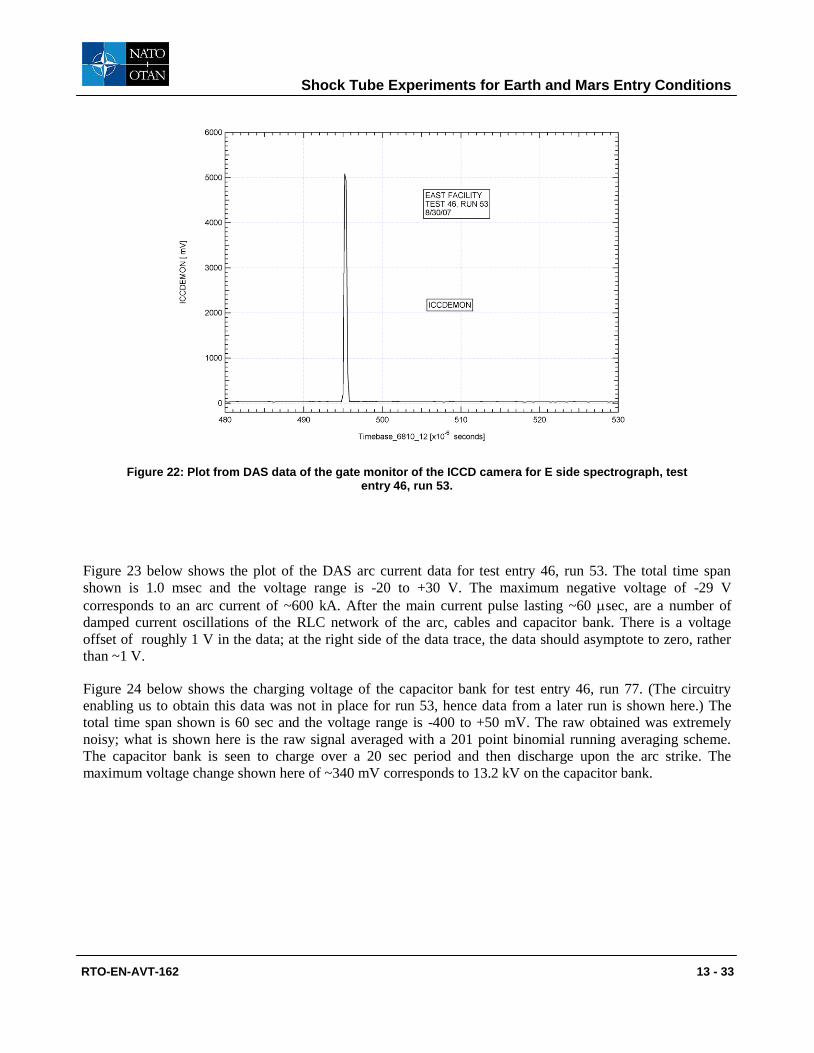
53. Figure 22 below shows the corresponding plot of the DAS data from the gate monitor of the ICCD camera
for E side spectrograph. For both plots, the total time interval shown in 50 sec. From Fig. 17, we see that the
voltage output of the PMT at station K, which inputs into the DG-535 timing unit, crossed the set threshold at
484 sec. This caused the DG-535 unit to trigger at that time. The timing unit was set for a delay of 11 sec
and produced the delayed output pulses shown in Fig. 21 at 495 and 524 sec. The first of these pulses caused
the camera gate to open at 495.2 sec, as shown by the ICCD gate monitor history of Fig. 22. Since the
camera gate can open only once, the second pulse seen in Fig. 21, caused by the second threshold crossing at
513 sec seen in Fig. 17, causes no problems. Similar timing unit output and camera gate monitor plots are
obtained for the VUV ICCD spectrograph camera at station G.
Figure 21: Plot of DAS data from output of DG-535 timing unit, test entry 46, run 53.
Shock Tube Experiments for Earth and Mars Entry Conditions
RTO-EN-AVT-162 13 - 33
Figure 22: Plot from DAS data of the gate monitor of the ICCD camera for E side spectrograph, test entry 46, run 53.
Figure 23 below shows the plot of the DAS arc current data for test entry 46, run 53. The total time span
shown is 1.0 msec and the voltage range is -20 to +30 V. The maximum negative voltage of -29 V
corresponds to an arc current of ~600 kA. After the main current pulse lasting ~60 sec, are a number of
damped current oscillations of the RLC network of the arc, cables and capacitor bank. There is a voltage
offset of roughly 1 V in the data; at the right side of the data trace, the data should asymptote to zero, rather
than ~1 V.
Figure 24 below shows the charging voltage of the capacitor bank for test entry 46, run 77. (The circuitry
enabling us to obtain this data was not in place for run 53, hence data from a later run is shown here.) The
total time span shown is 60 sec and the voltage range is -400 to +50 mV. The raw obtained was extremely
noisy; what is shown here is the raw signal averaged with a 201 point binomial running averaging scheme.
The capacitor bank is seen to charge over a 20 sec period and then discharge upon the arc strike. The
maximum voltage change shown here of ~340 mV corresponds to 13.2 kV on the capacitor bank.

Shock Tube Experiments for Earth and Mars Entry Conditions
13 - 34 RTO-EN-AVT-162
Figure 23: Plot of DAS arc current data, test entry 46, run 53.
Figure 24: Plot of DAS capacitor bank charging voltage data, test entry 46, run 77.

Shock Tube Experiments for Earth and Mars Entry Conditions
RTO-EN-AVT-162 13 - 35
7.2 Spectra from the Spectrometers
Representative spectra from the various spectrometers are presented in this section. Section 7.3 presents one
representative spectrum from each type of camera used and presents the method of determining the test time.
Section 7.4 and 7.5 present surveys of spectra over the complete wavelength ranges studied for earth and Mars
entry conditions, respectively. This data is qualitative only and is given in terms of “counts” from the camera,
rather than W/cm3/micron/sr. Limited quantitative data for Earth and Titan entry conditions and also for 6
km/sec shock waves in nitrogen was presented in Refs. 4 - 6. Quantitative data for the tests discussed herein
will be presented in later publications. Also, the corresponding dark pictures have not been subtracted from
the spectra shown herein. Hence, certain of the spectra to be shown here will show a non-zero “pedestal” level
which should be near zero and would be removed by the Drawpix data reduction program to produce the final
data.
7.3 Representative Spectra from the Four Types of Cameras Used
This section presents one representative spectrum from each type of camera used for the test condition of 0.2
Torr air in the driven tube and a nominal shock velocity of 10 km/sec (earth entry condition). Each of the four
two-dimensional images (wavelength versus distance along window – see Sec 4.3) is followed by a single one
dimensional spectrum (intensity vs wavelength) averaged over a number of camera pixels at a chosen location
behind the shock wave. This location is indicated in the two-dimensional images.
Figure 25 below shows the spectrum obtained from the east side spectrometer for EAST test entry 46, run 59.
This spectrum was taken with a Princeton Instruments PI-MAX Model 1024UV camera. This camera has a
256 x 1024 pixel ICCD array, but only about 660 pixels are useful in the wavelength direction because the
microchannel plate intensifier is considerably smaller than the array size in the 1024 pixel direction. The
spectral range shown is 386/184 nm. (The first number is the center wavelength and the second number is the
total wavelength span covered.) The shock velocity is 10.023 km/sec. The camera exposure time is 0.5 sec.
Because of the 0.5 sec open shutter time, there is smearing of the spectrum over ~0.5 cm in the y direction.
The shock wave is seen to be standing at ~1.8 cm and the beginning of the driver gas contamination is seen to
be at ~6.6 cm when the exposure was made. Many contamination lines are seen to appear. Many of the
strongest contamination lines are from tungsten (the trigger wire material) and aluminum (the main diaphragm
material). Using the distance between the shock location and the beginning of the contamination and the shock
velocity, we arrive at a test time (in pure driven gas) of ~4.8 sec.
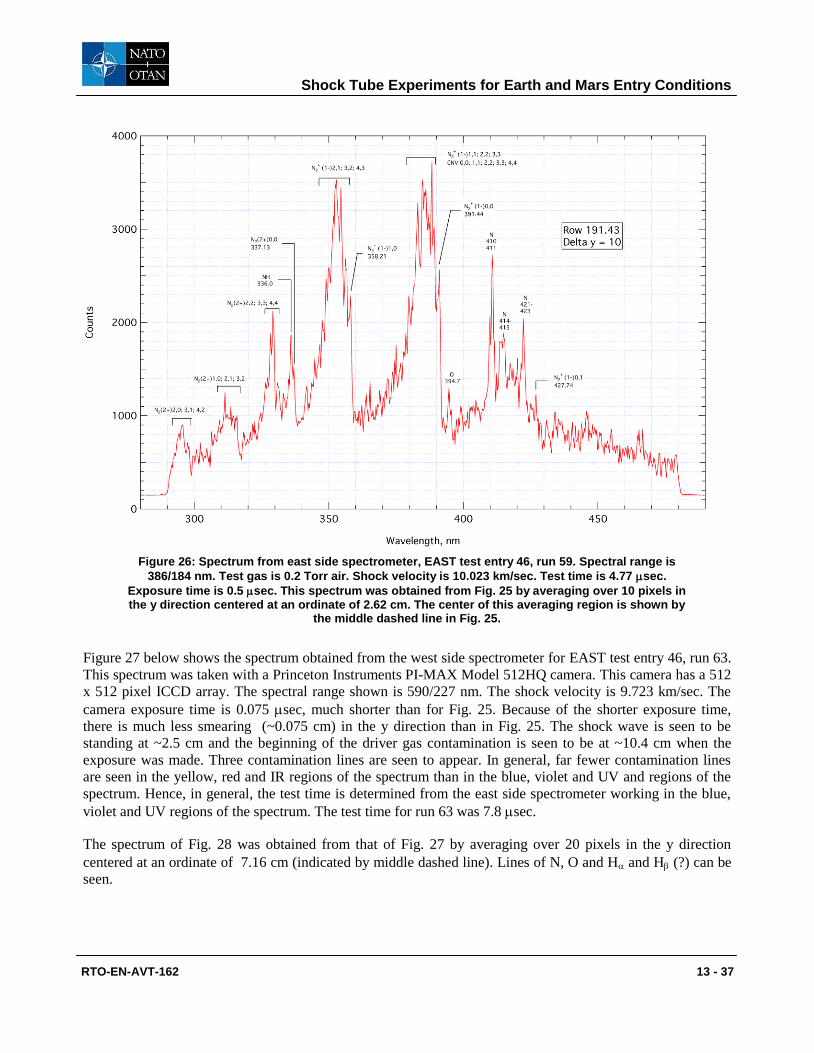
The spectrum of Fig. 26 was obtained from that of Fig. 25 by averaging over 10 pixels in the y direction
centered at an ordinate of 2.62 cm (indicated by middle dashed line). Various features of N2, N2+, N, CN, O
and can be seen.

Shock Tube Experiments for Earth and Mars Entry Conditions
13 - 36 RTO-EN-AVT-162
Figure 25: Spectrum from east side spectrometer, EAST test entry 46, run 59. Spectral range is
386/184 nm. Test gas is 0.2 Torr air. Shock velocity is 10.023 km/sec. Test time is 4.77 sec.
Exposure time is 0.5 sec.
Shock Tube Experiments for Earth and Mars Entry Conditions
RTO-EN-AVT-162 13 - 37
Figure 26: Spectrum from east side spectrometer, EAST test entry 46, run 59. Spectral range is
386/184 nm. Test gas is 0.2 Torr air. Shock velocity is 10.023 km/sec. Test time is 4.77 sec.
Exposure time is 0.5 sec. This spectrum was obtained from Fig. 25 by averaging over 10 pixels in the y direction centered at an ordinate of 2.62 cm. The center of this averaging region is shown by
the middle dashed line in Fig. 25.
Figure 27 below shows the spectrum obtained from the west side spectrometer for EAST test entry 46, run 63.
This spectrum was taken with a Princeton Instruments PI-MAX Model 512HQ camera. This camera has a 512
x 512 pixel ICCD array. The spectral range shown is 590/227 nm. The shock velocity is 9.723 km/sec. The
camera exposure time is 0.075 sec, much shorter than for Fig. 25. Because of the shorter exposure time,
there is much less smearing (~0.075 cm) in the y direction than in Fig. 25. The shock wave is seen to be
standing at ~2.5 cm and the beginning of the driver gas contamination is seen to be at ~10.4 cm when the
exposure was made. Three contamination lines are seen to appear. In general, far fewer contamination lines
are seen in the yellow, red and IR regions of the spectrum than in the blue, violet and UV and regions of the
spectrum. Hence, in general, the test time is determined from the east side spectrometer working in the blue,
violet and UV regions of the spectrum. The test time for run 63 was 7.8 sec.
The spectrum of Fig. 28 was obtained from that of Fig. 27 by averaging over 20 pixels in the y direction
centered at an ordinate of 7.16 cm (indicated by middle dashed line). Lines of N, O and H and H (?) can be
seen.

Shock Tube Experiments for Earth and Mars Entry Conditions
13 - 38 RTO-EN-AVT-162
Figure 27: Spectrum from west side spectrometer, EAST test entry 46, run 63. Spectral range is
590/227 nm. Test gas is 0.2 Torr air. Shock velocity is 9.737 km/sec. Test time is 7.83 sec. Exposure
time is 0.075 sec.

Shock Tube Experiments for Earth and Mars Entry Conditions
RTO-EN-AVT-162 13 - 39
Figure 28: Spectrum from west side spectrometer, EAST test entry 46, run 63. Spectral range is
590/277 nm. Test gas is 0.2 Torr air. Shock velocity is 9.737 km/sec. Test time is 7.83 sec. Exposure
time is 0.075 sec. This spectrum was obtained from Fig. 27 by averaging over 20 pixels in the y direction centered at an ordinate of 7.16 cm. The center of this averaging region is shown by the
middle dashed line in Fig. 27.
Figure 29 below shows the spectrum obtained from the west side spectrometer for EAST test entry 46, run 56.
This spectrum was taken with a FLIR Systems ThermaCAM Phoenix-Near Model, VisGas response option,
camera. This camera has a 320 x 256 pixel array, with 320 pixels in the wavelength direction. The spectral
range shown is 960/175 nm. The shock velocity is 10.546 km/sec. The camera exposure time is 0.98 sec.
Because of the long exposure time (needed for a non-intensified camera) there is ~1.0 cm of smearing in the y
direction. The shock wave is seen to be standing at ~1.0 cm when the exposure was made. No obvious
contamination lines are seen to appear, which is typical for infrared spectra. The test time for run 56 was 3.9
sec, determined from the arrival of contamination lines in the spectrum from the east side spectrometer,
which was set to 380/33 nm for this test run.
The spectrum of Fig. 30 was obtained from that of Fig. 29 by averaging over 10 pixels in the y direction
centered at an ordinate of 2.19 cm (indicated by upper dashed line). Lines of N and O can be seen.

Shock Tube Experiments for Earth and Mars Entry Conditions
13 - 40 RTO-EN-AVT-162
Figure 29: Spectrum from west side spectrometer, EAST test entry 46, run 56. Spectral range is
960/175 nm. Test gas is 0.2 Torr air. Shock velocity is 10.546 km/sec. Test time is 3.89 sec.
Exposure time is 0.98 sec.

Shock Tube Experiments for Earth and Mars Entry Conditions
RTO-EN-AVT-162 13 - 41
Figure 30: Spectrum from west side spectrometer, EAST test entry 46, run 56. Spectral range is
960/175 nm. Test gas is 0.2 Torr air. Shock velocity is 10.546 km/sec. Test time is 3.89 sec.
Exposure time is 0.98 sec. This spectrum was obtained from Fig. 29 by averaging over 10 pixels in the y direction centered at an ordinate of 2.19 cm. The center of this averaging region is shown by
the upper dashed line in Fig. 29.
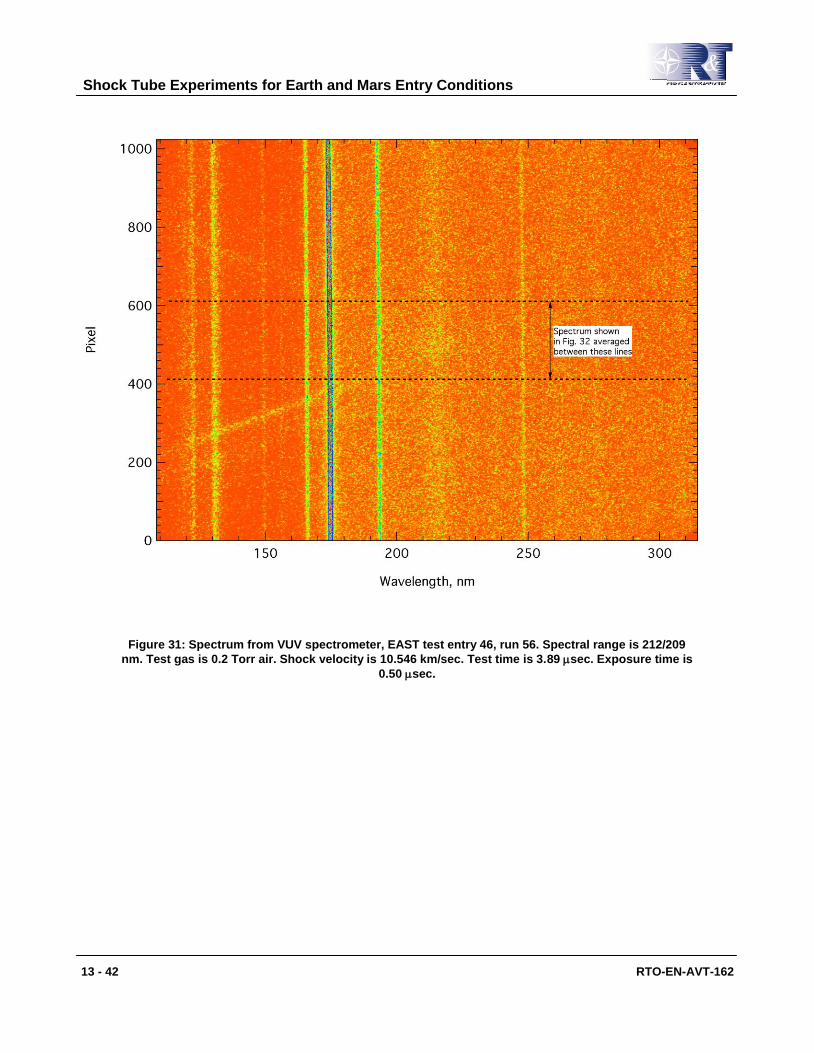
Figure 31 below shows the spectrum obtained from the west side spectrometer for EAST test entry 46, run 56,
the same test run from which the spectra of Figs. 29 and 30 were taken. This spectrum was taken with a
Princeton Instruments PI-MAX Model 1024UV camera. This camera has a 1024 x 1024 pixel array. The
spectral range shown is 960/175 nm. The camera exposure time is 0.50 sec. From the time of the camera
exposure and the shock arrival time seen in the PMT opposite the spectrometer, the beginning of the
spectrometer exposure was 1.0 microsec after the shock passage time. This data is not imaged or spatially
resolved – thus the information at all vertical locations in the image is basically the same (see Secs. 4.3 and
4.4). The two comet-like streaks seen in the left half of the spectrum are artifacts, believed to be produced by
strong features, such as the zeroth order line, striking the inside of the barrel of the image intensifier (which is
smaller than the ICCD array) and then reflecting across the array. The energy in the streaks is definitely not at
the wavelengths indicated along the x-axis.
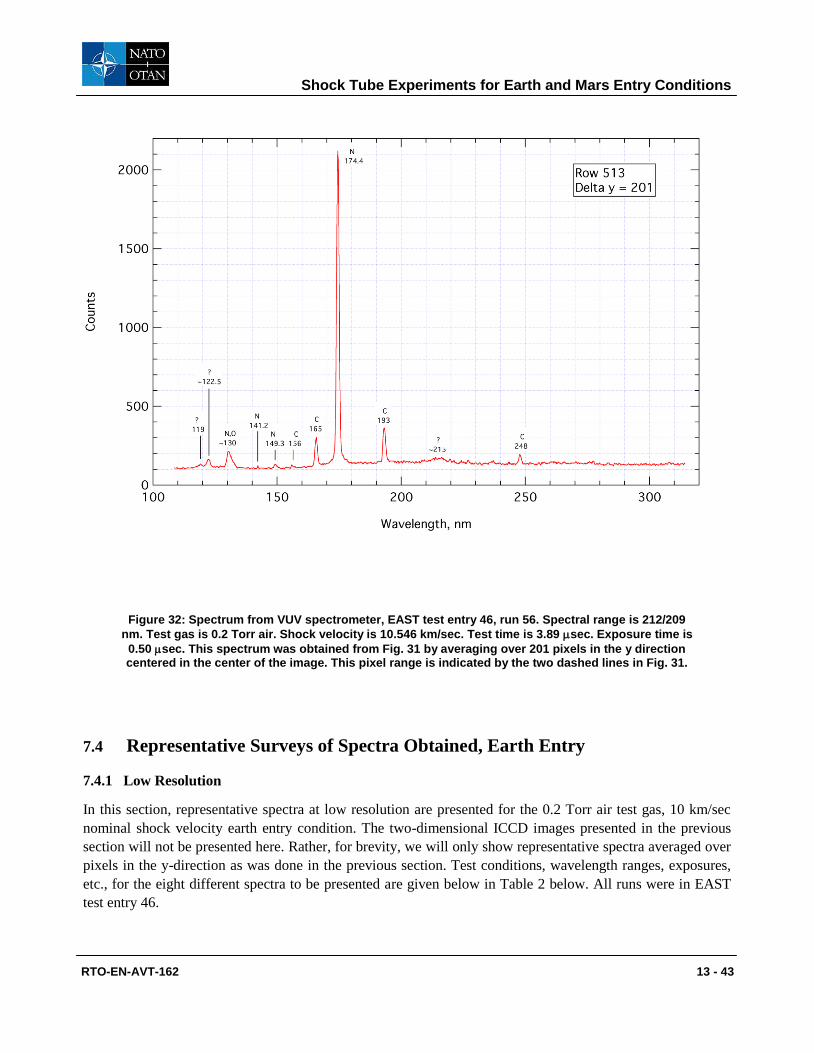
The spectrum of Fig. 32 was obtained from that of Fig. 31 by averaging over 201 pixels in the y direction
centered in the center of the image (region between the two dashed lines shown). Lines of C, N and O can be
seen. Spectral features of unknown origin are seen at 119, ~122.5 and ~215 nm.
Shock Tube Experiments for Earth and Mars Entry Conditions
13 - 42 RTO-EN-AVT-162
Figure 31: Spectrum from VUV spectrometer, EAST test entry 46, run 56. Spectral range is 212/209
nm. Test gas is 0.2 Torr air. Shock velocity is 10.546 km/sec. Test time is 3.89 sec. Exposure time is
0.50 sec.
Shock Tube Experiments for Earth and Mars Entry Conditions
RTO-EN-AVT-162 13 - 43
Figure 32: Spectrum from VUV spectrometer, EAST test entry 46, run 56. Spectral range is 212/209
nm. Test gas is 0.2 Torr air. Shock velocity is 10.546 km/sec. Test time is 3.89 sec. Exposure time is
0.50 sec. This spectrum was obtained from Fig. 31 by averaging over 201 pixels in the y direction centered in the center of the image. This pixel range is indicated by the two dashed lines in Fig. 31.
7.4 Representative Surveys of Spectra Obtained, Earth Entry
7.4.1 Low Resolution
In this section, representative spectra at low resolution are presented for the 0.2 Torr air test gas, 10 km/sec
nominal shock velocity earth entry condition. The two-dimensional ICCD images presented in the previous
section will not be presented here. Rather, for brevity, we will only show representative spectra averaged over
pixels in the y-direction as was done in the previous section. Test conditions, wavelength ranges, exposures,
etc., for the eight different spectra to be presented are given below in Table 2 below. All runs were in EAST
test entry 46.

Shock Tube Experiments for Earth and Mars Entry Conditions
13 - 44 RTO-EN-AVT-162
Table 2: Test conditions for low resolution earth entry spectra
Wavelength Camera Spectro- Test run Shock Test Exposure No. of pixels Location
range meter no. velocity time time averaged of center
over of averaging
region
(cm behind
(nm) (km/sec) (microsec) (microsec) shock)
212/209 *P-M 1k VUV 56 10.546 3.89 0.5 201 (ctr of image)
268/184 P-M 1024UV East side 62 9.944 6.36 0.5 12 0.64
386/184 P-M 1024UV East side 59 10.023 4.77 0.5 10 0.76
590/227 P-M 512HQ West side 63 9.737 7.83 0.075 20 4.56
771/227 P-M 512HQ West side 61 9.705 7.71 0.075 20 5.01
960/175 FLIR IR West side 56 10.546 3.89 0.98 10 0.96
1125/175 FLIR IR West side 59 10.023 4.77 0.98 10 0.78
1288/175 †FLIR IR West side 75 9.674 8.83 0.98 20 2.27
*P-M denotes Princeton Instruments PI-MAX cameras – see Sec. 4.5
†FLIR IR denotes FLIR Systems ThermaCAM – see Sec. 4.5
The eight spectra are presented below, in order of increasing center wavelength, as Figs. 33 – 40. Some of
these spectra repeat those presented in the preceeding section; this was done in order to facilitate comparisons
among the spectra. The discussion of these spectra follows Fig. 40.

Shock Tube Experiments for Earth and Mars Entry Conditions
RTO-EN-AVT-162 13 - 45
Figure 33: Spectrum from VUV spectrometer, EAST test entry 46, run 56. Spectral range is 212/209
nm. Test gas is 0.2 Torr air. Shock velocity is 10.546 km/sec. Test time is 3.89 sec. Exposure time is
0.50 sec. This spectrum was obtained by averaging over 201 pixels in the y direction centered in the center of the image.

Shock Tube Experiments for Earth and Mars Entry Conditions
13 - 46 RTO-EN-AVT-162
Figure 34: Spectrum from east side spectrometer, EAST test entry 46, run 62. Spectral range is
268/184 nm. Test gas is 0.2 Torr air. Shock velocity is 9.944 km/sec. Test time is 6.36 sec. Exposure
time is 0.5 sec. This spectrum was obtained from by averaging over 12 pixels in the y direction centered 0.64 cm behind shock wave.

Shock Tube Experiments for Earth and Mars Entry Conditions
RTO-EN-AVT-162 13 - 47
Figure 35: Spectrum from east side spectrometer, EAST test entry 46, run 59. Spectral range is
386/184 nm. Test gas is 0.2 Torr air. Shock velocity is 10.023 km/sec. Test time is 4.77 sec.
Exposure time is 0.5 sec. This spectrum was obtained by averaging over 10 pixels in the y direction centered 0.76 cm behind the shock wave.

Shock Tube Experiments for Earth and Mars Entry Conditions
13 - 48 RTO-EN-AVT-162
Figure 36: Spectrum from west side spectrometer, EAST test entry 46, run 63. Spectral range is
590/277 nm. Test gas is 0.2 Torr air. Shock velocity is 9.737 km/sec. Test time is 7.83 sec. Exposure
time is 0.075 sec. This spectrum was obtained by averaging over 20 pixels in the y direction centered 4.56 cm behind the shock wave.

Shock Tube Experiments for Earth and Mars Entry Conditions
RTO-EN-AVT-162 13 - 49
Figure 37: Spectrum from west side spectrometer, EAST test entry 46, run 61. Spectral range is
771/277 nm. Test gas is 0.2 Torr air. Shock velocity is 9.705 km/sec. Test time is 7.71 sec. Exposure
time is 0.075 sec. This spectrum was obtained by averaging over 20 pixels in the y direction centered 5.01 cm behind the shock wave.

Shock Tube Experiments for Earth and Mars Entry Conditions
13 - 50 RTO-EN-AVT-162
Figure 38: Spectrum from west side spectrometer, EAST test entry 46, run 56. Spectral range is
960/175 nm. Test gas is 0.2 Torr air. Shock velocity is 10.546 km/sec. Test time is 3.89 sec.
Exposure time is 0.98 sec. This spectrum was obtained by averaging over 10 pixels in the y direction centered 0.96 cm behind the shock wave.

Shock Tube Experiments for Earth and Mars Entry Conditions
RTO-EN-AVT-162 13 - 51
Figure 39: Spectrum from west side spectrometer, EAST test entry 46, run 59. Spectral range is
1125/175 nm. Test gas is 0.2 Torr air. Shock velocity is 10.023 km/sec. Test time is 4.77 sec.
Exposure time is 0.98 sec. This spectrum was obtained by averaging over 10 pixels in the y direction centered 0.78 cm behind the shock wave.

Shock Tube Experiments for Earth and Mars Entry Conditions
13 - 52 RTO-EN-AVT-162
Figure 40: Spectrum from west side spectrometer, EAST test entry 46, run 75. Spectral range is
1288/175 nm. Test gas is 0.2 Torr air. Shock velocity is 9.674 km/sec. Test time is 8.83 sec.
Exposure time is 0.98 sec. This spectrum was obtained by averaging over 20 pixels in the y direction centered 2.27 cm behind the shock wave.
In Fig. 33, centered at 212 nm, unidentified features are seen at 119 and 122.5 nm. A number of N and O lines
form a unresolved peak at ~130 nm. (These features are resolved in the high resolution spectra – see the
following section.) Nitrogen lines are seen at 141.1, 149.3 and 174.4 nm. Carbon contamination lines are seen
at 156, 165, 193 and 248 nm. An unidentified broad feature is seen at ~215 nm. (This feature has been seen in
a number of spectra.) In Fig. 34, centered at 268 nm, the carbon contamination lines at 193 and 248 nm are
also seen. Several second positive systems of N2 as well as a first negative system of N2+ are seen. The NH
line at 336 nm is also seen. There is substantial overlap of the spectral ranges of Figs. 34 and 35, the latter
centered at 386 nm. In Fig. 35, several second positive systems of N2 as well several first negative systems of
N2+ are seen. The NH line at 336 nm is also seen. A CN violet (CNV) system overlays the N2
+ first negative
system in the 382 – 392 nm range. The C lines and CN systems are due to carbon contamination. It is not
known at this point whether the carbon is in the bulk test gas, for example, as CO2 or whether if is lifted off
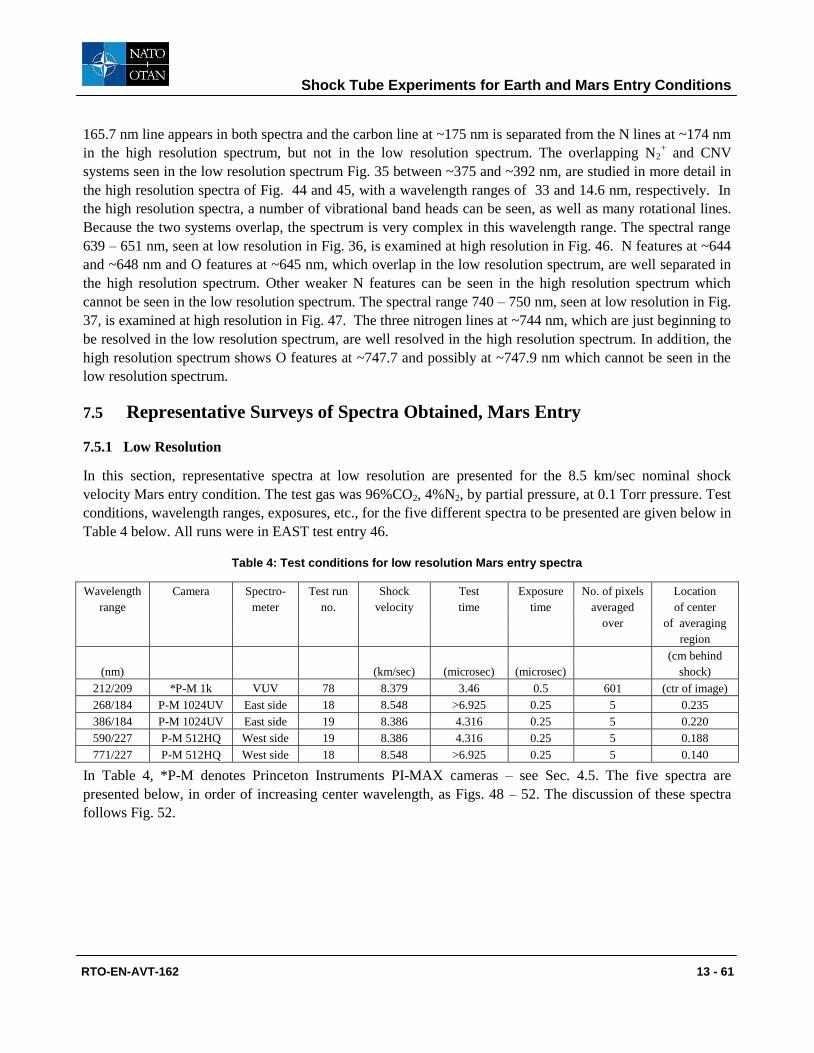
Shock Tube Experiments for Earth and Mars Entry Conditions
RTO-EN-AVT-162 13 - 53
the driven tube walls by the shock wave. The 394.7 nm O line is seen in Fig. 35, as well as several N lines
between 410 and 423 nm. Figure 36, centered at 590 nm, shows an number of N and O lines as well as the H
alpha and H beta (?) lines. The latter lines are very likely due to water contamination of the driven tube gas
due to leaks and outgassing. In Figs. 37 to 40, covering the spectral range from ~660 to ~1370 nm, a large
number of N and O lines have been identified. No other species have been identifed to date over this spectral
range.
7.4.2 High Resolution
In this section, representative spectra at high resolution are presented for the 10 km/sec nominal shock
velocity earth entry condition. Not all of the high resolution spectrometer configurations were used at the 0.2
Torr driven gas pressure, Hence, some of the spectra presented in this section are for other driven tube
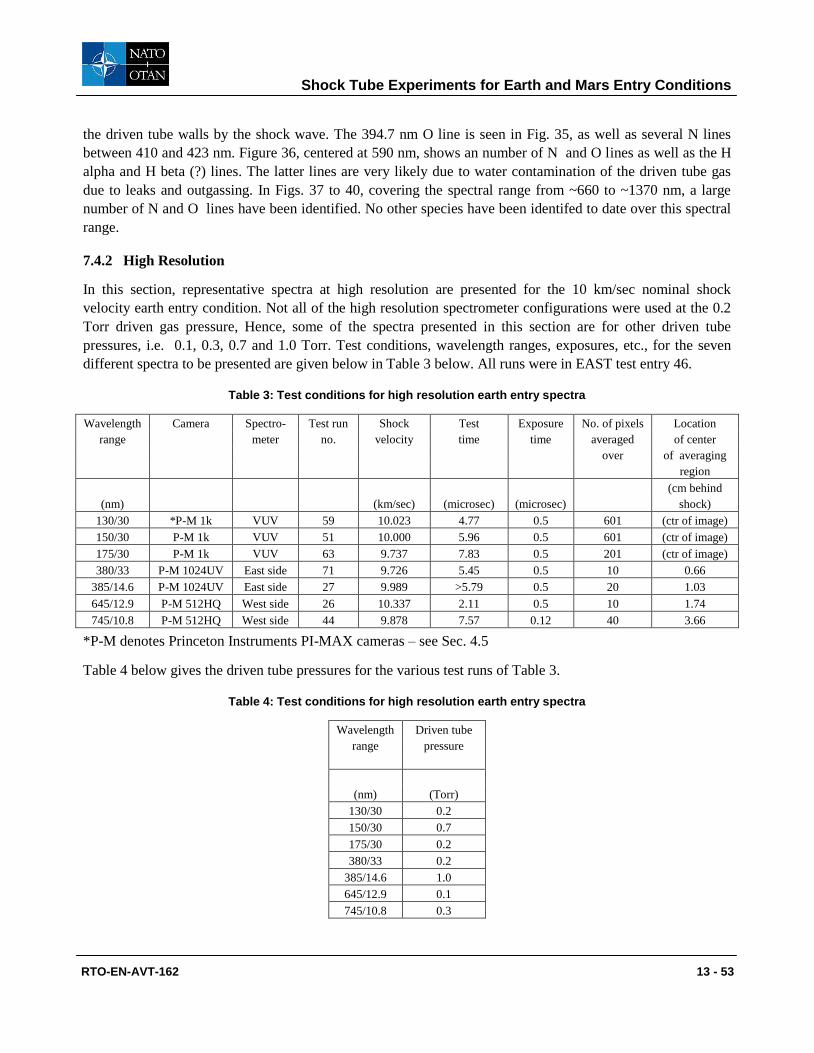
pressures, i.e. 0.1, 0.3, 0.7 and 1.0 Torr. Test conditions, wavelength ranges, exposures, etc., for the seven
different spectra to be presented are given below in Table 3 below. All runs were in EAST test entry 46.
Table 3: Test conditions for high resolution earth entry spectra
Wavelength Camera Spectro- Test run Shock Test Exposure No. of pixels Location
range meter no. velocity time time averaged of center
over of averaging
region
(cm behind
(nm) (km/sec) (microsec) (microsec) shock)
130/30 *P-M 1k VUV 59 10.023 4.77 0.5 601 (ctr of image)
150/30 P-M 1k VUV 51 10.000 5.96 0.5 601 (ctr of image)
175/30 P-M 1k VUV 63 9.737 7.83 0.5 201 (ctr of image)
380/33 P-M 1024UV East side 71 9.726 5.45 0.5 10 0.66
385/14.6 P-M 1024UV East side 27 9.989 >5.79 0.5 20 1.03
645/12.9 P-M 512HQ West side 26 10.337 2.11 0.5 10 1.74
745/10.8 P-M 512HQ West side 44 9.878 7.57 0.12 40 3.66
*P-M denotes Princeton Instruments PI-MAX cameras – see Sec. 4.5
Table 4 below gives the driven tube pressures for the various test runs of Table 3.
Table 4: Test conditions for high resolution earth entry spectra
Wavelength Driven tube
range pressure
(nm) (Torr)
130/30 0.2
150/30 0.7
175/30 0.2
380/33 0.2
385/14.6 1.0
645/12.9 0.1
745/10.8 0.3

Shock Tube Experiments for Earth and Mars Entry Conditions
13 - 54 RTO-EN-AVT-162
The seven spectra are presented below, in order of increasing center wavelength, as Figs. 41 – 47. The
discussion of these spectra follows Fig. 47.
Figure 41: Spectrum from VUV spectrometer, EAST test entry 46, run 59. Spectral range is 130/30
nm. Test gas is 0.2 Torr air. Shock velocity is 10.023 km/sec. Test time is 4.77 sec. Exposure time is
0.50 sec. This spectrum was obtained by averaging over 601 pixels in the y direction centered in the center of the image.

Shock Tube Experiments for Earth and Mars Entry Conditions
RTO-EN-AVT-162 13 - 55
Figure 42: Spectrum from VUV spectrometer, EAST test entry 46, run 51. Spectral range is 150/30
nm. Test gas is 0.7 Torr air. Shock velocity is 10.00 km/sec. Test time is 5.96 sec. Exposure time is
0.50 sec. This spectrum was obtained by averaging over 601 pixels in the y direction centered in the center of the image.
Shock Tube Experiments for Earth and Mars Entry Conditions
13 - 56 RTO-EN-AVT-162
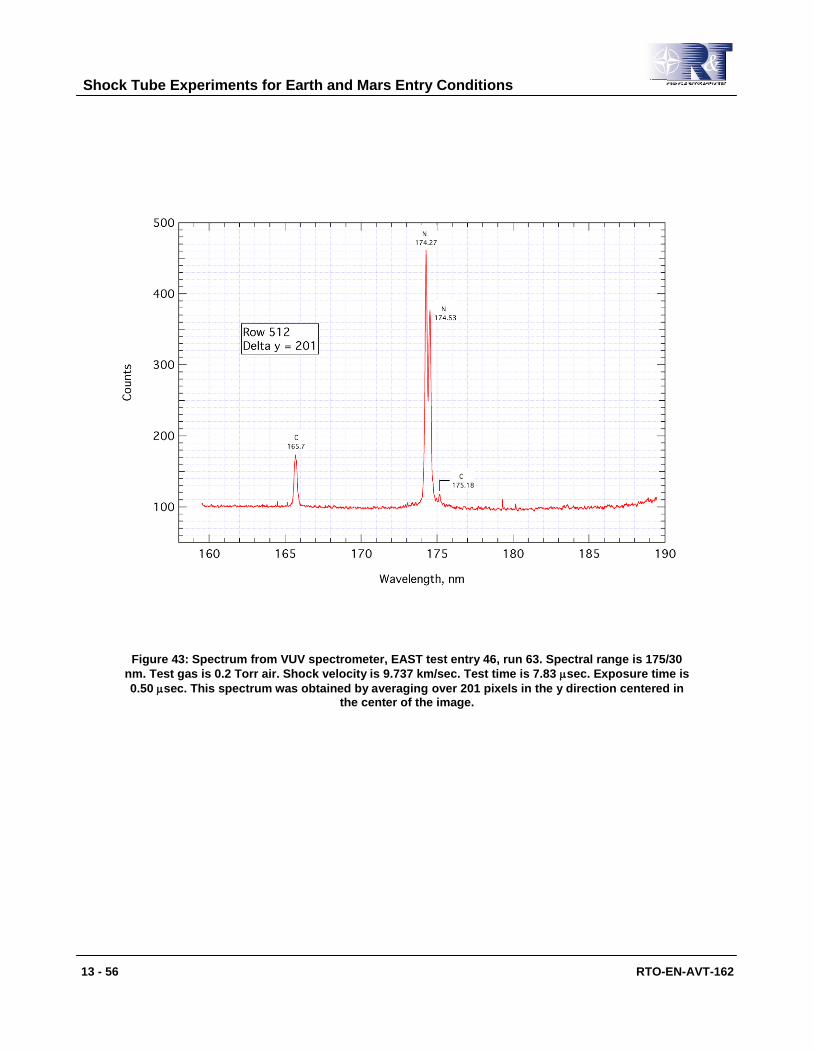
Figure 43: Spectrum from VUV spectrometer, EAST test entry 46, run 63. Spectral range is 175/30
nm. Test gas is 0.2 Torr air. Shock velocity is 9.737 km/sec. Test time is 7.83 sec. Exposure time is
0.50 sec. This spectrum was obtained by averaging over 201 pixels in the y direction centered in the center of the image.

Shock Tube Experiments for Earth and Mars Entry Conditions
RTO-EN-AVT-162 13 - 57
Figure 44: Spectrum from east side spectrometer, EAST test entry 46, run 71. Spectral range is
380/33 nm. Test gas is 0.2 Torr air. Shock velocity is 9.726 km/sec. Test time is 5.45 sec. Exposure
time is 0.50 sec. This spectrum was obtained by averaging over 10 pixels in the y direction centered 0.66 cm behind the shock wave.
Shock Tube Experiments for Earth and Mars Entry Conditions
13 - 58 RTO-EN-AVT-162
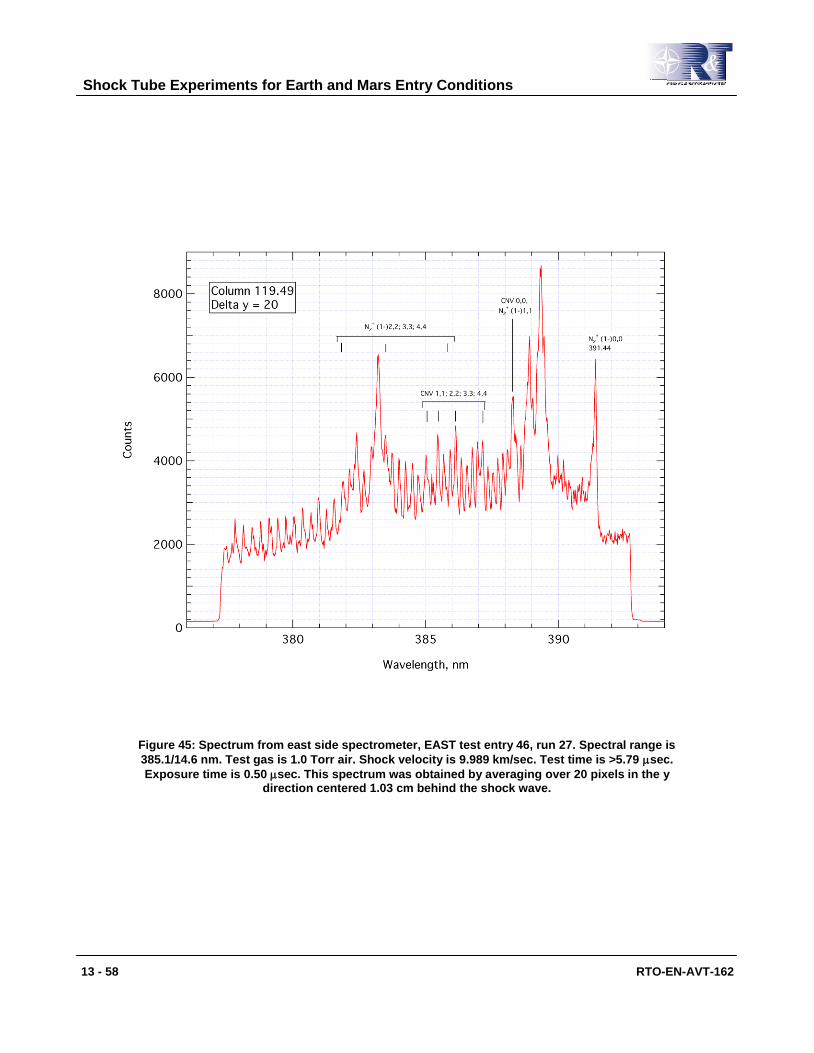
Figure 45: Spectrum from east side spectrometer, EAST test entry 46, run 27. Spectral range is
385.1/14.6 nm. Test gas is 1.0 Torr air. Shock velocity is 9.989 km/sec. Test time is >5.79 sec.
Exposure time is 0.50 sec. This spectrum was obtained by averaging over 20 pixels in the y direction centered 1.03 cm behind the shock wave.

Shock Tube Experiments for Earth and Mars Entry Conditions
RTO-EN-AVT-162 13 - 59
Figure 46: Spectrum from west side spectrometer, EAST test entry 46, run 26. Spectral range is
645/12.9 nm. Test gas is 0.1 Torr air. Shock velocity is 10.337 km/sec. Test time is 2.11 sec.
Exposure time is 0.50 sec. This spectrum was obtained by averaging over 10 pixels in the y direction centered 1.74 cm behind the shock wave.

Shock Tube Experiments for Earth and Mars Entry Conditions
13 - 60 RTO-EN-AVT-162
Figure 47: Spectrum from west side spectrometer, EAST test entry 46, run 44. Spectral range is
745/10.8 nm. Test gas is 0.3 Torr air. Shock velocity is 9.878 km/sec. Test time is 7.57 sec.
Exposure time is 0.12 sec. This spectrum was obtained by averaging over 40 pixels in the y direction centered 3.66 cm behind the shock wave.
Figure 41, centered at 130 nm, can be compared with the same wavelength region in the low resolution
spectrum Fig. 33. The unidentified feature at ~122.5 nm in Fig. 33 appears in Fig. 41 as a feature at ~122.8
nm. The various features which form a unresolved peak in Fig. 33 are seen to be resolved into three O lines
and 3 N lines in Fig. 41. Figure 42, centered at 150 nm, can be compared with the same wavelength region in
the low resolution spectrum Fig. 33. The N lines at 141.2 and 149.3 nm and the carbon line at ~156 nm appear
in both spectra. Figure 42 also shows an unidentified line at 157.3 nm. Figure 43, centered at 175 nm, can be
compared with the same wavelength region in the low resolution spectrograph Fig. 33. The two N lines at
~174.4 nm, unresolved in the low resolution spectrum, are resolved in the high resolution spectrogram. The C
Shock Tube Experiments for Earth and Mars Entry Conditions
RTO-EN-AVT-162 13 - 61
165.7 nm line appears in both spectra and the carbon line at ~175 nm is separated from the N lines at ~174 nm
in the high resolution spectrum, but not in the low resolution spectrum. The overlapping N2+ and CNV
systems seen in the low resolution spectrum Fig. 35 between ~375 and ~392 nm, are studied in more detail in
the high resolution spectra of Fig. 44 and 45, with a wavelength ranges of 33 and 14.6 nm, respectively. In
the high resolution spectra, a number of vibrational band heads can be seen, as well as many rotational lines.
Because the two systems overlap, the spectrum is very complex in this wavelength range. The spectral range
639 – 651 nm, seen at low resolution in Fig. 36, is examined at high resolution in Fig. 46. N features at ~644
and ~648 nm and O features at ~645 nm, which overlap in the low resolution spectrum, are well separated in
the high resolution spectrum. Other weaker N features can be seen in the high resolution spectrum which
cannot be seen in the low resolution spectrum. The spectral range 740 – 750 nm, seen at low resolution in Fig.
37, is examined at high resolution in Fig. 47. The three nitrogen lines at ~744 nm, which are just beginning to
be resolved in the low resolution spectrum, are well resolved in the high resolution spectrum. In addition, the
high resolution spectrum shows O features at ~747.7 and possibly at ~747.9 nm which cannot be seen in the
low resolution spectrum.
7.5 Representative Surveys of Spectra Obtained, Mars Entry
7.5.1 Low Resolution
In this section, representative spectra at low resolution are presented for the 8.5 km/sec nominal shock
velocity Mars entry condition. The test gas was 96%CO2, 4%N2, by partial pressure, at 0.1 Torr pressure. Test
conditions, wavelength ranges, exposures, etc., for the five different spectra to be presented are given below in
Table 4 below. All runs were in EAST test entry 46.
Table 4: Test conditions for low resolution Mars entry spectra
Wavelength Camera Spectro- Test run Shock Test Exposure No. of pixels Location
range meter no. velocity time time averaged of center
over of averaging
region
(cm behind
(nm) (km/sec) (microsec) (microsec) shock)
212/209 *P-M 1k VUV 78 8.379 3.46 0.5 601 (ctr of image)
268/184 P-M 1024UV East side 18 8.548 >6.925 0.25 5 0.235
386/184 P-M 1024UV East side 19 8.386 4.316 0.25 5 0.220
590/227 P-M 512HQ West side 19 8.386 4.316 0.25 5 0.188
771/227 P-M 512HQ West side 18 8.548 >6.925 0.25 5 0.140
In Table 4, *P-M denotes Princeton Instruments PI-MAX cameras – see Sec. 4.5. The five spectra are
presented below, in order of increasing center wavelength, as Figs. 48 – 52. The discussion of these spectra
follows Fig. 52.

Shock Tube Experiments for Earth and Mars Entry Conditions
13 - 62 RTO-EN-AVT-162
.
Figure 48: Spectrum from VUV spectrometer, EAST test entry 46, run 78. Spectral range is 212/209
nm. Test gas is 0.1 Torr 96%CO2, 4%N2. Shock velocity is 8.379 km/sec. Test time is 3.46 sec.
Exposure time is 0.50 sec. This spectrum was obtained by averaging over 601 pixels in the y direction centered in the center of the image.

Shock Tube Experiments for Earth and Mars Entry Conditions
RTO-EN-AVT-162 13 - 63
Figure 49: Spectrum from east side spectrometer, EAST test entry 46, run 18. Spectral range is 268/184 nm. Test gas is 0.1 Torr 96%CO2, 4%N2. Shock velocity is 8.548 km/sec. Test time is >6.93
sec. Exposure time is 0.25 sec. This spectrum was obtained by averaging over 5 pixels in the y direction centered 0.235 cm behind the shock wave.

Shock Tube Experiments for Earth and Mars Entry Conditions
13 - 64 RTO-EN-AVT-162
Figure 50: Spectrum from east side spectrometer, EAST test entry 46, run 19. Spectral range is 386/184 nm. Test gas is 0.1 Torr 96%CO2, 4%N2. Shock velocity is 8.386 km/sec. Test time is 4.32
sec. Exposure time is 0.25 sec. This spectrum was obtained by averaging over 5 pixels in the y direction centered 0.220 cm behind the shock wave.

Shock Tube Experiments for Earth and Mars Entry Conditions
RTO-EN-AVT-162 13 - 65
Figure 51: Spectrum from west side spectrometer, EAST test entry 46, run 19. Spectral range is 590/227 nm. Test gas is 0.1 Torr 96%CO2, 4%N2. Shock velocity is 8.386 km/sec. Test time is 4.32
sec. Exposure time is 0.25 sec. This spectrum was obtained by averaging over 5 pixels in the y direction centered 0.188 cm behind the shock wave.

Shock Tube Experiments for Earth and Mars Entry Conditions
13 - 66 RTO-EN-AVT-162
Figure 52: Spectrum from west side spectrometer, EAST test entry 46, run 18. Spectral range is 771/227 nm. Test gas is 0.1 Torr 96%CO2, 4%N2. Shock velocity is 8.548 km/sec. Test time is >6.925
sec. Exposure time is 0.25 sec. This spectrum was obtained by averaging over 5 pixels in the y direction centered 0.140 cm behind the shock wave.
In Fig. 48, centered at 212 nm, C lines are seen at 165.7, 193.1 and 248 nm. The N line at 174.4 nm is also
seen. The feature at ~231 nm may be comprised of O II lines. Part of the CO (4+) system is seen. This system
extends from ~130 to ~215 nm, with a maximum at ~160 nm, but the part of the system below ~160 nm is cut
off in Fig. 48 due to absorption in air which has leaked into the Princeton Instruments ICCD camera. In the
future, a continuous pure nitrogen purge will be used with this camera. The strong feature seen in Fig. 48 at
~182 nm is predicted by theoretical calculations of radiation from the CO (4+) system. In Fig. 49, centered at
268 nm, the carbon lines at 193.1 (?) and 248 nm and the possible O II lines at ~231 nm are also seen. The
long wavelength edge of the CO (4+) system is seen. Also, the CNV system peaking at ~358 nm is seen. In
Figure 50, centered at 386 nm, three CNV systems, peaking at ~358, ~385 and ~414 nm, can be seen. Two of

Shock Tube Experiments for Earth and Mars Entry Conditions
RTO-EN-AVT-162 13 - 67
the C2 Swan band systems can be seen. A fourth CNV system, between 450 and 460 nm may be overlapping
with the C2 Swan band 1,0 – 6,5 system. These systems cannot easily be separated in Fig. 50. Figure 51,
centered at 590 nm, clearly shows the C2 Swan band heads for the 0,0 – 2,2 and 0,1 – 4,5 systems. There is
also evidence for the band heads of the C2 Swan band systems 0,2 – 5,7 and 2,5 – 6,9. These latter systems
overlap, however, with many of the CN red band heads (the location of which are shown in Fig. 51), so that
the spectrum in this wavelength range is complex. (Note that the CN red band heads continue at wavelengths
below 570 nm, but are not shown in Fig. 51 because the spectrum in this wavelength range appears to be
dominated by the C2 Swan bands.) Figure 52, centered at 771 nm, shows strong O lines at 777.4 and 844.6 nm
and a C line at 833.5 nm. A number of weaker lines which correspond to N wavelengths are seen at ~821,
~859, ~862, ~868 and ~871 nm.
7.5.2 High Resolution
In this section, representative spectra at high resolution are presented for the 8.5 km/sec nominal shock
velocity Mars entry condition. Test conditions, wavelength ranges, exposures, etc., for the three different
spectra to be presented are given below in Table 5 below. All runs were in EAST test entry 46.
Table 5: Test conditions for high resolution Mars entry spectra
Wavelength Camera Spectro- Test run Shock Test Exposure No. of pixels Location
range meter no. velocity time time averaged of center
over of averaging
region
(cm behind
(nm) (km/sec) (microsec) (microsec) shock)
358.5/15 P-M 1024UV East side 23 8.308 8.64 0.5 5 0.197
513/11.4 P-M 1024UV East side 21 9.071 2.87 0.5 10 0.320
558/14.3 P-M 512HQ West side 20 8.308 7.27 0.25 10 0.284
*P-M denotes Princeton Instruments PI-MAX cameras – see Sec. 4.5
The three spectra are presented below, in order of increasing center wavelength, as Figs. 53 – 55. The
discussion of these spectra follows Fig. 55.

Shock Tube Experiments for Earth and Mars Entry Conditions
13 - 68 RTO-EN-AVT-162
Figure 53: Spectrum from east side spectrometer, EAST test entry 46, run 23. Spectral range is 358.5/15 nm. Test gas is 0.1 Torr 96%CO2, 4%N2. Shock velocity is 8.308 km/sec. Test time is 8.64
sec. Exposure time is 0.50 sec. This spectrum was obtained by averaging over 5 pixels in the y direction centered 0.197 cm behind the shock wave.

Shock Tube Experiments for Earth and Mars Entry Conditions
RTO-EN-AVT-162 13 - 69
Figure 54: Spectrum from east side spectrometer, EAST test entry 46, run 21. Spectral range is 513/11.4 nm. Test gas is 0.1 Torr 96%CO2, 4%N2. Shock velocity is 9.071 km/sec. Test time is 2.87
sec. Exposure time is 0.50 sec. This spectrum was obtained by averaging over 10 pixels in the y direction centered 0.320 cm behind the shock wave.

Shock Tube Experiments for Earth and Mars Entry Conditions
13 - 70 RTO-EN-AVT-162
Figure 55: Spectrum from west side spectrometer, EAST test entry 46, run 20. Spectral range is 558/14.3 nm. Test gas is 0.1 Torr 96%CO2, 4%N2. Shock velocity is 8.308 km/sec. Test time is 7.27
sec. Exposure time is 0.25 sec. This spectrum was obtained by averaging over 10 pixels in the y direction centered 0.284 cm behind the shock wave.
Figure 53, centered at 358.5 nm, can be compared with the same wavelength region in the low resolution
spectrum Fig. 50. The CNV band heads 1,0, 2,1 and 3,2 are well separated in the high resolution spectrum, but
not resolved in the low resolution spectrum. Figure 54, centered at 513 nm, can be compared with the same
wavelength region in the low resolution spectrum Fig. 51. The 0,0 and 1,1 band heads of the C2 Swan system
are separated in the low resolution spectrum, but with the 20 times higher resolution of the high resolution
spectrum, rotational band structure can be seen between the band heads and below the 1,1 band head. Similar
conclusions can be drawn comparing the high resolution spectrum of Fig. 55 (centered at 558 nm) with the
low resolution spectrum of Fig. 51. In Fig. 55, the 0,1, 1,2 and 2,3 band heads of the C2 Swan system are
shown instead of the 0,0 and 0,1 band heads of Fig. 54.

Shock Tube Experiments for Earth and Mars Entry Conditions
RTO-EN-AVT-162 13 - 71
8.0 CONCLUDING REMARKS
We have described how the Electric Arc Shock Tube (EAST) at the NASA Ames Research Center in
California has been used to study radiative heating for earth and Mars entry conditions. The motivation for the
work was to directly assess radiative heating for certain specific entry conditions, to better understand the
thermochemical processes in the shock layer and to furnish data to allow the improvement of models used to
predict radiative heating. Capturing spectroscopic details helps identify the principal band and line systems to
be considered in model building and simulation. Temperatures and particle number densities can be inferred
from the spectroscopic data. These data can be used to create new thermochemical rate process models which
can then be calibrated back against the experimental data.
The facility, including the driver and driven tubes, the dump tank and power system, was described. The
instrumentation was described, with emphasis on the spectrally resolving instruments – spectrographs and
monochromators. Facility operating procedures, including calibrations of the spectrally resolving instruments
and the data capture process were presented. Representative data from all instruments recorded by the data
acquistion system was presented. Finally, qualitative representative low and high resolution spectra for earth
and Mars entry conditions were presented. (A small amount of quantitative data for earth and Titan entry
conditions and also for 6 km/sec shock waves in nitrogen was presented in Refs. 4 - 6. Quantitative data from
the tests discussed herein will be presented at a later date.)
The facility and its instrumentation are currently being upgraded. The vacuum system will be improved using
higher conductance pumps and valves and the addition of a bakeout capability to reduce outgassing. A new
test section and vacuum boxes will be installed. This will improve the optical access to the flow. For example,
it will be possible to take four simultaneous spectra at the same location with the improved set-up, versus only
two with the present set-up. Also, spatially resolved VUV spectra will be obtainable with the upgrade – these
are not possible at present. Finally, using a nitrogen purge with the VUV cameras will eliminate the present
poor sensitivity of these cameras in certain regions of the VUV (due to absorption by air which has leaked into
the camera).
ACKNOWLEDGEMENTS
The author wishes to acknowledge the large amount of hard and often very tedious work put in by Mark
McGlaughlin in keeping the Ames EAST facility in operation. Valuable consultations on optics and
spectroscopy were provided by Jay Grinstead, Joe Olejniczak, Deepak Bose, Dinesh Prabhu and Mike Wright.
The reduction of the raw EAST spectrometer data to absolute radiation intensity was done with the help of
Gary A. Allen, Jr., who also wrote the code to perform the reductions. The support by ELORET Corporation
through contract NNA04BC25C is gratefully acknowledged, as is the support by the NASA CEV CAP
programs (for Earth entry) and the NASA ISP programs (for Mars entry).

Shock Tube Experiments for Earth and Mars Entry Conditions
13 - 72 RTO-EN-AVT-162
REFERENCES
1. Dannenberg, R. E., “Operating Parameters and Test Envelopes for the 1.22 MJ 20/40 kV Energy Storage
System and the 4-Inch Arc-Driven Shock Tube,” Arvin Calspan Report No. KDA 132, March 22, 1990.
2. Sharma, S. P. and Park, C., “Operating Characteristics of a 60- and 10-cm Electric Arc-Driven Shock Tube
– Part I: The Driver,” Journal of Thermophysics and Heat Transfer, Vol. 4, No. 3, July, 1990, pp. 259 – 265.
3. Sharma, S. P. and Park, C., “Operating Characteristics of a 60- and 10-cm Electric Arc-Driven Shock Tube
– Part II: The Driven Section,” Journal of Thermophysics and Heat Transfer, Vol. 4, No. 3, July, 1990, pp.
266 – 272.
4. Sharma, S. P., Gillespie, W. D. and Meyer, S. A., “Shock Front Radiation Measurements in Air,” AIAA
paper 91-0573, presented at the 29th Aerospace Sciences Meeting, Reno, NV, January 7 – 10, 1991.
5. Bose, D., Wright, M. J., Bogdanoff, D. W., Raiche, G. A. and Allen, G. A., Jr., “Modeling and
Experimental; Assessment of CN Radiation Behind a Strong Shock Wave,” Journal of Thermophysics and
Heat Transfer, Vol. 20, No. 2, April – June, 2006, pp. 220 – 230.
6. Sharma, S. P. and Gillespie, W. D., “Nonequilibrium and Equilibrium Shock Front Radiation
Measurements,” AIAA paper 90-0139, presented at the 28th Aerospace Sciences Meeting, Reno, NV, January
8 – 11, 1990.
The Headers and Footers in the templates contain specific information about the RTO Publication and the
document itself. In order to automatically generate this information, the following data must be entered into
the Document Properties Summary Tab as follows – see Figure 1 and Table below:

Shock Tube Experiments for Earth and Mars Entry Conditions
RTO-EN-AVT-162 13 - 73